CARATTERIZZAZIONE ANALITICA DELLE BIOMASSE
CARATTERIZZAZIONE ANALITICA DELLE BIOMASSE
CARATTERIZZAZIONE ANALITICA DELLE BIOMASSE

Create successful ePaper yourself
Turn your PDF publications into a flip-book with our unique Google optimized e-Paper software.
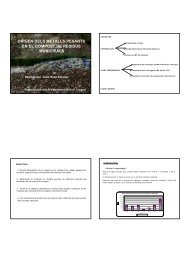
<strong>CARATTERIZZAZIONE</strong><br />
<strong>ANALITICA</strong><br />
<strong>DELLE</strong> <strong>BIOMASSE</strong><br />
Fulvia Tambone -Ricicla Ricicla Group<br />
Dipartimento di Produzione Vegetale<br />
Universit degli Studi di Milano
-Aspetti agronomici<br />
-Parametri di processo<br />
-Parametri di qualità finali
Recupero di risorse<br />
Recupero fertilità dei suoli<br />
L’utilizzo di biomasse in agricoltura deve<br />
perseguire una logica di spandimento e non di<br />
smaltimento<br />
Le biomasse utilizzate devono avere<br />
caratteristiche costanti e di elevata qualità<br />
La qualità delle biomasse deve intendersi sia<br />
in termini ambientali che agronomici
QUALITA’ AMBIENTALE<br />
prende in considerazione i possibili effetti<br />
inquinanti riconducibili all’utilizzo delle<br />
biomasse (metalli pesanti, xenobiotici, inerti)<br />
QUALITA’ AGRONOMICA<br />
considera la quantità di macro e microelementi,<br />
le caratteristiche fisiche, la stabilità e la<br />
maturità delle biomasse
PARAMETRI DI PROCESSO<br />
Ossigeno (5-15%), umidità >40%), temperatura<br />
(55-60°C), C/N (iniziale 25-30 finale 15-20),<br />
pH, SV, IR, produzione di biogas<br />
(si segue l’andamento)<br />
PARAMETRI DI QUALITA’ DEI PRODOTTI<br />
Umidità, pH, azoto, carbonio (AU e AF), inerti,<br />
metalli pesanti, microbiologiche, IR, fitotossicità<br />
Salinità, idrologiche<br />
Biogas, angolo di attrito, densità, potere calorico
LEGISLAZIONE<br />
COMPOST: L.N. 748/84<br />
FANGHI: L.N. 99/92<br />
-All. 1C<br />
- All. I A per i fanghi<br />
- All. I B per i suoli (CSC, pH)
CAMPIONAMENTO<br />
Il campione da sottoporre ad analisi deve<br />
risultare rappresentativo e omogeneo. Il<br />
prelievo e pari, in genere, a 2-3 kg in funzione<br />
della pezzatura del materiale.<br />
Il campione deve essere conservato in cella a<br />
4°C, nel caso in cui non si procedesse<br />
immediatamente all’analisi.
ANALISI SUL CAMPIONE TAL QUALE<br />
Umidità<br />
N-NH 4<br />
Fitotossicità<br />
pH e CES<br />
Indice di Respirazione
ANALISI SUL CAMPIONE SECCO<br />
Ceneri e solidi volatili (calcinazione a 650°C)<br />
Carbonio organico (ossidazione con K 2Cr 2O 7)<br />
OMEI<br />
Frazionamento del carbonio org. (AU AF)<br />
(estrazione con solventi alcalini)<br />
Metalli pesanti (mineralizzazione in acqua regia<br />
e lettura AAS)<br />
Inerti: vetro e plastiche (ossidazione con H 2O 2)
Compost Quality: an Italian Approach<br />
Compost Quality:<br />
an Italian Approach<br />
Fabrizio Adani<br />
Ricicla Group - Dipartimento di Produzione Vegetale,<br />
Università Fabrizio degli Studi Adani di Milano, and Fulvia Via Celoria Tambone<br />
2, 20133 Milan,<br />
Italy, (e-mail: fabrizio.adani@unimi.it)<br />
Ricicla Group<br />
Dipartimento di Produzione Vegetale,<br />
Universit degli Studi di Milano
DEFINIZIONI:<br />
Stabilità<br />
Maturità<br />
Evoluzione della sostanza organica
STABILITA’ BILOGICA<br />
E’ possibile definire la stabilità biologica come<br />
quello stato in cui la sostanza organica contenuta in<br />
una biomassa tenuta in condizioni ottimali, mostra<br />
una bassa attività microbica. (Genevini et al., 1997; Adani<br />
et al., 1997)<br />
•Misurazione: attività respirometrica
MATURITA’<br />
La maturità corrisponde all’assenza di<br />
fitotossicità (Epstein, 1993)<br />
•Misurazione: test di fitotossicità<br />
•(test di germinazione e di vegetazione )
EVOLUZIONE DELLA SOSTANZA<br />
ORGANICA :<br />
L’evoluzione della sostanza organica rappresenta<br />
la somma degli eventi che caratterizzano le<br />
trasformazione della sostanza organica come<br />
degradazione e umificazione (Adani et al., 1997)<br />
Misurazione: OMEI (Adani et al., 1997)
Che cosa è la stabilità biologica in Italia?<br />
Opinione corrente:<br />
attività biologica misurata dall’inice di respirazione<br />
dinamico inferiore a 1000 mg O 2 kg VS -1 h -1<br />
Come suggerito anche dal 2nd Draft of Biological<br />
Treatment of Biowaste of EC.<br />
Questo significa, da un punto di vista pratico,<br />
un trattamento biologico per le biomasse pari<br />
a 10-30 giorni in condizioni ottimali !!!!!!!
Stabilità Biologica:<br />
Molti metodi proposti<br />
Il più usato è l’approccio respirometrico<br />
che è una misura diretta della stabilità<br />
biologica (e.g. ASTM, 1992; ASTM, 1996;<br />
EU, 2001)
produzione di CO 2<br />
Metodi respirometrici:<br />
consumo di O 2<br />
I metodi respirometrici possono essere classificati in (Adani and<br />
Tambone, 1998) :<br />
metodi dinamici metodi statici<br />
dinamici statici
Metodi statici<br />
errore sistematico dovuto all’impossibilità di misurare il free air space della<br />
biomassa (Es. UNI 10780 method);<br />
la diffusione passiva dell’ossigeno causa sottostima dell’attività respirometrica;<br />
campione molto piccolo;<br />
Stato solido (DSOUR)<br />
Stato liquido (SOUR)<br />
misura effettuata in condizioni diverse rispetto alle fermentazioni in fase solida;<br />
il metodo è influenzato la frazione idrosolubile
Metodi dinamici<br />
MetodoDiProVe (Adani 1993)<br />
American Standard Testing Material method (ASTM, 1996)<br />
Aspetti negativi:<br />
Più lunga l’analisi rispetto al SOUR (2 giorni) ma simile al DSOUR;<br />
Costo dell’analisi maggiore rispetto agli altri metodi<br />
Aspetti positivi:<br />
Non ci sono limiti per la diffusione dell’O2 nella biomassa (aerazione)<br />
Quantità maggiore di campione usato (da qualche grammo fino a 50 kg);<br />
La determinazione non richiede il calcolo del free air space;<br />
Le condizioni analitiche sono simili alla scala reale di processo<br />
La misura avviene in condizioni adiabatiche come in scala reale (temperatura e altri<br />
parametri)
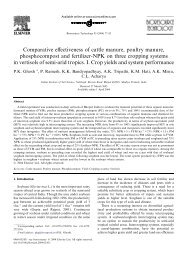
Metodi respirometrici : confronto fra test<br />
From : Adani et al., 2002; Cossu et al., 2001
Volatile solid contents, respirometric indeces, DOC, hydrophilic-DOC and hydrophobic-DOC, determined for<br />
organic matrices studied (from Adani et al., 2002 and Cossu et al., 2001)<br />
Sample<br />
BT-1-I<br />
BT-1-m<br />
BT-1-f<br />
BT-2-I<br />
BT-2-m<br />
BT-2-f<br />
BT-3-I<br />
BT-3-m<br />
BT-3-f<br />
BS-1-I<br />
BS-1-f<br />
BS-2-I<br />
BS-2-f<br />
BS-3-I<br />
BS-3-f<br />
ST-1<br />
ST-2<br />
ST-3<br />
Respiration index (mg O 2 ⋅ kg SV -1 ⋅ h -1 )<br />
VS<br />
g kg -1<br />
510 – 11.3<br />
397 – 1.5<br />
400 – 19.4<br />
687 – 4.4<br />
628 – 6.7<br />
625 – 15.9<br />
781 – 10.3<br />
612 – 16<br />
637 – 22.3<br />
875 – 22.7<br />
863 – 18.9<br />
905 – 34.3<br />
756 – 41<br />
732 – 45.6<br />
779 – 2.4<br />
449 – 11.3<br />
466 – 24.9<br />
445 – 17.5<br />
DRI<br />
4,126<br />
2,529<br />
780<br />
5,148<br />
1,300<br />
985<br />
3,255<br />
2,349<br />
918<br />
1,808<br />
692<br />
1,746<br />
595<br />
1,971<br />
582<br />
2,272<br />
889<br />
1,447<br />
SRI<br />
1.182<br />
532<br />
366<br />
1.326<br />
654<br />
502<br />
529<br />
595<br />
n.d.<br />
913<br />
205<br />
790<br />
178<br />
485<br />
99<br />
487<br />
294<br />
944<br />
SOUR<br />
16,446<br />
10,850<br />
7,117<br />
14,997<br />
12,413<br />
8,308<br />
18,980<br />
n.d.<br />
13,225<br />
5,570<br />
2,935<br />
5,698<br />
2,940<br />
4,725<br />
n.d.<br />
10,215<br />
6,338<br />
8,870<br />
SAPROMAT<br />
98,300<br />
52,700<br />
50,100<br />
104,500<br />
84,300<br />
72,200<br />
78,800<br />
55,600<br />
57,000<br />
85,500<br />
58,500<br />
73,100<br />
19,400<br />
32,200<br />
15,500<br />
35,100<br />
27,900<br />
27,900<br />
Dissolved Organic Carbon fractions<br />
Hydrophilic<br />
DOCg kgVS -1<br />
33.3<br />
13.9<br />
10<br />
38.6<br />
29.9<br />
25.4<br />
134.9<br />
51.2<br />
34.3<br />
18.2<br />
11.7<br />
40.8<br />
7.8<br />
13.6<br />
5.1<br />
n.d.<br />
n.d.<br />
n.d.<br />
Hydrophobic<br />
DOCg kgVS -1<br />
8.8<br />
25.5<br />
5<br />
17.3<br />
55.5<br />
36.1<br />
39.1<br />
35.1<br />
23.5<br />
54.8<br />
10.3<br />
45.3<br />
10.7<br />
4.9<br />
2.5<br />
n.d.<br />
n.d.<br />
n.d.<br />
DOC<br />
g kgVS -1<br />
4.21<br />
3.94<br />
1.50<br />
5.59<br />
8.54<br />
6.15<br />
14.40<br />
8.63<br />
5.78<br />
7.30<br />
2.20<br />
8.61<br />
1.85<br />
1.85<br />
0.76<br />
n.d.<br />
n.d.<br />
n.d.
DRI<br />
SRI<br />
SOUR<br />
Correlation matrix of respirometric determination (DRI,<br />
SRI, SOUR and Sapromat) and dissolved organic carbon<br />
fractions (from Adani et al., 2002 and Cossu et al., 2001)<br />
SAPROMAT<br />
DOC<br />
DOC<br />
hydrophilic<br />
† DOC<br />
hydrophobic<br />
DRI<br />
1<br />
0.78<br />
0.70<br />
0.65<br />
0.36<br />
0.46<br />
0.14<br />
SRI<br />
1<br />
0.55<br />
0.72<br />
0.31<br />
0.05<br />
0.30<br />
SOUR<br />
1<br />
0.57<br />
0.60<br />
0.69<br />
0.14<br />
SAPROMAT<br />
1<br />
0.53<br />
0.42<br />
0.52<br />
† DOC hydrophilic = (DOC – DOC hydrophilic)<br />
DOC<br />
1<br />
0.91<br />
0.72<br />
DOC<br />
hydrophilic<br />
1<br />
n.s.<br />
DOC<br />
hydrophobic<br />
1
Biological stability limits corresponding to<br />
DRI = 1000 mg O 2 kg VS -1 h -1 ,<br />
calculated for different method (Adani et al.,2002)<br />
DRI<br />
(mg O 2 kg VS -1 h -1 )<br />
1000<br />
SRI<br />
(mg O 2 kg VS -1 h -1 )<br />
395<br />
BT 409<br />
BS 340<br />
SAPROMAT<br />
(mg O 2 kg VS -1 96h -1 )<br />
45,393<br />
BT 59,570 (?)<br />
BS 41,555 (?)<br />
SOUR<br />
(mg O 2 kg VS -1 h -1 )<br />
7,038<br />
BT 8,310(?)<br />
BS 3,611(?)<br />
SOUR = 3468 + 1.80 DRI + 788 Hydrophilic frac.; R 2 = 0.67
Equation and fit parameters for DRI versus SRI values<br />
45 DRI = 2SRI - 121 R 2 =0.77 p< 0.01 (Scaglia et al, 2000)<br />
17 DRI=1.6 SRI + 252 R 2 =0.54 p< 0.05 (Seccafieno, 2002)<br />
21 DRI=1.63SRI-290 R 2 =0.99 p< 0.01 (Adani et al., 2001)<br />
† SRIs= static respiration index by sapromat method<br />
Scaglia et al., (2000), found 413<br />
Seccafieno (2002), found 467<br />
Adani et al., (2001) found 435<br />
As correspondig to 1000
Comparison methods: conclusion<br />
Results confirm that static methods give lower value than<br />
dynamic because of the oxygen diffusion limits. More studied<br />
needed in order to give corresponding values (if possible)<br />
SOUR present some advantage respect solid state condition but,<br />
it was affected by water soluble fraction and does not reflect field<br />
condition such as dynamic solid state approach. More studied<br />
needed to confirm our findings or not<br />
Solvita: it is not useful for stability determination when DRI ><br />
200-300. Anyway it is very interesting as field methods for<br />
compost and substrate characterization for by very high<br />
biological stability degree. More studied needed to better<br />
indicate the application field of this methods.
maximum value<br />
cumulated of 96 h, no lag-phase<br />
Result expression<br />
mean of 24 hours with intense microbial activity<br />
cumulated 96 h<br />
UNI, SOUR (I, UK)<br />
DiProVe (I)<br />
Sapromat, AT4 (D)<br />
ASTM (USA)
Results expression<br />
- Maximum value is one !!!!. Analysis takes about 47 h<br />
- Cumulative approach takes longer time (96 h) !!<br />
- Mean of 24 hour is a compromise; analysis takes 58 h about
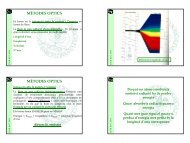
Dynamic Respiration Index : calculation<br />
o<br />
Temperatur2 C); ( Oxygen (% v/v)<br />
45,00<br />
40,00<br />
35,00<br />
30,00<br />
25,00<br />
20,00<br />
15,00<br />
10,00<br />
5,00<br />
0,00<br />
1<br />
3<br />
5<br />
7<br />
9<br />
11<br />
13<br />
24 h<br />
15<br />
Time (x 2h)<br />
data used for PDRI<br />
calculation<br />
17<br />
19<br />
21<br />
23<br />
25<br />
27<br />
DRI =Σ DRI i<br />
2500,00<br />
2000,00<br />
1500,00<br />
1000,00<br />
500,00<br />
0,00<br />
PDRI (mg. 2/kg O VS<br />
* h)
EC proposal: Biological Treatment of Biowaste<br />
EUROPEAN COMMISSION<br />
DIRECTORATE-GENERAL<br />
ENVIRONMENT<br />
Directorate A - Sustainable Development and Policy Support<br />
ENV.A.2 - Sustainable Resources<br />
WORKING DOCUMENT<br />
Brussels, 12 February 2001<br />
DG ENV.A.2/LM/biowaste/2 nd draft<br />
BIOLOGICAL TREATMENT OF BIOWASTE<br />
2 nd draft
Biological Stability definition by EU:<br />
‘stability’ :<br />
respirometric activity below 10 mg O 2 /g TS on 96 h basis (AT4)<br />
(Static method; Sapromat method)<br />
respirometric activity below 1000 mg O 2 /kg VS*h (dynamic<br />
methods, DiProVe, University of Milano, ASTM, 1996 (USA)<br />
DRI (DiProVe) of 1000 mg O 2 /kg VS*h correspond to DRI (ASTM, 196) of<br />
35.000-45.000, used to indicate biological stability
MATURITY<br />
Vegetation Test : DiProVe Methods
Plant growth (lettuce) on ad hoc substrate<br />
for 14-20 days<br />
Comparison between control (no compost) and different doses<br />
Each doses performed in quadruplicate<br />
ANOVA analysis<br />
Growth Index (GI) = µ dose(s) / µ control
N1 = substrate is toxic; N2 = substrate is toxic; P1 = substrate sometimes<br />
is toxic; P2 = substrate is not toxic; P3 = substrate causes positive<br />
effects; P4 = substrate causes strongly positive effects<br />
Growth Index<br />
Growth Index<br />
4<br />
3<br />
2<br />
1<br />
0<br />
2<br />
1<br />
0<br />
d<br />
c<br />
b<br />
a<br />
N1<br />
P2<br />
a<br />
0 8 16<br />
a<br />
0 8 16<br />
Doses (g dm kg -1 )<br />
Doses (g dm kg -1 )<br />
Growth Index<br />
Growth Index<br />
4<br />
3<br />
2<br />
1<br />
0<br />
2<br />
1<br />
0<br />
c<br />
c c<br />
a<br />
a<br />
a<br />
a<br />
c<br />
N2<br />
b<br />
0 8 16<br />
P3<br />
ab<br />
0 8 16<br />
a<br />
Doses (g dm kg -1 )<br />
b<br />
Doses (g dm kg -1 )<br />
Growth Index<br />
Growth Index<br />
4<br />
3<br />
2<br />
1<br />
0<br />
4<br />
3<br />
2<br />
1<br />
0<br />
c<br />
d d<br />
b<br />
P1<br />
b<br />
a<br />
0 8 16<br />
c<br />
b<br />
a<br />
Doses (g dm kg -1 )<br />
d<br />
P4<br />
e<br />
0 8 16<br />
e<br />
Doses (g dm kg -1 )
Growth Index<br />
4<br />
3<br />
2<br />
1<br />
0<br />
b<br />
c<br />
d d<br />
P1<br />
b<br />
0 8 16<br />
Doses (g dm kg -1 )<br />
a
Growth Index<br />
4<br />
3<br />
2<br />
1<br />
0<br />
P2<br />
0 8 16<br />
Doses (g dm kg -1 )
Growth Index<br />
4<br />
3<br />
2<br />
1<br />
0<br />
a<br />
a<br />
a<br />
a<br />
P3<br />
ab<br />
0 8 16<br />
Doses (g dm kg -1 )<br />
b<br />
Growth Index<br />
4<br />
3<br />
2<br />
1<br />
0<br />
b<br />
a<br />
c<br />
d<br />
P4<br />
e<br />
0 8 16<br />
Doses (g dm kg -1 )<br />
e
Growth Index<br />
2<br />
1<br />
0<br />
d<br />
c<br />
b<br />
a<br />
N1<br />
a<br />
0 8 16<br />
Doses (g dm kg -1 )<br />
a<br />
Growth Index<br />
2<br />
1<br />
0<br />
c<br />
c c<br />
c<br />
N2<br />
b<br />
0 8 16<br />
Doses (g dm kg -1 )<br />
a
Organic Matter Evolution Index<br />
OMEI = Core-HA / HA
Humic acid structure simplify scheme (Adani, 1995):<br />
Chemical purification<br />
Biological process
IM<br />
polysacchairide<br />
peptide<br />
Humic acid 3D structure
Humic acids structure: schematic approach<br />
HA = core-HA + IM<br />
Core-HA = recalcitrant material<br />
IM = degradable material
IM = interference material (degradable)<br />
IM = Degradation during composting follows a first<br />
order reaction such as dry matter degradation<br />
(Adani et al., 1997):<br />
dIM/dt = -k (IM Ø - IMe)<br />
dm/dt = -k (m Ø - me)<br />
Therefore IM is a measure of the degradation processes
Core-HA = recalcitrant material represent<br />
true humic acids<br />
core-HA is a measure of the humification<br />
processes
IM = measure of the degradation processes<br />
Core-HA = measure of the humification processes<br />
Therefore OMEI is not a humification index (Adani et al.,<br />
1997) but an index of OM evolution<br />
In fact rewriting OMEI as:<br />
OMEI = {1 / 1[ + (IM / core-HA)
Evolution of the Organic matter<br />
degradation + humification<br />
Dry blood OMEI = 0<br />
Leonardite OMEI = 0.9<br />
OMEI<br />
OMEI ranged between 0 (not evolved<br />
compost) to 1 (well evolved compost)
HA and core-HA 13-CPMAS NMR (compost): OMEI of 0.25<br />
IM<br />
purification<br />
OMEI = 0.25<br />
IM
HA and core-HA 13C-NMR of leonardite: OMEI of 0.9<br />
purification<br />
OMEI = 0.9
Composting performed under not optimal condition<br />
OMEI<br />
0.55<br />
0.5<br />
0.45<br />
0.4<br />
0.35<br />
0.3<br />
0.25<br />
0.2<br />
0.15<br />
(Adani et al.., 1997)<br />
0 50 100 150 200 250<br />
Composting time (days)<br />
y= 0.236 + 0.0011 x<br />
R 2 =0.86 p
DRI, vegetation test and OMEI:<br />
practical application<br />
Routinely laboratory work for compost characterization<br />
Rules: e.g. Lombardy Region (North Italy)
Compost use
Result of four different composts