Atomic Spectra A Report - Santa Monica College
Atomic Spectra A Report - Santa Monica College
Atomic Spectra A Report - Santa Monica College

Create successful ePaper yourself
Turn your PDF publications into a flip-book with our unique Google optimized e-Paper software.
Chemistry 11<br />
<strong>Santa</strong> <strong>Monica</strong> <strong>College</strong><br />
Name _______________________________________<br />
Date of Experiment ______________<br />
Lab Partner(s) _____________________________________________________<br />
Section ______________<br />
Lab <strong>Report</strong> for <strong>Atomic</strong> <strong>Spectra</strong><br />
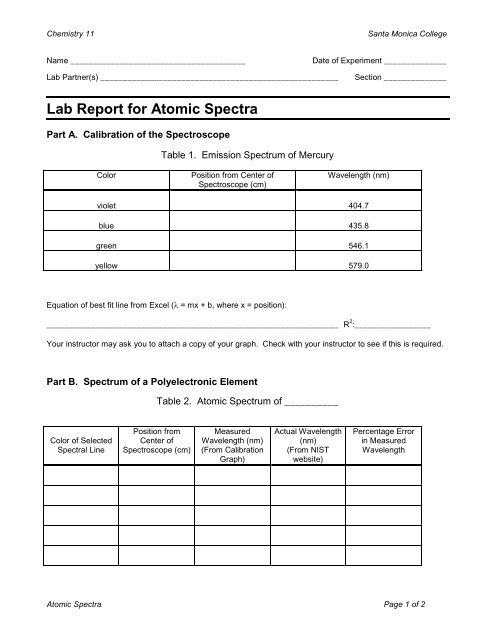
Part A. Calibration of the Spectroscope<br />
Table 1. Emission Spectrum of Mercury<br />
Color<br />
Position from Center of<br />
Spectroscope (cm)<br />
Wavelength (nm)<br />
violet 404.7<br />
blue 435.8<br />
green 546.1<br />
yellow 579.0<br />
Equation of best fit line from Excel (λ = mx + b, where x = position):<br />
_________________________________________________________________ R 2 :_________________<br />
Your instructor may ask you to attach a copy of your graph. Check with your instructor to see if this is required.<br />
Part B. Spectrum of a Polyelectronic Element<br />
Table 2. <strong>Atomic</strong> Spectrum of __________<br />
Color of Selected<br />
<strong>Spectra</strong>l Line<br />
Position from<br />
Center of<br />
Spectroscope (cm)<br />
Measured<br />
Wavelength (nm)<br />
(From Calibration<br />
Graph)<br />
Actual Wavelength<br />
(nm)<br />
(From NIST<br />
website)<br />
Percentage Error<br />
in Measured<br />
Wavelength<br />
<strong>Atomic</strong> <strong>Spectra</strong> Page 1 of 2
Chemistry 11<br />
<strong>Santa</strong> <strong>Monica</strong> <strong>College</strong><br />
Part C. Spectrum of a Single Electron Element: Hydrogen<br />
Table 3. <strong>Atomic</strong> Spectrum of Hydrogen<br />
Color<br />
red<br />
Position from Center of<br />
Spectroscope (cm)<br />
Wavelength (nm)<br />
(From Calibration Graph)<br />
green-blue<br />
violet 1<br />
violet 2<br />
Table 4. The First Four Lines of the Balmer Series<br />
Upper<br />
Level<br />
Energy of<br />
Upper<br />
Level (J)<br />
Lower Level<br />
Energy of<br />
Lower Level<br />
(J)<br />
Change in<br />
Energy of<br />
the Electron<br />
(J)<br />
Energy of<br />
the Emitted<br />
Photon<br />
(J)<br />
Wavelength<br />
of Emitted<br />
Photon (nm)<br />
3 2<br />
4 2<br />
5 2<br />
6 2<br />
Table 5. Comparison of Observed and Theoretical Results for Hydrogen<br />
Observed Wavelength<br />
(from Table 3)<br />
Calculated Wavelength<br />
(from Table 4)<br />
Electronic Transition<br />
(from Table 4)<br />
Percentage Error in<br />
Measured Wavelength<br />
<strong>Atomic</strong> <strong>Spectra</strong> Page 2 of 2