Luxottica: prosegue la forte crescita dei risultati
Luxottica: prosegue la forte crescita dei risultati
Luxottica: prosegue la forte crescita dei risultati

Create successful ePaper yourself
Turn your PDF publications into a flip-book with our unique Google optimized e-Paper software.
Comunicato stampa<br />
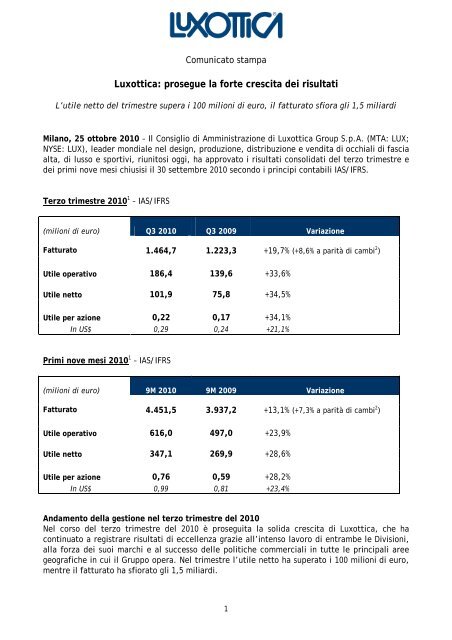
<strong>Luxottica</strong>: <strong>prosegue</strong> <strong>la</strong> <strong>forte</strong> <strong>crescita</strong> <strong>dei</strong> <strong>risultati</strong><br />
L’utile netto del trimestre supera i 100 milioni di euro, il fatturato sfiora gli 1,5 miliardi<br />
Mi<strong>la</strong>no, 25 ottobre 2010 – Il Consiglio di Amministrazione di <strong>Luxottica</strong> Group S.p.A. (MTA: LUX;<br />
NYSE: LUX), leader mondiale nel design, produzione, distribuzione e vendita di occhiali di fascia<br />
alta, di lusso e sportivi, riunitosi oggi, ha approvato i <strong>risultati</strong> consolidati del terzo trimestre e<br />
<strong>dei</strong> primi nove mesi chiusisi il 30 settembre 2010 secondo i principi contabili IAS/IFRS.<br />
Terzo trimestre 2010 1 – IAS/IFRS<br />
(milioni di euro) Q3 2010 Q3 2009 Variazione<br />
Fatturato 1.464,7 1.223,3 +19,7% (+8,6% a parità di cambi 2 )<br />
Utile operativo 186,4 139,6 +33,6%<br />
Utile netto 101,9 75,8 +34,5%<br />
Utile per azione 0,22 0,17 +34,1%<br />
In US$ 0,29 0,24 +21,1%<br />
Primi nove mesi 2010 1 – IAS/IFRS<br />
(milioni di euro) 9M 2010 9M 2009 Variazione<br />
Fatturato 4.451,5 3.937,2 +13,1% (+7,3% a parità di cambi 2 )<br />
Utile operativo 616,0 497,0 +23,9%<br />
Utile netto 347,1 269,9 +28,6%<br />
Utile per azione 0,76 0,59 +28,2%<br />
In US$ 0,99 0,81 +23,4%<br />
Andamento del<strong>la</strong> gestione nel terzo trimestre del 2010<br />
Nel corso del terzo trimestre del 2010 è proseguita <strong>la</strong> solida <strong>crescita</strong> di <strong>Luxottica</strong>, che ha<br />
continuato a registrare <strong>risultati</strong> di eccellenza grazie all’intenso <strong>la</strong>voro di entrambe le Divisioni,<br />
al<strong>la</strong> forza <strong>dei</strong> suoi marchi e al successo delle politiche commerciali in tutte le principali aree<br />
geografiche in cui il Gruppo opera. Nel trimestre l’utile netto ha superato i 100 milioni di euro,<br />
mentre il fatturato ha sfiorato gli 1,5 miliardi.<br />
1
“Anche il terzo trimestre ci ha visto conseguire buoni <strong>risultati</strong>”, ha commentato Andrea<br />
Guerra, Chief Executive Officer di <strong>Luxottica</strong>. “Tutte le persone all’interno del<strong>la</strong> nostra<br />
organizzazione hanno saputo reagire con determinazione e cogliere il meglio che questo nuovo<br />
mondo ci propone. Questi <strong>risultati</strong> possono essere sintetizzati in un solido incremento nei<br />
mercati cosiddetti maturi – in Europa il fatturato è cresciuto del 12,7%, in Nord America il<br />
fatturato in dol<strong>la</strong>ri è aumentato dell’8,5% - e in una <strong>forte</strong> <strong>crescita</strong> in tutti i principali Paesi<br />
emergenti, dove le nostre vendite hanno registrato un incremento del 26,2%.<br />
La stagione “sole” è stata positiva in tutto il mondo e Sung<strong>la</strong>ss Hut, <strong>la</strong> nostra catena retail<br />
specializzata in questo segmento, è stata in grado di registrare ottime performance sia negli<br />
Stati Uniti, con vendite omogenee 4 cresciute del 12,5%, sia a livello globale.<br />
E’ importante sottolineare <strong>la</strong> nuova tendenza del segmento premium e lusso del nostro<br />
portafoglio marchi: da ormai due trimestri assistiamo, giorno dopo giorno, a un crescente<br />
numero di consumatori nuovamente interessati ai prodotti di questo segmento.<br />
Sono inoltre partico<strong>la</strong>rmente soddisfatto del<strong>la</strong> nostra capacità di generare cassa, oltre 250<br />
milioni nel trimestre 3 , a conferma dal<strong>la</strong> validità del nostro modello di business e<br />
dell’attenzione quotidiana nel<strong>la</strong> gestione del capitale circo<strong>la</strong>nte.<br />
I <strong>risultati</strong> conseguiti sino a oggi ci consentono di guardare con ottimismo al<strong>la</strong> fine di un anno<br />
che, se continueremo a <strong>la</strong>vorare con <strong>la</strong> determinazione e <strong>la</strong> passione mostrate in questi mesi,<br />
potrebbe vederci raggiungere il traguardo <strong>dei</strong> 400 milioni di utile netto”.<br />
Nel corso del terzo trimestre dell’anno <strong>Luxottica</strong> ha saputo conseguire performance molto<br />
positive nel<strong>la</strong> maggior parte delle regioni geografiche in cui opera. A questi <strong>risultati</strong> ha<br />
contribuito in maniera determinante <strong>la</strong> Divisione Wholesale, in grado di crescere in maniera<br />
sostenuta sia nei mercati più maturi come Stati Uniti ed Europa che nei Paesi emergenti, il cui<br />
fatturato, per il quarto trimestre consecutivo, ha segnato un incremento superiore al 20% con<br />
punte del 40% in India e Corea.<br />
Molto positivi anche i <strong>risultati</strong> sia di LensCrafters, tornata a essere il punto di riferimento per il<br />
settore del retail ottico nord americano, sia di Sung<strong>la</strong>ss Hut, oggi più che mai <strong>la</strong> principale<br />
catena al mondo di negozi specializzati nel segmento “sole”.<br />
Il Gruppo<br />
Nel terzo trimestre del 2010, il fatturato del Gruppo ha mostrato un incremento del 19,7% a<br />
cambi correnti (+8,6% a parità di cambi 2 ), passando da 1.223,3 milioni a 1.464,7 milioni di<br />
euro. Nei primi nove mesi, quindi, il fatturato è cresciuto del 13,1% a 4.451,5 milioni di euro<br />
(3.937,2 milioni nei primi nove mesi del 2009).<br />
Considerando le performance operative, l’EBITDA 3 è risultato in progresso rispetto all’anno<br />
precedente, passando da 209,8 milioni di euro del terzo trimestre 2009 a 263,5 milioni di euro<br />
(+25,6%). Nei nove mesi, l’EBITDA 3 è passato a 841,5 milioni dai 711,3 milioni <strong>dei</strong> primi nove<br />
mesi del 2009 (+18,3%).<br />
Il risultato operativo si è attestato a 186,4 milioni di euro (139,6 milioni nello stesso periodo<br />
dell’anno precedente, +33,6%), mentre il margine operativo del Gruppo è passato al 12,7%<br />
dall’11,4% del terzo trimestre 2009. Nei primi nove mesi dell’anno, il risultato operativo è stato<br />
pari a 616,0 milioni di euro, in progresso del 23,9% rispetto ai 497,0 milioni dello stesso periodo<br />
dell’anno precedente.<br />
2
L’utile netto del terzo trimestre del 2010 è quindi cresciuto a 101,9 milioni di euro (75,8<br />
milioni nel 2009, +34,5%), corrispondente a un EPS (utile per azione) di 0,22 euro (con un<br />
cambio medio euro/dol<strong>la</strong>ro pari a 1,2910). Nei primi nove mesi dell’anno, l’utile netto è stato<br />
quindi pari a 347,1 milioni di euro (269,9 milioni nei primi nove mesi del 2009, +28,6%),<br />
corrispondente a un EPS di 0,76 euro (con un cambio medio euro/dol<strong>la</strong>ro pari a 1,3145).<br />
Anche nel terzo trimestre del 2010 il Gruppo ha ottenuto un’ottima generazione di cassa<br />
positiva 3 (oltre 250 milioni di euro): l’indebitamento netto al 30 settembre 2010 è risultato<br />
quindi pari a 2.269 milioni di euro (2.337 milioni a fine 2009), con un rapporto indebitamento<br />
netto/EBITDA 3 pari a 2,3 rispetto a 2,7 di fine 2009.<br />
Divisione wholesale<br />
Nel corso del trimestre <strong>la</strong> divisione ha continuato a registrare <strong>risultati</strong> di eccellenza, grazie al<br />
continuo successo delle politiche commerciali, al <strong>forte</strong> apprezzamento da parte <strong>dei</strong> clienti delle<br />
collezioni e di iniziative a loro rivolte come i Buying Days, e all’ottimo andamento di tutti i<br />
marchi del Gruppo. In partico<strong>la</strong>re, è importante sottolineare come per il secondo trimestre<br />
consecutivo i marchi del segmento premium e lusso abbiano accelerato nel loro trend di<br />
miglioramento, con un fatturato cresciuto del 18% nel trimestre. Ray-Ban e Oakley a loro volta<br />
hanno continuato a crescere a doppia cifra, con un successo partico<strong>la</strong>re per le collezioni vista.<br />
Per quanto riguarda l’andamento delle vendite nelle principali aree geografiche, <strong>Luxottica</strong> ha<br />
registrato performance decisamente positive nei Paesi emergenti, in partico<strong>la</strong>re in Brasile, Cina<br />
e India, nonché in Europa.<br />
Il fatturato del<strong>la</strong> divisione è quindi passato a 518,3 milioni di euro dai 429,5 milioni del terzo<br />
trimestre 2009 (+20,7% a cambi correnti e +12,4% a parità di cambi 2 ). Nei nove mesi, il fatturato<br />
si è attestato a 1.722,9 milioni di euro, in progresso del 14,4% rispetto ai 1.506,5 milioni del<br />
primo semestre 2009 (+9,5% a parità di cambi 2 ).<br />
Il risultato operativo del<strong>la</strong> divisione Wholesale si è quindi attestato a 94,9 milioni di euro, in<br />
<strong>crescita</strong> del 53,8% rispetto ai 61,7 milioni del terzo trimestre 2009. Il margine operativo è<br />
passato al 18,3% dal 14,4% del terzo trimestre del 2009, confermando l’efficacia delle azioni di<br />
recupero del<strong>la</strong> marginalità intraprese e un migliore effetto price/mix. Nei primi nove mesi, il<br />
margine operativo è stato invece pari al 21,6% (19,7% nello stesso periodo del 2009).<br />
Divisione retail<br />
Nel corso del trimestre <strong>la</strong> divisione ha registrato un buon progresso, trainata dai positivi <strong>risultati</strong><br />
di LensCrafters e di Sung<strong>la</strong>ss Hut. In partico<strong>la</strong>re, le vendite omogenee 4 di LensCrafters, cresciute<br />
dell’8,4% grazie al<strong>la</strong> determinazione di tutta l’organizzazione, hanno beneficiato del buon<br />
andamento delle vendite nel segmento “sole”, anche in termini di lenti graduate da sole, e <strong>dei</strong><br />
positivi <strong>risultati</strong> delle vendite nel periodo di riapertura delle scuole.<br />
Molto positivi i <strong>risultati</strong>, anche in termini di marginalità, di Sung<strong>la</strong>ss Hut, che ha registrato<br />
vendite omogenee 4 complessive in progresso del 9,6%, con un andamento positivo in partico<strong>la</strong>re<br />
negli Stati Uniti (+12,5%), grazie soprattutto all’efficacia delle nuove iniziative di marketing, a<br />
una ulteriormente migliorata gestione del portafoglio e al successo delle vendite di prodotti con<br />
lenti po<strong>la</strong>rizzate.<br />
Negativo, invece, l’andamento delle vendite omogenee in Australia, dove lo scenario del settore<br />
retail continua a essere difficile. Il Gruppo sta in ogni caso reagendo con nuove iniziative volte<br />
ad attirare i consumatori nei propri negozi e a migliorare ulteriormente <strong>la</strong> loro esperienza di<br />
acquisto: i primi segnali del quarto trimestre sono positivi.<br />
3
Il fatturato netto del<strong>la</strong> divisione Retail è quindi passato a 946,5 milioni di euro da 793,8 milioni<br />
del terzo trimestre 2009 (+19,2% a cambi correnti, +6,5% a parità di cambi 2 ). Nei nove mesi, il<br />
fatturato si è quindi attestato a 2.728,6 milioni di euro, in <strong>crescita</strong> del 12,3% rispetto ai 2.430,8<br />
milioni <strong>dei</strong> primi nove mesi del 2009 (+5,9 a parità di cambi 2 ).<br />
Il risultato operativo del<strong>la</strong> divisione è cresciuto a 129,3 milioni di euro (113,9 milioni nel terzo<br />
trimestre del 2009, +13,5%); il margine operativo è quindi passato dal 14,3% al 13,7%. Nei nove<br />
mesi, il margine operativo è stato invece pari al 13,0% (12,8% nei primi nove mesi del 2009).<br />
§<br />
Il Consiglio di Amministrazione ha inoltre deliberato le modifiche allo Statuto sociale al fine di<br />
adeguarlo alle novità introdotte dal Decreto Legis<strong>la</strong>tivo n. 27/2010 che ha recepito<br />
nell’ordinamento italiano <strong>la</strong> Direttiva 2007/36/CE in materia di diritti degli azionisti.<br />
Il Consiglio di Amministrazione, in linea con quanto previsto dal Rego<strong>la</strong>mento Consob<br />
n.17221/2010, ha infine approvato, con il parere favorevole del Comitato di Controllo Interno<br />
costituito esclusivamente da amministratori indipendenti, <strong>la</strong> nuova procedura in materia di<br />
operazioni con parti corre<strong>la</strong>te.<br />
§<br />
I <strong>risultati</strong> del terzo trimestre del 2010 saranno illustrati oggi a partire dalle ore 18:00 (CET) nel<br />
corso di una conference call con <strong>la</strong> comunità finanziaria. La presentazione sarà disponibile in<br />
web cast in diretta sul sito Internet www.luxottica.com.<br />
Il Dirigente Preposto al<strong>la</strong> redazione <strong>dei</strong> documenti contabili societari Enrico Cavatorta dichiara ai sensi<br />
del comma 2 articolo 154 bis del Testo Unico del<strong>la</strong> Finanza che l’informativa contabile contenuta nel<br />
presente comunicato corrisponde alle risultanze documentali, ai libri e alle scritture contabili.<br />
Contatti<br />
Ivan Dompé<br />
Group Corporate Communications Director<br />
Tel.: +39 (02) 8633 4726<br />
Email: ivan.dompe@luxottica.com<br />
Alessandra Senici<br />
Group Investor Re<strong>la</strong>tions Director<br />
Tel.: +39 (02) 8633 4038<br />
Email: InvestorRe<strong>la</strong>tions@<strong>Luxottica</strong>.com<br />
Luca Biondolillo<br />
Group Director of International Communications<br />
Tel.: +39 (02) 8633 4668<br />
Email: LucaBiondolillo@<strong>Luxottica</strong>.com<br />
www.luxottica.com<br />
1 Tutti i confronti, incluse le variazioni percentuali, si riferiscono ai tre e nove mesi terminati il 30 settembre 2010 e il 30 settembre<br />
2009, secondo i principi contabili IAS/IFRS.<br />
2 I dati a parità cambi sono calco<strong>la</strong>ti utilizzando il cambio medio del rispettivo periodo di confronto. Per ulteriori informazioni si<br />
rimanda alle tabelle allegate.<br />
3 EBITDA, free cash flow, indebitamento netto e rapporto indebitamento netto / EBITDA sono indicatori non previsti dagli IAS/IFRS.<br />
Per ulteriori informazioni re<strong>la</strong>tivi a tali indicatori si rimanda alle tabelle allegate.<br />
4 Per vendite omogenee si intendono le vendite a parità di negozi, cambi e perimetro di consolidamento.<br />
<strong>Luxottica</strong> Group S.p.A.<br />
<strong>Luxottica</strong> Group è leader nel settore degli occhiali di fascia alta, di lusso e sportivi, con oltre<br />
6.300 negozi operanti sia nel segmento vista che sole in Nord America, Asia-Pacifico, Cina,<br />
4
Sudafrica, Europa e un portafoglio marchi <strong>forte</strong> e ben bi<strong>la</strong>nciato. Tra i marchi propri figurano<br />
Ray-Ban, il marchio di occhiali da sole più conosciuto al mondo, Oakley, Vogue, Persol, Oliver<br />
Peoples, Arnette e REVO mentre i marchi in licenza includono Bvlgari, Burberry, Chanel, Dolce<br />
& Gabbana, Donna Karan, Polo Ralph Lauren, Prada, Salvatore Ferragamo, Tiffany e Versace.<br />
Oltre a un network wholesale globale che tocca 130 Paesi, il Gruppo gestisce nei mercati<br />
principali alcune catene leader nel retail tra le quali LensCrafters, Pearle Vision e ILORI in Nord<br />
America, OPSM e Laubman & Pank in Asia-Pacifico, LensCrafters in Cina e Sung<strong>la</strong>ss Hut in tutto il<br />
mondo. I prodotti del Gruppo sono progettati e realizzati in sei impianti produttivi in Italia, in<br />
due, interamente control<strong>la</strong>ti, nel<strong>la</strong> Repubblica Popo<strong>la</strong>re Cinese e in uno negli Stati Uniti,<br />
dedicato al<strong>la</strong> produzione di occhiali sportivi. Nel 2009, <strong>Luxottica</strong> Group ha registrato vendite<br />
nette pari a €5.1 miliardi. Ulteriori informazioni sul Gruppo sono disponibili su<br />
www.luxottica.com.<br />
Safe Harbor Statement<br />
Talune dichiarazioni contenute in questo comunicato stampa potrebbero costituire previsioni<br />
("forward looking statements") così come definite dal Private Securities Litigation Reform Act<br />
del 1995. Tali dichiarazioni riguardano rischi, incertezze e altri fattori che potrebbero portare i<br />
<strong>risultati</strong> effettivi a differire, anche in modo sostanziale, da quelli anticipati. Tra tali rischi ed<br />
incertezze rientrano, a titolo meramente esemplificativo e non esaustivo, <strong>la</strong> capacità di gestire<br />
gli effetti dell’attuale incerta congiuntura economica internazionale, <strong>la</strong> capacità di acquisire<br />
nuove attività e di integrarle efficacemente, <strong>la</strong> capacità di prevedere le future condizioni<br />
economiche e cambi nelle preferenze <strong>dei</strong> consumatori, <strong>la</strong> capacità di introdurre e<br />
commercializzare con successo nuovi prodotti, <strong>la</strong> capacità di mantenere un sistema distributivo<br />
efficiente, <strong>la</strong> capacità di raggiungere e gestire <strong>la</strong> <strong>crescita</strong>, <strong>la</strong> capacità di negoziare e mantenere<br />
accordi di licenza favorevoli, <strong>la</strong> disponibilità di strumenti correttivi alternativi agli occhiali da<br />
vista, fluttuazioni valutarie, variazioni nelle condizioni locali, <strong>la</strong> capacità di proteggere <strong>la</strong><br />
proprietà intellettuale, <strong>la</strong> capacità di mantenere le re<strong>la</strong>zioni con chi ospita nostri negozi,<br />
problemi <strong>dei</strong> sistemi informativi, rischi legati agli inventari, rischi di credito e assicurativi,<br />
cambiamenti nei regimi fiscali, così come altri fattori politici, economici e tecnologici e altri<br />
rischi e incertezze già evidenziati nei nostri filing presso <strong>la</strong> Securities and Exchange Commission.<br />
Tali previsioni ("forward looking statements") sono state ri<strong>la</strong>sciate al<strong>la</strong> data di oggi e non ci<br />
assumiamo alcun obbligo di aggiornamento.<br />
- SEGUONO LE TABELLE –<br />
5
LUXOTTICA GROUP<br />
CONSOLIDATED FINANCIAL HIGHLIGHTS<br />
FOR THE THREE-MONTH PERIODS ENDED<br />
SEPTEMBER 30, 2010 AND SEPTEMBER 30, 2009<br />
In accordance with IAS/IFRS<br />
KEY FIGURES IN THOUSANDS OF EURO (1) 2010 2009 % Change<br />
NET SALES 1,464,732 1,223,272 19.7%<br />
NET INCOME 101,934 75,784 34.5%<br />
BASIC EARNINGS PER SHARE (ADS) (2) : 0.22 0.17 34.1%<br />
KEY FIGURES IN THOUSANDS OF U.S. DOLLARS (1) (3) 2010 2009 % Change<br />
NET SALES 1,890,969 1,749,646 8.1%<br />
NET INCOME 131,597 108,394 21.4%<br />
BASIC EARNINGS PER SHARE (ADS) (2) : 0.29 0.24 21.1%<br />
Notes : 2010 2009<br />
(1) Except earnings per share (ADS), which are expressed in Euro and U.S. Dol<strong>la</strong>rs, respectively<br />
(2) Weighted average number of outstanding shares 458,527,966 457,214,454<br />
(3) Average exchange rate (in U.S. Dol<strong>la</strong>rs per Euro) 1.2910 1.4303<br />
<strong>Luxottica</strong> Group 3Q10, Table 1 of 6
LUXOTTICA GROUP<br />
CONSOLIDATED FINANCIAL HIGHLIGHTS<br />
FOR THE NINE-MONTH PERIODS ENDED<br />
SEPTEMBER 30, 2010 AND SEPTEMBER 30, 2009<br />
In accordance with IAS/IFRS<br />
KEY FIGURES IN THOUSANDS OF EURO (1) 2010 2009 % Change<br />
NET SALES 4,451,542 3,937,233 13.1%<br />
NET INCOME 347,077 269,869 28.6%<br />
BASIC EARNINGS PER SHARE (ADS) (2) 0.76 0.59 28.2%<br />
KEY FIGURES IN THOUSANDS OF U.S. DOLLARS (1) (3) 2010 2009 % Change<br />
NET SALES 5,851,552 5,379,048 8.8%<br />
NET INCOME 456,233 368,695 23.7%<br />
BASIC EARNINGS PER SHARE (ADS) (2) 0.99 0.81 23.4%<br />
Notes : 2010 2009<br />
(1) Except earnings per share (ADS), which are expressed in Euro and U.S. Dol<strong>la</strong>rs, respectively<br />
(2) Weighted average number of outstanding shares 458,544,153 457,108,193<br />
(3) Average exchange rate (in U.S. Dol<strong>la</strong>rs per Euro) 1.3145 1.3662<br />
<strong>Luxottica</strong> Group 3Q10, Table 2 of 6
LUXOTTICA GROUP<br />
CONSOLIDATED INCOME STATEMENT<br />
FOR THE THREE-MONTH PERIODS ENDED<br />
SEPTEMBER 30, 2010 AND SEPTEMBER 30, 2009<br />
In accordance with IAS/IFRS<br />
In thousands of Euro (1) 3Q 10 % of sales 3Q 09 % of sales % Change<br />
NET SALES 1,464,732 100.0% 1,223,272 100.0% 19.7%<br />
COST OF SALES (499,849) (420,784)<br />
GROSS PROFIT 964,883 65.9% 802,488 65.6% 20.2%<br />
OPERATING EXPENSES:<br />
SELLING EXPENSES (490,264) (412,049)<br />
ROYALTIES (22,012) (20,342)<br />
ADVERTISING EXPENSES (89,967) (73,246)<br />
GENERAL AND ADMINISTRATIVE EXPENSES (154,907) (137,217)<br />
TRADEMARK AMORTIZATION (21,297) (20,072)<br />
TOTAL (778,447) (662,925)<br />
OPERATING INCOME 186,436 12.7% 139,563 11.4% 33.6%<br />
OTHER INCOME (EXPENSE):<br />
INTEREST EXPENSES (26,929) (29,663)<br />
INTEREST INCOME 2,543 954<br />
OTHER - NET (1,120) 2,087<br />
OTHER INCOME (EXPENSES)-NET (25,507) (26,621)<br />
INCOME BEFORE PROVISION FOR<br />
INCOME TAXES 160,929 11.0% 112,941 9.2% 42.5%<br />
PROVISION FOR INCOME TAXES (58,229) (36,142)<br />
NET INCOME 102,700 76,800<br />
LESS: NET INCOME ATTRIBUTABLE TO NONCONTROLLING<br />
INTEREST (766) (1,016)<br />
NET INCOME ATTRIBUTABLE TO<br />
LUXOTTICA GROUP SHAREHOLDERS 101,934 7.0% 75,784 6.2% 34.5%<br />
BASIC EARNINGS PER SHARE (ADS): 0.22 0.17<br />
FULLY DILUTED EARNINGS PER SHARE (ADS): 0.22 0.17<br />
WEIGHTED AVERAGE NUMBER OF<br />
OUTSTANDING SHARES 458,527,966 457,214,454<br />
FULLY DILUTED AVERAGE NUMBER OF SHARES 460,152,396 458,303,432<br />
Notes :<br />
(1) Except earnings per share (ADS), which are expressed in Euro<br />
(2) Certain figures from 2008 have been rec<strong>la</strong>ssified to conform to the 2009 presentation<br />
<strong>Luxottica</strong> Group 3Q10, Table 3 of 6
LUXOTTICA GROUP<br />
CONSOLIDATED INCOME STATEMENT<br />
FOR THE NINE-MONTH PERIODS ENDED<br />
SEPTEMBER 30, 2010 AND SEPTEMBER 30, 2009<br />
In accordance with IAS/IFRS<br />
In thousands of Euro (1) 2010 % of sales 2009 % of sales % Change<br />
NET SALES 4,451,542 100.0% 3,937,233 100.0% 13.1%<br />
COST OF SALES (1,529,395) (1,352,480)<br />
GROSS PROFIT 2,922,148 65.6% 2,584,752 65.6% 13.1%<br />
OPERATING EXPENSES:<br />
SELLING EXPENSES (1,427,794) (1,281,290)<br />
ROYALTIES (74,512) (74,509)<br />
ADVERTISING EXPENSES (286,455) (245,410)<br />
GENERAL AND ADMINISTRATIVE EXPENSES (454,547) (425,227)<br />
TRADEMARK AMORTIZATION (62,829) (61,266)<br />
TOTAL (2,306,136) (2,087,703)<br />
OPERATING INCOME 616,012 13.8% 497,049 12.6% 23.9%<br />
OTHER INCOME (EXPENSE):<br />
INTEREST EXPENSES (78,500) (79,307)<br />
INTEREST INCOME 5,824 4,322<br />
OTHER - NET (5,872) (1,905)<br />
OTHER INCOME (EXPENSES)-NET (78,548) (76,890)<br />
INCOME BEFORE PROVISION FOR<br />
INCOME TAXES 537,464 12.1% 420,159 10.7% 27.9%<br />
PROVISION FOR INCOME TAXES (186,202) (145,308)<br />
NET INCOME 351,262 274,852<br />
LESS: NET INCOME ATTRIBUTABLE TO NONCONTROLLING<br />
INTEREST (4,185) (4,983)<br />
NET INCOME ATTRIBUTABLE TO<br />
LUXOTTICA GROUP SHAREHOLDERS 347,077 7.8% 269,869 6.9% 28.6%<br />
BASIC EARNINGS PER SHARE (ADS): 0.76 0.59<br />
FULLY DILUTED EARNINGS PER SHARE (ADS): 0.75 0.59<br />
WEIGHTED AVERAGE NUMBER OF<br />
OUTSTANDING SHARES 458,544,153 457,108,193<br />
FULLY DILUTED AVERAGE NUMBER OF SHARES 460,249,173 457,661,787<br />
Notes :<br />
(1) Except earnings per share (ADS), which are expressed in Euro<br />
(2) certain amounts of 2009 have been rec<strong>la</strong>ssified to conform to 2010 presentation<br />
<strong>Luxottica</strong> Group 3Q10, Table 4 of 6
LUXOTTICA GROUP<br />
CONSOLIDATED BALANCE SHEET<br />
AS OF SEPTEMBER 30, 2010 AND DECEMBER 31, 2009<br />
In accordance with IAS/IFRS<br />
In thousands of Euro September 30, 2010 December 31, 2009<br />
CURRENT ASSETS:<br />
CASH AND CASH EQUIVALENTS 482,943 380,081<br />
MARKETABLE SECURITIES 25,330<br />
ACCOUNTS RECEIVABLE - NET 665,332 618,884<br />
SALES AND INCOME TAXES RECEIVABLE 24,512 59,516<br />
INVENTORIES - NET 562,047 524,663<br />
PREPAID EXPENSES AND OTHER 143,404 138,849<br />
DEFERRED TAX ASSETS - CURRENT<br />
TOTAL CURRENT ASSETS 1,903,577 1,721,993<br />
PROPERTY, PLANT AND EQUIPMENT - NET 1,167,933 1,149,972<br />
OTHER ASSETS<br />
INTANGIBLE ASSETS - NET 3,992,926 3,838,715<br />
INVESTMENTS 51,454 46,317<br />
OTHER ASSETS 147,893 146,626<br />
SALES AND INCOME TAXES RECEIVABLE 1,191 965<br />
DEFERRED TAX ASSETS - NON-CURRENT 380,304 356,706<br />
TOTAL OTHER ASSETS 4,573,768 4,389,329<br />
TOTAL 7,645,278 7,261,294<br />
CURRENT LIABILITIES:<br />
BANK OVERDRAFTS 221,956 148,951<br />
CURRENT PORTION OF LONG-TERM DEBT 135,142 166,279<br />
ACCOUNTS PAYABLE 415,576 434,604<br />
ACCRUED EXPENSES AND OTHER 483,752 526,801<br />
ACCRUAL FOR CUSTOMERS' RIGHT OF RETURN 31,335 27,334<br />
INCOME TAXES PAYABLE 88,044 11,204<br />
TOTAL CURRENT LIABILITIES 1,375,805 1,315,174<br />
LONG-TERM LIABILITIES:<br />
LONG-TERM DEBT 2,394,627 2,401,796<br />
LIABILITY FOR TERMINATION INDEMNITIES 42,755 44,633<br />
DEFERRED TAX LIABILITIES - NON-CURRENT 403,224 396,048<br />
OTHER LONG-TERM LIABILITIES 315,495 350,028<br />
TOTAL LIABILITIES 4,531,905 4,507,679<br />
EQUITY:<br />
465,222,483 ORDINARY SHARES AUTHORIZED AND ISSUED - 458,768,198 SHARES<br />
OUTSTANDING 27,913 27,863<br />
NET INCOME ATTRIBUTABLE TO LUXOTTICA GROUP SHAREHOLDERS 347,077 299,122<br />
RETAINED EARNINGS 2,726,292 2,410,253<br />
TOTAL LUXOTTICA GROUP SHAREHOLDERS' EQUITY 3,101,281 2,737,239<br />
NONCONTROLLING INTEREST 12,091 16,376<br />
TOTAL EQUITY 3,113,373 2,753,615<br />
TOTAL 7,645,278 7,261,294<br />
<strong>Luxottica</strong> Group 3Q10, Table 5 of 6
LUXOTTICA GROUP<br />
CONSOLIDATED FINANCIAL HIGHLIGHTS<br />
FOR THE NINE-MONTH PERIODS ENDED<br />
SEPTEMBER 30, 2010 AND SEPTEMBER 30, 2009<br />
- SEGMENTAL INFORMATION -<br />
In accordance with IAS/IFRS<br />
In thousands of Euro<br />
2010<br />
Manufacturing<br />
and<br />
Wholesale<br />
Retail<br />
Inter-Segment<br />
Transactions and<br />
Corporate Adj.<br />
Consolidated<br />
Net Sales 1,722,947 2,728,595 4,451,542<br />
Operating Income 372,235 353,877 (110,101) 616,012<br />
% of sales 21.6% 13.0% 13.8%<br />
Capital Expenditures 59,556 79,709 139,264<br />
Depreciation & Amortization 58,297 104,317 62,829 225,442<br />
2009<br />
Net Sales 1,506,468 2,430,764 3,937,233<br />
Operating income 296,069 310,707 (109,726) 497,049<br />
% of sales 19.7% 12.8% 12.6%<br />
Capital Expenditures 52,490 78,578 131,068<br />
Depreciation & Amortization 55,915 97,031 61,266 214,212<br />
<strong>Luxottica</strong> Group 3Q10, Table 6 of 6
Major currencies<br />
Average exchange rates<br />
per € 1<br />
Three months ended Nine Months ended Twelve months ended Three months ended Nine months ended<br />
September 30, 2009 September 30, 2009 December 31, 2009 September 30, 2010 September 30, 2010<br />
US$ 1.43030 1.36618 1.39467 1.29104 1.31453<br />
AUD 1.71689 1.82338 1.77281 1.42885 1.46555<br />
GBP 0.87161 0.88633 0.89104 0.83305 0.85730<br />
CNY 9.77019 9.33414 9.52693 8.73875 8.94742<br />
JPY 133.81712 129.50037 130.31404 110.67500 117.66057
Non-IAS/IFRS Measure: EBITDA and EBITDA margin<br />
<br />
EBITDA represents net income before non-controlling interest, taxes, other income/expense, depreciation and amortization. EBITDA margin means EBITDA divided by net sales.<br />
The Company believes that EBITDA is useful to both management and investors in evaluating the Company’s operating performance compared with that of other companies in its industry.<br />
Our calcu<strong>la</strong>tion of EBITDA allows us to compare our operating results with those of other companies without giving effect to financing, income taxes<br />
and the accounting effects of capital spending, which items may vary for different companies for reasons unre<strong>la</strong>ted to the overall operating performance of a company’s business.<br />
<br />
EBITDA and EBITDA margin are not measures of performance under International Financial Reporting Standards as issued by the International Accounting Standards Board (IAS/IFRS).<br />
We include them in this presentation in order to:<br />
* improve transparency for investors;<br />
* assist investors in their assessment of the Company’s operating performance and its ability to refinance its debt as it matures and incur additional indebtedness to invest in new business opportunities;<br />
* assist investors in their assessment of the Company’s cost of debt;<br />
* ensure that these measures are fully understood in light of how the Company evaluates its operating results and leverage;<br />
* properly define the metrics used and confirm their calcu<strong>la</strong>tion; and<br />
* share these measures with all investors at the same time.<br />
EBITDA and EBITDA margin are not meant to be considered in iso<strong>la</strong>tion or as a substitute for items appearing on our financial statements prepared in accordance with IAS/IFRS.<br />
Rather, these non-IAS/IFRS measures should be used as a supplement to IAS/IFRS results to assist the reader in better understanding the operational performance of the Company.<br />
The Company cautions that these measures are not defined terms under IAS/IFRS and their definitions should be carefully reviewed and understood by investors.<br />
Investors should be aware that <strong>Luxottica</strong> Group’s method of calcu<strong>la</strong>ting EBITDA may differ from methods used by other companies. The Company recognizes that the usefulness of EBITDA has certain limitations, including:<br />
* EBITDA does not include interest expense. Because we have borrowed money in order to finance our operations, interest expense is a necessary element of our costs and ability to generate profits and cash flows.<br />
Therefore, any measure that excludes interest expense may have material limitations;<br />
* EBITDA does not include depreciation and amortization expense. Because we use capital assets, depreciation and amortization expense is a necessary element of our costs and ability to generate profits.<br />
Therefore, any measure that excludes depreciation and expense may have material limitations;<br />
* EBITDA does not include provision for income taxes. Because the payment of income taxes is a necessary element of our costs, any measure that excludes tax expense may have material limitations;<br />
* EBITDA does not reflect cash expenditures or future requirements for capital expenditures or contractual commitments;<br />
* EBITDA does not reflect changes in, or cash requirements for, working capital needs;<br />
* EBITDA does not allow us to analyze the effect of certain recurring and non-recurring items that materially affect our net income or loss.<br />
<br />
<br />
We compensate for the foregoing limitations by using EBITDA as a comparative tool, together with IAS/IFRS measurements, to assist in the evaluation of our operating performance and leverage.<br />
See the tables on the following pages for a reconciliation of EBITDA to net income, which is the most directly comparable IAS/IFRS financial measure, as well as the calcu<strong>la</strong>tion of EBITDA margin on net sales.
Non-IAS/IFRS Measure: EBITDA and EBITDA margin<br />
Millions of Euro<br />
3Q 2010 3Q 2009 9M 2010 9M 2009 FY09<br />
LTM September<br />
30, 2010<br />
Net income/(loss) 101.9 75.8 347.1 269.9 299.1 376.3<br />
(+)<br />
Net income attributable to non-controlling interest 0.8 1.0 4.2 5.0 5.8 5.0<br />
(+)<br />
Provision for income taxes 58.2 36.1 186.2 145.3 159.9 200.8<br />
(+)<br />
Other (income)/expense 25.5 26.6 78.5 76.9 106.3 108.0<br />
(+)<br />
Depreciation & amortization 77.0 70.2 225.4 214.2 285.4 296.7<br />
(+)<br />
EBITDA 263.5 209.8 841.5 711.3 856.5 986.7<br />
(=)<br />
Net sales 1,464.7 1,223.3 4,451.5 3,937.2 5,094.3 5,608.6<br />
(/)<br />
EBITDA margin 18.0% 17.1% 18.9% 18.1% 16.8% 17.6%<br />
(=)
Non-IAS/IFRS Measure: Net Debt to EBITDA ratio<br />
Net debt to EBITDA ratio: Net debt means the sum of bank overdrafts, current portion of long-term debt and long-term debt, less cash. EBITDA represents net income before non-controlling interest, taxes, other income/expense, depreciation and amortization.<br />
The Company believes that EBITDA is useful to both management and investors in evaluating the Company’s operating performance compared with that of other companies in its industry.<br />
Our calcu<strong>la</strong>tion of EBITDA allows us to compare our operating results with those of other companies without giving effect to financing, income taxes and the accounting effects of capital spending,<br />
which items may vary for different companies for reasons unre<strong>la</strong>ted to the overall operating performance of a company’s business. The ratio of net debt to EBITDA is a measure used by management to assess<br />
the Company’s level of leverage, which affects our ability to refinance our debt as it matures and incur additional indebtedness to invest in new business opportunities.<br />
The ratio also allows management to assess the cost of existing debt since it affects the interest rates charged by the Company’s lenders.<br />
EBITDA and ratio of net debt to EBITDA are not measures of performance under International Financial Reporting Standards as issued by the International Accounting Standards Board (IAS/IFRS).<br />
We include them in this presentation in order to:<br />
* improve transparency for investors;<br />
* assist investors in their assessment of the Company’s operating performance and its ability to refinance its debt as it matures and incur additional indebtedness to invest in new business opportunities;<br />
* assist investors in their assessment of the Company’s cost of debt;<br />
* ensure that these measures are fully understood in light of how the Company evaluates its operating results and leverage;<br />
* properly define the metrics used and confirm their calcu<strong>la</strong>tion; and<br />
* share these measures with all investors at the same time.<br />
EBITDA and ratio of net debt to EBITDA are not meant to be considered in iso<strong>la</strong>tion or as a substitute for items appearing on our financial statements prepared in accordance with IAS/IFRS.<br />
Rather, these non-IAS/IFRS measures should be used as a supplement to IAS/IFRS results to assist the reader in better understanding the operational performance of the Company.<br />
The Company cautions that these measures are not defined terms under IAS/IFRS and their definitions should be carefully reviewed and understood by investors.<br />
Investors should be aware that <strong>Luxottica</strong> Group’s method of calcu<strong>la</strong>ting EBITDA and the ratio of net debt to EBITDA may differ from methods used by other companies.<br />
The Company recognizes that the usefulness of EBITDA and the ratio of net debt to EBITDA as evaluative tools may have certain limitations, including:<br />
* EBITDA does not include interest expense. Because we have borrowed money in order to finance our operations, interest expense is a necessary element of our costs and ability to generate profits and cash flows.<br />
Therefore, any measure that excludes interest expense may have material limitations;<br />
* EBITDA does not include depreciation and amortization expense. Because we use capital assets, depreciation and amortization expense is a necessary element of our costs and ability to generate profits.<br />
Therefore, any measure that excludes depreciation and expense may have material limitations;<br />
* EBITDA does not include provision for income taxes. Because the payment of income taxes is a necessary element of our costs, any measure that excludes tax expense may have material limitations;<br />
* EBITDA does not reflect cash expenditures or future requirements for capital expenditures or contractual commitments;<br />
* EBITDA does not reflect changes in, or cash requirements for, working capital needs;<br />
* EBITDA does not allow us to analyze the effect of certain recurring and non-recurring items that materially affect our net income or loss; and<br />
* The ratio of net debt to EBITDA is net of cash and cash equivalents, restricted cash and short-term investments, thereby reducing our debt position.<br />
Because we may not be able to use our cash to reduce our debt on a dol<strong>la</strong>r-for-dol<strong>la</strong>r basis, this measure may have material limitations.<br />
We compensate for the foregoing limitations by using EBITDA and the ratio of net debt to EBITDA as two of several comparative tools, together with IAS/IFRS measurements, to assist in the evaluation of our operating performance and leverage.<br />
See the tables on the following pages for a reconciliation of net debt to long-term debt, which is the most directly comparable IAS/IFRS financial measure, as well as the calcu<strong>la</strong>tion of the ratio of net debt to EBITDA.<br />
For a reconciliation of EBITDA to net income, which is the most directly comparable IAS/IFRS financial measure, see the tables on the preceding pages.
Non-IAS/IFRS Measure: Net debt and Net debt / EBITDA<br />
Millions of Euro<br />
September 30, 2010 Dec 31, 2009<br />
Long-term debt 2,394.6 2,401.8<br />
(+)<br />
Current portion of long-term debt (+) 135.1 166.3<br />
(+)<br />
Bank overdrafts (+) 222.0 149.0<br />
Cash (-) (482.9) (380.1)<br />
Net debt (=) 2,268.8 2,336.9<br />
LTM EBITDA 986.7 856.5<br />
Net debt/LTM EBITDA 2.3x 2.7x<br />
Net debt @ avg. exchange rates (1) 2,274.7 2,381.7<br />
Net debt @ avg. exchange rates (1) /LTM EBITDA 2.3x 2.8x<br />
1. Net debt figures are calcu<strong>la</strong>ted using the average exchange rates used to calcu<strong>la</strong>te the EBITDA figures
Non-IAS/IFRS Measures: Free Cash Flow<br />
Free cash flow net represents net income before non-controlling interest, taxes, other income/espense,depreciation and amortization (i.e. EBITDA – see table on the earlier page) plus or minus the decrease/(increase)<br />
in working capital over the prior period, less capital expenditures, plus or minus interest income/(expense) and extraordinary items, minus taxes paid. The Company believes that free cash flow is useful to both management<br />
and investors in evaluating the Company’s operating performance compared with other companies in its industry. In particu<strong>la</strong>r, our calcu<strong>la</strong>tion of free cash flow provides a clearer picture of the<br />
Company’s ability to generate net cash from operations, which is used for mandatory debt service requirements, to fund discretionary investments, pay dividends or pursue other strategic opportunities.<br />
Free cash flow is not a measure of performance under International Financial Reporting Standards as issued by the International Accounting Standards Board (IAS/IFRS).<br />
We include it in this presentation in order to:<br />
* Improve transparency for investors;<br />
* Assist investors in their assessment of the Company’s operating performance and its ability to generate cash from operations in excess of its cash expenses;<br />
* Ensure that this measure is fully understood in light of how the Company evaluates its operating results;<br />
* Properly define the metrics used and confirm their calcu<strong>la</strong>tion; and<br />
* Share this measure with all investors at the same time.<br />
Free cash flow is not meant to be considered in iso<strong>la</strong>tion or as a substitute for items appearing on our financial statements prepared in accordance with IAS/IFRS.<br />
Rather, this non-IAS/IFRS measure should be used as a supplement to IAS/IFRS results to assist the reader in better understanding the operational performance of the Company.<br />
The Company cautions that this measure is not a defined term under IAS/IFRS and its definition should be carefully reviewed and understood by investors.<br />
Investors should be aware that <strong>Luxottica</strong> Group’s method of calcu<strong>la</strong>tion of free cash flow may differ from methods used by other companies.<br />
The Company recognizes that the usefulness of free cash flow as an evaluative tool may have certain limitations, including:<br />
• The manner in which the Company calcu<strong>la</strong>tes free cash flow may differ from that of other companies, which limits its usefulness as a comparative measure;<br />
• Free cash flow does not represent the total increase or decrease in the net debt ba<strong>la</strong>nce for the period since it excludes, among other things, cash<br />
used for funding discretionary investments and to pursue strategic opportunities during the period and any impact of the exchange rate changes; and<br />
• Free cash flow can be subject to adjustment at the Company’s discretion if the Company takes steps or adopts policies that increase or diminish its current liabilities and/or changes to working capital.<br />
We compensate for the foregoing limitations by using free cash flow as one of several comparative tools, together with IAS/IFRS measurements, to assist in the evaluation of our operating performance.<br />
See the table on the following page for a reconciliation of free cash flow to EBITDA and the table on the earlier page for a reconciliation of EBITDA to net income,<br />
which is the most directly comparable IAS/IFRS financial measure.
Non-IAS/IFRS Measure: Free cash flow<br />
Millions of Euro<br />
3Q 2010<br />
EBITDA (1) 263.5<br />
Δ working capital 90.7<br />
Capex (56.4)<br />
Operating cash flow 297.8<br />
Financial charges (2) (24.4)<br />
Taxes (20.1)<br />
Extraordinary charges (3) (1.1)<br />
Free cash flow 252.2<br />
1. EBITDA is not an IAS/IFRS measure; please see table on the earlier page for a reconciliation of EBITDA to net income<br />
2. Equals interest income minus interest expense<br />
3. Equals extraordinary income minus extraordinary expense