Luxottica: prosegue la forte crescita dei risultati
Luxottica: prosegue la forte crescita dei risultati
Luxottica: prosegue la forte crescita dei risultati

You also want an ePaper? Increase the reach of your titles
YUMPU automatically turns print PDFs into web optimized ePapers that Google loves.
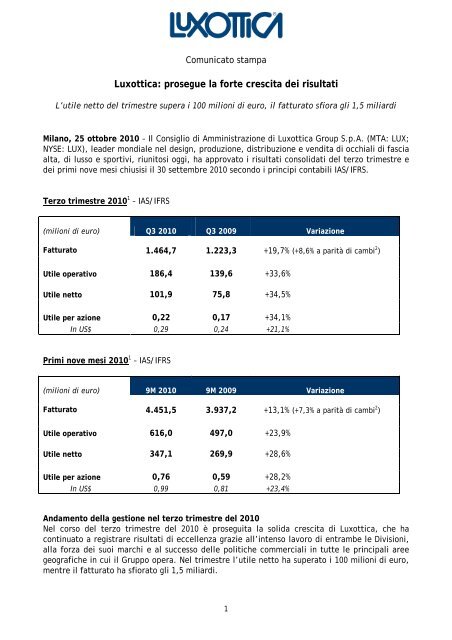
Comunicato stampa<br />
<strong>Luxottica</strong>: <strong>prosegue</strong> <strong>la</strong> <strong>forte</strong> <strong>crescita</strong> <strong>dei</strong> <strong>risultati</strong><br />
L’utile netto del trimestre supera i 100 milioni di euro, il fatturato sfiora gli 1,5 miliardi<br />
Mi<strong>la</strong>no, 25 ottobre 2010 – Il Consiglio di Amministrazione di <strong>Luxottica</strong> Group S.p.A. (MTA: LUX;<br />
NYSE: LUX), leader mondiale nel design, produzione, distribuzione e vendita di occhiali di fascia<br />
alta, di lusso e sportivi, riunitosi oggi, ha approvato i <strong>risultati</strong> consolidati del terzo trimestre e<br />
<strong>dei</strong> primi nove mesi chiusisi il 30 settembre 2010 secondo i principi contabili IAS/IFRS.<br />
Terzo trimestre 2010 1 – IAS/IFRS<br />
(milioni di euro) Q3 2010 Q3 2009 Variazione<br />
Fatturato 1.464,7 1.223,3 +19,7% (+8,6% a parità di cambi 2 )<br />
Utile operativo 186,4 139,6 +33,6%<br />
Utile netto 101,9 75,8 +34,5%<br />
Utile per azione 0,22 0,17 +34,1%<br />
In US$ 0,29 0,24 +21,1%<br />
Primi nove mesi 2010 1 – IAS/IFRS<br />
(milioni di euro) 9M 2010 9M 2009 Variazione<br />
Fatturato 4.451,5 3.937,2 +13,1% (+7,3% a parità di cambi 2 )<br />
Utile operativo 616,0 497,0 +23,9%<br />
Utile netto 347,1 269,9 +28,6%<br />
Utile per azione 0,76 0,59 +28,2%<br />
In US$ 0,99 0,81 +23,4%<br />
Andamento del<strong>la</strong> gestione nel terzo trimestre del 2010<br />
Nel corso del terzo trimestre del 2010 è proseguita <strong>la</strong> solida <strong>crescita</strong> di <strong>Luxottica</strong>, che ha<br />
continuato a registrare <strong>risultati</strong> di eccellenza grazie all’intenso <strong>la</strong>voro di entrambe le Divisioni,<br />
al<strong>la</strong> forza <strong>dei</strong> suoi marchi e al successo delle politiche commerciali in tutte le principali aree<br />
geografiche in cui il Gruppo opera. Nel trimestre l’utile netto ha superato i 100 milioni di euro,<br />
mentre il fatturato ha sfiorato gli 1,5 miliardi.<br />
1
“Anche il terzo trimestre ci ha visto conseguire buoni <strong>risultati</strong>”, ha commentato Andrea<br />
Guerra, Chief Executive Officer di <strong>Luxottica</strong>. “Tutte le persone all’interno del<strong>la</strong> nostra<br />
organizzazione hanno saputo reagire con determinazione e cogliere il meglio che questo nuovo<br />
mondo ci propone. Questi <strong>risultati</strong> possono essere sintetizzati in un solido incremento nei<br />
mercati cosiddetti maturi – in Europa il fatturato è cresciuto del 12,7%, in Nord America il<br />
fatturato in dol<strong>la</strong>ri è aumentato dell’8,5% - e in una <strong>forte</strong> <strong>crescita</strong> in tutti i principali Paesi<br />
emergenti, dove le nostre vendite hanno registrato un incremento del 26,2%.<br />
La stagione “sole” è stata positiva in tutto il mondo e Sung<strong>la</strong>ss Hut, <strong>la</strong> nostra catena retail<br />
specializzata in questo segmento, è stata in grado di registrare ottime performance sia negli<br />
Stati Uniti, con vendite omogenee 4 cresciute del 12,5%, sia a livello globale.<br />
E’ importante sottolineare <strong>la</strong> nuova tendenza del segmento premium e lusso del nostro<br />
portafoglio marchi: da ormai due trimestri assistiamo, giorno dopo giorno, a un crescente<br />
numero di consumatori nuovamente interessati ai prodotti di questo segmento.<br />
Sono inoltre partico<strong>la</strong>rmente soddisfatto del<strong>la</strong> nostra capacità di generare cassa, oltre 250<br />
milioni nel trimestre 3 , a conferma dal<strong>la</strong> validità del nostro modello di business e<br />
dell’attenzione quotidiana nel<strong>la</strong> gestione del capitale circo<strong>la</strong>nte.<br />
I <strong>risultati</strong> conseguiti sino a oggi ci consentono di guardare con ottimismo al<strong>la</strong> fine di un anno<br />
che, se continueremo a <strong>la</strong>vorare con <strong>la</strong> determinazione e <strong>la</strong> passione mostrate in questi mesi,<br />
potrebbe vederci raggiungere il traguardo <strong>dei</strong> 400 milioni di utile netto”.<br />
Nel corso del terzo trimestre dell’anno <strong>Luxottica</strong> ha saputo conseguire performance molto<br />
positive nel<strong>la</strong> maggior parte delle regioni geografiche in cui opera. A questi <strong>risultati</strong> ha<br />
contribuito in maniera determinante <strong>la</strong> Divisione Wholesale, in grado di crescere in maniera<br />
sostenuta sia nei mercati più maturi come Stati Uniti ed Europa che nei Paesi emergenti, il cui<br />
fatturato, per il quarto trimestre consecutivo, ha segnato un incremento superiore al 20% con<br />
punte del 40% in India e Corea.<br />
Molto positivi anche i <strong>risultati</strong> sia di LensCrafters, tornata a essere il punto di riferimento per il<br />
settore del retail ottico nord americano, sia di Sung<strong>la</strong>ss Hut, oggi più che mai <strong>la</strong> principale<br />
catena al mondo di negozi specializzati nel segmento “sole”.<br />
Il Gruppo<br />
Nel terzo trimestre del 2010, il fatturato del Gruppo ha mostrato un incremento del 19,7% a<br />
cambi correnti (+8,6% a parità di cambi 2 ), passando da 1.223,3 milioni a 1.464,7 milioni di<br />
euro. Nei primi nove mesi, quindi, il fatturato è cresciuto del 13,1% a 4.451,5 milioni di euro<br />
(3.937,2 milioni nei primi nove mesi del 2009).<br />
Considerando le performance operative, l’EBITDA 3 è risultato in progresso rispetto all’anno<br />
precedente, passando da 209,8 milioni di euro del terzo trimestre 2009 a 263,5 milioni di euro<br />
(+25,6%). Nei nove mesi, l’EBITDA 3 è passato a 841,5 milioni dai 711,3 milioni <strong>dei</strong> primi nove<br />
mesi del 2009 (+18,3%).<br />
Il risultato operativo si è attestato a 186,4 milioni di euro (139,6 milioni nello stesso periodo<br />
dell’anno precedente, +33,6%), mentre il margine operativo del Gruppo è passato al 12,7%<br />
dall’11,4% del terzo trimestre 2009. Nei primi nove mesi dell’anno, il risultato operativo è stato<br />
pari a 616,0 milioni di euro, in progresso del 23,9% rispetto ai 497,0 milioni dello stesso periodo<br />
dell’anno precedente.<br />
2
L’utile netto del terzo trimestre del 2010 è quindi cresciuto a 101,9 milioni di euro (75,8<br />
milioni nel 2009, +34,5%), corrispondente a un EPS (utile per azione) di 0,22 euro (con un<br />
cambio medio euro/dol<strong>la</strong>ro pari a 1,2910). Nei primi nove mesi dell’anno, l’utile netto è stato<br />
quindi pari a 347,1 milioni di euro (269,9 milioni nei primi nove mesi del 2009, +28,6%),<br />
corrispondente a un EPS di 0,76 euro (con un cambio medio euro/dol<strong>la</strong>ro pari a 1,3145).<br />
Anche nel terzo trimestre del 2010 il Gruppo ha ottenuto un’ottima generazione di cassa<br />
positiva 3 (oltre 250 milioni di euro): l’indebitamento netto al 30 settembre 2010 è risultato<br />
quindi pari a 2.269 milioni di euro (2.337 milioni a fine 2009), con un rapporto indebitamento<br />
netto/EBITDA 3 pari a 2,3 rispetto a 2,7 di fine 2009.<br />
Divisione wholesale<br />
Nel corso del trimestre <strong>la</strong> divisione ha continuato a registrare <strong>risultati</strong> di eccellenza, grazie al<br />
continuo successo delle politiche commerciali, al <strong>forte</strong> apprezzamento da parte <strong>dei</strong> clienti delle<br />
collezioni e di iniziative a loro rivolte come i Buying Days, e all’ottimo andamento di tutti i<br />
marchi del Gruppo. In partico<strong>la</strong>re, è importante sottolineare come per il secondo trimestre<br />
consecutivo i marchi del segmento premium e lusso abbiano accelerato nel loro trend di<br />
miglioramento, con un fatturato cresciuto del 18% nel trimestre. Ray-Ban e Oakley a loro volta<br />
hanno continuato a crescere a doppia cifra, con un successo partico<strong>la</strong>re per le collezioni vista.<br />
Per quanto riguarda l’andamento delle vendite nelle principali aree geografiche, <strong>Luxottica</strong> ha<br />
registrato performance decisamente positive nei Paesi emergenti, in partico<strong>la</strong>re in Brasile, Cina<br />
e India, nonché in Europa.<br />
Il fatturato del<strong>la</strong> divisione è quindi passato a 518,3 milioni di euro dai 429,5 milioni del terzo<br />
trimestre 2009 (+20,7% a cambi correnti e +12,4% a parità di cambi 2 ). Nei nove mesi, il fatturato<br />
si è attestato a 1.722,9 milioni di euro, in progresso del 14,4% rispetto ai 1.506,5 milioni del<br />
primo semestre 2009 (+9,5% a parità di cambi 2 ).<br />
Il risultato operativo del<strong>la</strong> divisione Wholesale si è quindi attestato a 94,9 milioni di euro, in<br />
<strong>crescita</strong> del 53,8% rispetto ai 61,7 milioni del terzo trimestre 2009. Il margine operativo è<br />
passato al 18,3% dal 14,4% del terzo trimestre del 2009, confermando l’efficacia delle azioni di<br />
recupero del<strong>la</strong> marginalità intraprese e un migliore effetto price/mix. Nei primi nove mesi, il<br />
margine operativo è stato invece pari al 21,6% (19,7% nello stesso periodo del 2009).<br />
Divisione retail<br />
Nel corso del trimestre <strong>la</strong> divisione ha registrato un buon progresso, trainata dai positivi <strong>risultati</strong><br />
di LensCrafters e di Sung<strong>la</strong>ss Hut. In partico<strong>la</strong>re, le vendite omogenee 4 di LensCrafters, cresciute<br />
dell’8,4% grazie al<strong>la</strong> determinazione di tutta l’organizzazione, hanno beneficiato del buon<br />
andamento delle vendite nel segmento “sole”, anche in termini di lenti graduate da sole, e <strong>dei</strong><br />
positivi <strong>risultati</strong> delle vendite nel periodo di riapertura delle scuole.<br />
Molto positivi i <strong>risultati</strong>, anche in termini di marginalità, di Sung<strong>la</strong>ss Hut, che ha registrato<br />
vendite omogenee 4 complessive in progresso del 9,6%, con un andamento positivo in partico<strong>la</strong>re<br />
negli Stati Uniti (+12,5%), grazie soprattutto all’efficacia delle nuove iniziative di marketing, a<br />
una ulteriormente migliorata gestione del portafoglio e al successo delle vendite di prodotti con<br />
lenti po<strong>la</strong>rizzate.<br />
Negativo, invece, l’andamento delle vendite omogenee in Australia, dove lo scenario del settore<br />
retail continua a essere difficile. Il Gruppo sta in ogni caso reagendo con nuove iniziative volte<br />
ad attirare i consumatori nei propri negozi e a migliorare ulteriormente <strong>la</strong> loro esperienza di<br />
acquisto: i primi segnali del quarto trimestre sono positivi.<br />
3
Il fatturato netto del<strong>la</strong> divisione Retail è quindi passato a 946,5 milioni di euro da 793,8 milioni<br />
del terzo trimestre 2009 (+19,2% a cambi correnti, +6,5% a parità di cambi 2 ). Nei nove mesi, il<br />
fatturato si è quindi attestato a 2.728,6 milioni di euro, in <strong>crescita</strong> del 12,3% rispetto ai 2.430,8<br />
milioni <strong>dei</strong> primi nove mesi del 2009 (+5,9 a parità di cambi 2 ).<br />
Il risultato operativo del<strong>la</strong> divisione è cresciuto a 129,3 milioni di euro (113,9 milioni nel terzo<br />
trimestre del 2009, +13,5%); il margine operativo è quindi passato dal 14,3% al 13,7%. Nei nove<br />
mesi, il margine operativo è stato invece pari al 13,0% (12,8% nei primi nove mesi del 2009).<br />
§<br />
Il Consiglio di Amministrazione ha inoltre deliberato le modifiche allo Statuto sociale al fine di<br />
adeguarlo alle novità introdotte dal Decreto Legis<strong>la</strong>tivo n. 27/2010 che ha recepito<br />
nell’ordinamento italiano <strong>la</strong> Direttiva 2007/36/CE in materia di diritti degli azionisti.<br />
Il Consiglio di Amministrazione, in linea con quanto previsto dal Rego<strong>la</strong>mento Consob<br />
n.17221/2010, ha infine approvato, con il parere favorevole del Comitato di Controllo Interno<br />
costituito esclusivamente da amministratori indipendenti, <strong>la</strong> nuova procedura in materia di<br />
operazioni con parti corre<strong>la</strong>te.<br />
§<br />
I <strong>risultati</strong> del terzo trimestre del 2010 saranno illustrati oggi a partire dalle ore 18:00 (CET) nel<br />
corso di una conference call con <strong>la</strong> comunità finanziaria. La presentazione sarà disponibile in<br />
web cast in diretta sul sito Internet www.luxottica.com.<br />
Il Dirigente Preposto al<strong>la</strong> redazione <strong>dei</strong> documenti contabili societari Enrico Cavatorta dichiara ai sensi<br />
del comma 2 articolo 154 bis del Testo Unico del<strong>la</strong> Finanza che l’informativa contabile contenuta nel<br />
presente comunicato corrisponde alle risultanze documentali, ai libri e alle scritture contabili.<br />
Contatti<br />
Ivan Dompé<br />
Group Corporate Communications Director<br />
Tel.: +39 (02) 8633 4726<br />
Email: ivan.dompe@luxottica.com<br />
Alessandra Senici<br />
Group Investor Re<strong>la</strong>tions Director<br />
Tel.: +39 (02) 8633 4038<br />
Email: InvestorRe<strong>la</strong>tions@<strong>Luxottica</strong>.com<br />
Luca Biondolillo<br />
Group Director of International Communications<br />
Tel.: +39 (02) 8633 4668<br />
Email: LucaBiondolillo@<strong>Luxottica</strong>.com<br />
www.luxottica.com<br />
1 Tutti i confronti, incluse le variazioni percentuali, si riferiscono ai tre e nove mesi terminati il 30 settembre 2010 e il 30 settembre<br />
2009, secondo i principi contabili IAS/IFRS.<br />
2 I dati a parità cambi sono calco<strong>la</strong>ti utilizzando il cambio medio del rispettivo periodo di confronto. Per ulteriori informazioni si<br />
rimanda alle tabelle allegate.<br />
3 EBITDA, free cash flow, indebitamento netto e rapporto indebitamento netto / EBITDA sono indicatori non previsti dagli IAS/IFRS.<br />
Per ulteriori informazioni re<strong>la</strong>tivi a tali indicatori si rimanda alle tabelle allegate.<br />
4 Per vendite omogenee si intendono le vendite a parità di negozi, cambi e perimetro di consolidamento.<br />
<strong>Luxottica</strong> Group S.p.A.<br />
<strong>Luxottica</strong> Group è leader nel settore degli occhiali di fascia alta, di lusso e sportivi, con oltre<br />
6.300 negozi operanti sia nel segmento vista che sole in Nord America, Asia-Pacifico, Cina,<br />
4
Sudafrica, Europa e un portafoglio marchi <strong>forte</strong> e ben bi<strong>la</strong>nciato. Tra i marchi propri figurano<br />
Ray-Ban, il marchio di occhiali da sole più conosciuto al mondo, Oakley, Vogue, Persol, Oliver<br />
Peoples, Arnette e REVO mentre i marchi in licenza includono Bvlgari, Burberry, Chanel, Dolce<br />
& Gabbana, Donna Karan, Polo Ralph Lauren, Prada, Salvatore Ferragamo, Tiffany e Versace.<br />
Oltre a un network wholesale globale che tocca 130 Paesi, il Gruppo gestisce nei mercati<br />
principali alcune catene leader nel retail tra le quali LensCrafters, Pearle Vision e ILORI in Nord<br />
America, OPSM e Laubman & Pank in Asia-Pacifico, LensCrafters in Cina e Sung<strong>la</strong>ss Hut in tutto il<br />
mondo. I prodotti del Gruppo sono progettati e realizzati in sei impianti produttivi in Italia, in<br />
due, interamente control<strong>la</strong>ti, nel<strong>la</strong> Repubblica Popo<strong>la</strong>re Cinese e in uno negli Stati Uniti,<br />
dedicato al<strong>la</strong> produzione di occhiali sportivi. Nel 2009, <strong>Luxottica</strong> Group ha registrato vendite<br />
nette pari a €5.1 miliardi. Ulteriori informazioni sul Gruppo sono disponibili su<br />
www.luxottica.com.<br />
Safe Harbor Statement<br />
Talune dichiarazioni contenute in questo comunicato stampa potrebbero costituire previsioni<br />
("forward looking statements") così come definite dal Private Securities Litigation Reform Act<br />
del 1995. Tali dichiarazioni riguardano rischi, incertezze e altri fattori che potrebbero portare i<br />
<strong>risultati</strong> effettivi a differire, anche in modo sostanziale, da quelli anticipati. Tra tali rischi ed<br />
incertezze rientrano, a titolo meramente esemplificativo e non esaustivo, <strong>la</strong> capacità di gestire<br />
gli effetti dell’attuale incerta congiuntura economica internazionale, <strong>la</strong> capacità di acquisire<br />
nuove attività e di integrarle efficacemente, <strong>la</strong> capacità di prevedere le future condizioni<br />
economiche e cambi nelle preferenze <strong>dei</strong> consumatori, <strong>la</strong> capacità di introdurre e<br />
commercializzare con successo nuovi prodotti, <strong>la</strong> capacità di mantenere un sistema distributivo<br />
efficiente, <strong>la</strong> capacità di raggiungere e gestire <strong>la</strong> <strong>crescita</strong>, <strong>la</strong> capacità di negoziare e mantenere<br />
accordi di licenza favorevoli, <strong>la</strong> disponibilità di strumenti correttivi alternativi agli occhiali da<br />
vista, fluttuazioni valutarie, variazioni nelle condizioni locali, <strong>la</strong> capacità di proteggere <strong>la</strong><br />
proprietà intellettuale, <strong>la</strong> capacità di mantenere le re<strong>la</strong>zioni con chi ospita nostri negozi,<br />
problemi <strong>dei</strong> sistemi informativi, rischi legati agli inventari, rischi di credito e assicurativi,<br />
cambiamenti nei regimi fiscali, così come altri fattori politici, economici e tecnologici e altri<br />
rischi e incertezze già evidenziati nei nostri filing presso <strong>la</strong> Securities and Exchange Commission.<br />
Tali previsioni ("forward looking statements") sono state ri<strong>la</strong>sciate al<strong>la</strong> data di oggi e non ci<br />
assumiamo alcun obbligo di aggiornamento.<br />
- SEGUONO LE TABELLE –<br />
5
LUXOTTICA GROUP<br />
CONSOLIDATED FINANCIAL HIGHLIGHTS<br />
FOR THE THREE-MONTH PERIODS ENDED<br />
SEPTEMBER 30, 2010 AND SEPTEMBER 30, 2009<br />
In accordance with IAS/IFRS<br />
KEY FIGURES IN THOUSANDS OF EURO (1) 2010 2009 % Change<br />
NET SALES 1,464,732 1,223,272 19.7%<br />
NET INCOME 101,934 75,784 34.5%<br />
BASIC EARNINGS PER SHARE (ADS) (2) : 0.22 0.17 34.1%<br />
KEY FIGURES IN THOUSANDS OF U.S. DOLLARS (1) (3) 2010 2009 % Change<br />
NET SALES 1,890,969 1,749,646 8.1%<br />
NET INCOME 131,597 108,394 21.4%<br />
BASIC EARNINGS PER SHARE (ADS) (2) : 0.29 0.24 21.1%<br />
Notes : 2010 2009<br />
(1) Except earnings per share (ADS), which are expressed in Euro and U.S. Dol<strong>la</strong>rs, respectively<br />
(2) Weighted average number of outstanding shares 458,527,966 457,214,454<br />
(3) Average exchange rate (in U.S. Dol<strong>la</strong>rs per Euro) 1.2910 1.4303<br />
<strong>Luxottica</strong> Group 3Q10, Table 1 of 6
LUXOTTICA GROUP<br />
CONSOLIDATED FINANCIAL HIGHLIGHTS<br />
FOR THE NINE-MONTH PERIODS ENDED<br />
SEPTEMBER 30, 2010 AND SEPTEMBER 30, 2009<br />
In accordance with IAS/IFRS<br />
KEY FIGURES IN THOUSANDS OF EURO (1) 2010 2009 % Change<br />
NET SALES 4,451,542 3,937,233 13.1%<br />
NET INCOME 347,077 269,869 28.6%<br />
BASIC EARNINGS PER SHARE (ADS) (2) 0.76 0.59 28.2%<br />
KEY FIGURES IN THOUSANDS OF U.S. DOLLARS (1) (3) 2010 2009 % Change<br />
NET SALES 5,851,552 5,379,048 8.8%<br />
NET INCOME 456,233 368,695 23.7%<br />
BASIC EARNINGS PER SHARE (ADS) (2) 0.99 0.81 23.4%<br />
Notes : 2010 2009<br />
(1) Except earnings per share (ADS), which are expressed in Euro and U.S. Dol<strong>la</strong>rs, respectively<br />
(2) Weighted average number of outstanding shares 458,544,153 457,108,193<br />
(3) Average exchange rate (in U.S. Dol<strong>la</strong>rs per Euro) 1.3145 1.3662<br />
<strong>Luxottica</strong> Group 3Q10, Table 2 of 6
LUXOTTICA GROUP<br />
CONSOLIDATED INCOME STATEMENT<br />
FOR THE THREE-MONTH PERIODS ENDED<br />
SEPTEMBER 30, 2010 AND SEPTEMBER 30, 2009<br />
In accordance with IAS/IFRS<br />
In thousands of Euro (1) 3Q 10 % of sales 3Q 09 % of sales % Change<br />
NET SALES 1,464,732 100.0% 1,223,272 100.0% 19.7%<br />
COST OF SALES (499,849) (420,784)<br />
GROSS PROFIT 964,883 65.9% 802,488 65.6% 20.2%<br />
OPERATING EXPENSES:<br />
SELLING EXPENSES (490,264) (412,049)<br />
ROYALTIES (22,012) (20,342)<br />
ADVERTISING EXPENSES (89,967) (73,246)<br />
GENERAL AND ADMINISTRATIVE EXPENSES (154,907) (137,217)<br />
TRADEMARK AMORTIZATION (21,297) (20,072)<br />
TOTAL (778,447) (662,925)<br />
OPERATING INCOME 186,436 12.7% 139,563 11.4% 33.6%<br />
OTHER INCOME (EXPENSE):<br />
INTEREST EXPENSES (26,929) (29,663)<br />
INTEREST INCOME 2,543 954<br />
OTHER - NET (1,120) 2,087<br />
OTHER INCOME (EXPENSES)-NET (25,507) (26,621)<br />
INCOME BEFORE PROVISION FOR<br />
INCOME TAXES 160,929 11.0% 112,941 9.2% 42.5%<br />
PROVISION FOR INCOME TAXES (58,229) (36,142)<br />
NET INCOME 102,700 76,800<br />
LESS: NET INCOME ATTRIBUTABLE TO NONCONTROLLING<br />
INTEREST (766) (1,016)<br />
NET INCOME ATTRIBUTABLE TO<br />
LUXOTTICA GROUP SHAREHOLDERS 101,934 7.0% 75,784 6.2% 34.5%<br />
BASIC EARNINGS PER SHARE (ADS): 0.22 0.17<br />
FULLY DILUTED EARNINGS PER SHARE (ADS): 0.22 0.17<br />
WEIGHTED AVERAGE NUMBER OF<br />
OUTSTANDING SHARES 458,527,966 457,214,454<br />
FULLY DILUTED AVERAGE NUMBER OF SHARES 460,152,396 458,303,432<br />
Notes :<br />
(1) Except earnings per share (ADS), which are expressed in Euro<br />
(2) Certain figures from 2008 have been rec<strong>la</strong>ssified to conform to the 2009 presentation<br />
<strong>Luxottica</strong> Group 3Q10, Table 3 of 6
LUXOTTICA GROUP<br />
CONSOLIDATED INCOME STATEMENT<br />
FOR THE NINE-MONTH PERIODS ENDED<br />
SEPTEMBER 30, 2010 AND SEPTEMBER 30, 2009<br />
In accordance with IAS/IFRS<br />
In thousands of Euro (1) 2010 % of sales 2009 % of sales % Change<br />
NET SALES 4,451,542 100.0% 3,937,233 100.0% 13.1%<br />
COST OF SALES (1,529,395) (1,352,480)<br />
GROSS PROFIT 2,922,148 65.6% 2,584,752 65.6% 13.1%<br />
OPERATING EXPENSES:<br />
SELLING EXPENSES (1,427,794) (1,281,290)<br />
ROYALTIES (74,512) (74,509)<br />
ADVERTISING EXPENSES (286,455) (245,410)<br />
GENERAL AND ADMINISTRATIVE EXPENSES (454,547) (425,227)<br />
TRADEMARK AMORTIZATION (62,829) (61,266)<br />
TOTAL (2,306,136) (2,087,703)<br />
OPERATING INCOME 616,012 13.8% 497,049 12.6% 23.9%<br />
OTHER INCOME (EXPENSE):<br />
INTEREST EXPENSES (78,500) (79,307)<br />
INTEREST INCOME 5,824 4,322<br />
OTHER - NET (5,872) (1,905)<br />
OTHER INCOME (EXPENSES)-NET (78,548) (76,890)<br />
INCOME BEFORE PROVISION FOR<br />
INCOME TAXES 537,464 12.1% 420,159 10.7% 27.9%<br />
PROVISION FOR INCOME TAXES (186,202) (145,308)<br />
NET INCOME 351,262 274,852<br />
LESS: NET INCOME ATTRIBUTABLE TO NONCONTROLLING<br />
INTEREST (4,185) (4,983)<br />
NET INCOME ATTRIBUTABLE TO<br />
LUXOTTICA GROUP SHAREHOLDERS 347,077 7.8% 269,869 6.9% 28.6%<br />
BASIC EARNINGS PER SHARE (ADS): 0.76 0.59<br />
FULLY DILUTED EARNINGS PER SHARE (ADS): 0.75 0.59<br />
WEIGHTED AVERAGE NUMBER OF<br />
OUTSTANDING SHARES 458,544,153 457,108,193<br />
FULLY DILUTED AVERAGE NUMBER OF SHARES 460,249,173 457,661,787<br />
Notes :<br />
(1) Except earnings per share (ADS), which are expressed in Euro<br />
(2) certain amounts of 2009 have been rec<strong>la</strong>ssified to conform to 2010 presentation<br />
<strong>Luxottica</strong> Group 3Q10, Table 4 of 6
LUXOTTICA GROUP<br />
CONSOLIDATED BALANCE SHEET<br />
AS OF SEPTEMBER 30, 2010 AND DECEMBER 31, 2009<br />
In accordance with IAS/IFRS<br />
In thousands of Euro September 30, 2010 December 31, 2009<br />
CURRENT ASSETS:<br />
CASH AND CASH EQUIVALENTS 482,943 380,081<br />
MARKETABLE SECURITIES 25,330<br />
ACCOUNTS RECEIVABLE - NET 665,332 618,884<br />
SALES AND INCOME TAXES RECEIVABLE 24,512 59,516<br />
INVENTORIES - NET 562,047 524,663<br />
PREPAID EXPENSES AND OTHER 143,404 138,849<br />
DEFERRED TAX ASSETS - CURRENT<br />
TOTAL CURRENT ASSETS 1,903,577 1,721,993<br />
PROPERTY, PLANT AND EQUIPMENT - NET 1,167,933 1,149,972<br />
OTHER ASSETS<br />
INTANGIBLE ASSETS - NET 3,992,926 3,838,715<br />
INVESTMENTS 51,454 46,317<br />
OTHER ASSETS 147,893 146,626<br />
SALES AND INCOME TAXES RECEIVABLE 1,191 965<br />
DEFERRED TAX ASSETS - NON-CURRENT 380,304 356,706<br />
TOTAL OTHER ASSETS 4,573,768 4,389,329<br />
TOTAL 7,645,278 7,261,294<br />
CURRENT LIABILITIES:<br />
BANK OVERDRAFTS 221,956 148,951<br />
CURRENT PORTION OF LONG-TERM DEBT 135,142 166,279<br />
ACCOUNTS PAYABLE 415,576 434,604<br />
ACCRUED EXPENSES AND OTHER 483,752 526,801<br />
ACCRUAL FOR CUSTOMERS' RIGHT OF RETURN 31,335 27,334<br />
INCOME TAXES PAYABLE 88,044 11,204<br />
TOTAL CURRENT LIABILITIES 1,375,805 1,315,174<br />
LONG-TERM LIABILITIES:<br />
LONG-TERM DEBT 2,394,627 2,401,796<br />
LIABILITY FOR TERMINATION INDEMNITIES 42,755 44,633<br />
DEFERRED TAX LIABILITIES - NON-CURRENT 403,224 396,048<br />
OTHER LONG-TERM LIABILITIES 315,495 350,028<br />
TOTAL LIABILITIES 4,531,905 4,507,679<br />
EQUITY:<br />
465,222,483 ORDINARY SHARES AUTHORIZED AND ISSUED - 458,768,198 SHARES<br />
OUTSTANDING 27,913 27,863<br />
NET INCOME ATTRIBUTABLE TO LUXOTTICA GROUP SHAREHOLDERS 347,077 299,122<br />
RETAINED EARNINGS 2,726,292 2,410,253<br />
TOTAL LUXOTTICA GROUP SHAREHOLDERS' EQUITY 3,101,281 2,737,239<br />
NONCONTROLLING INTEREST 12,091 16,376<br />
TOTAL EQUITY 3,113,373 2,753,615<br />
TOTAL 7,645,278 7,261,294<br />
<strong>Luxottica</strong> Group 3Q10, Table 5 of 6
LUXOTTICA GROUP<br />
CONSOLIDATED FINANCIAL HIGHLIGHTS<br />
FOR THE NINE-MONTH PERIODS ENDED<br />
SEPTEMBER 30, 2010 AND SEPTEMBER 30, 2009<br />
- SEGMENTAL INFORMATION -<br />
In accordance with IAS/IFRS<br />
In thousands of Euro<br />
2010<br />
Manufacturing<br />
and<br />
Wholesale<br />
Retail<br />
Inter-Segment<br />
Transactions and<br />
Corporate Adj.<br />
Consolidated<br />
Net Sales 1,722,947 2,728,595 4,451,542<br />
Operating Income 372,235 353,877 (110,101) 616,012<br />
% of sales 21.6% 13.0% 13.8%<br />
Capital Expenditures 59,556 79,709 139,264<br />
Depreciation & Amortization 58,297 104,317 62,829 225,442<br />
2009<br />
Net Sales 1,506,468 2,430,764 3,937,233<br />
Operating income 296,069 310,707 (109,726) 497,049<br />
% of sales 19.7% 12.8% 12.6%<br />
Capital Expenditures 52,490 78,578 131,068<br />
Depreciation & Amortization 55,915 97,031 61,266 214,212<br />
<strong>Luxottica</strong> Group 3Q10, Table 6 of 6
Major currencies<br />
Average exchange rates<br />
per € 1<br />
Three months ended Nine Months ended Twelve months ended Three months ended Nine months ended<br />
September 30, 2009 September 30, 2009 December 31, 2009 September 30, 2010 September 30, 2010<br />
US$ 1.43030 1.36618 1.39467 1.29104 1.31453<br />
AUD 1.71689 1.82338 1.77281 1.42885 1.46555<br />
GBP 0.87161 0.88633 0.89104 0.83305 0.85730<br />
CNY 9.77019 9.33414 9.52693 8.73875 8.94742<br />
JPY 133.81712 129.50037 130.31404 110.67500 117.66057
Non-IAS/IFRS Measure: EBITDA and EBITDA margin<br />
<br />
EBITDA represents net income before non-controlling interest, taxes, other income/expense, depreciation and amortization. EBITDA margin means EBITDA divided by net sales.<br />
The Company believes that EBITDA is useful to both management and investors in evaluating the Company’s operating performance compared with that of other companies in its industry.<br />
Our calcu<strong>la</strong>tion of EBITDA allows us to compare our operating results with those of other companies without giving effect to financing, income taxes<br />
and the accounting effects of capital spending, which items may vary for different companies for reasons unre<strong>la</strong>ted to the overall operating performance of a company’s business.<br />
<br />
EBITDA and EBITDA margin are not measures of performance under International Financial Reporting Standards as issued by the International Accounting Standards Board (IAS/IFRS).<br />
We include them in this presentation in order to:<br />
* improve transparency for investors;<br />
* assist investors in their assessment of the Company’s operating performance and its ability to refinance its debt as it matures and incur additional indebtedness to invest in new business opportunities;<br />
* assist investors in their assessment of the Company’s cost of debt;<br />
* ensure that these measures are fully understood in light of how the Company evaluates its operating results and leverage;<br />
* properly define the metrics used and confirm their calcu<strong>la</strong>tion; and<br />
* share these measures with all investors at the same time.<br />
EBITDA and EBITDA margin are not meant to be considered in iso<strong>la</strong>tion or as a substitute for items appearing on our financial statements prepared in accordance with IAS/IFRS.<br />
Rather, these non-IAS/IFRS measures should be used as a supplement to IAS/IFRS results to assist the reader in better understanding the operational performance of the Company.<br />
The Company cautions that these measures are not defined terms under IAS/IFRS and their definitions should be carefully reviewed and understood by investors.<br />
Investors should be aware that <strong>Luxottica</strong> Group’s method of calcu<strong>la</strong>ting EBITDA may differ from methods used by other companies. The Company recognizes that the usefulness of EBITDA has certain limitations, including:<br />
* EBITDA does not include interest expense. Because we have borrowed money in order to finance our operations, interest expense is a necessary element of our costs and ability to generate profits and cash flows.<br />
Therefore, any measure that excludes interest expense may have material limitations;<br />
* EBITDA does not include depreciation and amortization expense. Because we use capital assets, depreciation and amortization expense is a necessary element of our costs and ability to generate profits.<br />
Therefore, any measure that excludes depreciation and expense may have material limitations;<br />
* EBITDA does not include provision for income taxes. Because the payment of income taxes is a necessary element of our costs, any measure that excludes tax expense may have material limitations;<br />
* EBITDA does not reflect cash expenditures or future requirements for capital expenditures or contractual commitments;<br />
* EBITDA does not reflect changes in, or cash requirements for, working capital needs;<br />
* EBITDA does not allow us to analyze the effect of certain recurring and non-recurring items that materially affect our net income or loss.<br />
<br />
<br />
We compensate for the foregoing limitations by using EBITDA as a comparative tool, together with IAS/IFRS measurements, to assist in the evaluation of our operating performance and leverage.<br />
See the tables on the following pages for a reconciliation of EBITDA to net income, which is the most directly comparable IAS/IFRS financial measure, as well as the calcu<strong>la</strong>tion of EBITDA margin on net sales.
Non-IAS/IFRS Measure: EBITDA and EBITDA margin<br />
Millions of Euro<br />
3Q 2010 3Q 2009 9M 2010 9M 2009 FY09<br />
LTM September<br />
30, 2010<br />
Net income/(loss) 101.9 75.8 347.1 269.9 299.1 376.3<br />
(+)<br />
Net income attributable to non-controlling interest 0.8 1.0 4.2 5.0 5.8 5.0<br />
(+)<br />
Provision for income taxes 58.2 36.1 186.2 145.3 159.9 200.8<br />
(+)<br />
Other (income)/expense 25.5 26.6 78.5 76.9 106.3 108.0<br />
(+)<br />
Depreciation & amortization 77.0 70.2 225.4 214.2 285.4 296.7<br />
(+)<br />
EBITDA 263.5 209.8 841.5 711.3 856.5 986.7<br />
(=)<br />
Net sales 1,464.7 1,223.3 4,451.5 3,937.2 5,094.3 5,608.6<br />
(/)<br />
EBITDA margin 18.0% 17.1% 18.9% 18.1% 16.8% 17.6%<br />
(=)
Non-IAS/IFRS Measure: Net Debt to EBITDA ratio<br />
Net debt to EBITDA ratio: Net debt means the sum of bank overdrafts, current portion of long-term debt and long-term debt, less cash. EBITDA represents net income before non-controlling interest, taxes, other income/expense, depreciation and amortization.<br />
The Company believes that EBITDA is useful to both management and investors in evaluating the Company’s operating performance compared with that of other companies in its industry.<br />
Our calcu<strong>la</strong>tion of EBITDA allows us to compare our operating results with those of other companies without giving effect to financing, income taxes and the accounting effects of capital spending,<br />
which items may vary for different companies for reasons unre<strong>la</strong>ted to the overall operating performance of a company’s business. The ratio of net debt to EBITDA is a measure used by management to assess<br />
the Company’s level of leverage, which affects our ability to refinance our debt as it matures and incur additional indebtedness to invest in new business opportunities.<br />
The ratio also allows management to assess the cost of existing debt since it affects the interest rates charged by the Company’s lenders.<br />
EBITDA and ratio of net debt to EBITDA are not measures of performance under International Financial Reporting Standards as issued by the International Accounting Standards Board (IAS/IFRS).<br />
We include them in this presentation in order to:<br />
* improve transparency for investors;<br />
* assist investors in their assessment of the Company’s operating performance and its ability to refinance its debt as it matures and incur additional indebtedness to invest in new business opportunities;<br />
* assist investors in their assessment of the Company’s cost of debt;<br />
* ensure that these measures are fully understood in light of how the Company evaluates its operating results and leverage;<br />
* properly define the metrics used and confirm their calcu<strong>la</strong>tion; and<br />
* share these measures with all investors at the same time.<br />
EBITDA and ratio of net debt to EBITDA are not meant to be considered in iso<strong>la</strong>tion or as a substitute for items appearing on our financial statements prepared in accordance with IAS/IFRS.<br />
Rather, these non-IAS/IFRS measures should be used as a supplement to IAS/IFRS results to assist the reader in better understanding the operational performance of the Company.<br />
The Company cautions that these measures are not defined terms under IAS/IFRS and their definitions should be carefully reviewed and understood by investors.<br />
Investors should be aware that <strong>Luxottica</strong> Group’s method of calcu<strong>la</strong>ting EBITDA and the ratio of net debt to EBITDA may differ from methods used by other companies.<br />
The Company recognizes that the usefulness of EBITDA and the ratio of net debt to EBITDA as evaluative tools may have certain limitations, including:<br />
* EBITDA does not include interest expense. Because we have borrowed money in order to finance our operations, interest expense is a necessary element of our costs and ability to generate profits and cash flows.<br />
Therefore, any measure that excludes interest expense may have material limitations;<br />
* EBITDA does not include depreciation and amortization expense. Because we use capital assets, depreciation and amortization expense is a necessary element of our costs and ability to generate profits.<br />
Therefore, any measure that excludes depreciation and expense may have material limitations;<br />
* EBITDA does not include provision for income taxes. Because the payment of income taxes is a necessary element of our costs, any measure that excludes tax expense may have material limitations;<br />
* EBITDA does not reflect cash expenditures or future requirements for capital expenditures or contractual commitments;<br />
* EBITDA does not reflect changes in, or cash requirements for, working capital needs;<br />
* EBITDA does not allow us to analyze the effect of certain recurring and non-recurring items that materially affect our net income or loss; and<br />
* The ratio of net debt to EBITDA is net of cash and cash equivalents, restricted cash and short-term investments, thereby reducing our debt position.<br />
Because we may not be able to use our cash to reduce our debt on a dol<strong>la</strong>r-for-dol<strong>la</strong>r basis, this measure may have material limitations.<br />
We compensate for the foregoing limitations by using EBITDA and the ratio of net debt to EBITDA as two of several comparative tools, together with IAS/IFRS measurements, to assist in the evaluation of our operating performance and leverage.<br />
See the tables on the following pages for a reconciliation of net debt to long-term debt, which is the most directly comparable IAS/IFRS financial measure, as well as the calcu<strong>la</strong>tion of the ratio of net debt to EBITDA.<br />
For a reconciliation of EBITDA to net income, which is the most directly comparable IAS/IFRS financial measure, see the tables on the preceding pages.
Non-IAS/IFRS Measure: Net debt and Net debt / EBITDA<br />
Millions of Euro<br />
September 30, 2010 Dec 31, 2009<br />
Long-term debt 2,394.6 2,401.8<br />
(+)<br />
Current portion of long-term debt (+) 135.1 166.3<br />
(+)<br />
Bank overdrafts (+) 222.0 149.0<br />
Cash (-) (482.9) (380.1)<br />
Net debt (=) 2,268.8 2,336.9<br />
LTM EBITDA 986.7 856.5<br />
Net debt/LTM EBITDA 2.3x 2.7x<br />
Net debt @ avg. exchange rates (1) 2,274.7 2,381.7<br />
Net debt @ avg. exchange rates (1) /LTM EBITDA 2.3x 2.8x<br />
1. Net debt figures are calcu<strong>la</strong>ted using the average exchange rates used to calcu<strong>la</strong>te the EBITDA figures
Non-IAS/IFRS Measures: Free Cash Flow<br />
Free cash flow net represents net income before non-controlling interest, taxes, other income/espense,depreciation and amortization (i.e. EBITDA – see table on the earlier page) plus or minus the decrease/(increase)<br />
in working capital over the prior period, less capital expenditures, plus or minus interest income/(expense) and extraordinary items, minus taxes paid. The Company believes that free cash flow is useful to both management<br />
and investors in evaluating the Company’s operating performance compared with other companies in its industry. In particu<strong>la</strong>r, our calcu<strong>la</strong>tion of free cash flow provides a clearer picture of the<br />
Company’s ability to generate net cash from operations, which is used for mandatory debt service requirements, to fund discretionary investments, pay dividends or pursue other strategic opportunities.<br />
Free cash flow is not a measure of performance under International Financial Reporting Standards as issued by the International Accounting Standards Board (IAS/IFRS).<br />
We include it in this presentation in order to:<br />
* Improve transparency for investors;<br />
* Assist investors in their assessment of the Company’s operating performance and its ability to generate cash from operations in excess of its cash expenses;<br />
* Ensure that this measure is fully understood in light of how the Company evaluates its operating results;<br />
* Properly define the metrics used and confirm their calcu<strong>la</strong>tion; and<br />
* Share this measure with all investors at the same time.<br />
Free cash flow is not meant to be considered in iso<strong>la</strong>tion or as a substitute for items appearing on our financial statements prepared in accordance with IAS/IFRS.<br />
Rather, this non-IAS/IFRS measure should be used as a supplement to IAS/IFRS results to assist the reader in better understanding the operational performance of the Company.<br />
The Company cautions that this measure is not a defined term under IAS/IFRS and its definition should be carefully reviewed and understood by investors.<br />
Investors should be aware that <strong>Luxottica</strong> Group’s method of calcu<strong>la</strong>tion of free cash flow may differ from methods used by other companies.<br />
The Company recognizes that the usefulness of free cash flow as an evaluative tool may have certain limitations, including:<br />
• The manner in which the Company calcu<strong>la</strong>tes free cash flow may differ from that of other companies, which limits its usefulness as a comparative measure;<br />
• Free cash flow does not represent the total increase or decrease in the net debt ba<strong>la</strong>nce for the period since it excludes, among other things, cash<br />
used for funding discretionary investments and to pursue strategic opportunities during the period and any impact of the exchange rate changes; and<br />
• Free cash flow can be subject to adjustment at the Company’s discretion if the Company takes steps or adopts policies that increase or diminish its current liabilities and/or changes to working capital.<br />
We compensate for the foregoing limitations by using free cash flow as one of several comparative tools, together with IAS/IFRS measurements, to assist in the evaluation of our operating performance.<br />
See the table on the following page for a reconciliation of free cash flow to EBITDA and the table on the earlier page for a reconciliation of EBITDA to net income,<br />
which is the most directly comparable IAS/IFRS financial measure.
Non-IAS/IFRS Measure: Free cash flow<br />
Millions of Euro<br />
3Q 2010<br />
EBITDA (1) 263.5<br />
Δ working capital 90.7<br />
Capex (56.4)<br />
Operating cash flow 297.8<br />
Financial charges (2) (24.4)<br />
Taxes (20.1)<br />
Extraordinary charges (3) (1.1)<br />
Free cash flow 252.2<br />
1. EBITDA is not an IAS/IFRS measure; please see table on the earlier page for a reconciliation of EBITDA to net income<br />
2. Equals interest income minus interest expense<br />
3. Equals extraordinary income minus extraordinary expense