Dichiarazione ambientale della Centrale di Fiume Santo (5 Mb)
Dichiarazione ambientale della Centrale di Fiume Santo (5 Mb)
Dichiarazione ambientale della Centrale di Fiume Santo (5 Mb)

Create successful ePaper yourself
Turn your PDF publications into a flip-book with our unique Google optimized e-Paper software.
34<br />
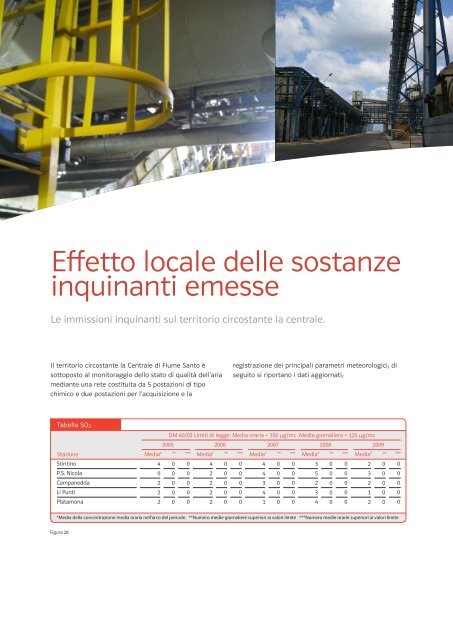
Effetto locale delle sostanze<br />
inquinanti emesse<br />
Le immissioni inquinanti sul territorio circostante la centrale.<br />
Il territorio circostante la <strong>Centrale</strong> <strong>di</strong> <strong>Fiume</strong> <strong>Santo</strong> è<br />
sottoposto al monitoraggio dello stato <strong>di</strong> qualità dell’aria<br />
me<strong>di</strong>ante una rete costituita da 5 postazioni <strong>di</strong> tipo<br />
chimico e due postazioni per l’acquisizione e la<br />
registrazione dei principali parametri meteorologici; <strong>di</strong><br />
seguito si riportano i dati aggiornati;<br />
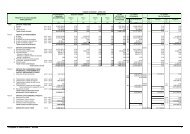
Tabella SO 2<br />
Stazione<br />
Stintino<br />
P.S. Nicola<br />
Campanedda<br />
Li Punti<br />
Platamona<br />
DM 60/02 Limiti <strong>di</strong> legge: Me<strong>di</strong>a oraria = 350 µg/mc Me<strong>di</strong>a giornaliera = 125 µg/mc<br />
2005<br />
2006<br />
Me<strong>di</strong>a* ** *** Me<strong>di</strong>a* ** ***<br />
4<br />
0<br />
2<br />
2<br />
2<br />
0<br />
0<br />
0<br />
0<br />
0<br />
0<br />
0<br />
0<br />
0<br />
0<br />
4<br />
2<br />
2<br />
2<br />
2<br />
0<br />
0<br />
0<br />
0<br />
0<br />
0<br />
0<br />
0<br />
0<br />
0<br />
2007<br />
Me<strong>di</strong>a* ** ***<br />
4<br />
4<br />
3<br />
4<br />
1<br />
0<br />
0<br />
0<br />
0<br />
0<br />
0<br />
0<br />
0<br />
0<br />
0<br />
2008<br />
Me<strong>di</strong>a* ** ***<br />
3<br />
5<br />
2<br />
3<br />
4<br />
0<br />
0<br />
0<br />
0<br />
0<br />
0<br />
0<br />
0<br />
0<br />
0<br />
2009<br />
Me<strong>di</strong>a* ** ***<br />
2<br />
3<br />
2<br />
1<br />
2<br />
0<br />
0<br />
0<br />
0<br />
0<br />
0<br />
0<br />
0<br />
0<br />
0<br />
*Me<strong>di</strong>a <strong>della</strong> concentrazione me<strong>di</strong>a oraria nell'arco del periodo **Numero me<strong>di</strong>e giornaliere superiori ai valori limite ***Numero me<strong>di</strong>e orarie superiori ai valori limite<br />
Figura 28