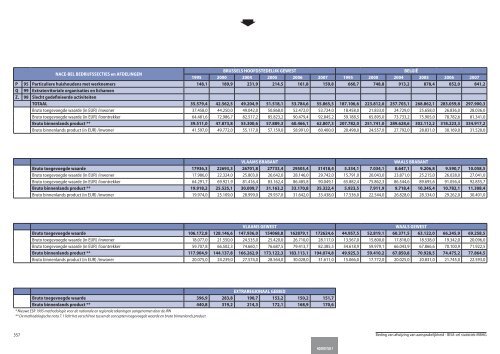
357 ➧ NACE-BEL BEDRIJFSSECTIES en AFDELINGEN 1995 BRUSSELS HOOFDSTEDELIJK GEWEST 2000 2004 2005 2006 2007 1995 2000 BELGIË 2004 2005 2006 2007 P 95 Particuliere huishoudens met werknemers 148,1 189,9 231,9 214,5 161,8 159,8 660,7 748,8 913,2 878,4 852,0 841,2 Q 99 Extraterritoriale organisaties en lichamen Z. 98 Slecht gedefinieerde activiteiten TOTAAL 35.579,4 42.562,5 49.204,9 51.518,1 53.784,6 55.865,5 187.106,6 223.812,0 257.703,1 268.862,1 283.059,8 297.900,3 Bruto toegevoegde waarde (in EUR) /inwoner 37.458,0 44.250,0 49.042,0 50.868,0 52.472,0 53.724,0 18.458,0 21.833,0 24.729,0 25.658,0 26.836,0 28.036,0 Bruto toegevoegde waarde (in EUR) /loontrekker 64.481,6 72.986,7 82.517,2 85.823,2 90.479,4 92.845,2 59.188,5 65.895,0 73.733,2 75.905,0 78.782,6 81.341,0 Bruto binnenlands product ** 39.511,0 47.873,8 55.300,6 57.889,3 60.466,1 62.807,3 207.782,0 251.741,0 289.628,6 302.112,2 318.223,3 334.917,2 Bruto binnenlands product (in EUR) /inwoner 41.597,0 49.772,0 55.117,0 57.159,0 58.991,0 60.400,0 20.498,0 24.557,0 27.792,0 28.831,0 30.169,0 31.520,0 VLAAMS BRABANT WAALS BRABANT Bruto toegevoegde waarde 17936,3 22693,3 26701,8 27733,4 29505,4 31418,4 5.334,1 7.034,1 8.647,1 9.206,8 9.590,7 10.058,5 Bruto toegevoegde waarde (in EUR) /inwoner 17.986,0 22.324,0 25.803,0 26.642,0 28.146,0 29.742,0 15.791,0 20.043,0 23.871,0 25.215,0 26.028,0 27.041,0 Bruto toegevoegde waarde (in EUR) /loontrekker 64.291,7 69.921,9 81.416,4 83.162,4 86.485,8 90.049,1 65.882,4 75.862,3 86.544,6 89.695,6 91.056,4 92.855,7 Bruto binnenlands product ** 19.918,2 25.525,1 30.009,7 31.163,2 33.170,8 35.322,4 5.923,5 7.911,9 9.718,4 10.345,4 10.782,1 11.308,4 Bruto binnenlands product (in EUR) /inwoner 19.974,0 25.109,0 28.999,0 29.937,0 31.642,0 33.438,0 17.536,0 22.544,0 26.828,0 28.334,0 29.262,0 30.401,0 VLAAMS GEWEST WAALS GEWEST Bruto toegevoegde waarde 106.172,8 128.146,6 147.936,0 154068,8 162879,1 172624,6 44.957,5 52.819,1 60.371,5 63.122,0 66.245,9 69.258,5 Bruto toegevoegde waarde (in EUR) /inwoner 18.077,0 21.550,0 24.535,0 25.420,0 26.710,0 28.117,0 13.567,0 15.800,0 17.818,0 18.538,0 19.342,0 20.096,0 Bruto toegevoegde waarde (in EUR) /loontrekker 59.707,8 66.502,3 74.660,1 76.687,5 79.413,7 82.385,5 54.618,9 59.979,1 66.043,9 67.866,6 70.100,9 71.922,5 Bruto binnenlands product ** 117.904,9 144.137,8 166.262,9 173.122,3 183.113,1 194.074,8 49.925,3 59.410,2 67.850,8 70.928,5 74.475,2 77.864,5 Bruto binnenlands product (in EUR) /inwoner 20.075,0 24.239,0 27.574,0 28.564,0 30.028,0 31.611,0 15.066,0 17.772,0 20.025,0 20.831,0 21.745,0 22.593,0 EXTRAREGIONAAL GEBIED Bruto toegevoegde waarde 396,9 283,8 190,7 153,2 150,2 151,7 Bruto binnenlands product ** 440,8 319,2 214,3 172,1 168,9 170,6 * Nieuwe ESR 1995 methodologie voor de nationale en regionale rekeningen aangenomen door de IRN ** De methodologische nota 7.1 licht het verschil toe tussen de concepten toegevoegde waarde en bruto binnenlands product HOOFDSTUK 7 Beding van afwijzing van aansprakelijkheid - <strong>BISA</strong>-cel statistiek-MBHG
358 TABEL 7.1b BRUTO TOEGEVOEGDE WAARDE tegen BASISPRIJZEN in VOLUME (referentiejaar 2006) naar NACE-BEL BEDRIJFSSECTIE en -SUBSECTIE : referentiejaren * NACE-BEL BEDRIJFSSECTIES en AFDELINGEN 1995 BRUSSELS HOOFDSTEDELIJK GEWEST 2000 2004 2005 2006 2007 1995 2000 BELGIË 2004 2005 2006 2007 1 Landbouw, jacht en aanverwante diensten 18,8 15,0 10,9 10,6 11,8 13,4 2.256,3 2.597,1 2.445,8 2.144,3 2.044,8 2.115,9 2 Bosbouw, bosexploitatie en aanverwante diensten 0,0 0,0 124,4 107,2 116,1 119,2 129,6 124,9 A Landbouw, jacht en bosbouw 18,9 15,0 11,0 10,5 11,8 13,3 2.380,8 2.704,3 2.564,0 2.262,9 2.174,4 2.240,8 B 5 Visserij 0,0 0,0 0,2 0,0 0,0 0,0 59,8 56,3 70,0 65,7 54,2 63,6 10 Winning van steenkool, bruinkool en turf 11 Winning van aardolie en aardgas en aanverwante diensten 13 Winning van metaalertsen 14 Overige winning van delfstoffen 8,8 6,7 7,9 8,7 14,1 13,4 345,5 332,5 297,6 319,3 351,9 369,6 C Winning van delfstoffen 8,8 6,7 7,9 8,7 14,1 13,4 345,5 332,5 297,6 319,3 351,9 369,6 15 Vervaardiging van voedingsmiddelen en dranken 457,4 373,7 371,9 371,0 346,9 358,6 5.407,1 5.345,1 5.716,1 5.755,4 5.851,1 6.275,9 16 Vervaardiging van tabaksproducten 158,6 82,9 62,2 98,7 90,1 95,1 486,4 272,9 242,8 238,9 224,3 200,5 17 Vervaardiging van textiel 11,8 13,3 8,3 7,4 10,4 9,5 1.346,5 1.698,3 1.437,7 1.357,3 1.485,4 1.663,9 18 Vervaardiging van kleding en bontnijverheid 111,1 147,3 105,4 115,8 103,1 86,5 610,4 489,0 416,2 385,9 352,3 294,0 19 Leernijverheid en vervaardiging van schoeisel 10,5 7,0 5,3 5,2 5,8 5,4 128,1 96,4 82,6 82,3 81,9 85,0 20 Houtindustrie en vervaardiging van artikelen van hout, kurk, riet en vlechtwerk 15,0 13,1 15,0 14,7 15,1 14,9 573,8 694,6 878,6 841,2 884,7 911,1 21 Papier- en kartonnijverheid 52,3 45,0 44,3 35,8 31,6 27,9 807,8 1.024,8 1.196,8 1.143,2 1.152,2 1.155,2 22 Uitgeverijen, drukkerijen en reproductie van opgenomen media 442,9 496,1 376,1 358,2 364,4 376,7 2.232,4 2.144,5 2.098,4 2.179,6 2.314,7 2.459,2 23 Vervaardiging van cokes, geraffineerde aardolieproducten en splijt- en kweekstoffen 532,7 356,2 326,3 450,0 459,2 600,9 3.332,9 1.747,0 1.321,0 1.754,4 1.871,1 2.400,0 24 Chemische nijverheid 453,2 499,5 449,1 475,2 436,3 452,7 6.683,0 8.852,7 9.577,4 9.425,6 9.822,9 9.111,2 25 Rubber- en kunststofnijverheid 25,7 23,0 28,6 28,5 32,8 35,2 1.282,9 1.475,4 1.740,0 1.870,2 1.943,3 2.149,6 26 Vervaardiging van overige niet-metaalhoudende minerale producten 145,1 113,1 80,9 79,3 83,0 80,6 2.545,0 2.399,3 2.479,8 2.430,4 2.435,5 2.422,2 27 Metallurgie 40,5 39,8 35,0 31,8 35,9 34,3 3.421,5 3.819,4 4.019,8 3.535,5 3.590,2 4.002,3 28 Vervaardiging van producten van metaal 191,2 174,0 177,4 169,6 166,1 174,3 2.737,7 3.516,3 3.735,0 3.614,2 3.682,1 3.932,4 29 Vervaardiging van machines, apparaten en werktuigen 182,8 150,3 232,3 285,9 263,8 286,1 2.268,4 3.017,8 2.906,4 3.033,2 3.258,8 3.593,4 30 Vervaardiging van kantoormachines en computers 8,4 4,9 1,2 1,2 1,2 1,5 93,6 71,3 75,5 78,3 83,0 77,5 31 Vervaardiging van elektrische machines en apparaten 157,4 151,0 130,9 153,0 129,1 138,3 1.389,6 1.699,1 1.630,2 1.651,5 1.687,9 1.650,6 32 Vervaardiging van audio-, video- en telecommunicatieapparatuur 36,2 22,9 48,8 43,8 45,5 46,6 761,4 1.740,8 1.198,3 1.121,2 1.058,3 911,2 33 Vervaardiging van medische apparatuur, van precisie- en optische instrumenten en van uurwerken 30,8 24,0 30,5 35,6 31,2 38,6 342,5 415,5 504,1 508,1 545,5 616,9 34 Vervaardiging en assemblage van auto's, aanhangwagens en opleggers 304,5 417,8 512,1 578,4 1.010,8 270,3 2.458,3 2.831,7 3.383,1 3.614,5 3.701,2 3.212,1 35 Vervaardiging van overige transportmiddelen 55,8 43,3 41,1 40,4 46,7 50,9 406,8 627,6 569,2 599,3 556,1 598,8 36 Vervaardiging van meubels; overige industrie 35,5 52,3 32,7 28,9 29,9 30,1 1.278,1 1.408,7 1.129,6 1.069,5 1.047,3 1.122,4 37 Recuperatie van recycleerbaar afval 3,5 7,8 16,3 20,2 11,2 12,2 114,3 179,5 396,8 387,3 346,9 379,0 D Industrie 3.162,6 3.285,1 3.670,9 3.891,3 4.257,3 3.630,3 40.347,1 45.416,4 52.486,0 52.559,0 54.465,0 55.866,0 ➧ Eenheid: miljoenen ketting EUR Bron: IRN Beding van afwijzing van aansprakelijkheid - <strong>BISA</strong>-cel statistiek-MBHG
- Page 1 and 2:
Ministerie van het Brussels Hoofdst
- Page 3 and 4:
Statistische indicatoren 2009 De in
- Page 5 and 6:
Statistische indicatoren 2009 4 De
- Page 7 and 8:
Statistische indicatoren 2009 CONVE
- Page 9 and 10:
Statistische indicatoren 2009 INLEI
- Page 11 and 12:
Statistische indicatoren 2009 2.2.
- Page 13 and 14:
Statistische indicatoren 2009 12 te
- Page 15 and 16:
Statistische indicatoren 2009 14 Be
- Page 17 and 18:
16 1.2 Loop van de bevolking Kernci
- Page 19 and 20:
18 1.1 Structuur van de bevolking T
- Page 21 and 22:
20 TABEL 1.1.1 extra TOTALE BEVOLKI
- Page 23 and 24:
22 TABEL 1.1.3 TOTALE BEVOLKING van
- Page 25 and 26:
24 TABEL 1.1.4 BELGISCHE BEVOLKING
- Page 27 and 28:
26 TABEL 1.1.5 VREEMDE BEVOLKING va
- Page 29 and 30:
28 TABEL 1.1.6 TOTALE, BELGISCHE en
- Page 31 and 32:
30 TABEL 1.1.7 GEMIDDELDE LEEFTIJD
- Page 33 and 34:
32 TABEL 1.1.8 VREEMDE BEVOLKING pe
- Page 35 and 36:
34 ➧ Europa Europese Unie Andere
- Page 37 and 38:
➧ 36 Marokko Algerije Tunesië A
- Page 39 and 40:
38 TABEL 1.1.9 VREEMDE BEVOLKING pe
- Page 41 and 42:
➧ 40 Marokko Algerije Tunesië A
- Page 43 and 44:
42 ➧ Rangorde Aantal Brussels Hoo
- Page 45 and 46:
44 TABEL 1.1.11 TOP 100 van de VOOR
- Page 47 and 48:
46 ➧ Rangorde Aantal Brussels Hoo
- Page 49 and 50:
48 TABEL 1.1.13 AANTAL PERSONEN ing
- Page 51 and 52:
50 TABEL 1.1.14 BEVOLKING in het WA
- Page 53 and 54:
➧ 52 Ex-USSR Andere landen Azië
- Page 55 and 56:
54 1.2 Loop van de bevolking TABEL
- Page 57 and 58:
56 TABEL 1.2.3 LOOP van de VREEMDE
- Page 59 and 60:
58 TABEL 1.2.5 LOOP van de TOTALE M
- Page 61 and 62:
60 TABEL 1.2.7 LOOP van de BELGISCH
- Page 63 and 64:
62 TABEL 1.2.9 LOOP van de BELGISCH
- Page 65 and 66:
64 TABEL 1.2.11 LOOP van de VREEMDE
- Page 67 and 68:
66 TABEL 1.2.13 BINNENLANDSE MIGRAT
- Page 69 and 70:
68 TABEL 1.2.14 BUITENLANDSE MIGRAT
- Page 71 and 72:
70 TABEL 1.2.15 MIGRATIES van de TO
- Page 73 and 74:
72 TABEL 1.2.17 MIGRATIES van de VR
- Page 75 and 76:
74 TABEL 1.2.19 MIGRATIES van de TO
- Page 77 and 78:
76 TABEL 1.2.21 BINNENGEWESTELIJKE
- Page 79 and 80:
➧ 78 Estland Letland Litouwen Pol
- Page 81 and 82:
80 TABEL 1.2.23 BUITENLANDSE EMIGRA
- Page 83 and 84:
➧ 82 Marokko Algerije Tunesië Co
- Page 85 and 86:
➧ 84 Estland Letland Litouwen Pol
- Page 87 and 88:
86 TABEL 1.2.25 MIGRATIESALDO van d
- Page 89 and 90:
88 TABEL 1.2.27 EXTERN MIGRATIESALD
- Page 91 and 92:
90 TABEL 1.2.29 LOOP van de BELGISC
- Page 93 and 94:
➧ 92 Marokko Algerije Tunesië VR
- Page 95 and 96:
94 TABEL 1.2.30 LOOP van de BELGISC
- Page 97 and 98:
96 TABEL 1.2.31 TOP 50 van de VOORN
- Page 99 and 100:
98 TABEL 1.2.32 (2007) TOP 50 van d
- Page 101 and 102:
100 TABEL 1.2.32 (2008) TOP 50 van
- Page 103 and 104:
102 TABEL 1.2.33 TOP 50 van de VOOR
- Page 105 and 106:
104 TABEL 1.2.34 (2007) TOP 50 van
- Page 107 and 108:
106 TABEL 1.2.34 (2008) TOP 50 van
- Page 109 and 110:
108 1.3 Huishoudens TABEL 1.3.1 AAN
- Page 111 and 112:
110 TABEL 1.3.3 AANTAL PRIVATE HUIS
- Page 113 and 114:
112 TABEL 1.3.5 AANTAL PRIVATE HUIS
- Page 115 and 116:
114 Beding van afwijzing van aanspr
- Page 117 and 118:
116 2.2.22 Verdeling van de niet-Be
- Page 119 and 120:
118 2.1.A Werkende beroepsbevolking
- Page 121 and 122:
120 TABEL 2.1.3 WERKENDE BEROEPSBEV
- Page 123 and 124:
122 TABEL 2.1.4 WERKENDE BEROEPSBEV
- Page 125 and 126:
124 TABEL 2.1.5 WERKENDE BEROEPSBEV
- Page 127 and 128:
126 2.2 Zelfstandigen TABEL 2.2.1 A
- Page 129 and 130:
128 ➧ BELGIE (exl. buitenland) BE
- Page 131 and 132:
130 ➧ BEDRIJFSTAKKEN 2005 WAALS G
- Page 133 and 134:
132 TABEL 2.2.3 AANTAL ZELFSTANDIGE
- Page 135 and 136:
134 ➧ 2006 BELGIE (excl, buitenla
- Page 137 and 138:
136 ➧ 2007 VLAAMS GEWEST AARD van
- Page 139 and 140:
138 TABEL 2.2.4 AANTAL ZELFSTANDIGE
- Page 141 and 142:
140 ➧ 2005 BRUSSELS HOOFDSTEDELIJ
- Page 143 and 144:
142 ➧ 2007 WAALS GEWEST AARD van
- Page 145 and 146:
144 ➧ 2007 Brussels Gewest Belgi
- Page 147 and 148:
146 TABEL 2.2.7 Aantal ZELFSTANDIGE
- Page 149 and 150:
148 ➧ 2007 BELGIE (inclusief buit
- Page 151 and 152:
150 ➧ 2007 WAALS GEWEST AARD van
- Page 153 and 154:
152 ➧ 2007 WAALS GEWEST AARD van
- Page 155 and 156:
154 ➧ 2007 BRUSSELS HOOFDSTEDELIJ
- Page 157 and 158:
156 ➧ 2007 VLAAMS GEWEST AARD van
- Page 159 and 160:
158 TABEL 2.2.10 AANTAL ZELFSTANDIG
- Page 161 and 162:
160 TABEL 2.2.11 AANTAL ZELFSTANDIG
- Page 163 and 164:
162 ➧ 2007 VLAAMS GEWEST AARD van
- Page 165 and 166:
164 TABEL 2.2.12 Aantal ZELFSTANDIG
- Page 167 and 168:
166 ➧ 2007 BELGIE (inclusief buit
- Page 169 and 170:
168 ➧ 2007 WAALS GEWEST AARD van
- Page 171 and 172:
170 ➧ 2007 VLAAMS GEWEST AARD van
- Page 173 and 174:
172 ➧ 2007 BELGIE ( inclusief bui
- Page 175 and 176:
174 ➧ 2007 WAALS GEWEST AARD van
- Page 177 and 178:
176 ➧ 2007 VLAAMS GEWEST AARD van
- Page 179 and 180:
178 ➧ 2007 VLAAMS GEWEST BEDRIJFS
- Page 181 and 182:
180 ➧ 2007 BELGIE (incl. buitenla
- Page 183 and 184:
182 ➧ 2007 WAALS GEWEST AARD van
- Page 185 and 186:
184 ➧ 2007 VLAAMS GEWEST BEDRIJFS
- Page 187 and 188:
186 2.3 Loontrekkenden en flexibili
- Page 189 and 190:
➧ 188 NACE-BEL SECTIES en AFDELIN
- Page 191 and 192:
190 TABEL 2.3.2 FLEXIBILITEIT van d
- Page 193 and 194:
192 ➧ Flexibiliteit type BRUSSELS
- Page 195 and 196:
194 Beding van afwijzing van aanspr
- Page 197 and 198:
196 3.3.b Onderzoek en Ontwikkeling
- Page 199 and 200:
198 TABEL 3.1 AANTAL VESTIGINGEN, W
- Page 201 and 202:
➧ 200 NACE-BEL SECTIES en AFDELIN
- Page 203 and 204:
202 TABEL 3.2 AANTAL VESTIGINGEN (p
- Page 205 and 206:
204 ➧ GROOTTEKLASSEN : VAN ... TO
- Page 207 and 208:
206 ➧ GROOTTEKLASSEN : VAN ... TO
- Page 209 and 210:
208 TABEL 3.3.a AANTAL WERKNEMERS o
- Page 211 and 212:
210 ➧ GROOTTEKLASSEN : VAN ... TO
- Page 213 and 214:
212 ➧ GROOTTEKLASSEN : VAN ... TO
- Page 215 and 216:
214 TABEL 3.3.b AANTAL WERKNEMERS o
- Page 217 and 218:
➧ 216 ➧ GROOTTEKLASSEN : VAN ..
- Page 219 and 220:
➧ 218 ➧ GROOTTEKLASSEN : VAN ..
- Page 221 and 222:
220 TABEL 3.3.c AANTAL WERKNEMERS o
- Page 223 and 224:
➧ 222 ➧ GROOTTEKLASSEN : VAN ..
- Page 225 and 226:
➧ 224 ➧ GROOTTEKLASSEN : VAN ..
- Page 227 and 228:
226 TABEL 3.4.a AANTAL VESTIGINGEN,
- Page 229 and 230:
228 ➧ BRUSSELS HOOFDSTEDELIJK GEW
- Page 231 and 232:
230 ➧ NACE-BEL SECTIES en AFDELIN
- Page 233 and 234:
➧ 232 NACE-BEL SECTIES en AFDELIN
- Page 235 and 236:
➧ 234 ➧ 2005 2006 2007 NACE-BEL
- Page 237 and 238:
236 ➧ BRUSSELS HOOFDSTEDELIJK GEW
- Page 239 and 240:
238 ➧ Sct Klas S. Klas NACE-BEL S
- Page 241 and 242:
240 ➧ Sct Klas S. Klas NACE-BEL S
- Page 243 and 244:
242 TABEL 3.5.d2 AANTAL WERKNEMERS
- Page 245 and 246:
244 ➧ BRUSSELS HOOFDSTEDELIJK GEW
- Page 247 and 248:
➧ 246 GEMEENTEN K Onroer. goed.,h
- Page 249 and 250:
248 TABEL 3.6.c AANTAL PRIVATE en O
- Page 251 and 252:
250 ➧ GEMEENTEN ZKO 1 - 9 KO 10 -
- Page 253 and 254:
➧ 252 GROOTTEKLASSEN : VAN ... TO
- Page 255 and 256:
➧ 254 GROOTTEKLASSEN : VAN ... TO
- Page 257 and 258:
➧ 256 TYPOLOGIE VAN ONDERNEMINGEN
- Page 259 and 260:
258 ➧ K L M AANTAL WERKNEMERS N O
- Page 261 and 262:
260 TABEL 3.8 AANTAL VESTIGINGEN en
- Page 263 and 264:
262 TABEL 3.10 AANTAL WERKNEMERS en
- Page 265 and 266:
264 ➧ BRUSSELSE ADMINISTRATIES re
- Page 267 and 268:
266 ➧ BRUSSELSE ADMINISTRATIES re
- Page 269 and 270:
268 TABEL 4.1.1 UITKERINGSGERECHTIG
- Page 271 and 272:
270 TABEL 4.1.3 NIET-WERKENDE WERKZ
- Page 273 and 274:
272 TABEL 4.1.5 UITKERINGSGERECHTIG
- Page 275 and 276:
274 TABEL 4.1.7 NIET-WERKENDE VERGO
- Page 277 and 278:
276 TABEL 4.1.8 VERGOEDE WERKLOZEN
- Page 279 and 280:
278 TABEL 4.2.2 IAB-WERKLOZEN in 20
- Page 281 and 282:
280 TABEL 4.3.1. NIET-WERKENDE WERK
- Page 283 and 284:
282 Beding van afwijzing van aanspr
- Page 285 and 286:
284 5.1.20 Welvaartsindex (België=
- Page 287 and 288:
286 TABEL 5.1.2 AANTAL AANGIFTEN pe
- Page 289 and 290:
288 TABEL 5.1.4 TOTAAL BELASTBAAR N
- Page 291 and 292:
290 TABEL 5.1.6 AANTAL AANGIFTEN en
- Page 293 and 294:
292 TABEL 5.1.8 AANTAL AANGIFTEN pe
- Page 295 and 296:
294 TABEL 5.1.10 AANTAL AANGIFTEN e
- Page 297 and 298:
296 Tabel 5.1.12 AANTAL AANGIFTEN e
- Page 299 and 300:
298 TABEL 5.1.14 GEMIDDELD TOTAAL B
- Page 301 and 302:
300 TABEL 5.1.16 GEMIDDELD TOTAAL B
- Page 303 and 304:
302 TABEL 5.1.18 GEMIDDELD TOTAAL B
- Page 305 and 306:
304 TABEL 5.1.20 WELVAARTSINDEX (Be
- Page 307 and 308: 306 TABEL 5.1.22 SAMENSTELLING van
- Page 309 and 310: 308 5.2 Huishoudbudgetonderzoek Tab
- Page 311 and 312: ➧ 310 Benaming VLAAMS GEWEST 1999
- Page 313 and 314: 312 Tabel 5.2.2 GEMIDDELDE JAARLIJK
- Page 315 and 316: ➧ 314 Benaming VLAAMS GEWEST 1995
- Page 317 and 318: 316 Tabel 5.2.3 GEMIDDELDE JAARLIJK
- Page 319 and 320: 318 TABEL 5.2.4 GEMIDDELDE UITGAVEN
- Page 321 and 322: ➧ 320 Benaming 1999 2000 2001 VLA
- Page 323 and 324: 322 Tabel 5.2.5 GEMIDDELDE JAARLIJK
- Page 325 and 326: ➧ 324 Benaming 1978-79 1987-88 19
- Page 327 and 328: ➧ 326 Benaming 1978-79 1987-88 19
- Page 329 and 330: ➧ 328 Benaming 1978-79 1987-88 19
- Page 331 and 332: 330 Tabel 5.2.6 GEMIDDELDE JAARLIJK
- Page 333 and 334: 332 Beding van afwijzing van aanspr
- Page 335 and 336: 334 TABEL 6.1.a MINISTERIE BRUSSELS
- Page 337 and 338: 336 ➧ UITVOERING / BEGROTING UITG
- Page 339 and 340: 338 TABEL 6.3 FINANCIËN van de 19
- Page 341 and 342: ➧ 340 BEGROTING 2007* ONTVANGSTEN
- Page 343 and 344: 342 TABEL 6.4 FINANCIËN van de 19
- Page 345 and 346: ➧ 344 ONTVANGSTEN UIT … prestat
- Page 347 and 348: ➧ 346 ONTVANGSTEN UIT … prestat
- Page 349 and 350: ➧ 348 BEGROTING 2009 GEDETAILLEER
- Page 351 and 352: 350 TABEL 6.5 FINANCIËN van de ins
- Page 353 and 354: 352 7.2.b Ruimtelijke kenmerken Fig
- Page 355 and 356: 354 - Investeringen in onderzoek en
- Page 357: 356 ➧ NACE-BEL BEDRIJFSSECTIES en
- Page 361 and 362: 360 ➧ NACE-BEL BEDRIJFSSECTIES en
- Page 363 and 364: 362 TABEL 7.1.d BELONING VAN WERKNE
- Page 365 and 366: 364 TABEL 7.1.e DISTRIBUTIEVE DEEL
- Page 367 and 368: 366 ➧ NACE-BEL BEDRIJFSSECTIES en
- Page 369 and 370: 368 ➧ NACE-BEL BEDRIJFSSECTIES en
- Page 371 and 372: 370 TABEL 7.3.a AANTAL ONDERNEMINGE
- Page 373 and 374: 372 TABEL 7.3.b AANTAL ONDERNEMINGE
- Page 375 and 376: 374 ➧ NACE-BEL BEDRIJFSSECTIES en
- Page 377 and 378: ➧ 376 AANTAL ONDERNEMINGEN K L M
- Page 379 and 380: 378 ➧ GEMEENTEN ZONDER PERSONEEL
- Page 381 and 382: 380 ➧ NACE-BEL BEDRIJFSSECTIES en
- Page 383 and 384: 382 TABEL 7.5 a INVESTERINGEN exclu
- Page 385 and 386: 384 ➧ NACE-BEL BEDRIJFSSECTIES en
- Page 387 and 388: 386 TABEL 7.5.b2 BRUTO-INVESTERINGE
- Page 389 and 390: 388 TABEL 7.5 c2 INVESTERINGEN in O
- Page 391 and 392: 390 ➧ BRUSSELS HOOFDSTEDELIJK GUE
- Page 393 and 394: 392 ➧ NACE-BEL SECTIES en AFDELIN
- Page 395 and 396: 394 TABEL 7.6.b AANDEEL van de UITV
- Page 397 and 398: 396 ➧ NACE-BEL SECTIES en AFDELIN
- Page 399 and 400: 398 ➧ NACE-BEL SECTIES en AFDELIN
- Page 401 and 402: 400 TABEL 7.6.c.2 UITVOER van GOEDE
- Page 403 and 404: 402 ➧ SECTIONS et DIVISIONS NACE-
- Page 405 and 406: 404 ➧ SECTIONS et DIVISIONS NACE-
- Page 407 and 408: 406 ➧ AFDELINGEN en HOOFDSTUK van
- Page 409 and 410:
408 ➧ AFDELINGEN en HOOFDSTUK van
- Page 411 and 412:
410 ➧ 2000 2005 2006 2007 2008 20
- Page 413 and 414:
412 Beding van afwijzing van aanspr
- Page 415 and 416:
414 TABEL 8.1 AANTAL HOTELS, MAANDE
- Page 417 and 418:
416 TABEL 8.3 AANTAL OVERNACHTINGEN
- Page 419 and 420:
418 TABEL 8.5 AANTAL OVERNACHTINGEN
- Page 421 and 422:
420 Beding van afwijzing van aanspr
- Page 423 and 424:
422 TABEL 9.1 BODEMBEZETTING naar A
- Page 425 and 426:
424 TABEL 9.2 BODEMBEZETTING naar A
- Page 427 and 428:
426 TABEL 9.3 BODEMBEZETTING naar A
- Page 429 and 430:
428 TABEL 9.4 BODEMBEZETTING, BEBOU
- Page 431 and 432:
430 TABEL 9.6a GEBOUWENPARK van WOO
- Page 433 and 434:
432 TABEL 9.7 GEBOUWEN en hun PARKI
- Page 435 and 436:
434 TABEL 9.8b GEBOUWEN en hun PARK
- Page 437 and 438:
436 ➧ VERBOUWINGEN : BOUWVERGUNNI
- Page 439 and 440:
438 ➧ BOUW: BEGONNEN BOUWWERKEN 2
- Page 441 and 442:
440 TABEL 9.11b VERKOPEN van gewone
- Page 443 and 444:
442 TABEL 9.11c VERKOPEN van APPART
- Page 445 and 446:
444 TABEL 9.13 VERKOPEN van ONROERE
- Page 447 and 448:
446 TABEL 9.14 INDUSTRIEPARKEN en -
- Page 449 and 450:
448 TABEL 9.16 WONINGENPARK van SOC
- Page 451 and 452:
450 10.3 Vervoer van goederen Analy
- Page 453 and 454:
452 TABEL 10.2 NIEUWE en TWEEDEHAND
- Page 455 and 456:
454 TABEL 10.4 NIEUWE tot het VERKE
- Page 457 and 458:
456 TABEL 10.6 Percentage van NIEUW
- Page 459 and 460:
458 TABEL 10.8 MOTORVOERTUIGENPARK
- Page 461 and 462:
460 TABEL 10.10 MOTORVOERTUIGENPARK
- Page 463 and 464:
462 10.2 Vervoer van personen TABEL
- Page 465 and 466:
464 TABEL 10.14 TAXI’S in het BRU
- Page 467 and 468:
466 10.3 Vervoer van goederen TABEL
- Page 469 and 470:
468 TABEL 10.18 GOEDERENVERVOER per
- Page 471 and 472:
470 10.4 Informatie en Communicatie
- Page 473 and 474:
472 11.6 Vervoer- en milieu-uitgave
- Page 475 and 476:
474 TABEL 11.2.1 LUCHTKWALITEIT in
- Page 477 and 478:
476 TABEL 11.2.3 LUCHTKWALITEIT in
- Page 479 and 480:
478 TABEL 11.2-5 STUIFMEELSTELLING
- Page 481 and 482:
➧ 480 2007 2008 Tellers Abonnees
- Page 483 and 484:
482 TABEL 11.3.3 KWALITEIT van het
- Page 485 and 486:
484 TABEL 11.4.2 RECYCLAGE van het
- Page 487 and 488:
486 TABEL 11.5.2 PERCENTAGE van de
- Page 489 and 490:
488 ➧ BHG Vlaams Gewest Waals Gew
- Page 491 and 492:
490 Beding van afwijzing van aanspr
- Page 493 and 494:
492 12.20 Aardgasflux naar de gewes
- Page 495 and 496:
494 TABEL 12.2 EINDENERGIEVERBRUIK
- Page 497 and 498:
496 TABEL 12.4 EVOLUTIE van het TOT
- Page 499 and 500:
498 TABEL 12.6 TOTAAL EINDVERBRUIK
- Page 501 and 502:
500 TABEL 12.8 TOTAAL EINDVERBRUIK
- Page 503 and 504:
502 TABEL 12.10 TOTAAL EINDVERBRUIK
- Page 505 and 506:
504 TABEL 12.12 AANTAL (geabonneerd
- Page 507 and 508:
506 TABEL 12.14 VERKOOP en VERVOER
- Page 509 and 510:
508 Beding van afwijzing van aanspr
- Page 511 and 512:
510 TABEL 13.1 VERKEERSONGEVALLEN o
- Page 513 and 514:
512 TABEL 13.3 VERKEERSONGEVALLEN o
- Page 515 and 516:
➧ 514 TABEL 13.4 TUSSENKOMSTEN va
- Page 517 and 518:
516 TABEL 13.5-2 VASTGESTELDE CRIMI
- Page 519 and 520:
518 TABEL 13.6-1 VEILIGHEIDSMONITOR
- Page 521 and 522:
520 TABEL 13.6-3 VEILIGHEIDSMONITOR
- Page 523 and 524:
522 TABEL 13.6-5 VEILIGHEIDSMONITOR
- Page 525 and 526:
524 Beding van afwijzing van aanspr
- Page 527 and 528:
526 TABEL 14.1 AANTAL ERKENDE ALGEM
- Page 529 and 530:
528 ➧ TABEL 14.2 AANTAL ZIEKENHUI
- Page 531 and 532:
530 TABEL 14.4 DOODSOORZAKEN wegens
- Page 533 and 534:
532 TABEL 14.6 LEVENSVERWACHTING: r
- Page 535 and 536:
534 TABEL 14.8 NEDERLANDSTALIGE en
- Page 537 and 538:
536 Beding van afwijzing van aanspr
- Page 539 and 540:
538 TABEL 15.1 SCHOOLBEVOLKING in h
- Page 541 and 542:
540 TABEL 15.3 BELGISCHE en NIET-BE
- Page 543 and 544:
➧ 542 2007-2008 Mannen Vrouwen TO
- Page 545 and 546:
➧ 544 2006-2007 Mannen Vrouwen TO
- Page 547 and 548:
546 TABEL 15.5 BELGISCHE en NIET-BE
- Page 549 and 550:
➧ 548 2007-2008 Mannen Vrouwen TO
- Page 551 and 552:
550 TABEL 15.7 STUDENTEN aan de UNI
- Page 553 and 554:
552 TABEL 15.9 TEWERKSTELLING in ON
- Page 555 and 556:
554 Beding van afwijzing van aanspr
- Page 557 and 558:
556 TABEL 16.1 AANTAL BIOSCOOPZALEN
- Page 559 and 560:
558 17.2.4 Aantal begunstigden van
- Page 561 and 562:
560 17.1 Recht op maatschappelijke
- Page 563 and 564:
562 TABEL 17.1.2 AANTAL BEGUNSTIGDE
- Page 565 and 566:
564 TABEL 17.1.3 AANTAL BEGUNSTIGDE
- Page 567 and 568:
566 TABEL 17.1.5 AANTAL BEGUNSTIGDE
- Page 569 and 570:
568 TABEL 17.1.7 AANTAL BEGUNSTIGDE
- Page 571 and 572:
570 TABEL 17.1.8 AANTAL BEGUNSTIGDE
- Page 573 and 574:
572 TABEL 17.1.9b AANTAL BUITENLAND
- Page 575 and 576:
574 TABEL 17.1.11 INSTALLATIEPREMIE
- Page 577 and 578:
576 TABEL 17.1.13 AANTAL BEGUNSTIGD
- Page 579 and 580:
578 TABEL 17.2.1 b AANTAL BEGUNSTIG
- Page 581 and 582:
580 TABEL 17.2.3 AANTAL BEGUNSTIGDE
- Page 583 and 584:
582 TABEL 17.2.5 AANTAL BEGUNSTIGDE
- Page 585 and 586:
584 TABEL 17.2.7 AANTAL BEGUNSTIGDE
- Page 587 and 588:
586 TABEL 17.3.2 AANTAL GERECHTIGDE
- Page 589 and 590:
588 TABEL 17.3.5 AANTAL BIJSLAGTREK
- Page 591 and 592:
590 18.1 Verkiezingen voor het Brus
- Page 593 and 594:
592 TABEL 18.1.3 VERKIEZING van het
- Page 595 and 596:
594 TABEL 18.1.4 VERKIEZING van het
- Page 597 and 598:
596 TABEL 18.1.6 VERKIEZING van het
- Page 599 and 600:
598 TABEL 18.1.8 VERKIEZING van het
- Page 601 and 602:
600 18.2 Verkiezingen voor het Euro
- Page 603 and 604:
602 TABEL 18.2.2 VERKIEZING van het
- Page 605 and 606:
604 TABEL 18.2.3 VERKIEZING van het
- Page 607 and 608:
606 Beding van afwijzing van aanspr
- Page 609 and 610:
Statistische indicatoren 2009 BIJLA
- Page 611 and 612:
Statistische indicatoren 2009 Voorb
- Page 613 and 614:
Sectie C Winning van delfstoffen 10
- Page 615 and 616:
67.11 Beheer van financiële beurze
- Page 617 and 618:
BIJLAGE 6 STATISTISCHE NACE-BEL 200
- Page 619 and 620:
Bijlagen 88 Maatschappelijke dienst
- Page 621 and 622:
Lijst van de publicaties van het BR
- Page 623 and 624:
Bijlagen nr 1 De invloedzone van de