PROVNINGSJÃMFÃRELSE 2002 - 2 - ITM
PROVNINGSJÃMFÃRELSE 2002 - 2 - ITM
PROVNINGSJÃMFÃRELSE 2002 - 2 - ITM
Create successful ePaper yourself
Turn your PDF publications into a flip-book with our unique Google optimized e-Paper software.
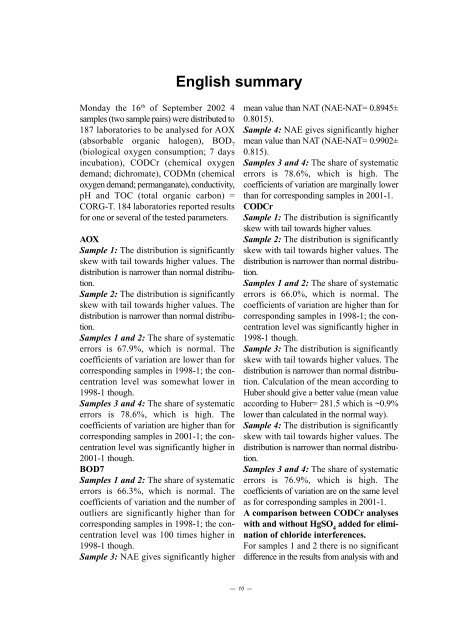
English summaryMonday the 16 th of September <strong>2002</strong> 4samples (two sample pairs) were distributed to187 laboratories to be analysed for AOX(absorbable organic halogen), BOD 7(biological oxygen consumption; 7 daysincubation), CODCr (chemical oxygendemand; dichromate), CODMn (chemicaloxygen demand; permanganate), conductivity,pH and TOC (total organic carbon) =CORG-T. 184 laboratories reported resultsfor one or several of the tested parameters.AOXSample 1: The distribution is significantlyskew with tail towards higher values. Thedistribution is narrower than normal distribution.Sample 2: The distribution is significantlyskew with tail towards higher values. Thedistribution is narrower than normal distribution.Samples 1 and 2: The share of systematicerrors is 67.9%, which is normal. Thecoefficients of variation are lower than forcorresponding samples in 1998-1; the concentrationlevel was somewhat lower in1998-1 though.Samples 3 and 4: The share of systematicerrors is 78.6%, which is high. Thecoefficients of variation are higher than forcorresponding samples in 2001-1; the concentrationlevel was significantly higher in2001-1 though.BOD7Samples 1 and 2: The share of systematicerrors is 66.3%, which is normal. Thecoefficients of variation and the number ofoutliers are significantly higher than forcorresponding samples in 1998-1; the concentrationlevel was 100 times higher in1998-1 though.Sample 3: NAE gives significantly highermean value than NAT (NAE-NAT= 0.8945±0.8015).Sample 4: NAE gives significantly highermean value than NAT (NAE-NAT= 0.9902±0.815).Samples 3 and 4: The share of systematicerrors is 78.6%, which is high. Thecoefficients of variation are marginally lowerthan for corresponding samples in 2001-1.CODCrSample 1: The distribution is significantlyskew with tail towards higher values.Sample 2: The distribution is significantlyskew with tail towards higher values. Thedistribution is narrower than normal distribution.Samples 1 and 2: The share of systematicerrors is 66.0%, which is normal. Thecoefficients of variation are higher than forcorresponding samples in 1998-1; the concentrationlevel was significantly higher in1998-1 though.Sample 3: The distribution is significantlyskew with tail towards higher values. Thedistribution is narrower than normal distribution.Calculation of the mean according toHuber should give a better value (mean valueaccording to Huber= 281.5 which is ~0.9%lower than calculated in the normal way).Sample 4: The distribution is significantlyskew with tail towards higher values. Thedistribution is narrower than normal distribution.Samples 3 and 4: The share of systematicerrors is 76.9%, which is high. Thecoefficients of variation are on the same levelas for corresponding samples in 2001-1.A comparison between CODCr analyseswith and without HgSO 4added for eliminationof chloride interferences.For samples 1 and 2 there is no significantdifference in the results from analysis with and— 10 —


