Årsrapport - Netfonds
Årsrapport - Netfonds
Årsrapport - Netfonds
- No tags were found...

You also want an ePaper? Increase the reach of your titles
YUMPU automatically turns print PDFs into web optimized ePapers that Google loves.
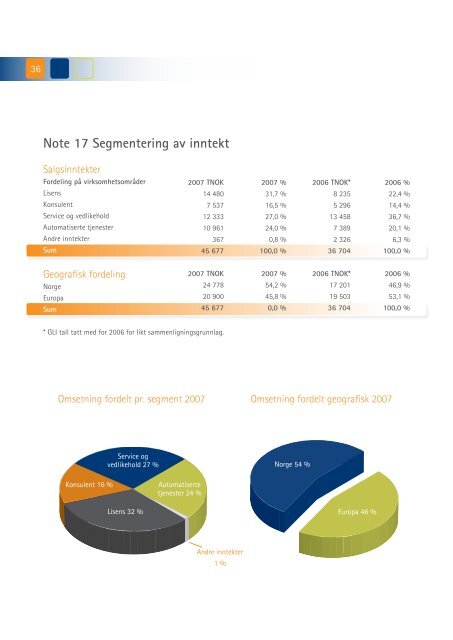
36Note 17 Segmentering av inntektSalgsinntekterFordeling på virksomhetsområderLisensKonsulentService og vedlikeholdAutomatiserte tjenesterAndre inntekterSum2007 TNOK14 4807 53712 33310 96136745 6772007 %31,7 %16,5 %27,0 %24,0 %0,8 %100,0 %2006 TNOK*8 2355 29613 4587 3892 32636 7042006 %22,4 %14,4 %36,7 %20,1 %6,3 %100,0 %Geografisk fordelingNorge2007 TNOK24 7782007 %54,2 %2006 TNOK*17 2012006 %46,9 %EuropaSum20 90045 67745,8 %0,0 %19 50336 70453,1 %100,0 %* GLI tall tatt med for 2006 for likt sammenligningsgrunnlag.Omsetning fordelt pr. segment 2007 Omsetning fordelt geografisk 2007Service ogvedlikehold 27 %Norge 54 %Konsulent 16 %Automatisertetjenester 24 %Lisens 32 %Europa 46 %Andre inntekter1 %