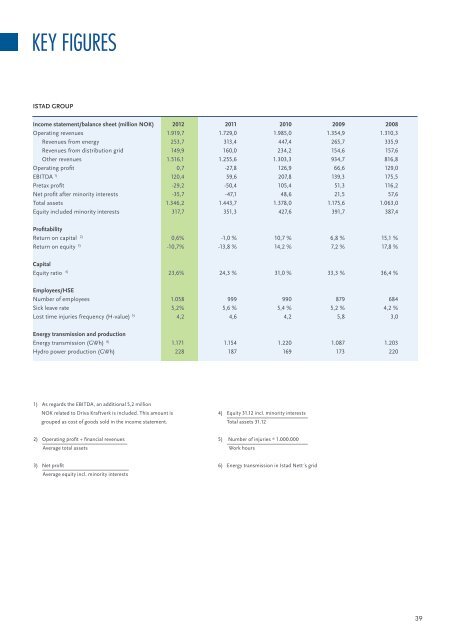
engLISH summaRYOperating revenues for the <strong>Istad</strong> Group in 2012 amounted to approx.NOK 1.9 billion, compared with approx. NOK 1.7 billion the yearbefore. The year 2011 was marked by weaker financial performancesin several of the Group’s businesses, and the year ended with anoperating loss of NOK 27.8 million. A number of measures have beenimplemented in 2012 to improve profitability in the Group. We inchedcloser to a more normalised result for the Group, with an operatingprofit of NOK 0.7 million (after a write-down of the district heatingplant of NOK 45 million). EBITDA is a much used key figure that isindicative of the cash flows linked to the underlying operation of thebusiness. In 2011, the Group’s EBITDA was NOK 59.6 million, and itincreased to NOK 120.4 million in 2012. The Group had 1,058 employeesat the end of 2012.We have a long-term perspective on the business we are engaged in,and we are concerned with managing the resources that have beenplaced at our disposal in order to create value to the benefit of theowners, employees and community. A strategic platform has beenprepared for the <strong>Istad</strong> Group for the period 2013–2016, whichsupports our vision: to be a profitable driving force for the localeconomy. We expect total turnover in 2013 to be at roughly thesame level as in 2012.Linjebygg offshore as (lbo) has seen increased activity in 2012with a turnover of NOK 787 million and a satisfactory profit. Considerableinvestments have been made in new business systems, thedevelopment of administrative capacity, internationalisation of thebusiness, innovation and product development. A business structureand capacity have been developed to form a foundation for growthin LBO’s business in the coming years. The outlook for the oil servicemarket looks promising. LBO has developed unique equipment foruse in the splash zone offshore that can be used in connection withinspections, mechanical operations, cutting, flushing and cleaningetc. Several demanding subsea assignments have been carried outin 2012 using this equipment, and strong growth is expected in thisarea in the time ahead.istad tekniske as was established in 2009 to coordinate and followup the Group’s activities in technical disciplines (electrical installation,plumbing, ventilation and automation). Several companies havebeen acquired in Trondheim, which have been merged and co-located.This has been a demanding process. Our investment in the technicaldisciplines in Trøndelag has not been successful, and the businesshas generated very weak results. Various strategic measures are beingdeveloped for this business. The companies in <strong>Istad</strong> Tekniske in Møreog Romsdal have recorded a positive performance in 2012.istad energimontasje as has recorded another year of growthin turnover and achieved a profit margin of 6 % in 2012. In the powerindustry, there is a considerable lag in relation to investments and reinvestmentsin power lines/cables, and the market for the company’sservices looks very promising. Continued access to competent labouris a limiting factor for further growth in the company’s business inthe coming years. Various strategic measures are being devised toincrease access to competent resources in order to be able to developthe company further.istad <strong>kraft</strong> as has focused on selling energy to the local market,and maintains a strong position in this area. There is stiff competitionin the energy market, and close follow-up is required to retain thismarket position. <strong>Istad</strong> Kraft is a small hydro power producer, and onlyaround 30 % of its total traded energy volume came from its ownproduction in 2012. The year 2012 was a good financial year for thecompany.istad nett is one of the most efficient grid companies inNorway. Grid operations have been stable throughout 2012, thoughthere were some after effects following the extreme weather at theend of 2011. The grid operations are a monopoly business and areregulated by the Norwegian Water Resources and Energy Directorate(NVE).The return on grid capital was 3.3 % in 2012. Most of the companiesin the industry will achieve a low return in 2012 because of themechanisms in the regulation model. NVE has adjusted the regulationmodel, which means profitability will improve in this industryin 2013. Over time, the return on invested capital will be normal inthe industry. <strong>Istad</strong> Nett <strong>AS</strong> also operates a bio-based district heatingplant at Årø in Molde. A new assessment has been made of the districtheating plant’s future finances, and the plant has therefore beenwritten down by NOK 45 million in 2012. Following the write-down,<strong>Istad</strong> Nett recorded a loss for 2012.In 2013, we will focus on continuing the work on measures to improveprofitability, ensure good operations and achieve a more normalisedlevel of performance for the Group’s business.38 ISTAD ÅRSRAPPORT 2012
kEY figuresISTAD groupIncome statement/balance sheet (million NOK) 2012 2011 2010 2009 2008Operating revenues 1.919,7 1.729,0 1.985,0 1.354,9 1.310,3Revenues from energy 253,7 313,4 447,4 265,7 335,9Revenues from distribution grid 149,9 160,0 234,2 154,6 157,6Other revenues 1.516,1 1.255,6 1.303,3 934,7 816,8Operating profit 0,7 -27,8 126,9 66,6 129,0EBITDA 1) 120,4 59,6 207,8 139,3 175,5Pretax profit -29,2 -50,4 105,4 51,3 116,2Net profit after minority interests -35,7 -47,1 48,6 21,5 57,6Total assets 1.346,2 1.443,7 1.378,0 1.175,6 1.063,0Equity included minority interests 317,7 351,3 427,6 391,7 387,4ProfitabilityReturn on capital 2) 0,6% -1,0 % 10,7 % 6,8 % 15,1 %Return on equity 3) -10,7% -13,8 % 14,2 % 7,2 % 17,8 %CapitalEquity ratio 4) 23,6% 24,3 % 31,0 % 33,3 % 36,4 %Employees/HSENumber of employees 1.058 999 990 879 684Sick leave rate 5,2% 5,6 % 5,4 % 5,2 % 4,2 %Lost time injuries frequency (H-value) 5) 4,2 4,6 4,2 5,8 3,0Energy transmission and productionEnergy transmission (GWh) 6) 1.171 1.154 1.220 1.087 1.203Hydro power production (GWh) 228 187 169 173 2201) As regards the EBITDA, an additional 5,2 millionNOK related to Driva Kraftverk is included. This amount isgrouped as cost of goods sold in the income statement.4) Equity 31.12 incl. minority interestsTotal assets 31.122) Operating profit + financial revenuesAverage total assets5) Number of injuries * 1.000.000Work hours3) Net profitAverage equity incl. minority interests6) Energy transmission in <strong>Istad</strong> Nett´s grid39