Plano Integrado de Recursos HÃdricos da Bacia do Rio ... - CBH Doce
Plano Integrado de Recursos HÃdricos da Bacia do Rio ... - CBH Doce
Plano Integrado de Recursos HÃdricos da Bacia do Rio ... - CBH Doce

Create successful ePaper yourself
Turn your PDF publications into a flip-book with our unique Google optimized e-Paper software.
-- Contrato Nº 043/2008 - IGAM--<br />
<strong>Plano</strong> <strong>Integra<strong>do</strong></strong> <strong>de</strong> <strong>Recursos</strong> Hídricos <strong>da</strong> <strong>Bacia</strong> <strong>do</strong> <strong>Rio</strong> <strong>Doce</strong> e <strong>do</strong>s <strong>Plano</strong>s <strong>de</strong> Ações <strong>de</strong> <strong>Recursos</strong> Hídricos para as Uni<strong>da</strong><strong>de</strong>s <strong>de</strong><br />
Planejamento e Gestão <strong>de</strong> <strong>Recursos</strong> Hídricos no Âmbito <strong>da</strong> <strong>Bacia</strong> <strong>do</strong> <strong>Rio</strong> <strong>Doce</strong><br />
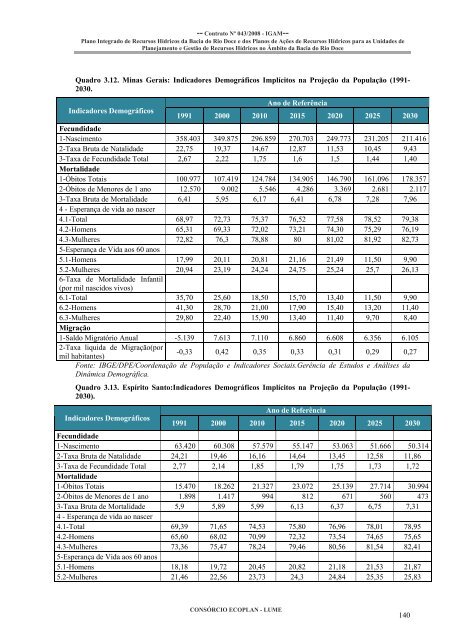
Quadro 3.12. Minas Gerais: Indica<strong>do</strong>res Demográficos Implícitos na Projeção <strong>da</strong> População (1991-<br />
2030.<br />
Indica<strong>do</strong>res Demográficos<br />
Ano <strong>de</strong> Referência<br />
1991 2000 2010 2015 2020 2025 2030<br />
Fecundi<strong>da</strong><strong>de</strong><br />
1-Nascimento 358.403 349.875 296.859 270.703 249.773 231.205 211.416<br />
2-Taxa Bruta <strong>de</strong> Natali<strong>da</strong><strong>de</strong> 22,75 19,37 14,67 12,87 11,53 10,45 9,43<br />
3-Taxa <strong>de</strong> Fecundi<strong>da</strong><strong>de</strong> Total 2,67 2,22 1,75 1,6 1,5 1,44 1,40<br />
Mortali<strong>da</strong><strong>de</strong><br />
1-Óbitos Totais 100.977 107.419 124.784 134.905 146.790 161.096 178.357<br />
2-Óbitos <strong>de</strong> Menores <strong>de</strong> 1 ano 12.570 9.002 5.546 4.286 3.369 2.681 2.117<br />
3-Taxa Bruta <strong>de</strong> Mortali<strong>da</strong><strong>de</strong> 6,41 5,95 6,17 6,41 6,78 7,28 7,96<br />
4 - Esperança <strong>de</strong> vi<strong>da</strong> ao nascer<br />
4.1-Total 68,97 72,73 75,37 76,52 77,58 78,52 79,38<br />
4.2-Homens 65,31 69,33 72,02 73,21 74,30 75,29 76,19<br />
4.3-Mulheres 72,82 76,3 78,88 80 81,02 81,92 82,73<br />
5-Esperança <strong>de</strong> Vi<strong>da</strong> aos 60 anos<br />
5.1-Homens 17,99 20,11 20,81 21,16 21,49 11,50 9,90<br />
5.2-Mulheres 20,94 23,19 24,24 24,75 25,24 25,7 26,13<br />
6-Taxa <strong>de</strong> Mortali<strong>da</strong><strong>de</strong> Infantil<br />
(por mil nasci<strong>do</strong>s vivos)<br />
6.1-Total 35,70 25,60 18,50 15,70 13,40 11,50 9,90<br />
6.2-Homens 41,30 28,70 21,00 17,90 15,40 13,20 11,40<br />
6.3-Mulheres 29,80 22,40 15,90 13,40 11,40 9,70 8,40<br />
Migração<br />
1-Sal<strong>do</strong> Migratório Anual -5.139 7.613 7.110 6.860 6.608 6.356 6.105<br />
2-Taxa liqui<strong>da</strong> <strong>de</strong> Migração(por<br />
-0,33 0,42 0,35 0,33 0,31 0,29 0,27<br />
mil habitantes)<br />
Fonte: IBGE/DPE/Coor<strong>de</strong>nação <strong>de</strong> População e Indica<strong>do</strong>res Sociais.Gerência <strong>de</strong> Estu<strong>do</strong>s e Análises <strong>da</strong><br />
Dinâmica Demográfica.<br />
Quadro 3.13. Espírito Santo:Indica<strong>do</strong>res Demográficos Implícitos na Projeção <strong>da</strong> População (1991-<br />
2030).<br />
Indica<strong>do</strong>res Demográficos<br />
Ano <strong>de</strong> Referência<br />
1991 2000 2010 2015 2020 2025 2030<br />
Fecundi<strong>da</strong><strong>de</strong><br />
1-Nascimento 63.420 60.308 57.579 55.147 53.063 51.666 50.314<br />
2-Taxa Bruta <strong>de</strong> Natali<strong>da</strong><strong>de</strong> 24,21 19,46 16,16 14,64 13,45 12,58 11,86<br />
3-Taxa <strong>de</strong> Fecundi<strong>da</strong><strong>de</strong> Total 2,77 2,14 1,85 1,79 1,75 1,73 1,72<br />
Mortali<strong>da</strong><strong>de</strong><br />
1-Óbitos Totais 15.470 18.262 21.327 23.072 25.139 27.714 30.994<br />
2-Óbitos <strong>de</strong> Menores <strong>de</strong> 1 ano 1.898 1.417 994 812 671 560 473<br />
3-Taxa Bruta <strong>de</strong> Mortali<strong>da</strong><strong>de</strong> 5,9 5,89 5,99 6,13 6,37 6,75 7,31<br />
4 - Esperança <strong>de</strong> vi<strong>da</strong> ao nascer<br />
4.1-Total 69,39 71,65 74,53 75,80 76,96 78,01 78,95<br />
4.2-Homens 65,60 68,02 70,99 72,32 73,54 74,65 75,65<br />
4.3-Mulheres 73,36 75,47 78,24 79,46 80,56 81,54 82,41<br />
5-Esperança <strong>de</strong> Vi<strong>da</strong> aos 60 anos<br />
5.1-Homens 18,18 19,72 20,45 20,82 21,18 21,53 21,87<br />
5.2-Mulheres 21,46 22,56 23,73 24,3 24,84 25,35 25,83<br />
CONSÓRCIO ECOPLAN - LUME<br />
140