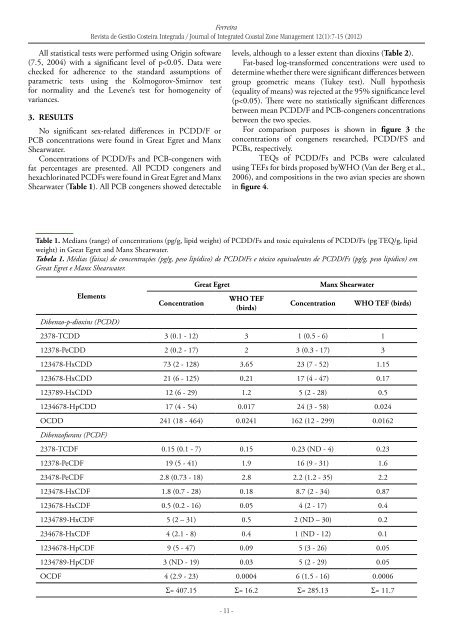
Ferreira Revista de Gestão Costeira Integrada / Journal of Integrated Coastal Zone Management 12(1):7-15 (2012) All statistical tests were performed using Origin software (7.5, 2004) with a significant level of p
Ferreira Revista de Gestão Costeira Integrada / Journal of Integrated Coastal Zone Management 12(1):7-15 (2012) Table 2. Medians (range) of concentrations as pg/g lipid weight of PCBs and toxic equivalents of PCBs (pg TEQ/g lipid weight) in Great Egret and Manx Shearwater. Tabela 2. Médias (faixa) de concentrações (pg/g, peso lipídico) de PCBs e tóxico equivalentes de PCBs (pg TEQ/g, peso lipídico) em Great Egret e Manx Shearwater. Elements Non-ortho PCBs Great Egret Concentration WHO TEF (birds) Concentration Manx Shearwater WHO TEF (birds) 3,3’,4,4’-TCB (77) 110 (54 - 670) 5.5 103 (76 - 140) 5.15 3,4,4’,5-TCB (81) 64 (18 - 740) 6.4 28 (11- 93) 2.8 3,3’,4,4’,5-PeCB (126) 94 (81 - 130) 9.4 58 (34 - 150) 5.8 3,3’,4,4’,5,5’-HxCB (169) 58 (35 - 100) 0.058 16 (9 - 57) 0.016 Mono-ortho PCBs 2,3,3’,4,4’-PeCB (105) 187 (58 - 220) 0.0187 156 (18 - 210) 0.0156 2,3,4,4’,5-PeCB (114) 213 (67 - 349) 0.0213 437 (216 - 511) 0.0437 2,3’,4,4’,5-PeCB (118) 169 (12 - 258) 0.00169 138 (19 - 231) 0.00138 2’,3,4,4’,5-PeCB (123) 64 (33 - 122) 0.00064 31 (13 - 55) 0.00031 2,3,3’,4,4’,5-HxCB (156) 17 (5 -78) 0.0017 23 (7 - 112) 0.0023 2,3,3’,4,4’,5’-HxCB (157) 13 (11 - 18) 0.0013 17 (8 - 54) 0.0017 2,3’,4,4’,5,5’-HxCB (167) 22 (18 - 30) 0.00022 21 (12 - 70) 0.00021 2,3,3’,4,4’,5,5’-HeCB (189) 12 (7 - 18) 0.00012 9 (4 - 16) 0.00009 ND = concentration below LOD Σ= 1023 Σ= 21.4 Σ= 1034 Σ= 13.8 Figure 3. Distribution of PCDD/FS and PCBs congeners (pg/g lipid) in the organisms studied. Figura 3. Distribuição de congêneros de PCDD/Fs e PCBs (pg/g, peso lipídico nos organismos estudados). - 12 -