- Page 2 and 3:
Anuário Estatístico do Brasil vol
- Page 4 and 5:
MINISTÉRIO DO PLANEJAMENTO, ORÇAM
- Page 6 and 7:
Sumário geral Apresentação Guia
- Page 8 and 9:
Guia de leitura O IBGE e o PGIEG As
- Page 10 and 11:
seção 1 Caracterização do terri
- Page 12 and 13:
1.3.4.3 - Domicílios particulares
- Page 14 and 15:
Tabela 1.1.1.1 - Pontos extremos, s
- Page 16 and 17:
Tabela 1.1.1.3 - Distância em linh
- Page 18 and 19:
Tabela 1.1.1.3 - Distância em linh
- Page 20 and 21:
Tabela 1.1.1.4 - Extensão da linha
- Page 22 and 23:
Tabela 1.1.2.1 - Área total, segun
- Page 24 and 25:
Tabela 1.1.3.1 - Estações geodés
- Page 26 and 27:
Tabela 1.2.1.1 - Evolução políti
- Page 28 and 29:
Tabela 1.2.2.1 - Municípios com á
- Page 30 and 31:
dos impactos que estes usos causam.
- Page 32 and 33:
Tabela 1.3.1.1 - Reservas de subst
- Page 34 and 35:
Tabela 1.3.2.2 - Pontos mais altos
- Page 36 and 37:
Tabela 1.3.2.2 - Pontos mais altos
- Page 38 and 39:
Tabela 1.3.3.1 - Potencial hidrelé
- Page 40 and 41:
Tabela 1.3.4.1 - Empresas que imple
- Page 42 and 43:
Tabela 1.3.4.3 - Domicílios partic
- Page 44 and 45:
Tabela 1.3.4.6 - Aquisição famili
- Page 46 and 47:
anticlinal Dobra que mostra fechame
- Page 48 and 49:
escoamento subterrâneo Fluxo de á
- Page 50 and 51:
macrofanerófita Planta cuja altura
- Page 52 and 53:
Território Nacional, sujeito à di
- Page 54 and 55:
seção 2 Características demográ
- Page 56 and 57:
População ocupada 2.2.2.1 - Pesso
- Page 58 and 59:
Principais características das pes
- Page 60 and 61:
seção 2 Demografia As análises e
- Page 62 and 63: Tabela 2.1.1.1 - População nos Ce
- Page 64 and 65: Tabela 2.1.1.2 - População reside
- Page 66 and 67: Tabela 2.1.1.3 - Projeção da popu
- Page 68 and 69: Tabela 2.1.2.1 - Nascidos vivos, po
- Page 70 and 71: Tabela 2.1.2.1 - Nascidos vivos, po
- Page 72 and 73: Tabela 2.1.2.2 - Casamentos, por m
- Page 74 and 75: Tabela 2.1.2.2 - Casamentos, por m
- Page 76 and 77: Tabela 2.1.2.3 - Óbitos, por ano d
- Page 78 and 79: Tabela 2.1.2.3 - Óbitos, por ano d
- Page 80 and 81: Tabela 2.1.2.4 - Processos de separ
- Page 82 and 83: Tabela 2.1.2.4 - Processos de separ
- Page 84 and 85: Tabela 2.1.3.2 - População reside
- Page 86 and 87: Tabela 2.1.4.2 - Famílias resident
- Page 88 and 89: Tabela 2.1.6.1 - População reside
- Page 90 and 91: Tabela 2.1.6.1 - População reside
- Page 92 and 93: Em 2002, a Classificação Brasilei
- Page 94 and 95: Tabela 2.2.1.1 - Pessoas de 10 anos
- Page 96 and 97: Tabela 2.2.1.3 - Pessoas de 10 anos
- Page 98 and 99: Tabela 2.2.2.1 - Pessoas de 10 anos
- Page 100 and 101: Grandes Regiões e grupamentos de a
- Page 102 and 103: Tabela 2.2.2.3 - Pessoas de 10 anos
- Page 104 and 105: Tabela 2.2.2.3 - Pessoas de 10 anos
- Page 106 and 107: Tabela 2.2.2.4 - Pessoas de 10 anos
- Page 108 and 109: Tabela 2.2.3.1 - Empregados de 10 a
- Page 110 and 111: Tabela 2.2.3.2 - Número de emprego
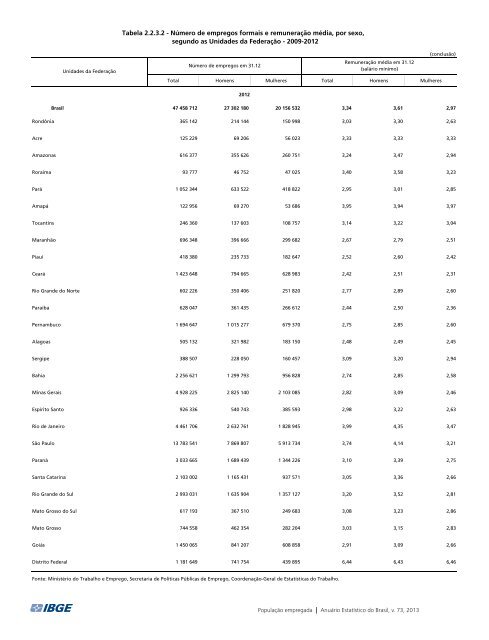
- Page 114 and 115: Tabela 2.2.3.3 - Número de emprego
- Page 116 and 117: Tabela 2.2.3.3 - Número de emprego
- Page 118 and 119: seção 2 Características demográ
- Page 120 and 121: Tabela 2.3.1.1 - Leitos para intern
- Page 122 and 123: Tabela 2.3.1.3 - Casos de Aids iden
- Page 124 and 125: Tabela - 2.3.2.1 - Quantidade de be
- Page 126 and 127: Tabela - 2.3.2.3 - Quantidade de be
- Page 128 and 129: Tabela 2.3.2.5 - Quantidade de bene
- Page 130 and 131: Tabela 2.4.1.1 - Taxa de analfabeti
- Page 132 and 133: Tabela 2.4.2.1 - Número de estabel
- Page 134 and 135: Tabela 2.4.2.2 - Número de estabel
- Page 136 and 137: Tabela 2.4.2.4 - Instituições de
- Page 138 and 139: Tabela 2.4.2.6 - Programas de pós-
- Page 140 and 141: seção 2 Habitação Característi
- Page 142 and 143: Tabela 2.5.1.2 - Domicílios partic
- Page 144 and 145: Tabela 2.6.1.1 - Número de pessoas
- Page 146 and 147: Tabela 2.6.1.3 - Veículos envolvid
- Page 148 and 149: Tabela 2.7.1.1 - Eleitores, por sex
- Page 150 and 151: Tabela 2.7.1.1 - Eleitores, por sex
- Page 152 and 153: seção 2 Glossário Característic
- Page 154 and 155: 1º grau, ou, no mínimo, a 4ª sé
- Page 156 and 157: divisão do número de moradores pe
- Page 158 and 159: estado civil (Censo Demográfico 20
- Page 160 and 161: nacionalidade Ver brasileiro nato,
- Page 162 and 163:
aritmética das remunerações indi
- Page 164 and 165:
com outra unidade domiciliar ou nã
- Page 166 and 167:
seção 2 Referências Característ
- Page 168 and 169:
seção 3 Aspectos das atividades a
- Page 170 and 171:
Produtos de origem animal 3.4.2.1 -
- Page 172 and 173:
seção 3 Aspectos das atividades a
- Page 174 and 175:
Tabela 3.1.1.2 - Unidades armazenad
- Page 176 and 177:
pequenos e médios produtores; e in
- Page 178 and 179:
Tabela 3.2.1.3 - Financiamentos con
- Page 180 and 181:
seção 3 Aspectos das atividades a
- Page 182 and 183:
Tabela 3.3.1.2 - Áreas plantada e
- Page 184 and 185:
Tabela 3.3.1.3 - Áreas plantada e
- Page 186 and 187:
Tabela 3.3.1.3 - Áreas plantada e
- Page 188 and 189:
Tabela 3.3.1.3 - Áreas plantada e
- Page 190 and 191:
Tabela 3.3.2.2 - Produção de carv
- Page 192 and 193:
Tabela 3.3.2.3 - Produção e valor
- Page 194 and 195:
seção 3 Aspectos das atividades a
- Page 196 and 197:
Tabela 3.4.1.1 - Abate de animais,
- Page 198 and 199:
Tabela 3.4.2.1 - Quantidade de leit
- Page 200 and 201:
seção 3 Efetivos Aspectos das ati
- Page 202 and 203:
Tabela 3.5.1.1 - Efetivo dos rebanh
- Page 204 and 205:
Tabela 3.5.1.2 - Efetivo das aves,
- Page 206 and 207:
válvulas e comportas que permitem
- Page 208 and 209:
de ambiente, como material para art
- Page 210 and 211:
seção 3 Referências Aspectos das
- Page 212 and 213:
seção 4 Aspectos da atividade ind
- Page 214 and 215:
Indicadores conjunturais da indúst
- Page 216 and 217:
seção 4 Aspectos da atividade ind
- Page 218 and 219:
Tabela 4.1.1.1 - Dados gerais das e
- Page 220 and 221:
Tabela 4.1.1.1 - Dados gerais das e
- Page 222 and 223:
Tabela 4.1.1.1 - Dados gerais das e
- Page 224 and 225:
Tabela 4.1.1.2 - Dados gerais das u
- Page 226 and 227:
Tabela 4.1.1.2 - Dados gerais das u
- Page 228 and 229:
Tabela 4.1.1.3 - Dados gerais das u
- Page 230 and 231:
Tabela 4.1.1.4 - Produção e venda
- Page 232 and 233:
Tabela 4.1.1.5 - Produção e venda
- Page 234 and 235:
Tabela 4.1.2.1 - Produção de aço
- Page 236 and 237:
Tabela 4.1.2.4 - Veículos de autop
- Page 238 and 239:
Tabela 4.1.2.7 - Produção de cime
- Page 240 and 241:
Tabela 4.1.2.8 - Consumo aparente d
- Page 242 and 243:
Tabela 4.1.2.11 - Consumo aparente
- Page 244 and 245:
Tabela 4.1.2.16 - Vendas de defensi
- Page 246 and 247:
Tabela 4.1.2.17 - Vendas de defensi
- Page 248 and 249:
Tabela 4.1.2.18 - Vendas de defensi
- Page 250 and 251:
Tabela 4.1.2.23 - Produção de pap
- Page 252 and 253:
Tabela 4.2.1.1 - Variáveis selecio
- Page 254 and 255:
Tabela 4.2.1.1 - Variáveis selecio
- Page 256 and 257:
Tabela 4.2.1.2 - Variáveis selecio
- Page 258 and 259:
Tabela 4.2.1.3 - Empresas da constr
- Page 260 and 261:
Gráfico 4.3.2 Evolução da oferta
- Page 262 and 263:
Tabela 4.3.1.4 - Consumo final de e
- Page 264 and 265:
Tabela 4.3.2.3 - Vendas de gás nat
- Page 266 and 267:
Tabela 4.3.3.2 - Produção de petr
- Page 268 and 269:
Tabela 4.3.3.2 - Produção de petr
- Page 270 and 271:
Tabela 4.3.3.2 - Produção de petr
- Page 272 and 273:
Tabela 4.3.3.3 - Reservas provadas
- Page 274 and 275:
Constitui-se o segundo grupo de inf
- Page 276 and 277:
Tabela 4.4.1.2 - Taxas anuais de cr
- Page 278 and 279:
Tabela 4.4.2.1 - Índices anuais pa
- Page 280 and 281:
Tabela 4.5.1.1 - Pedidos depositado
- Page 282 and 283:
organizados, também, segundo suas
- Page 284 and 285:
de previdência e assistência soci
- Page 286 and 287:
seção 5 Aspectos da atividade ser
- Page 288 and 289:
Aquaviário 5.2.3.1 - Movimento ger
- Page 290 and 291:
seção 5 Aspectos da atividade ser
- Page 292 and 293:
Tabela 5.1.1.1 - Dados gerais das e
- Page 294 and 295:
Tabela 5.1.1.2 - Número de empresa
- Page 296 and 297:
Tabela 5.1.2.1 - Faturamento real d
- Page 298 and 299:
Tabela 5.1.2.3 - Índice de volume
- Page 300 and 301:
Tabela 5.1.2.5 - Índice nominal de
- Page 302 and 303:
Tabela 5.1.2.7 - Índice de volume
- Page 304 and 305:
Tabela 5.1.2.9 - Índice nominal de
- Page 306 and 307:
seção 5 Aspectos da atividade ser
- Page 308 and 309:
Tabela 5.2.1.2 - Frota nacional de
- Page 310 and 311:
Tabela 5.2.3.1 - Movimento total de
- Page 312 and 313:
seção 5 Aspectos da atividade ser
- Page 314 and 315:
Tabela 5.3.1.2 - Atividades dos Cor
- Page 316 and 317:
Tabela 5.3.2.2 - Telefones de uso p
- Page 318 and 319:
transportes e armazenamento, ativid
- Page 320 and 321:
Tabela 5.4.1.3 - Empresas de servi
- Page 322 and 323:
Tabela 5.4.1.3 - Empresas de servi
- Page 324 and 325:
Tabela 5.4.1.4 - Unidades locais de
- Page 326 and 327:
Tabela 5.4.1.4 - Unidades locais de
- Page 328 and 329:
Tabela 5.4.1.4 - Unidades locais de
- Page 330 and 331:
Tabela 5.4.1.4 - Unidades locais de
- Page 332 and 333:
Tabela 5.4.2.2 - Agências de turis
- Page 334 and 335:
seção 5 Aspectos da atividade ser
- Page 336 and 337:
seção 5 Aspectos da atividade ser
- Page 338 and 339:
seção 6 Índices, preços, custos
- Page 340 and 341:
seção 6 Índices, preços, custos
- Page 342 and 343:
Quadro 6.1.1 - Dados gerais dos ín
- Page 344 and 345:
Tabela 6.1.1.1 - Variação geral n
- Page 346 and 347:
Tabela 6.1.1.2 - Variação geral n
- Page 348 and 349:
Tabela 6.1.1.3 - Variação geral n
- Page 350 and 351:
Tabela 6.1.2.1 - Variação mensal
- Page 352 and 353:
Gráfico 6.2.2 Variação mensal -
- Page 354 and 355:
Tabela 6.2.1.2 - Salário mínimo,
- Page 356 and 357:
Tabela 6.2.1.2 - Salário mínimo,
- Page 358 and 359:
salários mínimos. O período de c
- Page 360 and 361:
seção 7 Agregados macroeconômico
- Page 362 and 363:
7.3.2.4 - Valor dos desembolsos efe
- Page 364 and 365:
seção 7 Agregados macroeconômico
- Page 366 and 367:
Tabela 7.1.1.3 - Receitas realizada
- Page 368 and 369:
Tabela 7.2.1.1 - Despesa da União,
- Page 370 and 371:
Tabela 7.2.1.4 - Servidores civis a
- Page 372 and 373:
Tabela 7.3.1.1 - Variação percent
- Page 374 and 375:
Tabela 7.3.1.2 - Base monetária -
- Page 376 and 377:
Tabela 7.3.2.1 - Valor dos crédito
- Page 378 and 379:
Tabela 7.3.2.3 - Pagamentos do Prog
- Page 380 and 381:
Tabela 7.3.2.5 - Balanço do movime
- Page 382 and 383:
seção 7 Agregados Macroeconômico
- Page 384 and 385:
Tabela 7.4.1.3 - Exportação, segu
- Page 386 and 387:
Tabela 7.4.1.4 - Importação, segu
- Page 388 and 389:
Tabela 7.4.1.5 - Importação, segu
- Page 390 and 391:
Tabela 7.4.1.6 - Exportação, segu
- Page 392 and 393:
Tabela 7.4.1.6 - Exportação, segu
- Page 394 and 395:
Tabela 7.4.1.7 - Importação, segu
- Page 396 and 397:
Tabela 7.4.1.7 - Importação, segu
- Page 398 and 399:
Tabela 7.4.1.7 - Importação, segu
- Page 400 and 401:
Tabela 7.4.2.2 - Reservas internaci
- Page 402 and 403:
Tabela 7.4.2.4 - Serviços do balan
- Page 404 and 405:
Tabela 7.4.3.1 - Taxa média de câ
- Page 406 and 407:
São calculadas séries de índices
- Page 408 and 409:
Tabela 7.5.1.2 - Produto Interno Br
- Page 410 and 411:
Tabela 7.5.1.5 - Principais relaç
- Page 412 and 413:
aposentadorias, pensões etc. e as
- Page 414 and 415:
seção 7 Referências Agregados ma
- Page 416 and 417:
ver também Agropecuária ver tamb
- Page 418 and 419:
Banco Central do Brasil moeda estra
- Page 420 and 421:
Carne ver Indústria de produtos al
- Page 422 and 423:
custo médio do metro quadrado, 6-1
- Page 424 and 425:
2-82 crianças e adolescentes, 2-81
- Page 426 and 427:
FBCF ver Formação Bruta de Capita
- Page 428 and 429:
migração, 2-37, 2-38, 2-39 não c
- Page 430 and 431:
valor da produção, 4-10, 4-15 da
- Page 432 and 433:
água, 1-31, 1-32 energia, 1-31, 1-
- Page 434 and 435:
eceita, 4-10, 4-15 salários e outr
- Page 436 and 437:
comércio atacadista, 5-9 varejista
- Page 438 and 439:
famílias, 2-34 mortalidade infanti
- Page 440 and 441:
idade, 2-34 sexo, 2-34 renda, 2-34
- Page 442 and 443:
ver também sob o nome específico
- Page 444 and 445:
Sabão ver Indústria química Sal
- Page 446 and 447:
ver também Indústria de material
- Page 448 and 449:
Relação das fontes Na elaboraçã
- Page 450 and 451:
21241-051 - Rio de Janeiro Tel.: (2
- Page 452 and 453:
1.3.4.2 - Municípios, total, com C
- Page 454 and 455:
2.1.3.3 - Esperança de vida ao nas
- Page 456 and 457:
e as Unidades da Federação - 2010
- Page 458 and 459:
3.3.1.3 - Áreas plantada e colhida
- Page 460 and 461:
4.1.2.18 - Vendas de defensivos agr
- Page 462 and 463:
no varejo ampliado ano, segundo as
- Page 464 and 465:
Principais características das pes
- Page 466:
Equipe técnica Editora Wasmália B