75. PRODUSUL INTERN BRUT, PE CATEGORII DE RESURSE – serie brutăGROSS DOMESTIC PRODUCT, BY CATEGORY OF RESOURCES – unadjusted series- milioane lei preţuri curente – continuare - - lei million current prices – continued -Anii trim. I trim. II trim. III trim. IV total anYears 1 st quarter 2 nd quarter 3 rd quarter 4 th quarter total yearActivităţi profesionale; ştiinţifice şi tehnice;activităţi <strong>de</strong> servicii administrativeşi activităţi <strong>de</strong> servicii suport 2011 5860,8 7110,9 8424,7 9203,4 30599,8Professional, scientific and technical 2012 5815,3 8339,0 9786,5 10479,5 34420,3activities; activities of administrative <strong>2013</strong> 6396,6services and of support servicesAdministraţie publică şi apărare; asigurărisociale din sistemul public; învăţământ;sănătate şi asistenţă socială 2011 13666,6 13960,8 13562,2 13920,6 55110,2Public administration and <strong>de</strong>fence; social 2012 15083,5 12900,3 16272,7 16810,5 61067,0insurance of public sector; education; <strong>2013</strong> 17714,6health and social assistanceActivităţi <strong>de</strong> spectacole, culturale şirecreative; reparaţii <strong>de</strong> produse <strong>de</strong> uz casnicşi alte servicii 2011 3507,2 3146,1 3971,9 3760,1 14385,3Shows, culture and recreation activities; 2012 3691,9 3370,7 4214,0 4052,6 15329,2repair of household goods and other services <strong>2013</strong> 3984,2Valoarea adăugată brută – total 2011 93965,2 112041,4 136506,1 144814,1 487326,8Gross value ad<strong>de</strong>d – total 2012 97703,6 118863,8 144917,3 152318,1 513802,8<strong>2013</strong> 105053,9Impozite nete pe produs 1) 2011 14251,2 17117,7 17619,7 20393,0 69381,6Net taxes on product 1) 2012 15115,4 18934,6 19857,5 19789,1 73696,6<strong>2013</strong> 16393,8Notă: 2011 – an şi trimestre: date semi<strong>de</strong>finitive; 2012 – an şi trimestre: date provizorii (2); <strong>2013</strong> - trimestrul I: date provizorii.N ote: 2011 – year and quarters: semi - final data; 2012 – year and quarters: provisional data (2); <strong>2013</strong> - first quarter: provisional data.1) Reprezintă diferenţa dintre impozitele pe produs datorate la bugetul <strong>de</strong> stat (TVA, accize, alte impozite) şi subvenţiile pe produs plătite <strong>de</strong> la bugetul <strong>de</strong> stat.Represents the balance between taxes on product to be paid to the state budget (VAT, excise duties, other taxes) and subsidies on product paid from thestate budget.137
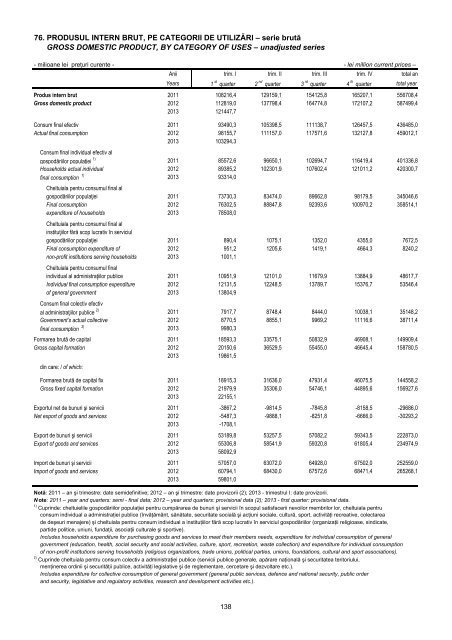
76. PRODUSUL INTERN BRUT, PE CATEGORII DE UTILIZĂRI – serie brutăGROSS DOMESTIC PRODUCT, BY CATEGORY OF USES – unadjusted series- milioane lei preţuri curente - - lei million current prices –Anii trim. I trim. II trim. III trim. IV total anYears 1 st quarter 2 nd quarter 3 rd quarter 4 th quarter total yearProdus intern brut 2011 108216,4 129159,1 154125,8 165207,1 556708,4Gross domestic product 2012 112819,0 137798,4 164774,8 172107,2 587499,4<strong>2013</strong> 121447,7Consum final efectiv 2011 93490,3 105398,5 111138,7 126457,5 436485,0Actual final consumption 2012 98155,7 111157,0 117571,6 132127,8 459012,1<strong>2013</strong> 103294,3Consum final individual efectiv algospodăriilor populaţiei 1) 2011 85572,6 96650,1 102694,7 116419,4 401336,8Households actual individual 2012 89385,2 102301,9 107602,4 121011,2 420300,7final consumption 1) <strong>2013</strong> 93314,0Cheltuiala pentru consumul final algospodăriilor populaţiei 2011 73730,3 83474,0 89662,8 98179,5 345046,6Final consumption 2012 76302,5 88847,8 92393,6 100970,2 358514,1expenditure of households <strong>2013</strong> 78508,0Cheltuiala pentru consumul final alinstituţiilor fără scop lucrativ în serviciulgospodăriilor populaţiei 2011 890,4 1075,1 1352,0 4355,0 7672,5Final consumption expenditure of 2012 951,2 1205,6 1419,1 4664,3 8240,2non-profit institutions serving households <strong>2013</strong> 1001,1Cheltuiala pentru consumul finalindividual al administraţiilor publice 2011 10951,9 12101,0 11679,9 13884,9 48617,7Individual final consumption expenditure 2012 12131,5 12248,5 13789,7 15376,7 53546,4of general government <strong>2013</strong> 13804,9Consum final colectiv efectival administraţiilor publice 2) 2011 7917,7 8748,4 8444,0 10038,1 35148,2Government’s actual collective 2012 8770,5 8855,1 9969,2 11116,6 38711,4final consumption 2) <strong>2013</strong> 9980,3Formarea brută <strong>de</strong> capital 2011 18593,3 33575,1 50832,9 46908,1 149909,4Gross capital formation 2012 20150,6 36529,5 55455,0 46645,4 158780,5<strong>2013</strong> 19861,5din care: / of which:Formarea brută <strong>de</strong> capital fix 2011 18915,3 31636,0 47931,4 46075,5 144558,2Gross fixed capital formation 2012 21979,9 35306,0 54746,1 44895,6 156927,6<strong>2013</strong> 22155,1Exportul net <strong>de</strong> bunuri şi servicii 2011 -3867,2 -9814,5 -7845,8 -8158,5 -29686,0Net export of goods and services 2012 -5487,3 -9888,1 -8251,8 -6666,0 -30293,2<strong>2013</strong> -1708,1Export <strong>de</strong> bunuri şi servicii 2011 53189,8 53257,5 57082,2 59343,5 222873,0Export of goods and services 2012 55306,8 58541,9 59320,8 61805,4 234974,9<strong>2013</strong> 58092,9Import <strong>de</strong> bunuri şi servicii 2011 57057,0 63072,0 64928,0 67502,0 252559,0Import of goods and services 2012 60794,1 68430,0 67572,6 68471,4 265268,1<strong>2013</strong> 59801,0Notă: 2011 – an şi trimestre: date semi<strong>de</strong>finitive; 2012 – an şi trimestre: date provizorii (2); <strong>2013</strong> - trimestrul I: date provizorii.N ote: 2011 – year and quarters: semi - final data; 2012 – year and quarters: provisional data (2); <strong>2013</strong> - first quarter: provisional data.1) Cuprin<strong>de</strong>: cheltuielile gospodăriilor populaţiei pentru cumpărarea <strong>de</strong> bunuri şi servicii în scopul satisfacerii nevoilor membrilor lor, cheltuiala pentruconsum individual a administraţiei publice (învăţământ, sănătate, securitate socială şi acţiuni sociale, cultură, sport, activităţi recreative, colectarea<strong>de</strong> <strong>de</strong>şeuri menajere) şi cheltuiala pentru consum individual a instituţiilor fără scop lucrativ în serviciul gospodăriilor (organizaţii religioase, sindicate,parti<strong>de</strong> politice, uniuni, fundaţii, asociaţii culturale şi sportive).Inclu<strong>de</strong>s households expenditure for purchasing goods and services to meet their members needs, expenditure for individual consumption of generalgovernment (education, health, social security and social activities, culture, sport, recreation, waste collection) and expenditure for individual consumptionof non-profit institutions serving households (religious organizations, tra<strong>de</strong> unions, political parties, unions, foundations, cultural and sport associations).2) Cuprin<strong>de</strong> cheltuiala pentru consum colectiv a administraţiei publice (servicii publice generale, apărare naţională şi securitatea teritoriului,menţinerea ordinii şi securităţii publice, activităţi legislative şi <strong>de</strong> reglementare, cercetare şi <strong>de</strong>zvoltare etc.).Inclu<strong>de</strong>s expenditure for collective consumption of general government (general public services, <strong>de</strong>fence and national security, public or<strong>de</strong>rand security, legislative and regulatory activities, research and <strong>de</strong>velopment activities etc.).138
- Page 2 and 3:
Institutul Naţional de Statistică
- Page 4 and 5:
ISSN 2066 - 0693ISSN-L 1223 -7507BU
- Page 6 and 7:
PaginaPageCOMERŢ INTERIOR ........
- Page 8 and 9:
PaginaPageIndicii produsului intern
- Page 10 and 11:
Indicii de preţ ai valorii adăuga
- Page 13 and 14:
B. Evoluţii sectorialeB. Sector ev
- Page 15 and 16:
În luna aprilie 2013, indicele val
- Page 17 and 18:
4. Comerţ şi servicii * )4.1. Com
- Page 19 and 20:
euro), valoarea acestora fiind mai
- Page 21 and 22:
7. Câştiguri salarialeCâştigul
- Page 23 and 24:
Rata locurilor de muncă vacante î
- Page 25 and 26:
INDUSTRIE; INVESTIŢII; CONSTRUCŢI
- Page 27 and 28:
1. INDICII PRODUCŢIEI INDUSTRIALE
- Page 29 and 30:
2. INDICII PRODUCŢIEI INDUSTRIALE
- Page 31 and 32:
2. INDICII PRODUCŢIEI INDUSTRIALE
- Page 33 and 34:
3. INDICII PRODUCŢIEI INDUSTRIALE
- Page 35 and 36:
4. INDICII PRODUCŢIEI INDUSTRIALE
- Page 37 and 38:
4. INDICII PRODUCŢIEI INDUSTRIALE
- Page 39 and 40:
5. INDICII PRODUCTIVITĂŢII MUNCII
- Page 41 and 42:
5. INDICII PRODUCTIVITĂŢII MUNCII
- Page 43 and 44:
6. INDICII PRODUCTIVITĂŢII MUNCII
- Page 45 and 46:
7. INDICII VALORICI AI CIFREI DE AF
- Page 47 and 48:
7. INDICII VALORICI AI CIFREI DE AF
- Page 49 and 50:
8. INDICII VALORICI AI CIFREI DE AF
- Page 51 and 52:
9. INDICII VALORICI AI COMENZILOR N
- Page 53 and 54:
11. INDICII PREŢURILOR PRODUCŢIEI
- Page 55 and 56:
11. INDICII PREŢURILOR PRODUCŢIEI
- Page 57 and 58:
12. INDICII PREŢURILOR PRODUCŢIEI
- Page 59 and 60:
13. PRINCIPALELE RESURSE DE ENERGIE
- Page 61 and 62:
P/P201215. INDICII INVESTIŢIILOR R
- Page 63 and 64:
Investiţiile realizate în economi
- Page 65 and 66:
20. AUTORIZAŢII DE CONSTRUIRE ELIB
- Page 67 and 68:
22. LOCUINŢE TERMINATE, PE SURSE D
- Page 69 and 70:
23. NUMĂRUL ANIMALELOR SACRIFICATE
- Page 71 and 72:
COMERŢ INTERIORDOMESTIC TRADE
- Page 73 and 74:
PVOLUME)P27. INDICII VOLUMULUI CIFR
- Page 75 and 76:
PVOLUME)P29. INDICII VOLUMULUI CIFR
- Page 77 and 78:
PVOLUME)P31. INDICII VOLUMULUI CIFR
- Page 79 and 80:
Indicii volumului cifrei de afaceri
- Page 81 and 82:
PVALUE35. INDICII VALORICI AI CIFRE
- Page 83 and 84:
36. COMERŢUL INTERNAŢIONAL CU BUN
- Page 85 and 86:
39. COMERŢUL INTERNAŢIONAL CU BUN
- Page 87 and 88:
SERVICIISERVICES
- Page 89 and 90: PVALUE42. INDICII VALORICI AI CIFRE
- Page 91 and 92: P2011P201244. TRANSPORTUL DE PASAGE
- Page 93 and 94: 46. TRANSPORTUL PORTUAR DE MĂRFURI
- Page 95 and 96: P48. ÎNMATRICULĂRI NOI DE VEHICUL
- Page 97 and 98: 50. ÎNNOPTĂRI ÎN PRINCIPALELE ST
- Page 99 and 100: 52. SOSIRILE VIZITATORILOR STRĂINI
- Page 101 and 102: 54. EFECTIVUL SALARIAŢILOR DIN ECO
- Page 103 and 104: 54. EFECTIVUL SALARIAŢILOR DIN ECO
- Page 105 and 106: 55. CÂŞTIGUL SALARIAL MEDIU BRUT
- Page 107 and 108: 55. CÂŞTIGUL SALARIAL MEDIU BRUT
- Page 109 and 110: 56. CÂŞTIGUL SALARIAL MEDIU NET *
- Page 111 and 112: 56. CÂŞTIGUL SALARIAL MEDIU NET *
- Page 113 and 114: 57. CÂŞTIGURILE SALARIALE NOMINAL
- Page 115 and 116: 57. CÂŞTIGURILE SALARIALE NOMINAL
- Page 117 and 118: 58. CÂŞTIGURILE SALARIALE MEDII O
- Page 119 and 120: 58. CÂŞTIGURILE SALARIALE MEDII O
- Page 121 and 122: 59. INDICII TRIMESTRIALI AI COSTULU
- Page 123 and 124: 59. INDICII TRIMESTRIALI AI COSTULU
- Page 125 and 126: Evoluţia indicilor preţurilor de
- Page 127 and 128: iun60. INDICII PREŢURILOR DE CONSU
- Page 129 and 130: 64. NUMĂRUL ŞOMERILOR ÎNREGISTRA
- Page 131 and 132: iun66. NUMĂRUL ŞOMERILOR ÎNREGIS
- Page 133 and 134: Rata şomajului în perioada aprili
- Page 135 and 136: 72. NUMĂRUL ŞI RATA LOCURILOR DE
- Page 137 and 138: iun74. MIŞCAREA NATURALĂ A POPULA
- Page 139: 75. PRODUSUL INTERN BRUT, PE CATEGO
- Page 143 and 144: 78. INDICII PRODUSULUI INTERN BRUT,
- Page 145 and 146: 79. INDICII PRODUSULUI INTERN BRUT,
- Page 147 and 148: 81. PRODUSUL INTERN BRUT, PE CATEGO
- Page 149 and 150: 83. INDICII PRODUSULUI INTERN BRUT,
- Page 151 and 152: 84. AGREGATELE MACROECONOMICE ALE S
- Page 153 and 154: 84. AGREGATELE MACROECONOMICE ALE S
- Page 155 and 156: 84. AGREGATELE MACROECONOMICE ALE S
- Page 157 and 158: 85. POPULAŢIA OCUPATĂ, PE ACTIVIT
- Page 159 and 160: 86. ORE LUCRATE DE POPULAŢIA OCUPA
- Page 161 and 162: 87. ÎNMATRICULĂRI DE SOCIETĂŢI
- Page 163 and 164: 89. ÎNMATRICULĂRI DE SOCIETĂŢI
- Page 165 and 166: 91. PRINCIPALII INDICATORI AI PIEŢ
- Page 167 and 168: 93. EXECUŢIA BUGETELOR LOCALEEXECU
- Page 169 and 170: 96. EXECUŢIA BUGETULUI FONDULUI NA
- Page 171 and 172: • În Buletinul Statistic Lunar s
- Page 173 and 174: Industria energetică cuprinde urm
- Page 175 and 176: Cifra de afaceri reprezintă venitu
- Page 177 and 178: Indicele preţurilor producţiei in
- Page 179 and 180: ENERGIEENERGYResursele de energie p
- Page 181 and 182: CONSTRUCŢIICONSTRUCTIONValoarea lu
- Page 183 and 184: Autorizaţia de construire se elibe
- Page 185 and 186: Randamentul mediu se calculează ca
- Page 187 and 188: Stabilirea modelelor de regresie fo
- Page 189 and 190: Repartizarea pe ţări a schimburil
- Page 191 and 192:
2010. Ponderile utilizate la agrega
- Page 193 and 194:
împărţirea numărului total de
- Page 195 and 196:
salariaţilor reprezintă o medie a
- Page 197 and 198:
Cheltuielile directe cu forţa de m
- Page 199 and 200:
PREŢURIIndicele preţurilor de con
- Page 201 and 202:
Această rată se calculează ca un
- Page 203 and 204:
Conform Ordonanţei de Urgenţă nr
- Page 205 and 206:
Cele două seturi de indicatori sta
- Page 207 and 208:
Divorţul reprezintă desfacerea un
- Page 209 and 210:
SPI = subvenţii pe producţie şi
- Page 211 and 212:
producţie, precum şi valoarea ser
- Page 213:
BVB (cu excepţia SIF).Metoda de ca