
Create successful ePaper yourself
Turn your PDF publications into a flip-book with our unique Google optimized e-Paper software.
semilogy - Semi-log scale plot.<br />
polar - Polar coordinate plot.<br />
plotyy - Graphs with y tick labels on the left and right.<br />
Axis control.<br />
axis - Control axis scaling and appearance.<br />
zoom - Zoom in and out on a 2-D plot.<br />
grid - Grid lines.<br />
box - Axis box.<br />
hold - Hold current graph.<br />
axes - Create axes in arbitrary positions.<br />
subplot - Create axes in tiled positions.<br />
Graph annotation.<br />
legend - Graph legend.<br />
title - Graph title.<br />
xlabel - X-axis label.<br />
ylabel - Y-axis label.<br />
text - Text annotation.<br />
gtext - Place text with mouse.<br />
Hardcopy and printing.<br />
print - Print graph or SIMULINK system; or save graph to Mfile.<br />
printopt - Printer defaults.<br />
orient - Set paper orientation.<br />
See also GRAPH3D, SPECGRAPH.<br />
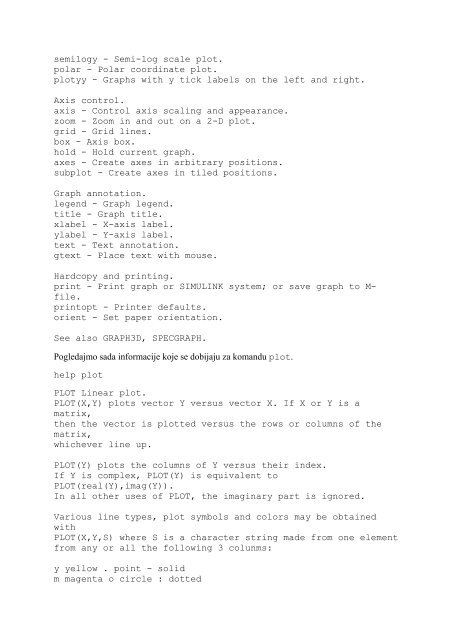
Pogledajmo sada informacije koje se dobijaju <strong>za</strong> komandu plot.<br />
help plot<br />
PLOT Linear plot.<br />
PLOT(X,Y) plots vector Y versus vector X. If X or Y is a<br />
matrix,<br />
then the vector is plotted versus the rows or columns of the<br />
matrix,<br />
whichever line up.<br />
PLOT(Y) plots the columns of Y versus their index.<br />
If Y is complex, PLOT(Y) is equivalent to<br />
PLOT(real(Y),imag(Y)).<br />
In all other uses of PLOT, the imaginary part is ignored.<br />
Various line types, plot symbols and colors may be obtained<br />
with<br />
PLOT(X,Y,S) where S is a character string made from one element<br />
from any or all the following 3 colunms:<br />
y yellow . point - solid<br />
m magenta o circle : dotted