BANANA (latundan): Volume of Production in Metric Tons ... - pcaarrd
BANANA (latundan): Volume of Production in Metric Tons ... - pcaarrd
BANANA (latundan): Volume of Production in Metric Tons ... - pcaarrd

You also want an ePaper? Increase the reach of your titles
YUMPU automatically turns print PDFs into web optimized ePapers that Google loves.
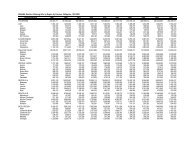
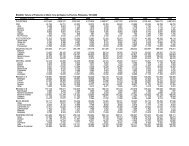
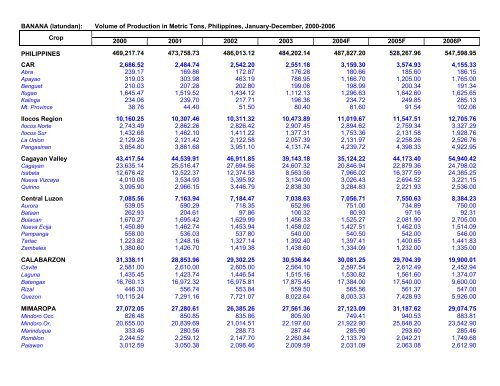
<strong>BANANA</strong> (<strong>latundan</strong>): <strong>Volume</strong> <strong>of</strong> <strong>Production</strong> <strong>in</strong> <strong>Metric</strong> <strong>Tons</strong>, Philipp<strong>in</strong>es, January-December, 2000-2006<br />
Crop<br />
2000 2001 2002 2003 2004F 2005F 2006P<br />
PHILIPPINES 469,217.74 473,758.73 486,013.12 484,202.14 487,827.20 528,267.96 547,598.95<br />
CAR 2,686.52 2,484.74 2,542.20 2,551.18 3,159.30 3,574.93 4,155.33<br />
Abra 239.17 169.86 172.87 176.28 180.66 185.60 186.15<br />
Apayao 319.03 303.98 463.19 786.95 1,166.70 1,205.00 1,765.00<br />
Benguet 210.03 207.28 202.80 199.06 198.99 200.34 191.34<br />
Ifugao 1,645.47 1,519.52 1,434.12 1,112.13 1,296.63 1,642.60 1,625.65<br />
Kal<strong>in</strong>ga 234.06 239.70 217.71 196.36 234.72 249.85 285.13<br />
Mt. Prov<strong>in</strong>ce 38.76 44.40 51.50 80.40 81.60 91.54 102.06<br />
Ilocos Region 10,160.25 10,307.46 10,311.32 10,473.89 11,019.67 11,547.51 12,705.76<br />
Ilocos Norte 2,743.49 2,862.26 2,826.42 2,907.45 2,894.62 2,759.34 3,327.29<br />
Ilocos Sur 1,432.68 1,462.10 1,411.22 1,377.31 1,753.36 2,131.58 1,928.76<br />
La Union 2,129.28 2,121.42 2,122.58 2,057.39 2,131.97 2,258.26 2,526.76<br />
Pangas<strong>in</strong>an 3,854.80 3,861.68 3,951.10 4,131.74 4,239.72 4,398.33 4,922.95<br />
Cagayan Valley 43,417.54 44,539.91 46,911.85 39,143.18 35,124.22 44,173.40 54,940.42<br />
Cagayan 23,635.14 25,516.47 27,694.56 24,607.32 20,846.94 22,879.36 24,798.02<br />
Isabela 12,676.42 12,522.37 12,374.58 8,563.56 7,966.02 16,377.59 24,385.25<br />
Nueva Vizcaya 4,010.08 3,534.93 3,395.92 3,134.00 3,026.43 2,694.52 3,221.15<br />
Quir<strong>in</strong>o 3,095.90 2,966.15 3,446.79 2,838.30 3,284.83 2,221.93 2,536.00<br />
Central Luzon 7,085.56 7,163.94 7,184.47 7,038.63 7,056.71 7,550.63 8,384.23<br />
Aurora 539.05 590.29 718.35 652.96 751.00 734.89 750.00<br />
Bataan 262.93 204.61 97.86 100.32 80.93 97.16 92.31<br />
Bulacan 1,670.27 1,695.42 1,629.99 1,456.33 1,525.27 2,081.90 2,705.00<br />
Nueva Ecija 1,450.89 1,462.74 1,453.94 1,458.02 1,427.51 1,462.03 1,514.09<br />
Pampanga 558.00 536.03 537.80 540.00 540.50 542.00 546.00<br />
Tarlac 1,223.82 1,248.16 1,327.14 1,392.40 1,397.41 1,400.65 1,441.83<br />
Zambales 1,380.60 1,426.70 1,419.38 1,438.60 1,334.09 1,232.00 1,335.00<br />
CALABARZON 31,338.11 28,853.96 29,302.25 30,536.84 30,081.25 29,704.39 19,900.01<br />
Cavite 2,581.00 2,610.00 2,605.00 2,564.10 2,597.54 2,612.49 2,452.94<br />
Laguna 1,435.45 1,423.74 1,446.54 1,515.16 1,530.82 1,561.60 1,374.07<br />
Batangas 16,760.13 16,972.32 16,975.81 17,875.45 17,384.00 17,540.00 9,600.00<br />
Rizal 446.30 556.74 553.84 559.50 565.56 561.37 547.00<br />
Quezon 10,115.24 7,291.16 7,721.07 8,022.64 8,003.33 7,428.93 5,926.00<br />
MIMAROPA 27,072.05 27,280.61 26,385.26 27,561.36 27,123.09 31,187.62 29,074.75<br />
M<strong>in</strong>doro Occ. 826.48 850.85 835.86 805.90 749.41 940.53 883.81<br />
M<strong>in</strong>doro Or. 20,655.00 20,839.69 21,014.51 22,197.60 21,922.90 25,848.20 23,542.90<br />
Mar<strong>in</strong>duque 333.46 280.56 288.73 287.44 285.90 293.60 285.46<br />
Romblon 2,244.52 2,259.12 2,147.70 2,260.84 2,133.79 2,042.21 1,749.68<br />
Palawan 3,012.59 3,050.38 2,098.46 2,009.59 2,031.09 2,063.08 2,612.90
<strong>BANANA</strong> (<strong>latundan</strong>): <strong>Volume</strong> <strong>of</strong> <strong>Production</strong> <strong>in</strong> <strong>Metric</strong> <strong>Tons</strong>, Philipp<strong>in</strong>es, January-December, 2000-2006<br />
Crop<br />
2000 2001 2002 2003 2004F 2005F 2006P<br />
Bicol Region 14,234.86 13,784.97 15,059.40 16,197.69 15,116.71 14,943.37 13,948.09<br />
Albay 3,346.53 3,147.57 3,281.88 3,492.20 3,261.07 3,232.12 3,027.03<br />
Camar<strong>in</strong>es Norte 702.42 463.14 648.94 732.57 792.25 684.20 702.26<br />
Camar<strong>in</strong>es Sur 8,242.57 8,183.24 8,833.97 9,526.64 8,783.35 8,523.91 7,811.06<br />
Catanduanes 291.60 239.39 273.43 286.72 229.49 245.32 263.94<br />
Masbate 476.62 606.80 601.30 602.12 603.20 608.55 613.03<br />
Sorsogon 1,175.12 1,144.83 1,419.89 1,557.44 1,447.35 1,649.27 1,530.77<br />
Western Visayas 37,177.53 37,409.89 37,194.43 36,983.25 39,068.28 45,236.79 50,098.04<br />
Aklan 6,721.21 6,818.20 6,885.02 7,042.64 7,996.91 8,614.03 9,280.02<br />
Antique 1,062.36 1,070.69 1,082.87 1,050.40 1,087.78 1,120.22 1,763.73<br />
Capiz 723.25 723.75 733.09 703.81 728.29 1,054.26 1,225.77<br />
Guimaras 290.80 294.85 286.37 281.88 306.22 309.59 327.46<br />
Iloilo 22,210.85 22,280.36 22,051.96 22,106.49 22,421.95 27,124.82 27,689.06<br />
Negros Occ. 6,169.07 6,222.05 6,155.13 5,798.04 6,527.13 7,013.87 9,812.00<br />
Central Visayas 25,015.46 23,487.75 22,743.74 23,431.93 26,586.48 23,097.18 28,573.01<br />
Bohol 2,616.07 2,365.76 2,073.24 2,285.61 2,412.81 2,325.84 4,741.91<br />
Cebu 8,510.13 7,330.35 7,171.02 7,262.81 8,243.09 7,877.42 9,150.99<br />
Negros Or. 11,619.40 11,500.07 11,276.57 11,670.00 13,563.26 11,041.70 12,624.07<br />
Siquijor 2,269.86 2,291.57 2,222.91 2,213.51 2,367.32 1,852.23 2,056.04<br />
Eastern Visayas 21,689.89 21,968.79 22,292.75 22,711.46 23,032.48 23,815.22 24,047.84<br />
Biliran 2,321.65 2,330.47 2,339.82 2,437.72 2,559.66 2,785.00 2,809.00<br />
Eastern Samar 623.71 628.00 651.28 652.77 659.95 687.96 717.83<br />
Leyte 4,710.96 4,861.35 5,021.20 5,175.09 5,352.04 5,457.32 5,840.34<br />
Northern Samar 1,741.01 1,804.40 1,837.10 1,872.60 1,895.15 2,308.11 2,366.20<br />
Southern Leyte 8,024.61 8,033.94 8,025.08 8,092.53 8,324.89 8,335.70 8,336.90<br />
Western Samar 4,267.95 4,310.63 4,418.27 4,480.75 4,240.79 4,241.13 3,977.57<br />
Zamboanga Pen<strong>in</strong>sula 20,686.04 21,880.76 23,331.60 23,270.12 25,331.59 35,489.70 33,451.25<br />
Zamboanga City 3,366.01 3,489.43 3,582.78 3,539.24 5,243.52 7,676.89 7,667.75<br />
Zamboanga Norte 8,786.03 8,888.30 10,118.06 10,275.98 10,549.96 12,841.40 13,324.58<br />
Zamboanga Sur 8,534.00 5,986.91 6,133.47 5,933.35 5,995.84 7,656.19 6,856.36<br />
Sibugay - 3,516.12 3,497.29 3,521.56 3,542.27 7,315.22 5,602.57<br />
Northern M<strong>in</strong>danao 87,865.50 89,377.85 93,011.76 92,937.67 94,336.20 93,602.14 100,333.87<br />
Bukidnon 2,144.98 2,179.45 2,123.26 2,230.61 2,220.72 2,207.03 2,273.20<br />
Camigu<strong>in</strong> 1,126.82 1,073.45 1,031.13 1,028.47 1,047.00 1,027.00 889.84<br />
Lanao Norte 28,201.99 29,342.53 30,302.17 27,855.37 23,199.85 23,203.90 23,382.92<br />
Misamis Occ. 3,150.70 3,136.76 3,165.40 3,176.46 3,609.33 3,690.88 4,143.54<br />
Misamis Or. 53,241.01 53,645.65 56,389.79 58,646.76 64,259.30 63,473.33 69,644.37
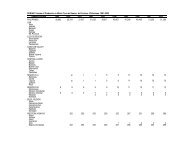
<strong>BANANA</strong> (<strong>latundan</strong>): <strong>Volume</strong> <strong>of</strong> <strong>Production</strong> <strong>in</strong> <strong>Metric</strong> <strong>Tons</strong>, Philipp<strong>in</strong>es, January-December, 2000-2006<br />
Crop<br />
2000 2001 2002 2003 2004F 2005F 2006P<br />
Davao Region 40,957.92 46,178.50 47,809.09 48,507.97 50,208.82 55,271.98 57,310.60<br />
Compostela Valley 1,302.56 1,332.84 1,403.77 1,690.35 2,055.95 2,689.31 2,783.81<br />
Davao City 6,152.97 8,099.66 8,524.26 8,858.01 9,335.50 10,331.28 10,101.27<br />
Davao Norte 1,140.52 1,398.31 1,595.21 1,912.54 2,150.49 2,867.16 3,370.22<br />
Davao Or. 3,609.17 3,698.17 3,695.38 3,831.51 3,944.23 4,419.53 4,684.16<br />
Davao Sur 28,752.70 31,649.52 32,590.47 32,215.56 32,722.65 34,964.70 36,371.14<br />
SOCCSKSARGEN 34,854.15 34,238.40 36,055.44 36,455.06 34,847.24 42,728.54 42,595.09<br />
North Cotabato 14,606.40 14,723.90 16,982.97 18,073.33 19,383.27 24,890.20 26,382.02<br />
Saranggani 11,881.94 10,917.29 10,693.05 9,996.50 7,248.80 9,739.39 10,928.75<br />
South Cotabato 6,168.65 6,216.94 6,075.09 6,105.01 6,112.89 5,981.73 5,795.94<br />
Sultan Kudarat 2,197.16 2,380.28 2,304.34 2,280.22 2,102.28 2,117.22 2,312.14<br />
CARAGA 42,216.19 42,193.69 42,433.19 42,861.73 42,894.15 44,235.17 46,346.68<br />
Agusan Norte 11,457.20 11,280.77 11,711.08 12,559.12 12,772.40 13,069.30 13,375.00<br />
Agusan Sur 22,350.46 22,700.32 23,139.34 22,792.61 22,685.75 22,666.24 24,305.68<br />
Surigao Norte 2,009.00 1,804.00 1,492.00 1,440.00 1,309.00 1,226.00 1,196.00<br />
Surigao Sur 6,399.53 6,408.60 6,090.77 6,070.00 6,127.00 7,273.63 7,470.00<br />
ARMM 22,760.18 22,607.51 23,444.37 23,540.19 22,841.01 22,109.38 21,733.98<br />
Basilan 1,493.92 1,491.41 1,481.06 1,330.58 1,298.54 1,270.71 1,291.24<br />
Lanao Sur 11,828.50 12,075.33 11,329.25 11,408.24 11,110.67 10,464.77 10,144.90<br />
Magu<strong>in</strong>danao 4,774.96 4,551.15 6,100.48 6,296.49 5,850.00 5,726.22 5,610.00<br />
Sulu 1,563.01 1,550.48 1,545.27 1,500.60 1,504.19 1,514.29 1,517.61<br />
Tawi-Tawi 3,099.79 2,939.15 2,988.30 3,004.29 3,077.61 3,133.40 3,170.23<br />
Source: BAS data
<strong>BANANA</strong> (<strong>latundan</strong>): <strong>Volume</strong> <strong>of</strong> <strong>Production</strong> <strong>in</strong> <strong>Metric</strong> <strong>Tons</strong>, Philipp<strong>in</strong>es, January-December, 2000-2006<br />
Crop<br />
2000 2001 2002 2003 2004F 2005F 2006P<br />
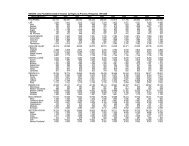
<strong>BANANA</strong> (<strong>latundan</strong>): <strong>Volume</strong> <strong>of</strong> <strong>Production</strong> <strong>in</strong> <strong>Metric</strong> <strong>Tons</strong>, Philipp<strong>in</strong>es, January-December, 2003-2006<br />
Crop<br />
2000 2001 2002 2003 2004F 2005F 2006P<br />
PHILIPPINES 469,217.74 473,758.73 486,013.12 484,202.14 487,827.20 528,267.96 547,598.95<br />
CAR 2,686.52 2,484.74 2,542.20 2,551.18 3,159.30 3,574.93 4,155.33<br />
Ilocos Region 10,160.25 10,307.46 10,311.32 10,473.89 11,019.67 11,547.51 12,705.76<br />
Cagayan Valley 43,417.54 44,539.91 46,911.85 39,143.18 35,124.22 44,173.40 54,940.42<br />
Central Luzon 7,085.56 7,163.94 7,184.47 7,038.63 7,056.71 7,550.63 8,384.23<br />
CALABARZON 31,338.11 28,853.96 29,302.25 30,536.84 30,081.25 29,704.39 19,900.01<br />
MIMAROPA 27,072.05 27,280.61 26,385.26 27,561.36 27,123.09 31,187.62 29,074.75<br />
Bicol Region 14,234.86 13,784.97 15,059.40 16,197.69 15,116.71 14,943.37 13,948.09<br />
Western Visayas 37,177.53 37,409.89 37,194.43 36,983.25 39,068.28 45,236.79 50,098.04<br />
Central Visayas 25,015.46 23,487.75 22,743.74 23,431.93 26,586.48 23,097.18 28,573.01<br />
Eastern Visayas 21,689.89 21,968.79 22,292.75 22,711.46 23,032.48 23,815.22 24,047.84<br />
Zamboanga Pen<strong>in</strong>sula 20,686.04 21,880.76 23,331.60 23,270.12 25,331.59 35,489.70 33,451.25<br />
Northern M<strong>in</strong>danao 87,865.50 89,377.85 93,011.76 92,937.67 94,336.20 93,602.14 100,333.87<br />
Davao Region 40,957.92 46,178.50 47,809.09 48,507.97 50,208.82 55,271.98 57,310.60<br />
SOCCSKSARGEN 34,854.15 34,238.40 36,055.44 36,455.06 34,847.24 42,728.54 42,595.09<br />
CARAGA 42,216.19 42,193.69 42,433.19 42,861.73 42,894.15 44,235.17 46,346.68<br />
ARMM 22,760.18 22,607.51 23,444.37 23,540.19 22,841.01 22,109.38 21,733.98<br />
Source: BAS data