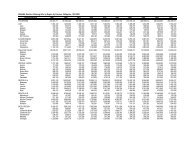
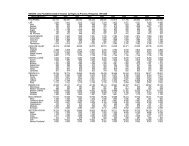
<strong>BANANA</strong> (<strong>latundan</strong>): <strong>Volume</strong> <strong>of</strong> <strong>Production</strong> <strong>in</strong> <strong>Metric</strong> <strong>Tons</strong>, Philipp<strong>in</strong>es, January-December, 2000-2006 Crop 2000 2001 2002 2003 2004F 2005F 2006P Bicol Region 14,234.86 13,784.97 15,059.40 16,197.69 15,116.71 14,943.37 13,948.09 Albay 3,346.53 3,147.57 3,281.88 3,492.20 3,261.07 3,232.12 3,027.03 Camar<strong>in</strong>es Norte 702.42 463.14 648.94 732.57 792.25 684.20 702.26 Camar<strong>in</strong>es Sur 8,242.57 8,183.24 8,833.97 9,526.64 8,783.35 8,523.91 7,811.06 Catanduanes 291.60 239.39 273.43 286.72 229.49 245.32 263.94 Masbate 476.62 606.80 601.30 602.12 603.20 608.55 613.03 Sorsogon 1,175.12 1,144.83 1,419.89 1,557.44 1,447.35 1,649.27 1,530.77 Western Visayas 37,177.53 37,409.89 37,194.43 36,983.25 39,068.28 45,236.79 50,098.04 Aklan 6,721.21 6,818.20 6,885.02 7,042.64 7,996.91 8,614.03 9,280.02 Antique 1,062.36 1,070.69 1,082.87 1,050.40 1,087.78 1,120.22 1,763.73 Capiz 723.25 723.75 733.09 703.81 728.29 1,054.26 1,225.77 Guimaras 290.80 294.85 286.37 281.88 306.22 309.59 327.46 Iloilo 22,210.85 22,280.36 22,051.96 22,106.49 22,421.95 27,124.82 27,689.06 Negros Occ. 6,169.07 6,222.05 6,155.13 5,798.04 6,527.13 7,013.87 9,812.00 Central Visayas 25,015.46 23,487.75 22,743.74 23,431.93 26,586.48 23,097.18 28,573.01 Bohol 2,616.07 2,365.76 2,073.24 2,285.61 2,412.81 2,325.84 4,741.91 Cebu 8,510.13 7,330.35 7,171.02 7,262.81 8,243.09 7,877.42 9,150.99 Negros Or. 11,619.40 11,500.07 11,276.57 11,670.00 13,563.26 11,041.70 12,624.07 Siquijor 2,269.86 2,291.57 2,222.91 2,213.51 2,367.32 1,852.23 2,056.04 Eastern Visayas 21,689.89 21,968.79 22,292.75 22,711.46 23,032.48 23,815.22 24,047.84 Biliran 2,321.65 2,330.47 2,339.82 2,437.72 2,559.66 2,785.00 2,809.00 Eastern Samar 623.71 628.00 651.28 652.77 659.95 687.96 717.83 Leyte 4,710.96 4,861.35 5,021.20 5,175.09 5,352.04 5,457.32 5,840.34 Northern Samar 1,741.01 1,804.40 1,837.10 1,872.60 1,895.15 2,308.11 2,366.20 Southern Leyte 8,024.61 8,033.94 8,025.08 8,092.53 8,324.89 8,335.70 8,336.90 Western Samar 4,267.95 4,310.63 4,418.27 4,480.75 4,240.79 4,241.13 3,977.57 Zamboanga Pen<strong>in</strong>sula 20,686.04 21,880.76 23,331.60 23,270.12 25,331.59 35,489.70 33,451.25 Zamboanga City 3,366.01 3,489.43 3,582.78 3,539.24 5,243.52 7,676.89 7,667.75 Zamboanga Norte 8,786.03 8,888.30 10,118.06 10,275.98 10,549.96 12,841.40 13,324.58 Zamboanga Sur 8,534.00 5,986.91 6,133.47 5,933.35 5,995.84 7,656.19 6,856.36 Sibugay - 3,516.12 3,497.29 3,521.56 3,542.27 7,315.22 5,602.57 Northern M<strong>in</strong>danao 87,865.50 89,377.85 93,011.76 92,937.67 94,336.20 93,602.14 100,333.87 Bukidnon 2,144.98 2,179.45 2,123.26 2,230.61 2,220.72 2,207.03 2,273.20 Camigu<strong>in</strong> 1,126.82 1,073.45 1,031.13 1,028.47 1,047.00 1,027.00 889.84 Lanao Norte 28,201.99 29,342.53 30,302.17 27,855.37 23,199.85 23,203.90 23,382.92 Misamis Occ. 3,150.70 3,136.76 3,165.40 3,176.46 3,609.33 3,690.88 4,143.54 Misamis Or. 53,241.01 53,645.65 56,389.79 58,646.76 64,259.30 63,473.33 69,644.37
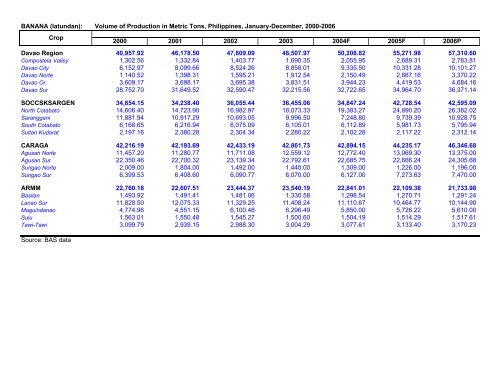
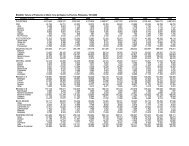
<strong>BANANA</strong> (<strong>latundan</strong>): <strong>Volume</strong> <strong>of</strong> <strong>Production</strong> <strong>in</strong> <strong>Metric</strong> <strong>Tons</strong>, Philipp<strong>in</strong>es, January-December, 2000-2006 Crop 2000 2001 2002 2003 2004F 2005F 2006P Davao Region 40,957.92 46,178.50 47,809.09 48,507.97 50,208.82 55,271.98 57,310.60 Compostela Valley 1,302.56 1,332.84 1,403.77 1,690.35 2,055.95 2,689.31 2,783.81 Davao City 6,152.97 8,099.66 8,524.26 8,858.01 9,335.50 10,331.28 10,101.27 Davao Norte 1,140.52 1,398.31 1,595.21 1,912.54 2,150.49 2,867.16 3,370.22 Davao Or. 3,609.17 3,698.17 3,695.38 3,831.51 3,944.23 4,419.53 4,684.16 Davao Sur 28,752.70 31,649.52 32,590.47 32,215.56 32,722.65 34,964.70 36,371.14 SOCCSKSARGEN 34,854.15 34,238.40 36,055.44 36,455.06 34,847.24 42,728.54 42,595.09 North Cotabato 14,606.40 14,723.90 16,982.97 18,073.33 19,383.27 24,890.20 26,382.02 Saranggani 11,881.94 10,917.29 10,693.05 9,996.50 7,248.80 9,739.39 10,928.75 South Cotabato 6,168.65 6,216.94 6,075.09 6,105.01 6,112.89 5,981.73 5,795.94 Sultan Kudarat 2,197.16 2,380.28 2,304.34 2,280.22 2,102.28 2,117.22 2,312.14 CARAGA 42,216.19 42,193.69 42,433.19 42,861.73 42,894.15 44,235.17 46,346.68 Agusan Norte 11,457.20 11,280.77 11,711.08 12,559.12 12,772.40 13,069.30 13,375.00 Agusan Sur 22,350.46 22,700.32 23,139.34 22,792.61 22,685.75 22,666.24 24,305.68 Surigao Norte 2,009.00 1,804.00 1,492.00 1,440.00 1,309.00 1,226.00 1,196.00 Surigao Sur 6,399.53 6,408.60 6,090.77 6,070.00 6,127.00 7,273.63 7,470.00 ARMM 22,760.18 22,607.51 23,444.37 23,540.19 22,841.01 22,109.38 21,733.98 Basilan 1,493.92 1,491.41 1,481.06 1,330.58 1,298.54 1,270.71 1,291.24 Lanao Sur 11,828.50 12,075.33 11,329.25 11,408.24 11,110.67 10,464.77 10,144.90 Magu<strong>in</strong>danao 4,774.96 4,551.15 6,100.48 6,296.49 5,850.00 5,726.22 5,610.00 Sulu 1,563.01 1,550.48 1,545.27 1,500.60 1,504.19 1,514.29 1,517.61 Tawi-Tawi 3,099.79 2,939.15 2,988.30 3,004.29 3,077.61 3,133.40 3,170.23 Source: BAS data