ABI-2015
ABI-2015
ABI-2015

Create successful ePaper yourself
Turn your PDF publications into a flip-book with our unique Google optimized e-Paper software.
Turnover<br />
(£million)<br />
Approximat<br />
e Gross<br />
Value Added<br />
(aGVA)<br />
(£million)<br />
Purchases<br />
(£million)<br />
Employment<br />
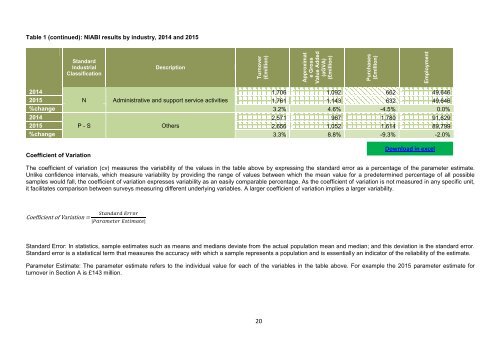
Table 1 (continued): NI<strong>ABI</strong> results by industry, 2014 and <strong>2015</strong><br />
Standard<br />
Industrial<br />
Classification<br />
Description<br />
2014<br />
1,706 1,092 662 49,646<br />
<strong>2015</strong> N Administrative and support service activities<br />
1,761 1,143 632 49,646<br />
%change 3.2% 4.6% -4.5% 0.0%<br />
2014<br />
2,571 967 1,780 91,629<br />
<strong>2015</strong> P - S<br />
Others<br />
2,656 1,052 1,614 89,799<br />
%change 3.3% 8.8% -9.3% -2.0%<br />
Coefficient of Variation<br />
Download in excel<br />
The coefficient of variation (cv) measures the variability of the values in the table above by expressing the standard error as a percentage of the parameter estimate.<br />
Unlike confidence intervals, which measure variability by providing the range of values between which the mean value for a predetermined percentage of all possible<br />
samples would fall, the coefficient of variation expresses variability as an easily comparable percentage. As the coefficient of variation is not measured in any specific unit,<br />
it facilitates comparison between surveys measuring different underlying variables. A larger coefficient of variation implies a larger variability.<br />
Coefficient of Variation =<br />
Standard Error: In statistics, sample estimates such as means and medians deviate from the actual population mean and median; and this deviation is the standard error.<br />
Standard error is a statistical term that measures the accuracy with which a sample represents a population and is essentially an indicator of the reliability of the estimate.<br />
Parameter Estimate: The parameter estimate refers to the individual value for each of the variables in the table above. For example the <strong>2015</strong> parameter estimate for<br />
turnover in Section A is £143 million.<br />
20