Trading report May 2017
Report on trading at BSP SouthPool Regional Energy Exchange for May 2017
Report on trading at BSP SouthPool Regional Energy Exchange for May 2017
- No tags were found...

Create successful ePaper yourself
Turn your PDF publications into a flip-book with our unique Google optimized e-Paper software.
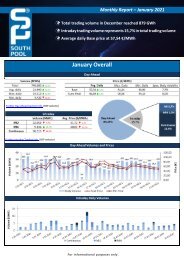
Monthly Report - <strong>May</strong> <strong>2017</strong><br />
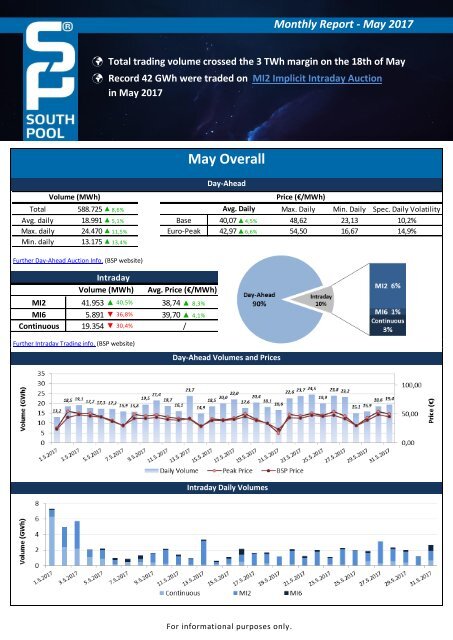
Total trading volume crossed the 3 TWh margin on the 18th of <strong>May</strong><br />
Record 42 GWh were traded on MI2 Implicit Intraday Auction<br />
in <strong>May</strong> <strong>2017</strong><br />
Volume (MWh)<br />
Further Day-Ahead Auction Info. (BSP website)<br />
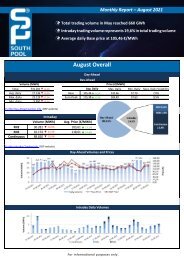
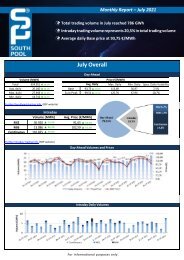
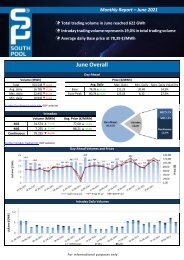
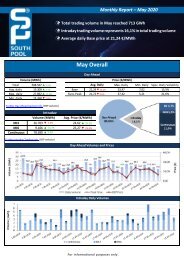
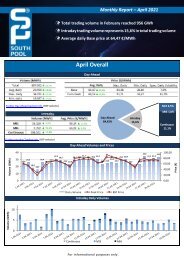
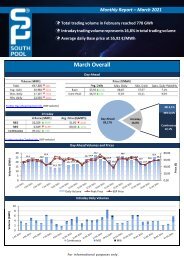
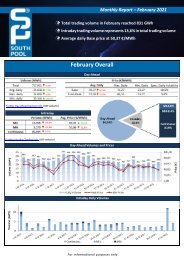
<strong>May</strong> Overall<br />
Day-Ahead<br />
Total 588.725 ▲ 8,6% Avg. Daily Max. Daily Min. Daily Spec. Daily Volatility<br />
Avg. daily 18.991 ▲ 5,1% Base 40,07▲4,5% 48,62 23,13 10,2%<br />
Max. daily 24.470 ▲ 11,5% Euro-Peak 42,97▲6,6% 54,50 16,67 14,9%<br />
Min. daily 13.175 ▲ 13,4%<br />
Intraday<br />
Volume (MWh)<br />
Avg. Price (€/MWh)<br />
MI2 41.953 ▲ 40,5% 38,74 ▲ 8,3%<br />
MI6 5.891 ▼ 36,8% 39,70 ▲ 4,1%<br />
Continuous 19.354 ▼ 30,4% /<br />
Price (€/MWh)<br />
Further Intraday <strong>Trading</strong> info. (BSP website)<br />
Day-Ahead Volumes and Prices<br />
Intraday Daily Volumes<br />
For informational purposes only.
Day-Ahead further Auction info.<br />
Average Hourly Prices<br />
Hour (AM) 1 2 3 4 5 6 7 8 9 10 11 12<br />
Volume (MWh) 712 685 681 664 673 698 746 853 874 860 840 805<br />
Base price (€/MWh) 36,59 32,08 29,16 29,01 28,98 30,13 36,48 42,06 44,77 45,15 43,05 42,76<br />
Hour (PM) 13 14 15 16 17 18 19 20 21 22 23 24<br />
Volume (MWh) 896 915 847 811 799 772 776 816 905 829 778 756<br />
Daily volatility of base price<br />
Base price (€/MWh) 42,58 41,21 40,03 40,24 42,20 42,93 44,46 46,31 48,87 47,83 44,03 40,66<br />
SI→IT<br />
IT→SI<br />
Cross-Zonal Capacities<br />
SI→AT<br />
AT→SI<br />
Total<br />
Offered (MWh) 319.946 469.480 1.088.472 232.228 2.110.126<br />
Allocated (MWh) 100.649 125.250 4.828 203.941 434.668<br />
% Allocated 31,46% 26,68% 0,44% 87,82% /<br />
Daily Volatility of Base Price<br />
Methodology used for calculation of volatility.<br />
MI2 & MI6 Implicit Auctions<br />
Allocated CZC Values on Slovenian-Italian Border<br />
Cross-Zonal-Capacities<br />
SI-IT IT-SI Total<br />
Offered (MWh)<br />
Allocated (MWh)<br />
% Allocated<br />
339.367<br />
27.143<br />
8,00%<br />
244.229<br />
9.259<br />
3,79%<br />
583.596<br />
36.402<br />
/<br />
Intraday Continuous <strong>Trading</strong><br />
Volumes by Products<br />
For informational purposes only.
Past 12 Months Trade Information<br />
Day-Ahead Auction<br />
Avg. Monthly Volume (MWh) 564.435<br />
Avg. Daily Volume (MWh) 18.565<br />
Avg. Base Price (€/MWh) 42,26<br />
Avg. Euro-Peak Price (€/MWh) 47,31<br />
Avg. SI-IT offered (MWh)/Avg. % Allocated 401.976 / 66,8%<br />
Avg. IT-SI offered (MWh)/Avg.% Allocated 473.818 / 9,1%<br />
Avg. SI-AT offered (MWh)/Avg. % Allocated 949.340 / 3,4%<br />
Avg. AT-SI offered (MWh)/Avg. % Allocated 225.994 / 62,0%<br />
Intraday Continuous <strong>Trading</strong><br />
Avg. Monthly volume (MWh) 22.734<br />
Avg. Nbr. Of Transactions 407<br />
MI2 & MI6 Implicit Auctions<br />
Avg. Monthly volume MI2 (MWh) 27.811<br />
Avg. Monthly volume MI6 (MWh) 8.543<br />
Avg. SI-IT offered (MWh)/Avg. % Allocated 171.780 / 7,0%<br />
Avg. IT-SI offered (MWh)/Avg.% Allocated 382.831 / 2,7%<br />
*Day-ahead coupling on SI-AT border was launched on 22 nd July 2016. Therefore for average calculation, data from August is being used.<br />
**Intraday coupling on SI-IT border was launched on 21 st June 2016. Therefore for average calculation, data from July is being used.<br />
Day-Ahead Market Volumes and Prices<br />
Intraday Volumes (MWh)<br />
Total Volume from April 2016 Continuous ■ MI2 ■ MI6 ■<br />
Maj 29.850 * *<br />
363.726<br />
331.483<br />
Jun 29.045 11.418 2.679<br />
Jul 13.309 33.515 5.582<br />
Avg 31.659 29.657 8.309<br />
Sep 9.212 27.861 10.493<br />
Okt 17.377 34.984 9.566<br />
94.002<br />
Nov 16.342 8.964 1.444<br />
Dec 12.541 23.301 9.464<br />
Jan 40.356 37.490 13.914<br />
Feb 19.024 34.970 11.829<br />
Mar 26.133 17.516 5.505<br />
Apr 27.822 29.853 9.325<br />
*MI Auctions were launched on 22 nd June 2016.<br />
Absolute Difference Between MI and Day-Ahead Prices & MI Offered Cross-Zonal Capacities<br />
*Cross-Zonal Capacities not allocated on Day-Ahead Auction are later offered for MI2 and MI6 Auctions.<br />
For informational purposes only.
BSP Regional Energy Exchange LL C<br />
Dunajska 156<br />
SI-1000 Ljubljana<br />
Slovenija<br />
+386 1 620 76 76<br />
+386 1 620 76 77<br />
www.bsp-southpool.com<br />
info@bsp-southpool.com<br />
For informational purposes only.