Competitiveness of Small-Scale Industries of India Vidya Suresh* P ...
Competitiveness of Small-Scale Industries of India Vidya Suresh* P ...
Competitiveness of Small-Scale Industries of India Vidya Suresh* P ...

Create successful ePaper yourself
Turn your PDF publications into a flip-book with our unique Google optimized e-Paper software.
<strong>Competitiveness</strong> <strong>of</strong> <strong>Small</strong>-<strong>Scale</strong> <strong>Industries</strong> <strong>of</strong> <strong>India</strong><br />
<strong>Vidya</strong> <strong>Suresh*</strong><br />
P shashidhar*<br />
Abstract<br />
The <strong>Small</strong>-<strong>Scale</strong> <strong>Industries</strong> (SSI) gathered momentum along with industrialization and economic<br />
growth in <strong>India</strong>. It started growing due to the vision <strong>of</strong> our late Prime Minister Jawaharlal Nehru<br />
who sought to develop core industry and have a sustaining sector in the form <strong>of</strong> small-scale<br />
enterprises. Being a labor-intensive sector, they <strong>of</strong>fer a higher productivity <strong>of</strong> capital than<br />
capital-intensive enterprises due to low investment per worker. The SSI today constitutes a very<br />
important segment <strong>of</strong> the <strong>India</strong>n economy as they help in dispersal <strong>of</strong> industries, rural<br />
development, and the decentralization <strong>of</strong> economic power.<br />
The central discussion <strong>of</strong> this paper highlights the importance <strong>of</strong> small industries and their role in<br />
the economy and the impact <strong>of</strong> economic reforms on growth pattern and productivity<br />
performance <strong>of</strong> small-scale industries. However, this is not to say that there are no shortcomings<br />
within the industry, or in public policy relating to it. <strong>Small</strong> industries are faced with numerous<br />
problems major and minor, which make them either uncompetitive, or sick. An attempt is made<br />
to address some solutions that can improve their productivity by focusing on a sustainable<br />
vision.<br />
KEY WORDS<br />
<strong>Small</strong>-scale industries, growth pattern <strong>of</strong> SSI, Government incentives<br />
Biographical Note<br />
• <strong>Vidya</strong> Suresh –Academic Intern, Corporate Strategy and Policy Area.<br />
• P. Shashidhar –Academic Intern, Corporate Strategy and Policy Area.<br />
Key role <strong>of</strong> SSI in the <strong>India</strong>n economic structure<br />
<strong>India</strong> has traditionally always had a very vibrant and competitive SSI. Even after the dawn <strong>of</strong><br />
industrialization, British producers <strong>of</strong> textiles found hand made <strong>India</strong>n textiles such a threat that<br />
they lobbied hard to have its import banned, succeeding in the late eighteenth century (Gupta &<br />
Sharma, 1996). During pre-economic liberalization period a wide variety <strong>of</strong> incentives,<br />
concessions and institutional facilities were extended for the development <strong>of</strong> SSIs. But these<br />
socialistic promotional policy measures, in many cases resulted in protection <strong>of</strong> weak units rather<br />
than the independent growth <strong>of</strong> units under competitive business environment (Nyati, 1988).<br />
Such situation was continued up to the mid <strong>of</strong> 1991. Under the regime <strong>of</strong> economic<br />
liberalization, the focus was shifted from “protection” to “competitive promotion”(Raja &<br />
Rajashekar, 2002).<br />
The public policy in <strong>India</strong> had been attaching lot <strong>of</strong> importance to village and SSI on the<br />
following grounds. SSI being labor-intensive, helped to increase the volume <strong>of</strong> employment,<br />
particularly in rural areas, it is estimated that about 2 crore persons are engaged in <strong>India</strong> in these<br />
industries. The handloom industry alone employs 50 lakh people. They account for 6% <strong>of</strong> GDP,<br />
95 % <strong>of</strong> all industrial units, and 34% <strong>of</strong> total exports. Around 39 lakhs SSIs in <strong>India</strong> has emerged<br />
versatile producing over 8000 products, from traditional handicrafts to high-end technical<br />
instruments.<br />
In developed OECD economies, about 60 % <strong>of</strong> GDP is generated by small enterprises, i.e.,<br />
enterprises with a maximum <strong>of</strong> 50 employees. The reason being large number <strong>of</strong> small enterprises<br />
guarantees a high degree <strong>of</strong> competition, and variety <strong>of</strong> economic activities that require millions<br />
<strong>of</strong> enterprises to be reasonable competitive and efficient. The indirect jobs created through<br />
forward and backward linkages are no less important. In real terms, the SSI recorded a growth<br />
rate <strong>of</strong> 10.1% in 1994-95 as against 7.1% in 1993-94 and 5.6% in 1992-93. By the year 2025, if<br />
not controlled, this sector will grow even more rapidly (Parthasarathy, 1996).<br />
*<strong>India</strong>n Institute <strong>of</strong> Management, Bangalore -560076, <strong>India</strong>. E-mail: vidyas@iimb.ernet.in, shashidharp@iimb.ernet.in
IIMK IIML<br />
Generalizations are also difficult because though there are firms which are growing rapidly, there<br />
also exist 1,38,000 sick units within the sector in <strong>India</strong>. The contribution <strong>of</strong> SSI in <strong>India</strong> to<br />
national development was meager as compared to the contribution <strong>of</strong> SSI in other countries <strong>of</strong> the<br />
world. <strong>India</strong>’s SSI shared 95 % <strong>of</strong> all establishments, 40 % <strong>of</strong> output, 45% <strong>of</strong> employment and 35<br />
% <strong>of</strong> exports. But Taiwan ranked first with a share <strong>of</strong> 97% <strong>of</strong> establishments, 81 % <strong>of</strong> output, 7%<br />
<strong>of</strong> employment, 48 % <strong>of</strong> exports followed by Japan contributing highly with 99 % <strong>of</strong><br />
establishments, 52 % <strong>of</strong> output, 72 % <strong>of</strong> employment and 13 % <strong>of</strong> exports (SIDBI Report, 2000).<br />
Methodology and data sources<br />
For the purpose <strong>of</strong> the study the required information relating to number <strong>of</strong> SSI units, labor<br />
employed, production and exports at all <strong>India</strong> level were complied from various issues <strong>of</strong><br />
Economic Survey and <strong>of</strong> Annual Survey <strong>of</strong> <strong>Industries</strong>. The data on number <strong>of</strong> sick SSI units were<br />
complied from Report on currency and Finance, RBI bulletin, various issues.<br />
The average annual growth rates, growth patterns and the number <strong>of</strong> times increase in growth <strong>of</strong><br />
SSIs, their employment, production and exports are calculated for the reference period.<br />
Definition and historical context<br />
The small companies are defined as those with less than US $180,000 in capital equipment (US-<br />
AEP, 1996). In <strong>India</strong> the definition <strong>of</strong> SSI has undergone changes over the years in terms <strong>of</strong><br />
investment limits in the following manner.<br />
Table-I Investment limit <strong>of</strong> SSIs<br />
Year SSI Remarks<br />
Employment less than 50 Workers Per Day (with the Use <strong>of</strong><br />
Gross Investment in Fixed Assets: not Power) or Less than 100 Workers Per Day (Without the Use<br />
1950 Exceeding Re. 0.5 Million<br />
<strong>of</strong> Power)<br />
Employment less than 50 Workers Per Day (with the Use <strong>of</strong><br />
Power) or Less than 100 Workers Per Day (Without the Use<br />
Gross Investment in Fixed Assets: <strong>of</strong> Power) except that the Criteria based on the employment<br />
1958 Less than Re. 0.5 Million<br />
‘per day’ was henceforth replaced by a ‘per shift’ provision<br />
Employment less than 50 Workers Per Day (with the Use <strong>of</strong><br />
Power) or Less than 100 Workers Per Day (Without the Use<br />
Gross Invesment in Fixed Assets: <strong>of</strong> Power) except that the Criteria based on the employment<br />
1959 Value <strong>of</strong> Machinery (Original) ‘per day’ was henceforth replaced by a ‘per shift’ provision<br />
Gross Investment in Fixed Assets:<br />
1960 Value up to Re. 0.5 Million The employment condition was dropped from the definition<br />
1966 Up to Re. 0.75 million No condition<br />
1975 Up to Re. 1 million No condition<br />
1977 Up to Re. 1 million No condition<br />
1980 Up to Rs. 2 million No condition<br />
1985 Up to 3.5 million No condition<br />
1991 Up to Rs.6 million No condition<br />
1997 Up to Rs. 30 million No condition<br />
1999 Up to Rs. 10 million No condition<br />
Source: SIDBI Report on <strong>Small</strong> <strong>Scale</strong> <strong>Industries</strong> Sector 2000, <strong>Small</strong> <strong>Industries</strong> Development<br />
Bank <strong>of</strong> <strong>India</strong>.<br />
Growth patterns <strong>of</strong> SSI during the reference period<br />
<strong>Small</strong> firms are <strong>of</strong>ten said to grow faster than large firms. However, empirically it is observed that<br />
though they have high growth rates, they as a group have a high death rate, that is, many firms do<br />
not last very long. This means that the total effect on the economy may not be much greater than<br />
that <strong>of</strong> relatively larger firms. This section attempts to study the direction <strong>of</strong> growth in various<br />
aspects <strong>of</strong> SSI.<br />
Conference on Global Competition & <strong>Competitiveness</strong> <strong>of</strong> <strong>India</strong>n Corporate 440
IIMK IIML<br />
Table: II Growth pattern in the number <strong>of</strong> establishments <strong>of</strong> SSIs (in lakhs)<br />
Year No. <strong>of</strong> SSIs<br />
Growth rate<br />
1980-81 8.74 -<br />
1981-82 9.62 10.07<br />
1982-83 10.59 10.08<br />
1983-84 11.55 9.07<br />
1984-85 12.4 7.36<br />
1985-86 13.53 9.11<br />
1986-87 14.62 8.06<br />
1987-88 15.83 8.28<br />
1988-89 17.12 8.15<br />
1989-90 18.23 6.48<br />
1990-91 19.48 6.86<br />
1991-92 20.82 6.88<br />
1992-93 22.46 7.88<br />
1993-94 23.88 6.32<br />
1994-95 25.71 7.66<br />
1995-96 26.58 3.38<br />
1996-97 28.03 5.46<br />
1997-98 29.44 5.03<br />
1998-99 30.8 4.62<br />
1999-00 32.12 4.29<br />
2000-01 33.7 4.92<br />
2001-02 34.6 2.67<br />
2002-03 35.1 1.45<br />
2003-04 38.6 9.97<br />
Source: Ministry <strong>of</strong> SSIs Annual Reports <strong>of</strong> SIDO,Govt. <strong>of</strong> <strong>India</strong> New Delhi<br />
During License Raj there was 2.6 times increase in the number <strong>of</strong> SSIs with the highest growth<br />
rate <strong>of</strong> 10.08 % in the year 1982-83 and with a annual growth <strong>of</strong> 8.35 % in the country. The postreform<br />
period obtained average annual growth rate <strong>of</strong> 5.42% with the highest growth rate <strong>of</strong> 9.97<br />
in 2003-04 but obtained only 1.84 times increase in the number <strong>of</strong> establishments <strong>of</strong> SSIs. Thus,<br />
it is clear that the government protection in many cases resulted in protection <strong>of</strong> weak units rather<br />
than the independent growth <strong>of</strong> units under competitive business environment (Nyati, 1988).<br />
Table III: Industry wise growth pattern <strong>of</strong> SSI<br />
Description <strong>of</strong> Industry<br />
Employ/Unit<br />
Working Units Working Units Working Units<br />
1 st Census<br />
1972-73<br />
2 nd Census 1987-<br />
88<br />
3 rd Census 2001-<br />
02<br />
Food & Food Products 6577 96123 104489 14.82<br />
Beverages, Tobacco & Tobacco<br />
Products<br />
CGR<br />
469 3669 5851 13.44<br />
Cotton Textiles - 1451 10876<br />
Wool Silk & Synth. Fibre<br />
Textiles<br />
- 1158 -<br />
Jute, Hemp & Mesta Textiles - 219 -<br />
Conference on Global Competition & <strong>Competitiveness</strong> <strong>of</strong> <strong>India</strong>n Corporate 441
IIMK IIML<br />
Hosiery & Garments 6178 39778 107565 15.35<br />
Wood Products 12188 54975 77110 9.66<br />
Paper Products & Printing 8332 33320 26104 5.87<br />
Leather & Leather Products 5040 24028 17027 6.27<br />
Rubber & Plastic Products 7688 25819 18228 4.41<br />
Chemical & Chemical Products 11837 25941 11177 -0.28<br />
Non-Metallic Mineral Products<br />
(Glass & Ceramic)<br />
7794 315891 25128 6.02<br />
Basic Metal Products 5073 14937 7876 2.22<br />
Metal Products 34011 65868 80636 4.41<br />
Machinery & Parts Except<br />
Electrical<br />
12701 40802 8776 -1.83<br />
Electrical Machinery/Apparatus 4409 12283 5626 1.22<br />
Transport Equipment & Part 6049 11325 2100 -5.15<br />
Misc..Manufacturing <strong>Industries</strong> 3489 8852 4726 1.52<br />
Repair Services 7197 80412 75385 12.46<br />
Services not e.c. - 613 1200<br />
Other Services & Products - 9206 160222<br />
Total 139577 582368 750102 8.77<br />
Source: <strong>Small</strong> <strong>Scale</strong> <strong>Industries</strong> in <strong>India</strong>, Ministry <strong>of</strong> SSI, Govt. <strong>of</strong> <strong>India</strong>.<br />
A highest growth rate was observed in Hosiery & Garments following the Food & Food Products<br />
Beverages and the Tobacco Products. The growth in these sectors was mainly due to export<br />
oriented production rather than domestic sales.<br />
Table: IV Growth Rates <strong>of</strong> SSI Sector and Total Industrial Sector in <strong>India</strong><br />
SSI Sector Growth Rate Total Industrial Sector<br />
Year<br />
(%)<br />
Growth Rate<br />
1991-92 3.1 0.6<br />
1992-93 5.6 2.3<br />
1993-94 5.65 6<br />
1994-95 10.44 9.1<br />
1995-96 11.49 13<br />
1996-97 11.29 6.1<br />
1997-98 9.19 6.7<br />
1998-99 7.84 4.1<br />
1999-00 7.09 6.7<br />
2000-01 8.04 5<br />
2001-02 6.06 2.7<br />
2002-03 7.7 5.7<br />
2003-04 8.6 6.9<br />
2004-05 9.96 8.4<br />
Conference on Global Competition & <strong>Competitiveness</strong> <strong>of</strong> <strong>India</strong>n Corporate 442
IIMK IIML<br />
Source: SIDO’s Half Century, History <strong>of</strong> <strong>Small</strong> <strong>Industries</strong> Development Organization 1954-2004<br />
and Ministry <strong>of</strong> <strong>Small</strong> <strong>Scale</strong> <strong>Industries</strong>,Govt. <strong>of</strong> <strong>India</strong>.<br />
The SSI has grown rapidly over the years. The growth rates during the various plan periods have<br />
been very impressive. The number <strong>of</strong> SSI has increased from an estimated 8.74 lakhs units in the<br />
year 1980-81 to an estimated 31.21 lakhs in the year 1999. The performance <strong>of</strong> SSI instills<br />
confidence when viewed against the growth in the industry sector as a whole. The estimates <strong>of</strong><br />
growth for the year 1995-96 have shown an upswing. The growth <strong>of</strong> SSI sector has surpassed<br />
overall industrial growth from 1991 onwards except for year 1993-94 and 1995-96 and augurs a<br />
bright future. However, this has to be viewed in the background <strong>of</strong> the general recession in the<br />
economy. The transition period <strong>of</strong> the process <strong>of</strong> economic reforms was also affected for some<br />
period by adverse factors such as foreign exchange constraints, credit squeeze, demand recession,<br />
high interest rates, shortage <strong>of</strong> raw material etc.<br />
Table:V Growth patterns <strong>of</strong> production in SSIs (Rs.Crores)<br />
Year<br />
Production (Rs. crore) Production Growth<br />
(Rs.crore) rate<br />
At 1993-94 prices<br />
Growth rate At current prices<br />
1979-80 66400 - 21600 -<br />
1980-81 72200 8.73 28100 30.09<br />
1981-82 78300 8.45 32600 16.01<br />
1982-83 84700 8.17 35000 7.36<br />
1983-84 93500 10.39 41600 18.86<br />
1984-85 104600 11.87 50500 21.39<br />
1985-86 118100 12.91 61200 21.19<br />
1986-87 133600 13.12 72300 18.14<br />
1987-88 150500 12.65 87300 20.75<br />
1988-89 169900 12.89 106400 21.88<br />
1989-90 189900 11.77 132300 24.34<br />
1990-91 84728 -55.38 78802 -40.44<br />
1991-92 87355 3.10 80615 2.30<br />
1992-93 92246 5.60 84413 4.71<br />
1993-94 98796 7.10 98796 17.04<br />
1994-95 108774 10.10 122154 23.64<br />
1995-96 121175 11.40 147712 20.92<br />
1996-97 134892 11.32 167805 13.60<br />
1997-98 146263 8.43 187217 11.57<br />
1998-99 157525 7.70 210454 12.41<br />
1999-00 170379 8.16 233760 11.07<br />
2000-01 184401 8.23 261297 11.78<br />
2001-02 195613 6.08 282270 8.03<br />
2002-03 210636 7.68 311993 10.53<br />
2003-04 228730 8.59 357733 14.66<br />
2004-05 251511 9.96 418263 16.92<br />
2005-06 (P) 275581 * 9.57 471244 ** 12.67<br />
Source: website <strong>of</strong> Reserve Bank <strong>of</strong> <strong>India</strong>.<br />
Conference on Global Competition & <strong>Competitiveness</strong> <strong>of</strong> <strong>India</strong>n Corporate 443
IIMK IIML<br />
It is evident from table V that growth rate has not been consistent through out the reference<br />
period and has decreased substantially after reform. The abolition <strong>of</strong> license-quota-permit system<br />
shifted the focus from protection to competitive promotion involving a process <strong>of</strong> de reservation<br />
<strong>of</strong> product from SSI. The anti license-raj policy along with integration <strong>of</strong> <strong>India</strong>n market with the<br />
global market has increased the problems <strong>of</strong> various SSI. Fierce competition, natural threat to<br />
indigenous technology and disadvantage to SSI <strong>of</strong> backward regions posed several threats and<br />
challenges to SSI. In this process, various SSI flourished well and several became sick. During<br />
pre-liberalization period the highest growth rate <strong>of</strong> 13 percent was achieved in 1986-87 following<br />
11 percent during 1995-96.<br />
Table:VI Growth pattern in exports <strong>of</strong> SSI<br />
Growth<br />
Year SSI Exports. Rs Crore rate<br />
1979-80 1200<br />
1980-81 1600 33.33333<br />
1981-82 2100 31.25<br />
1982-83 2000 -4.7619<br />
1983-84 2200 10<br />
1984-85 2500 13.63636<br />
1985-86 2800 12<br />
1986-87 3600 28.57143<br />
1987-88 4400 22.22222<br />
1988-89 5500 25<br />
1989-90 7600 38.18182<br />
1990-91 9664 27.15789<br />
1991-92 13883 43.65687<br />
1992-93 17784 28.09911<br />
1993-94 25307 42.30207<br />
1994-95 29068 14.8615<br />
1995-96 36470 25.46443<br />
1996-97 39248 7.61722<br />
1997-98 44442 13.2338<br />
1998-99 48979 10.20881<br />
1999-00 54200 10.65967<br />
2000-01 69797 28.77675<br />
2001-02 71244 2.073155<br />
2002-03 86013 20.73017<br />
2003-04 97644 13.52237<br />
Source: Reserve Bank <strong>of</strong> <strong>India</strong>.<br />
SSI Sector plays a major role in <strong>India</strong>'s present export performance. SSI is contributing almost<br />
45% <strong>of</strong> the <strong>India</strong>n Exports. Direct exports from the SSI account for nearly 35% <strong>of</strong> total exports.<br />
The number <strong>of</strong> small-scale units that undertake direct exports would be more than 5000. Besides<br />
direct exports, it is estimated that SSI contribute around 15% to exports indirectly. This takes<br />
place through merchant exporters, trading houses and export houses. They may also be in the<br />
form <strong>of</strong> export orders from large units or the production <strong>of</strong> parts and components for use for<br />
finished exportable goods. The non-traditional products account for more than 95% <strong>of</strong> the SSI<br />
Conference on Global Competition & <strong>Competitiveness</strong> <strong>of</strong> <strong>India</strong>n Corporate 444
IIMK IIML<br />
exports. The rewarding product groups where the SSI dominates in exports are sports goods,<br />
readymade garments, woolen garments and knitwear, plastic products, processed food and leather<br />
products.<br />
Table: VII Growth pattern <strong>of</strong> employees in SSIs<br />
Production per employee<br />
Employment (Lakh (Rs. thousand) at 1993-<br />
Year Nos.)<br />
94 prices<br />
1979-80 67 99<br />
1980-81 71 102<br />
1981-82 75 104<br />
1982-83 79 107<br />
1983-84 84.2 111<br />
1984-85 90 116<br />
1985-86 96 123<br />
1986-87 101.4 132<br />
1987-88 107 141<br />
1988-89 113 150<br />
1989-90 119.6 159<br />
1990-91 158.3 54<br />
1991-92 166 53<br />
1992-93 174.8 53<br />
1993-94 182.6 54<br />
1994-95 191.4 57<br />
1995-96 197.9 61<br />
1996-97 205.9 66<br />
1997-98 213.2 69<br />
1998-99 220.6 71<br />
1999-00 229.1 74<br />
2000-01 238.7 77<br />
2001-02 249.3 78<br />
2002-03 260.2 81<br />
2003-04 271.4 84<br />
2004-05 282.6 89<br />
2005-06<br />
(P) 294.9 * 93<br />
Source: Reserve Bank <strong>of</strong> <strong>India</strong>.<br />
<strong>Small</strong> firms and enterprises are an important source <strong>of</strong> employment in many developing nations,<br />
<strong>of</strong>ten employing a sizable share <strong>of</strong> the labor force. However it is <strong>of</strong>ten suggested that small firms<br />
are more labor intensive, and therefore should be encouraged as a way <strong>of</strong> generating employment.<br />
It has been estimated that a lakh rupees <strong>of</strong> investment in fixed assets in the SSI generates<br />
employment for four persons.<br />
Table:VIII Industry-wise Distribution <strong>of</strong> Employment in SSI<br />
IC<br />
Description <strong>of</strong> Industry<br />
Employ/Unit<br />
Employment<br />
Census<br />
1972-73<br />
1 st<br />
Census<br />
1987-88 3 rd Census 2001-02<br />
Conference on Global Competition & <strong>Competitiveness</strong> <strong>of</strong> <strong>India</strong>n Corporate 445<br />
2 nd
IIMK IIML<br />
20/21 Food & Food Products 131220 481682 403113<br />
Beverages, Tobacco &<br />
22 Tobacco Products 4577<br />
73375 35863<br />
23 Cotton Textiles - 24725 79312**<br />
Wool Silk & Synth. Fibre<br />
24 Textiles 12314<br />
-<br />
Jute, Hemp & Mesta<br />
25 Textiles 2599<br />
-<br />
26 Hosiery & Garments 75346 198387 374836<br />
27 Wood Products 94703 229061 290696<br />
28 Paper Products & Printing 89146 199389 119658<br />
Leather & Leather<br />
29 Products 31775<br />
81667 65174<br />
30 Rubber & Plastic Products 81690 188784 117934<br />
Chemical & Chemical<br />
31 Products 159013<br />
313986 96209<br />
Non-Mettalic Mineral<br />
Products (Glass &<br />
32 Ceramic) 202269<br />
446218 258627<br />
33 Basic Metal Products 109626 202463 84830<br />
34 Metal Products 300060 372711 358629<br />
Machinery & Parts Except<br />
35 Electrical 145333<br />
279292 37242<br />
Electrical Machinery 65908 137260 33104<br />
36 /Apparatus<br />
Transport Equipment &<br />
37 Part 83492<br />
100360 36208<br />
Misc Manufacturing<br />
38 <strong>Industries</strong> 40025<br />
65322 -<br />
97 Repair Services 38995 192267 161728<br />
99 Services not e.c. - 2720 -<br />
OT Other Services & Products- 61228 895193<br />
Total 1653178 3665810 3448356<br />
Source: Institute <strong>of</strong> Applied Manpower Research.<br />
Food products industry has ranked first in generating employment, providing employment to<br />
13.1%, which was followed by Non-metallic mineral products with employment <strong>of</strong> 4.46 lakh<br />
persons 12.2% and Metal products 10.2%. In Chemicals & chemical products, Machinery parts<br />
and except Electrical parts, Wood products, Basic Metal <strong>Industries</strong>, Paper products & printing,<br />
Hosiery & garments, Repair services and Rubber & plastic products, the contribution ranged from<br />
9% to 5%, the total contribution by these eight industry groups being 49%. In all other industries<br />
the contribution was less than 5%. Per unit employment was the highest in units engaged in<br />
Beverages, tobacco & tobacco products mainly due to the high employment potential <strong>of</strong> this<br />
industry particularly in Maharashtra, Andhra Pradesh, Rajasthan, Assam and Tamil Nadu. Next<br />
came Cotton textile products (17), Non-metallic mineral products (14.1), Basic metal industries<br />
(13.6) and Electrical machinery and parts (11.2.) The lowest figure <strong>of</strong> 2.4 was in Repair services<br />
line. Per unit employment was the highest (10) in metropolitan areas and lowest (5) in rural areas.<br />
However, in Chemicals & chemical products, Non-metallic mineral products and Basic metal<br />
industries per unit employment was higher in rural areas as compared to metropolitan areas/urban<br />
Conference on Global Competition & <strong>Competitiveness</strong> <strong>of</strong> <strong>India</strong>n Corporate 446
IIMK IIML<br />
areas. In urban areas highest employment per unit was in Beverages, tobacco products (31<br />
persons) followed by Cotton textile products (18), Basic metal industries (13) and Non-metallic<br />
mineral products (12).Non-metallic products contributed 22.7% to employment generated in rural<br />
areas. Food Products accounted for 21.1%, Wood Products and Chemicals and chemical products<br />
shared between them 17.5%. As for urban areas, Food Products and Metal Products almost<br />
equally shared 22.8% <strong>of</strong> employment. Machinery and parts except electrical, Non-metallic<br />
mineral products, and Chemicals & chemical products between them accounted for 26.2% <strong>of</strong><br />
employment. In metropolitan areas the leading industries were Metal products, Machinery and<br />
parts except electrical and Paper products & printing (total share being 33.6%).Tamil Nadu<br />
(14.5%) made the maximum contribution to employment.This was followed by Maharashtra<br />
(9.7%), Uttar Pradesh (9.5%) and West Bengal (8.5%) the total share being 27.7%.Gujarat<br />
(7.6%), Andhra Pradesh (7.5%), Karnataka (6.7%), and Punjab (5.6%) together accounted for<br />
another 27.4%.Per unit employment was high - 17, 16 and 14 respectively - in Nagaland, Sikkim<br />
and Dadra & Nagar Haveli.It was 12 in Maharashtra, Tripura and Delhi. Madhya Pradesh had the<br />
figure <strong>of</strong> 2. In all other cases it was around the average <strong>of</strong> 6 (exim.indiamart.com).<br />
Table:IX Expenditure on R&D by Industry Groups for SSI<br />
No.<strong>of</strong><br />
R&D<br />
R&D Expenditure as %<br />
R&D Expenditure (Rs. Lakhs) <strong>of</strong> S.T.O.<br />
Industry Group<br />
Units 1996-97 1997-98 1998-99 1996-97 1997-98 1998-99<br />
Metallurgical <strong>Industries</strong> 4 120.62 131.61 136.44 2.68 2.66 3.14<br />
Fuels 2 37.35 44.44 80.09 0.2 0.21 0.37<br />
Boilers and Steam Generating Plants 3 73.77 81.41 81.79 11.04 12.9 11.49<br />
Prime Movers 3 48.56 49.15 50.18 0.56 0.57 0.58<br />
Electricals and Electronics Equipment 64 1653.44 1810.63 2036.31 2.23 2.43 2.47<br />
Telecommunications 23 460.5 590.5 536.37 0.46 0.51 0.79<br />
Transportation 0 0 0 0 0 0 0<br />
Industrial Machinery 9 295.8 240.58 236.27 2.93 2.01 2.5<br />
Machine Tools 4 88.77 54.14 201.01 2.01 1.16 4.86<br />
Agricultural Machinery 2 19.4 31.72 11.18 2.69 4.58 2.03<br />
Earth Moving Machinery 0 0 0 0 0 0 0<br />
Misc. Mechanical Engineering<br />
<strong>Industries</strong> 7 108.43 160.95 183.82 0.69 1.11 1.32<br />
Commercial Offices, Household<br />
Equipment 2 10.62 11.13 12.39 0.62 0.64 0.87<br />
Medical and Surgical Appliances 3 12.5 21.6 29.42 0.91 0.22 0.25<br />
Industrial Instruments 11 243.17 399.16 401.49 3.83 5.29 5.34<br />
Scientific Instruments 9 91.13 71.58 81.27 3.13 2.42 2.64<br />
Math. Surveying & Drawing<br />
Instrument 0 0 0 0 0 0 0<br />
Fertilisers 0 0 0 0 0 0 0<br />
Chemicals (Other than Fertilizers) 32 546.62 572.22 483.32 0.23 0.29 0.26<br />
Photographic Raw Film and Paper 2 40.66 29.45 40.15 0.63 0.38 0.69<br />
Dye- Stuffs 2 14.86 14.02 14.12 0.29 0.21 0.21<br />
Drugs and Pharmaceuticals 37 802.87 940.16 1486.01 0.53 0.51 0.67<br />
Textiles (Dyed, Printed, Processed) 2 15.03 19.15 143.2 0.09 0.09 0.68<br />
Paper and Pulp 1 4.94 10.86 7.87 0.41 0.92 0.64<br />
Conference on Global Competition & <strong>Competitiveness</strong> <strong>of</strong> <strong>India</strong>n Corporate 447
IIMK IIML<br />
Sugar 0 0 0 0 0 0 0<br />
Fermentation <strong>Industries</strong> 1 127.2 104.96 138.54 4.3 2.74 3.8<br />
Food Processing <strong>Industries</strong> 7 1502.98 1876.13 1863.49 17.41 19.16 16.16<br />
Vegetable Oil & Vanaspathi 0 0 0 0 0 0 0<br />
Soaps, Cosmetics and Toilet<br />
Preparations 1 22.74 76.94 88.44 2.04 5.17 4.05<br />
Rubber Goods 1 4.84 5.09 2.84 2.57 2.81 1.7<br />
Leather, Leather Goods and Pickers 1 233.3 143.5 282.78 0.92 0.44 0.94<br />
Glue and Gelatin 3 52.09 37.52 59.62 1.26 0.82 1.21<br />
Glass 0 0 0 0 0 0 0<br />
Ceramics 1 3 3 3 5.17 5.17 5.17<br />
Cement and Gypsum Products 0 0 0 0 0 0 0<br />
Timber Products 1 1.56 1.12 1.94 0.98 0.54 1.28<br />
Defence <strong>Industries</strong> 0 0 0 0 0 0 0<br />
Information Technology 6 324.14 376.72 449.6 2.37 2.79 3.22<br />
Biotechnology 11 378.38 430.51 518.84 0.44 0.6 0.59<br />
Consultancy Services 2 12 16.5 15 0.58 0.64 0.58<br />
Miscellaneous <strong>Industries</strong> 8 214.34 172.8 136.61 1.47 1.12 0.79<br />
Total 265 7565.61 8529.25 9813.4 0.91 1 1.15<br />
Abbr.: S.T.O: Sale Turnover. Source: Research and Development in Industry 2000-01, Ministry<br />
<strong>of</strong> Science and Technology, Govt. <strong>of</strong> <strong>India</strong>.<br />
<strong>Competitiveness</strong> in SSI could be achieved through technological innovation, which will enable<br />
SSI to manufacture new-fangled products and achieve various economies <strong>of</strong> scale that basically<br />
accrues to large-scale sectors. The tenth plan lays emphasis on enhancing information flow about<br />
technology sources, facilitating such transfers, and funding up gradation activity through capital<br />
subsidy scheme <strong>of</strong> SIDBI- Govt. <strong>of</strong> <strong>India</strong> pattern. The Electrical and electronic sector has more<br />
number <strong>of</strong> R&D units with comparatively low expenditure in relation to its total sales. The SSI<br />
like industries transportation, sugar, vegetable oil, cement and fertilizer has absolutely no R&D<br />
activities taking place.<br />
Considering the above facts, the cluster approach helps industries to introduce innovative<br />
marketing. The facilities in cluster may include information dissemination, establishment <strong>of</strong><br />
design center, quality awareness programmes, testing facilities technology up gradation etc which<br />
becomes a part <strong>of</strong> R&D and the diffusion <strong>of</strong> innovation takes place at a faster rate in cluster form.<br />
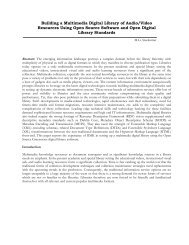
Growth<br />
140<br />
120<br />
100<br />
80<br />
60<br />
40<br />
20<br />
-20<br />
-40<br />
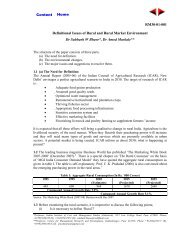
Chart: I Growth pattern <strong>of</strong> sick SSI units<br />
Sickness in SSI sector<br />
0<br />
1975 1980 1985 1990 1995 2000 2005<br />
Source: CMIE database.<br />
Year<br />
Conference on Global Competition & <strong>Competitiveness</strong> <strong>of</strong> <strong>India</strong>n Corporate 448<br />
Series1
IIMK IIML<br />
During the pre reform period there was 10.56 times increase in the number <strong>of</strong> sick SSI units in the<br />
country. After the liberalization period the number <strong>of</strong> sick units has decreased to .68 times.<br />
<strong>India</strong>’s obligation as a member <strong>of</strong> WTO to bring down tariff and non-tariff barriers gave another<br />
competitive environment for SSI (C Francis 1997). Thus after reform SSI has been exposed to<br />
intense competition both in domestic and international levels. The SSI, which was not able to<br />
withstand competition, has gradually become sick. According to the report <strong>of</strong> RBI (III census <strong>of</strong><br />
SSI) the criteria to measure sickness was: delay in repayment <strong>of</strong> loan over one year; decline in net<br />
worth by 50%; and decline in output during the last three years. According to the census <strong>of</strong> RBI<br />
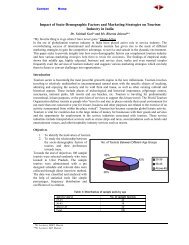
nearly 15% <strong>of</strong> registered SSI were identified to be sick. Lack <strong>of</strong> demand, shortage <strong>of</strong> working<br />
capital, non-availability <strong>of</strong> raw material, power shortage, labor problems and marketing problems<br />
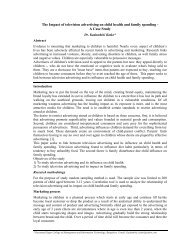
are the main reasons for incipient sickness in SSI. The chart II & III below depicts the cause and<br />
the magnitude <strong>of</strong> the problems faced by SSI ( Economic Survey,2004).<br />
Chart: II Reasons for sickness in registered SSI<br />
sickness in r egister ed SSI<br />
Chart: III Reasons for sickness in unregistered SSI<br />
sickness in unregistered SSI<br />
Lack <strong>of</strong> demand<br />
Short age <strong>of</strong> working<br />
capital<br />
Non-availability <strong>of</strong> raw<br />
mat erial<br />
power short age<br />
labour problems<br />
market ing problems<br />
equipment problems<br />
management problems<br />
Lack <strong>of</strong> demand<br />
Shortage <strong>of</strong> working<br />
capital<br />
Non-availability <strong>of</strong> raw<br />
material<br />
power shortage<br />
labour problems<br />
marketing problems<br />
equipment problems<br />
management problems<br />
The role <strong>of</strong> government towards SSI<br />
After independence, <strong>India</strong>n planners and policy-makers felt that protection was essential to the<br />
development <strong>of</strong> a strong and indigenous economy. The <strong>India</strong>n state played an integral role in the<br />
industrial and economic development <strong>of</strong> the country resulting in a dominant public sector and heavily<br />
regulated private sector. Viewing this, the protection was also extended to SSI as it was an important<br />
Conference on Global Competition & <strong>Competitiveness</strong> <strong>of</strong> <strong>India</strong>n Corporate 449
IIMK IIML<br />
tool in employment generation, value creation and poverty alleviation. These SSI also support<br />
entrepreneurial talent and skills, stimulate personal savings, and help in developing innovative and<br />
appropriate indigenous technology, providing dynamism and contributing to competition (Rajendran,<br />
1989). Over 800 products were exclusively reserved for SSI, where some <strong>of</strong> the products produced were<br />
purchased by government agencies. Apart form this, supply <strong>of</strong> scarce materials, input price concessions<br />
like lower interest rates and numerous fiscal measures such as excise duty exemptions and other tax<br />
concessions were also given (Source-Business Today, September 10, 2006). Government has reserved<br />
certain products for manufacture in the small scale sector in areas where there is techno-economic<br />
justification for such an approach. Large/Medium units can; however, manufacture such reserved items<br />
provided they undertake to export 50% or more <strong>of</strong> their production. As on March 2005, the total number<br />
<strong>of</strong> items reserved for small-scale sector is 506.<br />
In the second plan (1956-61), the SSI was given priority due to its consequence in creation <strong>of</strong><br />
diversified employment opportunities and wide dispersal <strong>of</strong> industrial production. The policies<br />
proposed then, were, and remain the main backbone <strong>of</strong> public policy relating to the SSI. What we<br />
see however is that this policy has been largely unhelpful, if not detrimental to the development<br />
<strong>of</strong> the sector. The policy regulations relating to the SSI are such that they ensure that units stay<br />
just small.<br />
Promotional measures aim to increase the efficiency and economic viability <strong>of</strong> small units by<br />
providing infrastructure facilities and improving access to markets. On the other hand, protective<br />
measures give small units preferential treatment. Continuous measures are those benefits which a<br />
small unit may avail <strong>of</strong> as long as it falls under that category, while one-shot are those which may<br />
be availed <strong>of</strong> only once, and tends to be discretionary in nature. Most policies like preference in<br />
government purchases; lower interest rates etc. are continuous in nature. Discretionary measures<br />
are those, which require an examination on a case-by-case basis and are not blanket measures<br />
available to all units, which fall under the definition <strong>of</strong> small. Non discretionary, by implication,<br />
are those measure which are based on some objective criteria and are applicable to all units that<br />
meet the criteria.<br />
The government has also provided measures such as greater infra-structural support, more and<br />
easier availability <strong>of</strong> credit, lower rates <strong>of</strong> duty, technology up-gradation, assistance to build<br />
entrepreneurial talent, facilities for quality improvement, and export incentives (Parthasarathy,<br />
1996).<br />
The Ministry <strong>of</strong> <strong>Small</strong> <strong>Scale</strong> <strong>Industries</strong> (MoSSI) designs policies, programmes, projects and<br />
schemes in consultation with its organizations. It also performs the function <strong>of</strong> policy advocacy<br />
with other Ministries/Departments <strong>of</strong> the Central Government and the States and Union<br />
Territories. Implementation <strong>of</strong> the policies and programmes/projects/schemes for providing<br />
various support services to the MSEs is undertaken through its attached <strong>of</strong>fice, namely, the<br />
Office <strong>of</strong> Development Commissioner (<strong>Small</strong> <strong>Scale</strong> <strong>Industries</strong>) also known as <strong>Small</strong> <strong>Industries</strong><br />
Development Organisation (SIDO) and the National <strong>Small</strong> <strong>Industries</strong> Corporation (NSIC) Ltd., a<br />
public sector undertaking <strong>of</strong> the Ministry. There are three national level Entrepreneurship<br />
Development Institutes supported by the Ministry viz. National Institute <strong>of</strong> <strong>Small</strong> Industry<br />
Extension Training (NISIET), Hyderabad, National Institute <strong>of</strong> Entrepreneurship and <strong>Small</strong><br />
Business Development (NIESBUD), NOIDA and <strong>India</strong>n Institute <strong>of</strong> Entrepreneurship (IIE),<br />
Guwahati.<br />
Financial aid for SSI<br />
Credit is the prime input for sustained growth <strong>of</strong> SSI and its mobilization for meeting fixed and<br />
working capital needs poses the foremost problems. Credit provided for creation <strong>of</strong> fixed assets<br />
like land, building, plant and machinery is called long term credit. Credit provided for running the<br />
industry for its day-to-day requirement for purchasing raw material and other input like electricity<br />
and water etc. and for payment <strong>of</strong> wages and salaries is called short-term credit or working<br />
capital.<br />
Conference on Global Competition & <strong>Competitiveness</strong> <strong>of</strong> <strong>India</strong>n Corporate 450
IIMK IIML<br />
The Laghu Udyami (small enterprise) Credit Card Scheme has been provided to SSI where they<br />
can credit up to Rs.10lakhs. Apart from this, credit facilities up to maximum <strong>of</strong> Rs.25lakhs are<br />
provided through Credit Guarantee Fund Trust in collaboration with SIDBI and Govt. <strong>of</strong> <strong>India</strong>.<br />
Table X provides further insight into credit related information. The SSI is provided working<br />
capital by commercial banks and in some cases by cooperative banks and regional rural banks.<br />
Term loans are provided by State Financial Corporations (SFCs), <strong>Small</strong> <strong>Industries</strong> Development<br />
Corporations (SIDCs), National <strong>Small</strong> <strong>Industries</strong> Corporation (NSIC) and National Bank for<br />
Agriculture and Rural Development (NABARD). Financial assistance from NSIC and to some<br />
extent from SIDCs is available in the form <strong>of</strong> supply <strong>of</strong> machinery on hire purchase<br />
basis/deferred payment basis. <strong>Small</strong> sized SSI and tiny units also get some term loans from<br />
commercial banks along with working capital in the form <strong>of</strong> composite loans.<br />
The <strong>Small</strong> <strong>Industries</strong> Development Bank <strong>of</strong> <strong>India</strong> (SIDBI) provides refinance to these institutions.<br />
Such refinance comprises assistance provided to State Financial Corporation Bills, Finance<br />
Scheme, Special Capital/Seed Capital Scheme, and new debt instruments and to National <strong>Small</strong><br />
<strong>Industries</strong> Corporation. Long-term loan are provided to the smalls scale industrial units by SFCs<br />
mainly through Single Window Scheme and National Equity Fund as also direct assistance<br />
provided to State Financial Corporations in the form <strong>of</strong> refinance. Some part <strong>of</strong> working capital<br />
for pre-operative expenses is also provided by State Financial Corporations to <strong>Small</strong> <strong>Scale</strong><br />
Industrial Units under the Single Window Scheme.<br />
Table:X Credit Guarantee Schemes for SSI<br />
Credit<br />
Guarantee Credit<br />
Scheme and Guarantee<br />
Guarantee Scheme<br />
Cover for Relating to<br />
<strong>Small</strong> <strong>Scale</strong> <strong>Small</strong><br />
<strong>Industries</strong> Borrowers<br />
Total<br />
Claims<br />
Claims Claims Guaranteed Claims Disposed<br />
Received Disposed <strong>of</strong>f Advances Received <strong>of</strong>f<br />
Year (As at end-<br />
March) No. Amount No. Amount No. Amount No. Amount<br />
1981+ 1 2 - - 3716 - - - -<br />
1982$ 4 9 31 2 - 1509 25 1055 15<br />
1983$ 9 33 7 13 - 147 28 127 20<br />
1984$ 18 54 10 14 - 255 62 237 32<br />
1985$ 22 72 23 25 - 454 115 467 114<br />
1986$ 34 105 30 67 - 630 141 644 176<br />
1987$ 45 132 40 88 - 1071 255 767 148<br />
1988-89** 94 217 81 157 10465 # 1528 364 # 1291 281<br />
1989-90 75 193 102 368 14094 1503 356 1599 347<br />
1990-91 84 244 76 249 16826 2088 505 1901 427<br />
1991-92 78 217 81 256 17362 1652 410 1591 360<br />
1992-93 130 260 118 243 19162 3681 883 2492 566<br />
1993-94 144 323 123 288 15503 4673 1168 3359 1026<br />
1994-95 190 379 193 409 14177 4793 1348 3912 1100<br />
3510<br />
1995-96 191 524 155 308 13847 6265 1841 @ 1031 @<br />
1996-97 118 270 101 292 11271 5997 1842 1312 403<br />
Conference on Global Competition & <strong>Competitiveness</strong> <strong>of</strong> <strong>India</strong>n Corporate 451
IIMK IIML<br />
1997-98 32 120 52 221 3376 541 184 1179 401<br />
1998-99 14 34 44 225 2813 757 218 4245 1188<br />
1999-00 14 26 71 139 39 889 219 4536 1195<br />
2000-01 3 14 17 54 5 75 22 679 171<br />
2001-02 1 1 4 5 1 - - 5 @@ 1 @@<br />
2002-03 2 - 2 1 - - - - -<br />
2003-04 - - - - - - - - -<br />
(No.in ' 000, Amount: Rs. in Crore)<br />
Source: Handbook <strong>of</strong> Statistics on <strong>India</strong>n Economy, Reserve Bank <strong>of</strong> <strong>India</strong>, 2003.<br />
Table XI gives the position with regard to flow <strong>of</strong> credit to SSI Sector. It depicts that there is a marginal increase in<br />
share <strong>of</strong> credit to SSI sector as a percentage <strong>of</strong> net bank credit.<br />
Table:XI Credit to SSI Sector from Public Sector Banks<br />
At the end <strong>of</strong> At the end <strong>of</strong> At the end <strong>of</strong> At the end <strong>of</strong> At the end <strong>of</strong><br />
March 1995 March 1996 March 1997 March 1998 March 1999<br />
Net Bank Credit 1,69,038 1,84,381 1,89,684, 2,18,219 2,46,203<br />
Credit to SSI 25,843 29,485 31,542 38,109 42,674<br />
No. <strong>of</strong> SSI Accounts (in<br />
lakhs)<br />
32.25 33.77 N.A. 29.64 N.A.<br />
SSI Credit as percentage<br />
<strong>of</strong> Net Bank Credit<br />
15.29 15.99 16.6 17.5 17.33<br />
Source: Handbook <strong>of</strong> Statistics on <strong>India</strong>n Economy, Reserve Bank <strong>of</strong> <strong>India</strong>, 2003.<br />
Conclusion<br />
<strong>Small</strong> industry sector has performed exceedingly well and enabled our country to achieve a<br />
wide measure <strong>of</strong> industrial growth and diversification. By its less capital intensive and high<br />
labor absorption nature, SSI sector has made significant contributions to employment generation<br />
and also to rural industrialization.<br />
Under the changing economic scenario, SSI has both the challenges and opportunities before<br />
them. The business can compete on cost, quality and products at domestic and international<br />
level only if ideal investment in technology production process, R&D and marketing are made.<br />
Infrastructure bottlenecks are not completely solved. The promotional activities for SSI in <strong>India</strong><br />
need to concentrate on improved credit flows, human resource development, appropriate<br />
technology and funds for modernization.<br />
So, this is the appropriate time to set up projects in the small-scale sector. It may be said that the<br />
stance is optimistic, indeed promising, given some protection. This expectation is based on an<br />
essential feature <strong>of</strong> the <strong>India</strong>n industry and the demand structures. The variety in the demand<br />
structures will ensure long-term co-existence <strong>of</strong> many layers <strong>of</strong> demand for consumer products /<br />
technologies / processes. There will be flourishing and well grounded markets for the same<br />
product/process, differentiated by quality, value added and sophistication. This characteristic <strong>of</strong><br />
the <strong>India</strong>n economy will allow complementary existence for various diverse types <strong>of</strong> units.<br />
References<br />
Pargal S., Mani, M., & Huq, M.(1997). Inspections and emissions in <strong>India</strong>: Puzzling survey evidence on<br />
industrial water pollution (World Bank Policy Research Working Paper # 1810).<br />
Parthasarathy, S. (1996). Whither small-scale industry? In The Hindu Survey <strong>of</strong> <strong>India</strong>n Industry, M/s (pp.<br />
14-26). Madras, <strong>India</strong>: Kasturi & Sons, National Press.<br />
Peattie, K. (1995). Environmental marketing management: Meeting the green challenge. London: Pitman.<br />
Porter, M. & Linde, C. (1995, Sept./Oct.). Green and competitive: Ending the stalemate. Harvard Business<br />
Review, 120-134.<br />
Conference on Global Competition & <strong>Competitiveness</strong> <strong>of</strong> <strong>India</strong>n Corporate 452
IIMK IIML<br />
Rajendran, S. (1989). Institutional support to SSIs. In The Hindu Survey <strong>of</strong> <strong>India</strong>n Industry, M/s (pp. 279-<br />
283). Madras, <strong>India</strong>: Kasturi & Sons.<br />
Roberts, Michael. (1995). <strong>India</strong>n public demands industry responsibility. Chemical Week, 157(1), 89.<br />
Schoemaker, P. & Schoemaker, J. (1995, spring). Estimating environmental liability?Quantifying the<br />
unknown. California Management Review, 29-61.<br />
Shaman, D. (1996). <strong>India</strong>?s pollution regulatory structure and background. U.S.A.: The World Bank.<br />
Retrieved from the World Wide Web: www.worldbank.org<br />
SIDBI report on small-scale industries sector, 1999. (1999). Lucknow, <strong>India</strong>: <strong>Small</strong> <strong>Industries</strong><br />
Development Bank <strong>of</strong> <strong>India</strong>.<br />
Tiwary, J. & Singh, B. (1990). Industrial development and its changing pattern in <strong>India</strong> during the Plan<br />
Period. In The <strong>India</strong>n Economic Association, conference volume, 73rd Annual Conference<br />
Muzaffarpur. (pp. 46-54). N.p.<br />
United States-Asia Environmental Partnership. (1996). Industry & environment in Asia: US-Asia<br />
Environmental Partnership. Retrieved from the World Wide Web: www.usaep.org<br />
Vedantam, V. (2000). <strong>India</strong>?s billionth. The Christian Century, 117(26), 945.<br />
Welford, R. & Bhargava, S. (1996). Corporate strategy and the environment: The theory. In Richard<br />
Welford (Ed.), Corporate environmental management: systems and strategies (pp. 13-32). London:<br />
Earthscan.<br />
Cornell, B. & Shapiro, A. (1987). Corporate stakeholders and corporate finance. Financial Management,<br />
16, 5-14.<br />
Dasgupta, S., Laplante, B., & Mamingi, N. (1998). Capital market responses to environmental performance<br />
in developing countries (World Bank Policy Research Working Paper # 1909). Retrieved from the<br />
World Wide Web: www.worldbank.org<br />
Dwivedi, O. P. & Khator, R. (1995). <strong>India</strong>'s environmental policy, programs and politics. In O.P. Dwivedi<br />
& D. K. Vajpeyi (Eds.), Environmental policies in the third world: A comparative analysis (pp.<br />
47-70). Westport, CT: Greenwood Press.<br />
Ehrlich, P. & Ehrlich, A. (1990). The Population Explosion. London: Arrow Ltd.<br />
Gupta, M. & Sharma, K. (1996, third quarter). Environmental operations management: An opportunity for<br />
improvement. Production and Inventory Management Journal, 40-46.<br />
Hart, S. (1997, Jan./Feb.). Beyond greening: Strategies for a sustainable world. Harvard Business Review,<br />
67-76.<br />
Johannson, L. (1994). Pr<strong>of</strong>its from green ventures. The Management Accounting Magazine (CMA), 68(7),<br />
17-21.<br />
Lau, R. & Srinivasan, R. (1997). Strategic issues <strong>of</strong> environmental management. South Dakota Business<br />
Review; 56(2), 1,4.<br />
Mani, M., Pargal, S., & Huq, M. (1996). Does environmental regulation matter? Determinants <strong>of</strong> the<br />
location <strong>of</strong> new manufacturing plants in <strong>India</strong> in 1994 (World Bank Policy Research Working<br />
Paper # 1718). Retrieved from the World Wide Web: www.worldbank.org<br />
Nyati, K. (1988). Problems <strong>of</strong> pollution and its control in small-scale industries.<br />
www.exim.indiamart.com<br />
************************<br />
Conference on Global Competition & <strong>Competitiveness</strong> <strong>of</strong> <strong>India</strong>n Corporate 453