Nitrogen and Phosphorus Optimize Barley Silage Production (Alberta)
Nitrogen and Phosphorus Optimize Barley Silage Production (Alberta)
Nitrogen and Phosphorus Optimize Barley Silage Production (Alberta)

Create successful ePaper yourself
Turn your PDF publications into a flip-book with our unique Google optimized e-Paper software.
A L B E R T A<br />
<strong>Nitrogen</strong> <strong>and</strong> <strong>Phosphorus</strong> <strong>Optimize</strong><br />
<strong>Barley</strong> <strong>Silage</strong> <strong>Production</strong><br />
By R.H. McKenzie, A. Middleton, E. Solberg, J. DeMulder, <strong>and</strong> H. Najda<br />
Feed dem<strong>and</strong>s for <strong>Alberta</strong>’s livestock<br />
industry result in some 800,000 acres of<br />
barley silage production each year.<br />
Farmers want high yielding, good quality<br />
silage, but have little information about the<br />
nutrient needs of today’s varieties. We initiated<br />
a three-year study to evaluate<br />
the yield potential <strong>and</strong><br />
fertilizer requirements of several<br />
new barley cultivars<br />
grown under irrigated <strong>and</strong> dry<br />
l<strong>and</strong> conditions at 10 to 12<br />
sites in Dark Brown, Black,<br />
Thin Black, <strong>and</strong> Gray-<br />
Wooded soils across <strong>Alberta</strong>.<br />
<strong>Barley</strong> silage is highly<br />
responsive to nitrogen (N)<br />
<strong>and</strong> phosphorus (P) fertilization.<br />
Varieties differ greatly<br />
in their dry matter production<br />
<strong>and</strong> quality, <strong>and</strong><br />
response to fertilization is<br />
variable, depending on the<br />
agro-climatic area.<br />
<strong>Phosphorus</strong> fertilizer is<br />
essential for optimum production,<br />
especially when<br />
soil test levels are low.<br />
<strong>Nitrogen</strong> Fertilization<br />
<strong>Barley</strong> silage has a high<br />
dem<strong>and</strong> for plant nutrients. A<br />
typical crop will remove 130<br />
to 180 lb of N, 40 to 60 lb of<br />
P 2 O 5 , 110 to 140 lb K 2 O <strong>and</strong> 15 to 20 lb sulfur<br />
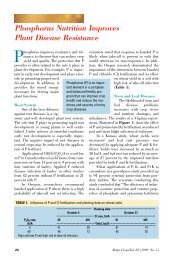
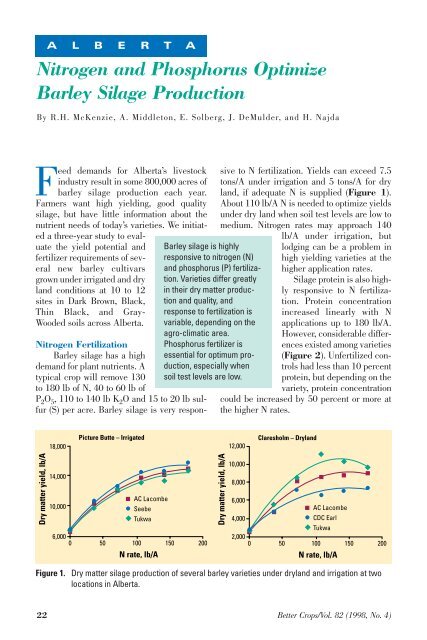
(S) per acre. <strong>Barley</strong> silage is very responsive<br />
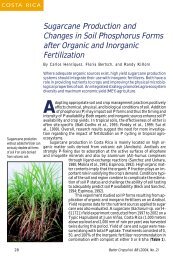
to N fertilization. Yields can exceed 7.5<br />
tons/A under irrigation <strong>and</strong> 5 tons/A for dry<br />
l<strong>and</strong>, if adequate N is supplied (Figure 1).<br />
About 110 lb/A N is needed to optimize yields<br />
under dry l<strong>and</strong> when soil test levels are low to<br />
medium. <strong>Nitrogen</strong> rates may approach 140<br />
lb/A under irrigation, but<br />
lodging can be a problem in<br />
high yielding varieties at the<br />
higher application rates.<br />
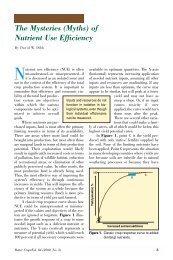
<strong>Silage</strong> protein is also highly<br />
responsive to N fertilization.<br />
Protein concentration<br />
increased linearly with N<br />
applications up to 180 lb/A.<br />
However, considerable differences<br />
existed among varieties<br />
(Figure 2). Unfertilized controls<br />
had less than 10 percent<br />
protein, but depending on the<br />
variety, protein concentration<br />
could be increased by 50 percent or more at<br />
the higher N rates.<br />
Dry matter yield, lb/A<br />
Picture Butte – Irrigated<br />
Claresholm – Dryl<strong>and</strong><br />
18,000<br />
12,000<br />
6,000 2,000<br />
0 50 100 150 200 0 50 100 150 200<br />
10,000<br />
14,000<br />
8,000<br />
AC Lacombe<br />
6,000<br />
10,000<br />
Seebe<br />
AC Lacombe<br />
Tukwa<br />
4,000<br />
CDC Earl<br />
Tukwa<br />
Dry matter yield, lb/A<br />
N rate, lb/A<br />
N rate, lb/A<br />
Figure 1. Dry matter silage production of several barley varieties under dryl<strong>and</strong> <strong>and</strong> irrigation at two<br />
locations in <strong>Alberta</strong>.<br />
22 Better Crops/Vol. 82 (1998, No. 4)
<strong>Phosphorus</strong> Fertilization<br />
Phosphate fertilizer significantly<br />
increased silage yield at 25<br />
of 32 site-year locations. Similar to<br />
N, varieties responded differently<br />
to applied P. Some varieties<br />
responded to P fertilization regardless<br />
of soil test level. However,<br />
when soil test P was 10 parts per<br />
million (ppm), or less, P increased<br />
yields at all sites except one. More<br />
than 70 percent of the sites<br />
responded to P fertilization when<br />
soil test P was between 10 <strong>and</strong> 20<br />
ppm. When soil test P was above<br />
20 ppm, the frequency of response<br />
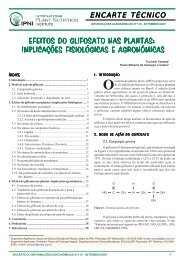
was less than 40 percent. Figure<br />
3 shows the magnitude of response<br />
observed to 60 lb/A P 2 O 5 at three<br />
locations in different agro-climatic<br />
areas. Applied P commonly<br />
increased yield by about 25 percent,<br />
but occasionally response<br />
was much higher. For example, P<br />
increased the dry matter yield of<br />
AC Certa from 6,812 lb/A to<br />
14,483 lb/A at a location in the<br />
Black soil zone (data not shown).<br />
Phosphate fertilization had no<br />
effect on silage protein at irrigated<br />
sites, but it did decrease protein in<br />
some of the dry l<strong>and</strong> sites. This<br />
was due to a dilution effect caused<br />
by the yield increase in response<br />
to applied P <strong>and</strong> suggests that<br />
additional N would have been<br />
required to maintain the protein<br />
levels at the higher yield.<br />
The authors are with <strong>Alberta</strong><br />
Agriculture, Food <strong>and</strong> Rural<br />
Development. Dr. McKenzie is Soil<br />
Fertility Specialist, at Lethbridge, AB.<br />
Mr. Middleton is Agronomy<br />
Technologist at Lethbridge. Mr. Solberg<br />
is Research Agronomist at Edmonton.<br />
Ms. DeMulder is Agronomy Research<br />
Coordinator at Edmonton. Mr. Najda is<br />
Forage Crops Agronomist at Brooks.<br />
Protein, %<br />
13<br />
11<br />
9<br />
7<br />
Picture Butte – Irrigated<br />
Duke<br />
5<br />
0 50 100 150 200<br />
N rate, lb/A<br />
Figure 2. Applied N increases protein concentration of<br />
several irrigated barley varieties in <strong>Alberta</strong>.<br />
Dry matter, lb/A<br />
6,500<br />
6,000<br />
5,500<br />
5,000<br />
4,500<br />
Chin - Brown Soil Zone<br />
Soil test P = 6 ppm<br />
-P +P<br />
AC Lacombe<br />
Seebe<br />
Tukwa<br />
CDC Earl<br />
4,000<br />
AC Lacombe CDC Earl Leduc Seebe Tukwa<br />
Strathmore - Dark Brown Soil Zone<br />
9,000<br />
Soil test P = 8 ppm<br />
8,500<br />
-P +P<br />
8,000<br />
7,500<br />
7,000<br />
6,500<br />
6,000<br />
AC Lacombe CDC Earl Leduc Seebe Tukwa<br />
9,000<br />
8,000<br />
7,000<br />
6,000<br />
5,000<br />
Ellerslie – Black Soil Zone<br />
Soil test P = 5.5 ppm<br />
-P +P<br />
4,000<br />
AC Lacombe CDC Earl Leduc Seebe Tukwa<br />
Variety<br />
Figure 3. Dry matter silage responds to P fertilization at sites<br />
in the Brown, Dark Brown, <strong>and</strong> Black soil zones in<br />
<strong>Alberta</strong>.<br />
Better Crops/Vol. 82 (1998, No. 4) 23