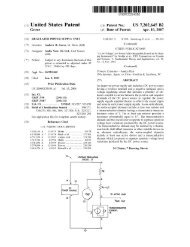
Which Tube Shall I Use - Tube CAD Journal
Which Tube Shall I Use - Tube CAD Journal
Which Tube Shall I Use - Tube CAD Journal

Create successful ePaper yourself
Turn your PDF publications into a flip-book with our unique Google optimized e-Paper software.
<strong>Which</strong> <strong>Tube</strong> <strong>Shall</strong> I <strong>Use</strong> ?<br />
GEORGE FLETCHER COOPER<br />
The author presents a lucid yet simplified description of the use of tube characteristic curves for the<br />
selection of the proper tube, from the standpoint of distortion, for a given application.<br />
I am always reading, and for that matter writing, articles on how to design this and that,<br />
especially in the way of audio amplifiers. My staff of trained statisticians estimates that if all the<br />
audio amplifiers which have been designed were set to operate at full output simultaneously,<br />
one in four of the population would be off to have their eardrums pierced. One thing, however,<br />
is scarcely mentioned: although I explain why I take feedback round from end to beginning, and<br />
my friend X tells you why he uses only local feedback, we rarely explain why we chose to use a<br />
particular tube in a particular place. Oliver Heaviside said somewhere, “Even Cambridge<br />
mathematicians deserve justice,” so I must rapidly plead that we do usually tell you why we<br />
chose our output stage tubes. My own personal choice for the 20-100 watt output stage is the<br />
EL34, even if it is a little harder to get than old faithfuls like the 6L6, just because I have found<br />
it very easy to drive. Maybe some of the newer tubes are even easier, but at the moment I have<br />
no reason to try to find out.<br />
The tube at the front end of the amplifier may choose itself, too, especially in portable<br />
equipment. My own personal feeling is that microphony is best treated by using the tube you<br />
like in its ruggedized version and providing some mechanical anti-shock system, while hum is<br />
rarely troublesome if the heater line is lifted up to about 20 volts above ground and is kept<br />
balanced. I am tempted to rectify the heater supply rather than use special tubes, but so far I<br />
have never been that desperate. As a result I am pretty free to choose the tubes right through the<br />
amplifier. There are some special considerations to be taken into account which will not affect<br />
most readers: when you are working on a whole range of equipment, spares inventories must be<br />
remembered or you find you need more space for spare tubes than for the operating installation.<br />
Designers of studio-frequency amplifiers usually adopt a figure of merit based on the ratio of<br />
transconductance to capacitance. Just how you combine input and output capacitance depends<br />
on the interstage coupling circuit. This is discussed in Terman and I do not propose to look it up<br />
and copy it down. A more sophisticated designer will go on to worry about grid-plate<br />
capacitance, the usual limiting factor in designing narrow-band r.f. amplifiers. And then—but<br />
we are, for now anyway, audio designers. What are we to do?<br />
The basic problem of the audio designer is to get gain without distortion. As you all know,<br />
you can trade gain for distortion by using negative feedback and you can also trade distortion<br />
for gain by using positive feedback. Not surprisingly, the bigger the deal the bigger the<br />
headache. Ideally each stage of an amplifier could then be used to maximum effect, but this<br />
really does involve quite a design job.<br />
<strong>Tube</strong> Data<br />
What we need in making our choice of tube type is some fairly simple criterion. In the old<br />
days the tube makers gave us a short set of tube data, curves and a couple of circuits all on a<br />
single small sheet of paper: now no self-respecting manufacturer would send out data sheets<br />
weighing less than the tube itself. What we need to do, therefore, is to find some way of<br />
summarizing this information into a form suitable for easy comparison between tubes.<br />
Most of the vital statistics of a tube seem to be included, for our purposes, in a single curve.<br />
This is the curve of transconductance against bias. From this curve we can derive a whole mass
of other information, and we can also just plot the curves for several different tubes on the same<br />
sheet of paper without getting into too much of a muddle. For some reason the textbook writers<br />
have never taken to this rather simple approach so that it is not nearly as widely known as it<br />
deserves.<br />
First of all, let us assume that we are working with pentodes. Then the characteristics of the<br />
tube are, for all practical purposes, independent of plate load. We write down the plate current I p<br />
as a function of grid voltage:<br />
2<br />
3<br />
Ip = Io<br />
+ α e<br />
g<br />
+ βeg<br />
+ γe<br />
g<br />
+ ...(1)<br />
In this expression e g is measured from the normal working point and represents the input<br />
signal. This corresponds to the practical arrangement in which the cathode is biased positive by<br />
the drop in the cathode resistor, the bias is held constant by a large decoupling capacitor and the<br />
grid is returned through a high resistance to ground. I p is just the plate current with no signal<br />
applied. To find the transconductance we differentiate, giving<br />
2<br />
α Ip / αeg<br />
= gm<br />
= α + 2βeg<br />
+ 3yeg<br />
+ ...(2)<br />
Of course we normally consider the transconductance to be the limiting value for very small<br />
signals, so that actually α is the transconductance given in tube data.<br />
In Eq. (2) we have written down<br />
dI<br />
p<br />
= gm<br />
de<br />
g<br />
This is just the same as writing down<br />
Ip = ∫g m<br />
α g<br />
provided we put in the proper limits. We know that if e p = e cg , the cut-off voltage, we must have<br />
I p = o and if e g = o the plate current is I o . Then<br />
I o<br />
= ∫<br />
0<br />
gmα<br />
e g<br />
e gc<br />
As I hope you remember, this is just the area under the g m – e g curve, the area shown shaded<br />
in Fig. 1. Therefore we can tell the price we must pay in plate current for any particular transconductance,<br />
and thus for any particular gain. The area under the curve, if it is of the form<br />
shown in Fig. 1, is most easily found by calculating the area of the triangle C'AP and then either<br />
counting squares or making a rough estimate of the area of the small wedge on the left.<br />
Remember, when doing this, that the average tube tolerances are quite large and do not, I beg<br />
you, try to work to 1 per cent, or even 5 per cent. It just doesn't mean a thing!
Fig. 1. A typical curve of transconductance against grid voltage. At P, the working point, the grid voltage is token<br />
to be zero, AO being the voltage of the cathode above ground. C is the cutoff point. The area shaded is the standing<br />
plate current.<br />
What else can we find out from this graph? Well, let us look again at Eq. (1), and assume that<br />
e g = e cos wt. It is, by the way, always a good thing to use cos wt rather than sin wt in harmonic<br />
calculations, because then there are no minus signs to make the expressions more awkward.<br />
Since e g = e cos wt, we have<br />
and<br />
e<br />
1<br />
wt = e<br />
2<br />
2 2 2<br />
2<br />
g<br />
= e cos (1+<br />
cos 2wt)<br />
e<br />
1 3<br />
wt = e - (3 cos wt<br />
4<br />
3 3 3<br />
g<br />
= e cos<br />
+<br />
Equation (1) therefore becomes<br />
cos 3wt)<br />
1 2 ⎛ 3 2 ⎞ 1 2 1 2<br />
Ip = Io<br />
+ β e + ⎜α<br />
+ γe<br />
⎟ e cos wt + βe<br />
cos 2wt + γe cos3wt<br />
+ ... (1a)<br />
2 ⎝ 4 ⎠ 2<br />
4<br />
This equation is correct as long as we are justified in neglecting anything above the third<br />
power of e g . Already, as you see, the steady component is affected by the γ term and the<br />
fundamental is affected by the ß term. These interactions are actually intermodulation effects<br />
in which the signal mixes with its own harmonies to produce other harmonics. The more<br />
terms we take, the more likely the editor is to say he doesn't like mathematics!<br />
If we simplify Eq. (1a) rather more by assuming that γ is zero, which means taking only<br />
second harmonic into account, and then turn to Eq. (2), we have<br />
g = α + 2β<br />
(2a)<br />
m<br />
e g<br />
Now let us differentiate this, giving
dg<br />
de<br />
m<br />
=<br />
g<br />
2β<br />
This means that ß is a measure of the slope of the transconductance characteristic. The ratio<br />
of second harmonic to fundamental in the plate current is<br />
1 2<br />
βe / α = eβ<br />
/ 2α<br />
2<br />
Let us look at Fig. 2, which is really only a part of Fig.1 redrawn. The signal drives the grid<br />
alternately to the right and the left of A with a total range of 2e (i.e. the peak-to-peak voltage).<br />
At P the transconductance is a, but the range over which the transconductance varies is 2 g ,<br />
The slope of the transconductance curve is thus 2g/2e= g/e. But this, we have just seen, is 2ß.<br />
Hence we have g = 2 ße and the ratio of second harmonic to fundamental becomes g/4α.<br />
Fig. 2. A signal drives the grid to a peak distance of e volts on either side of A,<br />
the reference point. The transconductance varies from α - g to α + g.<br />
It is, of course, very easy to find this just by looking at the tube characteristic.<br />
We want to have the largest gain, that is the largest value of a, for the smallest value of<br />
distortion, which in this case means the smallest value of g/4a. If we take gain/distortion as a<br />
figure of merit we have α 2 /4g, or since we are always comparing tubes and need not keep<br />
dividing everything by 4, we have α 2 /g as a gain/distortion figure of merit.<br />
Practical Example<br />
At this point we should, I suppose, look at some typical tubes. Skimming through a tube<br />
handbook I have picked out three tubes and have replotted their characteristics on the same scale,<br />
together, in Fig. 3. Choosing a working point at a bias of -1.6 volts and assuming a swing of ±<br />
0.4 volts, we have for these three:<br />
<strong>Tube</strong> a(transconductance) 2g (see Fig. 2) a 2 /g<br />
1 6AU6 3.5 1.4 17.5<br />
2 6BA6 4.0 1.0 32
3 6BS7 2.0 0.55 14.5<br />
Fig. 3. Comparison of three tube types operating at - 1.6 v. bias with a grid<br />
swing of ± 0.4 volts.<br />
It would appear, then, that the 6BA6 has the highest figure of merit, and that the low-g m tube,<br />
the 6BS7, although it produces less distortion than the 6AU6, does not pay off because it is better<br />
to accept the distortion for the sake of the extra gain.<br />
One thing will be noted, however. The 6BA6 curve is everywhere above the 6AU6 curve and in<br />
fact the current taken by the 6BA6 is about twice that taken by the 6AU6. We really should carry<br />
out another check of this sort, based on equal plate currents. Then we look at our particular<br />
problem and decide whether economy in current is important. Very often it is, even if only<br />
because it becomes easier to decouple the early stages from the power-supply disturbance<br />
originating in the output stage. In portable equipment every milliampere adds ounces to the<br />
weight of the smoothing components.<br />
It is worth while also working out what the distortion actually is : for our three tubes under the<br />
conditions given we have:
g/4α x 100 = 2nd harmonic distortion in per cent<br />
1. 6AU6 (0.7/14) x 100 = 5.0<br />
2. 6BA6 (0.5/16) x 100 = 3.12<br />
3. 6BS7 (0.275/8) x 100 = 3.44<br />
This shows us that we are favoring the 6BA6 for both distortion and gain. It also gives us<br />
some numbers to compare with the distortion in other parts of the amplifier, so that we can<br />
decide if this is our critical point or if we should be spending more time worrying about another<br />
stage.<br />
Triode Considerations<br />
We have now seen how to assess a pentode stage for its second harmonic distortion. Suppose,<br />
however, we are triode users. The answer then is, I'm afraid, it all depends on the tube maker. I<br />
have found one who provides me with curves of transconductance vs. grid voltage for three<br />
different plateloads, for the 12AT7, anyway. Sometimes you only get curves of µ and r p . When<br />
that happens you have to do rather more work.<br />
The gain of a triode stage is<br />
µR L /(r p +R L )<br />
so that the effective transconductance is µ / (r p + R L ) . It is tedious but not exhausting to tabulate<br />
µ and r p for different values of e g , then add R L to each r p and then work out this effective transconductance.<br />
To bring triodes into our general net we must do this. I think it is worthwhile, just<br />
because one unified approach does save quite a lot of thought and effort in the long run.<br />
While we are talking triodes let us deal with the effect of a local feedback loop. This is longhair<br />
language for leaving the cathode resistance without decoupling. (By the way, just what is the<br />
difference between the long-hair approach and the egg-head?). We know that the gain of the<br />
stage becomes<br />
µRL/[RL + rp(µ + 1)RK]<br />
And we have already decided that µ/ (R L + r p ) was the effective transconductance, which we<br />
will call g m . So the gain becomes<br />
⎛ 1 µ + 1 ⎞<br />
R<br />
⎜ + ⎟<br />
L/<br />
Rk<br />
⎝gm<br />
µ ⎠<br />
Now µ is always big enough for us to take ( µ + 1) µ =1. After all we shall probably use 20<br />
per cent tolerance components for R K . We thus have a new transconductance, the effective<br />
feedback transconductance g mf , which is given by<br />
1 = 1 + Rk<br />
g g<br />
mf<br />
m<br />
Let us look at Fig. 4. To make the work easier I have drawn a straight line g m characteristic<br />
and I have marked the g m , axis in the values of 1/g m . Thus at e g = 0 the g m is 10 mA/v, and 1/g m<br />
= 100 ohms. If we consider the effect of a cathode resistance of 100 ohms the value of 1/g m f is<br />
clearly, at this point, 100 + 100 = 200 ohms, so that g mf = 5.0 mA/v and we can plot this point.<br />
By working out a reasonable number of values in this way you can quite easily sketch in the<br />
curves shown in Fig. 4. You can do this for a pentode on the ordinary transconductance curve,<br />
and for a triode on the effective transconductance curve described earlier in this article.<br />
There is a rather interesting thing which appears if you draw out this set of curves very<br />
carefully, very large. When you work out the figure of merit for a swing from e g = o to e g =-2.5<br />
for the tube alone and for the tube with a 100-ohm cathode resistor, there is a small advantage in<br />
favor of the tube alone. It is less than 10 per cent better, which is not very much, of course. But<br />
the feedback does not quite reduce the distortion in the same proportion as it reduces the gain.
Just why this is so is a rather complicated question which I hope to discuss in another article.<br />
Another point about the R K = 100 and R K = 200 curves of Fig. 4 is that they are not, like the<br />
tube transconductance characteristic, straight lines.. Of course the practical tube<br />
transconductance itself would have some curvature, but adding the feedback seems to introduce<br />
some extra curvature. The result is, in fact, to add a third harmonic term. Physically this is<br />
produced by a mechanism of the following kind: we apply a cosine wave to the grid and<br />
produce some second harmonic in the cathode current. Because the cathode resistor is not<br />
decoupled the cathode voltage contains a second harmonic term. Between grid and cathode,<br />
then, we have a signal containing both fundamental and second harmonic. The tube now acts as<br />
a mixer, to produce terms of the (2f + f) and (2f - f) kind, of which the first is, obviously, the<br />
third harmonic.<br />
Fig, 4. The construction of these curves is described in the text.
Fig. 5. From the deviation of the transconductance curve from a straight line —the chord AB—we can find the third harmonic<br />
distortion.<br />
The transconductance curve contains information about this third harmonic. I am not going<br />
through the mathematics in detail, because it is rather lengthy and can be regarded as an exercise<br />
for the enthusiast. The practical result requires us to refer to the idealized characteristic of Fig. 5.<br />
Having chosen our working point P and the maximum signal amplitude ±e p we draw the chord<br />
AB across the transconductance curve. At P the transconductance is a. We measure the distance<br />
PC which we call δ. For Any input of less than e p , say e volts, the third harmonic distortion is<br />
3δ<br />
⎛<br />
⎜<br />
e<br />
α<br />
⎝ e p<br />
⎞<br />
⎟<br />
⎠<br />
2<br />
I am not going to apply this to the curves of Fig: 4, because it takes pretty accurate drawing.<br />
Looking back to our second harmonic expression g/4α we see that if δ = g/12 the second and<br />
third harmonics will be equal. You need to look pretty closely to check on the third harmonic.<br />
I think we can now get a rough idea of when local feedback will really be profitable. Most<br />
tubes tend to have transconductance characteristics which sag below the straight line I have<br />
been drawing so glibly. A little cathode feedback produces a curvature in the opposite<br />
direction. By careful choice of the cathode resistor you can get a pretty good linear<br />
characteristic and then, going push-pull, balance out the second harmonic. I remember that this
worked out very well indeed with the 5763, though I have no figures at hand now to show the<br />
improvement.<br />
Some readers may feel that all this is just a paper exercise. Maybe so, if you can afford to buy<br />
the wrong tubes. But if you want to get the best performance out of something you design<br />
yourself it is worth-while to sit down for a few hours and think before you put your money on<br />
the counter.