Download Document - Universities UK
Download Document - Universities UK
Download Document - Universities UK

Create successful ePaper yourself
Turn your PDF publications into a flip-book with our unique Google optimized e-Paper software.
Higher education in<br />
FACTS &<br />
FIGURES<br />
SUMMER 2007
Woburn House<br />
20 Tavistock Square<br />
London WC1H 9HQ<br />
Tel +44 (0)20 7419 4111<br />
Fax +44 (0)20 7388 8649<br />
Email info@<strong>Universities</strong><strong>UK</strong>.ac.uk<br />
Web www.<strong>Universities</strong><strong>UK</strong>.ac.uk<br />
Summer 2007
STAFF<br />
FINANCE<br />
Higher education in facts and figures covers the<br />
whole of the <strong>UK</strong> higher education sector. The<br />
data is derived from a variety of sources,<br />
please see the notes to each table.<br />
Further information can be obtained from:<br />
<strong>Universities</strong> <strong>UK</strong><br />
Tel +44 (0)20 7419 4111<br />
Web www.<strong>Universities</strong><strong>UK</strong>.ac.uk<br />
Email info@<strong>Universities</strong><strong>UK</strong>.ac.uk<br />
Higher Education Statistics Agency (HESA)<br />
Tel +44 (0)1242 255 577<br />
Web www.hesa.ac.uk<br />
Email information.provision@hesa.ac.uk<br />
<strong>Universities</strong> & Colleges Admissions<br />
Service for the <strong>UK</strong> (UCAS)<br />
Tel +44 (0)1242 222 4444<br />
Web www.ucas.ac.uk<br />
Email stats@ucas.ac.uk<br />
About <strong>Universities</strong> <strong>UK</strong><br />
<strong>Universities</strong> <strong>UK</strong> is the major representative<br />
body and membership organisation for the<br />
higher education sector. It represents the <strong>UK</strong>'s<br />
universities and some higher education<br />
colleges. Its 130 members are the executive<br />
heads of these institutions.<br />
<strong>Universities</strong> <strong>UK</strong> works closely with policy<br />
makers and key education stakeholders to<br />
advance the interests of universities and to<br />
spread good practice throughout the higher<br />
education sector.<br />
Founded in 1918 and formerly known as the<br />
Committee for Vice-Chancellors and Principals<br />
(CVCP), <strong>Universities</strong> <strong>UK</strong> will celebrate its 90th<br />
anniversary in 2008.<br />
ACADEMIC STAFF AT <strong>UK</strong> HIGHER EDUCATION INSTITUTIONS (HEIs): 2005/06<br />
Excluding atypical<br />
Full-time Part-time Total<br />
Total academic staff 111,412 53,465 164,877<br />
% female 37% 53% 42%<br />
% wholly institutionally financed 72% 87% 77%<br />
% financed by NHS/general 3% 3% 3%<br />
medical or general dental<br />
practice or Department of Health<br />
% research only 28% 12% 23%<br />
% disabled (1) 2% 2% 2%<br />
% of non-<strong>UK</strong> nationality 22% 14% 19%<br />
% with doctorate as highest qualification 53% 19% 42%<br />
Academic staff by grade<br />
% female<br />
Professors 14,051 1,457 15,507 17%<br />
Senior lecturers & researchers 24,590 3,624 28,213 34%<br />
Lecturers 34,975 18,594 53,569 47%<br />
Researchers 29,259 5,636 34,895 46%<br />
Other grades 8,538 24,155 32,692 49%<br />
Total 111,412 53,465 164,877 42%<br />
Academic staff by age<br />
% aged under 35 26% 25% 26%<br />
% aged 55 or over 17% 24% 19%<br />
Academic staff are defined as those staff whose primary function is teaching and/or research and include only<br />
those of at least 25% full-time equivalence.<br />
Full-time staff are those whose contracts state that their mode of employment is full-time; Age is at 31 August<br />
2005.<br />
(1) Based on those staff with known disability status. Disability status is self declared.<br />
Source: Higher Education Statistics Agency (HESA) (2007): Resources of Higher Education Institutions 2005/06, tables 5,<br />
8, 9, 16, 17, 18, 18a, and 18b.<br />
SIZE OF HIGHER EDUCATION INSTITUTIONS: 2005/06<br />
Income Number of Total numbers of Number of<br />
institutions HE students institutions<br />
(headcounts)<br />
Less than £10m 14 Less than 1,000 20<br />
£10 – 20m 21 1,000 – 5,000 27<br />
£20 – 50m 24 5,000 – 10,000 25<br />
£50 –80m 19 10,000 – 15,000 28<br />
£80 –120m 29 15,000 – 20,000 20<br />
£120 – 150m 23 More than 20,000 47<br />
More than £150m 38<br />
Average number<br />
Average income<br />
of students<br />
(headcounts)<br />
Mean £116m Mean 13,989<br />
Median £88m Median 12,720<br />
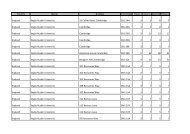
NUMBER OF INSTITUTIONS (AS AT AUGUST 2007)<br />
Higher education<br />
institutions<br />
<strong>Universities</strong>*<br />
England 132 88<br />
Scotland 20 13<br />
Wales 12 3<br />
Northern Ireland 4 2<br />
United Kingdom 168 106<br />
* Federal institutions such as the University of Wales and the University of London are counted as one university.<br />
There are also a significant number of further education colleges at which higher education students study.<br />
This list excludes foreign higher education institutions operating in the <strong>UK</strong>.<br />
The Open University operates in all countries of the <strong>UK</strong>; its headquarters is based in England however.<br />
Source: Higher Education Funding Council for England, Scottish Funding Council, Higher Education Funding Council for<br />
Wales, Department for Employment and Learning, Northern Ireland.<br />
HEIs’ INCOME FROM NON-EU DOMICILE STUDENTS: 1994/95–2005/06 (AND<br />
NON-<strong>UK</strong> DOMICILE STUDENT NUMBERS*)<br />
£ million, cash terms<br />
1600<br />
1400<br />
1200<br />
1000<br />
800<br />
600<br />
400<br />
200<br />
0<br />
97,997<br />
£445m<br />
1994/<br />
1995<br />
111,480 109,940<br />
£507m<br />
1995/<br />
1996<br />
£563m<br />
1996/<br />
1997<br />
116,840 117,290<br />
£622m<br />
1997/<br />
1998<br />
1998/<br />
1999<br />
1999/<br />
2000<br />
2000/<br />
2001<br />
2001/<br />
2002<br />
INCOME AND EXPENDITURE OF <strong>UK</strong> HEIs: 2005/06<br />
£636m<br />
122,150<br />
£672m<br />
136,295<br />
£746m<br />
152,620<br />
£875m<br />
173,985<br />
£1,085m<br />
2002/<br />
2003<br />
199,225<br />
£1,275m<br />
2003/<br />
2004<br />
214,690<br />
£1,396m<br />
2004/<br />
2005<br />
219,175<br />
£1,499m<br />
2005/<br />
2006<br />
250,000<br />
200,000<br />
150,000<br />
100,000<br />
50,000<br />
* Excluding students from European Economic Area (EEA) countries.<br />
Source: Higher Education Statistics Agency (HESA) (2007): Resources of Higher Education Institutions 2005/06, Table 1b,<br />
Students in Higher Education Institutions 2005/06, Table 6; <strong>Universities</strong> <strong>UK</strong> analysis.<br />
Research grants<br />
& contracts<br />
16%<br />
Income, £19.5bn<br />
Endowment &<br />
investment income<br />
2%<br />
Other income<br />
20%<br />
Funding Council<br />
grants<br />
39%<br />
Other<br />
operating<br />
expenses<br />
36%<br />
Expenditure, £19.3bn<br />
Interest payable<br />
1%<br />
0<br />
Student numbers (headcount)<br />
Staff costs<br />
58%<br />
PUBLIC EXPENDITURE ON<br />
TERTIARY EDUCATION<br />
INSTITUTIONS AS A<br />
PERCENTAGE OF GDP: 2003<br />
Finland 1.7<br />
Denmark 1.7<br />
Switzerland 1.6<br />
Sweden 1.6<br />
Norway 1.5<br />
Canada 1.3<br />
United States 1.2<br />
Greece 1.2<br />
Belgium 1.2<br />
France 1.1<br />
Iceland 1.1<br />
Austria 1.1<br />
Netherlands 1.1<br />
Turkey 1.1<br />
Hungary 1.0<br />
Portugal 1.0<br />
Poland 1.0<br />
Ireland 1.0<br />
Germany 1.0<br />
Spain 0.9<br />
New Zealand 0.9<br />
Mexico 0.9<br />
Czech Republic 0.9<br />
United Kingdom 0.8<br />
Slovak Republic 0.8<br />
Australia 0.8<br />
Italy 0.7<br />
Korea 0.6<br />
Japan 0.5<br />
OECD average 1.1<br />
Source: Organisation for Economic Cooperation<br />
and Development (OECD) (2006): Education at a<br />
Glance: OECD Indicators 2006, table B2,1b.<br />
This table includes all publicly funded <strong>UK</strong> HEIs and the University of Buckingham.<br />
Source: Higher Education Statistics Agency (HESA) (2007): Resources of Higher Education Institutions 2005/06, table<br />
1a, Students in Higher Education Institutions 2005/06, table 0a, and table 8; <strong>Universities</strong> <strong>UK</strong> analysis.<br />
Non-EU domicile<br />
HE fees<br />
8% Part-time <strong>UK</strong><br />
and EU HE fees<br />
2%<br />
Other fees and<br />
support grants<br />
(incl. NCB HE fees)<br />
Full-time <strong>UK</strong> 2%<br />
and EU HE fees<br />
11%<br />
Depreciation<br />
5%<br />
Source: Higher Education Statistics Agency (HESA) (2007) : Resources of Higher Education Institutions 2005/06,<br />
tables 1, 2a, and 2b.<br />
Z-CARD ® PocketMedia ® (trade marks used by Z Industries Ltd under<br />
licence). This product is a doubly-folded sheet card. These products and<br />
associated machinery and processes are subject to <strong>UK</strong>, European and<br />
Worldwide patents granted and pending, copyright, trade marks and other<br />
intellectual property rights including European patent numbers EP 602090. ©<br />
2007 Z Industries Ltd. Produced under licence by Z-CARD ® LTD, London<br />
Z-Card info<br />
Tel +44 (0)207 924 5147 info-uk@zcard.com<br />
www.zcard.com No. 24456/30 (1:2)
STUDENTS<br />
APPLICANTS FOR ADMISSION, <strong>UK</strong> HIGHER EDUCATION INSTITUTIONS: 2004–06<br />
Thousands<br />
For entry to academic year 2004 2005 2006<br />
Appls Accep % Appls Accep % Appls Accep %<br />
Total 486 378 78% 522 405 78% 506 391 77%<br />
Men 224 176 78% 239 188 79% 229 181 79%<br />
Women 262 202 77% 283 217 77% 277 210 76%<br />
% Women 54% 53% 54% 54% 55% 54%<br />
<strong>UK</strong> domiciled students 413 334 81% 445 360 81% 432 346 80%<br />
Overseas students* 73 43 59% 78 45 58% 74 45 61%<br />
% from abroad* 15% 11% 15% 11% 15% 12%<br />
* Includes EU domiciled and non-EU domiciled applicants.<br />
Sources: <strong>Universities</strong> and Colleges Admission Service (UCAS), 2003–2006.<br />
PARTICIPATION RATES: 1998–2006<br />
Percentage<br />
Appls = Applicants Accep = Accepted applicants % = Percentage accepted applicants<br />
1998/99 1999/2000 2000/01 2001/02 2002/03 2003/04 2004/05 2005/06*<br />
HEIPR – English domiciled students – 39 40 40 41 40 41 43<br />
API Scots-domiciled students 48 49 52 52 49 49 46 47<br />
Higher Education Age Participation Index (NI) 41 45 46 46 46 44 45 –<br />
HIGHER EDUCATION FULL-TIME AND PART-TIME STUDENTS: 2005/06<br />
Full-time* Part-time All students<br />
First degree<br />
United Kingdom 952,535 196,120 1,148,655<br />
Other European Union 45,455 2,645 48,100<br />
Non-European-Union 75,785 6,320 82,105<br />
Total 1,073,775 205,085 1,278,860<br />
Other undergraduate<br />
United Kingdom 114,350 369,245 483,595<br />
Other European Union 3,315 7,775 11,090<br />
Non-European-Union 7,385 9,820 17,205<br />
Total 125,050 386,840 511,890<br />
Postgraduate<br />
United Kingdom 117,520 256,265 373,785<br />
Other European Union 28,590 18,445 47,035<br />
Non-European-Union 88,110 36,435 124,545<br />
Total 234,220 311,145 545,365<br />
All students<br />
United Kingdom 1,184,405 821,630 2,006,035<br />
Other European Union 77,360 28,865 106,225<br />
Non-European-Union 171,275 52,580 223,855<br />
Total 1,433,040 903,075 2,336,115<br />
* Full-time and sandwich course students and those on a study-related year out.<br />
Source: Higher Education Statistics Agency (HESA): Students in Higher Education Institutions 2005/06, table 1.<br />
TRENDS IN HIGHER EDUCATION<br />
STUDENT NUMBERS AT <strong>UK</strong> HIGHER<br />
EDUCATION INSTITUTIONS:<br />
1994/95–2005/06<br />
1994/95 2005/06 %<br />
increase<br />
Undergraduate 1,231,988 1,790,740 45%<br />
full-time 946,919 1,198,820 27%<br />
part-time 285,069 591,925 108%<br />
Postgraduate 335,325 545,370 63%<br />
full-time 129,711 234,220 81%<br />
part-time 205,614 311,150 51%<br />
All students 1,567,313 2,336,110 49%<br />
Source: Higher Education Statistics Agency (HESA)<br />
(1996 and 2007): Students in Higher Education<br />
Institutions, various years.<br />
NOTES<br />
* Provisional.<br />
HEIPR = Higher education initial participation rate for 17-30 year olds – see DfES SFR 14/2006.<br />
API Scottish-domiciled students = under 21 Scottish entrants to HE as % of population in Scotland for the relevant age group in Scotland.<br />
NI participation in HE = under 21 full-time new entrants to HE in NI, GB or the Republic of Ireland/18 year olds in NI population.<br />
Source: Department for Education and Skills (DfES), Scottish Executive, Department for Employment and Learning Northern Ireland (DELNI).<br />
FULL-TIME & PART-TIME HIGHER EDUCATION STUDENTS BY SUBJECT AREA, <strong>UK</strong>: 2005/06<br />
First degree Other undergraduate Postgraduate Total<br />
Full-time* Part-time Full-time* Part-time Full-time* Part-time<br />
Medicine & dentistry 40,650 70 385 85 6,780 11,615 59,585<br />
Subjects allied to medicine 83,395 34,265 68,265 76,785 9,205 37,485 309,400<br />
Biological sciences 101,345 15,870 3,235 5,740 14,920 14,115 155,225<br />
Veterinary science 3,570 30 0 0 520 345 4,465<br />
Agriculture & related subjects 7,365 470 2,675 3,790 1,580 1,390 17,270<br />
Physical sciences 48,945 7,095 880 5,510 13,210 7,100 82,740<br />
Mathematical sciences 20,395 3,765 370 1,970 3,285 2,640 32,425<br />
Computer science 59,445 12,025 6,020 19,420 12,800 10,440 120,150<br />
Engineering & technology 70,775 9,765 5,130 12,050 21,735 17,245 136,700<br />
Architecture, building & planning 25,020 7,315 2,540 6,425 5,725 9,420 56,445<br />
Social studies 103,180 21,190 3,145 28,455 22,900 22,205 201,075<br />
Law 51,110 10,330 1,235 2,965 13,370 10,570 89,580<br />
Business & administrative studies 140,040 17,235 12,125 31,250 39,950 63,805 304,405<br />
Mass communications & documentation 32,970 1,575 1,445 1,685 5,455 4,675 47,805<br />
Languages 73,660 8,955 2,230 36,605 9,625 8,110 139,185<br />
Historical & philosophical studies 51,210 13,325 735 17,610 7,525 11,045 101,450<br />
Creative arts & design 113,625 4,555 9,635 12,200 9,210 6,960 156,185<br />
Education 40,780 9,455 3,605 47,770 36,155 69,940 207,705<br />
Combined 6,295 27,800 1,390 76,525 260 2,045 114,315<br />
Total 1,073,775 205,085 125,045 386,840 234,220 311,150 2,336,115<br />
* Full-time and sandwich course students and those on a study-related year out.<br />
Source: Higher Education Statistics Agency (HESA): Students in Higher Education Institutions 2005/06, tables 2a-d.<br />
HIGHER EDUCATION QUALIFICATIONS AWARDED AT <strong>UK</strong> HIGHER<br />
EDUCATION INSTITUTIONS: 2005/06<br />
Full-time Part-time* Total<br />
First degrees 278,385 37,600 315,985<br />
Other UG qualifications 48,565 78,020 126,585<br />
Doctorates 12,950 3,565 16,515<br />
Other higher degrees 77,945 30,615 108,560<br />
PGCE 25,550 3,445 28,995<br />
Other PG qualifications 15,150 29,055 44,205<br />
Total 458,545 182,300 640,845<br />
* Part-time students are those whose study was recorded as part-time, or studying full-time on courses<br />
lasting less than 24 weeks, on block release, or studying during the evenings.<br />
Source: Higher Education Statistics Agency (HESA): Students in Higher Education Institutions 2005/06, table 14.<br />
HIGHER EDUCATION STUDENTS IN THE <strong>UK</strong> BY COUNTRY OF INSTITUTION:<br />
2005/06<br />
Undergraduates Postgraduates All<br />
Full-time* Part-time Full-time* Part-time<br />
England 976,815 505,165 196,735 257,705 1,936,420<br />
Wales 64,780 39,175 10,210 15,065 129,230<br />
Scotland 125,535 36,310 23,290 30,695 215,830<br />
Northern Ireland 31,690 11,270 3,990 7,680 54,630<br />
United Kingdom total 2,336,110<br />
* Full-time and sandwich course students and those on a study related year out.<br />
Source: Higher Education Statistics Agency (HESA): Students in Higher Education Institutions 2005/06, table 0a.