Download Document - Universities UK
Download Document - Universities UK
Download Document - Universities UK

You also want an ePaper? Increase the reach of your titles
YUMPU automatically turns print PDFs into web optimized ePapers that Google loves.
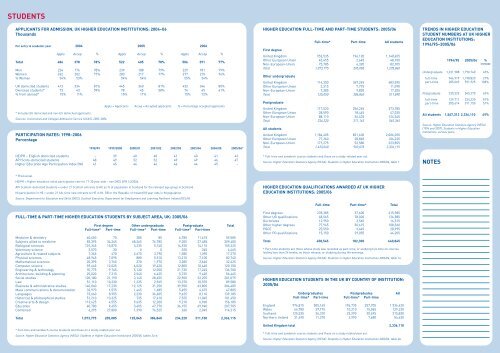
STUDENTS<br />
APPLICANTS FOR ADMISSION, <strong>UK</strong> HIGHER EDUCATION INSTITUTIONS: 2004–06<br />
Thousands<br />
For entry to academic year 2004 2005 2006<br />
Appls Accep % Appls Accep % Appls Accep %<br />
Total 486 378 78% 522 405 78% 506 391 77%<br />
Men 224 176 78% 239 188 79% 229 181 79%<br />
Women 262 202 77% 283 217 77% 277 210 76%<br />
% Women 54% 53% 54% 54% 55% 54%<br />
<strong>UK</strong> domiciled students 413 334 81% 445 360 81% 432 346 80%<br />
Overseas students* 73 43 59% 78 45 58% 74 45 61%<br />
% from abroad* 15% 11% 15% 11% 15% 12%<br />
* Includes EU domiciled and non-EU domiciled applicants.<br />
Sources: <strong>Universities</strong> and Colleges Admission Service (UCAS), 2003–2006.<br />
PARTICIPATION RATES: 1998–2006<br />
Percentage<br />
Appls = Applicants Accep = Accepted applicants % = Percentage accepted applicants<br />
1998/99 1999/2000 2000/01 2001/02 2002/03 2003/04 2004/05 2005/06*<br />
HEIPR – English domiciled students – 39 40 40 41 40 41 43<br />
API Scots-domiciled students 48 49 52 52 49 49 46 47<br />
Higher Education Age Participation Index (NI) 41 45 46 46 46 44 45 –<br />
HIGHER EDUCATION FULL-TIME AND PART-TIME STUDENTS: 2005/06<br />
Full-time* Part-time All students<br />
First degree<br />
United Kingdom 952,535 196,120 1,148,655<br />
Other European Union 45,455 2,645 48,100<br />
Non-European-Union 75,785 6,320 82,105<br />
Total 1,073,775 205,085 1,278,860<br />
Other undergraduate<br />
United Kingdom 114,350 369,245 483,595<br />
Other European Union 3,315 7,775 11,090<br />
Non-European-Union 7,385 9,820 17,205<br />
Total 125,050 386,840 511,890<br />
Postgraduate<br />
United Kingdom 117,520 256,265 373,785<br />
Other European Union 28,590 18,445 47,035<br />
Non-European-Union 88,110 36,435 124,545<br />
Total 234,220 311,145 545,365<br />
All students<br />
United Kingdom 1,184,405 821,630 2,006,035<br />
Other European Union 77,360 28,865 106,225<br />
Non-European-Union 171,275 52,580 223,855<br />
Total 1,433,040 903,075 2,336,115<br />
* Full-time and sandwich course students and those on a study-related year out.<br />
Source: Higher Education Statistics Agency (HESA): Students in Higher Education Institutions 2005/06, table 1.<br />
TRENDS IN HIGHER EDUCATION<br />
STUDENT NUMBERS AT <strong>UK</strong> HIGHER<br />
EDUCATION INSTITUTIONS:<br />
1994/95–2005/06<br />
1994/95 2005/06 %<br />
increase<br />
Undergraduate 1,231,988 1,790,740 45%<br />
full-time 946,919 1,198,820 27%<br />
part-time 285,069 591,925 108%<br />
Postgraduate 335,325 545,370 63%<br />
full-time 129,711 234,220 81%<br />
part-time 205,614 311,150 51%<br />
All students 1,567,313 2,336,110 49%<br />
Source: Higher Education Statistics Agency (HESA)<br />
(1996 and 2007): Students in Higher Education<br />
Institutions, various years.<br />
NOTES<br />
* Provisional.<br />
HEIPR = Higher education initial participation rate for 17-30 year olds – see DfES SFR 14/2006.<br />
API Scottish-domiciled students = under 21 Scottish entrants to HE as % of population in Scotland for the relevant age group in Scotland.<br />
NI participation in HE = under 21 full-time new entrants to HE in NI, GB or the Republic of Ireland/18 year olds in NI population.<br />
Source: Department for Education and Skills (DfES), Scottish Executive, Department for Employment and Learning Northern Ireland (DELNI).<br />
FULL-TIME & PART-TIME HIGHER EDUCATION STUDENTS BY SUBJECT AREA, <strong>UK</strong>: 2005/06<br />
First degree Other undergraduate Postgraduate Total<br />
Full-time* Part-time Full-time* Part-time Full-time* Part-time<br />
Medicine & dentistry 40,650 70 385 85 6,780 11,615 59,585<br />
Subjects allied to medicine 83,395 34,265 68,265 76,785 9,205 37,485 309,400<br />
Biological sciences 101,345 15,870 3,235 5,740 14,920 14,115 155,225<br />
Veterinary science 3,570 30 0 0 520 345 4,465<br />
Agriculture & related subjects 7,365 470 2,675 3,790 1,580 1,390 17,270<br />
Physical sciences 48,945 7,095 880 5,510 13,210 7,100 82,740<br />
Mathematical sciences 20,395 3,765 370 1,970 3,285 2,640 32,425<br />
Computer science 59,445 12,025 6,020 19,420 12,800 10,440 120,150<br />
Engineering & technology 70,775 9,765 5,130 12,050 21,735 17,245 136,700<br />
Architecture, building & planning 25,020 7,315 2,540 6,425 5,725 9,420 56,445<br />
Social studies 103,180 21,190 3,145 28,455 22,900 22,205 201,075<br />
Law 51,110 10,330 1,235 2,965 13,370 10,570 89,580<br />
Business & administrative studies 140,040 17,235 12,125 31,250 39,950 63,805 304,405<br />
Mass communications & documentation 32,970 1,575 1,445 1,685 5,455 4,675 47,805<br />
Languages 73,660 8,955 2,230 36,605 9,625 8,110 139,185<br />
Historical & philosophical studies 51,210 13,325 735 17,610 7,525 11,045 101,450<br />
Creative arts & design 113,625 4,555 9,635 12,200 9,210 6,960 156,185<br />
Education 40,780 9,455 3,605 47,770 36,155 69,940 207,705<br />
Combined 6,295 27,800 1,390 76,525 260 2,045 114,315<br />
Total 1,073,775 205,085 125,045 386,840 234,220 311,150 2,336,115<br />
* Full-time and sandwich course students and those on a study-related year out.<br />
Source: Higher Education Statistics Agency (HESA): Students in Higher Education Institutions 2005/06, tables 2a-d.<br />
HIGHER EDUCATION QUALIFICATIONS AWARDED AT <strong>UK</strong> HIGHER<br />
EDUCATION INSTITUTIONS: 2005/06<br />
Full-time Part-time* Total<br />
First degrees 278,385 37,600 315,985<br />
Other UG qualifications 48,565 78,020 126,585<br />
Doctorates 12,950 3,565 16,515<br />
Other higher degrees 77,945 30,615 108,560<br />
PGCE 25,550 3,445 28,995<br />
Other PG qualifications 15,150 29,055 44,205<br />
Total 458,545 182,300 640,845<br />
* Part-time students are those whose study was recorded as part-time, or studying full-time on courses<br />
lasting less than 24 weeks, on block release, or studying during the evenings.<br />
Source: Higher Education Statistics Agency (HESA): Students in Higher Education Institutions 2005/06, table 14.<br />
HIGHER EDUCATION STUDENTS IN THE <strong>UK</strong> BY COUNTRY OF INSTITUTION:<br />
2005/06<br />
Undergraduates Postgraduates All<br />
Full-time* Part-time Full-time* Part-time<br />
England 976,815 505,165 196,735 257,705 1,936,420<br />
Wales 64,780 39,175 10,210 15,065 129,230<br />
Scotland 125,535 36,310 23,290 30,695 215,830<br />
Northern Ireland 31,690 11,270 3,990 7,680 54,630<br />
United Kingdom total 2,336,110<br />
* Full-time and sandwich course students and those on a study related year out.<br />
Source: Higher Education Statistics Agency (HESA): Students in Higher Education Institutions 2005/06, table 0a.