Download Document - Universities UK
Download Document - Universities UK
Download Document - Universities UK

You also want an ePaper? Increase the reach of your titles
YUMPU automatically turns print PDFs into web optimized ePapers that Google loves.
STAFF<br />
FINANCE<br />
Higher education in facts and figures covers the<br />
whole of the <strong>UK</strong> higher education sector. The<br />
data is derived from a variety of sources,<br />
please see the notes to each table.<br />
Further information can be obtained from:<br />
<strong>Universities</strong> <strong>UK</strong><br />
Tel +44 (0)20 7419 4111<br />
Web www.<strong>Universities</strong><strong>UK</strong>.ac.uk<br />
Email info@<strong>Universities</strong><strong>UK</strong>.ac.uk<br />
Higher Education Statistics Agency (HESA)<br />
Tel +44 (0)1242 255 577<br />
Web www.hesa.ac.uk<br />
Email information.provision@hesa.ac.uk<br />
<strong>Universities</strong> & Colleges Admissions<br />
Service for the <strong>UK</strong> (UCAS)<br />
Tel +44 (0)1242 222 4444<br />
Web www.ucas.ac.uk<br />
Email stats@ucas.ac.uk<br />
About <strong>Universities</strong> <strong>UK</strong><br />
<strong>Universities</strong> <strong>UK</strong> is the major representative<br />
body and membership organisation for the<br />
higher education sector. It represents the <strong>UK</strong>'s<br />
universities and some higher education<br />
colleges. Its 130 members are the executive<br />
heads of these institutions.<br />
<strong>Universities</strong> <strong>UK</strong> works closely with policy<br />
makers and key education stakeholders to<br />
advance the interests of universities and to<br />
spread good practice throughout the higher<br />
education sector.<br />
Founded in 1918 and formerly known as the<br />
Committee for Vice-Chancellors and Principals<br />
(CVCP), <strong>Universities</strong> <strong>UK</strong> will celebrate its 90th<br />
anniversary in 2008.<br />
ACADEMIC STAFF AT <strong>UK</strong> HIGHER EDUCATION INSTITUTIONS (HEIs): 2005/06<br />
Excluding atypical<br />
Full-time Part-time Total<br />
Total academic staff 111,412 53,465 164,877<br />
% female 37% 53% 42%<br />
% wholly institutionally financed 72% 87% 77%<br />
% financed by NHS/general 3% 3% 3%<br />
medical or general dental<br />
practice or Department of Health<br />
% research only 28% 12% 23%<br />
% disabled (1) 2% 2% 2%<br />
% of non-<strong>UK</strong> nationality 22% 14% 19%<br />
% with doctorate as highest qualification 53% 19% 42%<br />
Academic staff by grade<br />
% female<br />
Professors 14,051 1,457 15,507 17%<br />
Senior lecturers & researchers 24,590 3,624 28,213 34%<br />
Lecturers 34,975 18,594 53,569 47%<br />
Researchers 29,259 5,636 34,895 46%<br />
Other grades 8,538 24,155 32,692 49%<br />
Total 111,412 53,465 164,877 42%<br />
Academic staff by age<br />
% aged under 35 26% 25% 26%<br />
% aged 55 or over 17% 24% 19%<br />
Academic staff are defined as those staff whose primary function is teaching and/or research and include only<br />
those of at least 25% full-time equivalence.<br />
Full-time staff are those whose contracts state that their mode of employment is full-time; Age is at 31 August<br />
2005.<br />
(1) Based on those staff with known disability status. Disability status is self declared.<br />
Source: Higher Education Statistics Agency (HESA) (2007): Resources of Higher Education Institutions 2005/06, tables 5,<br />
8, 9, 16, 17, 18, 18a, and 18b.<br />
SIZE OF HIGHER EDUCATION INSTITUTIONS: 2005/06<br />
Income Number of Total numbers of Number of<br />
institutions HE students institutions<br />
(headcounts)<br />
Less than £10m 14 Less than 1,000 20<br />
£10 – 20m 21 1,000 – 5,000 27<br />
£20 – 50m 24 5,000 – 10,000 25<br />
£50 –80m 19 10,000 – 15,000 28<br />
£80 –120m 29 15,000 – 20,000 20<br />
£120 – 150m 23 More than 20,000 47<br />
More than £150m 38<br />
Average number<br />
Average income<br />
of students<br />
(headcounts)<br />
Mean £116m Mean 13,989<br />
Median £88m Median 12,720<br />
NUMBER OF INSTITUTIONS (AS AT AUGUST 2007)<br />
Higher education<br />
institutions<br />
<strong>Universities</strong>*<br />
England 132 88<br />
Scotland 20 13<br />
Wales 12 3<br />
Northern Ireland 4 2<br />
United Kingdom 168 106<br />
* Federal institutions such as the University of Wales and the University of London are counted as one university.<br />
There are also a significant number of further education colleges at which higher education students study.<br />
This list excludes foreign higher education institutions operating in the <strong>UK</strong>.<br />
The Open University operates in all countries of the <strong>UK</strong>; its headquarters is based in England however.<br />
Source: Higher Education Funding Council for England, Scottish Funding Council, Higher Education Funding Council for<br />
Wales, Department for Employment and Learning, Northern Ireland.<br />
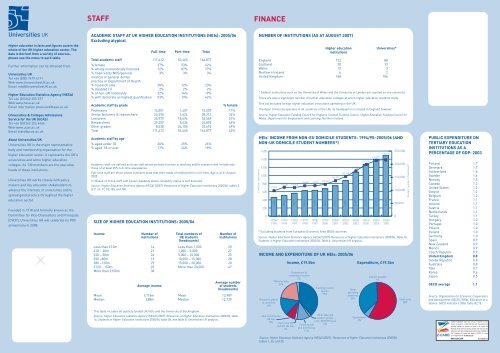
HEIs’ INCOME FROM NON-EU DOMICILE STUDENTS: 1994/95–2005/06 (AND<br />
NON-<strong>UK</strong> DOMICILE STUDENT NUMBERS*)<br />
£ million, cash terms<br />
1600<br />
1400<br />
1200<br />
1000<br />
800<br />
600<br />
400<br />
200<br />
0<br />
97,997<br />
£445m<br />
1994/<br />
1995<br />
111,480 109,940<br />
£507m<br />
1995/<br />
1996<br />
£563m<br />
1996/<br />
1997<br />
116,840 117,290<br />
£622m<br />
1997/<br />
1998<br />
1998/<br />
1999<br />
1999/<br />
2000<br />
2000/<br />
2001<br />
2001/<br />
2002<br />
INCOME AND EXPENDITURE OF <strong>UK</strong> HEIs: 2005/06<br />
£636m<br />
122,150<br />
£672m<br />
136,295<br />
£746m<br />
152,620<br />
£875m<br />
173,985<br />
£1,085m<br />
2002/<br />
2003<br />
199,225<br />
£1,275m<br />
2003/<br />
2004<br />
214,690<br />
£1,396m<br />
2004/<br />
2005<br />
219,175<br />
£1,499m<br />
2005/<br />
2006<br />
250,000<br />
200,000<br />
150,000<br />
100,000<br />
50,000<br />
* Excluding students from European Economic Area (EEA) countries.<br />
Source: Higher Education Statistics Agency (HESA) (2007): Resources of Higher Education Institutions 2005/06, Table 1b,<br />
Students in Higher Education Institutions 2005/06, Table 6; <strong>Universities</strong> <strong>UK</strong> analysis.<br />
Research grants<br />
& contracts<br />
16%<br />
Income, £19.5bn<br />
Endowment &<br />
investment income<br />
2%<br />
Other income<br />
20%<br />
Funding Council<br />
grants<br />
39%<br />
Other<br />
operating<br />
expenses<br />
36%<br />
Expenditure, £19.3bn<br />
Interest payable<br />
1%<br />
0<br />
Student numbers (headcount)<br />
Staff costs<br />
58%<br />
PUBLIC EXPENDITURE ON<br />
TERTIARY EDUCATION<br />
INSTITUTIONS AS A<br />
PERCENTAGE OF GDP: 2003<br />
Finland 1.7<br />
Denmark 1.7<br />
Switzerland 1.6<br />
Sweden 1.6<br />
Norway 1.5<br />
Canada 1.3<br />
United States 1.2<br />
Greece 1.2<br />
Belgium 1.2<br />
France 1.1<br />
Iceland 1.1<br />
Austria 1.1<br />
Netherlands 1.1<br />
Turkey 1.1<br />
Hungary 1.0<br />
Portugal 1.0<br />
Poland 1.0<br />
Ireland 1.0<br />
Germany 1.0<br />
Spain 0.9<br />
New Zealand 0.9<br />
Mexico 0.9<br />
Czech Republic 0.9<br />
United Kingdom 0.8<br />
Slovak Republic 0.8<br />
Australia 0.8<br />
Italy 0.7<br />
Korea 0.6<br />
Japan 0.5<br />
OECD average 1.1<br />
Source: Organisation for Economic Cooperation<br />
and Development (OECD) (2006): Education at a<br />
Glance: OECD Indicators 2006, table B2,1b.<br />
This table includes all publicly funded <strong>UK</strong> HEIs and the University of Buckingham.<br />
Source: Higher Education Statistics Agency (HESA) (2007): Resources of Higher Education Institutions 2005/06, table<br />
1a, Students in Higher Education Institutions 2005/06, table 0a, and table 8; <strong>Universities</strong> <strong>UK</strong> analysis.<br />
Non-EU domicile<br />
HE fees<br />
8% Part-time <strong>UK</strong><br />
and EU HE fees<br />
2%<br />
Other fees and<br />
support grants<br />
(incl. NCB HE fees)<br />
Full-time <strong>UK</strong> 2%<br />
and EU HE fees<br />
11%<br />
Depreciation<br />
5%<br />
Source: Higher Education Statistics Agency (HESA) (2007) : Resources of Higher Education Institutions 2005/06,<br />
tables 1, 2a, and 2b.<br />
Z-CARD ® PocketMedia ® (trade marks used by Z Industries Ltd under<br />
licence). This product is a doubly-folded sheet card. These products and<br />
associated machinery and processes are subject to <strong>UK</strong>, European and<br />
Worldwide patents granted and pending, copyright, trade marks and other<br />
intellectual property rights including European patent numbers EP 602090. ©<br />
2007 Z Industries Ltd. Produced under licence by Z-CARD ® LTD, London<br />
Z-Card info<br />
Tel +44 (0)207 924 5147 info-uk@zcard.com<br />
www.zcard.com No. 24456/30 (1:2)