STRATEGIC PLAN,2010–2014 - Kenya Sugar Board
STRATEGIC PLAN,2010–2014 - Kenya Sugar Board
STRATEGIC PLAN,2010–2014 - Kenya Sugar Board

You also want an ePaper? Increase the reach of your titles
YUMPU automatically turns print PDFs into web optimized ePapers that Google loves.
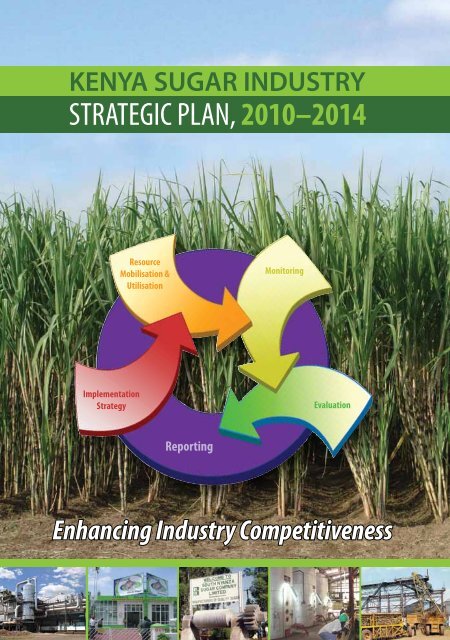
KENYA SUGAR INDUSTRY<br />
<strong>STRATEGIC</strong> <strong>PLAN</strong>, 2010–2014<br />
Implementation<br />
Strategy<br />
Resource<br />
Mobilisation &<br />
Utilisation<br />
Reporting<br />
Monitoring<br />
Evaluation<br />
Enhancing Industry Competitiveness<br />
Strategic Plan, 2010-2014 i
ii<br />
<strong>Kenya</strong> <strong>Sugar</strong> Industry
Table of Contents<br />
Acronyms ......................................................................................................................ii<br />
Foreword ......................................................................................................................iv<br />
Acknowledgements ....................................................................................................v<br />
Executive Summary ...................................................................................................vi<br />
Chapter 1: Introduction<br />
1.1 Historical Background .............................................................................................................1<br />
1.2 Importance of the <strong>Sugar</strong>cane Sector to the Economy................................................................2<br />
1.3 <strong>Sugar</strong> industry Stakeholders .....................................................................................................3<br />
1.4 Scope of Services......................................................................................................................4<br />
1.5 Methodology............................................................................................................................4<br />
Chapter 2: <strong>Kenya</strong>’s Development Agenda and Challenges .................................6<br />
2.1 Attaining Vision 2030 .............................................................................................................6<br />
2.2 Trade Environment for <strong>Kenya</strong>n <strong>Sugar</strong> ......................................................................................8<br />
Chapter 3: Review of the Strategic Plan 2004-2009 ........................................... 12<br />
3.1 Strategic Objectives (2004-2009) ...........................................................................................12<br />
3.2 Achievements.........................................................................................................................12<br />
3.3 Lessons from Plan Implementation ........................................................................................21<br />
3.4 Situational Analysis ................................................................................................................22<br />
Chapter 4: Strategic Plan 2010-2014 .................................................................... 24<br />
4.1 Rationale for the 2010-2014 Strategic Plan............................................................................24<br />
4.2 Vision, Mission and Core Values of the <strong>Sugar</strong> industry ..........................................................24<br />
4.3 Analysis of Challenges along the <strong>Sugar</strong> industry Value Chain.................................................25<br />
4.4 Strategic Goals (2010-2014) ..................................................................................................26<br />
4.5 Strategic Objectives (2010-2014) ...........................................................................................27<br />
Chapter 5: Implementation Strategy and Resource Requirements ................ 40<br />
5.1 Implementation Strategy........................................................................................................40<br />
5.2 Resource Mobilisation and Utilisation....................................................................................42<br />
5.3 Accountability .......................................................................................................................44<br />
5.4 Implementation Risks ............................................................................................................44<br />
Chapter 6: Monitoring, Evaluation and Reporting ............................................. 46<br />
6.1 Monitoring ...........................................................................................................................46<br />
6.2 Evaluation .............................................................................................................................46<br />
6.3 Reporting ..............................................................................................................................47<br />
6.4 Information Sharing ..............................................................................................................47<br />
6.5 Conclusion ............................................................................................................................47<br />
Annexes ...................................................................................................................... 48<br />
Strategic Plan, 2010-2014 iii
iv<br />
ACP African, Caribbean and Pacific Countries<br />
AgGDP Agricultural Gross Domestic Product<br />
AIDS Acquired Immune Deficiency Syndrome<br />
AMS Agricultural Management System<br />
BPO Business Process Outsourcing<br />
CDF Constituency Development Fund<br />
CET Common External Tariff<br />
CFC Common Fund for Commodities<br />
CIF Cost, Insurance and Freight<br />
COMESA Common Market for Eastern and Southern Africa<br />
CSR Corporate Social Responsibility<br />
CSS Customer Satisfaction Surveys<br />
CU Customs Union<br />
EAC East African Community<br />
ERSWEC Economic Recovery Strategy for Wealth and Employment Creation<br />
EU European Union<br />
GDP Gross Domestic Product<br />
GOK Government of <strong>Kenya</strong><br />
HIV Human Immunodeficiency Virus<br />
ICT Information and Communication Technology<br />
ISO International Organisation for Standardization<br />
KARI <strong>Kenya</strong> Agricultural Research Institute<br />
KECATRA <strong>Kenya</strong> Cane Transporters Association<br />
KenGen <strong>Kenya</strong> Electricity Generating Company<br />
KESGA <strong>Kenya</strong> <strong>Sugar</strong> Growers Associations<br />
KESMA <strong>Kenya</strong> <strong>Sugar</strong> Manufacturers Association<br />
KESREF <strong>Kenya</strong> <strong>Sugar</strong> Research Foundation<br />
KIRDI <strong>Kenya</strong> Industrial Research and Development Institute<br />
KPLC <strong>Kenya</strong> Power and Lighting Company<br />
KRB <strong>Kenya</strong> Roads <strong>Board</strong><br />
KSB <strong>Kenya</strong> <strong>Sugar</strong> <strong>Board</strong><br />
KSSCT <strong>Kenya</strong> Society of <strong>Sugar</strong>cane Technologist<br />
LATF Local Authority Transfer Fund<br />
M&E Monitoring and Evaluation<br />
MCI Millennium Cities Initiative<br />
MDG Millennium Development Goals<br />
MoA Ministry of Agriculture<br />
MoASP Ministry of Agriculture Strategic Plan<br />
MoE Ministry of Energy<br />
MoF Ministry of Finance<br />
MoI Ministry of Industrialization<br />
MoLG Ministry of Local Government<br />
MoR Ministry of Roads<br />
MoRDA Ministry of Regional Development Authority<br />
<strong>Kenya</strong> <strong>Sugar</strong> Industry<br />
Acronyms
MoT Ministry of Trade<br />
MoWI Ministry of Water and Irrigation<br />
MT Metric Tonne<br />
MTER Mid Term Evaluation and Review<br />
MTP Medium Term Plan<br />
NTB Non-Tariff Barriers<br />
OGC Outgrowers companies<br />
OTE Overall Time Efficiency<br />
PESTLE Political, Economic, Social, Technological, Legal and Environment<br />
PRSP Poverty Reduction Strategy Paper<br />
PS Permanent Secretary<br />
RRA Rural Roads Authority<br />
SACCO Savings and Credit Cooperatives<br />
SDF <strong>Sugar</strong> Development Fund<br />
SDL <strong>Sugar</strong> Development Levy<br />
SMART Specific, Measurable, Attainable, Realistic, Timed<br />
SMARTEST Specific, Measurable, Attainable, Realistic, Timed, Engaging, Siring, Team<br />
STI Science, Technology and Innovation<br />
SUCAM <strong>Sugar</strong> Campaign for Change<br />
SWOT Strengths, Weaknesses, Opportunities and Threats<br />
TARDA Tana and Athi Regional Development Authority<br />
TCD Tonnes Crushed per Day<br />
TCH Tonnes Crushed per Hour<br />
TNA Training Needs Assessment<br />
USA United States of America<br />
VCC Vale Columbia Center<br />
WTO World Trade Organisation<br />
Strategic Plan, 2010-2014 v
The sugar industry is a major contributor to the agricultural sector which is the mainstay of the<br />
economy and supports livelihoods of at least 25% of the <strong>Kenya</strong>n population. The subsector<br />
accounts for about 15% of the agricultural GDP, is the dominant employer and source of<br />
livelihoods for most households in Western <strong>Kenya</strong> comprising Nyanza, Rift Valley and Western<br />
Provinces.<br />
In 2008/2009, the industry produced close to 520,000 tonnes of sugar operating at 56 percent of the<br />
installed capacity. The industry has the potential of producing over 1 million tonnes of sugar if operated<br />
at 89 percent of the installed capacity. This would meet the domestic needs, currently standing at about<br />
700,000 tonnes, and provide a sustained surplus for export.<br />
By February 2012, the industry will begin operating under a liberalized trade regime after the COMESA<br />
safeguard measures lapse. In such environment, the industry will have to enhance its competitiveness<br />
along the entire value chain and reduce production costs by at least 39% to be in line with EAC partner<br />
states and COMESA sugar producing countries.<br />
At the moment, the industry is facing several challenges including capacity underutilization, lack of<br />
regular factory maintenance, poor transport infrastructure and weak corporate governance. Consequently,<br />
most factories have accumulated large debts amounting KSh. 58 billion. In the new Plan, the industry<br />
will require KSh 51.1 billion. KSh. 15.3 billion will be used to initiate power co-generation projects in<br />
various factories. KSh. 12.8 billion will be used to initiate ethanol production projects. The remaining<br />
KSh. 23 billion will be used to carry out other activities outlined in this Plan.<br />
As a matter of urgency, the Government through the Privatization Commission has appointedTransaction<br />
Advisors to work out the final details for the privatization of all publicly owned factories. Alongside the<br />
privatization, the Government will initiate a programme for financial restructuring of indebted public<br />
factories. This will be in addition to the continued Government support in the development of essential<br />
infrastructure such as roads, irrigation as well as basic research and extension.<br />
The 2010-2014 <strong>Kenya</strong> <strong>Sugar</strong> Industry Strategic Plan is intended to be the basis of facilitating the<br />
transformation required in the sugar subsector. It sets out the framework that will enable the industry<br />
achieve its vision of being ‘a world class multi-product sugarcane industry’ in the next five years. Despite<br />
the challenges the industry faces, this Plan underlines the industry’s commitment of being efficient,<br />
diversified and globally competitive.<br />
It is my hope that the objectives, strategies and activities recommended in this Plan will be implemented<br />
fully to revamp and resuscitate the sugar industry. I am therefore pleased to launch the <strong>Kenya</strong> <strong>Sugar</strong><br />
Industry Strategic Plan 2010-2014.<br />
Hon. William S. Ruto, M.P,<br />
Minister for Agriculture<br />
vi<br />
<strong>Kenya</strong> <strong>Sugar</strong> Industry<br />
Foreword
Acknowledgements<br />
The formulation of the <strong>Kenya</strong> <strong>Sugar</strong> Industry Strategic Plan 2010-2014 comes at a time when<br />
the industry needs to rethink its direction as it approaches the liberalization of the sugar trade<br />
regime in 2012. The industry needs to find ways of repositioning itself competitively. This<br />
would require that the industry goes beyond sugar, think more about sugarcane as a whole and exploit<br />
market opportunities that the broader sugarcane industry provides.<br />
The sugar industry stakeholders have been at the forefront in championing for a better, efficient and<br />
diversified sugarcane industry. It was through their efforts that considerable achievements were realised<br />
in the outgoing plan. It was also due to their participation and concurrence that the formulation and<br />
preparation of the incoming Plan became possible.<br />
First, I wish to thank His Excellency the President of the Republic of <strong>Kenya</strong>, Hon. Mwai Kibaki,<br />
EGH, MP and the Right Honourable Prime Minister of the Republic of <strong>Kenya</strong>, Hon. Raila Amollo<br />
Odinga, MP for their unwavering support for the sugar sub-sector. I am also grateful for the Minister for<br />
Agriculture, Hon. William S. Ruto for his robust support and vision for the development of the sugar<br />
industry.<br />
Secondly, I would like to thank the <strong>Board</strong> members and management team of <strong>Kenya</strong> <strong>Sugar</strong> <strong>Board</strong> for<br />
their invaluable contributions in setting the agenda for the new Plan. Special thanks to Ms. Rosemary<br />
Mkok, Chief Executive Officer, <strong>Kenya</strong> <strong>Sugar</strong> <strong>Board</strong> and her management team for the leadership they<br />
provided in the preparation of this Strategic Plan.<br />
Thirdly, I wish to express my deepest gratitude and appreciation to all industry stakeholders for their<br />
active participation in the preparation of this Strategic Plan.<br />
Lastly, I thank Log Associates consultants for facilitating the review and preparation of this Plan. I am<br />
confident that this Strategic Plan will serve as the industry’s framework for decision making, planning,<br />
resource mobilisation and performance monitoring in the next five years.<br />
Thank you.<br />
Z. Okoth Obado<br />
<strong>Board</strong> Chairman, <strong>Kenya</strong> <strong>Sugar</strong> <strong>Board</strong><br />
Strategic Plan, 2010-2014 vii
viii<br />
Executive Summary<br />
I. Background<br />
The <strong>Kenya</strong>n sugarcane industry is a major employer and contributor to the national economy. <strong>Sugar</strong>cane<br />
is one of the most important crops in the economy alongside tea, coffee, horticulture and maize. By far,<br />
the largest contribution of the sugarcane industry is its silent contribution to the fabric of communities<br />
and rural economies in the sugar belts. Farm households and rural businesses depend on the injection<br />
of cash derived from the industry. The survival of small towns and market places is also dependent on<br />
the incomes from the same. The industry is intricately weaved into the rural economies of most areas in<br />
western <strong>Kenya</strong>.<br />
Besides the socio-economic contributions, the industry also provides raw materials for other industries<br />
such as bagasse for power co-generation and molasses for a wide range of industrial products including<br />
ethanol. Molasses is also a key ingredient in the manufacturing of various industrial products such as<br />
beverages, confectionery and pharmaceuticals.<br />
II. Methodology<br />
In preparing this Strategic Plan, the consultant adopted a participatory and collaborative approach and<br />
methodology comprising Literature Review, Key Informants Interviews (KII), Focused Group Discussions<br />
(FDGs) and Stakeholder Consultative Workshops. Consultations were held with industry stakeholders in<br />
structured discussions as well as personal interviews with key informants. The consultant also held a validation<br />
workshop and discussed the recommendations of the Draft Strategic Plan 2010-2014. The validation workshop<br />
was attended by board members and management team of the <strong>Kenya</strong> <strong>Sugar</strong> <strong>Board</strong>.<br />
III. Structure of the Report<br />
This Plan is set out in six chapters. After an introduction in chapter one, <strong>Kenya</strong>’s Development Agenda<br />
and Challenges is outlined in chapter two followed by a review of the 2004-2009 Strategic Plan in chapter<br />
three. The proposed Strategic Plan 2010-2014 is discussed in chapter four. Implementation Strategy<br />
and Resource Requirements is presented in chapter five. The document concludes with a discussion on<br />
Monitoring, Evaluation and Reporting in chapter six.<br />
IV. 2004-2009 Strategic Plan Review Findings<br />
A review of the 2004-2009 Strategic Plan showed that:<br />
1. The Plan goals of creating a world class sugar industry were ambitious and had not been<br />
realized, having been set at a time when the industry was still a high cost producer<br />
2. The consumption-production gap still persists and growing, delaying the industry’s goal of<br />
being a net exporter<br />
3. Yield levels declined from a modest yield level of 73 tonnes per hectare to about 70 tonnes<br />
per hectare over the last five years.<br />
4. Farmer support services provided by outgrower institutions and contractors were inadequate<br />
in quality and timeliness including seed cane, fertilizer supplies, and cane harvesting and<br />
transportation.<br />
<strong>Kenya</strong> <strong>Sugar</strong> Industry
5. Most the factories, that are the backbone of the industry were struggling in debt and were<br />
unable to maintain effective crushing capacity, carry out routine maintenance and essential<br />
rehabilitation and pay farmers on time.<br />
6. Funding to the industry was inadequate to meet infrastructural development needs such as<br />
irrigation, roads, research and factories modernization<br />
7. The safeguards that were put in place to protect the industry including COMESA region<br />
quotas and taxes had many loopholes<br />
8. Governance in many of the industry institutions including outgrower institutions and<br />
publicly owned factories continued to be a big challenge<br />
Overall, even though the goals of the 2004-2009 Strategic Plan were ambitious, the Plan instrument<br />
assisted in getting the industry stakeholders to seek a common ground for the good of the industry.<br />
V. The 2010-2014 Strategic Plan<br />
Rationale for the Plan<br />
The <strong>Kenya</strong> <strong>Sugar</strong> Industry Strategic Plan for 2010-2014 provides a road map of how the industry intends<br />
to be a “world class multi-product sugarcane industry.” To enable the Government achieve its strategic<br />
objectives of being a middle-income country by the year 2030, this revised strategic plan aims at making<br />
the industry more efficient, diversified and globally competitive to contribute to the overall objective<br />
outlined in the Agricultural Sector Development Strategy (2009-2020) and the <strong>Kenya</strong> Vision 2030.<br />
The Plan provides a framework for setting goals, defining key actions, and mobilizing resources for<br />
funding programmes in the industry. It is a unifying instrument at the strategic level for industry<br />
stakeholders, who otherwise are autonomous operators. It lays the ground for enhanced performance of<br />
the sugar industry premised on a rational utilization of all resources in the sector.<br />
Vision<br />
The new vision for the industry is to be ‘a world-class multi-product sugarcane industry’.<br />
Mission<br />
The new mission of the industry is to ‘facilitate a multi-product sugarcane industry that is efficient,<br />
diversified and globally competitive’ through: enhanced industry’s competitiveness through cost reduction<br />
strategies and efficiency improvements, expanded product base, improved infrastructure and strengthened<br />
regulatory framework.<br />
Strategic Goals<br />
The formulation of this Plan came at a time when the industry needs to rethink its direction as it<br />
approaches the liberalization of the sugar trade regime in 2012. The industry needs to find ways of<br />
repositioning itself competitively. This would require that the industry goes beyond sugar, think more<br />
about sugarcane as a whole, and exploit market opportunities presented by multiple sugarcane products.<br />
This Plan will therefore put new pressure on the industry to find and invest resources in the new direction<br />
where the industry needs to go. In the light of the above, the 2010-2014 Strategic Plan is intended to<br />
seek a more limited but achievable set of goals. The stakeholders have identified and endorsed four<br />
strategic goals.<br />
1. Enhancing Competitiveness in the industry in order to transform it to a leaner, lower cost industry<br />
that can take on its competitors through:<br />
Strategic Plan, 2010-2014 ix
x<br />
n Reduction in farm level risks<br />
n Efficient, reliable harvesting and transport operations<br />
n Effective, efficient, milling operations<br />
n Enhanced human resource capacity<br />
n Streamlined corporate governance<br />
2. Expanding the product base to take advantage of opportunities created in the production process<br />
and increase factory profitability through value addition and product diversification by:<br />
n Initiating power co-generation projects<br />
n Initiating ethanol production projects<br />
n Producing industrial sugar and alcohol<br />
n Encouraging intensification to increase food security<br />
3. Investing more in infrastructure by:<br />
n Improving road transport<br />
n Investing in irrigation<br />
n Investing in and promoting the use of ICT<br />
n Increasing funding in Research and Development<br />
n Modernisation of mills<br />
4. Strengthening the policy, institutional and legal environment by:<br />
n Improving the management of the sugar import policy<br />
n Strengthening Corporate Governance<br />
n Finalising and implementing the <strong>Sugar</strong> Regulations<br />
n Finalising the implementation of the privatisation programme<br />
n Establishing a coordination mechanism for roads maintenance in the sugar zones<br />
n Supporting measures to develop a comprehensive policy on co-generations and exploitation<br />
of bio-fuels and other sugarcane products<br />
VI. Implementation Strategy and Resource Requirements<br />
Reporting the progress of implementation will be critical in adjusting strategic directions and measuring<br />
performance. Progress reports will be made on quarterly basis. The reports will outline in summary<br />
form projected targets, achievements, facilitating factors and challenges. The reports will be prepared<br />
and submitted by UCs to the SRF where a summary report will be prepared and submitted to the MC<br />
for review. Issues that will require policy interventions will be forwarded to the NICC through the KSB<br />
<strong>Board</strong>.<br />
<strong>Kenya</strong> <strong>Sugar</strong> Industry
1.1 Historical Background<br />
Chapter<br />
Introduction<br />
Industrial sugarcane farming was introduced in <strong>Kenya</strong> in 1902. The first sugarcane factory was set-up<br />
at Miwani 10km north of Kisumu in 1922 and later at Ramisi in the Coast Province in 1927. After<br />
independence, the Government explicitly expanded its vision of the role and importance of the sugar<br />
industry as set out in Sessional Paper No 10 of 1965 which sought, inter alia, to:<br />
n Accelerate socio-economic development<br />
n Redress regional economic imbalances<br />
n Promote indigenous entrepreneurship<br />
n Promote foreign investment through joint ventures<br />
In pursuit of the above goals, the Government established five additional factories in the 1960s and<br />
1970s: Muhoroni (1966), Chemelil (1968), Mumias (1973), Nzoia (1978), and South Nyanza (1979).<br />
Later, several more were to come on stream: West <strong>Kenya</strong> (1981), Soin <strong>Sugar</strong> Factory (2006) and Kibos<br />
<strong>Sugar</strong> & Allied Industries (2007), bringing the total number of milling companies to ten (10). The two<br />
older factories ceased operations: Ramisi sugar factory collapsed in 1988 and Miwani sugar factory was<br />
put under receivership.<br />
The establishment of the publicly owned factories was predicated on the need to:<br />
n Achieve self sufficiency in sugar with a surplus for export in a globally competitive market<br />
n Generate gainful employment and create wealth<br />
n Supply raw material for sugar related industries<br />
n Promote economic development in the rural economy and beyond through activities linked<br />
to the sugar industry<br />
In support of the above goals, the Government invested heavily in sugar factories, holding about 83% of<br />
the equity, later reduced to 70% after it divested 36% of its interest in Mumias <strong>Sugar</strong> Company. These<br />
resource injections into the subsector were in addition to the resources from the <strong>Sugar</strong> Development<br />
Fund (SDF), set up in 1992, that has contributed about KSh. 11 billion into the industry for cane<br />
development, factory rehabilitation, research and infrastructure development.<br />
These investments did not, however, help achieve the self-sufficiency in sugar as consumption continued<br />
to outstrip production. Total sugar production grew from 368,970 tonnes in 1984 to 520,000 tonnes<br />
in 2008 leaving <strong>Kenya</strong> a net importer of sugar with imports rising from 4,000 to 220,000 tonnes over<br />
the same period. The deficit is being met through imports from the COMESA region and other sugar<br />
producing countries including Brazil, United Kingdom and Mexico. Figure 1.1 shows production and<br />
consumption status since 2001.<br />
In 2003, the Government set up a Task Force on the <strong>Sugar</strong> Industry Crisis 1 whose objective was to<br />
examine the problems facing the sugar subsector and make recommendations for revitalizing the industry.<br />
1 Otherwise known as the Amayo Task Force Report dated 1st July 2003<br />
1<br />
Strategic Plan, 2010-2014 1
Following the Task Force’s recommendations, the Government made the following decisions:<br />
(a) Made changes in the management of all publicly owned milling companies with a view to<br />
improving corporate governance<br />
(b) Reduced lending rates on SDF loans from 10% to 5%<br />
(c) Wrote off KSh. 4.7 billion on accrued interest and penalties on SDF loans<br />
(d) Disbursed KSh. 800 million towards settling arrears owed by milling companies to farmers<br />
(e) Increased research funding from the <strong>Sugar</strong> Development Levy by (SDL) doubling the<br />
allocation from 0.5% to 1%<br />
(f) Successfully negotiated for a four-year COMESA safeguard to give the industry time to<br />
restructure and become globally competitive<br />
2<br />
Tonnes (x10000)<br />
80<br />
60<br />
40<br />
20<br />
0<br />
2001<br />
Fig. 1.1: <strong>Sugar</strong> Production, Consumption, Imports and Exports Trends<br />
Concurrent with the structural reforms the Government was implementing, the industry continued to<br />
expand its processing capacity: <strong>Kenya</strong> <strong>Sugar</strong> <strong>Board</strong> (KSB) registered three new mill white sugar factories,<br />
namely: Butali, Kwale International <strong>Sugar</strong> Co. Ltd and Trans Mara <strong>Sugar</strong> Companies with a combined<br />
potential capacity of 5,000 TCD. It is also expected that an additional mill would be established in the<br />
Tana River basin, with a potential capacity of 9,000 TCD. With the operationalisation of these new<br />
factories and the upgrading of the existing mills, the industry’s capacity would be close to 38,000 TCD,<br />
which would result in a production of about 1 million tonnes of sugar per annum.<br />
Apart from the regular sugar mills, there are four licensed and operational jaggery millers, namely:<br />
Lubao, Shajanand, Farm Industries and Homa Lime Jaggeries, who have a combined capacity of about<br />
300 TCD. There are also in excess of three hundred informal and mostly mobile jaggeries, each of which<br />
crushes between 3-35 tonnes of sugarcane per day.<br />
1.2 Importance of the <strong>Sugar</strong>cane Sector to the Economy<br />
The <strong>Kenya</strong>n sugarcane industry is a major employer and contributor to the national economy. It is<br />
one of the most important crops alongside tea, coffee, horticulture and maize. Currently, the industry<br />
directly supports approximately 250,000 small-scale farmers who supply over 92 percent of the cane<br />
milled by the sugar companies. An estimated six million <strong>Kenya</strong>ns derive their livelihoods directly or<br />
<strong>Kenya</strong> <strong>Sugar</strong> Industry<br />
2002 2003 2004 2005<br />
Year<br />
2006 2007 2008<br />
Production Consumption Imports Exports
indirectly from the industry. In 2008, the industry employed about 500,000 people directly or indirectly<br />
in the sugarcane business chain from production to consumption. In addition, the industry saves <strong>Kenya</strong><br />
in excess of USD 250 million (about KSh. 19.3 billion) in foreign exchange annually and contributes<br />
tax revenues to the exchequer (VAT, Corporate Tax, personal income taxes, cess). In the sugarbelt<br />
zones, the sugar industry contributes to infrastructure development through road construction and<br />
maintenance; construction of bridges; and to social amenities such as education, health, sports and<br />
recreation facilities 2,3 .<br />
The sugarcane industry provides raw materials for other industries such as bagasse for power cogeneration<br />
and molasses for a wide range of industrial products including ethanol. Molasses is also a<br />
key ingredient in the manufacturing of various industrial products such as beverages, confectionery and<br />
pharmaceuticals.<br />
By far, the largest contribution of the industry is its silent contributions to the fabric of communities and<br />
rural economies in the sugarcane belt. Farm households and rural businesses depend on the injection<br />
of cash derived from sugarcane. The survival of small towns and market places is also dependent on the<br />
incomes from the same. The industry is intricately weaved into the rural economies of most areas in<br />
Western <strong>Kenya</strong>.<br />
1.3 <strong>Sugar</strong> industry Stakeholders<br />
The <strong>Kenya</strong> <strong>Sugar</strong> industry has a wide range of stakeholders, each with a role to play.<br />
(i) The Government of <strong>Kenya</strong> (GoK)<br />
The Government of <strong>Kenya</strong> (GoK) through the Ministry of Agriculture (MoA) has the overall<br />
responsibility for the industry’s development. The GoK has a role of supporting the industry through<br />
regulation, enhancement of competition and fairplay, and provision of an enabling environment for all<br />
stakeholders. Currently, the GoK is the largest shareholder in the industry.<br />
(ii) The <strong>Kenya</strong> <strong>Sugar</strong> <strong>Board</strong> (KSB)<br />
The <strong>Kenya</strong> <strong>Sugar</strong> <strong>Board</strong> (KSB) is a public body set up by the <strong>Sugar</strong> Act, 2001, under the Ministry of<br />
Agriculture. The <strong>Board</strong> is mandated to:<br />
i. Regulate, develop and promote the sugar industry<br />
ii. Co-ordinate the activities of individuals and organisations in the industry<br />
iii. Facilitate equitable access to the benefits and resources of the industry by all interested<br />
parties<br />
(iii) <strong>Kenya</strong> <strong>Sugar</strong> Research Foundation (KESREF)<br />
The <strong>Kenya</strong> <strong>Sugar</strong> Research Foundation (KESREF) established in 2001, is the scientific wing of the<br />
industry mandated to develop and transfer appropriate technology in the sugar sub-sector. It also<br />
carries out socio-economic studies to enhance the development of sugar as a commercial business.<br />
The Foundation is funded mainly through grants from the <strong>Sugar</strong> Development Fund (SDF). It has its<br />
headquarters in Kibos, Kisumu with sub-stations in Mumias, Mtwapa and Opapo.<br />
2 Bracing for COMESA: <strong>Kenya</strong>n <strong>Sugar</strong> industry, Mumias <strong>Sugar</strong> Company Bulletin 2008<br />
3 <strong>Kenya</strong> <strong>Sugar</strong> <strong>Board</strong> Strategic Plan (2008-2012) and Year Book of Statistics (2008)<br />
Strategic Plan, 2010-2014 3
(iv) Cane Growers/Outgrower Institutions<br />
<strong>Sugar</strong>cane farmers (outgrowers) supply 92% of the cane milled. A large number of institutions including<br />
Outgrower Institutions, Societies, Unions and SACCOs represent these farmers. The role of these<br />
institutions is to promote, represent and protect the interest of the farmers. The institutions operate<br />
under the <strong>Kenya</strong> <strong>Sugar</strong>cane Growers Association (KESGA).<br />
(v) Cane Transporters<br />
Cane transporters are responsible for provision of cane transportation services in the industry.Transporters<br />
operate under the <strong>Kenya</strong> Cane Transporters Association (KECATRA).<br />
(vi) Millers/Jaggeries<br />
The role of the millers is to make fair return on investment through efficient operation of the sugar mills<br />
or jaggeries for the production of sugar and other products for sale and making timely payments to cane<br />
growers. The millers operate under an apex institution known as the <strong>Kenya</strong> <strong>Sugar</strong> Manufacturers Association<br />
(KESMA). Millers are a critical node in the sugarcane industry because of the role they play in value addition.<br />
The profitability and hence strength of the industry depends on how efficiently they operate.<br />
(vii) Other Industry Stakeholders<br />
Other industry stakeholders include:<br />
n Importers<br />
n Financial institutions<br />
n Consumers<br />
n Special interest groups<br />
• <strong>Kenya</strong> Society of <strong>Sugar</strong>cane Technologist (KSSCT)<br />
• <strong>Sugar</strong> Campaign for Change (SUCAM)<br />
1.4 Scope of Services<br />
The scope of services outlined in the Terms of Reference for the preparation of the 2010-2014 Strategic<br />
Plan, were as follows:<br />
i. Review the current strategic plan and other relevant documentation which shall include, but<br />
not limited to the National Vision 2030; the Ministry of Agriculture Strategic Plan 2006-<br />
2010; the <strong>Sugar</strong> Act 2001; Guidelines for the preparation of strategic plans 2008-2010 from<br />
the office of the Prime Minister, Ministry of State for Planning, National Development and<br />
Vision 2030; and prepare a critique of issues for consideration<br />
ii. Conduct a stakeholders’ workshop to collect views on possible amendment to the current<br />
document<br />
iii. Arising from (1) and (2) above, prepare a draft industry strategic plan 2010-2014<br />
iv. Conduct a workshop for the <strong>Board</strong> and Management Team to take them through the draft<br />
industry strategic plan 2010-2014<br />
v. Prepare a final draft to be presented to the <strong>Board</strong>, Management Team and sugar<br />
stakeholders<br />
vi. Prepare and present the final document<br />
1.5 Methodology<br />
In reviewing the strategic plan, the consultant adopted a participatory and collaborative approach<br />
comprising Literature Review, Key Informant Interviews (KII), Focused Group Discussions (FDGs) and<br />
Stakeholder Consultative Workshops.<br />
4<br />
<strong>Kenya</strong> <strong>Sugar</strong> Industry
1.5.1 Literature Review<br />
The consultant reviewed a wide range of published materials and documents in the course of<br />
the assignment, including:<br />
i. <strong>Kenya</strong> <strong>Sugar</strong> Industry Strategic Plan (2004-2009)<br />
ii. <strong>Kenya</strong> <strong>Sugar</strong> <strong>Board</strong> Strategic Plan (2008-2012)<br />
iii. <strong>Kenya</strong> Vision 2030, A Globally Competitive and Prosperous <strong>Kenya</strong><br />
iv. Sessional Paper of 2008 on Revitalisation of <strong>Sugar</strong> industry (March 2008)<br />
v. Agriculture Sector Development Strategy (2009-2020)<br />
vi. Economic Recovery Strategy for Wealth and Employment Creation<br />
vii. Report of the Task Force on <strong>Sugar</strong> industry Crisis, 1 st July 2003<br />
viii. Guidelines for Preparation of Vision 2030 based Strategic Plans<br />
ix. Report on Cost of Cane and <strong>Sugar</strong> Production (KSB, 2006, 2007)<br />
x. Year Book of <strong>Sugar</strong> Statistics (KSB, 2008)<br />
xi. <strong>Kenya</strong> <strong>Sugar</strong> industry Report (EPZA, 2005)<br />
xii. Working Papers (Millennium Cities Initiative & Vale Columbia Center, 2008)<br />
xiii. National Policy on <strong>Sugar</strong> industry (GoK, April 2001)<br />
xiv. National <strong>Sugar</strong> Conference Report (October, 2004)<br />
xv. Economic Governance Reform in the <strong>Sugar</strong> Subsector (February, 2005)<br />
xvi. Energy Act, 2006<br />
xvii. Various internet sources<br />
1.5.2 Stakeholder Consultative Workshops<br />
The consultant held two stakeholder consultative workshops in Kisumu. The first workshop<br />
was held on 21 and 22 May 2009. The second workshop was held on 17 June 2009. The<br />
workshops’ participants comprised representatives of Outgrower Institutions (OGIs), Millers,<br />
Transporters, Cane Researchers, Universities, Ministry of Agriculture, KESREF and <strong>Kenya</strong><br />
<strong>Sugar</strong> <strong>Board</strong>. These workshops were used as discussion forums to gather information on key<br />
issues affecting the industry and the way forward.<br />
1.5.3 Debriefing Workshops<br />
The consultant conducted three debriefing workshops. The first workshop was held on 10 July<br />
2009 with the management team of the <strong>Kenya</strong> <strong>Sugar</strong> <strong>Board</strong>. The second and third workshops<br />
were held on 27 July 2009 and 14 August 2009 respectively with the <strong>Board</strong> and Management<br />
Team of KSB. The comments and suggestions from the three debriefing workshops have been<br />
incorporated in this report.<br />
Strategic Plan, 2010-2014 5
6<br />
<strong>Kenya</strong> <strong>Sugar</strong> Industry<br />
Chapter<br />
2<br />
<strong>Kenya</strong>’s Development Agenda<br />
and Challenges<br />
2.1 Attaining Vision 2030<br />
<strong>Kenya</strong>’s medium and long-term development agenda is set out in the <strong>Kenya</strong> Vision 2030. The Vision is<br />
built on the foundation of the Economic Recovery Strategy for Wealth and Employment Creation (ERWEC)<br />
2003-2007. It is the country’s new development blueprint covering the period 2008-2030. The vision<br />
aims to transform <strong>Kenya</strong> into a newly industrialising, middle-income country providing a high quality life<br />
to all its citizens in a clean and secure environment by the year 2030. The Vision is also expected to be<br />
a major vehicle for the realisation of the Millennium Development Goals (MDGs). The vision is based<br />
on three pillars: the economic, the social and the political. These pillars are anchored on macroeconomic<br />
stability; continuity in governance reforms; enhanced equity and wealth creation opportunities for the<br />
poor; infrastructure; energy; science, technology and innovation (STI); land reform; human resources<br />
development; security as well as public sector reforms. The sugar industry will contribute to the<br />
attainment of three pillars through various interventions discussed below:<br />
2.1.1 Economic Pillar<br />
The economic pillar aims to attain an average Gross Domestic Product (GDP) growth rate of<br />
ten per cent (10 %) per annum and sustain it to 2030. The programs envisaged to move the<br />
economy up the value chain are tourism, agriculture, wholesale and retail trade, manufacturing,<br />
business process outsourcing and financial services. The sugarcane industry will play a key role<br />
in the attainment of the goals set for the programmes in agriculture and manufacturing; and<br />
to benefit substantially from programmes envisaged in the wholesale and retail, and financial<br />
services programmes.<br />
Agricultural Sector: The sugarcane industry already accounts for about 15% of agricultural GDP. In<br />
the Vision 2030, <strong>Kenya</strong> aims to build an agricultural sector that is innovative, business oriented and<br />
modern through:<br />
n Transforming key institutions to promote agricultural growth<br />
n Increasing productivity in the sector<br />
n Land policy and land use reforms<br />
n Expanding irrigation in arid and semi-arid lands<br />
n Improving market access for smallholders through better supply chain management<br />
Torealisetheaboveobjectives,theVisionhasidentifiedsevenflagshipprojectsforimplementation<br />
by the year 2012. Three of the projects that are relevant to the sugar subsector include irrigation<br />
development along the Tana River Basin; development and implementation of a 3-tiered fertilizer<br />
cost reduction programme; and development of an Agriculture land use Master Plan.
Wholesale and Retail Trade: The 2030 vision for wholesale and retail trade is to move<br />
towards greater efficiency in the country’s marketing system by lowering transaction costs<br />
through institutional reforms. This involves strengthening informal trade (through investment<br />
in infrastructure, training and linking it to wider local and global markets). This is expected<br />
to raise the market share of products (including sugar and co-products) sold through normal<br />
channels such as supermarkets from 5% to 30% by 2012. The envisaged flagship projects<br />
such as creation of wholesale hubs, building of retail markets and a free trade port are market<br />
opportunities that will be exploited by the sugar industry in the incoming planning period.<br />
Manufacturing Sector: <strong>Kenya</strong> aims to have a robust, diversified and competitive manufacturing<br />
sector through:<br />
n Restructuring local industries that use local materials but are currently uncompetitive e.g<br />
sugar and paper manufacturing<br />
n Exploiting opportunities in value addition to local agricultural produce<br />
n Adding value to intermediate imports<br />
With fuller exploitation of forward linkages in the value chain, the industry has an opportunity<br />
to increase significantly its contribution to the manufacturing sector.<br />
Financial Sector: The 2030 vision for financial services is to create a vibrant and globally<br />
competitive financial sector in <strong>Kenya</strong>. The sector is expected to create jobs and promote high<br />
levels of savings to finance investment needs. One of the most urgent steps towards creating a<br />
competitive financial environment in <strong>Kenya</strong> is introducing legal and institutional reforms that<br />
will enhance transparency in all transactions, build trust and make enforcement of justice more<br />
efficient. This will be achieved by:<br />
n Undertaking legal and institutional reforms to make <strong>Kenya</strong> more competitive as a financial<br />
centre<br />
n Consolidation of banks to make them larger and stronger<br />
n Introduction of credit referencing<br />
n Strengthening informal and micro-finance institutions and SACCOs<br />
n Deepening financial markets by raising institutional capital through pension funds,<br />
expanding bond and equity markets as well as tapping external sources of capital<br />
The reforms are also expected to strengthen the regulatory and oversight authority which<br />
in turn will help increase investor confidence in the economy and thus increase investment<br />
opportunities in the sugarcane sector as well. Increased investment in the sector will lead to<br />
higher production of sugar and co-products, which will then contribute to the realisation of<br />
the envisaged 10% GDP growth rate.<br />
To fully utilize the potential in the sugarcane industry, some essential reforms have been<br />
identified in the Agricultural Sector Development Strategy 2009-2020 to complement the<br />
broad reforms envisaged under Vision 2030, these include:<br />
n Land reforms to reduce inequality and increase intensification<br />
n Improving efficiencies in the supply chain e.g. enhancing access to input markets, raising<br />
cane yields, reducing post-harvest losses and upgrading factory capacity<br />
n Increasing access to credit facilities particularly for farmers<br />
n Increasing value addition by more processing and product diversification<br />
n Strengthening corporate governance in the sugarcane industry<br />
Strategic Plan, 2010-2014 7
8<br />
2.1.2 Social Pillar<br />
The social component addresses issues of equity and social justice; national cohesion, security<br />
and environmental concerns. It lays great emphasis on the development of education and<br />
training, better healthcare, improved water and sanitation, sustainable and better environmental<br />
management as well as vital national attention to gender equity, youth, vulnerable groups,<br />
housing, and poverty reduction.<br />
Developments envisaged in the social pillar will be important in providing opportunities for<br />
social safety nets and greater mobility in the social space. The sugar industry will contribute<br />
significantly to the social development through provision of employment opportunities and<br />
wealth creation in the rural areas of <strong>Kenya</strong>. As a social tool, a vibrant sugar industry will act<br />
as a catalyst for raising the standards of living in various rural households through direct and<br />
indirect incomes. The sugar industry will also contribute to the realisation of the goals of<br />
the social pillar through its corporate responsibility activities in health, education, water and<br />
sanitation, and recreation activities.<br />
2.1.3 Political Pillar<br />
The political component aims to realise a democratic political system predicated on greater<br />
economic and political devolution, respect for the rule of law, and protection of rights and<br />
freedoms for all citizens. Under this component, <strong>Kenya</strong>’s development agenda is to improve<br />
accountability, reduce impunity and begin the real fight against corruption, and thus promote<br />
efficiency in the governance and management of public affairs. Good corporate governance<br />
in the sugar industry is essential in order to create a climate of fairness, transparency and<br />
accountability especially now when major decisions are needed to make the industry leaner,<br />
efficient and more competitive.<br />
2.2 Trade Environment for <strong>Kenya</strong>n <strong>Sugar</strong><br />
2.2.1 Global Trade Environment and Obligations<br />
In the last two decades, the world has witnessed rapid economic growth and expansion of trade,<br />
driven primarily by emerging Asian Tiger economies. The rapid and continued strong growth<br />
in China and India will further put upward pressure on prices of crude oil. This will continue<br />
to cause major challenges to <strong>Kenya</strong>’s sugar industry that is significantly dependent on fossil<br />
fuel for cane transportation. In addition, there is evidence to suggest that financial market<br />
challenges in the United States of America (USA) and Europe, are affecting global markets<br />
thus impacting negatively on <strong>Kenya</strong>’s trade performance in goods and services. The overall<br />
effect of the credit crunch will be felt in terms of reduced purchasing power of foreign buyers<br />
of <strong>Kenya</strong>n goods, and lower domestic access to credit, grants, and donor support. Capital<br />
markets will also be more concerned at the likely impact of reducing global trade flows on the<br />
creditworthiness of countries like <strong>Kenya</strong>.<br />
The European Commission (EU) trading block, despite cutting prices by 36%, will still be an<br />
attractive sugar export destination. At an average price of 22 cents per pound, the EU price is<br />
still 4 cents above the open trade price.<br />
International competition from low cost sugar producers is a big challenge to the local sugar<br />
industry. The average cost of sugar production in 2006/07 in <strong>Kenya</strong> was KSh. 42,192 (USD<br />
680) per tonne. The world average cost of production for the same is USD 263 per tonne. As<br />
a result, importers view <strong>Kenya</strong> as an attractive market. <strong>Kenya</strong> needs to bring its cost structure,<br />
<strong>Kenya</strong> <strong>Sugar</strong> Industry
productivity and quality control to levels comparable to those of its competitors in order to<br />
exploit the opportunities availed by the global market.<br />
<strong>Kenya</strong>’s is a signatory to World Trade Organization (WTO), the Cotonou Partnership<br />
Agreements (ACP-EU), COMESA Free Trade Agreement and the East African Community<br />
Customs Union. <strong>Sugar</strong> imports and exports are affected by what happens in these trade<br />
regimes.<br />
2.2.2 COMESA and East African Community Customs Union Obligations<br />
The <strong>Kenya</strong>n sugar industry is protected by COMESA safeguard measures. The safeguards were<br />
first granted in 2004 and were to expire in February 2008. Despite the remarkable progress<br />
made during the safeguard period, the industry was not ready for an open trade regime in<br />
sugar. <strong>Kenya</strong> therefore sought and was granted an additional four years of protection from<br />
March 2008 to February 2012, with a declining tariff and an increasing quota (Table 2.1).<br />
Table 2.1: COMESA Import Quota<br />
Year Quota (tonnes) Tariff Rate (%)<br />
2008/09 220,000 100<br />
2009/10 260,000 70<br />
2010-2014/11 300,000 40<br />
2011/12 340,000 10<br />
1 March 2012 Open market 0<br />
The extension was granted subject to certain conditions, including:<br />
i. Rising sugar import quota in tandem with a declining tariff as shown in Table 2.1<br />
ii. The Government adopts a privatization plan within the first 12 months and takes<br />
verifiable steps to privatize the remaining publicly owned factories by 2011<br />
iii. The industry to implement cane payment system based on sucrose content instead of<br />
weight<br />
iv. The Government adopts an energy policy aimed at promoting co-generation and<br />
other forms of bio-fuel production that will contribute to making the industry more<br />
competitive<br />
v. <strong>Kenya</strong> <strong>Sugar</strong> <strong>Board</strong> (KSB) to increase funding for research on high yielding and early<br />
maturing varieties and spearhead its dissemination by farmers<br />
vi. The Government to increase funding for road infrastructure<br />
vii. The Government to submit twice yearly performance reports to the COMESA Council<br />
on all measures, activities and improvements on the sugar sector’s competitiveness<br />
<strong>Sugar</strong> prices in <strong>Kenya</strong> need to drop by at least 39% to be in line with COMESA levels. Such<br />
a price drop in less than 3 years is drastic and requires major cost reduction strategies for the<br />
industry. Although there are eight sugar mills in production, industry sources indicate that<br />
only West <strong>Kenya</strong>, Mumias and Kibos & Allied Industries would survive if the safeguards were<br />
to be lifted now because they can produce sugar at costs similar to other COMESA countries.<br />
These factories are equipped with modern facilities that can process sugarcane efficiently 4 .<br />
4 KSB (2008), Cost of Cane and <strong>Sugar</strong> Production and Personal Interviews<br />
Strategic Plan, 2010-2014 9
10<br />
Table 2.2: Cost of <strong>Sugar</strong> Production in COMESA and Selected EAC countries<br />
<strong>Kenya</strong> <strong>Sugar</strong> Industry<br />
Country Cost USD/ tonne<br />
<strong>Kenya</strong> 415-500<br />
Sudan 250-340<br />
Egypt 250-300<br />
Swaziland 250-300<br />
Zambia 230-260<br />
Malawi 200-230<br />
Uganda 140-180<br />
Tanzania 180-190<br />
While Tanzania is not a member of COMESA, Uganda is not a signatory to the COMESA<br />
Free Trade Agreement. Consequently, the two countries can and do import sugar from outside<br />
COMESA. These sugars find their way into <strong>Kenya</strong> through Informal Cross Border Trade<br />
(ICBT), which poses an unfair competition to the local sugar producers. Similar problems also<br />
occur through transhipment of sugar via other COMESA countries (such as Egypt) from non-<br />
COMESA countries (such as Brazil).<br />
The East African Community (EAC) commenced implementation of a common customs<br />
union in 2005. The Customs Union encompasses the removal of internal tariffs, application<br />
of a Common External Tariff (CET) and elimination of Non-tariff barriers (NTB). The CET<br />
applies zero tariff rates for raw materials, 10% for intermediate goods and 25% for finished<br />
products. Whilst this is a welcome move, it is worth noting that within the EAC, the cost<br />
of sugar production is lowest in Uganda followed by Tanzania then <strong>Kenya</strong>. The practical<br />
consequence is that even within the EAC; a duty free movement of sugar would imply that<br />
Uganda and Tanzania producers would pose a challenge to their <strong>Kenya</strong>n counterparts. The<br />
EAC Customs Union also include Burundi and Rwanda who are also members of the EAC.<br />
Ultimately, the custom union might include Southern Sudan and the Democratic Republic of<br />
the Congo in future. Therefore, it is necessary that domestic production be more efficient and<br />
competitive and internal prices be realigned with regional levels for the industry is to survive<br />
the anticipated regional sugar trade liberalization.<br />
2.2.3 National Challenges<br />
The country is facing a monumental task of overcoming poverty: 56% of the population lives<br />
below the poverty line; an unemployment rate in excess of 40%, compounded by an increasing<br />
number of youths leaving school who are looking for white-collar jobs. These problems are<br />
exacerbated by high inequality in income and asset distribution and a deteriorating gender<br />
inequality. The pressure to create jobs in the economy is therefore very high and the sugar<br />
industry is expected to play a significant role.<br />
These adverse trends have led to considerable disparities in development among the<br />
different regions of the country, which is posing a serious challenge to national cohesion and<br />
development. In addition, insecurity in neighbouring Somalia coupled with homegrown<br />
criminality, including the emergence of organized gangs and militia and availability of illegal<br />
firearms have combined to create an adverse investment climate and have put considerable<br />
pressure on state resources.
The state of infrastructure is unsatisfactory in terms of adequacy and quality because of years<br />
of deferred maintenance. Roads in particular, require a major effort for rehabilitation and<br />
maintenance; irrigation infrastructure has stagnated at very low levels since the 1970s – the<br />
share of irrigated agricultural output is less than 10% of AgGDP. The limited use of irrigation<br />
has increased farm level risks and hindered a sustainable increase in yields. The infrastructure<br />
problems are likely to persist unless there is a clear plan and programme of implementation<br />
over the medium and long-term. For the sugar industry, the process of seeking to build a<br />
competitive industry will be impeded by an inadequate and poor quality infrastructure.<br />
Corporate governance has been a challenge for the industry for a long time. The sugar industry<br />
needstotransformitselftoprofitabilityandefficiencypaththroughsoundmanagementpractices.<br />
There is need to develop and implement policies that would ensure that the principles of good<br />
governance are instituted and maintained. This would ensure competitiveness, transparency,<br />
accountability and sustainability of the industry.<br />
Land is an important factor of production as it provides the foundation for all other activities<br />
such as agriculture, water, settlement, tourism, wildlife and forestry, and infrastructural activities.<br />
However, over the years, administration and management of land has been a challenge due to<br />
lack of a comprehensive land tenure policy. This has led to fragmentation of land into small and<br />
uneconomic land units. Small land sizes has led to strong competition for land between food<br />
crops and sugarcane, which has increased food insecurity. The agricultural sector is developing<br />
a National Land Use Policy and Master Plan, which will provide guidelines regarding the use<br />
of land.<br />
Development projects recommended under Vision 2030 will increase demand on <strong>Kenya</strong>’s energy<br />
supply. Currently, <strong>Kenya</strong>’s energy costs are higher than those of her competitors. <strong>Kenya</strong> must,<br />
therefore, generate more energy at a lower cost and increase efficiency in energy consumption.<br />
To help meet the energy needs, the industry will invest in co-generation with the aim of selling<br />
surplus power to the national grid.<br />
Strategic Plan, 2010-2014 11
12<br />
<strong>Kenya</strong> <strong>Sugar</strong> Industry<br />
Chapter<br />
3<br />
Review of the Strategic Plan<br />
2004-2009<br />
3.1 Strategic Objectives (2004-2009)<br />
To turn around the sugar industry, the outgoing Plan identified nine (9) Strategic objectives for<br />
implementation during the period 2004-2009. These objectives and actions are presented in Annex I.<br />
3.2 Achievements<br />
A review of the outgoing Plan revealed that the level of implementation of activities was only about 30%<br />
of what was intended, many of the activities are work-in progress. The poor implementation of the plan<br />
was attributed to the fact that the objectives were way too ambitious, not SMART 5 hence extremely<br />
difficult to implement and monitor. Implementation of some activities was delayed by lack of funds.<br />
3.2.1 Attainment of the Mission<br />
The <strong>Kenya</strong> <strong>Sugar</strong> Industry Strategic Plan (2004-2009) set out the mission of the industry as to:<br />
“consistently achieve self-sufficiency and capacity for export of sugar and related products through<br />
implementation of competitive global industry best practices.” However, this mission was not<br />
achieved during the Plan period. The industry is still a net exporter. The goal of being globally<br />
competitive is still a dream because the industry did not implement the structural measures<br />
that would have brought down costs and increased its competitiveness. But of great concern,<br />
is the focus on sugar and self-sufficiency without regard to profitability and efficiency. It<br />
became clear that the sugar industry could not simultaneously seek self-sufficiency and global<br />
competitiveness. As illustrated by the COMESA conditionality for granting an extension of its<br />
safeguards, the industry needs to become competitive through major structural changes. This<br />
calls for a review of the mission.<br />
3.2.2 Analysis of the <strong>Sugar</strong> Industry Performance (2004-2009)<br />
I. Increased <strong>Sugar</strong>cane Production and Productivity<br />
Area under Cane<br />
Area under cane grew from 131,507 hectares in 2004 to 169,421 hectares in 2008 (Fig 3.1),<br />
representing an increase of 28.8%. The increase in cane area was attributed to the addition of<br />
Kibos and Soin <strong>Sugar</strong> Zones as new cane areas. Additionally, apart from SONY <strong>Sugar</strong> Company<br />
and Miwani, all the other companies increased areas under cane. Most of the increase was from<br />
the West <strong>Kenya</strong> zone, which rose by 198.2% (Table 3.1)<br />
5 Specific, Measurable, Attainable, Realistic, Timed
Area under cane (Ha)<br />
169,421<br />
158,568<br />
147,730<br />
144,765<br />
131,507<br />
122,580<br />
126,826<br />
117,131<br />
Fig. 3.1: Area under Cane (2001-2008) 6<br />
Source: Year Book of <strong>Sugar</strong> Statistics, KSB, 2008<br />
Table 3.1: Area under Cane<br />
Company<br />
2001<br />
Year<br />
2004 2008 Increase/<br />
Decrease<br />
Increase/<br />
(Decrease)<br />
Ha Ha Ha %<br />
Chemelil 10,219 13,341 3,122 30.6<br />
Muhoroni 11,146 14,259 3,113 27.9<br />
Mumias (+Busia Zone) 56,792 64,637 7,845 13.8<br />
Nzoia 19,449 23,899 4,450 22.9<br />
SONY 20,941 19,322 -1,619 (7.7)<br />
Miwani 5,560 4,633 -927 (16.7)<br />
Kibos - 2,622 2,622 New zone<br />
West <strong>Kenya</strong> 7,400 22,070 14,670 198.2<br />
Soin - 4,638 4,638 New zone<br />
Total 131,507 169,421 37,914 28.8<br />
Source: Year Book of <strong>Sugar</strong> Statistics, KSB, 2008<br />
Cane Varieties<br />
2002 2003 2004 2005<br />
In 2008, cane variety CO 945 occupied 35.72% of the total area under cane. Varieties CO 421,<br />
CO 617 and N14 occupied 28.4%, 13.29%, 10.95% of the total area respectively. KESREF<br />
developed four new cane varieties (KEN 82-062, KEN 82-472, EAK 73-335 and D8484)<br />
in 2007. However, the area under cane for <strong>Kenya</strong>n bred varieties remained just under 5% of<br />
the gross area. The slow adoption rate to <strong>Kenya</strong>n varieties is attributed to inefficient factory<br />
utilisation capacity that translates into delayed harvesting which raises the risks to the farmers,<br />
and to some extent weak research-extension-farmer linkages. Most farmers do not want to<br />
adopt early maturing cane varieties because they deteriorate faster and the factories do not have<br />
the capacity to harvest in good time.<br />
6 Source: <strong>Kenya</strong> <strong>Sugar</strong> <strong>Board</strong> Strategic Plan (2008-2012), Year Book of <strong>Sugar</strong> Statistics<br />
Year<br />
2006 2007 2008<br />
Strategic Plan, 2010-2014 13
14<br />
Area Harvested, Cane Deliveries and Cane Yields<br />
Area Harvested: Total area harvested in the nucleus estates and the outgrower farms was<br />
54,465 hectares in 2008 compared to 54,191 hectares in 2004, indicating an increase of 0.51%.<br />
This does not however include the area harvested by non-contracted farmers. The mean area<br />
harvested over the entire planning period was 38.9% of the total area with a standard deviation<br />
of ±3.4. The largest area harvested was recorded in 2007 (Fig. 3.2). However, the best industry<br />
average was achieved in 2002, when 42.6% of the area under cane was harvested.<br />
Average yield (Tonnes/Ha)<br />
75<br />
73<br />
71<br />
69<br />
67<br />
65<br />
63<br />
2001<br />
Fig. 3.2: Area Harvested (2001-2008) 7<br />
Cane Deliveries: Total cane deliveries for the year 2008 were 5,125,821 tonnes against<br />
4,660,995 tonnes in 2004, representing a cane supply increase of approximately 10% over<br />
the planning period. The best supply was recorded in 2007 at 5,204,214. The decrease in cane<br />
supply in 2008 was attributed to poor rains, post election related violence including a spike in<br />
cane burning cases which affected operations at the farm, transportation and factory levels.<br />
Cane Yields: The average cane yield for the year 2008 was 72.9 TC/Ha against 73.8 TC/Ha<br />
in 2004 representing a decrease of 1.2% (Fig. 3.3). The mean yield for the entire planning<br />
period was 70.4 TC/Ha with a standard deviation of ±3.1. Highest cane yields were recorded in<br />
SONY sugar belt (five-year average, 86.0TC/Ha) followed by Nzoia <strong>Sugar</strong> company (five-year<br />
average, 83.6TC/Ha) then Mumias <strong>Sugar</strong> Company (five year average, 70.9TC/Ha). Lowest<br />
yields were recorded in Chemelil (five-year average, 60.3TC/Ha). The challenge remains in<br />
respect of raising cane yields.<br />
7 Source: <strong>Kenya</strong> <strong>Sugar</strong> <strong>Board</strong> Strategic Plan (2008-2012), Year Book of <strong>Sugar</strong> Statistics<br />
<strong>Kenya</strong> <strong>Sugar</strong> Industry<br />
2002 2003 2004 2005<br />
Year<br />
2006 2007 2008
Harvested area (Ha)<br />
Thousands<br />
61<br />
59<br />
57<br />
55<br />
53<br />
51<br />
49<br />
47<br />
2001<br />
Fig. 3.3: Average Yield, Tonnes/Ha 8<br />
II. Increased <strong>Sugar</strong> Production<br />
Cane Crushed, <strong>Sugar</strong> Made and Recoveries<br />
In 2008, a total of 5,165,786 tonnes of cane was crushed at a sugar recovery rate of 10.03% to<br />
make 518,026 tonnes of sugar. In 2004, a total of 4,805,887 tonnes of cane was milled to make<br />
512,835 tonnes of sugar, giving a recovery rate of 10.67. Some sugar factories such as Chemelil<br />
and Muhoroni are still recording sugar recoveries below the industry standard of 10.1%. The<br />
industry’s long-term target is to achieve recovery levels of 11.5%.<br />
Quality of sugarcane crushed deteriorated during the outgoing planning period. In 2008, the<br />
weighted average pole % cane as a measure of cane quality reduced to 12.7% from 13.2% in<br />
2004 (Fig.3.4). This was still lower than the industry’s long-term target of 13.50%. The average<br />
fibre % cane rose to 17.72% from 17.46% in 2004 (Fig.3.4). The long-term industry’s target<br />
for fibre is 15.50%.<br />
8 Source: Year Book of <strong>Sugar</strong> Statistics, KSB, 2008<br />
2002 2003 2004 2005<br />
Year<br />
2006 2007 2008<br />
Future Outlook for the <strong>Sugar</strong> industry:<br />
According to the mini-survey conducted in January<br />
2009, it was revealed that all zones except West<br />
<strong>Kenya</strong> and Kibos have “excess” cane. The industry is<br />
projected to produce 8,146,913 tonnes against a<br />
consumption of 6,377,453 tonnes leaving an<br />
“excess” of 1,769,560 tonnes (28%)<br />
Strategic Plan, 2010-2014 15
16<br />
Cane quality (%)<br />
Fig. 3.4: Cane Quality (2001-2008) 9<br />
Time Account<br />
During the outgoing planning period, the total gross time available for grinding was 70,112<br />
hours. The actual hours used for grinding over the same period was 40,188 hours representing<br />
57.3% of the gross grinding time. The industry grinding time standard deviation was computed<br />
as±417.5 hours (±4.8%). Figure 3.5 shows account of the factory time within the planning<br />
period under review.<br />
Time (Hours)<br />
19.0<br />
18.0<br />
17.0<br />
16.0<br />
15.0<br />
14.0<br />
13.0<br />
12.0<br />
Hundreds<br />
95<br />
85<br />
75<br />
65<br />
55<br />
45<br />
35<br />
2001<br />
Fig. 3.5: Factory Time Account 10<br />
9 Source: Year Book of <strong>Sugar</strong> Statistics, KSB, 2008<br />
10 Source: Year Book of <strong>Sugar</strong> Statistics, KSB, 2008<br />
<strong>Kenya</strong> <strong>Sugar</strong> Industry<br />
2001<br />
2002 2003 2004<br />
Year<br />
2005<br />
Pol % cane Fibre % cane<br />
2002 2003 2004<br />
Gross grinding time<br />
Year<br />
2005<br />
2006 2007 2008<br />
2006 2007 2008<br />
Actual grinding time
Causes of time losses:<br />
i. Lack of cane resulting mostly from delays in harvesting and transportation<br />
ii. Frequent factories’ breakdowns due to lack of maintenance<br />
Based on the above, none of the sugar factories met the standard for Factory Time Efficiency<br />
(FTE) of 92%. Additionally, all the sugar factories with the exception of Mumias <strong>Sugar</strong><br />
Company, failed to meet the industry’s standard of Overall Time Efficiency (OTE) of 82%.<br />
Capacity Utilisation<br />
The combined installed capacity of sugar factories in the country is 24,040 TCD. This could<br />
produce about 883,691 tonnes of sugar per year. However, during the planning period, the<br />
average capacity utilised was 13,522.50TCD (56.25%), and even though this was a modest<br />
increase over the previous period, it is still far below optimal (Fig. 3.6). The decline in capacity<br />
utilisation needs to be addressed first before expensive options such as capacity expansion are<br />
sought.<br />
Capacity utilisation (%)<br />
70<br />
65<br />
60<br />
55<br />
50<br />
45<br />
2001<br />
Fig. 3.6: Average Factories’ Capacity Utilization (2001-2008) 11<br />
11 Source: Year Book of <strong>Sugar</strong> Statistics, KSB, 2008<br />
2002 2003 2004 2005<br />
Year<br />
Future Outlook for the <strong>Sugar</strong> industry: The<br />
excess cane in the sugar industry has been occasioned<br />
mainly by inefficiency in the utilization of the milling<br />
capacity which currently stands at 56.25%.<br />
Stakeholders’ Concern: ‘Why can’t KSB address the issue<br />
of the factories’ inability to crush existing cane?<br />
2006 2007 2008<br />
Strategic Plan, 2010-2014 17
18<br />
III. Expanded Product Base<br />
Very little was achieved under this strategic direction. Plans for expanding the product base<br />
were largely tentative. Partly because the industry was beset with debts and pressing demand<br />
for factory rehabilitation. The industry also lacked a comprehensive legislation to undertake<br />
the same.<br />
During the outgoing planning period, Mumias <strong>Sugar</strong> Company was the exception, having<br />
launched a co-generation plant to generate electricity to supply the national grid. Some sugar<br />
factories such as Muhoroni, despite their indebtedness, were giving out bagasse freely to small<br />
business entrepreneurs for the production of briquettes and soft boards. Currently, no feasibility<br />
study has been carried out on the production of ethanol and other cane products.<br />
Industry records indicate that production of power alcohol was undertaken for sometime at<br />
the Agro-Chemical and Food Company for blending with petrol. This programme could not<br />
be sustained because there was no policy and legal framework to regulate its use. In addition,<br />
there was resistance from the multi-national petroleum companies who feared a reduction in<br />
their market share.<br />
This strategic direction needs to be pursued in the next planning period.<br />
Challenges to Product Diversification:<br />
i. Co-generation: Uncompetitive pricing mechanism<br />
ii. Limited technology and factory capacities<br />
iii. Weak legal and regulatory framework<br />
IV. Policy and Legal Framework<br />
The major achievements under this strategic direction were:<br />
i. The Cabinet approved the Privatisation Plan<br />
ii. Commenced implementation of the Privatisation Programme<br />
iii. Drafting of the <strong>Sugar</strong> Act, 2001 Amendment Bill<br />
iv. Drafting of the <strong>Sugar</strong> (General) Regulations<br />
v. Classification of sugar as a special commodity under the East African Community<br />
Customs Union hence a CET of 100% or USD 200 per tonne whichever is higher<br />
vi. ISO certification is on going in some sugar factories. Already five factories (Mumias,<br />
Muhoroni, Chemelil, Nzoia and West <strong>Kenya</strong>) are ISO certified. It should be noted that<br />
ISO certification focuses mainly on the process audits that may not be an indicator of<br />
satisfactory performance in terms of service delivery.<br />
<strong>Kenya</strong> <strong>Sugar</strong> Industry<br />
Stakeholders’ Concerns:<br />
1. There are no concrete steps towards<br />
diversification<br />
2. Needs to accelerate its intensification programme<br />
e.g. introducing sweet sorghum in the farming<br />
community as a way of complementing<br />
cane farming
Finalization and implementation of all pending policy and legal instruments will be a major<br />
milestone in the incoming Plan. Pending actions include:<br />
i. Passing of the <strong>Sugar</strong> Amendment Bill<br />
ii. Gazetting of the <strong>Sugar</strong> General Rules<br />
iii. Reclassification of sugar as a food<br />
iv. Finalisation of regulations to restructure outgrower institutions<br />
V. Privatisation of the <strong>Sugar</strong> Industry<br />
During the period under review, the Privatisation Bill was passed by parliament and recently<br />
the Privatization Commission has commenced preparatory work towards offering the candidate<br />
factories for privatization. Speed will be of essence because of the urgency to restructure in<br />
good time to realign factories with the new trade regime expected after the expiry of COMESA<br />
safeguard measures in 2012.<br />
Work in progress:<br />
Stakeholders’ Concerns: Delay in the<br />
implementation of policy and legal actions<br />
i. The basic framework for OGIs has been prepared. It envisages OGIs that will become<br />
effective service providers.<br />
Stakeholders’ Concerns: Mushrooming of<br />
many outgrower institution with minimal service<br />
delivery<br />
VI. Funding for the Industry<br />
The funding of the industry was a challenge. This was exacerbated by poor managerial and<br />
business practices. During the period under review, the industry was not able to attract strategic<br />
investors to inject the much needed capital in the sub-sector. As a result, most millers and<br />
outgrower institutions have severe cash flow and liquidity problems. As a coping mechanism,<br />
some of the millers were not remitting <strong>Sugar</strong> Development Levy (SDL), which led to greater<br />
default penalties. The low funding has compounded the financial problems of factories that<br />
were already highly leveraged. Despite this, there were some notable achievements, including:<br />
i. Farmer education on the availability of credit facilities<br />
ii. Development of proposals for funding (KESREF/EU)<br />
iii. Development Partnerships (EU awarded 6 million Euros to the industry for structural<br />
adjustments)<br />
iv. Development of proposals for SDF funding that led to increased funding for the<br />
industry<br />
Strategic Plan, 2010-2014 19
20<br />
VII. Efficient Supply Chain Management<br />
Supply chain management is still a challenge in the sub-sector. For the industry to remain<br />
competitive, improved management actions such as cost cutting and productivity improvements<br />
along the supply chain should continue and intensified in the next planning period. Notable<br />
achievements under this strategy included:<br />
i. Establishment of quarterly consultative forums<br />
ii. Frequent stakeholder workshops<br />
iii. Adoption of e-commerce in procurement<br />
iv. Development of some cost reduction policies<br />
v. Simplified Cane Payment Formulae<br />
The industry was not able to establish an accountable and specialized procurement body to<br />
help stakeholders reduce costs through economies of scale. Each industry institution insisted<br />
on its own procedures to maintain control of the process. In addition, Parastatals mills are<br />
bound by the public procurement procedures, which are cumbersome and costly.<br />
IX. Socio-Economic Development<br />
The following were achieved during the outgoing planning period:<br />
i. Policy on social corporate responsibility developed but not yet adopted<br />
ii. Community empowerment through awareness creation on HIV/AIDS and Malaria<br />
iii. Environmental health and safety standards developed<br />
iv. Supported sports development<br />
The following were not achieved:<br />
i. Infrastructural development was considered far too modest<br />
ii. <strong>Sugar</strong> industry business plan was not realised<br />
iii. Brand <strong>Kenya</strong> initiative was still in the initial stages of conceptualization<br />
<strong>Kenya</strong> <strong>Sugar</strong> Industry<br />
Stakeholders’ Concerns: Since its inception<br />
in 1992, SDF has grown to be the largest source of<br />
industry funding. Is the SDF funding sustainable?<br />
Stakeholders’ Concerns: Some companies<br />
were ISO certified yet the services to farmers were<br />
still wanting
Stakeholders’ Concerns: Dilapidated<br />
infrastructure leading to high cost of cane and<br />
sugar production<br />
3.3 Lessons from Plan Implementation<br />
Several interviews and discussions were held to determine the salient lessons learnt since the industry’s<br />
Strategic Plan (2004-2009) was formulated and the experiences during its implementation. Overall, all<br />
stakeholders interviewed concurred that the Strategic Plan instrument was good. They also all agreed<br />
that the outgoing Plan could have achieved more.<br />
The useful lessons drawn from the implementation of the same were:<br />
i. Due to lack of a well-institutionalised monitoring, evaluation and reporting system, many<br />
stakeholders did not report diligently on their operations both current and planned. As a result<br />
there was no reliable empirical information for accurate forecasting beyond a quarter or two. This<br />
meant that the data that informed internal decision-making was not the same as was shared during<br />
the Plan’s quarterly implementation review meetings. This denied the planners the opportunity<br />
to gather information that would have been essential in facilitating the design and redesign of a<br />
longer-term strategy for the transformation of the industry.<br />
ii. Lack of a proper implementation framework was a major shortcoming in the outgoing Plan.<br />
This made it difficult to implement the strategic actions. Additionally, the objectives were not<br />
SMARTEST 12 , which made it difficult to measure performances against targets.<br />
iii. There was no linkage between Plan’s strategic objectives and the national agenda. Thus the<br />
implementation of the Plan was done in isolation.<br />
iv. Lack of funds and/or delayed funding led to delays in the implementation of some of the strategic<br />
objectives.<br />
v. There was no harmony between the Strategic Plan, work plans, performance contracts and<br />
budgetary provisions. This reduced efficiency and effectiveness of strategy implementation.<br />
vi. The role of KSB in carrying out monitoring and evaluation of the Plan’s implementation was full<br />
of challenges. The <strong>Board</strong> was not able to enforce and supervise its implementation.<br />
vii. Lack of a risk mitigation mechanism in the outgoing Plan was a major set- back in the realisation of<br />
the strategic objectives. Some of the declining outputs were as a result of risk that could have been<br />
anticipated and mitigated.<br />
viii. There were extremely high expectations at the onset of the Plan’s implementation. Some of the<br />
stakeholders had expected the Plan to be an instrument through which the Government would<br />
12 Specific, Measurable, Attainable, Realistic, Timed, Engaging, Siring, Team effort<br />
Strategic Plan, 2010-2014 21
22<br />
identify funding needs and release funds towards the same. Essentially, this group of stakeholders<br />
turned to Government as a lender of first resort and seemed disappointed when they learnt<br />
otherwise.<br />
ix. High indebtedness by most of the factories led to lack of implementation of some of the strategic<br />
objectives as some of the funds for implementation were to be from internal sources. This increased<br />
pressure on the <strong>Sugar</strong> Development Fund (SDF), which was already inadequate.<br />
Based on the foregoing, the incoming Strategic Plan (2010-2014) has been formulated taking cognisance<br />
of the above lessons.<br />
3.4 Situational Analysis<br />
At the end of the 2004-2009 planning period, the sugar industry is still struggling to transform itself into<br />
a vibrant, efficient, diversified and competitive industry. A SWOT and PESTLE analysis demonstrated<br />
the state of affairs.<br />
3.4.1 Strength, Weaknesses, Opportunities and Threats (SWOT) Analysis<br />
The Strengths, Weaknesses, Opportunities and Threats (SWOT) analysis of the <strong>Kenya</strong>’s sugar<br />
industry involved the assessment of both the internal and external environment in which the<br />
industry operates. The results are outlined below:<br />
I. Strengths: The following were identified as the industry main strengths:<br />
a. Vast potential for expansion of area under cane<br />
b. Unutilized processing capacity<br />
c. Strong agronomic research capacity<br />
d. Resilient, hardworking farmers<br />
e. Stakeholder participation and concurrence<br />
f. Protected local markets<br />
II. Weaknesses: The major weaknesses of the industry are:<br />
a. Over-reliance on a single product (sugar ) for revenue<br />
b. Limited irrigation<br />
c. Weak corporate governance<br />
d. High level of industry indebtedness<br />
e. Substantial Government ownership<br />
f. High post harvest losses (estimated to be at least 5%)<br />
g. Poor transport infrastructure<br />
h. Capacity underutilisation (56.25% of TCD)<br />
i. Low capacity mills (only 12.5% of operating factories above 3,500 TCD)<br />
j. High costs of production<br />
k. Inadequate and uncoordinated funding<br />
l. Lack of performance monitoring and evaluation system<br />
IV. Opportunities: Possible opportunities for exploitation in the Industry include:<br />
a. Ready local and regional markets<br />
b. Agronomic potential<br />
c. Government goodwill<br />
d. Proven opportunities for product diversification (co-generation, ethanol)<br />
e. Sucrose based pricing and cane payment system<br />
f. <strong>Sugar</strong>cane production through irrigation<br />
<strong>Kenya</strong> <strong>Sugar</strong> Industry
V. Threats: The threats to the realisation of the vision and mission include:<br />
a. Continued reduction of the SDL<br />
b. Informal cross-border trade<br />
c. Strong import competition<br />
d. Uneconomic land sub-division<br />
e. High energy costs<br />
f. High tax burden<br />
g. Risk of insolvency of some producers<br />
h. Food insecurity<br />
i. Risk of slow adoption of new technologies<br />
j. Political interference in affairs of the industry<br />
k. Climate change due to environmental degradation<br />
l. Malaria and HIV/AIDS<br />
3.4.2 PESTLE Analysis<br />
In addition to the SWOT analysis, an analysis of Political, Economic, Social, Technological,<br />
Legal and Environmental (PESTLE) challenges that the <strong>Kenya</strong> sugar industry faces was done.<br />
The analysis helped in understanding the challenges that might hinder the competitiveness<br />
of the industry. Annex II is a summary of the outcome of the analysis. Overall, the analysis<br />
showed that poor corporate governance creates uncertainties in the investment climate and may<br />
hinder the privatization process. It also pointed to the high production costs and the singular<br />
focus on sugar that had resulted in a non-competitive industry. The analysis also revealed the<br />
ecological risks of environmental degradation and climate change and the consequent negative<br />
impact on water and farming systems.<br />
3.4.3 Stakeholders Comparative Advantage Analysis<br />
The sugar industry has strong linkages with stakeholders identified in section 1.3 of this<br />
report. All these stakeholders play important roles in the industry. The industry recognises that<br />
stakeholders will facilitate the implementation of the incoming plan based on their comparative<br />
advantages. Annex III is a summary of the stakeholders’ comparative advantage analysis.<br />
Strategic Plan, 2010-2014 23
24<br />
Strategic Plan 2010-2014<br />
4.1 Rationale for the 2010-2014 Strategic Plan<br />
The Agricultural Sector Development Strategy (2009-2020), and the Vision 2030 emphasize the need<br />
for increasing productivity, commercialisation and competitiveness of the agricultural sector as well as<br />
the need for efficiency and better management in the utilisation of public resources. This is to enable<br />
the Government achieve its strategic objectives of being a middle-income country by the year 2030.<br />
The <strong>Kenya</strong> <strong>Sugar</strong> Industry Strategic Plan 2010-2014, will be one of the key building blocks for both the<br />
Agricultural Strategy and Vision 2030 goals.<br />
The 2010-2014 Strategic Plan will be used to maintain and build on the successes achieved in the 2004-<br />
2009 Strategic Plan. The revised Plan will aim at consolidating the gains made, identify new options to<br />
improve efficiency and increase the industry’s competitiveness. It will also take cognisance of the lessons<br />
learnt in the last five years.<br />
The Plan will provide a framework for setting goals, defining key actions and mobilizing resources to fund<br />
programmes that will achieve agreed goals. It will also provide an opportunity for the exchange of ideas<br />
by a wide array of stakeholders in the industry. It will increase awareness of industry-wide limitations<br />
and opportunities leading to a greater appreciation of actions to be undertaken. Consequently, there will<br />
be greater willingness to share information, gather new ideas and more correctly situate local area issues<br />
in an industry context.<br />
The periodic consultation forums to review status of the Plan’s implementation will provide opportunities<br />
for all industry stakeholders to learn from the leaders and innovators in the industry. The Plan will be<br />
an empowerment tool for internal lobby groups to press their demands for resources and better quality<br />
services. In addition, it will lay ground for enhanced performance of the sugarcane industry premised on<br />
proper utilisation of resources, arising from clearly identified goals, targets and verifiable indicators. The<br />
Plan will set strategic objectives that will help achieve the vision and mission of the industry.<br />
Above all, the formulation of the sugar industry Strategic Plan 2010-2014 comes at a time when the<br />
industry needs to rethink its direction as it approaches the liberalization of the sugar trade regime. The<br />
industry needs to find ways of repositioning itself competitively. This requires that the industry goes<br />
beyond sugar, think more about sugarcane as a whole and exploit market opportunities that the broader<br />
sugarcane industry can provide. It also puts new pressures on the industry to find and invest resources<br />
in the new direction where the industry needs to go.<br />
4.2 Vision, Mission and Core Values of the <strong>Sugar</strong> industry<br />
Following extensive consultations and discussions by the industry stakeholders, KSB management and<br />
the <strong>Board</strong>, it was agreed as follows:<br />
<strong>Kenya</strong> <strong>Sugar</strong> Industry<br />
Chapter<br />
4
4.2.1 Vision<br />
The new vision for the industry is to be ‘a world-class multi-product sugarcane industry’.<br />
4.2.2 Mission<br />
The new mission of the industry is to ‘facilitate a multi-product sugarcane industry that is<br />
efficient, diversified and globally competitive’. This will be realised by enhancing industry’s<br />
competitiveness through cost reduction strategies and efficiency improvements, expanding<br />
product base, improving infrastructure and strengthening the regulatory framework.<br />
4.2.3 Core Values<br />
To achieve the Vision and Mission of the industry, stakeholders have pledged to uphold the<br />
following six core values:<br />
1. Product and Service Excellence: through excellent product and service delivery it will<br />
strive to exceed customer expectations<br />
2. Stakeholder Partnership: to optimise synergies in order to meet set goals by consciously<br />
and deliberately nurturing team spirit, collaboration and consultation<br />
3. Integrity: to uphold virtues of integrity through honesty and fairness in all operations<br />
4. Accountability: to strive to be responsible custodians of all resources entrusted to the<br />
industry in a professional and transparent manner<br />
5. Social Responsibility: endeavour to be socially responsible to society and pursue industry<br />
goals though socially acceptable practices that preserve the environment; promote<br />
socio-economic development, support vulnerable groups and HIV/AIDS and Malaria<br />
programmes<br />
6. Gender Mainstreaming: embrace principles of gender equity, fairness and balance across<br />
gender<br />
4.3 Analysis of Challenges along the <strong>Sugar</strong> industry Value<br />
Chain<br />
After five years of implementing the Strategic Plan 2004-2009, the original strategic issues and objectives<br />
of the sugar industry broadly remain the same in spite of the marked improvement in addressing them. In<br />
the incoming planning period, the key strategic issues have been derived after a comprehensive analysis<br />
of the challenges and/or gaps along the industry’s value chain (Fig 4.1).<br />
Strategic Plan, 2010-2014 25
CHALLENGES<br />
• High cost of<br />
inputs<br />
• Weak researchextension-farmer<br />
linkages<br />
• Low adoption of<br />
high yielding cane<br />
varieties<br />
• Excessive land<br />
subdivision<br />
• Delayed payments<br />
to farmers<br />
• Limited irrigation<br />
• Inefficient OGIs<br />
• Drought, Cane<br />
fires, diseases<br />
• Long maturity<br />
periods<br />
• Inadequate<br />
funding (SDF)<br />
• Lack of collateral<br />
• Food insecurity<br />
• Limited irrigation<br />
26<br />
Farm level<br />
operations<br />
NUCLEUS<br />
ESTATES<br />
SMALLHOLDERS<br />
<strong>Kenya</strong> <strong>Sugar</strong> Industry<br />
Pre-Factory<br />
Operations<br />
HARVESTING<br />
TRANSPORTATION<br />
• Delayed and<br />
uncoordinated<br />
harvesting<br />
• Labour intensive<br />
• Dilapidated<br />
infrastructure<br />
• High post<br />
harvest losses<br />
(cane spillage,<br />
poaching etc.)<br />
• Inappropriate<br />
trailer designs<br />
• Inadequate<br />
funding (SDF)<br />
• Poor cane yard<br />
management<br />
• Small and<br />
uncoordinated<br />
planting and<br />
harvesting units<br />
• Irregular routine factory<br />
maintenance<br />
• Low crushing capacity<br />
• Low sugar extraction<br />
rates<br />
• Slow adoption of<br />
new and appropriate<br />
technology<br />
• Lack of industrial<br />
research<br />
• High cost of sugar<br />
production<br />
• High indebtedness<br />
• Narrow product base<br />
• Dilapidated processing<br />
equipment<br />
• Inefficient factory<br />
operations<br />
• Wastage in cane yard<br />
• Inadequate funding<br />
(SDF)<br />
Fig. 4.1: Challenges along the <strong>Sugar</strong> Industry Value Chain<br />
4.4 Strategic Goals (2010-2014)<br />
Processing Distribution<br />
CANEYARD<br />
OPERATIONS<br />
MILLING<br />
OPERATIONS<br />
BY PRODUCTS<br />
WHOLESALERS /<br />
RETAILERS<br />
• High taxation<br />
• Strong cartel<br />
of sugar<br />
importers<br />
• Limited value<br />
addition<br />
and product<br />
diversification<br />
• Inadequate<br />
funding SDF<br />
Consumption<br />
INDUSTRIAL<br />
CONSUMERS<br />
DOMESTIC<br />
CONSUMERS<br />
• Imports<br />
cheaper<br />
• Incapacity<br />
to process<br />
industrial<br />
sugar<br />
• Poor<br />
• product<br />
quality<br />
• Lack of<br />
consumer<br />
representation<br />
in SDF<br />
committees<br />
Arising from the stakeholders’ consultations, SWOT and PESTLE analysis, a number of strategic goals<br />
were identified along the sugar industry’s value chain. These issues and proposed actions are summarised<br />
in Fig. 4.2.
Farm level<br />
operations<br />
<strong>STRATEGIC</strong> ISSUES<br />
Enhance Competitiveness Enhance<br />
Competitiveness<br />
• Reduce cost of farm inputs<br />
• Increase supply of quality<br />
seed cane<br />
• Increase adoption rate of<br />
new technology<br />
• Intensify farm level<br />
research<br />
• Invest in irrigation<br />
• Increase research funding<br />
• Encourage good<br />
husbandry practices<br />
• Modernise and promote<br />
the use of ICT<br />
• Improve cane yard<br />
management<br />
• Reduces postharvest<br />
losses<br />
• Increase research<br />
funding<br />
• Modernise and<br />
promote the use of<br />
ICT<br />
Enhance<br />
Competitiveness<br />
• Intensify industrial and<br />
applied research<br />
• Increase processing<br />
efficiency<br />
• Reduce cost of sugar<br />
production<br />
• Factory rehabilitation<br />
and modernisation<br />
• Embrace condition<br />
maintenance<br />
• Modernise and<br />
promote the use of ICT<br />
Enhance<br />
Competitiveness<br />
• Harmonise marketing<br />
pattern<br />
• Increase market<br />
research<br />
• Branding<br />
• Maintain adequate<br />
stock levels<br />
• Modernise and<br />
promote the use of<br />
ICT<br />
Expand Product Base Expand Product Base Expand Product Base Expand Product Base<br />
• Encourage intensification<br />
to increase food security<br />
• Increase income<br />
streams from expanded<br />
product base<br />
• Implement legislation<br />
on blending<br />
• Feed in tariff<br />
• Implement legislation<br />
on blending<br />
Improve Infrastructure Improve Infrastructure Improve Infrastructure Improve Infrastructure<br />
Rehabilitate rural roads • Consider other<br />
modes of transport<br />
• Increase transport<br />
units<br />
• Invest in road<br />
improvement<br />
• Invest in ICT<br />
• Embrace e-commerce<br />
and e-procurement<br />
Regulatory Framework Regulatory Framework Regulatory Framework Regulatory Framework<br />
• Pass the <strong>Sugar</strong><br />
Amendment Bill<br />
• Gazette <strong>Sugar</strong> General<br />
Rules<br />
• Harmonize all sugar laws<br />
• Finalise and implement<br />
regulations to restructure<br />
outgrower institutions<br />
Fig. 4.2: Strategic Issues<br />
Pre-Factory<br />
Operations<br />
• Establish a sugarbelt<br />
roads management<br />
committee<br />
4.5 Strategic Objectives (2010-2014)<br />
• Encourage good<br />
corporate governance<br />
• Enforce measures to<br />
eliminate tax evasion<br />
A synthesis of the 2004-2009 Plan review and discussions with industry stakeholders led to a recognition<br />
of four (4) key strategic objectives that will be the pillars of the 2010-2014 Strategic Plan. These strategic<br />
objectives are:<br />
1. Enhancing industry competitiveness<br />
2. Expanding product base<br />
3. Improving infrastructure<br />
4. Strengthening the regulatory framework<br />
Processing Distribution<br />
Strategic Plan, 2010-2014 27
In order to ensure that the identified strategic objectives are comprehensively addressed, a number of<br />
strategies have been formulated for each objective. A set of activities have been identified for each strategy<br />
in order to work towards the achievement of the desired results. A results matrix has been developed<br />
and presented as Annex IV. The following section therefore presents the strategic objectives, proposed<br />
strategies and activities/actions to be undertaken under each strategy.<br />
28<br />
4.5.1 Strategic Objective 1: To Enhance <strong>Sugar</strong> Industry Competiveness<br />
<strong>Kenya</strong> remains a high cost sugarcane and sugar producer compared to regional competitors.<br />
The average cost per tonne to produce sugar in <strong>Kenya</strong> is higher than that of its COMESA<br />
competitors. In the 2008/09 season, the average industry sugar production cost per tonne was<br />
USD 428 vs. an estimated cost of USD 263 for its competitors 13 . These costs are too high to<br />
remain competitive, yet without cost reduction, the industry cannot compete. To bring its costs<br />
in line with its competitors, the industry needs to reduce its costs by a factor of about 39%. In the<br />
incoming planning period, 2010-2014, the sugar industry will reduce sugarcane production cost<br />
by 15% and 22% for plant crops and ratoon crops respectively as shown in Tables 4.1a. During<br />
the same period, sugar production cost will be reduced by 46% as shown on Table 4.1b.<br />
Table 4.1a: Actual and Required Cost Reduction in Cane Production per tonne<br />
Cost (KSh/Tonne<br />
Base year 2009/10 2010/2011 2011/2012 2012/2013<br />
Item<br />
PC R PC R PC R PC R PC R<br />
Land development 316 43 316 43 316 43 316 43 316 43<br />
Seed cane 269 0 269 0 269 0 269 0 269 0<br />
Cane maintenance 362 315 362 315 362 315 362 315 362 315<br />
Harvesting and<br />
loading<br />
206 206 189 189 172 172 150 150 150 150<br />
Cane transport (24km<br />
radius)<br />
600 600 530 530 450 450 400 400 400 400<br />
Total 1,753 1,164 1,666 1,077 1,569 980 1,497 908 1,497 908<br />
USD* 22.9 15.2 21.8 14.1 20.5 12.8 19.6 11.9 19.6 11.9<br />
*Exchange rate – USD 1 = KSh. 76.55; PC – plant cane; R - ratoon<br />
Source: Log Associates, 2009, Proposed Cost Reduction for Plant and Ratoon Crops<br />
Table 4.1b: Actual and Required Cost Reduction in <strong>Sugar</strong> Production per tonne<br />
Cost (KSh/Tonne)<br />
Item Base year 2009/2010 2010/2011 2011/2012 2012/2013<br />
Factory Cost 5,909 5,023 4,269 3,757 3,306<br />
Other business support<br />
costs<br />
26,873 22,841 19,415 17,085 15,034<br />
Total 32,782 27,864 23,684 20,842 18,340<br />
USD* 428.2 364.0 309.4 272.3 240.0<br />
*Exchange rate – USD 1 = KSh. 76.55<br />
Source: Log Associates, 2009, Proposed Cost Reduction in <strong>Sugar</strong> Production<br />
13 Calculations based on figures from Cost of Cane and <strong>Sugar</strong> Production 2008 by KSB<br />
<strong>Kenya</strong> <strong>Sugar</strong> Industry
The above tables are illustrations costs in two key stages of the production and value chain<br />
but are not the only areas that require cost reduction. The industry needs to gain production<br />
efficiencies at all stages of the value chain. One of the key elements of value chain enhancement<br />
is the expansion of the product base. In Mauritius for instance, the share of sugar revenue in<br />
the total revenue mix is only about 40%. The remaining 60% is derived from sugarcane coproducts<br />
including power generation, ethanol, industrial sugar and other products. The 2010-<br />
2014 Strategic Plan will redirect the <strong>Kenya</strong> sugar industry in the same direction. To enhance<br />
the competitiveness of the industry, the following strategies will be implemented:<br />
Strategy 1.1: Reduction in Farm Level Risks<br />
Farmers face many risks in the production cycle including unpredictable rainfall, cane fires,<br />
uncertainty in the timing of cane harvesting among many others. These risks ultimately result<br />
in increased sugarcane production costs and diminished returns to the farmer. In the incoming<br />
period, the industry will strive to reduce farm level risks by:<br />
i. Increasing sugarcane production and productivity through efficient farm operations:<br />
The search for an efficient and competitive sugarcane industry starts with the farmer.<br />
Farmers need to increase cane yields through consistent fertilizer application, use higher<br />
yielding and early maturing varieties and where feasible adopt supplemental irrigation and<br />
drainage. With good husbandry practises, farmers can profitably increase the number of<br />
ratoon crops and save replanting costs. The industry will increase the area under sugarcane<br />
by 32% and yield per hectare by 36% (Table 4.2). During the same period, the ERC%<br />
sucrose content in cane will be increased to 87.25%. It is also expected that 20,000Ha of<br />
sugarcane will be planted along the Tana River Basin 14 .<br />
Table 4.2: Farm Level Annual Targets<br />
Year Area under Cane (Ha) Yield (Tonnes/Ha)<br />
2008/2009(Base Year) 169,421 73<br />
2009/10 177,892 79<br />
2010/11 196,682 84<br />
2011/12 206,363 90<br />
2012/13 215,290 95<br />
2013/14 224,925 100<br />
Source: Log Associates, 2009, Projected Area under Cane and Yields<br />
ii. Developing the use of and financing irrigation for sugarcane production: There exist<br />
vast potential to increase irrigated sugarcane production in <strong>Kenya</strong> particularly in the Tana<br />
River Basin, Nyando Basin and Nzoia Basin. While estimates vary, the potential irrigable<br />
land in these three basins alone is in the range of 700,000 hectares. In the incoming<br />
period, the industry will expand cane area under irrigation by about 40,000 hectares<br />
annually to reach an estimated total of 2000,000 hectares by the end of the Plan period.<br />
Studies indicate that yields from irrigated fields range from 120-150 TCH compared to<br />
the 70-100TCH from rain-fed fields. Therefore, 200,000Ha irrigated cane field would<br />
produce 40,500,000 tonnes of sugarcane. In such controlled growing conditions, the<br />
sucrose content in the sugarcane can be boosted to an average of 15% compared to<br />
13.5% for rain-fed conditions. During the planning period 2010-2014, the industry will<br />
14 TARDA Strategic Plan 2008-2012<br />
Strategic Plan, 2010-2014 29
30<br />
invest in irrigation in the Tana, Nyando and Nzoia river basins. Already, the Ministry<br />
of Water and Irrigation (MoWI) is working on the details of constructing multi-purpose<br />
dams in Nyando and Nzoia basins as a lasting solution to perennial flooding in these areas.<br />
The water from these dams will be used by the industry for irrigation projects. The GoK<br />
has also stepped up campaigns for developing irrigation infrastructure along the Tana River<br />
basin. The sugar industry will support these initiatives to fast track implementation. Table<br />
4.3 outlines the targeted area under cane to be irrigated over the next five-year period.<br />
Table 4.3: Annual Targets for Irrigated Area under Cane<br />
Year Irrigated Area (Ha)<br />
2008/2009(Base Year) 400<br />
2009/10 44,000<br />
2010/11 84,000<br />
2011/12 124,000<br />
2012/13 164,,000<br />
2013/14 204,000<br />
Source: Log Associates, 2009, Proposed Irrigated Area under Cane<br />
iii. Creating an insurance scheme to cushion the farmers from losses arising in the<br />
industry: <strong>Sugar</strong>cane farmers continue to suffer from unforeseen calamities occasioned<br />
by unpredictable weather patterns with erratic and prolonged periods of drought. Cane<br />
fires and theft have also become increasingly frequent. During the planning period,<br />
the industry will pilot and if successful, expand sugarcane crop insurance working in<br />
collaboration with private sector partners.<br />
iv. Enhancing results oriented research-extension-farmer linkages to accelerate adoption<br />
rates of high yielding varieties: Adoption rates of new technology at farm level have<br />
generally been in the 30% range. Despite the advantages of high yielding and early<br />
maturing varieties, farmers have shown little enthusiasm for the new technologies. The<br />
extension messages need to be disseminated more aggressively while keeping in mind<br />
that the principle of sugarcane farming as a business starts with the farmer who needs<br />
transparent pricing, and prompt payment to run the farm as a business. In the incoming<br />
period, sugar factories and outgrowers will phase out long maturing cane varieties like<br />
CO 421 while replacing them with varieties such as CO 945, EAK 73-335 varieties,<br />
which are early maturing, rich in sucrose content and resistant to diseases. Table 4.4<br />
outlines the targeted proportional area under high yielding <strong>Kenya</strong>n cane varieties over the<br />
next five-year period.<br />
Table 4.4: Annual Targets for Proportion of High Yielding Cane Varieties<br />
Year Proportion (%)<br />
2008/09(Base Year) 5<br />
2009/10 10<br />
2010/11 25<br />
2011/12 40<br />
2012/13 45<br />
2013/14 50<br />
Source: Log Associates, 2009, Proposed Proportion of High Yielding Varieties<br />
<strong>Kenya</strong> <strong>Sugar</strong> Industry
v. Implementing a land tenure policy that encourages economies of scale: Land<br />
fragmentation through subdivision is a major threat to plantation crops such as sugarcane.<br />
A mix of population pressure and cultural practises has led to an escalation of land<br />
subdivisions. The sugarcane industry will continue to articulate the risks of uncontrolled<br />
subdivision. It will also design and implement innovative arrangements such as block<br />
farming 15 and satellite villages 16 that will help increase land sizes under cane cultivation.<br />
These approaches are consistent with the recommendations of the Agricultural Sector<br />
Development Strategy 2009-2020 and the <strong>Kenya</strong> Vision 2030.<br />
vi. Ratooning: Farmers need to make a fair return on investment. Studies have shown that the<br />
margins are small for plant crop. Subsequent ratoons, if well maintained, bring good profits<br />
to the farmer (Table 4.5). Currently, there are only two ratoons in the industry. Tanzania,<br />
whose production cost is the lowest in EAC region, has 5-8 ratoons. Brazil, which is the leastcost<br />
cane producer (USD20/t) in the world, has only 20% of the total area under cane on<br />
new plantings. The remaining 80% is under ratoon crops. Top sugar producing countries are<br />
known to produce over 10 ratoons, while marginal producers hardly go beyond two ratoons<br />
hence sustaining losses due to high production costs 17 .To increase earnings from cane farming,<br />
farmers will be encouraged to increase the number of ratoons to five or more.<br />
Table 4.5: Profit Margins Plant Crop vs. Ratoon Crop<br />
<strong>Sugar</strong>belt<br />
Plant Crop<br />
Profit (KSh/Tonne)<br />
Ratoon Crop<br />
Nyando 310 1,107<br />
Western<br />
South Nyanza<br />
621 958<br />
Light soils 669 946<br />
Heavy Soils 572 970<br />
Mean 543 995<br />
Source: <strong>Kenya</strong> <strong>Sugar</strong> <strong>Board</strong>, 2007, Cost of Cane and <strong>Sugar</strong> Production Study<br />
Strategy 1.2: Efficient, Reliable Harvesting and Transport Operations<br />
On average, harvesting and transport operations account for 48% of the total cost of sugarcane<br />
production with a range of 37%-52% 18 . In 2008, harvesting, loading and transport costs<br />
amounted to KSh. 806 per tonne, which translated into KSh. 4.163 billion (assuming all cane<br />
transported within 24km radius19 ). This huge cost was borne by the farmers. The industry will<br />
seek to reduce this cost to levels in the range of 10%-15% in the next five years by:<br />
i. Improving cane yard management: Losses related to a poor transport system are<br />
translated into unavailability and inefficient movement of sugarcane in the cane yard. This<br />
leads to capacity underutilisation in the factory. The losses due to capacity underutilisation<br />
are huge. Good cane yard management is needed to reduce the uneconomically lengthy<br />
turnaround times by cane haulage units. Efficient cane yard operations will also lead to<br />
reduced staleness and mitigate losses to the farmer. To improve efficiency of operations,<br />
cane yards will be rehabilitated, automated and modernised. The monitoring benchmarks<br />
will be reduced staleness index (Table 4.6) and increased cane delivery trips.<br />
15 Discussions on Block Farming are presented in XI<br />
16 Satellite village farming involves consolidating small parcels of land and consolidating farmers into eco-friendly villages<br />
17 Kegode P, 2005, Economic Governance Reform in the <strong>Sugar</strong> Sub-Sector<br />
18 Outgrowers cane production costs, 2007/2008<br />
19 The true picture is that some cane is transported even at70km<br />
Strategic Plan, 2010-2014 31
32<br />
Table 4.6: Annual Targets for Staleness Index<br />
<strong>Kenya</strong> <strong>Sugar</strong> Industry<br />
Year Staleness Index (Days)<br />
2008/2009 (Base Year) 4<br />
2009/10 2<br />
2010/11 2<br />
2011/12 1<br />
2012/13 1<br />
2013/14 1<br />
Source: Log Associates, 2009, Proposed Reduction in Staleness Index<br />
ii. Reducing post-harvest losses: <strong>Sugar</strong>cane farmers lose huge amounts of revenue as a<br />
result of post-harvest losses. A 5% loss in 2008 was equivalent to 258,289.3 tonnes of<br />
sugarcane. The cost of sugarcane ranges between KSh. 2,500-3,100 per tonne. This<br />
implies that farmers lost approximately KSh. 646-800 million. The industry will reduce<br />
post-harvest losses to less than 2% through stronger oversight, improved trailer designs<br />
and infrastructure development (Table 4.7).<br />
Table 4.7: Annual Targets for Post-Harvest Losses<br />
Year Percentage post-harvest losses<br />
2008/2009 (Base Year) 5<br />
2009/10 4<br />
2010/11 3<br />
2011/12 2<br />
2012/13 2<br />
2013/14 2<br />
Source: Log Associates, 2009, Proposed Reduction in Post-Harvest Losses<br />
iii. Reducing time lapse between cane maturity and harvesting: The average cane maturity<br />
period is 18 months. Farmers wait for up to 6-12 months before cane is harvested. This has<br />
made cane farming unattractive to most of them. Some have opted out of cane farming.<br />
The delays in harvesting operations are attributed to uncoordinated and unpredictable<br />
harvesting and transport schedules; and inefficiencies in mill operations. All this is<br />
happening due to lack of proper planning. Information and Communication Technology<br />
can provide the tools needed to coordinate transport and harvesting operations. Through<br />
ICT scheduling, the waiting period for harvesting will be reduced to less than a month<br />
(Table 4.8). The industry will also institutionalise harvesting operations to make it more<br />
reliable and predictable.<br />
Table 4.8: Waiting Time between Cane Maturity and Harvesting<br />
Year Time (months)<br />
2008/2009 (Base Year) 6-12<br />
2009/10 4<br />
2010/11 3<br />
2011/12 2<br />
2012/13 1<br />
2013/14 1<br />
Source: Log Associates, 2009, Proposed Time Lapse between Cane Maturity and Harvesting
iv. Promoting the use of other modes of transport: Industry players need to experiment<br />
with different modes of cane transport including light rail and trucks. Animal drawn carts<br />
are suitable for small factory capacities such as those common in India.<br />
v. Increasing research funding for harvesting and transport: Research in harvesting<br />
and transport is lagging behind as most of KESREF research is agronomic. During<br />
the incoming Plan period, the industry will increase funding to KESREF to explore<br />
mechanised harvesting operations. While mechanical harvesting may save on labour, it<br />
increases post-harvest losses and leads to soil compaction. Soil compaction leads to poor<br />
infiltration, slow drainage and reduced aeration, limiting root growth, nutrient uptake<br />
and crop yields. KESREF while undertaking research towards mechanisation should seek<br />
ways of mitigating such setbacks.<br />
Strategy 1.3: Effective, Efficient and Reliable Milling Operations<br />
The role of the millers is to make a fair return on investment through efficient operation<br />
of mills and/or jaggeries for the production of sugar and other products for sale, and make<br />
timely payments to cane growers. In the next five years, the millers will enhance industry’s<br />
competiveness by:<br />
i. Increasing sugar production through efficient processing: All factories need to operate<br />
optimally through efficient modern style management and carry out regular condition<br />
maintenance. Valuable time is lost while extensive maintenance is being undertaken.<br />
In the incoming plan period, sugar production will be increased by 122% by the year<br />
2014, recovery levels and capacity utilisation increased to 11.5% and 89% respectively<br />
(Table 4.9). Other efficiency performance benchmarks such as FTE and sugar co-product<br />
production per tonne will also be monitored. Currently, all the efficiency benchmarks are<br />
lower than those of major competitors. The various efficiency benchmarks are presented<br />
in Annex V.<br />
Table 4.9: Factory Level Targets<br />
Year Capacity Utilisation Rendement (%) Made <strong>Sugar</strong>(Tonne)<br />
2008/9(Base Year) 50 10.0 518,128<br />
2009/10 61 10.5 565,236<br />
2010/11 70 11.5 670,830<br />
2011/12 75 11.5 813,286<br />
2012/13 80 11.5 982,257<br />
2013/14 89 11.5 1,151,557<br />
Source: Log Associates, 2009, Proposed Factory Level Targets over the next Five Years<br />
ii. Creating economies of scale: Apart from Mumias and the proposed TARDA sugar<br />
company, all the other sugar factories are below 4,000TCD (Annex VI). As the industry<br />
seeks to become more efficient and competitive, all options for achieving economies<br />
of scale will have to be considered. The envisaged privatization programme offers an<br />
opportunity to increase economies of scale through factory mergers in the Western and<br />
Nyando zones. Other opportunities for achieving economies of scale will be realised<br />
through the construction of a new, larger capacity factory in Tana River Basin. Investing<br />
simply in rehabilitation and upgrading of mills, while necessary, is not sufficient.<br />
Strategic Plan, 2010-2014 33
34<br />
iii. Intensifying industrial and applied research: The <strong>Kenya</strong> sugarcane industry needs a<br />
centre of excellence in applied research. This will be achieved through strengthening of<br />
KESREF research capacity and other innovative approaches such as twinning arrangements<br />
between factories and local universities to bring together researchers and practitioners.<br />
iv. Benchmarking with international standards: For <strong>Kenya</strong>’s sugar products to be<br />
competitive nationally, regionally and globally, millers must benchmark their production<br />
processes with international best practices. The industry will achieve this by carrying<br />
out the following activities: (a) Providing information on production technologies and<br />
quality standards and facilitating their application, adaptation and uptake; (b) Providing<br />
information on international best practices for local millers to benchmark themselves;<br />
and (c) Participating in regional and international negotiations on issues affecting the<br />
sugar industry<br />
Strategy 1.4: Enhanced Human Resource Capacity<br />
The twin problems of bureaucratic interference and poor corporate governance have combined<br />
to obscure the efficacy of the human resource development programmes in the industry.<br />
Although <strong>Kenya</strong> has many educational institutions, both private and public, which provide<br />
quality education, the industry still lacks adequate skilled human resources. Arrangements are<br />
underway to create partnerships between the industry and training institutions to produce the<br />
kind of professionals that the industry needs. Already there are ongoing arrangements with<br />
Masinde Muliro University of Science and Technology (MMUST), Egerton University, Maseno<br />
University and Moi University towards the same end. More institutions need to come on<br />
board particularly middle level, diploma type training institutions to supplement these efforts.<br />
In addition to the external training programmes, factories and outgrower institutions will<br />
beef up their internal training capacities. To reinforce a strong skill development programme<br />
through training, staff recruitment policies will be strictly merit based. The management styles<br />
will be progressive and results oriented. It is only through a combination of these approaches<br />
that industry will eventually overcome the current human resource constraints.<br />
In order to deliver on the vision and mission setout in this Strategic Plan, the industry will<br />
recruit, train, promote and retain its staff, to effectively deliver quality services to all the<br />
stakeholders. In this regard, staff will sign performance contracts with respective institutions<br />
binding them to deliver on targets. To ensure availability of skills, talents, and knowledge<br />
required, the industry will carry out the following activities:<br />
i. Undertaking a sugar industry Training Needs Assessment (TNA) and implementing its<br />
findings<br />
ii. Preparation of a staff retention strategy though better remunerations, staff motivation<br />
and workforce compensation<br />
iii. Signing Performance Contracts;<br />
iv. Implementing a Performance Appraisal System (PAS)<br />
v. Strengthening industry’s collaborations with training institutions/universities<br />
Strategy 1.5: Streamlined Corporate Governance<br />
There are major challenges in corporate governance in some of the institutions in the industry.<br />
These challenges are pronounced particularly in institutional and supply chain management<br />
both in outgrower institutions and at the corporate levels of publicly owned factories. This was<br />
the result of poor recruitment policies and political patronage. The industry is moving towards<br />
<strong>Kenya</strong> <strong>Sugar</strong> Industry
ISO certification which may help highlight governance weaknesses and if addressed will help<br />
mitigate some of the challenges. Greater private sector participation in the industry within a<br />
strong regulatory environment will also complement the steps the Government is taking to<br />
improve the same. In order to streamline corporate governance in the industry, the following<br />
activities will be carried out:<br />
i. Conducting periodic Customer Satisfaction Surveys (CSS)<br />
ii. Ensuring the undertaking of International Organization of Standards (ISO) certification<br />
iii. Sensitization of industry on quality standards and certification requirements<br />
iv. Advocacy on governance, security, high cost of doing business, among others<br />
v. Improvement of communication amongst industry stakeholders and the rest<br />
vi. Training on prudent financial management<br />
4.5.2 Strategic Objective 2: To Expand Product Base<br />
Most countries are growing cane and producing sugar with the aim of getting a range of<br />
products and by-products. Cane is cultivated as a strategic product to support industries such<br />
as: Beverages, Confectionery, Pharmaceuticals, Wines, Spirits, Power Alcohol, Animal Feeds,<br />
Energy, Chemicals and Fertilizers. The <strong>Kenya</strong> sugarcane industry has embraced the market<br />
reality that the industry needs to expand its product base as a means of strengthening its<br />
competitiveness globally. Therefore, backward and forward linkages need to be exploited<br />
to their fullest potential. However, in <strong>Kenya</strong>, mill white sugar is still the core commodity<br />
produced from sugarcane. Diversification to other co-products such as power co-generation<br />
and ethanol production for sale is still very limited and largely unexploited. Figure 4.3 illustrates<br />
the technical potential for sugarcane products.<br />
<strong>Sugar</strong>/Solids<br />
Raw <strong>Sugar</strong><br />
Re�ned <strong>Sugar</strong><br />
Fertilizers<br />
Industrial uses<br />
<strong>Sugar</strong> Cane<br />
Fig. 4.3: Potential sugarcane products 20<br />
Mollasses/Juice<br />
Industrial uses<br />
Commercial Products<br />
Ethanol<br />
Stillage<br />
20 Log Associates, 2001, Financial Restructuring Strategy to Sony <strong>Sugar</strong> Company<br />
Fertilizer<br />
Methane<br />
Crop Residues<br />
Steam and Electricity<br />
Fuel Briquettes<br />
Block <strong>Board</strong><br />
Industrial Paper<br />
Strategic Plan, 2010-2014 35
36<br />
The <strong>Kenya</strong> sugarcane industry has the raw material and favourable market conditions<br />
to substantially expand its product base particularly into power generation, ethanol and<br />
industrial sugar and alcohol. To address this area of concern and to increase profitability and<br />
competitiveness of the industry, the following programmes will be undertaken:<br />
Strategy 2.1: Value Addition and Product Diversification<br />
While the industry will seek to exploit the full range of industrial products from sugarcane and<br />
sugar, the flagship projects under the theme of value addition and expansion of the product<br />
base will be power generation and ethanol production. Before the initiation of production of<br />
co-products, it is important that rigorous technical, financial and economic feasibility studies be<br />
carried out.<br />
i. Initiating co-generation projects: The demand for electricity has in the past continuously<br />
outstripped supply, precipitating a significant level of unmet demand. This shortfall is estimated<br />
to be 380GWh. The shortfall is further exacerbated by frequent drought occasioned by climate<br />
change. The sugar industry has large potential for co-generation that if fully exploited may<br />
help meet some of the power demands. Currently, only an estimated 36.5MW is generated<br />
through co-generation. Apart from Mumias <strong>Sugar</strong> Company that has initiated a massive cogeneration<br />
project to produce 35MW of electricity for their own use and for sale, the rest of<br />
the factories consume all the power they generate. During this Plan period, sugar factories will<br />
initiate co-generation projects and produce sufficient electricity for internal use and for sale<br />
to <strong>Kenya</strong> Power and Lighting Company (KPLC) to help alleviate the shortfall in the country.<br />
Through the Tana Integrated <strong>Sugar</strong> Project, it is proposed that 34MW of power would be<br />
produced through co-generation 21,22 . Chemelil <strong>Sugar</strong> Company and KenGen have also signed<br />
a MoU to develop a 20MW power plant to generate electrical power using bagasse 23 . Table<br />
4.10 shows the potential revenue from co-generation.<br />
Table 4.10: Potential Revenue from Co-generation<br />
Miller<br />
<strong>Kenya</strong> <strong>Sugar</strong> Industry<br />
Potential Local<br />
use<br />
Sales Rate Hours/<br />
year<br />
Potential<br />
Revenue (KSh.,<br />
millions)<br />
Capital Cost<br />
Estimates<br />
MW MW MW KSh Hours Per annum KSh, millions<br />
Mumias 36.3 11.4 24.9 3000 7,128 532 4,9261 W/<strong>Kenya</strong> 5.4 1.0 4.4 3000 7,128 94 733<br />
Muhoroni 9.5 1.7 7.8 3000 7,128 167 1,289<br />
Nzoia 14.2 2.2 12 3000 7,128 257 1,927<br />
Chemelil 20.0 2.4 17.6 3000 7,128 376 2,714<br />
SONY 13.8 2.4 11.4 3000 7,128 244 1,872<br />
Miwani 13.8 2.4 11.4 3000 7,128 244 1,872<br />
TARDA 36.3 11.4 24.9 3000 7,128 532 4,926<br />
Total 149.3 34.9 114.4 300 7,128 2,446 20,259<br />
Source: Log Associates, 2009, Co-generation Potential and Projected Revenues<br />
ii. Initiating ethanol production projects: <strong>Kenya</strong>’s fuel consumption stood at 1.4 and 3.3<br />
million litres of petrol and automotive diesel respectively per day in 2006 with an average<br />
21 Tana and Athi Development Authority, 2008-2012 Strategic Plan<br />
22 The Tana Integrated <strong>Sugar</strong> Project is estimated to cost KSh. 24 billion<br />
23 KenGen, Five Year Business Plan, 2007-2012
growth rate of 2.8% per year. Projections indicate that <strong>Kenya</strong> will require 1.7 and 4.1<br />
million litres of petrol and automotive diesel respectively per day by 2014. By 2030, the<br />
fuel consumption will be 2.7 and 6.5 million litres of petrol and automotive diesel per<br />
day.<br />
Currently, <strong>Kenya</strong> requires 85 million litres of ethanol per year for a national 10% (E10)<br />
blend. At current consumption levels, this would need to grow to 93 million and 148<br />
million litres by 2014 and 2030 respectively.<br />
It is estimated that a tonne of molasses can be converted into 220 litres of ethanol. In<br />
2008, the sugar industries produced approximately 180,000 tonnes of molasses, which<br />
would have produced 39.6 million litres of ethanol. The current ethanol prices in the<br />
world are between KSh. 30-35 per litre. In <strong>Kenya</strong>, the price of ethanol is in the range of<br />
KSh. 55-70 per litre 24 . This would have translated into KSh. 2.178 billions. It is expected<br />
that the construction of Tana Integrated <strong>Sugar</strong> Project would produce 22 million litres<br />
of ethanol, which would be equivalent to KSh. 1.21 billions. 25 With cane deliveries<br />
proposed in this Plan, it is possible to realise considerable amounts of revenue as shown in<br />
the Table 4.11. A conventional ethanol plant capital costs about KSh. 1.6 billion 26 . This<br />
implies that eight operational sugar factories would require 12.8 billion to initiate ethanol<br />
production projects.<br />
Table 4.11: Ethanol Production<br />
Year<br />
Cane<br />
Deliveries<br />
Molasses<br />
Produced<br />
Potential<br />
Ethanol<br />
Produced<br />
Cost per litre Potential<br />
Revenue<br />
Tonnes Tonnes Litres KSh. KSh, Billions<br />
2008/09 5,165,786 180,802 39,776,332 55-70 2.2-2.8<br />
2009/10 5,110,632 182,000 40,040,000 55-70 2.2-2.8<br />
2010/11 5,808,049 203,281 44,721,021 55-70 2.5-3.1<br />
2011/12 6,286,269 220,019 48,404,271 55-70 2.7-3.4<br />
2012/13 7,192,730 251,745 55,384,021 55-70 3.0-3.9<br />
2013/14 8,010,834 280,379 61,683,422 55-70 3.4-4.3<br />
Source: Log Associates, 2009, Projected Ethanol Production Potential and Revenues<br />
iii. Producing industrial sugar and industrial alcohol: Projections of sugar consumption<br />
indicate that the demand for industrial sugar is expected to continue to increase. Currently,<br />
the <strong>Kenya</strong>n sugar industry does not have the capacity for processing industrial sugar and<br />
industrial alcohol. Miwani was the only factory that could process these products. In the<br />
2010-2014 Strategic Plan the industry will revive its capacity for producing refined sugar,<br />
industrial sugar and industrial alcohol. The distillery and sugar refinery at Miwani <strong>Sugar</strong><br />
Company will provide a starting point but the industry as a whole will diversify into these<br />
products.<br />
iv. Encouraging intensification to increase food security: To reduce exit from cane farming<br />
due to pressure from other agricultural produce, the industry will encourage intercropping<br />
and mixed farming amongst farmers.<br />
24 Clint Oguya, Agrochemical, personal communications, 31 August 2009<br />
25 TARDA Strategic Plan 2008-2012<br />
26 Each factory should effect a comprehensive feasibility study on the same<br />
Strategic Plan, 2010-2014 37
38<br />
4.5.3 Strategic Objective 3: To Enhance Infrastructure Development<br />
Inadequate, unreliable and poor state of physical infrastructure in the sugar growing zones<br />
has led to low productivity, high production and distribution costs; and uncompetitive<br />
products and service delivery. The industry will improve the state of physical infrastructure by<br />
implementing the following strategies:<br />
Strategy 3.1: Improve Road Transport Infrastructure<br />
This strategy will be achieved by implementing the following activities:<br />
i. Setting up a mechanism to coordinate utilisation of public funds available for road<br />
infrastructure development<br />
ii. Increasing SDF allocation for infrastructure development<br />
iii. Dedicating 15% of sugar tax revenue to infrastructure development in the sugar belt<br />
Strategy 3.2: Modernise and Promote the Use of Information and Communication Technology (ICT)<br />
There are numerous opportunities for the application of ICT in the sugar industry including<br />
business process improvement in sugarcane production, office operations, management of OGIs,<br />
strategic management, performance monitoring, research and information sharing. Despite such<br />
array of uses, the industry has not fully invested, modernised and promoted the use of ICT.<br />
Apart from Mumias <strong>Sugar</strong> Company that has invested in the Agricultural Management<br />
Systems (AMS) to coordinate planting, harvesting, transport and milling operations, the ICT<br />
infrastructure in most of the sugar factories is still at infancy stage. To tap these opportunities,<br />
the industry will modernise and promote the use of ICT by:<br />
i. Improving the ICT infrastructure through networking<br />
ii. Encouraging e-commerce and e-procurement<br />
iii. Increasing training of staff on the use of ICT including the new fibre optic cable<br />
architecture<br />
iv. Increasing information sharing through ICT<br />
4.5.4 Strategic Objective 4: To Strengthen the Regulatory Framework<br />
The passing of the <strong>Sugar</strong> Act, 2001 went a long way in strengthening the regulatory framework<br />
in the sugar industry. However, some of the supporting regulations have not been approved. A<br />
number of proposals that would have improved the business environment in the sugar industry<br />
including tax proposals are pending approval. To strengthen the legal framework, the following<br />
specific strategies will be undertaken:<br />
Strategy 4.1: Finalise the Policy and Legal Framework Work- in- Progress and Implement them<br />
The review revealed that there were pending actions under the policy and legal framework in<br />
the outgoing planning period. The industry will conclude the pending actions by:<br />
i. Passing the <strong>Sugar</strong> Amendment Bill<br />
ii. Gazetting <strong>Sugar</strong> General Rules<br />
iii. Harmonizing all sugar laws<br />
iv. Finalising and implementing regulations to restructure outgrower institutions<br />
Strategy 4.2: Strengthen the Management of <strong>Sugar</strong> Import Policy<br />
Illegal and uncoordinated importations of sugar are major contributors to the sub-sector<br />
problems. To address this concern, the industry will:<br />
<strong>Kenya</strong> <strong>Sugar</strong> Industry
i. Enhance capacity for a robust assessment of market conditions<br />
ii. Support measures to eliminate tax evasion<br />
iii. Support the implementation of rules of origin<br />
iv. Strengthen its advocacy role with KRA, Ministry of Trade (MoT), Ministry of Finance<br />
(MoF) Ministry of Energy (MoE) and MoA<br />
Strategy 4.3: Strengthen the Framework for Corporate Governance<br />
Weak corporate governance has been a problem in the industry for a long time. The sugar<br />
industry needs to transform itself to profitability and efficiency path through sound management<br />
ethics. To address corporate governance challenges, the industry will:<br />
i. Ensure prompt payment to farmers<br />
ii. Strengthen the management of OGIs, through governance and institutional capacity<br />
building programmes<br />
iii. Sign sugar industry agreements between millers, growers and other service providers<br />
iv. Conclude privatisation of sugar factories<br />
v. Establish and implement the framework of implementation and M&E system for the<br />
2010-2014 Strategic Plan<br />
Strategy 4.4: Development of an Institutional Framework for Coordination of Roads Maintenance<br />
in the sugarbelt<br />
There exists an opportunity for the sugar industry, through KSB, to collaborate with central<br />
and local government in the utilisation of the petroleum and the local government cess funds,<br />
CDF and LATF for road maintenance and rehabilitation. To ensure efficient utilisation of<br />
these funds, the industry will:<br />
i. Establish a sugarbelt roads management committee comprising KSB, Millers, OGIs and<br />
GoK departments responsible for roads.<br />
Strategy 4.5: Development of a comprehensive policy on co-generation and exploitation of bio-fuels<br />
and other sugarcane products<br />
The Energy Act, 2006, sets out the National Policies and Strategies for short, medium and<br />
long-term energy development in <strong>Kenya</strong>. The Minister for Energy has the mandate through<br />
the Act, to promote co-generation by sugar millers and sale of the same to the national grid;<br />
and promote the production and use of gasohol and biodiesel. However, there is still no<br />
comprehensive policy and legal framework to regulate the production and use of these products.<br />
In the incoming period, and working closely with the Ministry of Energy, the industry will:<br />
i. Support measures to develop a comprehensive policy on co-generation and exploitation<br />
of bio-fuels and other sugarcane products.<br />
Strategic Plan, 2010-2014 39
40<br />
Implementation Strategy and<br />
Resource Requirements<br />
5.1 Implementation Strategy<br />
Implementation responsibilities of this strategy will be devolved to all levels in order to allow for<br />
maximum participation of all the relevant stakeholders. Formal existing institutional structures including<br />
the oversight bodies that undertake regulatory responsibilities will be charged with carrying out their<br />
appropriate roles. Stakeholder institutions such as millers, OGIs, Cane Transporters, KESREF, KSB and<br />
farmers will be accorded their rightful say in the implementation of this strategy.<br />
5.1.1 Implementation Framework<br />
Successful implementation of the Plan will depend significantly on a practical implementation<br />
framework, which is easy to coordinate. The <strong>Kenya</strong> <strong>Sugar</strong> <strong>Board</strong> (KSB), having the dual legal<br />
mandate to develop and regulate the industry should exercise its authority towards the same.<br />
KSB needs to remain as the voice of the industry in consultation with all stakeholders. Given<br />
the matrix nature of industry decision-making organs, the Plan’s implementation framework<br />
will have a wide spectrum of players.<br />
5.1.2 Institutional Structure<br />
The implementation of the 2010-2014 Strategic Plan will be the responsibility of the following<br />
institutional structures:<br />
National Inter-ministerial Coordinating Committee (NICC)<br />
The Committee will comprise MoF, MoE, MoA, MoT, MoWI, MoR, MoPW, MoLG and<br />
MoRDA. It will deal with policy and legislative issues affecting the industry. The NICC will be<br />
convened and chaired by the Permanent Secretary, Ministry of Agriculture from time to time as<br />
need arises.<br />
Monitoring Committee (MC)<br />
The industry will establish a Monitoring Committee (MC) through a legal notice by the<br />
Minister of Agriculture to monitor the implementation of this Strategic Plan. The committee<br />
will sit twice yearly. Structured reports will be prepared and presented to the Committee by<br />
Monitoring and Evaluation Officer who will be stationed at the <strong>Kenya</strong> <strong>Sugar</strong> <strong>Board</strong> headquarters<br />
in Nairobi. The Committee will assess progress on the status of Plan’s implementation focusing<br />
on the industry adjustment and preparedness for a liberalized trade regime. The Committee<br />
will comprise chief executive officers or chairpersons of KSB, KESMA, KESGA, KECATRA<br />
and KESREF, representatives from MoA and consumers. The committee will be convened and<br />
chaired by the Chairman of KSB <strong>Board</strong>. The MC will report to the NICC through the KSB<br />
<strong>Board</strong>.<br />
<strong>Kenya</strong> <strong>Sugar</strong> Industry<br />
Chapter<br />
5
Stakeholders Review Forum (SRF)<br />
The Stakeholders Review Forum (SRF) will comprise senior managers of stakeholder<br />
institutions. The Chief Executive, <strong>Kenya</strong> <strong>Sugar</strong> <strong>Board</strong>, will chair it. The SRF will sit quarterly<br />
to review the progress of implementation of the Plan based on reports prepared by the M&E<br />
Officer.<br />
Unit Committees (UC)<br />
Factories’, OGIs’ and other stakeholders’ level committees will comprise Unit Committees.<br />
These committees will be set-up at respective stakeholder units and will meet monthly. The<br />
committees will carry out the specific activities of the Plan and report progress to senior managers<br />
sitting at the SRF. The composition of the UCs will be senior technical and managerial staff of<br />
the various stakeholder institutions. Figure 5.1 outlines the proposed institutional structure<br />
and the implementation framework.<br />
National Inter-Ministerial Coordinating Committee<br />
Monitoring Committee<br />
Stakeholders Review Forum<br />
KSB, <strong>Board</strong> Chairman (Chair)<br />
KESMA<br />
KESGA<br />
KESREF<br />
KECATRA<br />
Representative MoA<br />
Consumer Representatives<br />
Fig. 5.1: Institutional Structure and Implementation Framework<br />
Factories<br />
OGIs<br />
KESREF<br />
Other Stakeholder Representatives<br />
Strategic Objectives Resources Implementation M & E<br />
Review the appropriateness<br />
of chosen strategy<br />
KSB, <strong>Board</strong><br />
Unit Committees<br />
Match Resources and strategies<br />
Ministry of Agriculture, PS (Chair)<br />
Ministry of FinanceMinistry of Energy<br />
Ministry of Water and Irrigation<br />
Ministry of Trade<br />
Ministry of Public Works<br />
Ministry of Roads<br />
Ministry of Local Government<br />
Ministry of Regional Development Authority<br />
KSB, CEO (Chair)<br />
M&E O�cer<br />
Senior Management of<br />
Stakeholder Institutions<br />
Allocate resources and<br />
carry out activities<br />
Measure targets, outputs,<br />
corrective action<br />
Strategic Plan, 2010-2014 41
42<br />
5.1.3 Private Sector Participation<br />
The implementation of this Plan calls for close collaboration and participation of the public<br />
and private sector. While privatization is not a panacea, private sector participation brings<br />
with it increased financial discipline; capital injection; new management styles; a stronger<br />
commercial orientation and some insulation from political interference. The privatization of<br />
the Mumias <strong>Sugar</strong> Company, and the subsequent improvement in performance, is a case in<br />
point. In the interim, any decisions made on factories’ rescue, should be synchronized with<br />
the proposed privatization actions to avoid investing in low priority interventions. The drive<br />
towards diversification and value addition is also likely to be realized if done in the context of<br />
wholly or largely privatized sugar subsector.<br />
5.2 Resource Mobilisation and Utilisation<br />
The resources required for the <strong>Kenya</strong> sugar industry to implement the 2010-2014 Strategic Plan include,<br />
financial, human and physical resources. Successful implementation of the same will not only depend on<br />
the quality and commitment of the stakeholders, but also on the availability and efficient utilisation of<br />
resources required to undertake the various activities. Weak corporate governance, high debt burden and<br />
lack of funds for investment continue to plague the Government owned mills. This was manifested in<br />
delayed farmer payments; lack of routine and preventive maintenance; failure to invest in new machinery;<br />
and the overall degeneration of effective processing capacity. The resources from internally generated<br />
sources and the <strong>Sugar</strong> Development Levy are inadequate to meet the scope of activities proposed in this<br />
Plan. Table 5.1 is a summary of financial resources requirements for implementing the same.<br />
Table 5.1: Plan Implementation Cost Estimates<br />
Years (KSh, millions)<br />
Strategic Objective<br />
2009/10 2010/11 2011/12 2012/13 2013/14 Total<br />
Enhance sugar industry<br />
Competitiveness<br />
2,905 2,984 5,725 5,745 950 18,309<br />
Expand product base 58 55 55 9 5 182<br />
Enhance infrastructure<br />
development<br />
607 1,007 1,007 1,007 607 4,235<br />
Strengthen regulatory<br />
framework<br />
77 77 25 25 25 229<br />
Total 3,647 4,123 6,812 6,786 1,487 22,955<br />
Source: Log Associates, 2009, Plan’s Implementation Cost Estimates<br />
The cost inherent in implementing activities outlined in the strategy will be huge. The industry requires<br />
at least KSh. 23 billion to implement the activities recommended in this Plan (Annex VII), 15.3<br />
billion to invest in co-generation and 12.8 billion to invest in ethanol production. The industry needs<br />
a further KSh. 58 billion to clear all debts on sugar factories and OGIs balance sheets. (Annex VIII).<br />
Funding this Plan will require a public-private partnership comprising budget resources, government<br />
devolved funds, internally generated funds and loans, grants from development partners and joint<br />
venture agreements as discussed below.<br />
5.2.1 Funding Sources<br />
To realise the objectives of the 2010-2014 Strategic Plan, there will be various financial sources<br />
as briefly explained below:<br />
<strong>Kenya</strong> <strong>Sugar</strong> Industry
i. Internally Generated Funds at Factory Level<br />
Most of the sugar companies with the exception of Mumias, Soin, Kibos and West <strong>Kenya</strong><br />
<strong>Sugar</strong> Companies are barely making surpluses. The scope for factory generated funds is<br />
thus limited for publicly owned factories. These publicly owned factories are looking for<br />
grants and soft debt financing. Nevertheless, the funds generated from internal sources<br />
will be utilized for factory maintenance, modernisation and rehabilitation.<br />
ii. <strong>Sugar</strong> Development Fund<br />
A sugar development levy of 4% of the ex-factory price is charged by the <strong>Kenya</strong> Government<br />
on all sugar sales. This levy is collected by the <strong>Kenya</strong> Revenue Authority and is managed<br />
by KSB as the <strong>Sugar</strong> Development Fund (SDF). After 17 years of implementation, SDF<br />
has grown to become the single largest source of funding for the industry. The fund<br />
utilisation per component is shown in Figure 5.2.<br />
KSB administration<br />
(35%)<br />
Research and extension<br />
(23%)<br />
Fig. 5.2: SDF Allocation per Component 27<br />
At the present state, the sugar industry requires funding on a much larger scale than can<br />
be met by the SDF. The funding gaps will be bridged through alternative financing.<br />
iii. Soft loan financing and Grants<br />
Given the importance of the sugar sub-sector in poverty reduction, infrastructure<br />
development, environmental conservation and energy, the subsector will continue to<br />
attract concessional funding from development partners. The industry will also continue<br />
seeking for financial grants from the GoK.<br />
iv. Loans<br />
The sugar industry is already attracting donor funds from a variety of sources including<br />
the European Union (EU) and CFC. The subsector can attract more funds from a range<br />
of initiatives including energy, environment, water and sanitation, and rural roads, all of<br />
which have a direct impact on sustainable development and MDGs. The industry will<br />
therefore prepare and present proposals to willing donors for the purposes of sourcing for<br />
funds for its development.<br />
v. CDF/LATF Funds<br />
The sugar industry will collaborate with institutions implementing the CDF and LATF<br />
funded projects to harness the resources directed towards infrastructural development in<br />
the sugarbelt.<br />
27 KSB, SDF Operational Manual, February 2006<br />
Cane development<br />
(17%)<br />
Infrastructure<br />
(7%)<br />
Factory rehabilitation<br />
(18%)<br />
Strategic Plan, 2010-2014 43
44<br />
vi. Carbon Credits<br />
Carbon credits are a key component of national and international attempts to mitigate<br />
the growth of concentrations of greenhouse gases. One carbon credit is equal to a tonne of<br />
carbon. The sugar factories through cane farming, co-generation and ethanol production<br />
will produce environmentally friendlier energy sources, which will allow them to enter<br />
into agreements with Carbon Finance Companies around the world, through Clean<br />
Development Mechanism (CDM). These credits will be exchanged for hard currencies to<br />
help finance some of the activities in this Plan 28 .<br />
viii. Joint Venture Agreements<br />
Joint ventures are strategic weapons used by organisations to enhance competitiveness. A<br />
joint venture is an agreement formed by two or more parties to undertake an economic<br />
activity together. The parties agree to contribute equity, share revenue, expenses and<br />
control the enterprise. In the incoming Plan period, the industry will enter into joint<br />
venture agreements with like-minded organisations/corporations to undertake some of<br />
the strategies/activities highlighted in this Plan. Possible areas for such agreements are<br />
power-cogeneration, ethanol production and irrigation.<br />
5.2.2 Human Resources<br />
Whilst there are many skilled personnel in the country, the industry has excess unskilled staff.<br />
The industry lacks human resources capacity to carry out the wide range of research that the<br />
industry needs. Most of the farmer institutions have also failed to provide essential extension<br />
services to the farmers. To meet the human resources gaps, the industry will carry out staff<br />
rationalisation to determine the level of human resource requirements under the strategy for<br />
enhanced human resource capacity.<br />
5.3 Accountability<br />
Accountability for the implementation of this Plan and the use of resources will critical since it will<br />
require proper utilization of financial, human and material resources. This demands that all stakeholders<br />
in the sugar industry and other sectors take responsibility and be accountable for their use. All institutions<br />
using industry resources will account for the same in accordance to the laid down regulations and<br />
procedures.<br />
5.4 Implementation Risks<br />
There are several risks to the implementation of this Strategic Plan, including the timely availability<br />
of resources and political goodwill. This requires that possible risks be analysed to take precautionary<br />
measures in good time and prevent failure of the Plan’s implementation. The following are some of the<br />
major risks identified for consideration:<br />
i. Failure to Realize the Privatisation Process: The survival of the <strong>Kenya</strong> sugar industry appears<br />
directly pegged to privatization and subsequent private sector participation in increasing efficiency.<br />
Failure to divest GoK shareholding in the industry portends doom.<br />
ii. Poor Plan Implementation: All of the participating institutions need to diligently carry out the<br />
actions identified in Chapter 4. Failure to carry out the changes needed to make the industry more<br />
28 Corporations like Mumias, Ken-Gen just to mention a few, have already signed carbon credit agreements through the Clean<br />
Development Mechanism (CDM). The CDM is a support scheme under the United Nations Climate Convention and the Kyoto<br />
Protocol.<br />
<strong>Kenya</strong> <strong>Sugar</strong> Industry
efficient and competitive, will pose a major risk to the industry. Individual institutional plans that<br />
are intended to help achieve the global industry objectives need to be developed and implemented<br />
diligently.<br />
iii. Lack of Political goodwill: Political goodwill is necessary for the implementation of this Strategic<br />
Plan. If political goodwill is lacking, there remains the risk of failure in implementing the same.<br />
iv. Lack of resources: Resources are essential for the implementation of the activities highlighted in<br />
this Plan. Inadequate human, financial and other resources pose risks to the implementation of<br />
these activities.<br />
v. Insecurity: Insecurity is both a threat to human life and a major risk against the objective of<br />
attracting investment. It also often causes disruption of planned activities, leads to business losses<br />
and increases business costs. For meaningful private sector investment, the industry must operate<br />
in a conducive and secure environment.<br />
vi. Poor Communication: The absence of an effective and agreed communication strategy may result<br />
in poor information flow and thereby delay decision-making. This will result in a risk of failure<br />
and/or delay in the implementation of the Plan.<br />
vii. Lack of Ownership: The lack of ownership by the stakeholders, for instance farmers, may lead to<br />
failure in the implementation of the strategic plan.<br />
viii. Resistance to change/negative attitude: Resistance to change by farmers, transporters, millers and<br />
outgrower institutions may result in failure or delay in the Plan’s implementation.<br />
5.4.1 Risk Mitigation Framework<br />
The matrix below gives a list of the risks, their ranking and suggested mitigation strategies.<br />
Table 5.2: Risk Mitigation Framework<br />
No. Risk Priority Mitigation Measure<br />
1. Failure to realise privatisation<br />
process<br />
High Accelerate the ongoing privatisation efforts<br />
2. Poor Plan Implementation High Close monitoring and tie funding to agreed<br />
performance outcome<br />
3. Lack of Political goodwill High Strong lobbying for political goodwill and<br />
issue-based decisions<br />
4. Lack of resources High Design and implement a <strong>Sugar</strong> Restructuring<br />
Programmes<br />
5. Insecurity High Liaise with Provincial Administration to<br />
address insecurity concerns in the sugar subsector<br />
6. Poor Communication Medium Prepare and implement a communication<br />
strategy to ensure effective information flow.<br />
7. Lack of ownership Low Consultation and involvement of<br />
stakeholders at all stages of strategy<br />
formulation and implementation<br />
8. Resistance to change/<br />
Negative attitude<br />
Low Create awareness of the intended changes in<br />
good time through active participation and<br />
discussions with stakeholders<br />
Strategic Plan, 2010-2014 45
46<br />
Monitoring, Evaluation and<br />
Reporting<br />
6.1 Monitoring<br />
The successful implementation of this Plan will depend largely on how the activities and outputs are<br />
effectively monitored and evaluated. The Plan’s monitoring will be through the institutional arrangements<br />
defined in section 5.1.2 of this report. Monitoring will be done using the instrument provided in Annex<br />
IX. The instrument has expected outcomes, indicators and annual targets for gauging performance.<br />
Monitoring will help determine whether the implementation is on track; establish the need for any<br />
adjustment in light of the changes in the sugar subsector and political environment.<br />
6.1.1 Monitoring Mechanism<br />
Institution Strategic Plans<br />
For ease of monitoring, the sugar industry stakeholders will align their objectives and strategies<br />
with the <strong>Kenya</strong> <strong>Sugar</strong> Industry Strategic Plan 2010-2014. The individual strategies should have<br />
clearly defined activities with specific timelines for implementation. The realisation of the<br />
individual strategic plans will feed into the overall objectives of the sugar industry.<br />
Supervision<br />
The KSB will carry out supervision of the overall Plan’s implementation and prepare quarterly<br />
reports. This will require the cooperation of all industry stakeholders. Findings from the<br />
supervision missions will be presented to the MC and follow-up actions discussed. KSB will<br />
ensure prompt submission of the reports.<br />
Service Delivery Surveys<br />
The MC will organize surveys on the quality of service delivery. The information from such<br />
surveys will be disseminated to all the stakeholders.<br />
Quarterly Review Meetings (QRM)<br />
Stakeholders review sessions will be held quarterly with stakeholders’ representatives. This is<br />
will keep the Plan’s activities and outputs on track during implementation, and enable the<br />
stakeholders to identify and take necessary actions to address emerging challenges. This is will<br />
give the industry a chance to interrogate what is being done. The QRM will be undertaken<br />
through the SRF.<br />
6.2 Evaluation<br />
The Plan will be subjected to four evaluations, which are two Internal Annual Evaluations; Mid-<br />
Term Evaluation and Review; and Final Evaluation. The evaluations will be done using the indicatormonitoring<br />
tool provided in Annex X.<br />
<strong>Kenya</strong> <strong>Sugar</strong> Industry<br />
Chapter<br />
6
6.2.1 Internal Annual Evaluation (IAE)<br />
To ensure that the experiences of the previous Plan’s implementation are not repeated, the<br />
industry will undertake two internal annual evaluations of the Plan. The first annual review will<br />
be held at end of the year 2010. The second annual review will be held at the end of the year<br />
2013. The two evaluations will be done by an independent team of consultants with experience<br />
in the sugar industry.<br />
6.2.2 Mid-Term Evaluation and Review (MTER)<br />
The purpose of the Mid- Term Evaluation and Review (MTER) will be to assess the extent<br />
to which the Plan is meeting its implementation objectives and timelines. The MTER will be<br />
carried out in December 2011, three months before the expiry of the COMESA protocol and<br />
will therefore provide an opportunity to: (i) assess readiness for the open trade regime; and (ii)<br />
provide recommendations for the remaining phase of the Plan. The MTER will be done by an<br />
independent team of consultants.<br />
6.2.3 Final Evaluation<br />
The prime purpose of the Final Evaluation for the Strategic Plan 2010-2014, expected to be<br />
carried out at the end of May 2014, will be to address four issues:<br />
• Effectiveness (Impact): The extent to which the implementation of activities met the<br />
stated strategies and objectives<br />
• Sustainability: Assesses the sustainability of the achievements made<br />
• Lessons Learnt: Document lessons learnt<br />
• Terms of Reference (TORs): Prepare the TORs for the next strategic plan.<br />
6.3 Reporting<br />
Reporting the progress of implementation will be critical in adjusting strategic directions and measuring<br />
performance. Progress reports will be made on quarterly basis. The reports will outline in summary form<br />
projected targets, achievements, facilitating factors and challenges. The reports will be prepared and<br />
submitted by unit committees to the SRF, where a summary report will be prepared and submitted to<br />
the MC for review. Issues that will require policy interventions will be forwarded to the NICC through<br />
the KSB <strong>Board</strong>.<br />
6.4 Information Sharing<br />
Information sharing and reporting will be key in reviewing this Plan. It will also provide a mechanism for<br />
monitoring and evaluation. Various stakeholders have established websites through which information<br />
can be shared. Additionally, the industry stakeholders will be meeting quarterly to share amongst<br />
themselves and report emerging challenges. Reports on the implementation status of the Plan will also<br />
be made available quarterly and annually by KSB.<br />
6.5 Conclusion<br />
The revised <strong>Kenya</strong> <strong>Sugar</strong> Industry Strategic Plan 2010-2014 focuses on objectives, strategies and<br />
activities that will enhance industry’s competitiveness. If truly implemented, it will lay a firm foundation<br />
for the industry to become efficient, diversified and globally competitive.<br />
Strategic Plan, 2010-2014 47
Annex I: Strategic Objectives and Actions (2004-2009)<br />
48<br />
Strategic Objective Strategic Actions<br />
1. Increase sugarcane<br />
production and<br />
productivity<br />
2. Increase sugar<br />
production<br />
3. Expand product base • Product diversification<br />
4. Strengthen Policy,<br />
Legal and Regulatory<br />
Framework<br />
5. Privatisation of <strong>Sugar</strong><br />
Institutions<br />
6. Sustainable Funding for<br />
Industry,<br />
7. Stream Supply Chain<br />
management<br />
8. Adopt World Class<br />
Standards<br />
9. Enhance Socio-<br />
Economic Development<br />
and Environmental<br />
Management<br />
<strong>Kenya</strong> <strong>Sugar</strong> Industry<br />
Annexes<br />
• Strengthening research –extension- farmer linkages<br />
• Irrigation Development<br />
• Motivation to cane farmers to intensify production<br />
• Land reform in sugar growing areas<br />
• Expansion of sugar cane growing into new areas<br />
• Enhance management capacity within the industry institutions<br />
• Optimise existing factory capacity<br />
• Modernising existing factories<br />
• External interventions<br />
• Policy reforms on taxation<br />
• Classify sugar as special commodity<br />
• Review and implement policy of Revitalisation of <strong>Sugar</strong> industry<br />
• Institutionalise inter-ministerial standing committee on sugar<br />
• Internal interventions<br />
• Review <strong>Sugar</strong> Act 2001 and its regulations<br />
• Develop and document procedures for arbitration among stakeholders<br />
• Adopt good corporate governance practices<br />
• Implement industry standards on Environmental Health and Safety<br />
• Promotions to attract financial service providers<br />
• Management and financial restructuring<br />
• Transformation of farmer institutions from advocacy to service provision<br />
• Promotion of private sector partnerships<br />
• Divestiture of GoK shareholding<br />
• Internally generated funds<br />
• <strong>Sugar</strong> Development Fund (SDF)<br />
• External Sources<br />
• Institutionalisation of policies, strategies and structures<br />
• Monitoring cost reduction programmes<br />
• Establishment of Central procurement body for the industry<br />
• Transforming Stakeholder apex to central procurement units<br />
• Lobbying for e-commerce in procurement<br />
• Establish industry consultative forum to negotiate on pricing, costing, timing<br />
and improved provision of goods and services<br />
• Develop and implement appropriate standards and policies<br />
• Establish a national quality control laboratory for the industry<br />
• Develop and adopt appropriate service delivery standards<br />
• Develop ICT strategies and systems for the sugar industry<br />
• Benchmarking with best practices in the world<br />
• Keeping up to date trends and statistics from leading global sugar producers<br />
• Adapting to the existing multilateral trading arrangements<br />
• Enhance industry contribution to socio-economic development in sugar<br />
growing areas and the country as a whole.<br />
• Improve industrial relations in the sub-sector<br />
• Development and improvement of infrastructure<br />
• Increased environmental health and safety<br />
• Effective marketing strategy
Annex II: PESTLE Analysis<br />
Issues Global Regional National Effect<br />
• Uncertain investment climate<br />
• Regional crises diverting attention and<br />
resources from local needs<br />
• Lack of a long term roadmap for the<br />
development of the sugar belt<br />
• Ministry of Agriculture starting to focus<br />
but it needs to be structured<br />
• Piracy along the Somalia coastline<br />
• Conflicts (Darfur Crisis, Southern Sudan,<br />
Eritrea/Ethiopia)<br />
Political • World focused mostly on Governance<br />
and<br />
• Human Rights<br />
• Terrorism<br />
• Unfair competition<br />
• A disenabling investment climate<br />
• Strong competitive pressure<br />
• Need for increased efficiency in the<br />
sugar industry<br />
• Need for increased funding for market<br />
development<br />
• Economic crimes (money laundering,<br />
corruption, fake currencies),<br />
• Increasing Oil prices<br />
• Food insecurity<br />
• Poor enforcement of tax laws and<br />
International Agreements and<br />
• Standards<br />
• Counterfeit goods<br />
• High inflation<br />
• Underdeveloped export market access<br />
for sugar<br />
• Low funding for export market<br />
development<br />
• Increasing food prices<br />
• Obligations under Regional<br />
Agreements<br />
• And Standards<br />
• Non-Tariff Barriers (NTBs)<br />
• World Trade Organization (WTO)<br />
agreements on bilateral arrangements<br />
Economic • Increasing Oil prices<br />
• Increasing food price<br />
• Counterfeiting<br />
• WTO) agreements on bilateral trade<br />
• Standards<br />
• Non-Tariff Barriers (e.g Minimum<br />
Residue Limits)<br />
• Sanitary and Phytosanitary standards<br />
• Language barriers and insecurity<br />
increase costs of doing business<br />
• Diseases leading to absenteeism and<br />
low labour productivity<br />
• Drug abuse reduces productivity<br />
• High population growth rate<br />
• Low literacy levels<br />
• High HIV/AIDS and malaria prevalence<br />
• Language barriers<br />
• High crime rates<br />
• Language Barriers<br />
• High HIV/AIDS prevalence<br />
• Regional conflicts<br />
Social • Language barriers resulting in<br />
additional transactional costs<br />
• Drug trafficking and Drug abuse<br />
leading to reduced productivity<br />
• Human trafficking and brain drain<br />
• Lack of competitiveness<br />
• Need for an injection of capital to<br />
assist in Mill modernization through<br />
privatization and dilution of public<br />
capital holding in sugar factories<br />
• Private Mills (Mumias, West <strong>Kenya</strong>, Soin<br />
and Kibos) have invested in upgrades,<br />
but parastatals Mills are mired in debt<br />
and unable to upgrade or even carry<br />
out routine maintenance<br />
• Low funding for Research and<br />
Development<br />
• Slow pace of transformation to shorter<br />
maturity cane varieties<br />
• Low funding for Research and<br />
Development<br />
Technological • High cost of advanced technologies<br />
• Low negotiation capability<br />
• Low adaptability of advanced<br />
technology<br />
Strategic Plan, 2010-2014 49
• Need for simplification of regulations<br />
• Need for increased corporatization<br />
• Need for stricter contract enforcement<br />
• Performance standards needed for<br />
Judiciary<br />
• Weak institutional capacity in the sugar<br />
industry<br />
• Bureaucratic regulatory and<br />
administrative framework<br />
• Few qualified personnel on commercial<br />
law (both bench and bar)<br />
• Informality of businesses<br />
• High legal costs<br />
Legal • High legal costs • National Ratification of Regional<br />
Treaties<br />
50<br />
• Climate change and desertification<br />
Slow domestication of Multilateral<br />
Environmental Agreements(MEAs)<br />
Environment • Climate change and desertification<br />
• Slow domestication of Multilateral<br />
Environmental Agreements(MEAs)<br />
<strong>Kenya</strong> <strong>Sugar</strong> Industry<br />
• Climate-dependent sectors such as<br />
agriculture adversely affected<br />
• Degrading environment impacting the<br />
poor adversely<br />
• Rapid degradation of water towers,<br />
biodiversity and habitats<br />
• Declining availability of fresh water<br />
• Pollution and waste management<br />
• Poor enforcement of environmental<br />
standards<br />
Annex III: Stakeholder Comparative Advantage Analysis<br />
Stakeholders Responsibilities Comparative Advantage Target What they can do to the sugar industry<br />
• Policy formulation • Overall sector • Link to the government<br />
• Provide policy direction in the sugar<br />
sub-sector<br />
• Sector coordination and policy<br />
formulation<br />
Government<br />
(MoA)<br />
• Issue licenses<br />
• Provide regulations, procedures<br />
and guidelines on various areas of<br />
operation in the industry<br />
• Efficient, effective quality service<br />
delivery<br />
• Regulation<br />
• Coordination<br />
• Strategy setting<br />
• Advisory<br />
• Regulate, develop and promote the<br />
sugar industry<br />
• Coordinate activities within the<br />
industry<br />
• Facilitate equitable access to benefits<br />
and resources<br />
<strong>Kenya</strong> <strong>Sugar</strong><br />
<strong>Board</strong><br />
• Conduct more research into new<br />
early maturing seed varieties that<br />
are disease resistant and have high<br />
sucrose content<br />
• Increase farmer training<br />
• Increase research on irrigation,<br />
processing, harvesting , transport<br />
and marketing<br />
• Enhanced research-extension<br />
–farmer linkages<br />
• High and sustained technology<br />
adoption rates<br />
• Research<br />
• Innovation<br />
• Breeding appropriate cane varieties<br />
• Recommending appropriate<br />
fertilizers<br />
• Appraising, studying, developing<br />
and monitoring technologies<br />
• Pest and diseases, agronomic<br />
packages, farm machinery,<br />
environment and safety issues in<br />
sugar.<br />
• Carry out industrial research<br />
KESREF<br />
KIRDI
• To be business oriented<br />
• Ensure food security through<br />
intercropping, border cropping<br />
• Reduce land subdivision<br />
• Cane Production • Increased cane production<br />
• Competitive return to land and<br />
labour<br />
Farmers • To produce quality cane with high<br />
sucrose content<br />
• Adopt recommended crop<br />
husbandry practices<br />
• Elect competent representatives<br />
• Must become key partners in the<br />
drive for efficient sugar production<br />
• Input supply • Must seek to satisfy farmers,<br />
transporters<br />
• Coordinate all cane growing<br />
activities<br />
• Supply quality seed cane<br />
• Harvest and transport cane<br />
Outgrower<br />
Institutions<br />
• Increased efficiency in sugar<br />
processing<br />
• Processing • Increased sugar and co-products<br />
production<br />
<strong>Sugar</strong> Millers • Purchase and mill sugarcane<br />
• Market sugar and its by-products<br />
• Grow, harvest and transport cane<br />
• Encourage technology adoption and<br />
its implementation<br />
• Advocate for efficient supply chain<br />
management<br />
• Advocacy for outgrowers and millers • Advocacy • Effective service delivery to farmers<br />
• Efficient supply chain management<br />
Other<br />
Institutions:<br />
KESGA,KESMA,<br />
Transporters • Cane Transport • Transportation • Reduced Transport cost • Provide transport services<br />
• Reduce on-transit cane losses<br />
• Demand quality and competitive<br />
prices<br />
Consumers • Buy sugar • Feedback on sugar quality • Good quality sugar at competitive<br />
prices<br />
• Innovate new products and<br />
technologies of sugar production<br />
• Broaden product base<br />
• Market intelligence<br />
• Science, technology and innovation • Highly trained personnel<br />
• Increased collaboration<br />
• Training<br />
• Research<br />
• Innovations<br />
Universities<br />
and Research<br />
Institutions<br />
Strategic Plan, 2010-2014 51
Annex IV: Results Matrix (2010-2014)<br />
52<br />
Strategic Objective 1:- To Enhance <strong>Sugar</strong> Industry Competitiveness<br />
Strategy Activity Responsibility Output Output Indicators Timeframe<br />
2010-2014/<br />
Continuous<br />
Farmers, KESREF, OGIs, Millers, KSB • Higher yields at lower costs • Area under cane, yield levels/ha,<br />
sucrose content<br />
Increasing sugarcane production and<br />
productivity through efficiency farm<br />
operations<br />
Reduction in Farm<br />
Level Risks<br />
2010-2014/<br />
Continuous<br />
KESREF, MoA, Farmers, MoWI, KSB • Higher yields • Area under irrigation<br />
• % of water recycled into irrigation<br />
Developing the use of and financing<br />
irrigation for sugarcane production<br />
<strong>Kenya</strong> <strong>Sugar</strong> Industry<br />
2011<br />
KSB, Millers, Insurance firms, Farmers • Lower farm level risks • % of incidence covered<br />
• Change in farm level investment<br />
Creating an insurance scheme to cushion<br />
the farmers from losses arising in the<br />
industry<br />
2011/<br />
Continuous<br />
• Increase adoption to high<br />
yielding varieties<br />
KESREF, Farmers, OGIs, Millers • Higher productivity<br />
• High of high yielding and<br />
early maturing varieties in<br />
the total crop<br />
Enhancing results oriented researchextension-farmer<br />
linkages to accelerate<br />
adoption rates<br />
• Reduced land subdivision 2011/<br />
continuous<br />
Farmers, KSB, KESREF, MoA • Block farming<br />
• Satellite villages<br />
Implementing a land tenure policy that<br />
encourages economies of scale<br />
• % of ratoon crops 2010/<br />
continuous<br />
Ratooning Farmers • Reduced cane production<br />
cost<br />
2010-2014/<br />
Continuous<br />
• Reduced staleness index<br />
• Improved sugar quality<br />
Improving cane yard management Millers, Transporters • Lower Caneyard losses<br />
• Reduced cycle times<br />
Efficient, Reliable<br />
Harvesting and<br />
Transport Operations<br />
Reducing post-harvest losses Transporters, OGIs, Farmers • Increased cane supply • % of losses 2010-2014/<br />
Continuous<br />
2010-2011<br />
• % of cane harvested at maturity<br />
• Timeliness of evacuation from<br />
farm<br />
• Cycle time lapse<br />
• Timely harvesting<br />
• Efficient scheduling of<br />
transport operations<br />
Transporters, Millers, Farmers, cane<br />
cutters<br />
Reducing time lapse between cane<br />
maturity and harvesting<br />
2012<br />
• Lower unit transport cost • Share of transport in production<br />
cost<br />
Farmers, Transporters, Millers, KSB,<br />
MoA (GoK)<br />
Promoting the use of other modes of<br />
transport<br />
2012<br />
• % of harvesting and<br />
transportation in total cost<br />
KESREF, KSB, Millers, MoA • Improved cane transport<br />
system<br />
Increasing research funding for harvesting<br />
and transport
2010-2014<br />
• Capacity utilised, FTE, recovery<br />
rates,<br />
Millers, Private Sector, KSB, KESREF • Higher sugar production at<br />
lower cost<br />
Increasing sugar production through<br />
efficient processing<br />
Effective, Efficient<br />
and Reliable Milling<br />
Operations<br />
2012<br />
Creating economies of scale Millers, KSB, MoA, GoK, Private sector • Lower production costs • Integration of factories, mergers,<br />
acquisitions<br />
Intensifying industrial and applied research KESREF,KIRDI, Universities • New technologies • New technologies introduced 2014<br />
KSB, Millers, OGIs • Best practices • International standards adopted 2014<br />
Benchmarking with international<br />
standards<br />
2011<br />
KSB, Millers, OGIs, KESREF • Number of Staff trained • Efficient, effective and motivated<br />
staff<br />
• Optimal staff levels retained<br />
Undertaking training needs assessment<br />
and implementing its findings<br />
Enhanced Human<br />
Resource Capacity<br />
Preparation of staff retention policy Millers, KSB, OGIs • Optimal staff levels • Number of staff retained 2010/<br />
continuous<br />
2010/<br />
continuous<br />
Signing of performance contracts Millers, OGIs, KESREF, KSB • Optimal performance • Number of performance contracts<br />
signed<br />
Millers, OGIs, KSB, KESREF • Good Performance • Level of targets being achieved 2010/<br />
continuous<br />
Implementing a performance appraisal<br />
system<br />
2014/<br />
continuous<br />
• Collaboration agreements<br />
reached<br />
Millers, KESREF, OGIs, Universities • Increased skilled human<br />
resource pool<br />
Strengthening industry collaboration with<br />
training institutions<br />
2012<br />
• % of customers receiving quality<br />
service<br />
KSB, Millers, OGIs, KESREF, Consumers • Report on quality service<br />
delivery<br />
Conducting periodic Customer Satisfaction<br />
Surveys(CSS)<br />
Streamlined corporate<br />
governance<br />
Millers, KSB, Consumers • Quality standards • ISO Certification 2012<br />
Ensuring the undertaking of International<br />
Organization of Standards (ISO)<br />
certification<br />
2012<br />
Millers, KSB, Consumers • Quality Standards • % of customers receiving quality<br />
service<br />
Sensitization of industries on quality<br />
standards and certification requirements<br />
2012<br />
All stakeholders • Good corporate governance • % of factories that are self<br />
sustaining<br />
Advocacy on governance, security, high<br />
cost of doing business, among others<br />
• Rate of information flow 2012<br />
All stakeholders • Efficient communication<br />
systems<br />
Improvement of communication amongst<br />
industry stakeholders and the rest<br />
• Profit margins 2012<br />
Training on prudent financial management All stakeholders • Efficient financial<br />
management<br />
Strategic Plan, 2010-2014 53
Strategic Objective 2:- To Expand Product Base<br />
Strategy Activity Responsibility Output Output Indicators Timeframe<br />
Value Addition and Encouraging intensification to increase OGIs, KESREF, Millers, Farmers • Integrated and intensive • Number of famers practising 2010-2014<br />
Product Diversification food security<br />
farming<br />
integrated farming<br />
• Increased food supply • Number of farmers exiting cane<br />
production<br />
54<br />
KSB, Millers • Reports • Number of studies completed 2011<br />
Commissioning and undertaking value<br />
chain analysis and product diversification<br />
studies (feasibility, technological and<br />
economic studies)<br />
<strong>Kenya</strong> <strong>Sugar</strong> Industry<br />
2011<br />
• Recommendations adopted • Number of viable<br />
recommendations<br />
Farmers, OGIs, Transporters, Millers<br />
and Distributors<br />
Implementation of recommendations<br />
from the value chain analysis and product<br />
diversification study<br />
2012<br />
Millers, KSB • New product lines • Number of new products<br />
reaching the market<br />
Developing diversification programmes<br />
tailored to suit specific factory<br />
requirements in line with market<br />
opportunities<br />
2013<br />
Initiating co-generation projects Millers, Private sector Partnerships • Electricity • Amount of electricity supplied to<br />
the grid<br />
Initiating ethanol production projects Millers, Private sector Partnerships • Ethanol • Litres of ethanol produced 2013<br />
Producing industrial sugar and alcohol Millers, Private sector Partnership • Industrial sugar and alcohol • Tonnes of industrial sugar 2013<br />
produced<br />
• Litres of industrial alcohol<br />
produced<br />
Strategic Objective 3:- To Enhance Infrastructure Development<br />
Strategy Activity Responsibility Output Output Indicators Timeframe<br />
KSB, GoK, MoR, MORDA, MOLG • Coordinating mechanism • Amount fund allocated to roads 2010-2014<br />
Setting up a mechanism to coordinate<br />
utilisation of public funds available for<br />
road infrastructure development<br />
Improve road<br />
transport<br />
infrastructure<br />
KSB, SDF committee • Infrastructure development • SDF allocation to infrastructure 2010-2014<br />
Increasing SDF allocation for infrastructure<br />
development<br />
2010<br />
KSB, MoA, MoF, GoK • Improved infrastructure • Amount of sugar tax revenue<br />
allocated to sugar<br />
Dedicating 15% of sugar tax revenue to<br />
infrastructure development
All stakeholders • Networked sugar industry • Common sugar industry database 2011<br />
Improving the ICT infrastructure through<br />
networking<br />
Modernise and<br />
promote the use of ICT<br />
• Number of e-procured items 2012<br />
All stakeholders • Streamlined procurement<br />
procedures<br />
Encouraging E-commerce and<br />
E-procurement<br />
KSB. OGIs, Millers • Pool of skilled personnel • Number of staff trained 2010-2014<br />
2010<br />
• Number of stakeholders with<br />
websites<br />
Increasing training of staff on the use of<br />
ICT<br />
Increasing information sharing through ICT KSB, Millers, OGIs • Information market place<br />
e.g. Website, emails etc.<br />
Strategic Objective 4:- To Strengthen the Regulatory Framework for the <strong>Sugar</strong> industry<br />
Strategy Activity Responsibility Output Output Indicators Timeframe<br />
Pass the <strong>Sugar</strong> Amendment Bill Parliament, MoA • Revised <strong>Sugar</strong> Act 2010<br />
Gazette the <strong>Sugar</strong> General Rules KSB, MoA • <strong>Sugar</strong> General Rules 2010<br />
Harmonise all sugar laws All stakeholders • <strong>Sugar</strong> Laws 2010<br />
Finalise and implement regulations to KSB, MoA, OGIs, Farmers • Efficient outgrower<br />
2010<br />
restructure OGIs<br />
institutions<br />
• Accuracy of estimates 2010-2014<br />
Finalise the policy<br />
and legal framework<br />
work-in-progress and<br />
implement them<br />
KSB, GOK • More accurate of import<br />
requires<br />
Enhance capacity for a robust assessment<br />
of market conditions<br />
Strengthen the<br />
management of <strong>Sugar</strong><br />
Import Policy<br />
• % change in SDF collection 2010-2014<br />
Support measures to eliminate tax evasion KRA, KSB • Higher revenues to KRA and<br />
SDF<br />
KRA, MoT, MoF, MoE, MoA, KSB 2010/<br />
continuous<br />
Strengthen advocacy role with other<br />
stakeholders<br />
2010-2014<br />
Ensure prompt payment to farmers Millers, KSB • Timeliness of Payment • Time lapse between cane delivery<br />
and payment<br />
Development of a<br />
Legal Framework for<br />
Corporate Governance<br />
Conclude privatisation of sugar factories GOK • Privatised sugar subsector • Numbers of mills privatised 2010-2012<br />
Strengthen the management of OGIs, Farmers, OGIs, KSB, MoA • Management efficiencies 2010<br />
through governance and institutional<br />
capacity building programmes<br />
Strengthen the management of OGIs KSB, OGIs, GOK • More effective and efficient • Numbers of OGIs restructured 2010-2014<br />
OGIs<br />
• Improved service delivery • Number of agreements signed 2010<br />
Millers, Farmers, Transporters, cane<br />
cutters<br />
Sign sugar industry agreements between<br />
millers, growers and other service<br />
providers<br />
2010<br />
All stakeholders, • Implementation Framework<br />
• M&E system<br />
Establish framework of implementation<br />
and M&E system<br />
Strategic Plan, 2010-2014 55
• Functioning committee 2012<br />
KSB, Millers, MoR, MoLG, GoK • Framework for coordination<br />
of roads maintenance<br />
Establish a sugarbelt roads management<br />
committee<br />
Development of<br />
an institutional<br />
Framework for<br />
Coordination of Roads<br />
Maintenance in the<br />
sugarbelt<br />
56<br />
KSB, MoA, MoE • Comprehensive policy 2012<br />
Support measures to develop a<br />
comprehensive policy on co-generation<br />
and exploitation of bio-fuels and other<br />
sugarcane products<br />
Development of a<br />
comprehensive policy<br />
on co-generation and<br />
exploitation of bio-fuels<br />
and other sugarcane<br />
products<br />
<strong>Kenya</strong> <strong>Sugar</strong> Industry<br />
Annex V: Benchmarking with Competitors<br />
EFFICIENCY PARAMETERS RSA Swaziland Zimbabwe Malawi Uganda <strong>Kenya</strong> long term<br />
Cane quality 1 Cane pol % 12.99 13.7 14 13.96 10.78 13.5<br />
3 Cane fibre % 14.97 13.74 14.01 15.11 18.47 15.5<br />
Time Account 1 Annual & mini maintenance, Days - 124 126 170 45 42<br />
2 Out of field crop, Days 68.4 87.81 81.54 111.96 5.61 -<br />
Crop length (Average) Days 251 241 239 195 320 323<br />
6 Available extraction time(days) 201.95 186.48 194.69 161.22 286.08 294<br />
7 FTE % 94.65 90.74 89.45 92.67 73.31 92<br />
8 OTE % 80.46 77.38 81.46 82.68 89.4 80<br />
Throughput 1 TCH 296.25 324.71 461.44 233.69 116.26 300<br />
2 Mill Numbers 15 3 2 2 1 7<br />
3 TCD - operational 85,810.59 18,089.98 18,042.48 9,273.56 2,494.47 40,320.00<br />
4 TCD - Designed 106,650.00 23,379.12 22,148.88 11,216.88 2,790.24 50,400.00<br />
5 Cane crushed (TCY) 21,156,562.00 4,179,975.00 4,231,784.00 1,817,273.00 710,845.00 13,023,360.00<br />
6 <strong>Sugar</strong> Made (T) 2,402,763.00 500,937.00 512,372.00 215,484.00 61,455.05 1,432,569.60<br />
7 Capacity Utilization % 80.46 77.38 81.46 82.68 89.4 80
Separation efficiency 1 R/Extraction % 98 96.39 96.68 97.06 96.75 96.63<br />
2 RBHR 88 89.55 88.04 87.53 86.67 89<br />
3 Rendement % 11.36 11.98 12.11 11.86 11.56 11<br />
4 ROR % 86.24 86.99 85.6 85.14 83.81 86<br />
5 ERC % sucrose in cane 86.05 86.38 86.48 87.15 _ 86.25<br />
6 Undetermined losses % 1.92 1.74 3.14 2.93 0.12 2<br />
Source: <strong>Kenya</strong> <strong>Sugar</strong> <strong>Board</strong><br />
Annex VI: Capacity of Existing and Proposed <strong>Sugar</strong> Factories<br />
Factory TCD<br />
1. Chemelil 3,360<br />
2. Muhoroni 2,200<br />
3. Soin 100<br />
4. Kibos & Allied <strong>Sugar</strong> Industries 800<br />
5. Miwani 800<br />
6. Mumias 9,200<br />
7. Nzoia 3,360<br />
8. West <strong>Kenya</strong> 2,500<br />
9. SONY 3,120<br />
10. Butali 1,000<br />
11. Trans Mara 1,000<br />
12. Kwale International <strong>Sugar</strong> Co. 3,000<br />
13. TARDA 9,000<br />
Total 39,440<br />
Strategic Plan, 2010-2014 57
Annex VII: Plan Implementation Cost Estimates<br />
58<br />
Strategic Objective 1: To Enhance <strong>Sugar</strong> industry Competitiveness<br />
Estimated Costs (KSh. Millions)<br />
Strategy Activities 2010 2011 2012 2013 2014 Total<br />
Increasing efficiency in sugarcane production 10 15 20 20 20 85<br />
1. Reduction in Farm Level Risks<br />
Developing the use of and financing irrigation 200 250 300 300 400 1450<br />
6 15 30 50 50 151<br />
2.<br />
3.<br />
4.<br />
<strong>Kenya</strong> <strong>Sugar</strong> Industry<br />
Creating an insurance scheme to cushion the farmers from losses arising<br />
in the industry<br />
Enhancing results oriented research-extension-farmer linkages to<br />
6 20 25 30 30 111<br />
accelerate adoption rates<br />
Improving cane yard management 10 10 10 0 0 30<br />
5. Efficient, Reliable Harvesting and<br />
Transport Operations<br />
Reducing post-harvest losses 5 10 15 15 15 60<br />
Increasing ICT use in scheduling of cane harvesting and transport<br />
5 15 20 25 30 95<br />
operations<br />
Promoting the use of other modes of transport 6 14 20 20 20 80<br />
Increasing research funding for harvesting and transport 12 20 20 20 20 92<br />
Increase processing efficiency<br />
6. Effective, Efficient and Reliable<br />
Milling Operations<br />
2500 2500 5000 5000 0 15000<br />
Invest in rehabilitation of the mills and upgrade them to more modern<br />
and efficient technology.<br />
Intensify industrial and applied research 50 100 150 150 150 600<br />
Carry out regular condition maintenance 80 100 100 100 100 100<br />
5 5 5 5 5 25<br />
Providing information on production technologies and quality<br />
standards and facilitating their application, adaptation and uptake<br />
7. Benchmarking with International<br />
standards<br />
5 5 5 5 5 25<br />
Providing information on international best practices for local millers to<br />
benchmark themselves<br />
5 5 5 5 5 25<br />
Participating in regional and international negotiations on issues<br />
affecting the sugar industry<br />
Strategic Objective 2: To Expand Product Base
5 5 5 5 5 25<br />
Encouraging intercropping and mixed farming to enhance food security<br />
reduce exit from cane farming<br />
8. Value Addition and Product<br />
Diversification<br />
3 0 0 4 0 7<br />
Commissioning and undertaking value chain survey analysis and<br />
product diversification studies<br />
0 0 0 0 0 0<br />
Implementation of recommendations from the value chain analysis and<br />
product diversification study<br />
50 50 50 0 0 150<br />
Developing diversification programmes tailored to suit specific factory<br />
requirements in line with market opportunities<br />
Strategic Objective 3: To enhance Infrastructure Development<br />
Setting up a mechanism to coordinate utilisation of public funds<br />
1 1 1 1 1 5<br />
available for road infrastructure development<br />
Increasing SDF allocation for infrastructure development 500 500 500 500 500 2500<br />
9. Improve road transport<br />
infrastructure<br />
Funding road development 100 500 500 500 100 1700<br />
10. Promote the Use of ICT: Increasing training of staff on the use of ICT 3 3 3 3 3 15<br />
Increasing information sharing through ICT 3 3 3 3 3 15<br />
Strategic Objective 4: To Strengthen the Regulatory Framework for the <strong>Sugar</strong> industry<br />
Enhance capacity for a robust assessment of market conditions 5 5 5 5 5 25<br />
11. Strengthen Management of<br />
<strong>Sugar</strong> Import Policy<br />
Support measures to eliminate tax evasion 1 1 0 0 0 2<br />
Support implementation of rules of origin 1 1 0 0 0 2<br />
Ensure prompt payment to farmers 0 0 0 0 0 0<br />
12. Strengthen Framework for<br />
Corporate Governance<br />
Strengthen the management of OGIs 5 5 5 5 5 25<br />
Conclude privatization of sugar factories 50 50 0 0 0 100<br />
Establish and implement a M&E system for strategic plan 2010-2014 10 10 10 10 10 50<br />
Establish a sugarbelt roads management committee 5 5 5 5 5 25<br />
13. Development of a Institutional<br />
Framework for Coordination<br />
of Roads Maintenance in the<br />
sugarbelt<br />
Total Budget Estimate 3,647 4,223 6,812 6,786 1,487 22,955<br />
Strategic Plan, 2010-2014 59
Annex VIII: Loans and Grants to <strong>Sugar</strong> Factories (31 December 2007)<br />
60<br />
Total<br />
Other<br />
Creditors<br />
Performing<br />
SDF Loans<br />
Farmers<br />
Arrears<br />
Non performing SDF Loans SDL Statutory payments e.g.<br />
Taxes<br />
GoK loans Financial Institutions<br />
Loans<br />
Penalties Principal Penalties<br />
Interest Principal Interest Principal Interest Levy<br />
Arrears<br />
Principal<br />
KSh., Millions<br />
<strong>Kenya</strong> <strong>Sugar</strong> Industry<br />
- - - 95 6 601 - 557 574 715<br />
-<br />
2,548<br />
3337<br />
- - - - - - - - - - -<br />
3547<br />
6,884<br />
22 28 0 1,875 134 411 -<br />
0 - 2,153 8,666<br />
366<br />
1,433 2,244<br />
361 654 1,892 1268 303 527 - 0 0 175<br />
9,968<br />
104<br />
4,684<br />
3,807 3,930 682 1892 3,238 443 1,539 1,990 2,244 749 7,552 28,066<br />
Chemelil <strong>Sugar</strong><br />
Co.<br />
Agro Chemical<br />
Co.<br />
Miwani <strong>Sugar</strong><br />
Co.<br />
Muhoroni<br />
<strong>Sugar</strong> Co.<br />
Sub-total<br />
Nyando <strong>Sugar</strong><br />
Belt<br />
- - - 302 73 - - - - 0 - -<br />
-<br />
375<br />
11,963<br />
0 787 199 1471 -<br />
- 200 6,744<br />
9,774<br />
5<br />
1,321 937<br />
26,657<br />
- - - - - - - - - - - - -<br />
-<br />
9,774 11,963 5 0 1,089 272 1,471 1,321 937 200 6,744 27,032<br />
Busia <strong>Sugar</strong> Co.<br />
Nzoia <strong>Sugar</strong> Co.<br />
West <strong>Kenya</strong><br />
<strong>Sugar</strong> Co.<br />
Sub-total<br />
Western <strong>Sugar</strong><br />
Belt<br />
355 87 242 566 - - 95 23 331 2,998<br />
254 692<br />
201<br />
152<br />
South Nyanza<br />
<strong>Sugar</strong> Belt (<br />
Sony <strong>Sugar</strong>)<br />
-<br />
Coastal <strong>Sugar</strong><br />
Belt ( Ramisi)<br />
Grand Total 13,835 16,585 839 2,093 4,682 802 3,252 566 3,311 3,181 95 972 14,627 58,096<br />
Source: State of SDF Funds, KSB.
Annex IX: Annual Targets Monitoring Indicators<br />
Firm/Farm Level Annual Targets<br />
Goal: Enhanced <strong>Sugar</strong> industry Competiveness<br />
Outcome: Optimal yield levels<br />
Outcome Indicator: Tonnes of cane harvested<br />
Outcome Indicator Unit Base Year Base Value 2009/10 2010/11 2011/12 2012/13 2013/14<br />
Optimal yield levels Area under cane Ha<br />
i. Chemelil Ha 2008/2009 13,341 14,008 14,625 15,342 16,009 16,676<br />
ii. Muhoroni Ha 2008/2009 14,259 14,972 15,685 16,398 17,111 17,874<br />
iii. Mumias Ha 2008/2009 64,637 67,869 71,101 74,333 77,111 80,874<br />
iv. Nzoia Ha 2008/2009 23,899 25,094 26,289 27,434 28,679 29,874<br />
v. SONY Ha 2008/2009 19,322 20,288 21,254 22,220 23,186 24,153<br />
vi. West <strong>Kenya</strong> Ha 2008/2009 22,070 23,174 24,277 25,381 26,434 27,588<br />
vii. Soin Ha 2008/2009 4,638 4,870 5,102 5,334 5,566 5,798<br />
viii. Kibos Ha 2008/2009 2,622 2,753 2,884 3,015 3,146 3,278<br />
ix. Butali** Ha 2008/2009 - - 2,600 2860 3120 3250<br />
x. Kwale International** Ha 2008/2009 - - 5000 5500 6000 6250<br />
xi. Transmara** Ha 2008/2009 - - 3,000 3450 3600 3750<br />
xii. Miwani* Ha 2008/2009 4,633 4,633 4,865 5,096 5,328 5,560<br />
Total area under cane Ha 2008/2009 169,421 177,892 196,682 206,363 215,290 224,925<br />
2008/2009 73 79 84 90 95 100<br />
Yield per hectare TC/<br />
Ha<br />
*Miwani Rehabilitated and Operational by 2011<br />
**New factories operational by 2013<br />
Strategic Plan, 2010-2014 61
Harvesting and Transport Annual Targets<br />
62<br />
Goal: Enhanced <strong>Sugar</strong> industry Competiveness<br />
Outcome: Optimal Harvesting and Transport schedules<br />
Outcome Indicator: Tonnes of cane harvested and delivered to mills<br />
Outcome Indicator Unit Base Year Base Value 2009/10 2010/11 2011/12 2012/13 2013/14<br />
Area of Cane Harvested Ha<br />
i. Chemelil Ha 2008/2009 9,043 9,782 10,524 11,276 12,027 13,380<br />
Optimal Harvesting<br />
and Transport<br />
Schedules<br />
<strong>Kenya</strong> <strong>Sugar</strong> Industry<br />
ii. Muhoroni Ha 2008/2009 5,507 7,105 7,643 8189 8,735 9718<br />
iii. Mumias Ha 2008/2009 27,191 29,053 28,740 30,792 32,845 36,540<br />
iv. Nzoia Ha 2008/2009 5,909 7,730 8,316 8910 9,504 10,574<br />
v. SONY Ha 2008/2009 5,489 8,559 9,208 9866 10,524 11,707<br />
vi. West <strong>Kenya</strong> Ha 2008/2009 7,480 7,034 7,565 8105 8,645 9,618<br />
vii. Soin Ha 2008/2009 297 314 303 325 347 338<br />
viii. Kibos Ha 2008/2009 1,326 1,404 1,471 1471 1,604 1,672<br />
ix. Butali Ha 2008/2009 - - - - 1,345 1,560<br />
x. Kwale International Ha 2008/2009 - - - - 3,360 3,898<br />
xi. Transmara Ha 2008/2009 - - - - 1,345 1,560<br />
xii. Miwani Ha 2008/2009 - - 1,076 1,248 1,463 1,614<br />
Total Ha 2008/2009 62,242 70,981 74,846 80,182 91,744 102,179<br />
Tonnes of Cane Harvested Tonnes 2008/2009 5,125,821 5,323,575 5,987,680 6,414,560 7,339,520 8,174,320<br />
Post-harvest losses % 2008/2009 5 4 3 2 2 2<br />
Cane delivered to mills Tonnes 2008/2009 5,165,786 5,110,632 5,808,049 6,286,269 7,192,730 8,010,834
Factory Level Annual Targets<br />
Goal: Enhanced <strong>Sugar</strong> industry Competiveness<br />
Outcome: Optimal Processing Levels<br />
Outcome Indicator: Tonnes of sugar made<br />
Outcome Indicator Unit Base Year Base Value 2009/10 2010/11 2011/12 2012/13 2013/14<br />
Capacity Utilisation<br />
i. Chemelil % 2008/2009 50 61 70 75 80 89<br />
Optimal Processing<br />
Levels<br />
ii. Muhoroni % 2008/2009 52 61 70 75 80 89<br />
iii. Mumias % 2008/2009 66 66 70 75 80 89<br />
iv. Nzoia % 2008/2009 58 61 70 75 80 89<br />
v. SONY % 2008/2009 51 61 70 75 80 89<br />
vi. West <strong>Kenya</strong> % 2008/2009 60 61 70 75 80 89<br />
vii. Soin % 2008/2009 68 68 70 75 80 89<br />
viii. Kibos % 2008/2009 88 88 88 88 88 89<br />
ix. Butali % 2008/2009 - - - - 50 58<br />
x. Kwale International % 2008/2009 - - - - 50 58<br />
xi. Transmara % 2008/2009 - - - - 50 58<br />
xii. Miwani % 2008/2009 - - 50 58 68 75<br />
Recovery Levels % 2008/2009 10.0 10.5 11.0 11.5 11.5 11.5<br />
<strong>Sugar</strong> Made Tonnes 2008/2009 518,128 565,236 670,830 813,286 982,257 1,151,557*<br />
*Projected <strong>Sugar</strong> consumption by 2014 – 877,133 tonnes of sugar<br />
*Export potential – 500,000 tonnes<br />
Industry long term goal – 1,432,569 tonnes of made sugar<br />
Strategic Plan, 2010-2014 63
Other Critical Annual Targets<br />
64<br />
Goal: Enhanced <strong>Sugar</strong> industry Competiveness<br />
Outcome: Optimal yield levels<br />
Outcome Indicator: Tonnes of cane harvested<br />
Outcome Indicator Unit Base Year Base Value 2009/10 2010/11 2011/12 2012/13 2013/14<br />
High yielding varieties % 2008/2009 5 10 25 40 45 50<br />
Optimal yield levels<br />
achieved<br />
<strong>Kenya</strong> <strong>Sugar</strong> Industry<br />
Area under cane irrigated Ha 2008/2009 400 44,000 84,000 124,000 164,000 204,000<br />
Synchronised timely<br />
Months 2008/2009 6-12 4 3 2 1 1<br />
harvesting<br />
Staleness index Days 2008/2009 4 2 2 1 1 1<br />
Optimal harvesting and<br />
transport schedules
Annex X: Plan Indicator Tracking Evaluation Tool<br />
Year Cumulative<br />
Indicator Target Achieved Variance Scorecard* Comments Improvement Action Achievement to Date Mean Scorecard<br />
Score Card Comment Target Achievement Level (%)<br />
5 Very Good 85-100<br />
4 Good 69-84<br />
3 Satisfactory 53-68<br />
2 Below Average 37-52<br />
1 Poor 0-36<br />
Strategic Plan, 2010-2014 65
Annex XI: <strong>Sugar</strong>cane Production – Recommendations for<br />
Competitiveness<br />
Excerpts from Cost of <strong>Sugar</strong>cane and <strong>Sugar</strong> Production, <strong>Kenya</strong> <strong>Sugar</strong> <strong>Board</strong>, 2008<br />
1.1 Seed Cane Production<br />
66<br />
Seed cane for establishment of milling cane be obtained from properly selected “B” nurseries<br />
which have been developed with seed cane from properly treated and inspected seed from “A”<br />
nurseries. There is need for all sugar zones to invest in and operationalise seed cane treatment<br />
units.<br />
The price for seed cane should be at a premium, higher than that of cane for milling. This will<br />
motivate selected farmers to produce adequate good quality seed cane.<br />
There is need for training of seed certification officers and field inspectors for quality<br />
assurance.<br />
Procedures for certification must also be developed and documented. KESREF must play a<br />
leading role in this process, backed by the sugar companies and OGIs.<br />
Standard variety composition should gradually be restored to 20:40:40 for early, mid and late<br />
maturing varieties. The seed cane for this restoration should be established in the nucleus<br />
estate, where all the required standards for seed cane preparation will be adhered to.<br />
1.2 Fertilizer Application<br />
There is need for regular undertaking of soil tests to determine actual deficiencies in order to<br />
apply appropriate corrective measures, instead of sticking to a fixed fertilizer regime regardless<br />
of the changing soil needs. There is need for equipping of the soil testing laboratory at KESREF<br />
to meet industry demand for effective and timely testing.<br />
Fertilizers are applied mostly manually on top of the ridges and are usually washed away when<br />
applied in the rainy season. Urea is a volatile fertilizer and is less effective when applied on<br />
top of the ridges. For better effectiveness, fertilizer should be incorporated into the soil using<br />
fertilizer ridgers or by hand in small furrows adjacent to the cane stools, then covered with<br />
soil.<br />
In the MSC zone especially, efforts to stem diversion of fertilizer to sale for cash, could be<br />
supplemented by:<br />
� Ensuring prompt payment for cane deliveries<br />
� Re-instating the farmers’ advance scheme to meet social needs and crop maintenance costs<br />
before payments are received<br />
� Undertaking specific research to ascertain the appropriate fertilizer regimes for each zone<br />
� Supplying fertilizer in a timely manner, when required<br />
� Closely supervising fertilizer application<br />
1.3 Cane Harvesting and Transportation<br />
Effective mechanization is only possible through viable farm units, hence the need for block<br />
farming with minimum plot sizes of 25 Ha.<br />
<strong>Kenya</strong> <strong>Sugar</strong> Industry
There is need to use purpose built unit for cane haulage eg. Bell instead of general multipurpose<br />
use units in order to cut down on cost of maintenance and improve on availability,<br />
hence efficiency.<br />
Cane Yard management at the factory is key to reduction of the uneconomically lengthy turnaround<br />
time by cane haulage units.<br />
Cane transportation rates account for 30-37% of the total cost of sugarcane production. In<br />
order to minimise on this cost, it makes business sense to increase productivity of existing cane<br />
areas rather than expanding cane catchment areas to uneconomically distant zones.<br />
High cane spillage especially in the Mumias <strong>Sugar</strong> Zone could be mitigated by having the<br />
trailer baskets fitted with all round expanded metal and secured with rope or cargo netting.<br />
In areas where farmers have smaller cane plots, it is worthwhile considering animal drawn carts<br />
to ferry cane from the fields to a collection centre. This would save on costs and protect the<br />
plots and cane stools from destruction.<br />
1.4 Roads Infrastructure<br />
An industry infrastructure development blue print be formulated and implemented. The<br />
industry collaborates with central and local government in the utilization of petroleum levy<br />
and the local government cess.<br />
The following sources of funding have been identified for long-term sugar roads maintenance:<br />
� The Central Government through the ministry of public Works and the <strong>Kenya</strong> Roads<br />
<strong>Board</strong>, from taxes and fuel levy<br />
� The local authorities through Cess funds levied on sugarcane sales<br />
� Funds generated internally by the sugar companies<br />
� Grants from the <strong>Sugar</strong> Development Fund.<br />
In a liberalized market, the use of sugar company resources in maintaining sugar roads, which<br />
are public roads, is not desirable as it increases production overheads and ultimately adds to<br />
the cost of sugar.<br />
It is proposed that the management of sugar roads be placed under a committee comprising<br />
KSB, millers, outgrower representatives, local government and the <strong>Kenya</strong> Roads <strong>Board</strong>.<br />
1.5 Quality based Cane Payment System<br />
The modified cane payment formula should be adopted and implemented in all sugar<br />
companies as a pilot cane testing unit is established to guide the industry towards sucrose<br />
based cane payment.<br />
Price of cane =<br />
Farmer’s sharing ratio: 50%<br />
TC/TS ratio: 10%<br />
av. Price of sugar x farmer’s sharing ratio<br />
TC/TS Ratio<br />
Strategic Plan, 2010-2014 67
68<br />
The system will create incentive for farmers to deliver clean high sucrose sugar and the millers<br />
to improve sugar recovery, with overall increased productivity for the industry.<br />
Currently, there exists a Cane Pricing Committee which under the law comprises representation<br />
from KSB, KESGA and KESMA and has the function of reviewing sugarcane prices which<br />
Paragraph 8 of the 2nd Schedule of the <strong>Sugar</strong> Act 2001 demands that it be determined on the<br />
basis of sucrose content.<br />
The importance of cane pricing in providing growers with quality incentives and protection<br />
from poor mill performance cannot be over-emphasized.<br />
Conditions to be met for a Successful System<br />
Availability of high sucrose seed cane must be guaranteed (major role for KESREF)<br />
The grower must guarantee ability to supply and the miller to crush, cane at the optimal<br />
sucrose level.<br />
The preferred payment system must be backed by the law and governed by strict and clear<br />
regulation. In this regard, there must be a neutral and professional arbitration body to police<br />
the regulation and deal with any queries arising.<br />
The farmers and millers must be fully enlightened on the system, its implications and what is<br />
expected of them for the growth of the industry.<br />
The preferred cane payment system must be one that provides the farmer and the miller an<br />
equitable share of the industry’s earnings based on their respective costs of production, plus a<br />
reasonable return on their investments.<br />
The system must encourage and reward the farmer for supply of good quality cane to the<br />
mills.<br />
The system must encourage and reward the factory for operating at optimal efficiency.<br />
1.6 Ratooning<br />
Unless in exceptional cases where sugarcane husbandry is of high quality, farmers hardly make<br />
any profit from the plant crop. Subsequent ratoons, if well maintained to sustain high yields,<br />
bring good profits to the farmer. Emphasis must therefore be placed in ratoon maintenance<br />
through selection at planting of varieties with high ratoonability, cane husbandry practices<br />
such as ridging which stimulates cane growth and proper fertilizer application.<br />
1.7 Management and Profitability<br />
The use of inputs and factors of production varies in the different sugar belts due to management<br />
styles, technologies and geographical characteristics.<br />
MSC is a high input use scheme attributed to a centrally planned management system. With<br />
the exception of hired labour, the level of use of inputs is determine and paid for by the miller.<br />
The profits earned by the farmer are an implicit land rate for leasing out their land. Since the<br />
inputs are supplied centrally, the farmer has lower leverage in bargaining for better prices. The<br />
input costs are also higher due to mark up costs for the transactions. In the absence of choice<br />
of input use, cases of diversion, especially of fertilizer are high.<br />
<strong>Kenya</strong> <strong>Sugar</strong> Industry
In W/<strong>Kenya</strong>, CSC and MUSCO zones, the input use is generally lower and farmers have more<br />
autonomy in deciding the level of input use. This autonomy has a disadvantage in that there is<br />
more variability in production levels. One advantage however is that farmers can access inputs<br />
at relatively lower prices than in the MSC zone.<br />
1.8 Research<br />
KESREF was incorporated in January 2001 with the principal objective of conducting sugar<br />
research and undertaking technology transfer. Low levels of funding, poor and inadequate<br />
infrastructure, and reliance on SDF as the only source of funding which is not adequate<br />
limit the performance of the Foundation. To enable the Foundation effectively carry out its<br />
mandate, there is need to increase research funding, develop bankable projects proposals to<br />
attract financial support from donors and venture into other sources of income generation.<br />
Current R & D activities have concentrated on agronomic and socio-economic research while<br />
farm mechanization, sugar milling and processing are almost non-existent. Potential research<br />
capacities that can be exploited exist at KESREF, KIRDI 29 and local universities.<br />
2.0 Strategies for Smallholder/Outgrower Development<br />
It is often argued that the smallholder nature of sugarcane production in <strong>Kenya</strong> is one of the<br />
key challenges that lead to high cost of production. While the smallholder nature is distinctly<br />
unique in the case of <strong>Kenya</strong> compared with other regional producers, it can by all means be<br />
streamlined and made efficient as is demonstrated by Indian sugarcane production which is<br />
also largely smallholder yet enviable competitive.<br />
2.1 Measures to Address Smallholder Constraints<br />
In order to address the typical constraints of smallholder production system, the following<br />
measures have to be considered:<br />
� Improved access to long term and affordable cane development finance<br />
� Improved access to higher yielding and disease resistant cane varieties, and seed cane<br />
� Improved capacity of cane growers in: cane growing techniques, business understanding,<br />
enforcement of grower/miller contracts, continuous civic education programmes<br />
� Improved capacity of the management systems: MIS to make operations more effective<br />
and efficient; staff capacity through training and development; engaging with technical<br />
partners to facilitate development.<br />
Improved road network to improve haulage and reduce transportation costs; and<br />
Equitable division of proceeds through the cane pricing formula.<br />
A study undertaken by the ISO has identified the following four possible strategies for further<br />
development of smallholder/ outgrower cane production:<br />
• The Business Linkages Model;<br />
• Block Farming;<br />
• Adoption of new cane varieties; and<br />
• Strengthening of Grower Association.<br />
29 Collaboration MOU between KESREF and KIRDI was signed in August 2006. This led to a joint study involving KSB on the Assessment of<br />
Industrial Research and Development needs of the <strong>Kenya</strong>n <strong>Sugar</strong> industry.<br />
Strategic Plan, 2010-2014 69
2.2 The Business Linkages Model<br />
70<br />
The ‘business linkages’ model was developed by Kilombero <strong>Sugar</strong> Company Ltd (KSCL) in<br />
Tanzania and the International Finance Corporation (IFC) which financed a project proposal<br />
entitled – the Kilombero Business Linkages Project (KBLP). The project, assessed as successful,<br />
involves promoting business and commercial linkages between KSCL and the outgrower<br />
community through innovative financing mechanisms and capacity building programmes. It<br />
has allowed new farmers to enter the market and existing farmers to expand and improve their<br />
cane farming activities. Support was provided for vital infrastructural development, creation<br />
of an information management system, and delivery of agriculture and business training<br />
to farmers, farm groups and local entrepreneurs through leveraging commercial and donor<br />
funding.<br />
KBLP’s initial analysis revealed that it was necessary to increase outgrowers’ access to finance<br />
and assist farmers to improve crops, adopt new technologies and view their farms as profit<br />
making operations. Under KBLP, the KSCL aimed to provide a reliable and stable market for<br />
outgrower cane while all other services such as land preparation, weeding, cane loading and<br />
infrastructure maintenance, is provided by the community for the community.<br />
The following were identified by KBLP as priority areas to achieve the objectives:<br />
• Develop a comprehensive management information system;<br />
• Enhance business, agricultural and technical skills;<br />
• Contribute to SME and micro-enterpreneur development;<br />
• Develop Kilombero Community Trustand Trust Farm to provide finance for outgrower<br />
community development projects;<br />
• Improve infrastructure in outgrower areas;<br />
• Increased access to finance for existing and new farmers; and<br />
• Build the capacity of associations that represent outgrower farmers.<br />
The success of this project is hinged on supporting partners and a market to outgrower<br />
production, all driven by clear economic objectives.<br />
2.3 Block Farming<br />
The problem of land fragmentation is notable in East Africa, and has been cited as a key constraint<br />
to efficient sugarcane production. One strategy being pursued to address land fragmentation is<br />
Block farming – a contiguous farming area operated under shared ownership.<br />
2.3.1 Benefits of Block Farming<br />
� As a result of continuous plots, roads, drainage and other necessary infrastructure can be<br />
more easily constructed and maintained<br />
� Easier to provide extension services for improved husbandry and higher productivity<br />
� Reduced incidence of accidental fire because the grid road network acts as a firebreak<br />
� Planting lines will be more uniform, ensuring more accurate and easier application of<br />
herbicide and fertilizer<br />
� Easier harvesting due to uniform maturity period and easy accessibility to cane. Harvest<br />
efficiency also improved because cane loaders no longer have to travel long distances<br />
when loading cane into trucks<br />
� Cost per unit of cane planting and maintenance operations will decline through the<br />
exploitation of economies of scale<br />
<strong>Kenya</strong> <strong>Sugar</strong> Industry
� A drainage system will ensure productivity losses associated with water logging will be<br />
reduced and even allow harvesting of cane during the rainy season if required.<br />
2.3.2 Challenges of Block Farming<br />
� All participating growers must start planting at the same time;<br />
� A high risk of free-riding; and<br />
� Farmers must stay with the block arrangement whilst the agreed period is in force.<br />
2.3.3 Requirements for Successful Block Farming<br />
� Strong institutional factors are crucial to the success of block farming. Strong farmer<br />
associations at local and apex levels are needed to sensitize growers to build consensus<br />
skills among block members<br />
� Financing mechanisms must be made available<br />
� Extension and training Services<br />
� Supportive sugar miller and government to ensure appropriate institutions for policy and<br />
regulation<br />
� At least 4 hectare blocks are necessary for sustainable commercial sugarcane farming.<br />
Maximum number of farmers per block is 20.<br />
� Aerial photographs and GPS should be used to indicate block boundaries.<br />
2.4 Improved Cane Varieties<br />
One of the factors leading to low production and productivity of sugarcane is the existence of<br />
low yielding varieties which are also susceptible to diseases and insect pests. The diseases are<br />
generally seed-borne and are easily spread by use of unclean seed cane.<br />
While improved cane varieties can increase productivity in O/G farms, sustainability will only<br />
be guaranteed by better cultural practises and a business sense. The incentive to use treated<br />
seed cane, proper zone specific varieties and good crop husbandry can only be sustained by the<br />
following factors:<br />
Much greater focus on grower extension and training;<br />
Introduction/ enforcement of legislative sanction;<br />
A cane payment system that properly rewards growers for the quality of their cane.<br />
The ISO and CFC (providing grant financing) approved a project submitted by the <strong>Sugar</strong><br />
<strong>Board</strong> of Tanzania aimed at addressing the problems of low productivity and profitability in<br />
the smallholder sector in East Africa (Tanzania, <strong>Kenya</strong> and Uganda) through importation and<br />
evaluation of superior sugarcane varieties, multiplication, production, use of certified seed cane<br />
and promotion of proper practices of crop husbandry and management. The project is also<br />
expected to overcome the current short falls of lack of clean planting material by introducing<br />
certified seed cane production systems which will ensure healthy seed cane and effective control<br />
over the spread of diseases and pests.<br />
2.5 Strengthening Outgrower Institutions<br />
(a) In order to address the low levels of education among farmer leaders, training and<br />
capacity building of the management of Outgrower institutions is a priority. Directors<br />
of Outgrower bodies must have acceptable minimum levels of education to enable then<br />
understand and interpret policy.<br />
Strategic Plan, 2010-2014 71
72<br />
(b) Immediate independent audits of each of the Outgrower institutions should be undertaken<br />
to determine the nature and extent of the liabilities. Restructuring of the financial state of<br />
the Outgrower bodies is a pre-requisite in making them viable.<br />
(c) Accountability in the leadership of Outgrower Institutions could be enhanced through<br />
reviewing the Memoranda and Articles of Association, such that the grower bodies are<br />
limited by shares rather than guarantee. Under their present structure, the outgrower<br />
directors have nothing to lose by running down the institutions.<br />
(d) For effective operation of outgrower institutions, they must be focused on the farmers<br />
needs at the grass root and be accountable to the grower members who shall be<br />
shareholders of the company. Essentially then, the outgrower bodies shall be governed by<br />
the Co-operatives Act.<br />
(e) Outgrower bodies must be run by competent management, based on sound commercial<br />
principles with proper checks and balances in place to ensure that set targets are achieved.<br />
KSB could play a coordinating role ensuring that the controls are in place and that the<br />
institutions so established take advantage of the existing community strengths.<br />
(f) Directors and management of Outgrower institutions should be put on binding<br />
Performance Contracts modeled in the form of those currently obtaining in the Civil<br />
Service in order to ensure quality service delivery and accountability.<br />
(g) The OGIs need to develop and adhere to a risk management policy to enable them<br />
identify, assess and manage risks in order to minimize the negative impact thereof.<br />
(h) There is a programme supported by the World Association of Beet and Cane Growers<br />
(WABCG) to strengthen sugarcane and beet producers’ organizations in developing<br />
countries (undertaken by Agricord). The basic premise of the programme is that grower/<br />
miller relationships determine the level of income generation by a smallholder farmer.<br />
The organizational degree of outgrowers determines the degree of bargaining power and<br />
the way proceeds are shared.<br />
Annex XII: <strong>Sugar</strong> Production – Recommendations for Efficiency<br />
Excerpts from Cost of <strong>Sugar</strong>cane and <strong>Sugar</strong> Production, <strong>Kenya</strong> <strong>Sugar</strong> <strong>Board</strong>, 2008<br />
i. Undertake financial restructuring of government owned sugar companies to prepare them for<br />
privatization within a given period; Government should gradually divest from ownership of sugar<br />
companies through sale of its equity in parastatal mills to strategic partners. Such divestiture should<br />
take cognizance of the socio-economic impact on the local community.<br />
ii. Promote rehabilitation, modernization and expansion of the factories to maintain sufficient<br />
capacity for the production of sugar to meet domestic consumption requirements at all times and<br />
surplus for export;<br />
iii. Promote the development of new factories in viable regions of the country by the private sector;<br />
iv. Support industrial and applied research. Seek in-house support for mill maintenance e.g. enlisting<br />
the services of institutions such as KIRDI and Numeric Machining for fabrication of mill parts.<br />
<strong>Kenya</strong> <strong>Sugar</strong> Industry
v. Enhance income streams through value addition of co-products<br />
vi. Guard against diseconomies of scale as introduced by overheads from dominant functional<br />
departments and systems rigidity as may be evident in the local best of the breed companies<br />
compared to regional competitors.<br />
vii. Empower managers through-out the company to approach cost containment differently by<br />
modifying the manner in which they produce, report, supervise, control, appraise and market<br />
products and services.<br />
viii. The industry must identify and eliminate low value-adding tasks, which increase overheads but<br />
must limit the frequency of cost cutting activities as they wear down morale.<br />
ix. Tune corporate structure to emerging conditions of lean innovative and balanced production<br />
systems.<br />
x. Carry out assessment of the working patterns in the industry that lead to high costs and encourage<br />
modification of such factors to reduce costs.<br />
xi. To avoid impaired decision making, the industry should standardize its accounting reports and<br />
monitor its cost data more consistently to reduce irrelevance, inaccuracy and issuance of misleading<br />
information.<br />
xii. Industry must modify its decision making process to cut down paper work, filing etc., without<br />
diluting the management of financial and staff resources. Effective use of IT by senior managers in<br />
finding out the accurate details of occurrences and making decisions must be encouraged. It must<br />
receive equal attention as labour, materials and overheads.<br />
xiii. The industry must map out its value chain in order to quantify value added by each activity and set<br />
out equitable rates and prices for all inputs to support sustainability for the benefit of all players.<br />
xiv. Probably allow the Agriculture Department to run the nucleus estate as a semi autonomous business<br />
selling its cane to the company to help assess the real cost of cane and due returns. This may further<br />
encourage other growers contracts, such as leases, where grower practices are wanting.<br />
xv. De-link the cost of cane handling (harvesting, loading, transport e.t.c) from the grower’s proceeds.<br />
In any case all such services are secured by contracts between the millers and service contractors<br />
without consulting the grower. A review of value addition activities in these operations among the<br />
accountable parties should bring down the costs.<br />
xvi. Embrace condition maintenance at the factory to pre-empt breakdowns and ensure that valuable<br />
time is not lost while extensive repairs and maintenance are being undertaken.<br />
Strategic Plan, 2010-2014 73
74<br />
<strong>Kenya</strong> <strong>Sugar</strong> Industry