DEER PROGRAM REPORT DEER ROGRAM REPORT
DEER PROGRAM REPORT DEER ROGRAM REPORT
DEER PROGRAM REPORT DEER ROGRAM REPORT

Create successful ePaper yourself
Turn your PDF publications into a flip-book with our unique Google optimized e-Paper software.
ii2006-2007 Mississippi Deer Program Report
Table of ContentsDedication.......................................................................................................................................................................................................iiiGovernor and Legislative Committees.............................................................................................................................................................ivCommission on Wildlife, Fisheries, and Parks.................................................................................................................................................ivTable of Contents..............................................................................................................................................................................................vAcknowledgments...........................................................................................................................................................................................viIntroduction..................................................................................................................................................................................................... 1Wildlife Technical Staff Directory ................................................................................................................................................................. 2-3Wildlife Management Areas ........................................................................................................................................................................ 4-5Wildlife Management Area Information........................................................................................................................................................ 6-7Wildlife Management Area Directory............................................................................................................................................................ 8-9Wildlife Management Area Narratives....................................................................................................................................................... 10-21Regional Narratives.................................................................................................................................................................................. 22-23Road Kill Survey Data.................................................................................................................................................................................... 24Depredation................................................................................................................................................................................................... 25Chronic Wasting Disease.......................................................................................................................................................................... 26-27Epizootic Hemorrhagic Disease................................................................................................................................................................ 28-29Statewide Deer Herd Health Evaluations................................................................................................................................................... 30-33Mail Survey Data...................................................................................................................................................................................... 34-35Sex Ratio Estimates.................................................................................................................................................................................. 36-37Deer Tags....................................................................................................................................................................................................... 38Antler Regulations......................................................................................................................................................................................... 39High Fenced Enclosures........................................................................................................................................................................... 40-41Deer Management Assistance Program.................................................................................................................................................... 42-45Statewide DMAP Data............................................................................................................................................................................... 46-47Mississippi Soil Resource Area Map ............................................................................................................................................................. 48Batture Soil Resource Area Summary of DMAP Data.................................................................................................................................... 49Delta Soil Resource Area Summary of DMAP Data........................................................................................................................................ 50Upper Thick Loess Soil Resource Area Summary of DMAP Data.................................................................................................................. 51Lower Thick Loess Soil Resource Area Summary of DMAP Data.................................................................................................................. 52Upper Thin Loess Soil Resource Area Summary of DMAP Data................................................................................................................... 53Lower Thin Loess Soil Resource Area Summary of DMAP Data.................................................................................................................... 54Black Prairie Soil Resource Area Summary of DMAP Data ........................................................................................................................... 55Upper Coastal Plain Soil Resource Area Summary of DMAP Data................................................................................................................. 56Lower Coastal Plain Soil Resource Area Summary of DMAP Data................................................................................................................ 57Coastal Flatwoods Soil Resource Area Summary of DMAP Data................................................................................................................... 58Interior Flatwoods Soil Resource Area Summary of DMAP Data.................................................................................................................. 59Enforcement of Deer-related Citations........................................................................................................................................................... 60Citations Summary by County....................................................................................................................................................................... 61Hunting Incident/Accident Summary........................................................................................................................................................ 62-63Magnolia Records Program........................................................................................................................................................................... 64Pope and Young Record Non-typical Deer..................................................................................................................................................... 65Pope and Young Record Typical Deer............................................................................................................................................................ 65Boone and Crockett Record Non-typical Deer................................................................................................................................................ 66Boone and Crockett Record Typical Deer....................................................................................................................................................... 67Status............................................................................................................................................................................................................ 68Recommendations......................................................................................................................................................................................... 692006-2007 Mississippi Deer Program Reportv
AcknowledgementsNumerous people are responsible for the information presented in this report. The vision and work of Mississippi Game and Fish Commissionpatriarchs like Fannie Cook and Bill Turcotte initiated plans in the 1930’s that ultimately provided Mississippi Sportsmen with thedeer population we enjoy today.Leaf River Refuge Manager Quinton Breeland, Upper Sardis Refuge Manager Garald Mize, and other dedicated Commission employeesprotected, trapped, and relocated hundreds of deer throughout the state during the days of Mississippi’s deer restoration. In addition, gamewardens of the deer restoration era protected a growing deer population through the early period of wildlife conservation. During this timein the history of Mississippi’s Wildlife Management Agency, game wardens provided their own gun and vehicle. Mobile communication withother officers was little more than a futuristic dream. Wildlife enforcement, or the game warden that interfered with the “jacklighting” of deerand illegal harvest of game, was not a welcome sight to some hunters at that time. Refuge managers and game wardens of the restorationera are pioneers of the deer population restoration success of today.Today the conservation officer is considered differently. Most men and women who enjoy the bountiful wildlife that exist today regard theconservation officer as a partner in wildlife conservation. As those who are responsible for the deer populations we treasure are remembered,the conservation officers of today should not be forgotten.The Mississippi Legislature is also to be thanked for their historic and sustained funding of this agency. Since the establishment of theGame and Fish Commission in the days of the Great Depression, the Mississippi Legislature has funded efforts necessary for the wildlifeconservation success story of the white-tailed deer.Mississippi landowners have made deer in the Magnolia State a reality. Without landowner desire to have deer, most agency efforts wouldhave proved ineffective. Those of us who hunt, study, or admire the white-tailed deer truly thank you.This report would not have been possible without the efforts and cooperation of the Mississippi Department of Wildlife, Fisheries, andParks (MDWFP) Wildlife Bureau technical staff and district field personnel. An extra-special appreciation is extended to Dene Smith for assistancewith many aspects of producing and mailing this report. And to Cindy Clark who was responsible for the report design.Additionally, Mississippi’s deer hunters deserve special recognition. Your data collection efforts, concern, and support for white-tailed deerare vital to the success of the White-tailed Deer Program.Look for this information on www.mdwfp.com/deer. If you have any questions, feel free to contact us.Cover photo courtesy of Steve Gulledge Photography.Special thanks and recognition goes out to Bill Lunceford. Bill had the vision and foresight to put the first DMAP Annual Report togetherin 1988. In 1993 the report changed to the Mississippi Deer Data book. Without Bill’s vision of the DMAP program and the DeerData Book, today’s report would not have been possible.Chad DacusDeer Program CoordinatorChris McDonaldRegional Deer BiologistWilliam T. McKinleyRegional Deer BiologistLann WilfRegional Deer BiologistFEDERAL AID IN WILDLIFERESTORATIONA PITTMAN-ROBERTSONFUNDED PROJECTThis report is produced by the Technical Guidelines Project, Statewide Wildlife Development Project and Statewide Wildlife InvestigationsProject and is primarily funded by Federal Aid in Wildlife Restoration.vi2006-2007 Mississippi Deer Program Report
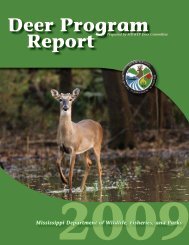
White-tailed Deer Program Report2006-2007The first Deer Management Assistance Program (DMAP) report was completed in 1982. The DMAP report evolved into the Mississippi DeerProgram Report in 1992. Since its inception, the purpose of this report was to consolidate all deer-related information obtained by theMississippi Department of Wildlife, Fisheries, and Parks (MDWFP) personnel. Compilation of these data provides managers the opportunityto analyze trends in deer harvest and physiological condition. In the future, managers will have a chronicled reference to more effectivelycritique effects of changes in season framework, hunter success, and climatic conditions on the deer population.Decision makers such as the Mississippi Legislature and the Mississippi Commission on Wildlife, Fisheries, and Parks have served thesportsmen of the state well. Deer harvest and management opportunities exist today that were considered far-fetched twenty years ago.Deer hunting regulations are subject to change each year. The most notable change is the creation of two deer management zones (Seepage 39).Annual mail surveys are used to monitor trends in hunter harvest and effort. This report includes mail survey data from the 2005 – 2006hunting season. Currently, Mississippi State University conducts these mail surveys. Recognizing that biases exist in mail survey data, andassuming all biases remain constant, the estimates obtained from the survey provide adequate indices for monitoring harvest and efforttrends.The MDWFP began using a new computer summary program (XtraNet) in 2004 – 2005. Data from 2001 – 2007 was analyzed usingXtraNet, while data prior to 2001 was analyzed using DeerTrax, the old computer summary program. This may be the cause for drastic differencesin some numbers. Once all of the historic data is entered into the XtraNet system, the numbers are expected to fall along the sametrend and eliminate the drastic drop in the graphs and tables. Additionally, all DMAP summary tables and graphs now include harvest reportsfrom WMAs that collect deer harvest data.Sample methods were unchanged for the following data sets:• Hunter effort and harvest information collected on state-operated WMAs• Employee observations of deer mortality due to motor vehicle collisions• Enforcement Bureau monitoring of deer hunting-related citations• Deer research projects conducted in cooperation with Mississippi State University Forest and Wildlife Research CenterDepartment wildlife biologists continued to inform and educate sportsmen relative to deer management needs and issues. Our goals areto provide insight into current deer management needs while providing the leadership to identify and guide future issues. All known mediasources were utilized in this process. In addition, public presentations were made to hunting, civic, and conservation groups throughout thestate. This report captures a portion of the informational and educational efforts.introDuctionSwayze Bozeman, with his dad Harvey, harvested these two deerSwayze Bozeman, with his dad Harvey, harvested these two deeron a DMAP property in Madison County.2006-2007 Mississippi Deer Program Report1
Wildlife Technical Staff DirectoryAdministrAtive & Office stAffWilDlife DirectoryLarry CastleWildlife Director601.432.2196larryc@mdwfp.state.ms.usRonald S. SeissAssistant Wildlife Director601.432.2213ron.seiss@mdwfp.state.ms.usDene SmithAdministrativeAssistant601.432.2300dene@mdwfp.state.ms.usJohn TindallLandsCoordinator601.432.2202johnt@mdwfp.state.ms.usJason PriceGIS Coordinator601.432.2123jasonp@mdwfp.state.ms.usCharlie “Buck”WelchGIS Specialist601.432.2122charliew@mdwfp.state.ms.usdeer PrOgrAmmigrAtOry gAme Bird PrOgrAmChad M.DacusCoordinator601.432.2177chad.dacus@mdwfp.state.ms.usChrisMcDonald601.757.2313chrismcd@hughes.netWilliam T.McKinley662.582.6111williamm@mdwfp.state.ms.usLann M. Wilf662.299.1454lannw@mdwfp.state.ms.usScott Baker601.432.2241scottb@mdwfp.state.ms.usKevin Brunke601.432.2242kevinb@mdwfp.state.ms.usHoustonHavens662.299.0273houston_havens@yahoo.comWild turkey PrOgrAmPrivAte lAnds HABitAt PrOgrAmsmAll gAmePrOgrAmDave GodwinCoordinator662.325.5119dgodwin@cfr.msstate.eduJoe KoloskiNWTF/MDWFPCo-op Biologist601.824.2933jkoloskinwtf@yahoo.comScott Edwards662.325.7490sedwards@cfr.msstate.eduJohn Gruchy662.274.1050john.gruchy@gmail.comRuss Walsh601.408.3399wrwalsh@gmail.comRick Hamrick662.320.9345rickh@mdwfp.state.ms.us22006-2007 Mississippi Deer Program Report
Wildlife Technical Staff DirectoryWmA PrOgrAmRandy SpencerWMA Coordinator601.432.2198randys@mdwfp.state.ms.usJeff MangrumMitigation LandsCoordinator601.737.5831owma@bellsouth.netJackie Fleeman662.873.3497jfleeman@bellsouth.netJerry Hazlewood662.423.1455mdwfp@avsia.comBrad Holder662.832.2110bdholder@hotmail.comJosh Moree601.835.3050jlmoree@gmail.comWilDlife DirectoryAlligAtOr/furBeArer PrOgrAmBlAck BeArPrOgrAmexOtic sPeciesPrOgrAmstaffDirectoryRicky FlyntProgram Leader601.432.2217rickyf@mdwfp.state.ms.usBrad YoungProgram Leader601.432.2242brad.young@mdwfp.state.ms.usRichard G.RummelProgram Leader601.432.2360richardr@mdwfp.state.ms.usregiOnAl BiOlOgists PrOgrAmJim WillcuttProgram Leader662.325.7490jwillcutt@cfr.msstate.eduStephen Chandler662.617.4944stephenchandler@cableone.netMatt Brock601.723.0370mattbrock02@yahoo.comAshley Gary662.418.0290a.gary@gmail.comAlan Mumbower601.941.1317mumbower@gmail.comRoger Tankesly601.540.5445rogertankesly@gmail.com2006-2007 Mississippi Deer Program Report3
Wildlife Management AreasWMA Data42006-2007 Mississippi Deer Program Report
Wildlife Management Areas2006-2007summary of Wildlife Management Area (WMA) deer harvest and hunter activity is presentedA in Figure 1. The majority of data was collected from self-service permit stations. Mandatorycheck-in and harvest reporting is required from all hunters on all WMAs.Throughout the year, conservation officers monitor compliance of hunters checking-in onWMAs. Differences in compliance rates among WMAs are seen each year. These differencesare mainly due to the degree of hunter acceptance of the check-in system. Someconservation officers assigned to WMAs have informed hunters of the importance ofaccurate check-in more than officers on other areas. Also, some officers have enforcedthe mandatory check-in regulation more diligently. The size of a WMA and control ofhunter access also affects compliance rates.Some WMAs provide very restrictive hunting opportunities due to area size, habitattype, and management objectives. The location and soil region in which a WMAlays impacts deer productivity. Because of these factors, as well as other uniquedifferences between areas, caution should be exercised in comparing data betweenWMAs (Table 1 on page 7).Hunter man-days for the 2006 – 2007 season increased slightly from last yearby approximately 8,200 man-days. The previous four seasons showed a declinein hunter effort from average as depicted in Figure 1. Reasons for these decreasesvary. Hurricane Katrina certainly decreased hunter activity, as did the increase in fuelprices that followed the hurricane in 2005 – 2006. Hunter opportunity has generallyremained stable or increased on most WMAs; therefore, opportunity is not likely acausative factor of this decrease. Conservation officers report an apparent statewidedecline in hunter numbers as well as hunter time spent in the field. Thisperceived trend seems to be applicable on private and public hunting acreage.However, while hunter effort increased, the total harvest remained stablefrom last season (Figure 1). The 2006 – 2007 season was the third andfourth seasons that many WMAs had a minimum inside spread restrictionfor legal bucks. WMAs with spread restrictions are noted on Table 1 by an*. The harvest should continue to increase for a few years before leveling off. Figure 2However, an increase in harvest can only be expected if hunter effort remains constant or increases.Average success rate also increased across WMAs. Therefore, the increased harvest may in addition bepartially attributed to increased deer populations on the WMA system. Other behavioral changes within thedeer herd are also likely culprits in the increased harvest.Figure 2 illustrates the location of WMAs in the state. For a list of WMAs in the state see the Wildlife ManagementArea information table on page 6.WMA DataWildlife Management AreaReported Deer Harvested and Hunter MandaysFigure 12006-2007 Mississippi Deer Program Report5
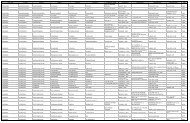
Wildlife Management Area Information2006-2007Wildlife Management Area Acreage Nearest Town Contact Person Phone NumberWMA Data1. Bienville....................................... 26,136............................ Morton................................Clayton Lott...........................601-469-59932. Black Prairie.................................. 5,673.......................... Brooksville...........................................................................662-272-83033. Calhoun County........................... 10,900........................Calhoun City............................Donnie Cain...........................662-628-63284. Canal Section............................... 26,000.............................Fulton.................................Clark Adams..........................662-862-27235. Caney Creek................................. 28,000.............................Forest.................. Art Bradshaw / Gary Crumpton............601-537-35556. Caston Creek................................ 29,875.......................... Meadville............................... A.J Smith............................601-384-36067. Chickasaw.................................... 27,259........................... Houston.................... Matt Gray / Doug Swords................662-447-01418. Chickasawhay............................. 122,740............................Laurel.................... Ronnie Hurst / Jay Landrum..............601-344-06009. Choctaw....................................... 24,314..........................Ackerman.............................. John Taylor...........................662-285-692810. Copiah County............................. 6,583...........................Hazlehurst.............................Allen Patrick..........................601-277-363611. Divide Section............................. 15,337...............................Iuka........................David Overby / Tim Ryan.................662-423-145512. Graham Lake Waterfowl............... 1,400..............................Oxford...............................Bobby Young..........................662-234-612513. Hamer.......................................... 4,000..............................Sardis..................................Walt Hardy...........................662-563-633014. Hell Creek.................................... 2,284..........................New Albany............... Steve Coleman / Jack Griffin..............662-685-450815. John Bell Williams....................... 2,938..............................Fulton................................. John Tigner...........................662-862-272316. John W Starr............................... 8,244............................Starkville.............................Wayne Gordon........................662-840-517217. Lake George................................. 8,383...........................Holly Bluff.............................Scottie Jones .........................662-828-344918. Leaf River................................... 42,000........................... Wiggins............................. Le Don Cooley.........................601-598-232319. Leroy Percy.................................. 1,642...........................Hollandale.............................Scottie Jones..........................601-859-342120. Little Biloxi.................................. 14,540...........................McHenry............................ Dwight Morrow........................601-928-372021. Mahannah................................... 12,675.......................... Redwood...............................Lee Harvey...........................601-636-204522. Malmaison................................... 9,696..........................Greenwood...............Dale Adams / Shannon Chunn.............662-453-540923. Marion County............................. 7,200........................... Columbia............................Danny Stringer........................601-736-006624. Mason Creek............................... 28,000............................Richton................................ Ted Hooper...........................601-928-372025. Muscadine Farms..........................700.................................Avon.................................Scottie Jones..........................601-859-342126. Nanih Waiya................................. 7,655......................... Philadelphia...........................Larry Waddell.........................662-724-277027. Okatibbee..................................... 6,883.......................... Collinsville................Randy Akins / Brent Baucum..............601-737-583128. O’Keefe........................................ 6,239............................ Lambert..............................Robbie Kiihnl..........................662-326-802929. Old River..................................... 14,764..........................Poplarville............................ Patrick Rush..........................601-772-902430. Pascagoula River........................ 37,124...........................Lucedale................................. Ben Hare.............................601-947-6376Moss Point.......................... Michael Everett........................228-588-387831. Pearl River................................... 6,925............................. Canton...........................Nathaniel Emerson.....................601-859-342132. Red Creek................................... 91,139........................... Wiggins...............................Doyce Bond...........................601-928-429633. Sandy Creek................................ 16,407............................Natchez................................. Mark Reid............................601-835-305034. Sardis Waterfowl......................... 4,000..............................Oxford............................... Vic Theobold..........................662-236-976235. Shipland....................................... 3,642..........................Mayersville....................... Michael Thompson.....................662-873-933136. Stoneville..................................... 2,500..............................Leland................................Scottie Jones..........................601-859-342137. Sunflower................................... 58,480........................ Rolling Fork................Bobby Hodnett / Jason Kerr..............662-828-345638. Tallahala...................................... 28,120.......................... Montrose.............................Brian Gordon..........................601-739-367139 Trim Cane........................................891..............................Starkville.............................Wayne Gordon........................662-840-517240. Tuscumbia................................... 2,436............................. Corinth............................. Jimmy Drewery........................662-284-074041. Twin Oaks.................................... 5,675......................... Rolling Fork...........................Scottie Jones..........................601-859-342142. Upper Sardis............................... 42,274.............................Oxford...............................Bobby Young..........................662-234-612543. Ward Bayou................................ 13,234.........................Moss Point.............................Lynn McCoy..........................228-826-101244. Wolf River................................... 10,881..........................Poplarville.......................... Ricky McDaniel........................601-795-868245. Yockanookany.............................. 2,379.............................McCool................................ Brad Holder...........................662-563-633062006-2007 Mississippi Deer Program Report
Table 1. Wildlife Management Area Harvest Informationfor the 2006-2007 SeasonWildlife Total Buck Doe Total Mandays/ Mandays/Management Area Acreage Harvest Acres/Deer Harvest Acres/ Buck Harvest Acres/Doe Mandays Deer AcreBienville*Black PrairieCalhoun County*Canal/John BellCaney Creek*Caston Creek*Chickasaw*Chickasawhay*Choctaw*Copiah County*Divide Section*Hamer*Hell CreekJohn Starr*Lake George*Leaf River*Leroy Percy*Little Biloxi*Lower Pascagoula*Mahannah*Malmaison*Marion County*Mason Creek*Nanih WaiyaOkatibbeeO’Keefe*Old River*Pearl RiverRed Creek*Sandy Creek*Shipland*Stoneville*Sunflower*Tallahala*TuscumbiaTwin Oaks*Upper Pascagoula*Upper Sardis*Ward Bayou*Wolf River*Yockanookany*TOTAL25,3005,8259,88832,50030,90027,78528,31935,00024,3146,58315,3363,9092,5008,2448,38341,4112,20014,98018,73512,67510,0167,20027,3467,6556,8836,10015,0426,00083,34516,4073,6422,00060,11528,0002,6005,67520,48242,00013,23410,3012,483731,31374295713163449875111776076128115651019181528580286129629n/a1736281295746701216926372,21234220117324849063128946721985256512081025596372207881,0418311890977125237981,671n/a4,903456130167633378433811,7072496,61716435554736831922505446169284338376101446244723169316n/a1622125493152097622911,0154698322753921,6261,2635666485294111,7041406252501,0481,1193671,4981,3382764171531,1894787651972,507n/a5,2097463044001,2279035202842,2765536,6173552,483202221484422482165615148848728494106613354520313n/a114167463515039303461,1891,2652654716777021,2635901,667374108301813131721,1981,4795501,6644,6841201642185,4691703441975,014n/a83,3451,1722282861,3078002,6001146,82745203034141,9241031,9903,9122,3472,8876,2812,8295,6557292,9021,2701801,9332975,7945541,9951,5841,7551,7272,1011,7511,4209831,825360n/a4,0032,6288405903,7711,9242529808928,9951,1123,03516686,27626435303766643851948171524208955105881220266323342940n/a23573304940264214745355648240.080.020.200.120.080.100.220.080.230.110.190.320.070.230.040.140.250.130.080.140.170.290.060.190.140.300.02n/a0.050.160.230.300.060.070.100.170.040.210.080.290.07AVERAGE17,837 55 667 25 1,074 30 3,266 2,157 58 0.15WMA with minimum inside spread criteria for legal bucks.*WMA Data2006-2007 Mississippi Deer Program Report7
Wildlife Management Area DirectorynOrtHWestBobby YoungConservation OfficerUpper SardisVic TheobaldConservation OfficerSardis WaterfowlDonnie CainConservation OfficerCalhoun CountyWalt HardyConservation OfficerHamerDalton AdamsConservation OfficerMalmaisonRobbie KiihnlConservation OfficerO’KeefeShannon ChunWildlife ManagerMalmaisonsOutHWestWMa DirectoryKallumHerringtonWMA SupervisorPatrick RushConservation OfficerOld RiverAJ SmithConservation OfficerCaston CreekRicky McDanielConservation OfficerWolf RiverMark ReidWildlife ManagerSandy CreekMed PalmerWildlife ManagerCopiah CountyDanny StringerConservation OfficerMarion CountysOutHeAstWest centrAlDwight MorrowWildlife SupervisorBen HareWildlife ManagerUpper PascagoulaRonnie HurstConservation OfficerChickasawhayTed HooperConservation OfficerMason CreekJay LandrumWildlife ManagerChickasawhayBobby HodnettConservation OfficerSunflowerJason KerrConservation OfficerSunflowerLynn McCoyWildlife ManagerWard BayouMichael EveretteConservation OfficerLower PascagoulaLe Don CooleyWildlife ManagerLeaf RiverRonnie LeeWildlife ManagerLittle BiloxiMike ThompsonConservation OfficerShiplandNathanielEmersonWildlife ManagerPearl River82006-2007 Mississippi Deer Program Report
Wildlife Management Area DirectorynOrtHeAst centrAldeltATim BrinkleyWildlife SupervisorJohn TaylorConservation OfficerChoctawWayne GordonWildlife ManagerJohn Starr ForestSteve ColemanConservation OfficerHell CreekScottie JonesWMA SupervisorLee HarveyConservation OfficerMahannahMatt GrayConservation OfficerChickasawJack GriffinWildlife ManagerHell CreekDoug SwordsWildlife ManagerChickasawnOrtHeAstWMa DirectoryDoug EppsWildlife SupervisorJimmy DreweryWildlife ManagerTuscumbiaDavid OverbyConservation OfficerDivide SectionClark AdamsConservation OfficerDivide SectionTim RyanConservation OfficerDivide SectionJohn TignerWildlife ManagerJohn Bell WilliamseAst centrAlPaul WindhamWildlife SupervisorLarry WaddellConservation OfficerNanih WaiyaRandy AkinsConservation OfficerOkatibbeeBrent BaucumWildlife ManagerOkatibbeeClayton LottConservation OfficerBeinvilleBrian GordonWildlife ManagerTallahalaArt BradshawConservation OfficerCaney Creek2006-2007 Mississippi Deer Program Report9
2006-2007 WMA Deer Harvest NarrativesChickasaw WMAWMa narrativesBienville WMAWritten by: Chad M. DacusBienville WMA is a 31,000 acre area within the Bienville National Forest located north of2005-2006 ................87 .............. 1,806Morton. For the third year bucks must have 4 or more antler points and an inside spread of 122006-2007 ................74 .............. 1,924inches or more to be legal for harvest and antlerless deer had to weigh at least 65 pounds liveweight. The 2006 – 2007 season was the second year where antlerless deer were legal for harvest during gun season. Antlerless deer werelegal for harvest on the 2 statewide doe days.Deer harvest numbers consisted of 54 bucks and 20 does. Total harvest decreased by 15% from last year but hunter effort increased by107%.Habitat conditions on Bienville WMA improved over the years due to management for the Red-cockaded woodpecker, which is an endangeredspecies that resides on the WMA. However, Hurricane Katrina damaged much of the hardwoods along creeks across the area. TheMDWFP has proposed new openings in timber thinning/harvest areas which will provide additional food sources for wildlife.As deer populations continue to grow in response to habitat improvements on the area, it has become necessary to increase antlerlesshunting opportunities. For the 2007-2008 season, antlerless hunting opportunities on Bienville WMA will include archery season, primitiveweapon season, and during the still the gun without dogs season (December 15 – 23). This is the first year for antlerless opportunity duringthe gun without dogs season.Black Prairie WMAWritten by: Jerry HazlewoodSeasonHarvestMan-days2004-2005 ................60 .............. 2,931Black Prairie WMA offers a lottery draw hunt that has provided a very high success rate during the past several years. Hunter effort andharvest were both significantly lower than previous years, with a harvest this year of 7 bucks and 22 does. Overall harvest, doe harvest, andbuck harvest decreased 46% each. Man-days of effort decreased 73% but harvest success doubled from 14% in 05-06 to 28% in 06-07.There were no significant changes in deer hunting regulations, opportunity, or bag limits to account for the decrease in man-days of effort.We offer two possible reasons for the decline. Because the application process was available online for the first time this past season, manyhunters may have applied due to the ease of the application process but their desire to hunt the area was limited. The second possibleexplanation is that unseasonably warm, dry winter discouraged hunters from hunting.SeasonHarvestMan-days2004-2005 ................53 ................. 3732005-2006 ................54 ................. 3772006-2007 ................29 ................. 103Doe body weights were higher than the 5 year average but lactation rates were somewhatlower . Hunters who desire a quality buck are passing up young bucks and waiting for an opportunityto harvest a mature buck; therefore, fewer yearling bucks are being harvested. Theresult is an increase in buck quality because bucks are allowed to grow older. Habitat quality ismaintained by keeping the deer population below carrying capacity, planting supplemental foodplots, in addition to planting summer agriculture crops on approximately 1,600 acres.102006-2007 Mississippi Deer Program Report
2006-2007 WMA Deer Harvest NarrativesCalhoun County WMAWritten by: Brad HolderCalhoun County WMA is a 10,900-acre area located near Bruce, MS in Calhoun County. This area is unique because it offers extensiveopportunity to those who hunt deer with dogs. Deer man-days increased by 29% compared to the 2005-2006 season. Harvest on the WMAcontinues to be skewed towards bucks. Thirty-six bucks and 21 does were harvested this pastseason. We would like to see more does than bucks harvested during future seasons. Buck anddoe weights and lactation were down 5-15% for 1.5 and 2.5 year old classes compared to pastseasons. However, buck weights for 3.5 and 4.5+ year old classes increased slightly, althoughdata was from a small sample size. Antler indices increased slightly for all age classes duringthe 2006-2007 season. Weights and lactation rates for 3.5+ does increased significantly. Again,sample sizes were low (3 does). Those who hunt deer without dogs continue to find huntingSeason Harvest Man-days2004-2005.................40............... 1,7392005-2006.................57............... 1,4062006-2007.................57............... 1,990conditions less favorable in the aging pine stands on Calhoun County WMA. The canopy closure occurring in the mid-rotation pine standsand 2-4 year old clearcuts on most of the WMA are making it harder to encounter deer. However, timber thins and small clear-cuts continueto improve habitat to an extent. The logging decks and lanes provide additional areas that can be planted or maintained as openings. Acornproduction was low on the area. Food plots were slow to develop until cooler temperatures and increased rainfall arrived during November.Canal Section and John Bell Williams WMAsWritten by: Jerry HazelwoodCanal Section WMA (32,500 ac.) and John Bell Williams WMA (3,000 ac.) share common boundaries and harvest data is combined.These areas stretch approximately 54 linear miles along the west side of the Tennessee-Tombigbee Waterway from MS Hwy. 4 at BaySprings Lake to 5 miles south of MS Hwy. 45 at Aberdeen. These WMAs lie in Tishomingo, Prentiss, Itawamba, and Monroe counties.During the past deer season, a total of 3,912 man-days were recorded for deer hunting with a harvest of 131 deer, consisting of 83bucks and 48 does. The majority of usage and harvest occurred during the gun seasons with 2003 man-days and 55 bucks harvested (doeharvest was not allowed during gun season). The man-day usage total increased 25% while harvest increased 96%. There were no changesin regulations or habitat to explain these increases.Antlered buck harvest criteria and bag limit are the same as statewide. Approximately 250 acres of the area is handicapped hunting only,200 acres is archery only and 100 acres is primitive weapon only for deer hunting.The WMAs have 164 winter food plots and 79 summer food plots. The winter food plots onthe area did not do well due to late acquisition of seed and fertilizer which led to late plantingdates with little or no seed bed preparation. Acorn production throughout the WMA was verypoor.Season Harvest Man-days2004-2005...............133............... 3,9292005-2006.................67............... 3,1402006-2007...............131............... 3,912Caney Creek WMAWritten by: Chad M. DacusCaney Creek WMA is a 31,000 acre area within the Bienville National Forest located near Forest. For the third year bucks must have 4 ormore antler points and an inside spread of 12 inches or more to be legal for harvest and antlerless deer had to weigh at least 65 poundslive weight. The 2006 – 2007 season was the second year that antlerless deer were legal for harvest during gun season. Antlerless deerwere legal for harvest on the 2 statewide doe daysDeer harvest numbers consisted of 19 bucks and 44 does. Total harvest decreased by 21% from last year and hunter effort decreasedslightly. This is the fourth year in a row that reported hunter effort and harvest has decreased. This could be attributed to an actual decreasein effort or hunters are becoming more apathetic in regards to filling out permit cardsSeason Harvest Man-days2004-2005...............111............... 3,3332005-2006.................79............... 2,3712006-2007.................63............... 2,347when hunting on the area. Hunter apathy can also account for the reduction in reported deerharvested.Historically, antlerless harvest was by permit only during the gun seasons and duringarchery and primitive weapon seasons. This year antlerless deer were legal for harvest on the 2statewide doe days.During the 2007 – 2008 season, the antlerless opportunity during gun season will be available during archery, primitive weapon seasonsand during the gun without dogs season (December 15 – 23). This is the first year for antlerless opportunity during the gun without dogsseason.Measures are being taken to improve habitat conditions on the area. The U. S. Forest Service conducted timber harvest operations onCaney Creek WMA and continue spring prescribed burns, which should increase available browse for deer and other wildlife. As a resultof the timber harvest operation, the MDWFP will be allowed to maintain several areas as permanent wildlife openings, which will improvehabitat conditions on the area for years to come.WMA Na r r at i v e s2006-2007 Mississippi Deer Program Report11
2006-2007 WMA Deer Harvest NarrativesCaston Creek WMAWritten by: Josh MoreeSeason Harvest Man-days2004-2005.................65............... 4,4362005-2006.................61............... 2,6932006-2007.................44............... 2,887Caston Creek WMA is a 27,785-acre WMA located within the Homochitto National Forest.Total reported deer harvest decreased 28% for the 2006-2007 hunting season compared to the2005-2006 hunting season, with 44 deer harvested, which consisted of 22 bucks and 22 does.Total reported man-days for deer hunting increased by 7% compared to the previous season.The increase in man-days was likely due to conditions returning to normal after Hurricanes Katrina and Rita. A 12-inch minimum insidespread regulation has been in effect on Caston Creek WMA for three hunting seasons. The buck harvest decreased 39% from the 2005-2006 buck harvest.Chickasaw WMAWritten by: Brad HolderChickasaw WMA is a 28,000-acre area located within the Tombigbee National Forest near Houston, MS in Chickasaw County. Deer huntingactivity increased by 9% compared to the 2005-2006 season; however, harvest decreased by 65%. A total of 50 bucks and 48 doeswere harvested which is a 9-season low. This past season’s buck:doe harvest ratio was almost even and much improved compared to the87 bucks and 64 does harvested during the 2005-2006 season. When comparing the 2006-2007 season to past seasons, harvest weightsfor bucks increased 10-22% for all but the 2.5 year old age class. Antler indices increased for all age classes as well. Doe weights increased5-12% for all age classes. Lactation rates increased significantly for 2.5 and 3.5+ year old does when compared to past seasons. Althoughharvest hit a 9-year low, herd health indices continue to improve which indicates a better managed herd. Winter food plots planted inSeason Harvest Man-days2004-2005...............100............... 6,3172005-2006...............151............... 5,7322006-2007.................98............... 6,281clovers, oats, and wheat responded to cooler temperatures and increased rainfall in late falland early winter. Deer used food plots early and often due to the below average acorn crop.However, above average fall and winter temperatures served to decrease deer movements.Antler measurements appear to be increasing when compared to past seasons. Sportsmenand women continue to look forward to the potential that more progressive antler criteria suchas the 12-inch inside spread rule will unlock.WMA Na r r at i v e sChickasawhay WMAWritten by: Russ WalshChickasawhay WMA is a large U.S. Forest Service area spanning across 122,153 acres inJones and Wayne Counties. The fire maintained pine stands combined with scattered creeksand drains on the area attract many outdoor types. As with other southern WMAs, Katrinadampened Chickasawhay man-days during the 2005-2006 season. However, improved accessibilityto the area and more hunters having the ablility to go afield surged numbers for 2006-2007. The drought from the spring and summermonths provided a lower than average mast crop across the area. Increased sunlight from downed and logged timber should provide morebrowse for deer this summer. The surge in hunters increased man-days by 25% to 2,829. Harvest showed a strong increase of 55% to 75.Harvest included 54 bucks and 21 does. Work continues on the WMA to improved accessibility for the upcoming season.Choctaw WMAWritten by: Brad HolderChoctaw WMA is a 24,500-acre area located within the Tombigbee National Forest near Ackerman, MS in Choctaw County. Deer wereharder to come by on Choctaw WMA during the 2006-2007 season. Hunter effort was up significantly (48%) from the 2005-2006 seasonalthough harvest remained about the same. An increase in man-days may be attributed to continued visits from south Mississippi huntersstill displaced from the effects of Hurricane Katrina. Harvest comprised 46 bucks and 65 does this past season. Buck weights were up by4% when compared to past seasons, but doe weights and lactation were down, particularly among 2.5 year old class, by 10-43%. Thesenumbers along with a large percentage (58%) of 3.5+ year old does in the 2006-2007 totalSeason Harvest Man-days2004-2005...............106............... 3,1062005-2006...............107............... 2,9262006-2007...............111............... 5,655Season Harvest Man-days2004-2005.................66............... 3,4742005-2006.................34............... 2,1292006-2007.................75............... 2,829doe harvest indicate overpopulation. The acorn crop was less than desirable and caused deerto use food plots early and often. Habitat quality on the WMA continues to improve followingtimber management by the U.S. Forest Service and their prescribed burning program. The majorityof the food plots continue to be maintained in wheat, oats, crimson clover, and arrowleafclover mixtures which are better adapted to soil conditions on the WMA.Copiah County WMAWritten by: Josh MoreeCopiah County WMA is comprised of 6,583 acres owned by the State of Mississippi.Total reported man-days for deer hunting decreased 34% compared to the previous season. Total reported deer harvest decreased by 3deer for the 2006-2007 deer hunting season compared to the previous season. A total of 77 harvested deer were reported, which consisted122006-2007 Mississippi Deer Program Report
2006-2007 WMA Deer Harvest Narrativesof 16 bucks and 61 does. Buck harvest decreased 54% compared to the previous season. A12-inch minimum inside spread regulation has been in effect on Copiah County WMA sincethe 2004-2005 hunting season. The purpose of this regulation is to protect 1.5 year old bucksfrom harvest. The regulation has been successful. Young bucks have been protected, huntershave reported more buck observations, and age of harvested bucks has increased.Season Harvest Man-days2004-2005.................73............... 2,0002005-2006.................80............... 1,1022006-2007.................77.................. 729Divide Section WMAWritten by: Jerry HazelwoodDivide Section WMA (15,300 ac.) lies along both sides of the Tennessee-Tombigbee Waterway from the northwest side of Bay SpringsLake northward to MS Hwy. 25 near Pickwick Lake. A small portion of the area is in Prentiss County and the remainder is in TishomingoCounty. This WMA annually undergoes intense habitat management in order to increase the value to wildlife and provide a quality huntingexperience. The WMA has 141 winter food plots and 78 summer food plots. The food plotsSeason Harvest Man-days2004-2005.................60............... 2,4792005-2006.................61............... 2,3892006-2007.................60............... 2,902range in size from one-half acre to one acre. Approximately one-third of the WMA is spoil area,which is material excavated during the construction of the Tennessee-Tombigbee Waterway.This acreage is very poor soil still in early stages of plant succession.Divide Section WMA is a primitive weapons only area for deer with a season bag limit of twoantlerless deer and one legal antlered buck. Regulations state that a buck must have 4 or moreantler points and an inside spread of 12 inches or more to be legal for harvest. Antlerless deermust weigh at least 65 pounds live weight. Approximately 950 acres of this area is devoted to youth and handicapped deer hunting. Youthand handicapped hunters may use modern firearms.The buck harvest was 9 in 2006-2007, which was a decrease of 1 from the 2005-2006 season. The antlerless harvest was 51, exactly thesame as last season. Man-days for deer hunting increased 21%.The winter food plots on the area did not do well due to late acquisition of seed and fertilizer which led to late planting dates with little orno seed bed preparation. Acorn production throughout the WMA was very poor.Hamer WMAWritten by: Brad HolderHamer WMA is a 4,000-acre area located near Sardis, MS in Panola County. The 2006-2007season marked the third deer season on the area. The WMA provides mostly bow huntingopportunity due to its layout of small upland woodlots. Man-days decreased slightly whenSeason Harvest Man-days2004-2005.................14.................. N/A2005-2006.................98............... 1,3882006-2007.................76............... 1,270compared to the 2005-2006 season. Twenty-eight bucks and 48 does were harvest during the 2006-2007 season. Buck harvest decreasedby 45% from the 2005-2006 season. This was expected due to the large buck harvest (53) during the 2005-2006 season. Warmer thanaverage fall and winter temperatures served to decrease deer activity during the daytime. Doe weights from the 2006-2007 season decreasedfor 2.5 and 3.5+ year old classes by 10% when compared to the previous 2 seasons. Lactation rates for the previously mentionedage classes decreased by 33% and 48%. Older does (3.5+) made up 43% of the total doe harvest which continues to indicate a large deerherd. Signs of browse pressure on native vegetation and agricultural crops support this. Buck weights and antler measurements increasedslightly when compared to the 2005-2006 season. Because antler data indicate good potential, more progressive antler regulations havebeen adopted for the 2007-2008 season on the WMA. A minimum inside spread of 15 inches or a minimum main beam length of 18 inchesshould protect younger, better quality bucks which should ensure more sightings of better deer in the future. A less than favorable acorncrop was offset by winter food plot plantings of clover, wheat, and oats and by the large agricultural fields on the area that were planted inwheat. Habitat conditions should continue to improve with large scale prescribed burning.WMA Na r r at i v e sHell Creek WMAWritten by: Jerry HazlewoodDeer hunting opportunity on this area is by draw only. Deer hunting activity and harvest on Season Harvest Man-daysHell Creek WMA decreased compared to recent hunting seasons. Man-day usage decreased 2004-2005.................10.................. 10845% from last season. There were no significant changes in deer hunting regulations, opportunityor bag limits to account for the decrease in man-days of effort. We offer two possible 2006-2007.................12.................... 992005-2006.................16.................. 180reasons for the decline. Because the application process was available online for the first timethis past season, many hunters may have applied due to the ease of the application process, but their desire to hunt the area was limited.The second possible explanation is that unseasonably warm, dry winter discouraged hunters from hunting.The deer harvest of 12 deer (4 bucks, 8 does) was a 25% decrease from last year, but the overall success rate increased from 9% to12%. Body weights were average for this area during 2006-2007. Habitat management efforts to improve 400 acres of mid-rotation pineplantations by drastically thinning the stands should be beneficial to white-tailed deer on Hell Creek WMA. Much of the open farmland isleased to local farmers and the extreme drought conditions during the early summer of 2007 have limited production of soybeans and cornand could impact the availability of deer food on Hell Creek WMA.2006-2007 Mississippi Deer Program Report13
2006-2007 WMA Deer Harvest NarrativesJohn Starr Forest WMAWritten by: Brad HolderSeason Harvest Man-days2004-2005.................80............... 1,5152005-2006.................88............... 1,2732006-2007.................81............... 1,933John Starr Forest WMA is an 8,244-acre area located near Starkville, MS in OktibbehaCounty. Deer harvest continues to remain fairly consistent on the area. Thirty-three bucksand 48 does were harvested this past season. Man-days were up 35% from last year. Thiswas probably due to continued visits from Gulf Coast hunters displaced from the impacts ofHurricane Katrina. Harvested deer weights and doe lactation were down compared to last season. Weights and lactation rates for 2.5 yearold does decreased by 9% and 71%. Weights and lactation rates for 3.5+ year old does were similar in pattern but decreases were not asdrastic. Buck weights and antler measurements were similar to past seasons with a slight increasing trend for 3.5 year old bucks. Acornproduction on the area was similar to many other parts of the state with low abundance causing deer to hit clover, oats, and wheat plotsearly and often. Food plots were slow to get started but began to grow well when temperatures cooled and rainfall increased in late fall andearly winter. The development of new food plots, pine timber management in the form of prescribed burning and thinning, and increasedharvest should help to increase health indices of the deer herd.Lake George WMAWritten by: Jackie FleemanLake George WMA is an 8,383-acre tract consisting primarily of 15 year-old replanted bottomland hardwood timber. The 2006 – 2007season was the fourth year requiring legal bucks to have a 15-inch minimum inside spread. Also, hunters could apply for a tag that wouldallow them to harvest a buck with at least one unforked antler for research purposes . Both of these regulations appear to be supported bythe majority of the deer hunters in the area. Nineteen of these special buck tags were given out for use on Lake George WMA, and nonewere turned in as being used. Deer hunting man-days increased from 286 in 2005 – 2006 to 297 in 2006 – 2007. Buck harvest increasedfrom 7 to 8, and doe harvest remained at 7. Body weights were excellent on bucks and does, and antler indices were outstanding as well.Buck harvest consisted of 2½, 3½, and 4½ year-old bucks.Season Harvest Man-days2004-2005.................10.................. 2222005-2006.................14.................. 2862006-2007.................15.................. 297Rainfall was consistent until late summer and early fall, which resulted in high browseavailability. Mast crop production was good where available, but most of the trees were notold enough to produce mast. Warm weather and abundant food limited deer movement duringmuch of the winter. This area has a fairly low deer density, but the herd is growing in numbersand in buck quality, which is due to excellent deer habitat.WMA Na r r at i v e sLeaf River WMAWritten by: Russ WalshSeason Harvest Man-days2004-2005...............111............... 6,8812005-2006.................41............... 3,7882006-2007.................65............... 5,794Leaf River is one of, if not the most, storied WMAs in Mississippi. The rich history and excellenthunting make this area a popular draw for south Mississippi hunters. The 41,411-acreWMA, located in Perry County, is a mix of fire-maintained pine stands and scattered creeksand drains. Reported man-days for Leaf River WMA rose by 34% to 5,794 this season. Mostof the area was accessible to hunting after much effort to get roads cleaned and food plots planted. Harvest was also up from 41 to 65(37%), with 37 bucks and 28 does harvested. The creation of new openings from Hurricane Katrina coupled with fresh burned areas shouldprovide excellent browse this year. Conditions will further improve with the recent addition of a new wildlife manager.Leroy Percy WMAWritten by: Jackie FleemanSeason Harvest Man-days2004-2005...................8.................. 4882005-2006.................12.................. 4722006-2007.................10.................. 554Leroy Percy WMA is located about 5 miles west of Hollandale on MS Hwy 12. Only primitive weapons and archery equipment are allowedfor deer hunting. Deer harvest consisted of 6 bucks and 4 does, which is down slightly from 5 bucks and 7 does harvested during the 2004– 2005 season. This was the fourth year that regulations required legal bucks to have a minimum 15-inch inside spread. Also, hunterscould apply for a tag that would allow them to harvest a buck with at least one unforked antler for research purposes. Nineteen tags wereissued and no tags were turned in as being used. Hunting pressure this season was up slightly at 554 man-days compared to 472 mandayslast season. Deer body weights declined slightly. Lactation rates for 3½+ year-old doeswere low at 50%; however, this sample size was small. Buck indices declined slightly but arealso based on a small sample size. Average rainfall during summer and fall resulted in goodbrowse conditions. The amount of browse is diminishing due to shading caused by canopyclosure. Some timber harvest in the form of thinning is needed. Acorn production was fair. Themild winter resulted in limited deer movement which caused a reduction in deer sightings.142006-2007 Mississippi Deer Program Report
2006-2007 WMA Deer Harvest NarrativesLittle Biloxi WMAWritten by: Russ WalshThe 15,622-acre Little Biloxi WMA is a popular hunting destination for many coastal countyresidents. Access to roads and food plots across the hurricane ravaged area was muchimproved for the 2006-2007 season. Man-days showed a significant increase of 66% (1,995)over the previous hunting season. Reported harvest also increased to pre-hurricane numberswith 10 bucks and 9 does harvested. Conditions will continue to improve on the WMA with therecent addition of a wildlife manager.Season Harvest Man-days2004-2005.................19............... 2,7132005-2006...................6.................. 6622006-2007.................19............... 1,995Mahannah WMAWritten by: Jackie FleemanMahannah WMA is a 12,675-acre area located approximately 12 miles north of Vicksburg. Deer hunting is by permit only except for theJanuary archery hunt which is open to the public. This was the fourth year under the regulations that required legal bucks to have a 15-inchminimum inside spread. Also, hunters could apply for a tag that would allow them to harvest a buck with at least one unforked antler forresearch purposes. Four hundred twenty-four of these special buck tags were issued on Mahannah WMA and sixteen were turned in asbeing used. Both of these regulations appear to be supported by the majority of deer hunters on the area. Deer man-days decreased slightlyto 1,755. Deer harvest increased to 152. Doe harvest increased from 51 to 106 due to hunters being entered in a draw for a special huntif they harvested an antlerless deer. Buck harvest decreased from 75 to 46. Buck condition indices remained good with weights remainingstable and antler measurements increasing slightly. Lactation rates were very good at 86% for 3½+ year-old does, and 64% in 2½year-old does. Doe body weights remained stable at 125 pounds for 3½+ year-old does. The percent of 3½+ year-old does in the harvestremained good at 42%. Below normal rainfall for much of the summer and fall resulted in fairSeason Harvest Man-days2004-2005.................87............... 1,4592005-2006...............126............... 1,7662006-2007...............152............... 1,755browse conditions. Acorn production was poor in most species but good in overcup. The warmweather during much of the winter resulted in limited deer movement which caused a reductionin deer sightings.A deer herd health evaluation was conducted on Mahannah WMA on February 19, 2007. Atotal of twelve does were collected with two does being 1.5 years old, and ten does being 2.5years old or older. Overall, the current herd health indices on Mahannah WMA are below theexpected values for the WMA and the region as a whole. Dressed weight, reproductive potential, and kidney fat indices are all lower thanthe expected values for the WMA and region. Reproductive timing is slightly late with a mean breeding date of January 6. The reproductiverate is higher than normal. One primary concern is that the range of conception dates was almost 2 months long. Conception dates rangedfrom December 9 until February 5The deer herd health evaluation suggests that the decreased antlerless harvest in 2004 and 2005, coupled with the poor browse conditionsin the summer and winter of 2006 and the poor acorn production in 2006, has caused a decrease in the overall health of the antlerlesspopulation on Mahannah WMA. A selective timber harvest was started in 2006 to increase browse and an intensified antlerless harvestprogram was begun in 2006 to help in future years of poor habitat conditions. Hopefully, these management practices will reverse the currenttrends.Malmaison WMAWritten by: Brad HolderMalmaison WMA is a 9,483-acre area located near Grenada, MS in Grenada and Carroll Counties. Twenty-four bucks and 61 does wereharvested during the 2006-2007 season. Man-days were at a 3-season low; however harvest remained similar to last season. Annualharvest continues to follow a decreasing trend particularly when compared to 1997-2005seasons when doe harvest regularly surpassed triple digits. Man-days have decreased over the Season Harvest Man-dayspast three seasons. Doe weights, particularly in the 2.5 and 3.5+ year old classes, decreasedby 7% and 11% compared to past seasons. The lactation rate for 2.5 year old does decreasedby 43% when compared to past seasons. Buck weights seem to be stable or increasing in each2004-2005...............118............... 2,8602005-2006.................89............... 2,3942006-2007.................85............... 1,727age class. Deer density appears to be fairly high as indicated by summer browse pressure onnative vegetation and food plots, decreasing doe weights and lactation, and a large percentage of 3.5+ year old does in this past season’stotal doe harvest. Antler measurements seem to be improved when compared to years past. This is probably due to progressive antlerregulations on the area which many hunters support. Acorn production from white and red oaks was average to below average this year.Deer used food plots early and often this past season. Above average winter temperatures seemed to reduce deer movements. Winter foodplots developed well following cooler temperatures and increased rainfall in late fall and early winter.WMA Na r r at i v e s2006-2007 Mississippi Deer Program Report15
2006-2007 WMA Deer Harvest NarrativesMarion County WMAWritten by: Josh MoreeMarion County WMA is comprised of 7,200 acres owned by the State of Mississippi. Total reported deer harvest increased 63% forthe 2006-2007 hunting season compared to the 2005-2006 hunting season, with 80 deer harvested consisting of 47 bucks and 33 does.Compared to the 2005-2006 season, buck harvest increased by 35 bucks; however, doe harvest remained stable. The increase in buckSeason Harvest Man-days2004-2005.................64............... 1,9312005-2006.................49............... 1,3882006-2007.................80............... 2,101harvest is largely due to the increase in reported man-days for the 2006-2007 deer season.Also, a 12-inch minimum inside spread regulation was implemented for the first time duringthe 2005-2006 hunting season. This protected many 1.5 year old bucks that normally wouldhave been harvested under the old 4-point regulation. This protection is the goal of using the12-inch regulation. Hunters have reported more buck observations and age of harvested buckshas increased.Total reported man-days for deer hunting increased by 34% compared to the previous season. The increase in man-days was mostlikely due to more hunters returning to the area after conditions began to return to normal after Hurricane Katrina. Katrina caused extensivetimber damage on Marion County WMA. Due to downed timber, access was physically challenging in many parts of the area during the2005-2006 season. Timber salvage operations prior to the 2006-2007 deer season improved hunter access throughout the area.Mason Creek WMAWritten by: Russ WalshSeason Harvest Man-days2004-2005.................21............... 1,3602005-2006.................19............... 1,7442006-2007.................28............... 1,751The 27,272-acre Mason Creek WMA, located in Greene County, adjoins the larger ChickasawhayWMA to the south. Hunter compliance continued to improve this year with the continuedpresence of a full-time area manager. While there is no check-in station on Mason Creek,hunters are still required to record harvests on the daily permit card. Man-days for the 2006-2007 season increased slightly to 1,751.Reported harvest showed a much improved increase of 32% to 28. Of these, 23 were bucks and 5 were does. In addition to improvinghunter compliance, the area manager is working to increase food plot programs on the area.WMA Na r r at i v e sNanih Waiya WMAWritten by: Jerry HazlewoodMan-days of deer hunting effort for the 2006-2007 season increased 66% from the previous year. Total deer harvest included 16 bucksand 45 does, very similar to last year’s harvest. Harvest success decreased from 6% in 2005-2006 to 4% in 2006-2007.No significant differences were noticed in the 2006-2007 doe weights compared to the previous five year average. Minimum weight limitsfor legal harvest were implemented in the 2004 – 2005 season and continue to be effective at limiting the number of fawns harvested.The lactation rate for mature does was 51%, which is the average for the past five years.Season Harvest Man-days2004-2005.................47............... 1,0172005-2006.................52.................. 8542006-2007.................61............... 1,420Deer hunting opportunity on the WMA is largely dependent upon rainfall and water levelsin the Pearl River. The dry fall and winter experienced during the deer season allowed forgood hunter access throughout the WMA. Wind damage to trees from Hurricane Katrina wassignificant and many access roads were blocked for the 2005-2006 season. The primary roadsystem on the WMA was opened before the beginning of the 2005-2006 deer season, but thenortheastern half of the area remained inaccessible to hunters. However, due to the hard work of WMA personnel and their supervisor,nearly all access trails were opened by the beginning of the 2006-2007 season. Likewise, timber blockages along the length of the PearlRiver, within the bounds of the WMA, were removed therefore increasing boat access. The increase in man-days was likely attributable tothe increase in hunter access.After seven hunting seasons on this WMA, deer hunting potential remains largely untapped, particularly in the more remote areasthroughout the WMA. The early successional habitat which comprises most of the WMA has provided an abundant food supply for deer.Populations continue to remain at higher levels than when mature hardwood timber dominated the area. The early successional habitatwhich provides abundant deer forage, however, is quickly changing and will be reaching a closed-canopy stage in 3 – 6 years over most ofthe WMA. The openings created by Hurricane Katrina in areas with mature hardwoods will provide a short-term increase in the amount ofdeer browse available. In an effort to manage deer populations, doe harvest opportunity extends throughout the entire length of the deerseason.Okatibbee WMAWritten by: Jerry HazlewoodMan-days increased 117% from the previous year. Total deer harvest was 29, which included9 bucks and 20 does. This is a 107% increase from the previous year’s harvest. Harvestdata indicated that doe weights across all age classes were not significantly different fromthe previous five year average. The lactation rate for mature does was 88%, compared to lastyear’s rate of 67%.Season Harvest Man-days2004-2005.................11.................. 6092005-2006.................14.................. 4512006-2007.................29.................. 983162006-2007 Mississippi Deer Program Report
2006-2007 WMA Deer Harvest NarrativesHurricane Katrina has had a lasting impact on the WMA. Timber damage from sustained, hurricane-force winds ranged from 5% to 75%of the standing timber. High winds damaged stands of mature, bottomland hardwood more than upland stands of mixed pine and hardwood.Downed timber from the hurricane was scattered throughout much of the WMA, and hunters were unable to access large portionsof the area. However, due to the hard work of WMA personnel and their supervisor, nearly all access trails were opened by the beginning ofthe 2006-2007 season. The increase in man-day usage is most likely due to increased hunter access.Below average rainfall during the previous spring and early summer limited browse in areas which receive adequate sunlight. Browsepressure on summer food plots was heavy. Winter food plots, however, yielded low returns because of an exceptionally dry fall and winterand late planting dates.Timber management practices are being implemented to increase production of deer browse. Most of the mature, upland pine standshave been thinned and burned. Most Hurricane Katrina timber salvage efforts are complete. As a result of Katrina, the mature, closed-canopybottomland hardwood stands which dominated most of the area have had the ecological impact of a timber thin. Although such areaswill be difficult for hunters to access, the amount of deer browse generated will continue to provide quality habitat for deer on the WMA.O’Keefe WMAWritten by: Brad HolderO’Keefe WMA is a 5,919-acre area located near Lambert, MS in Quitman County. Man-daysand harvest have continued to increase on the area over the past 9 seasons. Thirty-one bucksand 31 does were harvested during the 2006-2007 season. Buck weights seem to be stable orSeason Harvest Man-days2004-2005.................54............... 1,3662005-2006.................60............... 1,6152006-2007.................62............... 1,825slightly increasing when compared to past seasons. Doe weights and lactation rates decreased 3-11%. Lower doe weights, lactation rates,and a large percentage (52%) of 3.5+ year old does in this past season’s harvest indicate an overpopulated deer herd. An average to belowaverage acorn crop on the area may have also contributed to lower weights. This area is surrounded by crop land which provides above averagesummer and winter forage. Area food plots of clover, oats, and wheat developed well particularly later in the fall and early winter andwere used early and often. Hunters indicated lower deer sightings. This was probably due to above average winter temperatures. Hunterscontinue to support more progressive antler regulations on the area such as the 15-inch minimum inside spread.Old River WMAWritten by: Russ WalshOld River WMA was in the direct path of Hurricane Katrina as it roared through south Mississippi.Season Harvest Man-daysIt was estimated that 70% of the prime bottomland hardwood on the 15,408-acre areawas left a tangled, ravaged mess. Logging operations are still ongoing in an effort to salvageand clean up the area. It will take decades, if not longer, for the area to return to pre-storm conditions.2004-2005...................5.................. 4102005-2006...................5.................. 2072006-2007...................9.................. 360Although access was tough, man-days increased 42% to 360. Harvest also increasedfrom 5 to 9 (44%) with 6 bucks and 3 does. The large areas of new growth will provide excellent habitat for several years to come.Lower Pascagoula River WMAWritten by: Russ WalshLower Pascagoula River WMA is a mix of bottomland hardwoods traversing along the Pascagoula Basin in Jackson County. Parts of thearea were heavily damaged by Hurricane Katrina, with road access being a significant issue.Season Harvest Man-days As with other areas, increased sunlight from downed timber will provide excellent browse for2004-2005.................30............... 2,589 several years. The Hurricane Katrina hindered road and water access was greatly improved for2005-2006.................11............... 1,559 the 2006-2007 season. However, man-days only rose a slight 2% to 1,584. Harvest increased2006-2007.................18............... 1,584 39% to 18, with 14 bucks and 4 does.WMA Na r r at i v e sUpper Pascagoula River WMAWritten by: Russ WalshUpper Pascagoula River WMA lies within George County, and coupled with Lower Pascagoula,totals 37,124 acres. Continued work by area personnel following Hurricane Katrina 2004-2005...................2............... 2,081Season Harvest Man-daysimproved access and food plot plantings across the area. Although Hurricane Katrina hindered 2005-2006...................0.................. 341access during the 2005-2006 season, lack of hunter compliance was also a problem. The 2006-2007.................12.................. 8922006-2007 hunting season brought additional law enforcement to the area, thus helping toimprove the situation. Reported man-days increased 61% to 892 and harvest increased 100% to 12. Of the 12, 9 were bucks and 3 weredoes.2006-2007 Mississippi Deer Program Report17
2006-2007 WMA Deer Harvest NarrativesPearl River WMAWritten by: Chad M. DacusSeason Harvest Man-days2004-2005.................14............... 1,0462005-2006.................13.................. 7152006-2007................n/a................... n/aPearl River WMA is a 6,000 acre area along the Ross Barnett Reservoir north of Hwy. 43near Canton. There is a 1,500 acre Youth and Handicap Only area within the waterfowl refuge.Regulations state that a buck must have 4 or more antler points to be legal for harvest and antlerlessdeer had to weigh at least 65 pounds live weight. There were no reported deer harvested on the area. This can be directly attributedto no personnel assigned to the WMA.Habitat conditions on the WMA were favorable for deer with good browse and improvements will continue. A carbon dioxide well wasdrilled in the Youth and Handicap Only Area in the summer of 2007. As a result of this operation, Denbury Onshore will make improvementsto a 30-acre cutover area within Hurricane Lake and along roadsides within this area. Once the drilling is completed, the drill pad willbe maintained as a permanent wildlife opening.Red Creek WMAWritten by: Russ WalshRed Creek WMA is a 91,139-acre area spanning across Stone, George, and HarrisonCounties. Akin to Little Biloxi, the area is a popular draw for many coastal county residents.Reported man-days increased a slight 2% to 4,003 in the 2006-2007 season. Reported harvestalso increased 47%. Seventeen total deer were reported with 16 bucks and 1 doe. As withLower Pascagoula, increased law enforcement in the upcoming season will help to improve hunter compliance.Season Harvest Man-days2004-2005.................35............... 2,9502005-2006...................9............... 3,9332006-2007.................17............... 4,003Sandy Creek WMAWritten by: Josh MoreeSandy Creek WMA is a 16,407-acre WMA located within the Homochitto National Forest. The area manager position on this WMA hasremained vacant for the past four years. Only 36 harvested deer were reported during the 2006-2007 hunting season on Sandy Creek WMASeason Harvest Man-days2004-2005.................32............... 2,5712005-2006.................37............... 2,0122006-2007.................36............... 2,628(22 bucks and 14 does). Reported harvest decreased by one deer compared to the 2005-2006hunting season. Total reported man-days increased 31% compared to the 2005-2006 deerhunting season. The increase in man-days was likely due to conditions returning to normalafter Hurricanes Katrina and Rita. Reported deer harvest and man-days are expected to remainlow until the area manager position is filled on Sandy Creek WMA.WMA Na r r at i v e sSardis Waterfowl WMAWritten by: Brad HolderSardis Waterfowl WMA is a 2,480 acre-area located north of Oxford, MS in Lafayette County. Sardis Waterfowl WMA’s four-day, drawyouth hunt affords young hunters a unique opportunity to hunt an unpressured, high density deer herd. Sixteen bucks and 8 does wereharvested during the 2006-2007 season. This follows a continued trend of greater buck than doe harvest. Harvest weights for both sexesas well as lactation rates remain consistently below average for the Upper Coastal Plain soilregion by 10-25%. Hunters reported numerous sightings this past season and usually optedto pass up does for a shot at a buck. Low lactation rates, low weights, and numerous deerobservations suggest overpopulation. Supplemental plantings like clover, wheat, and oats werecropped low throughout the season by heavy browsing pressure. Acorn production was lowon the area. Habitat on the area should see improvement within the next couple of years due toSeason Harvest Man-days2004-2005.................42.................. 1122005-2006.................20.................... 782006-2005.................24.................... 96projected pine stand thins and prescribed burning. An additional 2-day hunt has been added for the upcoming 2007-2008 season in hopesof increasing doe harvest. Youth who harvest does during their regular draw hunt will be qualified for the additional draw hunt.Shipland WMAWritten by: Jackie FleemanShipland WMA is the only state-owned land in the Batture soil region. The west boundary is the Mississippi River. Only primitiveweapons and archery equipment are allowed for deer hunting. The WMA consists of bottomland hardwood and an approximately 100-acresandfield. Timber thinning in the recent past has greatly increased the browse and escape cover on the WMA. This was the fourth year thatregulations required legal bucks to have a minimum 15-inch inside spread. Also, hunters could apply for a tag that would allow them toharvest a buck with at least one unforked antler for research purposes. Nineteen of these special buck tags were issued on Shipland WMAand none were turned in as being used. Both of these regulations appear to be supported by the majority of deer hunters on the WMA.Hunting pressure increased to 840 man-days in 2006 – 2007. Harvest included 12 bucks and 16 does, which was up from 7 bucks and 13does last season. The harvest consisted of 98% 2½+ year-old bucks. Antler production continued to be good according to harvest data.182006-2007 Mississippi Deer Program Report
2006-2007 WMA Deer Harvest NarrativesBody weights of bucks and does remained stable or increased slightly. Lactation rate of 2½+year-old does was 64%. Mast production on pecan trees was poor. Below normal rainfall duringthe summer and fall resulted in fair browse conditions. The mild winter resulted in limiteddeer movement which caused a reduction in deer sightings.Season Harvest Man-days2004-2005.................10.................. 6222005-2006.................20.................. 6282006-2007.................28.................. 840Stoneville WMAWritten by: Jackie FleemanStoneville WMA is located about 4 miles north of Leland, MS. Most of the timber on the area was cut in the mid to late 1990’s. This WMAhas abundant browse and escape cover. Only primitive weapons and archery equipment are allowed for deer hunting. This was the fourthyear under the regulations that required legal bucks to have a minimum 15-inch inside spread. Also, hunters could apply for a tag thatwould allow them to harvest a buck with at least one unforked antler for research purposes. Nineteen of these special buck tags were givenout for use on Stoneville WMA and none were turned in as being used. Both of these regulations appear to be supported by the majorityof deer hunters on the area. Hunting pressure decreased to 590 man-days in 2006 – 2007. Deer harvest decreased to 12. This harvestincluded 5 bucks and 7 does. No other scientific data was collected because no personnelare assigned to this WMA. Below normal rainfall during summer and fall resulted in only fairbrowse conditions. Acorn production was poor. The mild winter resulted in limited deer movementwhich caused a reduction in deer sightings.Season Harvest Man-days2004-2005...................7.................. 5422005-2006.................13.................. 7212006-2007.................12.................. 590Sunflower WMAWritten by: Jackie FleemanSunflower WMA is a 60,000-acre U.S. Forest Service area in Sharkey County.This was the fourth year under the regulations that required legal bucks to have a 15-inch minimum inside spread. Also, hunters couldapply for a tag that would allow them to harvest a buck with at least one unforked antler for research purposes. Two hundred of thesespecial buck tags were issued on Sunflower WMA and six were turned in as being used. Both of these regulations appear to be supportedby the majority of deer hunters on the area. Overall, body weight and antler dimension indices remained stable or increased slightly. Belownormal rainfall during summer and fall resulted in intermediate browse conditions. The mild winter resulted in limited deer movementSeason Harvest Man-days2004-2005...............119............... 5,2762005-2006...............146............... 5,1232006-2007.................95............... 3,771which caused a reduction in deer sightings during the later deer seasons. Acorn productionwas spotty. Flooding was not a factor in November and December, as it commonly is. Buckharvest decreased from 85 to 49 in 2006 - 2007. Doe harvest decreased from 61 to 46. Mandayswere down from 5,123 to 3,771.A deer herd health evaluation was conducted on Sunflower WMA on February 26-27, 2007.A total of 11 does were collected with one doe being 1 ½ years old and 10 does being 2 ½years old or older. Overall herd health indices on Sunflower WMA are consistent with the expected values for the WMA and the region asa whole. The only statistics not within expected ranges are the kidney fat index and the conception date. The kidney fat index is 66% ofthe historical expected value for Sunflower and is 74% of the expected value for the Delta. Reproductive timing is a little late with meanconception occurring around January 5. The range of conception was relatively short and occurred between December 21 and January15. The reproductive rate and potential are average. The herd health evaluation suggests that harvest on Sunflower WMA has kept the deerpopulation in balance with existing habit conditions, and that the population could be increased. The reduction in the kidney fat index canbe attributed to drought stressed browse and a poor mast crop.WMA Na r r at i v e sTallahala WMAWritten by: Chad M. DacusTallahala WMA is a 28,120 acre area within the Bienville National Forest located nearMontrose. For the third year bucks must have 4 or more antler points and an inside spread of12 inches or more to be legal for harvest and antlerless deer had to weigh at least 65 poundslive weight. The 2006 – 2007 season was the second year that antlerless deer were legal forharvest during gun season. Antlerless deer were legal for harvest on the 2 statewide doe days.Season Harvest Man-days2004-2005.................97............... 2,9302005-2006.................57............... 2,2272006-2007.................74............... 1,924Deer harvest consisted of 31 bucks and 35 does. Total harvest increased 130% from last year and buck harvest increased by 115%.Deer hunters accounted for 1,924 man-days which were down slightly from last year. This decrease in man-days could be due to hunter’sreluctance to turn in permit cards at WMA permit stations.During the 2007 – 2008 season, the antlerless opportunity during gun season will be available during the gun without dogs season(December 15 – 23) along with antlerless opportunity during archery and primitive weapon seasons. This is the first year for antlerless opportunityduring the gun without dogs season.The U.S. Forest Service continues to conduct spring prescribed burns on the WMA. This helps to encourage browse production duringthe spring and fall.2006-2007 Mississippi Deer Program Report19
2006-2007 WMA Deer Harvest NarrativesTuscumbia WMAWritten by: Jerry HazelwoodTuscumbia WMA, located in Alcorn County, is a relatively new WMA. The area comprises 2,600 acres and consists primarily of abandonedagricultural fields and beaver slash. The area is comprised of two separate units. The northern unit (1400 ac.) is mainly permanentwater and slash, which is not easily accessed and provides little deer habitat. The southern unit(1200 ac.) has mostly abandoned agricultural fields and seven newly constructed waterfowlimpoundments. Both units experience frequent flooding in the winter months.As part of a waterfowl management strategy, the southern unit (Unit 2) of the area wasclosed to all hunting for the 2005-2006 season. This season (2006-2007), Unit 2 was openedfor draw waterfowl hunting beginning Dec. 16 and archery hunting was allowed Sept. 30Season Harvest Man-days2004-2005...................1.................... 602005-2006...................0.................... 612006-2007...................6.................. 252– Nov. 30, which accounted for the majority of the increase in man-days of hunter effort. Deer hunting is not a primary use of the area andonly 6 deer (5 bucks, 1 doe) were harvested. Effort and harvest numbers are low due to the relatively small size of the area and limited deerhabitat and public access.WMA Na r r at i v e sTwin Oaks WMAWritten by: Jackie FleemanTwin Oaks WMA is a 5,675-acre bottomland hardwood area 5 miles southeast of Rolling Fork. Deer hunting is restricted to archery andprimitive weapon and is by permit only except for the January archery hunt which is open to the public. This was the fourth year that regulationsrequired legal bucks to have a 15-inch minimum inside spread. Also, hunters could apply for a tag that would allow them to harvesta buck with at least one unforked antler for research purposes. Both of these regulations appear to be supported by the majority of deerhunters on the WMA. Four hundred twenty-four of these special buck tags were issued on Twin Oaks WMA and eight were turned in as beingused. Hunter effort decreased to 980 man-days in 2006 – 2007. Buck harvest decreased from 23 to 20. Doe harvest increased from 34to 50. Buck weights increased or remained stable in all age classes. Antler indices were mixed but were basically unchanged from last year.Doe weights were up slightly in the two and three year old age classes. Lactation rates decreased to 64% in two year olds and older. Belownormal rainfall during summer and fall resulted in intermediate browse conditions. Acorn production was poor. The mild winter limited deermovement which caused a reduction in deer sightings during the late season deer hunts.Season Harvest Man-days2004-2005.................38............... 1,5152005-2006.................57............... 1,2062006-2007.................70.................. 980A deer herd health evaluation was conducted on Twin Oaks WMA on February20, 2007. Atotal of 12 does were collected, two of which were 1 ½ years old and 10 were 2 ½ years oldor older. Overall herd health indices on Twin Oaks WMA are below the expected values for theWMA and the region as a whole. Dressed weight, reproductive potential and rate, and kidneyfat index are all lower than the expected values for the WMA and region. Reproductive timing isslightly late with a mean conception date of January 12. The range of conception was 52 days long, ranging from December 17 until February6, with three does bred February 6.The deer herd health evaluation suggests that the decreased antlerless harvest in 2004 and 2005, poor browse conditions in the summerand winter of 2006, and the poor acorn production in 2006 has caused a decrease in the overall health of the antlerless population on TwinOaks WMA.Upper Sardis WMAWritten by: Brad HolderUpper Sardis WMA is a 42,274-acre area located within the Holly Springs National Forest near Oxford, MS in Lafayette County. Mandaysincreased by 26% from the 2005-2006 season and seem to be holding relatively steady when looking at the past 9 seasons. Harvestdecreased by 20% when compared to the 2005-2006 season. Harvest favored does this season and we hope to see this trend continue.Seventy-six bucks and 93 does were harvested. Weights from harvested bucks in the 4.5+ year old class were down by 5%. Doe weightsfor 2.5+ age classes experienced increases from 4-6% when compared to past seasons.Lactation decreased by 64% and 24% for 2.5 and 3.5+ year old does when compared to pastseasons. The numbers and a large percentage (63%) of 3.5+ year old does in the past season’sharvest indicate an overpopulated deer herd on the area. A poor acorn crop in some parts ofthe WMA may have contributed to lower weights. Planted winter forages like clovers, wheat,and oats benefited from cooler temperatures and increased rainfall amounts later in the fall andSeason Harvest Man-days2004-2005...............188............... 7,5802005-2006...............212............... 6,7262006-2007...............169............... 8,995early winter. Food plot plantings also helped to offset low acorn abundance as they were used early and often. Habitats continue to improveon Upper Sardis WMA due to timber management practices such as timber thinnings, limited clearcuts, and burning, which are conductedby the Holly Springs National Forest.202006-2007 Mississippi Deer Program Report
2006-2007 WMA Deer Harvest NarrativesWard Bayou WMAWritten by: Russ WalshSeasonHarvestMan-days2004-2005 ................22 .............. 1,881Ward Bayou WMA is a 13,234-acre parcel of bottomland hardwoods and some upland areas2005-2006 ..................3 .............. 1,078nestled within the Pascagoula River Basin. Many of the low-lying areas are boat accessible2006-2007 ..................2 .............. 1,112through navigable waters off the main river channel. Depending on rainfall and river levelsduring winter, hunting access is hit and miss. Compared to most areas, Hurricane Katrina damage was mild across the WMA. The 1,112reported man-days were a slight 3% increase over the 2005-2006 season. Harvest was down by one deer with only 2 bucks being reported.Wolf River WMAWritten by: Russ WalshThe 10,801-acre Wolf River WMA is located in Lamar and Pearl River Counties. The variousSeasonHarvestMan-daysaged pine plantations and intermittent stream bottoms received substantial damage during2004-2005 ................69 .............. 3,250Hurricane Katrina. However, the increased available forage from downed timber and log-2005-2006 ................57 .............. 2,484ging operations provided above average habitat conditions. While many roads on the area2006-2007 ................63 .............. 3,035were closed temporarily, MDWFP personnel worked hard to get most of the area ready forthe 2006–2007 season. Wolf River had a 20% increase in man-days (3,035) over the 2005-2006 season. The reported deer harvest alsoshowed an increase over the previous season. Harvest was comprised of 29 bucks and 34 does.Yockanookany WMAWritten by: Brad HolderYockanookany WMA is a 2,379-acre area located in Attala County approximately 12 miles east of Kosciusko. This marked the third yearof legal hunting on this WMA. The lack of hunting on this WMA continues to be the main reason for habitat stress and over-population ofdeer. Deer hunting man-days decreased slightly when compared to the 2005–2006 season. The harvest consisted of 1 buck and 6 does.Doe harvest remains fairly consistent over the past three seasons. Buck harvest has decreased. Doe harvest remains inadequate. The deerSeasonHarvestMan-days2004-2005 ................15 ................... 912005-2006 ................12 ................. 1892006-2007 ..................7 ................. 166herd is overpopulated as indicated by large percentages (60-80%) of 3.5+ year old does inthe harvest during the past three seasons. Also, doe weights and lactation are below averagefor the Upper Coastal Plain soil region. The overall harvest was lower than expected, whichcan be attributed to less than favorable hunting conditions provided by warm fall and wintertemperatures and some flood events. Hopefully, next season will provide more quality huntingopportunities on this area resulting in a greater overall deer harvest. An intense antlerlessharvest is needed on the area to balance the number of deer with the available habitat. The hunts on this area were restricted to draw huntsfor archery, primitive weapon, and rifle. Draw hunts for archery season have been removed on the WMA for the upcoming 2007-2008 deerseason. The WMA consists of bottomland hardwoods of varying ages that produced an average acorn crop this past season which wasunavailable at times due to large scale flooding. Habitat conditions should continue to improve on the area with creation of additional foodplots and proposed timber thins of selected stands on the area.WMa narrativesMahannah WMA2006-2007 Mississippi Deer Program Report21
2006-2007 Regional NarrativesRe g i o n a l Na r r at i v e sNorth RegionWritten by: William T. McKinleyThe North region is experiencing localized deer population explosions. The harvest rate has almost doubled in just five years, accordingto DMAP harvest. Deer herds that have been afforded protection on the antlerless side are becoming overpopulated. The sentiment againstharvesting antlerless deer is still strong in the North region, and is the strongest of any region in the state. Overall, the herd appears healthy.However, site visits to this region have revealed grossly over-populated deer herds on the lands that continue to refrain from antlerless harvest.The summer drought in 2006 appeared to have little impact on the deer herd. Average lactation rates and body weights on bucks and doesshowed very little change. In fact, lactation increased slightly to 65%. Average doe body weights remained at 111 lbs. The percent of 3 ½+year old does in the harvest is increasing, indicating an expanding herd.Buck harvest is changing due to increasing management. Hunters are realizing that age is a limiting factor in their harvest, and are choosingto let some state-legal bucks go. The percent of 4 ½+ year old bucks in the harvest has increased to 22%, while the percent of 2 ½ year oldbucks has decreased to 29%. However, even with the increase in management, the percent of 1 ½ year old bucks in the harvest continues tobe higher in the north region than in most of the state.The late freeze and subsequent drought of 2007 most likely will impact the health of the North region deer herd. The freeze practically eliminatedthe white oak crop. However, red oaks appear to have a moderate crop. The drought has reduced food resources even further. Harvestshould be high in the 2007-2008 season, especially if food plots are established.West Central RegionWritten by: Lann M. WilfIn the West Central Region, the 2006-2007 deer season was relatively successful. Deer were readily seen during cool periods in the lateseason when rutting and feeding activity were consistent. Several above average bucks were harvested, and overall harvest was fairly high onDMAP clubs and Wildlife Management Areas. Deer harvest was above average when compared to recent years. Increased harvest and deervisibility can primarily be attributed to dry weather throughout most of the summer, which stressed deer browse and limited mast production.Warmer temperatures during most of December inhibited daylight deer movement and reduced the visibility of the rut. However, a fair amountof rutting activity was observed in late January. Hopefully, next season will provide more favorable deer hunting weather during the rut.Mast crops were heavily impacted by dry conditions in the summer. As a result, acorns and pecans were spotty. The only oaks with a presentablemast crop were water oaks and willow oaks. Some cherrybark oaks, swamp chestnut oaks, and even white oaks produced, but mostof these were in creek bottoms that had water throughout summer. Overall, the mast crop in the West Central Region was fair.The physical condition of deer within the region was down slightly from previous years, especially on areas that had a good fawn crop.Buck and doe body weights were reduced on most properties, which are expected from a drought year. Lactation rates within the region werereduced by the drought in most cases, but areas with a lower deer density had a decent fawn crop.Overall, food plots did well this year. Food plot use was higher than the previous couple of years because of lower mast success and reducedquality of available winter browse. Based on food plot exclosures, use seemed to peak in late December and January.Anticipation is high for the 2007-2008 season due to the return of regular rainfall in early July. Last year’s drought had reduced deer bodyconditions and antler production going into this year. However, recent rains have improved the quality of summer browse and set acorn cropsthat were weeks away from being lost. These rains are good news for lactating does, fawns that are hitting the ground in July, and bucks thatare growing antlers.So far this year, the most detrimental factor for mast production was the freeze that occurred in early April. This freeze completely decimatedwhite oak mast production in the northern part of the region. However, the impact to red oaks may have been minimal. South of thefreeze line, we expect most of the mast crop to be exceptional, although much can change between July and OctoberNorth Central RegionWritten by: William T. McKinleyThe North Central region experienced one of the best deer seasons in recent history. Harvest on DMAP properties increased to 1 deer per97 acres, with over 60% of the harvest being does. Mature buck harvest (4 ½+ year olds) continues to increase and was 25% of the total buckharvest. Total harvest on Wildlife Management Areas also increased. Overall, the herd appears relatively healthy. However, localized areas arestill over-populated and are in desperate need of a change in management.The summer drought in 2006 appeared to have a minimal negative impact on the north central region deer herd. Average body weights fordoes decreased by 1 – 3 pounds, with the average mature doe weighing 110 pounds. Lactation rates remained constant from the previousseason. The percent of 3 ½+ year old does in the harvest is increasing, indicating an expanding herd.The mast crop was very low, due mainly to the summer drought. This caused deer to move more, thus increasing harvest opportunity.Rains came just at food plot planting time, resulting in very productive food plots.The late freeze of 2007 will affect the northern counties of the North Central Region. Counties such as Yalobusha, Calhoun, Chickasaw,and Monroe can expect white oak acorns to be spotty at best. However, red oaks appear to have a moderate crop. Counties and portions of222006-2007 Mississippi Deer Program Report
2006-2007 Regional Narrativescounties below the freeze line appear to have good white oak and red oak crops this year. The drought of 2007 was broken in July and hasresulted in abundant growth in natural foodsEast-Central RegionWritten by: Chad M. DacusHarvest reports from DMAP clubs and WMAs remained stable when compared to last season. Reported harvest was down 13% from the2004 – 2005 to 2005 – 2006 season. This decline in deer harvest may have been a direct result of the effects of Hurricane Katrina. If this wasthe case, harvest should have returned to pre-Katrina numbers. The habitat damage may have hurt the deer population numbers in somelocalities.However, on most lands hunters are seeing just as many deer, if not more than ever. So over-harvest is not an issue on most properties.There is still a concern of poor reporting of harvest on WMAs. Man-days have decreased, but this is not the reason for the decreased harvest.WMA hunters have become apathetic in regards to checking in deer and reporting their harvest. Also, due to decreased man-power on thisregion’s WMAs, hunters do not feel the need to report/check-in deer at check stations.Complaints from crop depredation decreased slightly this year. Depredation permits were issued in 4 counties (Lauderdale, Newton, Simpson,and Smith). Complaints from sub-divisions and small towns remained high this year. With new sub-divisions being constructed in theJackson Metro area, these complaints will continue to rise. Also, as municipalities outlaw bow hunting within city limits, these complaintswill be harder to deal with in the future.Reports of HD/Bluetongue increased from last year. HD/Bluetongue was found in 4 counties in east-central Mississippi. However, the numbersof affected deer were much higher than last year. On some properties, mortality due to HD/Bluetongue was extremely high. Samples weretaken from hunter harvested and road killed deer for chronic wasting disease testing. No occurrence of the disease was found.Southwest RegionWritten by: Chris McDonaldFor the second consecutive year, environmental conditions were dry going into the hunting season. Limited rainfall during the summerdecreased the amount of quality deer browse. Acorn crop was fair to good across the region, but mostly fair. Utilization of food plots bydeer was high throughout the hunting season due to limited browse caused by drought. Hunters reported good success on food plots. Eventhough environmental conditions were not optimum, body weights of harvested deer during the 2006-2007 hunting season were consistentwith the past 5 years.Cold weather was sporadic throughout the hunting season. However, due to limited food sources, harvest success was good. This can beseen in harvest numbers reported by DMAP clubs in the region. The number of harvested deer reported by DMAP clubs was the second highestin the past five years. DMAP clubs once again harvested more does than bucks (1.6 does per buck). Overall, DMAP clubs in the regiondo a good job of letting bucks get to an older age before they are harvested. The majority of bucks harvested in the region are 3 ½ years oldand older, with many 5 ½ year old bucks harvested. Deer herds continue to exceed the carrying capacity of the habitat on most properties inthe western portion of the region.Reports of hemorrhagic disease throughout the region increased this year. This was expected because reports of hemorrhagic disease havebeen limited over the past three years. Samples were collected once again for Chronic Wasting Disease. All samples tested negative for thedisease and Chronic Wasting Disease has not been found in Mississippi.Southeast RegionWritten by: Chris McDonaldConditions going into the 2006-2007 hunting season were good for a successful hunting season. Deer harvest for the previous seasondecreased drastically due to Hurricane Katrina. Many hunters could not get into the woods due to downed timber. Because of the decrease inhunting opportunity, many deer were carried over for the 2006-2007 season.Hurricane damaged trees produced little or no acorns, which limited a primary food source for deer. However, the lack of acorns was madeup for by an increase in browse. Hurricane Katrina created openings and thinned timber, which made conditions good for new vegetativegrowth. Deer were in good condition going into the 2006-2007 hunting season. This is illustrated by an increase in body weights and lactationrates for the hunting season.The number of deer harvested increased on both private and public land. Hunters were finally able to get to their favorite hunting spot.Hunters reported good harvest success on food plots. Hunters in the region continued to harvest old does and young bucks. Most bucksharvested in the region are 2.5 years old or younger. This was the second year the region was under the 10 inch spread or 13 inch main beamregulation. Under the regulation, legal bucks in areas south of Hwy. 84 and east of Hwy. 35 are those with at least 4 antler points and a minimuminside spread of 10 inches or a minimum main beam of 13 inches. Because of this regulation, hunters should have more opportunity toharvest older bucks. Hunters continue to enjoy the late primitive weapons season in the region. The late season was provided to give huntersmore opportunity to hunt during the rut.Improvement of deer habitat by Hurricane Katrina will continue into the 2007-2008 hunting season. Two years of new vegetative growth willhave taken place once the season opens. Hunters should have the opportunity to harvest deer that are both older and healthier.Re g i o n a l Na r r at i v e s2006-2007 Mississippi Deer Program Report23
MDWFP personnel have monitored statewide deer road kill sinceJanuary 1997. All dead deer observed on or adjacent to roadsand highways are recorded during the personnel’s regular course oftravel from October 1 – January 31. The cause of death of theseanimals is assumed to be a vehicle collision. The specific location bycounty is recorded for every deer observed. Personnel also recordtheir monthly mileage. In the past these data were analyzed, and theaverage number of deer observed per 10,000 miles is was calculatedby district. However, with changing district lines and MDWFP personnelroutinely traveling outside their home district, we have changedthis to a statewide average and not district averages.Graphical monthly statewide summaries of these data are presentedin Figure 3. The precise value and accuracy of this method of data collectionhave not been critically evaluated. No evaluation has been madeto determine if number of vehicles on the highways has increased, decreased,or remained constant. Therefore, any inferences or interpretationof these data should be approached cautiously. Every effort has beenmade to standardize sampling protocol.When these data are examined graphically, fluctuations over time areapparent. Certain assumptions may be logical. For example, an increasein observed deer vehicular related mortality is a result of an increase indeer activity. Data are currently collected from October – January. Activitypeaked during the fall and winter around breeding seasons, whendeer activity is at its highest.A second assumption is if deer numbers are fluctuating annuallyand the number of deer observed is density dependent, then in lowerpopulation years, fewer road-killed deer will be observed. Conversely,during high population years, a greater number of road-killed deer willRoad Kill Data By Month (InDeer Per 10k Miles) 2006-2007Figure 3Road Kill Survey Report2006-2007Figure 4be observed. If this assumption is correct, deer populations increasedduring the 2006 – 2007 season. In addition to increasing or expandingdeer herds, road kill observations may be heavily influenced by weatherconditions and mast availability. The dry weather during the summer of2006 may have caused deer movement to increase earlier in the yearin addition by causing mast crops to fail. This past year, observed roadkills increased the most during the months of October and November,with December and January remaining consistent with previous years.This is most likely due to increased deer movement due to dry conditions,stressed browse, and an overall poor mast crop caused by the latesummer drought. Also, road side right-of-ways being which are plantedin cool season grasses and legumes tended to congregate deer alonghighways.We also collect road-kill data from two outside sources: State Farm InsuranceCompany and The Mississippi Office of Highway Safety. Accordingto State Farm’s estimates there were 12,146 deer-vehicle collisions in2005 – 2006 and 13,197 in 2006 – 2007. These estimates fit the sameincreasing trend from the MDWFP personnel’s road-kill observations.The data from State Farm has been projected for the whole insuranceindustry, based on State Farm’s known auto insurance marketshare within each state. This data is based on actual comprehensive andcollision claims, and as such, would not include deer-vehicle collisionswhere the policy holder had only liability insurance coverage (which istypically carried on older vehicles in some states).Ro a d Kill Su r v e yTable 2. Road Kill Data By Month (In Deer Per 10k Miles)2006-2007Month 2001-2002 2002-2003 2003-2004 2004-2005 2005-2006 2006-2007 Avg. all YearsOctoberNovemberDecemberJanuarySeason Avg.6.76.47.68.17.26.38.15.98.37.25.98.610.48.38.36.67.310.19.58.46.59.213.011.210.08.411.112.811.811.06.78.510.09.5242006-2007 Mississippi Deer Program Report
Depredation By DeerConservation officers annually deal with agricultural depredation bydeer. Landowners who experience deer depredation problems arerequired to apply for a permit before any action is taken to harass orremove problem animals. The process for permit issuance includesan on-site evaluation by an MDWFP officer to verify the occurrenceof depredation. Permits are issued primarily for agricultural damage,but ornamental vegetation is included. Miscellaneous problemssuch as deer on airport runways also occur and are handled ona case-by-case basis. Property owners should know thatpermits are not issued in every situation.A total of 81 depredation permits were issued in 27counties during 2006, which increased from 67 permitsduring 2005 (Figure 5). However, the number ofcounties that had recorded depredation permits decreased.This increase in the number of permits canbe attributed to rising deer populations throughoutmost of the state and the effects of drought stresson vegetation. Counties with the most depredationproblems are either the same counties with themost rapidly expanding deer populations or countiesthat had the least rainfall during the summer of2006. Cases of deer depredation included damageto soybeans, corn, cotton, peas, sweet potatoes,watermelons, cantaloupe, okra, peanuts, lettuce,numerous gardens and truck crops, flowers, andinterference on airports.The preferred method of controlling deer depredationproblems is adequate hunter harvest. Thislowers the deer population to levels that are in balancewith the environmental carrying capacity of thehabitat. Normally this involves cooperation with adjoininglandowners and hunting clubs.Alternative direct methods used to solve depredationproblems include scare or harassmenttactics, assorted chemical applications, electricfencing, and traditional fencing at a height thateliminates deer access. High fencing aroundgardens and small problem areas is costlybut provides assured control on a longtermbasis with little or no maintenance.In some instances, after other controlmeasures have been exhausted,deer will be lethally removed. Thisprocess seldom provides a longtermsolution but is used in someproblem situations.Depredation problems will continueto occur in Mississippi as long asFigure 5abundant deer populations exist. Extensiveproblems with agricultural depredation can be controlled withadequate antlerless harvest. Instances of urban depredation are increasingdue to escalating deer numbers and urban sprawl. Urbandeer problems are magnified in cities where bowhunting has beenbanned.De p r e d at i o n2006-2007 Mississippi Deer Program Report25
Chronic Wasting DiseaseDisease DataChronic wasting disease (CWD) is a progressively degenerative fataldisease that attacks the central nervous system of membersof the deer family. To date it has been diagnosed in elk, mule deer,black-tailed deer, and white-tailed deer. CWD is one of a group of diseasesknown as transmissible spongiform encephalopathies (TSEs).These diseases are characterized as transmissible because they canbe transmitted from one infected animal to another. They are furtherclassified as spongiform due to the “spongy-like” areas which formin the brain of the infected animal, hence the encephalopathy portionof the name.The scientific community generally accepts that the infectiousagents of CWD are prions. Prions are abnormal proteins that seem tohave the ability to alter the structure of normal proteins found in thebody of the animal they enter. Logical natural methods of prion transmissioninclude, but may not be limited to, secretions and excretionsfrom infected animals. In a new study conducted this past year atColorado State University found that CWD can be transmitted experimentallyfrom saliva and blood. Also, human activity contributesto environmental prion contamination. Prions are hideously durableand impervious to most disinfectants and natural conditions, remainingin the environment for years.Animals suffering from CWD typically behave abnormally by separatingthemselves from their usual social group. They often standalone, with a drooped posture, and may not respond to human presence.As the disease progresses they will appear very skinny on closeexamination and will salivate, drink, and urinate excessively.The goal for the 2006 – 2007 monitoring period was to test approximately1,500 deer statewide. Routine testing involved Mississippihunters in this disease monitoring effort. Hunters throughoutthe state were asked to voluntarily submit the heads of harvesteddeer for CWD testing. Additionally samples were obtained from taxidermistsand deer processing facilities. Most of these samples camefrom wildlife management areas, national wildlife refuges, and DeerManagement Assistance Program (DMAP) cooperators.A total of 1,120 samples were taken from free-ranging white-taileddeer in Mississippi during 2006 – 2007. Samples were obtained fromhunter harvested animals, spring herd health evaluations, target animalsurveillance, and road-killed animals. Samples were obtainedfrom 72 counties (Figure 6). The samples were submitted to theSoutheastern Cooperative Wildlife Disease Study at the Universityof Georgia following the 2006 – 2007 hunting season and 1,089 ofthose samples were tested for evidence of the CWD agent using immunohistochemistry.The remaining 31 samples were not tested becausethe containers did not contain testable specimens. Evidenceof CWD was not detected in 1,087 of the tested samples and the remaining2 results cannot be considered official test results, becausethe correct specimens for testing were not available.to diagnose disease is dependent on quick reporting because deercarcasses deteriorate rapidly in Mississippi’s climate.In 1967 CWD was first recognized at a captive mule deer researchfacility in Colorado. A Wyoming research facility documented thedisease in deer and elk in 1978. CWD was then documented in freerangingdeer in Colorado and Wyoming in the 1980s. Further testingfrom 1996 through the end of 2001 found additional positive animals(either captive or wild elk or deer) in Kansas, Nebraska, Montana,Oklahoma, South Dakota, and the Canadian provinces of Saskatchewanand Alberta. Then in February 2002 the first case was confirmedeast of the Mississippi River in Wisconsin, in wild white-tailed deer.In 2004, CWD was found in New York and West Virginia. As of October1, 2007, there are 11 states with CWD infected wild populations(Colorado, Illinois, Kansas, Nebraska, New Mexico, New York, SouthDakota, Utah, Wisconsin, West Virginia, and Wyoming) and two Canadianprovinces (Alberta and Saskatchewan). Additionally, CWD hasbeen found in captive cervid populations in all of the above states aswell as Minnesota, Montana, and Oklahoma.All public health officials maintain that venison is safe for humanconsumption. However, hunters who wish to take additional stepsto avoid potential unnecessary contact with prions or environmentalcontamination can do the following:• Avoid shooting, handling, or consuming any animal that appearssick. Contact the MDWFP at 601-432-2199 if you see or harvestan animal that appears sick.• Wear latex gloves when field dressing or processing deer.• Avoid eating or contact with brain, spinal cord, spleen, lymphnodes, or eyes.• Cut through the spinal cord only when removing the head. Use aknife designated solely for this purpose.• Bone out meat to avoid cutting into or through bones. Remove allfat and connective tissue to avoid lymph nodes.• Dispose of all carcass material, including the head, in a landfill orpit dug for carcass disposal purposes.• Either process your animal individually or request that it be processedwithout adding meat from other animals.• Disinfect knives and other processing equipment in a 50% bleachsolution for a minimum of one hour.• Discontinue baiting and feeding which unnaturally concentratedeer.Deer With Chronic Wasting Disease from WisconsinThe MDWFP, in cooperation with the Mississippi Board of AnimalHealth and the U.S. Department of Agriculture/Veterinary Serviceswill continue target animal surveillance. A target profile animal is anyadult cervid that is emaciated and shows some neurological disorder.These target animals should be reported to the local county conservationofficer who has been trained to properly handle them and coordinatetheir transport to the appropriate laboratory for CWD testing.Most deer exhibiting symptoms of CWD are actually suffering fromother conditions or diseases common to white-tailed deer in Mississippi.Malnutrition, hemorrhagic disease, brain abscesses, and otherconditions may cause some of the same symptoms. However, due tothe seriousness of CWD and the importance of early detection andcontrol, it is necessary to test target animals for infection. The ability262006-2007 Mississippi Deer Program Report
Chronic Wasting DiseaseDisease DataFigure 62006-2007 Mississippi Deer Program Report27
Epizootic Hemorrhagic DiseaseDisease DataHemorrhagic Disease (HD), sometimes referred to as EpizooticHemorrhagic Disease (EHD) or Bluetongue (BT), is consideredthe most important viral disease of white-tailed deer in the UnitedStates. Different subtypes of two closely related viruses cause HD:EHD and BT. Technically, there are five subtypes of the BT virus andtwo subtypes of the EHD virus. A distinguishable difference does notvisually exist between these diseases, so wildlife managers normallygroup the symptoms into one category and refer to the condition asHD.Biting midges of the genus Culicoidestransmit HD; therefore thedisease is seasonal, based on the abundance of the midge vectors.Normal occurrence of HD is late summer through fall (approximatelylate July – November). Deer that become infected with the HD virusmay exhibit a variety of outward symptoms. Some mildly infecteddeer will exhibit few symptoms. Others which contract a more potentform of the virus will appear depressed, become feverish, have swollenareas around the head or neck, and may have trouble breathing.Still others, which become infected with a particularly potent formof the virus, can die within 1 to 3 days. Normal mortality rates fromHD are usually less than 25 percent. However, rates greater than 50percent of the population have been documented. On a brighter note,HD has destroyed no free-ranging deer population.HD is first suspected when unexplained deer mortality is observedin late summer or early fall. Typically, archery hunters who are scoutingduring late September are the first to observe carcasses in thewoods. On some occasions HD deer are found dead during the latesummer in or adjacent to water. The fever produced by the diseasecauses the sick deer to seek water. These deer subsequently succumbto the disease in creeks and ponds.Hunters will most frequently encounter the evidence of HD whileobserving harvested deer during the winter months. During the highfever produced by HD, an interruption in hoof growth occurs. Thisgrowth interruption causes a distinctive ring around the hoof, whichis readily identifiable on close examination. Hoof injury, as well asbacterial or fungal infection can cause a “damaged” appearance on asingle hoof. HD is not considered unless involvement is noticed ontwo or more feet.Fortunately, people are not at risk by HD. Handling infected deeror eating the venison from infected deer is not a public health factor.Even being bitten by the biting midge that is a carrier of the virusis not a cause of concern for humans. Deer which develop bacterialinfections or abscesses secondary to HD may not be suitable forconsumption.The case is not as clear regarding domestic livestock. A small percentageof BT infected cattle can become lame, have reproductiveproblems or develop sore mouths. Variations exist between BT andEHD virus infection in cattle and domestic sheep. Sheep are usuallyunaffected by EHD but can develop serious disease symptoms withthe BT virus.Occasionally overpopulation of the deer herd has been blamed foroutbreaks of HD. Abnormally high deer populations are expected tohave greater mortality rates simply because the deer are in sub-optimalcondition. The spread of the virus would be expected to begreater in dense deer herds. However, an outbreak of HD cannot bedirectly attributed to an overpopulated deer herd.HD can be diagnosed several ways. A reliable tentative diagnosiscan be made after necropsy by a trained biologist or veterinarian. Aconfirmed diagnosis can only be made by isolating one of the virusesfrom refrigerated whole blood, spleen, lymph node, or lung fromfresh a carcass.MDWFP biologists have been monitoring the presence of HD inMississippi by several methods: sudden, unexplained high deer mortalityduring late summer and early fall, necropsy diagnosis, isolationof EHD or BT virus, and the observation of hoof lesions on hunterharvesteddeer. HD or previous HD exposure is always present inMississippi deer herds. Previous HD exposure is good. Exposureyields antibodies to future outbreaks of the disease. Without the antibodypresence significant mortality would occur.The 2006 – 2007 season produced a moderate HD occurrence.Evidence of HD was reported in only 20 counties during the 2006– 2007 hunting season (Figure 7). Researchers have documented adistinctive 2 - 3 year cycle in HD outbreaks. Assuming that these cyclicoutbreaks occur, we can expect a high occurrence of HD duringthe 2007 – 2008 hunting season.Biting Midge(Culicoides spp.)Transmits EHDMouth Lesions from EHDHoof Sloughingfrom EHD282006-2007 Mississippi Deer Program Report
Epizootic Hemorrhagic DiseaseDisease DataFigure 72006-2007 Mississippi Deer Program Report29
2007 Deer Herd Health EvaluationsherD healthPhoto by Steve GulledgeDeer herd health evaluations are conducted by MDWFP biologistsannually. Evaluation sites are selected each year based ona specific need for additional information, which cannot be obtainedfrom hunter-harvested deer. These sites may be on DMAP cooperatorlands, WMAs, open public lands, or areas with a special deermanagement concern. Some sites are sampled annually, others ona rotational schedule of two – three years and some locations on anas-needed basis.Time constraints normally limit the number of locations biologistssample each year. Deer collections are conducted during the monthsof February, March, and April. Collection timing must be late enoughto insure that all does have been bred, but early enough to precedethe spring green-up when foliage density reduces the ability to readilyobserve and identify deer. The sampling window is most criticalin the southern portion of the state where late breeding is a chronicproblem and early green-up of native vegetation occurs.Biologists complete an application for approval to conduct eachherd health evaluation during a specific time period. The MDWFPDeer Committee reviews these applications and denies or grants approval.Other agency personnel assist the biologist in charge of thedeer collection. When non-agency personnel are participating in theprocess, specific prior approval is obtained on the application.During a typical herd health evaluation, biological data regardingreproduction, body condition, and disease are collected from maturefemales. A minimum of 10 mature females is necessary to obtain anadequate sample size to assess herd parameters. Mature does areshot during the late afternoon on existing food plots or at night withthe aid of a light and from a truck platform, which has been designedspecifically for this purpose. Other deer are occasionally taken bymistake during the collection process. Data are obtained from all deerbut the purpose of the evaluation is to obtain reproductive, physicalcondition and disease data from mature females. All measurementsand data are obtained from the deer on site or at a convenient nearbylocation. All deer are donated to a charitable institution or to an individualdetermined needy by agency personnel. Neither deer nor portionsthereof are utilized by any MDWFP employees. Receipts areobtained from every deer donated. Rarely, instances have occurredwhere deer had to be disposed of in a manner where human utilizationwas not possible.ReproductionReproductive data collected during herd health evaluations includeconception dates, fawning dates, number of corpus lutea per doe,and number of fetuses per doe. Conception dates and fawning datesare determined using a fetal aging scale. Fetal length is measured onthe fetal aging scale and the length is used to calculate conceptiondata and fawning date. Data from the 2007 statewide deer herd healthevaluations are given in Table 3. Data were collected from 310 deeron 27 sites across the state.In Table 3, conception date ranges and corresponding fawningdates are given for each collection site. The earliest conception date(18-November) was detected at Coahoma Conservation League inCoahoma County. The latest conception date (20-March) was detectedon Leaf River WMA in Perry County. Mean fawning dates based onthe conception dates ranged from 20-June on Conservation Leaguein Coahoma County to 17-August on Leaf River WMA in Perry County.The statewide average conception date was 9-January and thecorresponding state average fawning date was 10-July.Sample sizes for each collection site are given as N1 or N2. Differentgroupings by age and sex are mandatory to accurately interpretcondition and reproductive data. Total 1½ year-old or older fecund(capable of breeding) does are represented as N1. Mature 2½ yearsold and older does are represented as N2. Both N1 and N2 deer areutilized to calculate conception dates, but only N2 deer are consideredin the sample when reproductive rates and condition data arecompared.302006-2007 Mississippi Deer Program Report
2007 Deer Herd Health EvaluationsData comparing conception ranges and mean conception datesare self-explanatory. Average number of corpus lutea (CLs) is determinedby examination of the ovaries of each N2 deer in the sampleand counting the number of CLs present at the time of collection. ACL is a structure in the ovary, which forms when an egg is released.The CL functions to maintain pregnancy by the release of hormones.As in domestic livestock, healthy deer on a high plane of nutritionwill produce more eggs than deer in poor condition. Therefore, CLdata provide a quantitative index to gauge not only reproductive performanceat a specific site but also provide a general index to overallherd condition. CL data ranged from a low of 1.0 CLs per doe onWilderness Forever in Claiborne County to a high of 2.7 CLs per doeon Weyerhaeuser in Kemper County.Average number of fetuses are also self-explanatory, but will, inmost instances, be a lower number than average number of CLs becauseall CLs do not represent a viable fetus. As the average numberof CLs provides an index to reproductive rates and herd condition,the average number of fetuses per doe provides an additional indexto determine site-specific herd health. Average number of fetusesper doe ranged from a low of 1.0 on Wilderness Forever in ClaiborneCounty and Copiah County WMA in Copiah County to a high of 2.3 onWilliams Farm in Coahoma County.Body ConditionBody condition data collected during herd health evaluations includedressed weight and kidney fat index (KFI). Average dressedweight only includes N2 deer. A wide range of weights are apparentdue to soil type, deer herd condition, and habitat type. In general,dressed weight is a reliable indicator to help gauge herd conditionbut should not be used to compare different sites unless all soil andhabitat types are uniform.KFI provides a quantitative index to energy levels within a deerherd. KFI is calculated by expressing the weight of the kidney fat as apercentage of the kidney weight. Substandard kidney fat levels werefound at several areas. The highest value during 2007 was seen onInfolab in Quitman County.DiseaseDuring herd health evaluations, blood serum samples are collectedfrom deer. The serum samples are tested for antibodies to the varioussub-types of Hemorrhagic disease (HD). HD can be caused byseveral different strains of either the epizootic hemorrhagic disease(EHD) virus or the bluetongue (BT) virus. The presence of antibodiesindicates previous exposure, not current infection. During 2007, deerfrom 22 of the 27 collection sites tested positive for the EHD virus,and deer from 23 of the 27 collection sites tested positive for the BTvirus. Specific serotype information was not available at press time.Chronic Wasting Disease (CWD) samples were also collected onall deer harvested during the 2007 herd health evaluations. Therewas no incidence of CWD found in any samples.herD healthPhoto by Steve Gulledge2006-2007 Mississippi Deer Program Report31
Table 3. Deer Herd Health Evaluation Summary for 2007He r d HealthSoil AreaDate ofRange of# Collection SiteCollection N1 N2 Conception1 900 Archer Island HC, Washington County 15-Feb-2007 11 6 27-Nov 24-Dec 11-Dec 25-Jun 2.0 1.8 94.7 144.42 903 Big Black Association, Attala County 5-Mar-2007 14 14 19-Dec 12-Feb 10-Jan 25-Jul 2.0 1.8 76.5 61.83 901 Black Bear Plantation, Issaquena County 13-Feb-2007 25 21 9-Dec 31-Dec 22-Dec 6-Jul 2.0 2.1 94.2 144.94 902 Bozeman Property, Madison County 19-Feb-2007 10 8 18-Dec 29-Jan 3-Jan 18-Jul 1.8 1.7 88.0 79.55 902 Cameron Plantation, Madison County 20-Feb-2007 5 5 23-Nov 2-Jan 19-Dec 3-Jul 2.0 2.0 93.4 87.36 905 Canal Section WMA, Itawamba County 5-Mar-2007 10 10 27-Dec 7-Feb 13-Jan 28-Jul 2.0 1.6 74.8 53.87 900 Coahoma Conservation League, Coahoma Co. 6-Feb-2007 11 10 18-Nov 24-Dec 6-Dec 20-Jun 1.6 1.8 102.7 89.58 913 Copiah Co WMA, Copiah County 6-Mar-2007 9 9 8-Dec 20-Feb 17-Jan 1-Aug 1.2 1.0 73.8 22.59 913 Cotton Branch Plantation, Franklin County 15-Feb-2007 2 2 18-Jan 1-Feb 25-Jan 9-Aug 1.5 1.5 79.5 102.110 905 Divide Section WMA, Tishomingo County 26-Feb-2007 11 9 29-Dec 19-Jan 12-Jan 27-Jul 2.0 2.0 78.4 57.811 902 Hamer WMA, Panola County 6-Feb-2007 12 10 30-Nov 23-Jan 16-Dec 30-Jun 2.3 1.9 90.0 76.312 903 Horseshoe Lake, Madison County 7-Mar-2007 4 3 31-Dec 20-Jan 12-Jan 27-Jul 2.0 2.0 91.0 98.413 901 Infolab, Quitman County 8-Feb-2007 6 5 11-Dec 18-Jan 23-Dec 7-Jul 2.0 2.0 112.6 172.914 907 Leaf River WMA, Perry County 3-Apr-2007 11 10 18-Jan 21-Mar 2-Feb 17-Aug 1.9 1.9 66.2 32.415 901 Magna Vista, Issaquena County 13-Feb-2007 10 9 3-Dec 30-Jan 21-Dec 5-Jul 2.3 2.1 95.0 120.916 912 Magnolia, Claiborne County 21-Feb-2007 10 9 31-Jan 24-Jan 29-Jun 11-Jan 1.6 1.6 94.2 97.617 901 Mahannah WMA, Issaquena County 19-Feb-2007 20 20 9-Dec 5-Feb 5-Jan 20-Jul 1.6 2.0 88.1 68.018 907 Old Pearl Game Mgt, Simpson County 14-Mar-2007 3 2 17-Dec 20-Jan 30-Dec 14-Jul 2.0 2.0 77.5 56.519 901 Sunflower WMA, Sharkey County 26-Feb-2007 21 19 21-Dec 12-Feb 3-Jan 18-Jul 1.8 1.8 97.5 71.520 905 Tallahatchie/Pinhook, Tippah County 20-Feb-2007 13 10 4-Dec 6-Feb 6-Jan 21-Jul 2.0 1.9 78.0 56.621 900 Togo Island, Claiborne County 22-Feb-2007 10 8 17-Dec 9-Jan 28-Dec 12-Jul 2.1 1.9 94.5 98.922 907 Triple Creek Game Farm, Jasper County 20-Mar-2007 9 9 30-Dec 20-Feb 15-Jan 30-Jul 1.9 1.8 79.1 46.523 901 Twin Oaks WMA, Sharkey County 20-Feb-2007 22 20 17-Dec 6-Feb 10-Jan 25-Jul 1.7 1.8 91.5 58.424 908 Weyhauser - Kemper Co., Kemper County 28-Feb-2007 23 20 24-Dec 28-Feb 11-Jan 26-Jul 2.7 1.9 91.9 42.725 912 Wilderness Forever, Claiborne County 22-Feb-2007 2 2 26-Dec 1-Jan 29-Dec 13-Jul 1.0 1.0 91.0 41.026 901 Williams Farm, Coahoma County 6-Feb-2007 10 7 20-Nov 26-Dec 9-Dec 23-Jun 2.3 2.3 103.6 159.227 906 Yates Property, Noxubee County 12-Mar-2007 16 16 24-Dec 25-Jan 6-Jan 21-Jul 2.1 1.8 85.4 96.2Total: 310 273 Average: 9-Jan 10-JulMean Conception DateMean FawningDateAverage # CLSAverage # FetusesAvg. Dressed WeightAverage KFISoil AreaRegion Name900 Batture901 Delta902 Upper Thick Loess903 Upper Thin Loess905 Upper Coastal Plain906 Blackland PrairieSoil AreaRegion Name907 Lower Coastal Plain908 Interior Flatwoods909 Coastal Flatwoods912 Lower Thick Loess913 Lower Thin LoessN1 = Total 1½ year-old or older fecund(capable of breeding) doesN2= Mature 2½ years old and older does322006-2007 Mississippi Deer Program Report
2007 Deer Herd Health EvaluationHe r d Health2006-2007 Mississippi Deer Program Report33
Mail Survey Data 2005-2006Mail Su r v e yResident Hunter Survey ResultsThere were two significant factors acting on hunter numbers inthe 2005-2006 season. First, the definition of a primitive weaponchanged to allow some cartridge fired rifles to be used. From thischange, we expected, and received, an increase in primitive weaponhunters. Second, and certainly not least, there was Hurricane Katrina.With the damage and displacement that this storm caused, we expectedoverall hunter numbers and effort to decrease. While the numbersdid decrease, the drops were not as drastic as we expected. Possibly,hunting provided a little piece of normalcy to uprooted lives.Survey methods changed beginning with the 2003 – 2004 season.All data collected after this change, which includes the 2005 – 2006data, must be looked at carefully. Total resident deer hunters by usergroup (gun, archery, and primitive weapons) are shown in Figure 8.Overall, total hunter numbers decreased, but only by a little over 1%.However, an increase is apparent in archery and primitive weaponhunter numbers. Primitive weapons hunters increased by 13%.Deer hunting man-days by user group are shown in Figure 9. Along-term evaluation of hunter man-days reveals a declining trend thatbegan in the mid 1980s. This year, however, a large drop in total mandayswas expected, due to restricted travel and increased fuel pricesfollowing Hurricane Katrina. Total man-days dropped by over 200,000or by almost 8%. Man-days decreased by all hunting methods. Primitiveweapon hunter man-days showed the smallest decrease, likely dueto the influx of new primitive weapon hunters. Primitive weapon andarchery hunters have shown an increasing trend in man-days for severalyears. We expect this trend to continue in the 2006-2007 season.Total hunter numbers have remained relatively constant for the pastfew years, but the remaining hunters are choosing to hunt with morethan just modern firearms.Total resident deer harvest for the 2005 – 2006 season is depictedin Figure 10. This graph includes the harvest of bucks and does fromarchery, primitive weapon, and gun deer seasons. Total resident deerharvest increased by about 1,100 compared to the 2004 – 2005 season.This increase is surprising when the 8% decrease in hunter effortis considered. The percent of successful hunters increased to 73.7%of all hunters. Additionally, the average seasonal harvest increasedto 2 deer per hunter. Fewer hunters are harvesting more deer, withless time expended. This would suggest an increasing deer populationstatewide. A balanced buck to doe harvest, also exhibited in Figure 10,can be directly attributed to continued antlerless opportunity offeredon private lands.Archery and primitive weapon deer hunters harvested 31% of thetotal deer harvested and 39% of total does harvested. Archery andprimitive weapon hunters harvested more does than bucks.Non-Resident Hunter Survey ResultsNon-resident deer hunter numbers are shown in Figure 11. Totalhunter numbers remained relatively stable compared to the 2004– 2005 season.Non-resident harvest information is presented in Figure 12. Bothbuck and doe harvest increased. Non-resident man-days by methodare shown in Figure 13. Man-days decreased slightly for archery hunters,but increased substantially for primitive weapon and gun hunters.Hurricane Katrina did not have the same effect on non-resident huntersas it did on resident hunters. Success rates for non-resident huntersincreased from the 2004 – 2005 season.2005-2006 Summary (Resident and Non-Resident Combined)The total number of deer harvested increased by about 2,700 from 141,012 does, for a total of 285,130 deer. It took an average of 9.9the 2004 – 2005 season. A total of 146,700 deer hunters spent man-days per deer harvested. Hunters spent an average of 19.3 mandayshunting during the 2,829,309 man-days deer hunting and harvested 144,118 bucks andseason.Table 4. Mail Survey Summary for 2005-2006 SeasonAveragePercentTotal Harvest Total Numbers Seasonal Total Man-days SuccessfulHarvestHuntersTotalResidentNon-ResidentResidentNon-ResidentTotalResidentNon-Resident Resident Resident Total Resident Non-ResidentTotal DeerBuckDoeArchery TotalBuckDoePrimitive TotalBuckDoeGun TotalBuckDoe256,870 28,260 285,130 128,180 18,520 146,700 2.00 1.53 2,542,662 286,647 2,829,309 73.70 69.20130,629 13,489 144,118 1.02 0.73 59.20 49.40126,241 14,771 141,012 0.98 0.80 51.60 47.7031,841 3,236 35,077 37,250 4,534 41,784 0.85 0.71 372,463 39,512 411,975 48.50 44.509,389 913 10,302 0.25 0.20 20.30 15.9022,452 2,323 24,775 0.60 0.51 41.60 36.8046,741 4,294 51,035 57,354 5,831 63,185 0.81 0.74 381,539 37,367 418,906 56.80 52.5020,003 1,714 21,717 0.35 0.29 30.60 26.1026,738 2,579 29,317 0.47 0.44 39.10 36.00178,289 20,731 199,020 120,220 16,902 137,122 1.48 1.23 1,681,590 200,931 1,882,521 69.80 68.30101,238 10,862 112,100 0.84 0.64 55.80 48.0077,051 9,869 86,920 0.64 0.58 42.10 41.50342006-2007 Mississippi Deer Program Report
Mail Survey Data 2005-2006Figure 8: Total Deer Hunters – ResidentFigure 9: Total Man-days – ResidentFigure 10: Total Deer Harvest – ResidentFigure 11: Total Deer Hunters – Non-ResidentMail surveyFigure 12: Total Deer Harvest – Non-ResidentFigure 13: Total Man-days – Non-Resident2006-2007 Mississippi Deer Program Report35
Statewide Sex Ratio and Fawn Crop EstimatesSex Rat i oMDWFP began distributing Bowhunter Observation Books beforethe 2005-2006 deer archery season. Efforts to increase distributionof the books increased in the 2006-2007 season. Also, a statewidespotlight count was conducted from October 16 – 20, 2006to gain data to compare against the Bowhunter Observation Books.Following is a description and the results of each method.The Bowhunter Observation Books were distributed throughsporting goods stores, feed stores, and were available online.Almost 2,000 of the books were distributed in September2006. A total of 88 books were returned by the December1st deadline. Participating bowhunters observed 3,803 totaldeer at 1.11 deer per hour. They recorded 3,431.75 hoursin 49 counties. Total hours of observation by countyare presented in Figure 14. Not enough data was collectedto produce sex ratio and fawn crop estimates bycounty.A total of nine different spotlight routes were establishedacross the state, with six of the routes on the NatchezTrace Parkway (Figure 15). All routes except onewere sampled three nights. One route was sampled twonights. Total numbers of bucks, does, fawns, and unknowndeer observed were recorded for each night. Anapproximate age was assigned to each buck. No densityestimates were derived from the survey. A total of 917miles were driven during the survey and 2,012 deer werecounted, of which 68% were identified as buck, does, orfawns. Estimates are provided for each route on Figure15.The Statewide Spotlight Count and Bowhunter ObservationBooks produced very similar statewide estimates(Table 5). Based on these results, Mississippi has about3 does for every buck. We will discontinue the StatewideSpotlight Count. However, we plan to continue distributingBowhunter Observation Books. If you wouldlike to assist the MDWFP in collecting observationdata during archery season, you may downloadthe book from our website, www.mdwfp.com/deer or call 601-432-2199 to request abook.Figure 14Table 5. StatewideSpotlight and BowhunterObservation Books DataStatewide Spotlight CountBowhunter ObservationBooks1 Buck : 3 Does 1 Buck : 2.69 Does0.60 Fawns : 1 Doe 0.52 Fawns : 1 Doe362006-2007 Mississippi Deer Program Report
Statewide Sex Ratio and Fawn Crop EstimatesSex Rat i oFigure 152006-2007 Mississippi Deer Program Report37
Deer TagsDeer Ta g sManagement Buck TagsIn 2003 – 2004, the first time since 1995, sub – 4point bucks were legal for harvest with sub – 4point tags issued by biologists to DMAP cooperatorson a limited basis for management purposes. In2005– 2006 this was expanded to include managementbucks. Management buck tags were issuedto DMAP cooperators which allowed the harvest ofsub-optimal bucks. The management buck harvestcriteria were for an individual property and weredetermined by the DMAP biologist. A written managementjustification issued by the MDWFP mustaccompany any request for such a permit. Managementbucks harvested under this permit must beidentified with a tag immediately upon possession.Antlered deer taken by permit are not subject to theannual or daily bag limit on antlered deer.Permits were issued to the following WMAs forthe 2006 – 2007 season: Calhoun County, CopiahCounty, Hamer, Lake George, Leroy Percy, Mahannah,Malmaison, O’Keefe, Shipland, Stoneville, Sunflower,Twin Oaks, Upper Sardis, and Yockanookany.A total of 1,501 permits were issued to these WMAsand 39 of these permits were used.Permits were issued to the following DMAP clubsfor the 2006 – 2007 season: Noxubee NationalWildlife Refuge, Coahoma County Conservation League, Ashbrook,Bledsoe, Riverside Farms, Chesterfield, Casey Jones, Moore Farms,Big Black Wildlife, LLC, Clifton Plantation, Cameron Farms, Big RiverFarms, Box B, TCP, Deviney, Togo Island, Catfish Point, Black River,Burkes, Ward Lake, Yates, Bozeman Farms, Dry Grove, Breakwater, IttaBena, Horseshoe Lake, Halifax, Red Gate, Providence 2, Providence1, White Oak, Spell, Barefoot, Infolab, Woodstock, Atwood, Merigold,Deer Creek Timber, Canemount, Bush Bottom, Montgomery Farms,Triple Creek Game Club, Miller Point, Palmer Farms, Fairview, BlackBear, Magna Vista, Jackson Point, Millbrook, Lockhardt - Dalewood,Duck Lake, Burl Branch, Arkabutla Lake, Brierfield, Paradise, Palmyra,Rosedale, Chiefs, Goat Hill, Bellweather Plantation, Melrose, DeltaWildlife – Luckett, Delta Wildlife – Mabry, Delta Wildlife – Greasy Bayou,Delta Wildlife – Parker Gary, Delta Wildlife - Thornton, Willow Oak,A&B, P&L, Clanton Farms, Pinhook, Solitude, J. Cameron Plantation,Centennial, Cypress Brake, Riverbend Farms, Riverbend South, Tara,Scotland H.C., Woodburn, Fitler Farms, East Line, Casey Jones, HuntersChaple, Dave Kitchens, Wrights Creek, Prewitt, Mt. Ararat, Ellislie,Cedar Ridge, Jeff H.C., Riverland H.C., 27 Break, Deerfield, Wolf Creek,Wildwood, Williams Farm, Craigside Plantation, Donaldson Pt., BlackBayou, Bogue Felia, Wood Lawn, Sewell H.C., Bowman, Attala DeerCamp, Dancing Rabbit, Big Horn, Robertson, Willow Break, Smallwood,Refuge. A total of 1,760 permits were issued to these clubs and910 of these permits were used.Fee ManagementAssistance ProgramThe Fee Management Assistance Program (FMAP) was implementedduring the 1989-1990 season. It began as a pilot program in twonorth-central counties at the request of local conservation officers,in response to “We have too many does, how do we get a hold onthem. Current season either-sex opportunity does not allow enoughAn example of proper usage of a management buck tag.time to harvest our does.” Under this program, doe tags were purchasedfor $10 each at a rate of one per 50 acres. The landowner orclub was required to show proof of ownership or hunting control.FMAP allowed the permittee to harvest antlerless deer in addition tothe state bag limit. This program was accepted and quickly spreadstatewide. Sportsmen realized they could properly harvest does andstill maintain a huntable number of deer.Initially, a large number of permits were sold. However, liberalizationof antlerless opportunity has occurred throughout the state. Thishas decreased the need for permits in most areas to the point ofconsidering termination of the program. There were only 242 permitssold during the 2006-2007 hunting season.Continuation of the program is recommended because it providesan opportunity to harvest antlerless deer in excess of the season baglimit on specific areas that are in excess of the environmental carryingcapacity.DMAP Antlerless TagsMDWFP issues antlerless tags to DMAP clubs. This allows theharvest of antlerless deer in excess of the daily and seasonal bag limits.These tags have been issued since the implementation of DMAP.When antlerless seasons were liberalized statewide, the need forantlerless tags was reduced. However, some landowners and managersstill have the need for more antlerless harvest than state baglimits allow.Antlerless tags are issued by the DMAP Biologists, based on anindividual landowner’s or manager’s need. The tags can only be usedon antlerless deer on the property to which they were issued.DMAP biologists issued 4,226 tags to 141 DMAP clubs in2006-2007.382006-2007 Mississippi Deer Program Report
Antler RegulationsThe 2006 – 2007 hunting season was the second season for DeerManagement Zone 2 in southeast Mississippi. This zone includesprivate and open public lands south of U.S. Hwy. 84 andeast of MS Hwy. 35. Within the zone, deer hunting opportunity isallowed October 15 through February 15. The objectives of DeerManagement Zone 2 were as follows:1) To protect adult does early which may still be caring forfawns by opening the season two weeks later (Oct 15);2) To provide more hunting opportunity during thebreeding period (Feb. 1-15). Deer herd health evaluationdata collected within the zone indicates mostbreeding occurs during the latter part of Januarythrough early February; and3) To improve the age structure of adult bucksthrough more restrictive antler harvest requirements(4-points AND 10 inch insidespread or 13 inch main beam).The inside spread antler restrictionsplaced on many of the Wildlife ManagementAreas (WMAs) is in its third year. Resultsfrom studies on the effects of the “four-pointlaw” and apparent over-harvest of bucks onsome WMAs support this antler restriction.Initiated for the 1995 – 1996 hunting season,the “four point law” is an example of aframework change.In 2003 – 2004, the first time since 1995,sub – 4 point bucks were legal for harvestwith sub – 4 point tags issued by biologiststo DMAP cooperators on a limited basis formanagement purposes. In 2005 – 2006 thiswas expanded to include management bucks.Management buck tags were issued again in2006 – 2007 to DMAP cooperators which allowedthe harvest of sub-optimal bucks. Themanagement buck harvest criteria were foran individual property and were determinedby the DMAP biologist.Figure 16Antler Re g u l at i o n s2006-2007 Mississippi Deer Program Report39
Hi g h-Fenced En c l o s u r e sHouse Bill 1144 was signed into law during 2007 (Section 49-7-58.4,Mississippi Code of 1972). This legislation gave the Commissionon Wildlife, Fisheries, and Parks and the Mississippi Department ofWildlife, Fisheries, and Parks (MDWFP) plenary power to regulate allcommercial and noncommercial wild animal enclosures. House Bill1144 will allow the agency to conserve and protect native wildlife forall citizens to enjoy in addition to protecting our recreational economy,which is dependent on native wildlife resources. House Bill1144 mandated that the Commission on Wildlife, Fisheries andParks regulate any facility that prevents the free ingressand egress of native or nonnative cervids. The bill alsorequired the MDWFP to inventory the number, location,and size of wild animal enclosures within the state andrecord the types of non-native animals held in suchenclosures. This bill also required the MDWFP to filea report containing the above information with theWildlife, Fisheries, and Parks Committees of theSenate and the House of Representatives beforeJanuary 3, 2007.On August 18, 2006, Public Notice W-3780was adopted by the Commission on Wildlife,Fisheries, and Parks. Public Notice W-3780 requiredall enclosure owners to register their facilitywith the MDWFP by January 1, 2007. Enclosureregistration forms were mailed to all knownowners of enclosures (177 forms mailed) thatcontained white-tailed deer and/or non-nativeanimals, excluding small game enclosures. Theenclosure registration form was also made availableto the public on the MDWFP’s web site. Thegeneral public was informed about the requiredregistration through press releases, media appearances,and the MDWFP’s web site. Small game(coyote, fox, and rabbit) enclosure information wasobtained from registration/permit data maintainedby MDWFP District Offices.As of December 31, 2006, one hundred sixtynine(169) enclosures have been registered. Figures17 – 18 illustrate locations of registeredenclosures. Following are the results of theregistration:• 48 registered enclosures containingwhite-tailed deer only (38,648 acres).• 35 registered enclosures containingwhite-tailed deer and non-nativeanimals (18,686 acres).• 86 registered enclosures containingnon-native animals only(9,655 acres).• 15 registered species of nonnativeanimals.The MDWFP is currently reviewing all lawsand regulations regarding high-fenced enclosures.Interest in building enclosures appears tobe growing. Because of this interest, regulationsthat will conserve and protect native wildlife areneeded.High-Fenced EnclosuresFigure 17: Known Large Mammal Enclosuresas of November 2007402006-2007 Mississippi Deer Program Report
Figure 18: Known Whitetail Deer onlyEnclosures as of November 2007High-Fenced EnclosuresHi g h-Fenced En c l o s u r e s2006-2007 Mississippi Deer Program Report41
Deer Management Assistance Program (DMAP)DMAPThrough a cooperative research program with MississippiState University in 1976, the MississippiDepartment of Wildlife, Fisheries and Parksgained information which provided biologistswith the ability to evaluate population densityrelative to carrying capacity, using conditionindicators rather than population estimates orbrowse surveys. This Cooperative Deer ManagementAssistance Program (DMAP) directlyinvolved hunters in management through thecollection of biological data. The interpretation ofthese data, in consultation with a biologist, is theguiding principle of DMAP. From a two-county pilotproject in its first year, DMAP grew steadily until participationpeaked in 1994 at almost 1,200 cooperators with over3.25 million acres under management.SPECIAL NOTE: Beginning with the 2001 data, theMDWFP began using a new computer summary program(XtraNet). This may be the cause for drastic differencesin some numbers. Once all of the historicdata is entered into the XtraNet system the numbersare expected to fall along the same trend,thus eliminating the drastic drop currently observedin the graphs and tables. Additionally,all DMAP summary tables and graphs nowinclude harvest reports from WMA’s thatcollect deer harvest data.Liberalized season structure and baglimits during the mid-1990’s allowed landmanagers the flexibility to meet harvestobjectives outside DMAP guidelines, whichresulted in a decline in DMAP participation(Figure 20). This decline reduced both totalacreage and number of cooperators inDMAP. Current enrollment includes 670 cooperatorswith 2.1 million acres. Total DMAPharvest has declined proportionally with thedecline in cooperators and acreage in DMAP(Figure 21.The ability to collect and analyzeDMAP data has been exceptional.Hundreds of thousands of deer arenow part of the statewide DMAPdatabase. In excess of 10,000 deerhave annually been available forcomparative purposes since1983 (Figure 21). Analysis ofthese data over time capturedthe obvious trends and subtlechanges in deer herd conditionand structure. These trendsand changes would have goneundocumented and possiblyundetected without DMAP.Clubs and landowners participatingin DMAP may or may not be representative of hunter goals andobjectives on a statewide basis. Therefore, deer condition and herdstructure on DMAP lands may not reflect herds on un-managed lands.Figure 19: DMAP Cooperators by CountyHowever, a data source representing over 2 millionacres is credible and can be used to examine trenddata. The extensive statewide coverage of DMAPat the county level can be seen in Table 6.All DMAP data are evaluated based on soil region.These data are presented in Tables 10-20.These summaries allow individual DMAP cooperatorsto compare their data to soil regionaverages. In these tables are two sets of averagesas well. The first is an average from 1991 –1994 and the second is of the last five years (2002– 2006). The 1991 – 1994 average is the four years priorto the 4-point law. Significant differences are obvious whencomparing these averages.A significant trend in DMAP datais obvious. The average age of allharvested bucks has increasedfrom 2.1 years old in 1991 to 3.0years old in 2006 (Figure 23). In addition,these older age class bucksare being produced and harvestedon a declining acreage base (Figure24). One possible reason for the dropin acres per 3½ year old bucks overthe last couple of seasons is the moreliberalized use of management bucktags which allowed DMAP propertiesto harvest sub-optimal adult bucks. Inaddition, the average spread, numberof points, beam length, and circumferenceon all harvested bucks has increasedproportionally.The percentage of harvested bucksin the older age classes (4½+) has increasedas well (Figure 25). This increaseis the result of a shift in buckselection by hunters from younger ageclass bucks (1½ year olds) to older animals.Notice in the same graph, the correspondingdecline in the percentage ofyounger age class bucks, which occur inthe annual harvest. These are very evidentwhen comparing the past 10 yearsto the 1991 – 1994 average.Statewide condition data are presentedin Table 9. This table presentstrend data on various antler parameterssuch as spread, length, circumference,and points. Other information, such asweight and lactation data are also providedin this table.Soil region condition data are presentedin Tables 10-20. These tablesalso present trend data on various antlerparameters such as spread, length, circumference, and points.Other information, such as weight and lactation data are provided inthese tables as well.422006-2007 Mississippi Deer Program Report
Mississippi DMAP DataFigure 20: DMAP Acreage & CooperatorsFigure 21: DMAP Deer HarvestDMapFigure 22: Acres/Deer HarvestedFigure 23: Average Age All BucksFigure 24: Acres/3.5+ BucksFigure 25: Percent Bucks by Age Class2006-2007 Mississippi Deer Program Report43
Table 6. DMAP Participation and Harvest by CountyDuring 2006-2007HarvestHarvestCountyCooperatorsAcresBucksDoesTotalCountyDMAPCooperatorsAcresBucksDoesTotalAdams 22 74,988 379 572 951Alcorn 0Amite 7 27,679 150 206 356Attala 12 41,064 187 273 460Benton 0Bolivar 7 41,824 263 369 632Calhoun 3 14,088 84 64 148Carroll 19 52,454 363 511 874Chickasaw 2 29,500 34 37 71Choctaw 5 31,800 72 103 175Claiborne 54 95,365 742 1,226 1,968Clarke 4 18,200 47 114 161Clay 12 30,243 104 113 217Coahoma 9 44,750 242 340 582Copiah 10 28,678 130 341 471Covington 0Desoto 1 5,000 14 7 21Franklin 2 3,700 30 24 54George 2 18,750 9 8 17Greene 4 10,652 25 29 54Grenada 5 15,000 48 103 151Hancock 1 5,880 7 8 15Harrison 1 1,400 1 3 4Hinds 21 43,590 335 575 910Holmes 17 30,226 168 305 473Humphries 4 9,800 24 75 99Issaquena 47 107,686 728 1,087 1,815Itawamba 4 34,348 128 74 202Jackson 4 24,510 47 32 79Jasper 9 43,478 106 200 306Jefferson 22 54,419 277 588 865Jeff Davis 0Jones 1 35,000 21 13 34Kemper 11 35,492 232 292 524Lafayette 9 58,658 156 225 381Lamar 4 12,569 29 23 52Lauderdale 5 20,222 47 82 129Lawrence 4 13,501 52 102 154Leake 4 11,730 61 93 154Lee 0Leflore 9 11,987 62 170 232LincolnLowndesMadisonMarionMarshallMonroeMontgomeryNeshobaNewtonNoxubeeOktibbehaPanolaPearl RiverPerryPikePontotocPrentissQuitmanRankinScottSharkeySimpsonSmithStoneSunflowerTallahatchieTateTippahTishomingoTunicaUnionWalthallWarrenWashingtonWayneWebsterWilkinsonWinstonYalobushaYazooTOTAL1 3,642 18 21 3910 24,248 76 151 22716 40,264 221 648 8694 16,695 115 80 1952 5,200 18 68 8621 61,777 219 343 56217 28,004 177 320 4971 7,655 16 45 614 9,198 55 71 12617 54,900 283 406 6894 12,494 34 76 1109 19,312 115 228 3436 35,945 88 63 1512 41,778 52 35 87001 6,000 8 8 162 12,214 37 75 1128 24,666 116 159 2756 17,110 53 116 1693 67,040 79 118 1973 14,000 51 78 1292 9,267 43 43 864 93,292 18 13 311 1,585 3 4 73 4,795 11 39 5004 17,213 51 103 1546 21,847 101 143 2444 13,904 50 125 1755 20,100 68 67 1351 5,325 28 30 5890 148,937 1,231 1,672 2,9039 34,934 252 381 6331 11,500 7 1 82 7,610 41 42 8311 32,215 228 296 5246 16,700 89 106 1951 4,872 23 57 8026 54,625 412 566 978670 2,139,094 9,891 15,184 25,075442006-2007 Mississippi Deer Program Report
Mississippi DMAP DataTable 7. Harvest Summary of Bucks by Age ClassSeason199219931994*1995*1996199719981999+2000 +200120022003200420052006Sample0.5 Bucks 1.5 Bucks 2.5 Bucks 3.5 Bucks 4.5+ Bucks Avg. Age Total Acres/# % # % # % # % # % All Bucks 3.5+ Bucks 3.5+ Bucks17,631 1,410 8 8,025 46 5,154 29 2,255 13 831 5 2.1 3,086 84718,585 1,301 7 8,527 46 5,488 30 2,489 13 852 5 2.1 3,341 74019,128 1,530 8 7,063 37 6,529 34 3,020 16 1,045 5 2.2 4,065 68514,650 1,172 8 3,391 23 5,503 38 3,367 23 1,187 8 2.5 4,554 56016,350 1,308 8 3,246 20 6,489 40 3,601 22 1,697 10 2.3 5,298 50014,405 1,296 9 2,737 19 5,474 38 3,601 25 1,585 11 2.4 5,186 45613,278 1,062 8 2,257 17 4,913 37 3,452 26 1,859 14 2.5 5,311 41012,336 864 7 1,727 14 4,441 36 3,577 29 1,850 15 2.5 5,428 39311,329 680 6 1,586 14 3,965 35 3,285 29 1,813 16 2.6 5,098 37910,639 426 4 1,277 12 3,511 33 3,192 30 2,021 19 2.7 5,213 45711,191 448 4 1,343 12 3,357 30 3,469 31 2,462 22 2.8 5,931 43410,646 426 4 1,490 14 2,874 27 3,300 31 2,449 23 2.8 5,749 4499,992 300 3 1,099 11 2,798 28 3,297 33 2,398 24 2.9 5,695 4509,559 382 4 1,147 12 2,199 23 3,250 34 2,485 26 3.0 5,735 3899,891 396 4 1,385 14 1,978 20 3,066 31 3,066 31 3.0 6,132 358DMAPMississippi DMAP DataTable 8. Harvest Summary of Antlerless Deer by Age ClassSeason199219931994*1995*1996199719981999+2000 +200120022003200420052006Sample0.5 Bucks 0.5 Does 1.5 Does 2.5 Does 3.5+ Does Avg. Age# % # % # % # % # % All Does16,870 1,366 8 1,897 11 3,634 22 3,434 20 6,539 39 2.420,481 1,218 6 1,827 9 4,756 23 4,352 21 8,328 41 2.423,330 1,470 6 2,339 10 4,769 20 5,353 23 9,399 40 2.525,997 1,187 5 2,691 10 5,903 23 5,599 22 10,619 41 2.423,410 1,171 5 2,341 10 5,150 22 5,150 22 9,598 41 2.521,763 1,088 5 2,176 10 4,788 22 4,570 21 9,140 42 2.517,601 704 4 1,584 9 3,872 22 3,696 21 7,744 44 2.616,288 652 4 1,466 9 3,420 21 3,746 23 7,004 43 2.615,228 457 3 1,066 7 3,350 22 3,350 22 7,005 46 2.713,451 390 3 713 5 3,040 23 3,242 24 5,959 44 2.714,260 385 3 913 6 3,009 21 3,437 24 6,702 47 2.715,038 361 2 917 6 3,399 23 3,624 24 7,023 47 2.814,763 340 2 989 7 3,145 21 3,558 24 6,732 46 2.713,397 402 3 938 7 2,545 19 2,947 22 6,565 49 2.815,184 456 3 1,063 7 2,885 19 3,037 20 7,744 51 2.9*1995* Four points or better law initiated and bag limit changed from 5 bucks and 3 antlerless to 3 bucks and 5 antlerless with DMAPand FMAP participants exempt from the annual bag limit - 2 additional antlerless may be taken with archery equipment+2000+ Bag limit changed to 3 bucks and 3 antlerless with DMAP and FMAP participants exempt from the annual bag limit, 2 additionalantlerless may be taken with archery equipment. Four points or better law remain in effect.2006-2007 Mississippi Deer Program Report45
Table 9. Statewide Compiled DMAP DataStatewide DMAPSeasonAverage06 05 04 03 02 01 00+ 99 98 97 91-94 02-06Acres 2,139,094 2,308,263 2,443,444 2,475,480 2,430,506 2,297,401 2,602,586 2,662,032 2,748,231 2,857,272 3,105,186 2,355,719Total Deer 25,075 22,956 24,755 25,684 25,451 24,090 26,557 28,624 30,879 36,168 39,138 24,718Bucks 9,891 9,559 9,992 10,646 11,191 10,639 11,329 12,336 13,278 14,405 19,562 10,230Does 15,184 13,397 14,763 15,038 14,260 13,451 15,228 16,288 17,601 21,763 19,576 14,488Acres/Deer 85 101 99 96 95 95 98 93 89 79 79.5 95Bucks 216 241 245 233 217 216 230 216 207 198 159 230Does 141 172 166 165 170 171 171 163 156 131 160 163Avg Age ALL Bucks 3.0 3.0 2.9 2.8 2.8 2.7 3.0 2.9 2.9 2.7 2.2 2.6Avg Points ALL Bucks 7.1 7.2 7.2 7.1 7.3 7.2 6.7 6.6 6.3 6.4 4.8 7.0Avg Length ALL Bucks 16.5 16.6 16.4 16.0 16.0 15.7 14.6 14.2 13.5 13.7 10.4 31.1Avg Spread ALL Bucks 13.5 13.5 13.4 13.0 13.0 12.8 11.9 11.6 11.0 11.2 8.7 12.7Acres/3.5+Bucks 358 388 449 445 431 457 379 393 410 456 808 413% 0.5 Yr Bucks 4 4 4 3 3 4 5 6 6 7 8 4Weight* 67 74 66 71 75 66 64 63 64 62 63 65% 1.5 Yr 14 12 11 14 12 12 14 16 17 19 44 13Weight* 115 115 112 111 118 115 116 118 115 116 115 115Points 3.1 3.1 3.4 3.6 4.5 4.1 4.4 4.5 4.1 4.3 3.2 4.0Circumf. 2.2 2.3 2.3 2.3 2.5 2.4 2.5 2.5 2.4 2.4 2.2 2.4Length 6.8 6.7 7.2 7.4 9.0 8.3 8.4 8.7 8.2 8.4 6.8 8.1Spread 6.2 6.4 6.7 6.6 7.5 7.3 7.4 7.4 7.2 7.2 6.0 7.0% 2.5 Yr 20 22 28 27 30 34 35 36 36 37 31 25Weight* 148 149 149 148 150 145 147 149 146 149 148 148Points 6.9 6.8 6.8 6.8 7.0 6.9 6.9 7.0 6.8 7.0 6.6 6.9Circumf. 3.4 3.5 3.4 3.4 3.5 3.3 3.4 3.4 3.4 3.4 3.3 3.4Length 14.7 14.6 14.5 14.4 14.7 14.3 14.4 14.5 14.1 14.4 14.0 14.4Spread 12.0 11.9 12.0 11.7 11.9 11.6 11.7 11.9 11.5 11.9 11.4 11.7% 3.5 Yr 31 34 33 31 31 30 30 28 26 26 14 32Weight* 169 170 169 172 169 166 168 170 165 165 163 169Points 7.8 7.7 7.7 7.8 7.8 7.8 7.9 7.9 7.8 7.8 7.5 7.8Circumf. 4.0 4.0 4.0 4.0 4.0 3.9 4.0 4.0 3.9 3.9 3.9 4.0Length 17.6 17.5 17.3 17.6 17.2 17.1 17.4 17.4 16.9 17.1 16.7 17.3Spread 14.2 14.1 14.0 14.1 13.9 13.8 14.1 14.2 13.6 13.9 13.5 14.0% 4.5+ Yr 31 27 24 23 22 19 16 14 14 12 5 25Weight* 185 185 185 186 184 182 182 183 178 175 173 183Points 8.3 8.4 8.3 8.3 8.3 8.3 8.3 8.5 8.3 8.2 8.1 8.3Circumf. 4.5 4.5 4.5 4.5 4.5 4.4 4.5 4.5 4.4 4.4 4.3 4.5Length 19.7 19.7 19.7 19.7 19.5 19.4 19.6 19.4 19.0 19.0 18.6 19.5Spread 15.8 15.7 15.7 15.6 15.5 15.4 15.6 15.5 15.0 15.2 14.9 15.5# 4.5 Yr 1672 1609 1461 1511 1484 1250 1257 1183 1082 1093 589 1543Weight* 183 182 183 184 182 179 181 182 176 173 173 181Points 8.2 8.3 8.2 8.2 8.3 8.2 8.3 8.4 8.2 8.1 8.1 8.3Circumf. 4.4 4.4 4.4 4.4 4.4 4.3 4.4 4.4 4.3 4.3 4.2 4.4Length 19.3 19.2 19.4 19.4 19.2 18.9 19.4 19.1 18.7 18.7 18.6 19.2Spread 15.5 15.4 15.6 15.4 15.3 15.1 15.5 15.4 14.8 15.0 14.8 15.3* ALL weights are live weights00+ Year bag limit changed (3-5 to 3-3, bucks-antlerless) continue minimum 4 points or more462006-2007 Mississippi Deer Program Report
Table 9. ContinuedSeasonAverage06 05 04 03 02 01 00+ 99 98 97 91-94 02-06# 5.5 Yr 834 650 530 576 579 467 395 372 339 334 151 633Weight* 186 189 189 190 186 185 186 185 181 180 174 187Points 8.4 8.4 8.5 8.4 8.5 8.5 8.4 8.6 8.5 8.3 7.9 8.4Circumf. 4.6 4.6 4.6 4.6 4.6 4.5 4.6 4.6 4.5 4.5 4.4 4.6Length 19.9 20.4 20.2 20.2 20.0 20.1 19.9 20.1 19.6 19.7 18.9 20.1Spread 15.9 16.1 16.0 16.0 15.9 15.9 15.9 15.8 15.4 15.9 15.1 15.9# 6.5 Yr 327 236 194 202 146 159 125 112 118 85 44 221Weight* 191 192 192 191 191 187 186 187 182 178 176 189Points 8.3 8.5 8.2 8.4 8.4 8.3 8.6 8.5 8.7 8.5 8.3 8.4Circumf. 4.8 4.7 4.7 4.7 4.6 4.7 4.7 4.7 4.6 4.5 4.5 4.7Length 21.0 20.8 20.4 20.5 20.6 20.6 20.4 19.9 20.1 19.9 19.4 20.5Spread 16.4 16.4 16.1 15.9 16.4 16.3 16.1 16.0 15.7 15.9 15.2 16.2# 7.5 Yr 99 78 65 71 45 63 39 48 35 35 18 72Weight* 192 192 189 190 192 183 187 189 185 170 168 188Points 8.6 8.3 8.7 8.3 8.6 9.0 8.1 8.6 8.5 8.2 7.4 8.5Circumf. 4.7 4.7 4.7 4.8 4.7 4.7 4.8 4.9 4.3 4.5 4.4 4.7Length 21.0 20.6 20.8 20.5 20.2 20.0 20.6 19.8 20.2 19.2 18.3 20.4Spread 16.3 16.0 16.6 16.6 15.3 15.8 16.2 15.8 15.8 15.2 15.0 16.1# 8.5+ Yr 59 46 27 36 44 36 29 23 13 18 11 42Weight* 186 195 183 186 180 190 183 179 191 173 171 184Points 7.7 7.8 8.0 8.1 8.0 8.4 7.4 9.1 10.5 8.5 7.5 8.1Circumf. 4.5 4.4 4.5 4.7 4.6 4.7 4.5 4.5 5.3 4.6 4.3 4.6Length 20.8 19.8 18.6 19.3 20.1 19.5 19.6 20.4 21.5 19.5 18.5 19.8Spread 16.2 15.5 15.0 15.2 15.7 15.2 16.5 16.4 16.8 16.2 14.4 15.7Doe Age Classes%0.5 Yr 7 7 7 6 6 5 7 10 10 11 13 7% 1.5 Yr 20 20 22 23 21 23 23 22 23 23 59 21% 2.5 Yr 20 22 24 22 23 25 23 24 22 23 66 22% 3.5+ Yr 53 51 46 47 47 45 47 45 45 44 70 49Doe Weights*Weight 0.5 Yr 65 66 64 67 66 64 63 62 63 61 11 63Weight 1.5 Yr 98 98 96 96 99 97 96 96 95 95 23 96Weight 2.5 Yr 109 111 109 108 110 108 107 108 107 107 24 108Weight 3.5+ Yr 116 117 115 116 116 117 114 115 113 113 42 115% Doe Lactation1.5 Yr 11 13 11 10 12 10 12 13 12 13 60 132.5 Yr 58 57 56 56 58 58 61 64 59 58 96 602.5+ Yr 68 66 63 64 65 66 68 71 68 67 108 673.5+ Yr 71 70 67 68 69 70 72 75 73 71 115 71All Antlerless H’vst% 0.5 Yr Bk Fawns 3 3 2 2 3 3 3 4 4 5 7 3% 0.5 Yr Doe Fawns 7 7 7 6 6 5 7 9 9 10 10 7%1.5 Yr Does 19 19 21 23 21 23 22 21 22 22 22 21% 2.5 Yr Does 20 20 20 20 20 24 22 23 21 21 22 20% 3.5+ Yr Does 51 49 46 47 47 44 46 43 44 42 39 48Statewide DMAP* ALL weights are live weights00+ Year bag limit changed (3-5 to 3-3, bucks-antlerless) continue minimum 4 points or more2006-2007 Mississippi Deer Program Report47
Mississippi Soil Resource AreasFigure 26So i l Re s o u r c e s482006-2007 Mississippi Deer Program Report
Table 10. Batture Soil Resource AreaSummary of DMAP DataAcresTotal DeerBucksDoesAcres/DeerBucks3.5+ BucksDoesAvg Age ALL Bucks% 0.5 Yr BucksWeight*% 1.5 YrWeight*PointsCircumf.LengthSpread% 2.5 YrWeight*PointsCircumf.LengthSpread% 3.5 YrWeight*PointsCircumf.LengthSpread% 4.5+ YrWeight*PointsCircumf.LengthSpread% Doe Lactation1.5 Yr2.5 Yr3.5+ YrDoe Age Classes% 0.5 Yr% 1.5 Yr% 2.5 Yr% 3.5+ YrDoe Weights*0.5 Yr1.5 Yr2.5 Yr3.5+ YrSeasonAverage06 05 04 03 02 01 00+ 99 98 97 91-94 02-06241,639 243,394 234,398 227,838 236,582 207,187 178,239 171,795 173,182 156,481 172,527 236,0704,392 4,340 4,158 4,588 4,711 4,073 3,191 2,950 2,933 2,752 2,906 4,4171,775 1,757 1,595 1,879 1,935 1,530 1,300 1,308 1,444 1,288 1,449 1,7792,617 2,583 2,563 2,709 2,776 2,543 1,891 1,642 1,489 1,464 1,457 2,63855 56 56 50 50 51 56 58 59 57 60 107136 139 147 121 122 135 137 131 120 121 119 133167 177 205 168 191 215 232 239 240 283 693 18192 94 91 84 85 81 94 105 116 107 120 893.6 3.5 3.4 3.3 3.2 3.1 3.3 3.2 3.1 2.9 2.4 3.44 3 3 4 3 4 7 5 5 5 6 3.270 67 72 84 77 65 70 70 74 67 73 73.86 6 5 5 5 9 7 6 9 8 28 6124 115 116 112 119 115 130 129 127 123 134 1172.5 2.2 2.4 2.6 3.1 2.9 4.4 4.4 4.0 3.4 3.9 2.62.3 2.2 2.4 2.0 2.4 2.4 2.9 2.8 2.5 2.4 2.4 2.36.7 5.0 5.7 5.8 6.0 6.8 9.2 9.5 8.6 6.6 8.2 5.86.1 5.4 6.0 6.0 6.3 7.1 8.7 8.6 7.9 7.1 7.1 6.012 15 16 15 21 24 27 34 36 44 49 16165 159 165 166 166 164 168 167 165 166 169 1647.4 7.3 7.4 7.8 7.7 7.7 7.7 7.8 7.6 7.7 7.5 7.53.7 3.6 3.7 3.7 3.7 3.7 3.7 3.7 3.6 3.6 3.5 3.716.9 16.3 16.8 16.8 16.5 16.4 16.7 16.8 16.2 16.1 15.5 16.713.9 13.3 13.7 13.8 13.6 13.4 13.7 13.7 13.4 13.5 13.0 13.733 35 35 39 38 36 35 36 32 30 14 36183 184 185 187 184 183 188 189 185 187 187 1858.0 8.1 8.2 8.3 8.3 8.3 8.5 8.5 8.4 8.3 8.2 8.24.2 4.3 4.3 4.3 4.2 4.2 4.3 4.3 4.3 4.2 4.2 4.319.4 19.6 19.5 19.5 19.0 19.0 19.9 19.9 19.3 18.8 18.7 19.415.5 15.7 15.8 15.6 15.3 15.4 16.2 16.1 15.5 15.5 15.4 15.645 41 42 36 32 27 24 19 18 13 4 39193 192 193 195 194 192 202 197 193 198 198 1948.2 8.4 8.4 8.5 8.5 8.4 8.5 8.6 8.7 8.5 8.5 8.44.6 4.6 4.6 4.6 4.6 4.6 4.7 4.7 4.6 4.5 4.6 4.620.9 21.1 20.9 20.8 20.5 20.7 21.4 20.9 21.0 20.6 20.8 20.816.6 16.6 16.7 16.6 16.4 16.4 17.1 17.0 16.8 16.7 16.8 16.610 6 7 11 6 8 10 11 10 11 14 863 51 58 55 47 57 63 70 51 48 58 5577 67 69 65 59 65 77 75 63 65 68 677 6 6 8 6 6 9 11 10 9 11 619 19 22 18 20 24 24 18 19 21 20 2024 27 25 27 31 30 25 28 27 28 30 2750 48 47 47 42 40 42 43 44 42 39 4768 68 66 68 69 64 67 68 67 66 68 68103 98 98 101 100 98 104 106 101 104 108 100114 114 112 112 115 114 115 114 115 118 121 113122 121 119 122 122 121 123 124 122 125 126 121* ALL weights are live weights00+ Year bag limit changed (3-5 to 3-3, bucks-antlerless) continue minimum 4 points or moreSo i l Re s o u r c e s2006-2007 Mississippi Deer Program Report49
Table 11. Delta Soil Resource AreaSummary of DMAP DataSo i l Re s o u r c e sAcresTotal DeerBucksDoesAcres/DeerBucks3.5+ BucksDoesAvg Age ALL Bucks% 0.5 Yr BucksWeight*% 1.5 YrWeight*PointsCircumf.LengthSpread% 2.5 YrWeight*PointsCircumf.LengthSpread% 3.5 YrWeight*PointsCircumf.LengthSpread% 4.5+ YrWeight*PointsCircumf.LengthSpread% Doe Lactation1.5 Yr2.5 Yr3.5+ YrDoe Age Classes% 0.5 Yr% 1.5 Yr% 2.5 Yr% 3.5+ YrDoe Weights*0.5 Yr1.5 Yr2.5 Yr3.5+ YrSeasonAverage06 05 04 03 02 01 00+ 99 98 97 91-94 02-06285,183 302,538 318,554 282,497 283,851 240,653 178,239 269,772 256,237 240,360 254,153 293,1492,867 2,802 2,912 3,026 2,938 2,652 3,476 3,503 3,393 3,632 3,909 2,8671,093 1,191 1,169 1,231 1,343 1,096 1,360 1,469 1,467 1,364 1,830 1,1951,774 1,611 1,743 1,795 1,595 1,556 2,116 2,034 1,926 2,268 1,457 1,67299 108 109 93 97 91 84 77 76 66 66 204261 254 273 229 211 220 215 184 175 176 140 245401 335 445 382 407 432 243 375 416 503 962 395161 188 183 157 178 155 138 133 133 106 124 1753.1 3.2 3.2 3.1 3.0 2.9 3.1 3.0 2.9 2.7 2.1 3.16 3 3 4 3 5 5 5 5 7 8 3.674 76 73 69 75 67 69 73 65 66 70 73.418 8 5 7 5 8 9 12 13 12 41 9125 124 127 124 133 120 134 135 131 126 134 1272.3 2.4 3.4 3.3 4.2 3.8 4.1 5.0 4.2 4.3 3.5 3.12.1 2.2 2.4 2.3 2.6 2.3 2.4 2.7 2.5 2.4 2.4 2.35.0 5.3 7.1 7.7 8.9 6.5 8.1 9.2 8.8 7.8 7.3 6.84.9 5.5 7.0 7.0 8.3 7.8 7.8 7.9 7.6 7.2 6.4 6.513 16 24 22 28 28 32 34 40 46 36 21170 170 174 175 170 164 167 168 167 163 169 1717.2 7.3 7.5 7.6 7.3 7.4 7.4 7.8 7.5 7.2 7.3 7.43.7 3.7 3.8 3.8 3.6 3.4 3.5 3.6 3.6 3.4 3.5 3.716.5 16.5 16.9 16.5 15.8 15.6 15.6 15.8 15.3 14.8 15.1 16.413.9 13.6 14.2 13.6 13.0 12.9 13.1 13.2 13.0 12.7 12.8 13.630 38 35 36 37 33 36 33 28 26 12 35189 188 190 191 187 183 191 191 187 184 187 1898.4 8.1 8.3 8.2 7.9 8.1 8.2 8.2 8.3 8.2 8.1 8.24.3 4.2 4.3 4.2 4.0 4.0 4.2 4.2 4.1 4.1 4.1 4.219.3 19.1 19.0 18.9 18.2 18.4 19.0 18.6 18.4 18.2 18.0 18.915.8 15.5 15.7 15.2 14.8 14.8 15.6 15.5 15.2 14.8 14.9 15.434 35 32 30 26 25 18 16 14 9 4 31199 199 197 200 196 198 204 202 200 197 197 1988.6 8.6 8.6 8.4 8.3 8.4 8.5 8.8 8.4 8.9 8.4 8.54.5 4.7 4.6 4.6 4.5 4.4 4.6 4.6 4.4 4.5 4.4 4.520.6 20.7 20.9 20.3 20.0 20.2 21.0 20.8 20.2 20.3 19.5 20.516.6 16.6 16.7 16.0 16.2 16.0 17.0 16.6 16.1 16.3 15.8 16.416 16 12 10 12 13 20 18 14 13 16 1361 60 58 57 59 57 68 70 59 59 58 6072 68 67 68 69 68 76 78 70 69 71 699 8 9 7 7 6 8 10 9 9 12 821 19 21 24 21 23 22 20 22 22 21 2120 24 26 24 26 25 23 23 25 29 27 2450 48 43 44 46 45 47 47 44 40 41 4669 69 67 72 73 70 70 69 67 68 66 70108 105 103 105 106 103 107 107 103 104 109 105119 118 116 119 119 116 117 117 116 117 121 118126 125 124 127 126 124 124 123 121 125 129 125* ALL weights are live weights00+ Year bag limit changed (3-5 to 3-3, bucks-antlerless) continue minimum 4 points or more502006-2007 Mississippi Deer Program Report
Table 12. Upper Thick Loess Soil Resource AreaSummary of DMAP DataAcresTotal DeerBucksDoesAcres/DeerBucks3.5+ BucksDoesAvg Age ALL Bucks% 0.5 Yr BucksWeight*% 1.5 YrWeight*PointsCircumf.LengthSpread% 2.5 YrWeight*PointsCircumf.LengthSpread% 3.5 YrWeight*PointsCircumf.LengthSpread% 4.5+ YrWeight*PointsCircumf.LengthSpread% Doe Lactation1.5 Yr2.5 Yr3.5+ YrDoe Age Classes% 0.5 Yr% 1.5 Yr% 2.5 Yr% 3.5+ YrDoe Weights*0.5 Yr1.5 Yr2.5 Yr3.5+ YrSeasonAverage06 05 04 03 02 01 00+ 99 98 97 91-94 02-06289,445 286,330 256,675 258,147 242,703 236,886 196,733 234,944 245,798 268,894 210,775 266,4465,294 4,624 4,148 4,053 3,595 3,680 2,909 3,722 3,596 4,268 2,732 4,3281,960 1,800 1,564 1,489 1,416 1,404 1,142 1,509 1,466 1,691 1,443 1,6423,334 2,824 2,584 2,564 2,179 2,276 1,767 2,213 2,130 2,577 1,457 2,68555 62 62 64 68 64 68 63 68 63 78 123148 159 164 173 171 169 172 155 168 159 146 162262 287 290 298 316 344 392 399 493 468 1179 29087 101 99 101 111 104 111 106 115 104 169 992.9 2.8 2.8 2.9 2.9 2.8 2.9 3.2 3.1 2.9 2.4 2.86 6 4 5 5 6 6 8 9 8 7 5.368 68 69 74 69 70 69 69 68 68 72 69.518 16 15 12 10 11 12 17 17 20 53 14119 118 114 112 124 120 121 128 129 131 132 1172.9 2.5 2.6 2.8 4.4 3.6 4.2 4.4 4.4 4.5 3.9 3.02.2 2.1 2.0 2.2 2.5 2.3 2.6 2.6 2.6 2.6 2.5 2.26.4 5.7 5.7 6.0 8.5 7.5 8.2 8.8 8.6 9.1 8.1 6.55.8 5.5 5.4 5.9 7.4 7.3 7.6 7.7 7.7 7.6 6.9 6.019 24 25 23 30 32 38 36 40 38 28 24155 157 154 154 160 154 156 161 160 161 163 1567.0 7.0 7.0 7.2 7.3 7.3 7.2 7.3 7.1 7.2 7.0 7.13.6 3.6 3.5 3.5 3.7 3.5 3.5 3.6 3.5 3.6 3.5 3.615.1 15.1 14.7 15.0 15.2 14.8 14.8 15.1 14.7 15.1 14.9 15.012.4 12.4 12.4 12.6 12.5 12.2 12.2 12.6 12.3 12.6 12.5 12.528 33 33 33 33 31 31 28 27 25 11 32176 178 176 179 176 173 179 186 185 186 190 1777.9 7.9 7.8 8.0 8.0 7.9 8.2 8.3 8.1 8.2 8.1 7.94.2 4.3 4.1 4.2 4.1 4.0 4.1 4.3 4.3 4.3 4.3 4.218.2 18.1 17.8 18.1 17.6 17.4 17.9 18.2 18.6 18.6 18.6 18.014.7 14.7 14.3 14.7 14.4 14.2 14.5 14.9 15.0 15.2 15.3 14.629 22 22 25 22 20 13 11 7 9 2 24189 191 189 192 193 189 193 201 200 195 211 1918.3 8.5 8.2 8.2 8.3 8.3 8.6 8.8 8.6 8.2 8.6 8.34.7 4.7 4.6 4.6 4.7 4.5 4.6 4.8 4.7 4.7 5.0 4.620.1 19.9 19.8 19.9 19.8 19.6 20.3 20.4 20.5 20.4 21.1 19.916.0 16.0 15.9 15.8 16.0 15.8 16.1 16.3 16.2 16.7 17.1 15.912 13 11 10 13 8 11 13 13 9 12 1258 59 56 54 66 61 64 64 61 57 60 5971 73 68 66 70 70 72 77 70 67 66 696 7 7 7 7 6 6 10 11 11 12 719 19 20 22 20 21 24 22 23 22 23 2021 22 23 20 22 22 22 25 23 21 25 2154 52 49 51 51 51 48 43 43 46 41 5165 65 65 68 65 66 64 66 69 67 66 66101 102 100 99 106 103 103 104 104 105 107 102112 115 113 113 115 114 115 117 116 118 120 114120 122 120 121 122 123 122 125 124 126 128 121* ALL weights are live weights00+ Year bag limit changed (3-5 to 3-3, bucks-antlerless) continue minimum 4 points or moreSo i l Re s o u r c e s2006-2007 Mississippi Deer Program Report51
Table 13. Lower Thick Loess Soil Resource AreaSummary of DMAP DataSo i l Re s o u r c e sAcresTotal DeerBucksDoesAcres/DeerBucks3.5+ BucksDoesAvg Age ALL Bucks% 0.5 Yr BucksWeight*% 1.5 YrWeight*PointsCircumf.LengthSpread% 2.5 YrWeight*PointsCircumf.LengthSpread% 3.5 YrWeight*PointsCircumf.LengthSpread% 4.5+ YrWeight*PointsCircumf.LengthSpread% Doe Lactation1.5 Yr2.5 Yr3.5+ YrDoe Age Classes% 0.5 Yr% 1.5 Yr% 2.5 Yr% 3.5+ YrDoe Weights*0.5 Yr1.5 Yr2.5 Yr3.5+ YrSeasonAverage06 05 04 03 02 01 00+ 99 98 97 91-94 02-06143,685 145,715 147,216 160,276 153,658 148,830 166,906 193,570 211,427 226,654 233,912 149,7582,607 2,406 2,651 2,914 2,864 2,721 3,022 3,515 4,299 4,943 6,077 2,678998 1,064 1,111 1,125 1,218 1,239 1,252 1,407 1,871 1,783 2,776 1,0991,609 1,342 1,540 1,789 1,646 1,482 1,730 2,108 2,458 3,160 1,457 1,57955 61 56 55 54 55 55 55 50 46 39 112144 137 133 142 126 120 129 138 116 127 84 136223 234 205 254 218 244 284 313 276 318 417 22689 109 96 90 93 100 96 92 87 72 73 953.3 3.2 3.1 3.0 3.0 2.8 3.0 3.2 3.1 2.9 2.4 3.14 6 3 2 3 3 5 7 5 7 7 3.461 109 63 64 67 70 66 61 67 58 63 72.89 9 9 10 9 12 14 14 15 18 34 9113 111 107 112 121 113 111 119 113 116 117 1132.7 3.1 3.1 3.5 4.4 3.6 3.6 3.8 3.3 4.1 3.1 3.42.2 2.1 2.2 2.4 2.6 2.4 2.2 2.4 2.3 2.3 2.2 2.37.1 5.9 6.5 7.3 9.1 7.7 6.0 7.0 6.4 7.5 6.5 7.26.7 6.1 6.2 6.8 7.8 7.1 6.3 6.7 6.5 6.8 6.0 6.719 19 23 30 27 30 34 35 39 35 38 24147 148 145 152 149 148 150 149 146 149 151 1487.0 7.2 6.8 7.2 7.1 7.1 7.1 7.0 6.8 7.0 6.9 7.13.5 3.5 3.3 3.5 3.5 3.4 3.4 3.5 3.4 3.4 3.4 3.514.4 14.8 14.0 14.5 14.6 14.1 14.3 14.2 13.8 14.1 14.3 14.411.6 12.0 11.8 11.9 11.9 11.2 11.6 11.6 11.2 11.6 11.8 11.829 34 35 27 30 29 27 26 23 22 16 31165 165 166 169 168 164 170 168 166 163 169 1677.7 7.7 7.8 7.9 8.0 7.7 8.0 7.9 7.7 7.9 7.9 7.84.1 4.0 3.9 4.0 4.1 4.0 4.0 4.0 3.9 3.9 4.0 4.017.3 17.3 17.2 17.3 17.1 16.8 17.3 17.2 16.8 16.8 17.1 17.214.0 14.0 13.6 13.8 13.7 13.6 14.0 13.7 13.5 13.7 13.8 13.839 31 30 30 28 23 20 18 18 18 5 32182 182 183 185 184 183 184 186 181 180 182 1838.4 8.8 8.5 8.5 8.7 8.4 8.6 8.5 8.6 8.6 8.4 8.64.5 4.6 4.4 4.6 4.7 4.5 4.6 4.5 4.5 4.6 4.5 4.619.4 19.3 19.3 20.0 19.6 19.2 19.9 19.5 19.4 19.6 19.5 19.515.4 15.2 15.3 15.4 15.5 15.4 15.6 15.5 15.1 15.7 15.4 15.48 10 7 6 12 10 8 11 7 11 9 953 61 50 59 65 58 62 62 53 56 60 5874 76 65 73 75 74 72 78 71 70 72 736 8 7 5 4 4 7 9 9 11 10 621 20 24 25 22 23 24 21 25 23 24 2218 21 22 19 19 21 23 19 21 20 25 2055 50 47 48 51 48 48 51 45 46 42 5064 67 61 64 67 66 63 61 64 59 60 6598 97 94 96 101 98 96 96 96 96 97 97110 110 110 111 110 111 112 110 109 109 111 110116 118 116 117 116 117 117 116 117 116 118 117* ALL weights are live weights00+ Year bag limit changed (3-5 to 3-3, bucks-antlerless) continue minimum 4 points or more522006-2007 Mississippi Deer Program Report
Table 14. Upper Thin Loess Soil Resource AreaSummary of DMAP DataAcresTotal DeerBucksDoesAcres/DeerBucks3.5+ BucksDoesAvg Age ALL Bucks% 0.5 Yr BucksWeight*% 1.5 YrWeight*PointsCircumf.LengthSpread% 2.5 YrWeight*PointsCircumf.LengthSpread% 3.5 YrWeight*PointsCircumf.LengthSpread% 4.5+ YrWeight*PointsCircumf.LengthSpread% Doe Lactation1.5 Yr2.5 Yr3.5+ YrDoe Age Classes% 0.5 Yr% 1.5 Yr% 2.5 Yr% 3.5+ YrDoe Weights*0.5 Yr1.5 Yr2.5 Yr3.5+ YrSeasonAverage06 05 04 03 02 01 00+ 99 98 97 91-94 02-06111,780 100,316 186,374 188,073 193,902 171,215 181,754 187,806 211,555 206,051 221,531 154,8801,688 1,375 2,086 2,029 1,974 1,818 2,020 2,459 2,757 2,993 3,045 1,818629 577 906 860 935 890 999 1,004 1,145 1,247 1,656 7771,059 798 1,180 1,169 1,039 928 1,021 1,455 1,612 1,746 1,457 1,04266 73 89 93 98 94 90 76 77 69 73 170178 174 206 219 207 192 182 187 185 165 134 199353 257 450 492 539 422 520 567 596 551 1365 415106 126 158 161 187 184 178 129 131 118 163 1492.8 2.5 2.6 2.5 2.4 2.6 3.2 3.2 3.1 2.9 2.4 2.65 6 3 4 7 3 4 6 9 9 7 562 66 62 66 97 66 58 62 63 63 63 70.816 19 15 21 23 15 15 16 23 21 52 19107 115 115 118 121 117 116 118 116 116 112 1153.1 3.5 3.8 4.1 4.6 4.1 4.2 4.3 4.2 4.3 3.2 3.82.2 2.3 2.3 2.4 2.5 2.3 2.5 2.3 2.3 2.4 2.2 2.35.9 7.4 7.3 8.3 9.2 7.9 8.5 8.3 8.4 8.4 6.7 7.76.1 6.9 6.9 7.2 7.7 7.1 7.2 7.1 7.1 7.1 5.8 7.025 26 31 28 30 34 47 45 37 40 31 28142 145 144 148 147 147 142 145 144 144 144 1456.9 6.5 6.5 6.4 6.6 6.7 6.6 6.8 6.7 6.9 6.5 6.63.5 3.4 3.3 3.4 3.4 3.4 3.3 3.4 3.4 3.4 3.3 3.414.3 13.9 13.7 13.9 14.0 14.0 13.8 14.4 13.9 14.0 13.6 14.011.5 11.2 11.1 11.5 11.4 11.7 11.3 11.7 11.2 11.5 11.0 11.329 32 34 30 25 28 27 26 23 25 9 30155 157 156 159 160 154 158 166 165 162 164 1577.4 7.2 7.2 7.3 7.4 7.2 7.8 7.9 8.1 7.8 7.9 7.33.8 3.8 3.7 3.8 3.9 3.7 4.0 4.1 4.1 4.0 4.1 3.816.1 15.9 15.7 15.8 16.3 15.5 16.7 17.3 17.3 17.0 17.3 16.012.7 13.0 12.7 12.9 13.4 12.5 13.3 14.0 13.7 13.9 14.0 12.925 15 14 17 14 17 8 7 8 5 2 17169 168 170 173 171 166 171 171 173 170 174 1708.0 7.8 8.0 7.9 8.0 7.8 8.1 8.4 8.8 8.3 8.4 7.94.3 4.3 4.4 4.2 4.3 4.1 4.6 4.5 4.5 4.3 4.5 4.318.1 18.0 18.3 18.0 18.2 17.8 18.7 19.0 19.0 19.3 19.3 18.114.5 14.3 14.4 14.4 14.7 14.2 15.0 15.2 14.9 15.4 15.4 14.510 21 20 10 17 11 10 13 14 13 9 1654 59 54 56 61 51 59 59 60 57 54 5764 61 70 70 71 66 67 70 71 66 65 679 9 5 10 11 7 5 11 10 12 12 921 21 23 26 24 24 26 23 24 22 24 2317 22 21 20 19 23 26 28 24 23 25 2052 47 45 44 45 43 43 38 42 43 39 4759 62 62 73 74 66 63 63 62 60 60 6691 95 93 97 98 96 89 92 94 93 93 95103 109 107 106 106 107 102 102 105 104 104 106110 109 111 112 112 112 109 110 110 111 111 111* ALL weights are live weights00+ Year bag limit changed (3-5 to 3-3, bucks-antlerless) continue minimum 4 points or moreSo i l Re s o u r c e s2006-2007 Mississippi Deer Program Report53
Table 15. Lower Thin Loess Soil Resource AreaSummary of DMAP DataSo i l Re s o u r c e sAcresTotal DeerBucksDoesAcres/DeerBucks3.5+ BucksDoesAvg Age ALL Bucks% 0.5 Yr BucksWeight*% 1.5 YrWeight*PointsCircumf.LengthSpread% 2.5 YrWeight*PointsCircumf.LengthSpread% 3.5 YrWeight*PointsCircumf.LengthSpread% 4.5+ YrWeight*PointsCircumf.LengthSpread% Doe Lactation1.5 Yr2.5 Yr3.5+ YrDoe Age Classes% 0.5 Yr% 1.5 Yr% 2.5 Yr% 3.5+ YrDoe Weights*0.5 Yr1.5 Yr2.5 Yr3.5+ YrSeasonAverage06 05 04 03 02 01 00+ 99 98 97 91-94 02-06100,734 131,044 177,211 170,730 178,461 171,661 223,985 230,662 236,033 197,471 214,591 150,3341,547 1,327 2,188 2,453 2,284 2,173 2,776 3,426 3,915 4,798 3,892 1,944504 487 811 891 897 836 1,043 1,157 1,379 1,502 1,705 7121,043 840 1,377 1,562 1,387 1,337 1,733 2,269 2,536 3,296 1,457 1,23365 99 81 70 78 79 81 67 60 41 55 155200 269 219 192 199 205 216 199 171 131 126 211336 307 362 394 377 419 430 391 364 313 578 35397 156 129 109 129 128 130 102 93 60 99 1223.1 3.0 3.0 2.8 2.9 2.8 3.2 3.2 3.1 2.9 2.4 3.06 5 2 2 2 2 4 8 7 10 9 3.166 69 69 74 131 71 61 60 66 57 62 81.716 11 9 14 12 11 11 13 14 18 39 13109 116 110 114 122 121 115 115 111 109 110 1142.9 3.6 3.0 3.7 4.4 3.9 3.8 4.2 3.6 4.3 2.8 3.52.1 2.3 1.8 2.4 2.6 2.5 2.2 2.2 2.3 2.3 2.1 2.25.3 7.6 6.4 7.6 8.9 7.7 7.4 8.0 7.3 8.0 5.8 7.15.8 7.0 7.8 7.0 7.7 6.9 6.8 6.8 6.6 7.0 5.6 7.016 19 22 26 27 31 35 28 32 30 30 22147 146 143 149 150 143 144 145 143 143 142 1477.1 6.5 6.5 6.6 6.7 6.7 6.9 6.8 6.7 6.8 6.3 6.73.5 3.3 3.2 3.4 3.4 3.3 3.3 3.3 3.4 3.3 3.3 3.314.7 14.0 13.5 13.7 14.1 13.9 14.1 13.7 13.9 13.9 13.6 14.011.5 11.4 11.1 10.9 11.4 10.9 11.3 11.1 11.0 11.2 10.7 11.328 37 37 31 31 29 28 27 28 27 16 33165 164 162 168 167 164 163 163 159 159 163 1657.2 7.3 7.5 7.6 7.7 7.7 7.5 7.6 7.6 7.7 7.5 7.53.9 3.9 3.7 3.9 3.9 3.9 3.9 3.8 3.8 3.9 3.8 3.916.6 16.2 16.4 16.9 17.1 16.5 17.0 16.6 16.2 16.8 16.7 16.613.1 12.9 13.3 13.4 13.7 13.3 13.5 13.4 12.8 13.4 13.3 13.335 26 26 23 25 23 22 24 19 15 7 27180 177 179 181 181 179 176 177 174 173 176 1808.1 8.2 8.1 8.3 8.3 8.2 8.2 8.3 8.3 8.2 8.3 8.24.3 4.5 4.3 4.4 4.5 4.4 4.3 4.5 4.3 4.4 4.4 4.418.8 18.7 18.7 19.1 19.3 19.3 18.9 18.9 18.9 19.1 19.2 18.915.1 14.7 14.8 14.9 15.0 15.1 15.0 14.9 14.9 15.1 15.0 14.98 9 10 10 12 14 9 10 9 9 11 1066 61 63 61 61 64 60 62 57 57 61 6274 74 72 74 77 74 74 77 77 74 75 746 7 5 4 5 3 7 9 10 10 10 619 21 24 25 23 24 24 22 24 24 23 2216 17 18 19 19 22 23 22 20 18 24 1859 54 49 49 47 47 46 47 46 48 43 5264 67 63 63 74 70 61 59 62 55 59 6696 99 96 98 101 99 95 95 94 93 94 98107 110 107 109 110 108 107 104 106 104 107 109115 115 115 115 116 116 114 113 114 112 115 115* ALL weights are live weights00+ Year bag limit changed (3-5 to 3-3, bucks-antlerless) continue minimum 4 points or more542006-2007 Mississippi Deer Program Report
Table 16. Black Prairie Soil Resource AreaSummary of DMAP DataAcresTotal DeerBucksDoesAcres/DeerBucks3.5+ BucksDoesAvg Age ALL Bucks% 0.5 Yr BucksWeight*% 1.5 YrWeight*PointsCircumf.LengthSpread% 2.5 YrWeight*PointsCircumf.LengthSpread% 3.5 YrWeight*PointsCircumf.LengthSpread% 4.5+ YrWeight*PointsCircumf.LengthSpread% Doe Lactation1.5 Yr2.5 Yr3.5+ YrDoe Age Classes% 0.5 Yr% 1.5 Yr% 2.5 Yr% 3.5+ YrDoe Weights*0.5 Yr1.5 Yr2.5 Yr3.5+ YrSeasonAverage06 05 04 03 02 01 00+ 99 98 97 91-94 02-06117,686 147,416 225,121 210,923 217,575 186,663 142,720 155,976 173,388 170,057 156,927 184,488902 926 1,513 1,776 1,663 1,475 1,246 1,328 1,455 1,625 1,994 1,370333 366 640 916 785 722 540 629 675 646 857 612569 560 873 860 878 753 706 699 780 979 1,457 758130 159 149 119 131 127 115 117 119 105 79 269353 403 352 230 277 259 265 248 257 263 186 301497 737 828 799 659 547 539 551 642 752 913 702207 263 258 245 248 248 203 223 222 174 139 2433.0 2.9 2.6 2.1 2.4 2.5 3.2 3.2 3.1 2.9 2.4 2.62 3 6 4 5 5 7 4 6 6 8 465 74 64 60 63 63 62 60 63 62 64 64.810 9 9 37 20 17 15 17 22 23 49 17118 124 113 105 114 110 114 116 116 116 113 1143.6 3.9 4.3 3.2 5.0 4.6 5.1 4.9 4.5 4.8 3.3 4.02.6 2.7 2.4 2.1 2.6 2.5 2.7 2.6 2.6 2.5 2.2 2.58.5 8.6 8.3 6.3 9.5 8.5 9.7 9.0 8.8 9.5 6.9 8.26.9 7.9 6.9 5.7 7.4 6.8 8.1 7.6 7.0 7.8 6.3 6.923 25 38 27 30 33 29 34 32 36 23 28144 147 146 136 141 130 132 142 139 143 143 1436.8 6.9 6.6 6.3 6.8 6.6 6.5 6.6 6.5 6.9 6.1 6.63.5 3.5 3.3 3.3 3.3 3.2 3.2 3.4 3.4 3.4 3.3 3.414.6 14.8 14.5 13.4 13.8 13.3 13.5 14.0 13.8 14.5 13.7 14.212.0 12.1 11.7 10.9 11.1 10.8 10.9 11.3 11.2 11.9 10.9 11.539 39 32 20 30 28 28 30 27 26 15 32160 164 165 158 155 154 154 158 152 163 160 1617.6 7.5 7.7 7.4 7.4 7.7 7.8 8.0 7.8 7.6 7.3 7.53.9 4.0 3.8 3.9 3.8 3.8 3.9 3.9 3.8 3.8 3.7 3.916.5 16.9 16.8 16.4 16.1 16.1 16.6 16.9 16.0 17.0 16.4 16.513.3 13.5 13.6 13.0 12.9 13.0 13.1 13.4 12.6 13.7 13.2 13.326 24 14 10 14 15 21 15 13 9 6 18182 182 179 177 170 170 174 177 168 172 173 1788.4 8.2 8.0 8.1 8.1 8.6 8.3 8.6 8.3 8.3 8.0 8.14.5 4.5 4.3 4.6 4.2 4.3 4.5 4.4 4.5 4.3 4.2 4.419.3 19.1 18.1 18.6 18.3 18.6 18.7 18.5 18.7 18.9 18.4 18.614.9 15.0 14.2 14.7 14.8 15.0 14.6 14.8 14.3 15.1 14.5 14.719 24 16 10 11 9 12 16 9 15 14 1557 64 61 54 61 57 52 58 50 61 57 5973 70 70 63 71 66 66 66 62 71 66 698 8 8 4 9 7 8 10 11 14 12 718 24 20 28 19 25 24 23 21 20 24 2220 21 30 20 20 20 18 20 20 23 19 2255 47 42 44 47 45 50 47 48 43 47 4767 71 63 55 54 56 55 62 61 60 59 6297 96 94 92 94 90 90 95 93 98 95 94107 108 106 104 103 100 101 105 104 105 105 105115 117 113 110 110 110 109 111 110 113 113 113* ALL weights are live weights00+ Year bag limit changed (3-5 to 3-3, bucks-antlerless) continue minimum 4 points or moreSo i l Re s o u r c e s2006-2007 Mississippi Deer Program Report55
Table 17. Upper Coastal Plain Soil Resource AreaSummary of DMAP DataSo i l Re s o u r c e sAcresTotal DeerBucksDoesAcres/DeerBucks3.5+ BucksDoesAvg Age ALL Bucks% 0.5 Yr BucksWeight*% 1.5 YrWeight*PointsCircumf.LengthSpread% 2.5 YrWeight*PointsCircumf.LengthSpread% 3.5 YrWeight*PointsCircumf.LengthSpread% 4.5+ YrWeight*PointsCircumf.LengthSpread% Doe Lactation1.5 Yr2.5 Yr3.5+ YrDoe Age Classes% 0.5 Yr% 1.5 Yr% 2.5 Yr% 3.5+ YrDoe Weights*0.5 Yr1.5 Yr2.5 Yr3.5+ YrSeasonAverage06 05 04 03 02 01 00+ 99 98 97 91-94 02-06422,077 452,273 419,692 510,396 511,330 496,206 557,521 705,830 727,380 741,776 879,440 462,4103,765 3,735 3,519 3,433 3,724 3,595 4,786 5,409 5,719 7,044 8,488 3,6211,579 1,630 1,515 1,541 1,749 1,804 2,155 2,648 2,536 3,147 4,677 1,5992,186 2,105 2,004 1,892 1,975 1,791 2,631 2,761 3,183 3,897 1,457 2,022112 121 119 149 137 138 116 130 127 105 105 255267 277 277 331 292 275 259 267 287 236 188 289557 626 790 714 689 703 631 762 797 693 997 676193 215 209 270 259 277 212 256 229 190 237 2292.6 2.7 2.4 2.5 2.5 2.5 2.8 3.2 3.1 2.9 2.4 2.53 4 5 2 3 3 4 6 7 6 7 3.460 65 65 63 61 60 59 58 62 59 58 62.917 14 15 18 20 16 20 21 24 24 51 17108 107 109 108 113 112 112 113 112 111 108 1093.9 3.8 4.1 4.4 4.7 4.6 4.7 4.7 4.6 4.4 3.2 4.22.3 2.2 2.5 2.4 2.5 2.6 2.5 2.5 2.5 2.4 2.1 2.48.0 7.6 8.5 8.8 9.2 9.1 9.2 9.3 8.9 8.7 6.7 8.46.9 6.8 7.6 7.5 7.5 7.6 7.7 7.5 7.4 7.2 5.8 7.330 31 41 32 32 38 35 38 33 36 24 33137 137 140 136 139 138 137 138 137 139 134 1386.5 6.5 6.5 6.4 6.9 6.6 6.6 6.7 6.6 6.6 6.0 6.53.3 3.3 3.3 3.2 3.3 3.3 3.3 3.3 3.3 3.3 3.2 3.313.8 13.2 13.8 13.4 14.1 13.7 13.7 14.0 13.7 13.9 13.2 13.711.1 10.8 11.1 10.7 11.3 11.1 11.1 11.3 10.9 11.2 10.5 11.031 31 27 30 28 28 27 25 24 25 14 29153 151 152 153 152 152 150 156 152 157 152 1527.3 7.0 7.3 7.2 7.4 7.4 7.5 7.5 7.3 7.5 7.1 7.23.8 3.7 3.8 3.7 3.8 3.7 3.8 3.9 3.8 3.8 3.6 3.715.8 15.6 15.8 15.7 15.7 15.9 16.1 16.4 15.8 16.5 15.6 15.712.8 12.5 12.6 12.6 12.7 12.7 12.9 13.2 12.6 13.3 12.7 12.719 19 12 16 16 14 14 10 12 9 5 16168 164 167 164 166 167 164 171 170 166 164 1667.9 7.7 7.9 7.9 8.0 8.0 8.1 8.3 8.0 7.9 7.6 7.94.3 4.1 4.2 4.2 4.3 4.3 4.2 4.3 4.2 4.3 4.1 4.217.8 17.4 17.8 17.9 18.2 18.4 18.2 18.3 17.9 18.3 17.7 17.814.4 14.1 14.4 14.4 14.3 14.4 14.8 14.8 14.5 14.6 14.1 14.311 12 12 14 14 10 12 16 15 15 13 1353 57 56 51 56 59 57 65 57 57 56 5569 68 67 69 68 71 67 72 70 68 65 687 7 8 4 7 6 8 10 10 11 11 720 22 21 23 22 24 23 24 24 24 24 2219 20 25 21 18 23 24 23 22 23 20 2055 51 45 48 48 43 45 43 44 42 45 5059 62 63 60 59 60 58 57 59 58 58 6189 89 88 87 90 89 87 89 88 89 89 8997 99 100 97 100 100 97 99 97 99 99 99107 107 106 106 105 107 103 104 105 107 105 106* ALL weights are live weights00+ Year bag limit changed (3-5 to 3-3, bucks-antlerless) continue minimum 4 points or more562006-2007 Mississippi Deer Program Report
Table 18. Lower Coastal Plain Soil Resource AreaSummary of DMAP DataAcresTotal DeerBucksDoesAcres/DeerBucks3.5+ BucksDoesAvg Age ALL Bucks% 0.5 Yr BucksWeight*% 1.5 YrWeight*PointsCircumf.LengthSpread% 2.5 YrWeight*PointsCircumf.LengthSpread% 3.5 YrWeight*PointsCircumf.LengthSpread% 4.5+ YrWeight*PointsCircumf.LengthSpread% Doe Lactation1.5 Yr2.5 Yr3.5+ YrDoe Age Classes% 0.5 Yr% 1.5 Yr% 2.5 Yr% 3.5+ YrDoe Weights*0.5 Yr1.5 Yr2.5 Yr3.5+ YrSeasonAverage06 05 04 03 02 01 00+ 99 98 97 91-94 02-06314,852 397,543 397,659 402,461 343,592 334,038 202,709 264,521 328,344 356,712 308,965 371,2211,253 1,142 1,468 1,500 1,590 1,512 1,506 1,721 2,163 2,818 2,944 1,391610 541 596 698 838 832 686 812 977 1,064 1,467 657643 601 872 802 752 680 820 909 1,186 1,754 1,457 734251 348 271 268 216 221 135 154 152 127 104 534516 735 667 577 410 401 295 326 336 335 210 5651086 1636 1446 2064 1108 1152 672 740 820 860 1098 1468490 661 456 502 457 491 247 291 277 203 209 5052.6 2.7 2.6 2.3 2.5 2.4 2.9 3.2 3.1 2.9 2.4 2.52 3 4 3 2 3 3 3 7 8 10 2.757 68 71 60 62 61 55 58 61 57 56 63.618 11 16 13 11 12 15 18 18 24 47 14109 109 104 110 113 111 109 108 107 108 102 1093.9 4.0 3.7 4.2 4.5 4.6 4.7 4.5 4.0 4.3 2.7 4.12.4 2.7 2.3 2.4 2.4 2.4 2.3 2.4 2.2 2.3 1.9 2.48.5 8.9 7.3 8.5 8.9 8.6 8.4 8.5 7.5 8.2 5.4 8.47.2 7.5 6.4 7.0 7.2 7.8 7.2 6.9 6.8 7.0 5.3 7.029 35 33 55 46 53 38 35 34 29 25 40133 135 138 136 134 134 132 131 130 131 126 1356.6 6.8 6.6 6.5 6.7 6.7 6.9 6.4 6.4 6.6 5.2 6.63.2 3.3 3.3 3.2 3.3 3.2 3.3 3.1 3.1 3.2 2.8 3.213.7 13.5 13.6 13.6 13.7 13.6 13.6 12.9 12.7 13.1 11.5 13.611.1 10.9 11.2 10.9 10.9 10.9 11.2 10.7 10.2 10.9 9.3 11.034 30 33 19 26 22 30 28 26 24 14 29143 148 149 147 142 151 152 145 145 143 146 1467.6 7.3 7.4 7.2 7.5 7.7 7.5 7.3 7.5 7.2 7.1 7.43.7 3.7 3.7 3.6 3.6 3.7 3.7 3.5 3.6 3.6 3.5 3.615.5 15.0 15.5 15.5 15.2 16.2 15.5 15.3 15.3 15.3 15.0 15.312.5 12.6 13.0 12.5 12.4 13.0 12.8 12.5 12.3 12.5 12.1 12.617 18 14 9 12 10 14 16 15 15 6 14161 153 154 156 155 162 158 158 153 150 155 1568.3 7.9 8.0 8.0 8.2 8.1 8.0 8.2 7.9 7.7 7.5 8.14.2 4.1 4.1 4.1 4.2 4.2 4.1 4.2 4.1 4.0 4.0 4.118.1 17.2 17.6 17.7 17.8 18.2 17.7 17.8 17.3 17.0 17.0 17.714.6 13.9 14.6 13.9 14.5 14.8 14.5 14.3 14.1 13.7 13.8 14.310 15 12 6 19 8 21 17 19 14 14 1360 48 52 60 58 61 63 68 69 59 58 5659 68 66 64 66 71 73 70 73 73 68 654 4 5 4 3 5 7 6 8 8 11 419 17 19 20 19 20 18 22 20 24 23 1924 23 30 38 30 40 25 24 22 19 21 2953 56 46 37 47 35 51 48 50 49 45 4859 62 63 57 55 57 55 57 56 58 54 5988 88 88 83 88 86 90 87 85 84 86 87100 96 96 96 95 93 95 97 94 93 95 97104 101 102 101 100 99 101 101 100 96 100 101* ALL weights are live weights00+ Year bag limit changed (3-5 to 3-3, bucks-antlerless) continue minimum 4 points or moreSo i l Re s o u r c e s2006-2007 Mississippi Deer Program Report57
Table 19. Coastal Flatwoods Soil Resource AreaSummary of DMAP DataSo i l Re s o u r c e sAcresTotal DeerBucksDoesAcres/DeerBucks3.5+ BucksDoesAvg Age ALL Bucks% 0.5 Yr BucksWeight*% 1.5 YrWeight*PointsCircumf.LengthSpread% 2.5 YrWeight*PointsCircumf.LengthSpread% 3.5 YrWeight*PointsCircumf.LengthSpread% 4.5+ YrWeight*PointsCircumf.LengthSpread% Doe Lactation1.5 Yr2.5 Yr3.5+ YrDoe Age Classes% 0.5 Yr% 1.5 Yr% 2.5 Yr% 3.5+ YrDoe Weights*0.5 Yr1.5 Yr2.5 Yr3.5+ YrSeasonAverage06 05 04 03 02 01 00+ 99 98 97 91-94 02-0649,790 47,790 63,810 55,927 55,650 55,650 51,850 52,850 51,850 59,229 46,517 54,593110 47 67 148 156 178 202 161 202 87 177 10663 23 29 82 89 116 101 93 101 56 105 5747 24 38 66 67 62 101 68 101 31 1,457 48453 1017 952 378 357 313 257 328 257 681 526 1034790 2078 2200 682 625 480 513 568 513 1058 1332 9412165 2987 4908 3728 2319 2140 960 1229 1127 1851 3445 32211059 1991 1679 847 831 898 513 777 513 1911 3219 11102.6 3.3 2.5 2.1 2.3 2.2 2.5 2.7 2.7 2.9 2.0 2.52 0 0 3 0 1 1 1 2 2 17 0.858 0 0 70 0 48 35 45 60 45 36 25.510 9 10 11 8 6 17 8 7 6 31 10120 106 94 96 83 106 103 106 106 85 96 1004.2 2.0 4.5 4.6 4.0 4.1 3.7 3.3 3.8 2.0 2.5 3.82.4 0.0 2.9 2.3 2.3 2.1 2.3 1.9 2.3 1.9 1.4 2.07.9 0.0 7.6 9.2 6.9 7.9 7.7 7.4 8.1 5.9 4.3 6.37.2 0.0 5.5 7.1 5.6 6.6 7.9 7.6 7.0 5.0 5.7 5.143 18 48 68 64 72 31 39 42 32 29 48143 114 128 130 125 122 126 120 123 118 120 1287.1 4.8 5.8 5.9 6.2 5.9 5.8 5.8 5.7 5.1 4.9 5.93.5 2.9 3.3 2.9 2.9 2.9 2.8 2.6 2.8 2.5 2.4 3.114.3 13.3 12.8 12.1 12.6 12.3 12.1 11.4 11.9 10.6 10.0 13.012.6 10.3 11.2 9.7 9.9 9.8 10.0 9.5 9.7 8.7 7.8 10.826 32 29 16 19 16 41 35 32 36 16 24152 146 130 134 132 139 132 136 131 122 115 1398.0 7.6 7.0 6.5 7.3 7.2 6.4 6.6 5.8 5.7 5.1 7.34.0 3.9 3.6 3.4 3.5 3.8 2.9 3.2 2.9 2.8 2.5 3.716.4 16.7 15.5 14.5 15.2 15.6 13.3 13.6 12.0 12.4 10.7 15.613.3 13.5 12.3 12.2 13.2 12.3 11.1 10.9 9.7 10.4 8.9 12.914 41 13 3 9 5 11 17 17 25 6 16145 160 132 141 155 165 163 155 136 138 116 1477.8 7.9 8.3 6.0 7.9 8.5 7.5 7.5 7.3 7.2 5.1 7.63.8 4.3 3.9 3.3 4.2 4.1 3.9 3.8 3.6 3.2 2.8 3.916.3 17.9 16.4 11.9 16.5 18.9 16.6 16.9 15.4 14.7 11.5 15.813.2 13.9 12.7 9.1 13.2 14.8 13.6 13.0 11.9 11.8 9.6 12.40 0 43 22 7 18 18 0 25 40 6 1433 60 33 77 50 50 54 80 63 50 65 5155 56 45 43 65 47 65 56 68 78 67 533 14 18 3 8 8 8 5 7 10 0 916 19 21 30 22 22 19 13 13 17 10 218 24 18 38 35 41 29 25 27 27 23 2554 43 44 30 35 30 45 57 53 47 67 4137 44 48 70 68 61 52 57 58 47 0 5381 89 81 83 77 84 81 76 86 77 41 8278 79 92 92 85 86 90 84 81 78 69 8598 98 92 96 89 90 94 93 92 95 90 95* ALL weights are live weights00+ Year bag limit changed (3-5 to 3-3, bucks-antlerless) continue minimum 4 points or more582006-2007 Mississippi Deer Program Report
Table 20. Interior Flatwoods Soil Resource AreaSummary of DMAP DataAcresTotal DeerBucksDoesAcres/DeerBucks3.5+ BucksDoesAvg Age ALL Bucks% 0.5 Yr BucksWeight*% 1.5 YrWeight*PointsCircumf.LengthSpread% 2.5 YrWeight*PointsCircumf.LengthSpread% 3.5 YrWeight*PointsCircumf.LengthSpread% 4.5+ YrWeight*PointsCircumf.LengthSpread% Doe Lactation1.5 Yr2.5 Yr3.5+ YrDoe Age Classes% 0.5 Yr% 1.5 Yr% 2.5 Yr% 3.5+ YrDoe Weights*0.5 Yr1.5 Yr2.5 Yr3.5+ YrSeasonAverage06 05 04 03 02 01 00+ 99 98 97 91-94 02-0693,989 92,685 76,412 61,260 63,200 66,210 40,870 38,770 36,270 41,867 69,015 77,509927 697 564 315 409 514 397 429 373 419 1,107 582428 290 243 143 212 265 179 199 135 180 517 263499 407 321 172 197 249 218 230 238 239 1,457 319101 133 135 194 155 129 103 90 97 100 63 266220 320 314 428 298 250 228 195 269 233 135 294445 598 772 1075 658 534 486 487 548 646 642 710188 228 238 356 321 266 188 169 152 175 120 2422.7 2.8 2.6 2.5 2.7 2.7 3.2 3.2 3.1 2.9 2.4 2.75 4 6 4 3 2 4 9 12 15 9 4.364 64 63 61 59 61 59 64 67 69 63 62.314 16 13 19 8 10 15 18 16 16 45 14105 126 105 109 116 122 117 119 114 123 111 1122.9 2.5 3.0 3.8 4.9 5.6 5.4 4.4 3.8 4.8 3.0 3.41.9 1.9 1.9 2.3 2.7 2.7 2.9 2.4 2.1 2.4 2.2 2.26.4 6.0 6.4 8.9 9.7 11.2 11.9 9.0 7.3 9.2 6.5 7.57.2 6.9 7.2 7.3 7.1 8.3 9.0 7.9 7.3 7.3 6.0 7.227 21 36 32 34 33 34 33 23 33 25 30143 143 151 134 142 143 145 144 138 140 137 1436.6 6.4 7.0 6.0 7.0 6.7 6.6 6.7 6.4 7.0 5.7 6.63.3 3.2 3.3 3.2 3.5 3.3 3.3 3.4 3.1 3.4 3.1 3.313.7 14.0 14.5 12.7 14.9 14.2 14.4 14.0 13.8 15.0 13.0 13.911.1 11.2 12.3 10.0 11.3 11.7 11.4 12.0 11.5 12.0 10.1 11.233 38 25 24 32 35 30 25 35 27 16 31161 156 161 166 162 159 160 164 152 154 153 1617.9 7.9 7.3 7.4 7.7 7.8 8.2 7.3 7.3 7.2 7.1 7.73.8 3.6 3.6 3.8 4.0 3.9 3.8 3.9 3.7 3.6 3.6 3.816.6 15.8 15.8 15.3 16.7 16.5 16.6 15.0 15.5 15.7 15.6 16.113.2 12.5 13.0 12.5 13.0 13.4 13.5 12.5 12.3 13.1 12.5 12.821 22 21 16 17 18 17 15 14 9 5 19172 184 184 158 185 176 179 179 171 163 176 1778.2 7.9 8.3 7.5 8.6 9.0 8.0 8.6 7.9 8.1 8.5 8.14.3 4.2 4.1 4.0 4.7 4.3 4.4 4.5 4.0 4.1 4.3 4.318.4 17.9 18.8 17.0 19.8 18.8 19.4 18.8 18.0 19.0 18.5 18.414.6 14.2 14.7 13.8 15.5 15.1 14.7 16.0 14.3 14.8 15.0 14.65 18 13 10 16 11 12 8 18 10 15 1254 56 47 59 51 55 69 51 67 54 53 5467 69 65 70 73 67 66 67 75 66 65 694 5 10 5 3 1 6 5 17 15 11 625 20 21 25 17 19 27 27 21 17 28 2128 19 27 21 19 27 26 26 19 25 20 2343 56 42 45 53 49 41 42 43 43 42 4858 57 60 60 56 68 56 58 65 63 60 5891 92 95 93 94 93 94 94 96 99 93 93106 106 108 105 103 103 105 105 101 109 103 106110 113 115 116 112 117 114 114 111 116 111 113* ALL weights are live weights00+ Year bag limit changed (3-5 to 3-3, bucks-antlerless) continue minimum 4 points or moreSo i l Re s o u r c e s2006-2007 Mississippi Deer Program Report59
Ci tat i o n sEnforcement of Deer Hunter-Related Citations2006-2007The Law Enforcement Division began monitoring all statewide citationsat the district and county levels during the 1996 – 1997 deerseason. The eight most common deer hunting citations from October1 – January 31 were extracted from the database and summarized.Citation totals by county are shown in Table 22 on page 61. Yearlytrends in various citations show some variability.A total of 2,567 citations were written during the 2006 – 2007 deerhunting season. This is an increase of 311 citations from the previousseason. The total number of citations was at an all time high in2003 – 2004. Over the past 3 hunting seasons, citations have beensignificantly lower (Table 21 and Figure 27). The decline in citationscan be attributed to a number of things: violations actually decreased,fewer hunters in the woods, and new or no officers in an area.It is logical to assume that if fewer citations were written for a specificviolation, then a decreased incidence of that violation occurred.The only notable decreases in recorded violations from the 2006– 2007 were No License-Resident and Trespassing.Some violations are still occurringat dangerously high levels. Failure to wearhunter orange is a good example. Many huntersstill refuse to wear their hunter orange.This law is in place to protect the hunters.Trespassing also still occurs at a high rate,indicating that anyone could be on the landwithout a hunter’s knowledge. Headlightingis another citation that occurs at a high rate.Last year, headlighting citations were thethird highest on record.The number of licensed hunters continuesto decline. This could be another reason forthe general decrease in citations. With fewerhunters taking to the field, the number ofviolations should decrease. However, manyhunters are ignoring license requirementsand taking their chances. This is evident bythe increase in citations for no hunting licenseby non-residents which increased fromlast year.The number of baiting citations for the 2006 – 2007 season increased151% from last year. However, hunter acceptance of baitingcontinues to increase. Bait is readily available and a big seller. Whena citation is written and a conviction obtained, the minimal fine assessedthe violator is hardly a deterrent to prevent future baiting.With more hunters managing their land for bigger deer, manypoachers are trying to take advantage of the results that managershave created. More large-antlered bucks on roadsides equal moretemptations. Many would-be hunters are giving in and turning topoaching. This is evidenced by the number of trespassing and headlightingcitations written each year.Our officers are doing a good job across the state, but they needthe help of sportsmen. Hunters can assist our officers by reportingwildlife violations by calling 1-800-BE-SMART. Most counties haveonly 2 officers, but with concerned sportsmen, they have eyes andears all over the county.Figure 27: Total CitationsTable 21. Statewide Citations Summary by Most FrequentViolations During Deer SeasonSeason Totals2006-20072005-20062004-20052003-20042002-20032001-20022000-20011999-20001998-19991997-19981996-1997MotorVehicleHunt FromNo HunterOrangeNo LicenseBaitingTrespassingHeadlightingTotalCitationsPublicNon-ResidentRoadResident59 609 363 341 115 554 223 303 256757 528 271 445 68 365 343 179 2256104 725 652 391 125 689 283 261 3230136 914 700 482 159 724 330 363 380899 867 658 491 184 569 240 282 3390120 840 702 491 179 781 275 227 3615236 1137 612 505 118 519 297 332 3756238 938 415 422 87 449 318 299 3166433 1037 409 378 152 356 290 260 3315476 1063 403 335 112 313 278 282 3262282 920 312 348 150 208 281 172 2673602006-2007 Mississippi Deer Program Report
Table 22. Citations Summary of Most FrequentViolations During 2006-2007 Deer SeasonCountyHunt FromMotor VehicleHunt FromPublic RoadNo Hunter OrangeNo LicenseResidentNo LicenseNon-ResBaitingTresspassingHeadlightingTotal CitationsCountyHunt FromMotor VehicleHunt FromPublic RoadNo Hunter OrangeNo LicenseResidentNo LicenseNon-ResBaitingTresspassingHeadlightingTotal CitationsAdams 0 5 5 3 1 10 1 0 25Alcorn 0 1 1 3 0 1 0 1 7Amite 2 7 11 1 10 34 1 4 70Attala 2 9 3 1 1 14 3 21 54Benton 0 2 2 5 1 2 0 1 13Bolivar 4 4 4 3 0 0 0 0 15Calhoun 3 10 3 10 0 7 2 6 41Carroll 2 4 9 5 5 6 1 2 34Chickasaw 0 17 7 5 0 8 7 4 48Choctaw 0 1 2 1 0 7 1 1 13Claiborne 2 9 3 4 4 8 1 4 35Clarke 0 20 26 10 10 23 6 3 98Clay 0 5 3 4 0 0 0 1 13Coahoma 0 0 1 2 0 3 0 0 6Copiah 0 3 5 4 2 11 2 1 28Covington 0 0 3 3 0 6 1 0 13Desoto 0 3 2 1 2 2 4 2 16Forrest 0 18 10 4 0 4 2 1 39Franklin 0 4 1 2 2 1 0 0 10George 0 8 5 2 1 10 2 1 29Greene 0 12 12 10 4 21 2 0 61Grenada 1 8 5 5 0 1 3 9 32Hancock 0 1 1 2 1 0 1 2 8Harrison 0 3 1 3 0 2 5 0 14Hinds 0 0 5 3 0 1 1 2 12Holmes 0 2 2 2 0 8 3 4 21Humphreys 0 0 0 0 0 0 0 0 0Issaquena 2 3 4 3 0 0 3 2 17Itawamba 0 31 6 24 2 6 6 10 85Jackson 0 8 0 9 0 3 5 4 29Jasper 0 7 24 8 12 63 3 5 122Jeff Davis 0 0 9 1 6 4 0 0 20Jefferson 0 1 2 1 3 5 0 0 12Jones 0 6 7 8 0 11 3 3 38Kemper 0 9 2 1 0 23 0 6 41Lafayette 2 29 6 7 2 6 10 23 85Lamar 1 13 7 5 0 5 3 7 41Lauderdale 0 6 12 6 5 25 1 5 60Lawrence 0 2 3 0 6 11 1 2 25Leake 3 4 2 2 0 0 6 3 20Lee 0 2 1 4 1 1 3 0 12Leflore 0 3 2 3 0 1 2 0 11Lincoln 0 5 7 1 0 11 1 3 28Lowndes 0 1 8 3 2 5 3 2 24Madison 0 13 2 3 0 4 8 13 43Marion 5 7 10 4 2 17 5 7 57Marshall 0 18 2 9 3 2 3 2 39Monroe 0 37 6 13 3 6 9 9 83Montgomery 0 7 3 4 1 2 3 8 28Neshoba 1 2 1 2 0 7 0 3 16Newton 0 11 1 8 3 11 2 5 41Noxubee 0 4 2 2 0 2 1 3 14Oktibbeha 0 4 2 0 0 1 3 3 13Panola 0 22 13 11 3 25 11 19 104Pearl River 0 7 3 5 0 1 2 2 20Perry 0 40 5 10 0 14 0 9 78Pike 0 1 4 1 1 4 0 0 11Pontotoc 0 6 0 9 1 0 3 0 19Prentiss 0 7 3 2 0 5 4 0 21Quitman 1 0 2 2 0 2 4 0 11Rankin 1 3 0 1 0 1 1 1 8Scott 0 5 1 4 0 4 9 3 26Sharkey 7 5 3 7 1 0 5 5 33Simpson 1 12 3 3 0 3 1 11 34Smith 0 5 0 1 0 0 0 0 6Stone 0 2 0 1 0 0 0 5 8Sunflower 3 5 4 0 0 0 6 4 22Tallahatchie 1 5 3 5 0 1 1 2 18Tate 0 13 3 2 0 5 2 4 29Tippah 0 2 1 6 0 0 2 2 13Tishomingo 0 9 4 2 0 2 0 0 17Tunica 2 6 5 2 0 1 4 0 20Union 0 11 6 4 0 10 10 8 49Walthall 1 3 7 2 1 14 0 1 29Warren 3 6 9 10 2 2 1 4 37Washington 0 1 0 1 0 1 1 0 4Wayne 4 10 0 1 0 3 3 8 29Webster 0 12 4 4 0 6 2 6 34Wilkinson 0 7 7 1 10 13 5 0 43Winston 0 5 0 1 0 3 0 2 11Yalobusha 1 6 7 10 0 6 1 1 32Yazoo 4 4 3 4 1 6 12 8 42Ci tat i o n s2006-2007 Mississippi Deer Program Report61
2006-2007 Hunting Incident/AccidentSummaryistockphoto.comhunteracci cciDentsAhunting accident/incident is one in which a person is injured by the discharge of a hunting firearm, bow and arrow, or a fall from a huntingtree stand arising from the activity of hunting.There were 27 total hunting related incident/accidents investigated in Mississippi during the 2006-2007 hunting season, an increase fromlast season. Of these, 16 were firearm/bow related with 2 fatalities and 11 were tree stand related with 2 fatalities.The majority of hunting incidents occurred while deer hunting, but there were also incidents reported while dove, duck, squirrel, and hoghunting. (Figure 28).Firearms related accidents increased from last year and treestand accidents remained constant. Since 2001 total hunting accidents hadbeen on a steady decline until last season (Figure 29).Sportsmen, Hunter Education Instructors, and Conservation Officers in Mississippi should be commended for keeping hunting among thesafest of sports. Volunteer instructors and Conservation Officers certified 10,387 sportsmen in Hunter Education during the 2006 – 2007season (Figure 30). Hunting accidents in Mississippi average about one injury for every 13,000 licensed hunters: an average of around seveninjuries per 100,000 participants. When compared to other sports such as football, which averages around 3,500 injuries per 100,000 participants,hunting is a very safe sport.Hunter education regulations changed slightly for the 2006 – 2007 season as an effort to increase hunter recruitment. Youths 12 – 15year of age must complete a Hunter Education course in order to hunt unsupervised. Youths 12 – 15 years of age may hunt without a HunterEducation certificate if under the direct supervision of a licensed adult 21 years of age and older. Youths under 12 years of age must stillbe under adult supervision while hunting. An apprentice license was also created. The apprentice license is for residents over the age of 15which do not have the required certificate of hunter education. This apprentice license may be purchased only one time by a resident and theapprentice hunting licensee must be accompanied by a licensed or exempt resident hunter at least twenty-one (21) years of age when hunting.With these new hunter education requirements, we are confident accident numbers will continue to decline.622006-2007 Mississippi Deer Program Report
2006-2007 Hunting Incident/Accident DataFigure 28: Hunting Incident by Animal HuntedFigure 29: Hunting IncidentsFigure 30: Students Trained by YearHu n t e r Ac c i d e n t s2006-2007 Mississippi Deer Program Report63
Magnolia Records ProgramBy: Rick DillardThe year 2007 marks the 7th year of the Magnolia Records Program. Since the beginning, over 4,300 deer have been scored and over 2,800met the minimum requirements (125 inches for typical and 155 inches for non-typical). Counties bordering the Mississippi River and theBig Black River continue to stand out as the top contributors of bucks to Magnolia Records.Over 500 deer with inside spreads greater than or equal to 20” have been entered. The widest deer on record was harvested by Ken Helmickin Madison County with an inside spread of 28 6/8 inches.A total of 172 bucks in Magnolia Records have been harvested on public land (WMAs, National Wildlife Refuges, U.S. Forest Service, U.S.Army Corps of Engineers). Ray Barrett harvested the largest non-typical from public land with a 201 3/8 inch buck.During the 2006 – 2007 hunting season, several bucks worthy of being recognized were harvested. The largest typical buck scored 171 andwas taken by Kirk Hannon in Madison County. The largest non-typical buck scored 219 6/8 and was taken by Stephen Brian Smith in MarshallCounty. Lastly, Angus Catchot’s 187 3/8 non-typical buck from Washington County was the largest taken by archery.Many outstanding bucks, too numerous to list here, are being entered in Magnolia Records each year. To view all entries and their photosvisit www.mdwfp.com and look for Magnolia Records.Figure 31: MRP Qualified Non-typical DeerFigure 32: MRP Qualified Typical DeerRe c o r d s642006-2007 Mississippi Deer Program Report
Pope and Young Deer Taken in MississippiTable 23. Non-Typical Trophies (Minimum Score 155)RANK SCORE STATUS TAKEN BY SEASON COUNTY1** 236 1/8 1 Tracy Laird 2003-04 Adams2 204 1 Denver Eshee 1996-97 Webster3 195 5/8 1 Damon C. Saik 2000-01 Madison4 187 3/8 3 Angus Catchot 2006-07 Washington5 178 3/8 3 Wyn Diggs 2006-07 Holmes6 177 3/8 2 Adam McCurdy 2005-06 Holmes7 173 3/4 1 Jimmy Riley 2000-01 Adams8 165 5/8 1 James Goss, Jr. 1987-88 WashingtonTable 24. Typical Trophies (Minimum Score 125)RANK SCORE STATUS TAKEN BY SEASON COUNTY123456789+9+1011165 6/8 2 Carl Taylor 2004-05 Issaquena164 7/8 1 James House 1999-00 Issaquena160 1/8 1 Odis Hill, Jr. 1989-90 Washington159 6/8 1 Steve Nichols 1986-87 Washington158 4/8 1 John Harvey 1989-90 Adams157 1 James Morris 1998-99 Tunica156 7/8 2 Allen Henry 1993-94 Simpson156 2/8 1 Chris Cordell 1996-97 DeSoto155 7/8 1 Charles Neely 1993-94 Coahoma155 7/8 1 John Windham 1997-98 Jefferson155 2/8 1 Marty Hendrix 2000-01 Claiborne155 1/8 1 Jim Agent 1997-98 Jefferson** OFFICIAL STATE RECORD + TIES1 - IN BOWHUNTING RECORDS OF NORTH AMERICAN WHITETAIL <strong>DEER</strong> 3 - OFFICIALLY SCORED AND PENDING2 - OFFICIALLY SCORED AND ACCEPTED 4 - OFFICIALLY SCORED BUT NOT ENTEREDRe c o r d s2006-2007 Mississippi Deer Program Report65
Boone and Crockett Deer Taken in MississippiTable 25. Non-Typical Trophies (Minimum Score 195)RANK SCORE STATUS TAKEN BY SEASON COUNTYRe c o r d s1 ** 295 6/8 1 Tony Fulton 1994-95 Winston2 225 1 Richard Herring 1988-89 Lowndes3 221 2/8 1 Milton Parrish 1972-73 Holmes4 220 3/8 1 Dean Jones 1976-77 Oktibbeha5 219 6/8 3 Brian Smith 2006-07 Marshall6 219 2/8 1 Matt Woods 1997-98 Hinds7 217 5/8 1 Mark Hathcock 1977-78 Carroll8 216 5/8 4 (Pick up) Matthew Freeny 1989-99 Winston9 212 5/8 2 Stephen McBrayer 2005-06 Pontotoc10 212 1 Wayne Parker 1999-00 Madison11 210 4 (Pick up) Chip Haynes 2000-01 Madison12 209 6/8 1 Ronnie Strickland 1981-82 Franklin13 207 3/8 1 Larry Reece 2001-02 Madison14 205 6/8 1 Joe Shurden 1976-77 Lowndes15 205 1 (Pick up) Tommy Yateman 1959 Lowndes16 204 1 Denver Eshee 1996-97 Webster17 202 5/8 1 George Galey 1960’S Carroll18 202 4/8 1 William Westmoreland 2001-02 Pontotoc19 + 202 1/8 1 Oliver Lindig 1983-84 Oktibbeha19 + 202 1/8 2 Bobby Smith 1992-93 Tate20 201 6/8 1 Jimmy Ashley 1985-86 Wilkinson21 201 3/8 1 Ray Barrett 2002-03 Washington22 200 7/8 4 Don Williams 1997-98 Jefferson23 200 6/8 1 Pamela Reid-Rhoades 1993-94 Oktibbeha24 199 3/8 2 John E. Hayes 1976-77 Holmes25 199 1/8 4 Jay Leggette 1999-00 Hinds26 198 5/8 1 Timothy Watson 1997-98 Oktibbeha27 198 4/8 1 John T. Campbell 2001-02 Issaquena28 197 2/8 1 Arthur Halfacre 1997-98 Noxubee29 197 2 Patrick Cenac 2005-06 Adams30 196 7/8 1 Eddie Alias, Jr. 1989-90 Yazoo31 196 5/8 1 Robert Sullivan 1981-82 Wilkinson32 195 7/8 1 Ken Dye 1986-87 Monroe33 195 6/8 4 Mark Kinard 1978-79 Oktibbeha34 + 195 5/8 1 Kathleen McGehee 1981-82 Adams34 + 195 5/8 1 Damon C. Saik 2000-01 Madison35 + 195 2/8 1 Leland N. Dye, Jr. 2001-02 Tunica35 + 195 2/8 1 Bill Kimble 1995-96 Copiah** OFFICIAL STATE RECORD + TIES1 - IN RECORDS OF NORTH AMERICAN BIG GAME 3 - OFFICIALLY SCORED AND PENDING2 - OFFICIALLY SCORED AND ACCEPTED 4 - OFFICIALLY SCORED BUT NOT ENTERED662006-2007 Mississippi Deer Program Report
Boone and Crockett Deer Taken in MississippiTable 26. Typical Trophies (Minimum Score 170)RANK SCORE STATUS TAKEN BY SEASON COUNTY1 ** 182 7/8 1 Glen Jourdan 1986-87 Noxubee2 182 2/8 1 R. L. Bobo 1955-56 Claiborne3 181 5/8 1 Ronnie Whitaker 1980-81 Wilkinson4 180 4/8 1 W. F. Smith 1968-69 Leflore5 180 2/8 1 Steve Greer 1995-96 Madison6 179 2/8 1 Marlon Stokes 1988-89 Hinds7 178 5/8 1 Grady Robertson 1951-52 Bolivar8 176 5/8 1 Sidney Sessions 1952-53 Bolivar9 176 1/8 1 J.D. Hood 1972-73 Monroe10 + 175 2/8 1 Johnnie Leake, Jr. 1977-78 Wilkinson10 + 175 2/8 1 Charlie G. Wilson, II 2001-02 Neshoba11 175 2 Kyle Gordon 2005-06 Madison12 + 174 6/8 1 O. P. Gilbert 1960-61 Coahoma12 + 174 6/8 1 Jeremy Boelte 1997-98 Adams13 + 174 1/8 1 William Ladd 1999-00 Noxubee13 + 174 1/8 4 Mike Shell, current owner 1940 Warren13 + 174 1/8 1 Bill Walters 1995-96 Coahoma14 173 5/8 1 Geraline Holliman 1982-83 Lowndes15 173 3/8 1 Richard Powell 1994-95 Coahoma16 172 5/8 1 Adrian Stallone 1983-84 Adams17 + 172 1 Barry Barnes 2003-04 Yazoo17 + 172 1 Nan Foster New 1977-78 Adams18 171 6/8 1 Delton Davis 1990-91 Tunica19 171 4/8 1 Ricky Lee 1999-00 Tallahatchie20 171 2 Kirk Hannon 2006-07 Madison21 170 7/8 1 W. A. Miller 1920 Issaquena22 170 4/8 4 Joe Reed Perry Unknown Sharkey23 170 2/8 1 David G. McAdory 1994-95 Madison24 170 1/8 4 Joe W. Martin 1994-95 Madison** OFFICIAL STATE RECORD + TIES1 - IN RECORDS OF NORTH AMERICAN BIG GAME 3 - OFFICIALLY SCORED AND PENDING2 - OFFICIALLY SCORED AND ACCEPTED 4 - OFFICIALLY SCORED BUT NOT ENTEREDRe c o r d s2006-2007 Mississippi Deer Program Report67
In ConclusionconclusionStatusA s in previous reports, data collected from a wide array of sources during the 2006 – 2007 season continued to indicate a diverse statewidedeer herd. Unique populations continued to exist in all regions of the state.Condition data and field habitat evaluations conducted by biologists continued to document the effects of current and long-term over-population in some areas of the state. Degradation of deer habitat and noticeable substandard condition indicators such as low reproductionwere prevalent. Many locations in the state have experienced on-going damage of native browse by overpopulation of the deer herd since theearly 1970’s. Deer habitat on poorer soils has been damaged at a greater level than habitat on more fertile soils. In addition, habitat damageon lower fertility soils requires a longer recovery time than on the more fertile soils in regions like the Mississippi Delta. Reduction of deerpopulations to levels where habitat can recover is unacceptable to many hunters. The result has been continued over-use of quality browsespecies by deer.The effects of Hurricane Katrina are beginning to be realized and will be observed for years to come. Lack of hunter’s ability to access publicand private lands in southeast Mississippi due to timber damage was evident in the hunter man-days and harvest during the 2005 – 2006season. Access to these lands was improved prior to the 2006 – 2007 season, but man-days and harvest have not returned to pre-Katrinalevels. In the next few years the population levels may increase due to the habitat shift from mature pine stands to more of a cut-over typemakeup in this section of the state.istockphoto.comDeclines in deer condition and habitat quality have occurred in regions of the state where extensive acreage were converted from agricul-ture to pine monocultures in the late 1980s. Assorted federal and state incentive programs perpetuated this condition by providing cost-shareopportunities to landowners. The result was an increasing acreage of densely planted plantations of pine on sites with a history of agriculture.Herbicide applications to other pine plantations to prevent competition and thereby eliminating browse plants caused decreased body weightsand reproduction. Minimal amounts of deer forage were found in these sites, which allow only a moderate deer population to cause over-utili-zation of the browse that does occur. The result was a poor herd health due to a lack of quality and quantity of native browse plants. However,most of these pine monocultures are at mid-rotation age (14 – 20 years old). Timber thinning has begun on some of these sites, resulting inadditional browse production because sunlight is reaching the forest floor where it has been lacking in the past. These thinnings along withmid-rotation stand improvements (i.e., herbicide application and/or prescribed fire) will drastically improve browse production.For the fourth year a tool was offered to landowners and hunting clubs which suffer from extreme overpopulation or whose objective is682006-2007 Mississippi Deer Program Report
to reduce total deer numbers. This tool is also effective for the removal of management bucks on above average habitat. Legislation waspassed in 2003 allowing the harvest of sub - 4 point bucks by special permit; and altered to include management bucks in 2005. Landownersor clubs must meet certain requirements, such as cooperating with an approved wildlife biologist and be enrolled in DMAP for a minimumof at least one year to be eligible for these tags. A written justification from the biologist must be approved by the MDWFP Deer Committeebefore management tags will be issued to a property. The biologist recommendations are used to determine the management buck criteriaon individual properties.Co n c l u s i o nRecommendationsStatewide variance in parameters such as breeding dates, condition indicators, and changes in habitat quality continue to warrant intelligentsite-specific deer management recommendations. Because of the extreme diversity in management needs across the state, landownerscan implement these recommendations only if they are provided with a season framework that offers maximum opportunity or withspecial permits that allow additional opportunity.A liberal antlerless season framework is mandatory if landowners are to meet management goals. Antlerless opportunity should be providedto allow landowners in all regions of the state the opportunity to manage deer populations. Decision makers will receive an increasingnumber of negative reports associated with antlerless hunting opportunity, as behavioral changes in the deer population create changes thatmake deer less visible to hunters. Continued complaints will arise as hunters incorrectly associate decreasing deer populations to antlerlessseason opportunity. These complaints will be more frequent in areas of the state with poor soil quality, previously high deer populations,and/or declining habitat quality.An effective method to monitor statewide harvest on a county basis is needed to take deer management to the next level in Mississippi.Harvest data, which would include sex, harvest method, and county of harvest would provide information from which detailed analyses of thedeer herd could occur. A telephone-based reporting system, which provides this type of information, is currently in use in many states acrossthe Southeast. Harvest data at a county level are instantaneously available to wildlife officials in these states. Voluntary implementation of asimilar, efficient and cost-effective system, known as Tel-Chek, began in 2002, but has been underutilized. A mandatory tagging and reportingsystem like Tel-Chek would provide biologists with much needed data, and law enforcement officers with a new tool to enforce bag limits.Evaluation of the 4-Point Law has led to a recommendation by the MDWFP Deer Committee to eliminate this law. The new proposal is todivide the state into 3 Deer Management Zones and use a minimum spread or main beam length criteria based on local parameters in place ofone statewide point based criteria. The proposal includes recommendations to change the antlerless bag limit from 3 antlerless deer with anyweapon and 2 additional antlerless deer with archery equipment to 5 antlerless deer with any weapon. Additionally, the proposal is to alter the3 buck bag limit to 2 bucks that meet antler criteria and one buck of choice (AKA “Charlie” Buck). This would give the hunter more flexibilityto manage the deer herd on their property.Research funding should continue. Continued advancement of the state deer program hinges on the professional association and interactionwith current deer research projects. The MDWFP Wildlife Technical Staff has benefited professionally from this relationship with MississippiState University for over 20 years. Many of the advances in the management of Mississippi’s deer herd would not have occurred withoutthis relationship. The opportunity to find answers, which address practical management questions, should continue to receive priority.Existing data collection procedures on public and private lands must continue if responsible harvest recommendations for these lands areexpected. Extensive baseline data exists from which objective evaluations can be conducted to examine the effects of changes in habitat, huntingopportunity, and harvest schemes. The annual mail survey will continue to be a valuable tool to monitor trends in a variety of importantcategories.Information and education should remain the top priority of the deer program in Mississippi. Deer management needs are well documentedin most regions of the state. Landowner and hunter understanding, acceptance, and support of sound deer management will continue todetermine the success of deer management in Mississippi. Deer management objectives should be better communicated to the users ofthis resource. Without landowner and hunter support, success is not expected. When provided the freedom, sportsmen in Mississippi haveproven they can make informed decisions that benefit the deer resource if they are provided with the correct management and biologicalinformation.2006-2007 Mississippi Deer Program Report69
Notes702006-2007 Mississippi Deer Program Report
Notes2006-2007 Mississippi Deer Program Report71
Notes722006-2007 Mississippi Deer Program Report
Notes2006-2007 Mississippi Deer Program Report 73
Notes742006-2007 Mississippi Deer Program Report
The MDWFP is an equal opportunity employer and provider of programs and services. If anyone believes they have been subjected to discrimination on the basis of politicalaffiliation, race, color, national origin, marital status, sex, religion, creed, age, or disability, they may file a complaint alleging discrimination with either the MississippiDepartment of Wildlife, Fisheries and Parks, Office of Administrative Services, P.O. Box 451, Jackson, MS 39205-0451, or the U.S. Equal Employment Opportunity Commission,1801 L. Street, N.W. Washington, D.C. 20507.STANDARD MAILU.S. PostagePAIDJackson, MSPermit 449