DEER PROGRAM REPORT DEER ROGRAM REPORT
DEER PROGRAM REPORT DEER ROGRAM REPORT
DEER PROGRAM REPORT DEER ROGRAM REPORT

You also want an ePaper? Increase the reach of your titles
YUMPU automatically turns print PDFs into web optimized ePapers that Google loves.
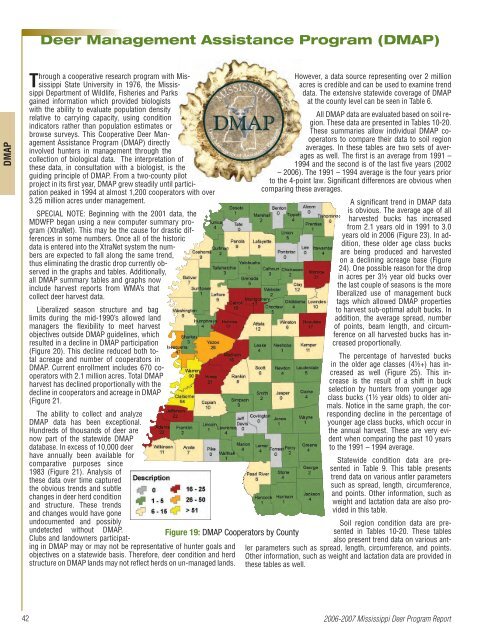
Deer Management Assistance Program (DMAP)DMAPThrough a cooperative research program with MississippiState University in 1976, the MississippiDepartment of Wildlife, Fisheries and Parksgained information which provided biologistswith the ability to evaluate population densityrelative to carrying capacity, using conditionindicators rather than population estimates orbrowse surveys. This Cooperative Deer ManagementAssistance Program (DMAP) directlyinvolved hunters in management through thecollection of biological data. The interpretation ofthese data, in consultation with a biologist, is theguiding principle of DMAP. From a two-county pilotproject in its first year, DMAP grew steadily until participationpeaked in 1994 at almost 1,200 cooperators with over3.25 million acres under management.SPECIAL NOTE: Beginning with the 2001 data, theMDWFP began using a new computer summary program(XtraNet). This may be the cause for drastic differencesin some numbers. Once all of the historicdata is entered into the XtraNet system the numbersare expected to fall along the same trend,thus eliminating the drastic drop currently observedin the graphs and tables. Additionally,all DMAP summary tables and graphs nowinclude harvest reports from WMA’s thatcollect deer harvest data.Liberalized season structure and baglimits during the mid-1990’s allowed landmanagers the flexibility to meet harvestobjectives outside DMAP guidelines, whichresulted in a decline in DMAP participation(Figure 20). This decline reduced both totalacreage and number of cooperators inDMAP. Current enrollment includes 670 cooperatorswith 2.1 million acres. Total DMAPharvest has declined proportionally with thedecline in cooperators and acreage in DMAP(Figure 21.The ability to collect and analyzeDMAP data has been exceptional.Hundreds of thousands of deer arenow part of the statewide DMAPdatabase. In excess of 10,000 deerhave annually been available forcomparative purposes since1983 (Figure 21). Analysis ofthese data over time capturedthe obvious trends and subtlechanges in deer herd conditionand structure. These trendsand changes would have goneundocumented and possiblyundetected without DMAP.Clubs and landowners participatingin DMAP may or may not be representative of hunter goals andobjectives on a statewide basis. Therefore, deer condition and herdstructure on DMAP lands may not reflect herds on un-managed lands.Figure 19: DMAP Cooperators by CountyHowever, a data source representing over 2 millionacres is credible and can be used to examine trenddata. The extensive statewide coverage of DMAPat the county level can be seen in Table 6.All DMAP data are evaluated based on soil region.These data are presented in Tables 10-20.These summaries allow individual DMAP cooperatorsto compare their data to soil regionaverages. In these tables are two sets of averagesas well. The first is an average from 1991 –1994 and the second is of the last five years (2002– 2006). The 1991 – 1994 average is the four years priorto the 4-point law. Significant differences are obvious whencomparing these averages.A significant trend in DMAP datais obvious. The average age of allharvested bucks has increasedfrom 2.1 years old in 1991 to 3.0years old in 2006 (Figure 23). In addition,these older age class bucksare being produced and harvestedon a declining acreage base (Figure24). One possible reason for the dropin acres per 3½ year old bucks overthe last couple of seasons is the moreliberalized use of management bucktags which allowed DMAP propertiesto harvest sub-optimal adult bucks. Inaddition, the average spread, numberof points, beam length, and circumferenceon all harvested bucks has increasedproportionally.The percentage of harvested bucksin the older age classes (4½+) has increasedas well (Figure 25). This increaseis the result of a shift in buckselection by hunters from younger ageclass bucks (1½ year olds) to older animals.Notice in the same graph, the correspondingdecline in the percentage ofyounger age class bucks, which occur inthe annual harvest. These are very evidentwhen comparing the past 10 yearsto the 1991 – 1994 average.Statewide condition data are presentedin Table 9. This table presentstrend data on various antler parameterssuch as spread, length, circumference,and points. Other information, such asweight and lactation data are also providedin this table.Soil region condition data are presentedin Tables 10-20. These tablesalso present trend data on various antlerparameters such as spread, length, circumference, and points.Other information, such as weight and lactation data are provided inthese tables as well.422006-2007 Mississippi Deer Program Report