DEER PROGRAM REPORT DEER ROGRAM REPORT
DEER PROGRAM REPORT DEER ROGRAM REPORT
DEER PROGRAM REPORT DEER ROGRAM REPORT

You also want an ePaper? Increase the reach of your titles
YUMPU automatically turns print PDFs into web optimized ePapers that Google loves.
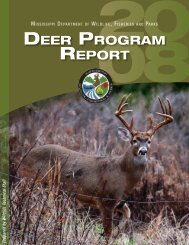
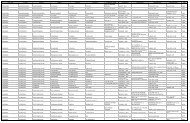
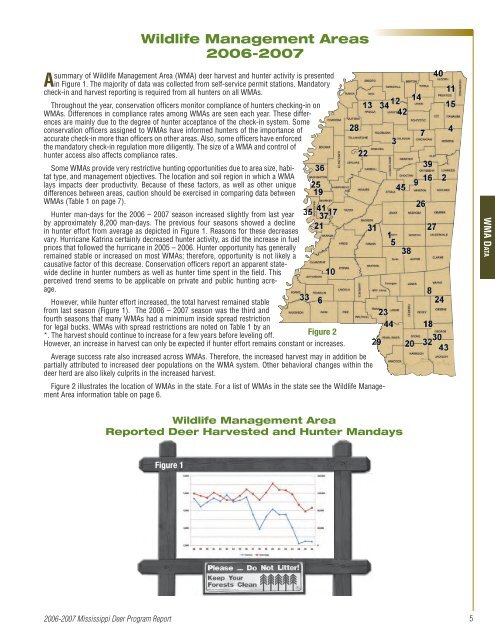
Wildlife Management Areas2006-2007summary of Wildlife Management Area (WMA) deer harvest and hunter activity is presentedA in Figure 1. The majority of data was collected from self-service permit stations. Mandatorycheck-in and harvest reporting is required from all hunters on all WMAs.Throughout the year, conservation officers monitor compliance of hunters checking-in onWMAs. Differences in compliance rates among WMAs are seen each year. These differencesare mainly due to the degree of hunter acceptance of the check-in system. Someconservation officers assigned to WMAs have informed hunters of the importance ofaccurate check-in more than officers on other areas. Also, some officers have enforcedthe mandatory check-in regulation more diligently. The size of a WMA and control ofhunter access also affects compliance rates.Some WMAs provide very restrictive hunting opportunities due to area size, habitattype, and management objectives. The location and soil region in which a WMAlays impacts deer productivity. Because of these factors, as well as other uniquedifferences between areas, caution should be exercised in comparing data betweenWMAs (Table 1 on page 7).Hunter man-days for the 2006 – 2007 season increased slightly from last yearby approximately 8,200 man-days. The previous four seasons showed a declinein hunter effort from average as depicted in Figure 1. Reasons for these decreasesvary. Hurricane Katrina certainly decreased hunter activity, as did the increase in fuelprices that followed the hurricane in 2005 – 2006. Hunter opportunity has generallyremained stable or increased on most WMAs; therefore, opportunity is not likely acausative factor of this decrease. Conservation officers report an apparent statewidedecline in hunter numbers as well as hunter time spent in the field. Thisperceived trend seems to be applicable on private and public hunting acreage.However, while hunter effort increased, the total harvest remained stablefrom last season (Figure 1). The 2006 – 2007 season was the third andfourth seasons that many WMAs had a minimum inside spread restrictionfor legal bucks. WMAs with spread restrictions are noted on Table 1 by an*. The harvest should continue to increase for a few years before leveling off. Figure 2However, an increase in harvest can only be expected if hunter effort remains constant or increases.Average success rate also increased across WMAs. Therefore, the increased harvest may in addition bepartially attributed to increased deer populations on the WMA system. Other behavioral changes within thedeer herd are also likely culprits in the increased harvest.Figure 2 illustrates the location of WMAs in the state. For a list of WMAs in the state see the Wildlife ManagementArea information table on page 6.WMA DataWildlife Management AreaReported Deer Harvested and Hunter MandaysFigure 12006-2007 Mississippi Deer Program Report5