Perception of speaker sex, age, and vocal effort - Stockholms ...
Perception of speaker sex, age, and vocal effort - Stockholms ...
Perception of speaker sex, age, and vocal effort - Stockholms ...
- No tags were found...
You also want an ePaper? Increase the reach of your titles
YUMPU automatically turns print PDFs into web optimized ePapers that Google loves.
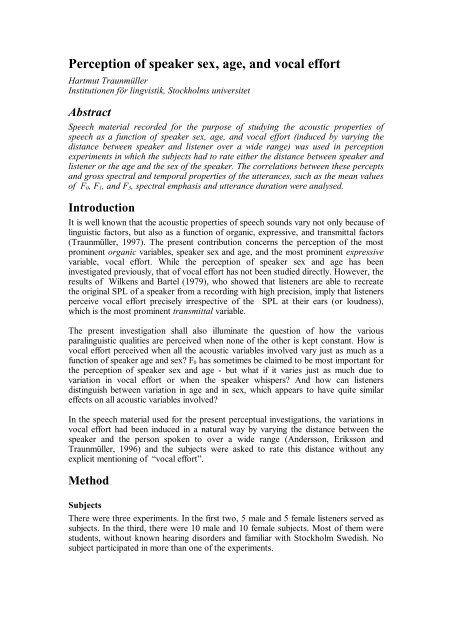
<strong>Perception</strong> <strong>of</strong> <strong>speaker</strong> <strong>sex</strong>, <strong>age</strong>, <strong>and</strong> <strong>vocal</strong> <strong>effort</strong>Hartmut TraunmüllerInstitutionen för lingvistik, <strong>Stockholms</strong> universitetAbstractSpeech material recorded for the purpose <strong>of</strong> studying the acoustic properties <strong>of</strong>speech as a function <strong>of</strong> <strong>speaker</strong> <strong>sex</strong>, <strong>age</strong>, <strong>and</strong> <strong>vocal</strong> <strong>effort</strong> (induced by varying thedistance between <strong>speaker</strong> <strong>and</strong> listener over a wide range) was used in perceptionexperiments in which the subjects had to rate either the distance between <strong>speaker</strong> <strong>and</strong>listener or the <strong>age</strong> <strong>and</strong> the <strong>sex</strong> <strong>of</strong> the <strong>speaker</strong>. The correlations between these percepts<strong>and</strong> gross spectral <strong>and</strong> temporal properties <strong>of</strong> the utterances, such as the mean values<strong>of</strong> F 0 , F 1 , <strong>and</strong> F 3 , spectral emphasis <strong>and</strong> utterance duration were analysed.IntroductionIt is well known that the acoustic properties <strong>of</strong> speech sounds vary not only because <strong>of</strong>linguistic factors, but also as a function <strong>of</strong> organic, expressive, <strong>and</strong> transmittal factors(Traunmüller, 1997). The present contribution concerns the perception <strong>of</strong> the mostprominent organic variables, <strong>speaker</strong> <strong>sex</strong> <strong>and</strong> <strong>age</strong>, <strong>and</strong> the most prominent expressivevariable, <strong>vocal</strong> <strong>effort</strong>. While the perception <strong>of</strong> <strong>speaker</strong> <strong>sex</strong> <strong>and</strong> <strong>age</strong> has beeninvestigated previously, that <strong>of</strong> <strong>vocal</strong> <strong>effort</strong> has not been studied directly. However, theresults <strong>of</strong> Wilkens <strong>and</strong> Bartel (1979), who showed that listeners are able to recreatethe original SPL <strong>of</strong> a <strong>speaker</strong> from a recording with high precision, imply that listenersperceive <strong>vocal</strong> <strong>effort</strong> precisely irrespective <strong>of</strong> the SPL at their ears (or loudness),which is the most prominent transmittal variable.The present investigation shall also illuminate the question <strong>of</strong> how the variousparalinguistic qualities are perceived when none <strong>of</strong> the other is kept constant. How is<strong>vocal</strong> <strong>effort</strong> perceived when all the acoustic variables involved vary just as much as afunction <strong>of</strong> <strong>speaker</strong> <strong>age</strong> <strong>and</strong> <strong>sex</strong>? F 0 has sometimes be claimed to be most important forthe perception <strong>of</strong> <strong>speaker</strong> <strong>sex</strong> <strong>and</strong> <strong>age</strong> - but what if it varies just as much due tovariation in <strong>vocal</strong> <strong>effort</strong> or when the <strong>speaker</strong> whispers? And how can listenersdistinguish between variation in <strong>age</strong> <strong>and</strong> in <strong>sex</strong>, which appears to have quite similareffects on all acoustic variables involved?In the speech material used for the present perceptual investigations, the variations in<strong>vocal</strong> <strong>effort</strong> had been induced in a natural way by varying the distance between the<strong>speaker</strong> <strong>and</strong> the person spoken to over a wide range (Andersson, Eriksson <strong>and</strong>Traunmüller, 1996) <strong>and</strong> the subjects were asked to rate this distance without anyexplicit mentioning <strong>of</strong> “<strong>vocal</strong> <strong>effort</strong>”.MethodSubjectsThere were three experiments. In the first two, 5 male <strong>and</strong> 5 female listeners served assubjects. In the third, there were 10 male <strong>and</strong> 10 female subjects. Most <strong>of</strong> them werestudents, without known hearing disorders <strong>and</strong> familiar with Stockholm Swedish. Nosubject participated in more than one <strong>of</strong> the experiments.
Speech materialThere were five phonated <strong>and</strong> two whispered versions <strong>of</strong> the sentence ”Jag tog ettviolett, åtta svarta och <strong>sex</strong> vita” ‘I took one violet, eight black <strong>and</strong> six white’ producedby 6 men (mean <strong>age</strong> 35 years), 6 women (mean <strong>age</strong> 25 years), four boys <strong>and</strong> four girls(all 7 years). The sentence had been elicited in response to the question ”Hur mångakort tog du av varje färg?” ‘How many cards <strong>of</strong> each color did you take?’ by anexperimenter, always the same, whose distance from the <strong>speaker</strong> was 0.3, 1.5, 7.5,38.5, or 187.5 m for the phonated versions, <strong>and</strong> 0.3 <strong>and</strong> 1.5 m for the whispered. Forthe adult <strong>speaker</strong>s, the procedure has been described by Andersson, Eriksson <strong>and</strong>Traunmüller (1996) <strong>and</strong> the same procedure was followed when recording thechildren. The speech material has been subjected to various acoustic measurementsamong which the following figure in the present report:1) The overall duration <strong>of</strong> the whole sentence.2) The mean value <strong>of</strong> the fundamental frequency over all voiced portions.3) A measure <strong>of</strong> spectral emphasis, calculated as the excess <strong>of</strong> the total signal level Lover the ‘level <strong>of</strong> the first partial’ L 0 , measured after low pass filtering the signal at1.5 F 0 (mean), 36 dB/octave.4) Approximate mean values <strong>of</strong> F 1 <strong>and</strong> F 3 , obtained by LPC analysis <strong>of</strong> theconcatenated voiced portions <strong>of</strong> each utterance using a rectangular analysis windowwhose length was equal to that <strong>of</strong> the utterance. For this purpose, the signal wasdown sampled to 10.667, 8.0 <strong>and</strong> 6.4 kHz for children, women <strong>and</strong> men, <strong>and</strong> 8reflection coefficients were used.ProcedureThe utterances were presented to the subjects through headphones in r<strong>and</strong>omizedorder <strong>and</strong> they had to choose among a number <strong>of</strong> response alternatives on screen.When they had made their choice, the next stimulus was presented. In experiments 1<strong>and</strong> 2, the task was to estimate the distance between the <strong>speaker</strong> <strong>and</strong> person spoken to(in 25 steps from 0.2 to 490 m). In experiment 1, the stimuli were presented (twice)with the natural variation in level that a listener would experience at a constantdistance from the <strong>speaker</strong>. In experiment 2, each utterance was presented at twoconstant levels that differed by 6 dB. In experiment 3, the task consisted in estimatingthe <strong>age</strong> <strong>of</strong> the listener (in 25 steps from 4 to 75 years) <strong>and</strong> to give a confidence ratingconcerning the <strong>speaker</strong>’s <strong>sex</strong> (in 9 steps from certain female to certain male). Theexperiments were done by Jessika Rundlöf (1996), who also studied the correlationswith the acoustic factors (1) to (3) in experiments 1 <strong>and</strong> 2, before the formantfrequencies (4) had been measured.Results <strong>and</strong> discussionVocal <strong>effort</strong> judgements by distanceThe distance estimates were heavily biased. While the smallest distance, 0.3 m wasoverestimated, the distances from 7.5 to 187.5 m were underestimated in bothexperiments (1 <strong>and</strong> 2). Therefore, the slopes <strong>of</strong> the regression lines listed in Table 1 arebelow 1.00. An improved fit is obtained by correlating the distance ratings (in meters)with the modified distance sqrt(distance 2 + 1.5 2 ). The differences between the results<strong>of</strong> the two experiments <strong>and</strong> between the two levels <strong>of</strong> presentation in exp. 2 were smallbut significant. The distance ratings could be predicted very well from the acousticfactors (see Table 2) <strong>and</strong> they can be taken as quite accurate measures <strong>of</strong> <strong>vocal</strong> <strong>effort</strong>,which is indicated by the high correlation between the ratings obtained for eachutterance in the two experiments (2 vs. 1 in Tabel 1).
Table 1. Ratings <strong>of</strong> communicative distance correlated with spatial distance <strong>and</strong> witheach other, <strong>and</strong> ratings <strong>of</strong> <strong>speaker</strong> <strong>age</strong> correlated with chronological <strong>age</strong>.Exp. nr. Slope rlog 2 (dist) against spatial distance 1 0.58 0.90log 2 (dist) against modified distance 1 0.79 0.93log 2 (dist) against log 2 (dist) 2 vs. 1 0.93 0.993log 2 (<strong>age</strong>) against chronological <strong>age</strong> 3 0.97 0.97Table 2. Multiple regression analysis <strong>of</strong> six acoustic properties (independentvariables) vs. perceived communicative distance, <strong>speaker</strong> <strong>age</strong> <strong>and</strong> <strong>sex</strong> (dependentvariables). Coefficients indicate unnormalized weights <strong>of</strong> acoustic propertiesquantified as listed. Question mark: not significantly different from zero (p > 0.05).PerceptDistance Distance Age Confidence rated <strong>sex</strong>exp. 1 exp. 2Quantification log 2 (dist) log 2 (dist) log 2 (<strong>age</strong>) Female (1) .. male (2)Set <strong>of</strong> utterances phonated phonated all adults childrenn 99 99 138 83 55r 2 0.94 0.95 0.88 0.81 0.05Coefficients:F 0 [+1 octave] 2.15 2.06 0.14 ? -0.27 -0.07 ?F 1 [+1 octave] 1.18 1.04 -0.18 ? -0.02 ? 0.35 ?F 3 [+1 octave] -4.53 -4.43 -3.52 -1.75 -0.02 ?L - L 0 [+6 dB] 1.90 1.77 0.14 ? 0.34 -0.16 ?Duration [doubled] -0.08 ? 0.12 ? -0.01 ? -0.16 ? 0.10 ?[Whispered vs. phonated] ------ ------ 0.10 ? 0.06 ? 0.06 ?Age judgementsThe mean <strong>age</strong> ratings were close to the chronological <strong>age</strong> <strong>of</strong> the <strong>speaker</strong>s (see Table 1)<strong>and</strong> they could be predicted fairly well on the basis <strong>of</strong> the acoustic factors considered(see Table 2). This is remarkable, since the acoustic factors are affected in a similarway by variation in <strong>age</strong> as by variation in <strong>sex</strong>. The weights <strong>of</strong> the coefficients listed inTable 2 have been obtained by comparing ‘adults’ with ‘children’. They are likely toturn out quite differently in comparisons including only children or only adults <strong>of</strong>different <strong>age</strong>.Sex judgementsThe mean <strong>sex</strong> ratings agreed with the physiological <strong>sex</strong> for all utterances <strong>of</strong> the adult<strong>speaker</strong>s. While the subjects were less confident in rating the <strong>sex</strong> <strong>of</strong> the children, therewere actually only three category confusions in the mean data, but may more in theindividual data For adult <strong>speaker</strong>s, the <strong>sex</strong> ratings clustered close to the extremes <strong>of</strong>the scale <strong>and</strong> they could be predicted fairly well from the acoustic data (r = 0.91), butfor children this attempt failed obtrusively (r = 0.24), see Table 2. Since the acousticfactors considered here cover almost all <strong>of</strong> any ‘static’ spectral differences between theutterances, we have to conclude that the recognition <strong>of</strong> <strong>sex</strong> in children must be mainlybased on dynamic <strong>and</strong> segment specific properties <strong>of</strong> speech signals. It has beenreported that the number <strong>of</strong> F 0 -movements per time unit is significantly higher in thespeech <strong>of</strong> girls than in that <strong>of</strong> boys (Johansson, 1979), but such variation is restricted
y linguistic factors so that this can hardly be valid when the utterances arelinguistically identical.Reverse analysisSince we are not used to reasoning about speech signals from a perceptual point <strong>of</strong>view, the meaning <strong>of</strong> the figures in Table 2 is not easily grasped. We can, however,reverse the analysis <strong>and</strong> predict the acoustic quantities on the basis <strong>of</strong> the perceptual.The result is shown in Table 3. In this table, then, we see the acoustic affects <strong>of</strong> theparalinguistic variations that were present in the speech material, as defined by thelisteners. This gives us a more familiar picture, whose details for the most part aremore immediately intelligible.Table 3. Multiple regression analysis <strong>of</strong> perceived qualities (independent variables)vs. five acoustic variables (dependent variables). Coefficients indicate unnormalizedweights <strong>of</strong> variables quantified as listed. Question mark: not significantly differentfrom zero (p > 0.05).Property Pitch F 1 F 3 Emphasis DurationQuantification log 2 (F 0 ) log 2 (F 1 ) log 2 (F 3 ) L - L 0 log 2 (dur)Unit octave octave octave dBSet <strong>of</strong> utterances phonated all all phonated alln 99 138 138 99 138r 2 0.90 0.89 0.91 0.82 0.41Coefficients:Sex [male vs. female] -0.46 -0.14 -0.13 0.1 0.00 ?Age [doubled] -0.39 -0.24 -0.24 0.1 ? -0.20Distance (1) [doubled] 0.17 0.14 0.01 1.4 0.07[Whispered vs. phonated] ----- 0.12 0.02 ? ----- -0.11 ?* Men vs. children -1.18 -0.64 -0.65 1.0 -0.49* Women vs. children -0.50 -0.34 -0.37 -0.0 ? -0.41* Men vs. women -0.68 -0.31 -0.28 1.0 -0.06 ?* Boys vs. girls 0.01 ? 0.02 ? 0.00 ? 0.0 ? 0.00 ?* For these subsets, the figures on the other rows are not valid.AcknowledgementsThis research has been supported, in part, by a grant from HSFR within the frame <strong>of</strong>the Swedish langu<strong>age</strong> technology programme. I am grateful to Jessika Rundlöf, whohas done all the practical work involved in running these experiments with subjects.ReferencesAndersson A., Eriksson A. <strong>and</strong> Traunmüller H. 1996. Cries <strong>and</strong> whispers: Acousticeffects <strong>of</strong> variations in <strong>vocal</strong> <strong>effort</strong>. TMH-QPSR 2/1996, Speech, Music <strong>and</strong>Hearing, Royal Institute <strong>of</strong> Technology, Stockholm, 127 - 130.Johansson I. 1979. Könsbedömning av förskolebarn på grundval av prosodi.Könsroller i språk 3; FUMS Report Series, no 75, Institutionen för nordiska språk,Uppsala universitet, 75-93.Rundlöf J. 1996. Perceptuella ledtrådar vid auditiv bedömning av avståndet mellantalare och lyssnare. D-uppsats, Institutionen för lingvistik, <strong>Stockholms</strong> universitet.Traunmüller H. 1997. En tur i fonetikens marker: språkliga och utomspråkligafenomen http://www.ling.su.se/staff/hartmut/tur.htmWilkens H. <strong>and</strong> Bartel H-H. 1977. Wiedererkennbarkeit der Originallautstärke einesSprechers bei elektroakustischer Wiedergabe. Acustica 37, 45-49.


