ARKANSAS SPECIAL EDUCATION DISTRICT ANNUAL ...
ARKANSAS SPECIAL EDUCATION DISTRICT ANNUAL ...
ARKANSAS SPECIAL EDUCATION DISTRICT ANNUAL ...

You also want an ePaper? Increase the reach of your titles
YUMPU automatically turns print PDFs into web optimized ePapers that Google loves.
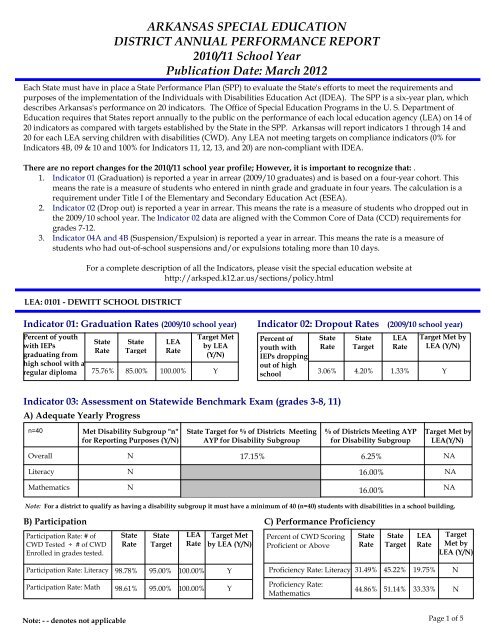
LEA: 0101 - DEWITT SCHOOL <strong>DISTRICT</strong><br />
<strong>ARKANSAS</strong> <strong>SPECIAL</strong> <strong>EDUCATION</strong><br />
<strong>DISTRICT</strong> <strong>ANNUAL</strong> PERFORMANCE REPORT<br />
2010/11 School Year<br />
Publication Date: March 2012<br />
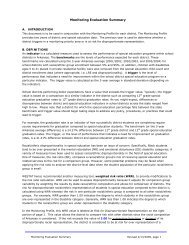
Each State must have in place a State Performance Plan (SPP) to evaluate the State's efforts to meet the requirements and<br />
purposes of the implementation of the Individuals with Disabilities Education Act (IDEA). The SPP is a six-year plan, which<br />
describes Arkansas's performance on 20 indicators. The Office of Special Education Programs in the U. S. Department of<br />
Education requires that States report annually to the public on the performance of each local education agency (LEA) on 14 of<br />
20 indicators as compared with targets established by the State in the SPP. Arkansas will report indicators 1 through 14 and<br />
20 for each LEA serving children with disabilities (CWD). Any LEA not meeting targets on compliance indicators (0% for<br />
Indicators 4B, 09 & 10 and 100% for Indicators 11, 12, 13, and 20) are non-compliant with IDEA.<br />
There are no report changes for the 2010/11 school year profile; However, it is important to recognize that: .<br />
1. Indicator 01 (Graduation) is reported a year in arrear (2009/10 graduates) and is based on a four-year cohort. This<br />
means the rate is a measure of students who entered in ninth grade and graduate in four years. The calculation is a<br />
requirement under Title I of the Elementary and Secondary Education Act (ESEA).<br />
2. Indicator 02 (Drop out) is reported a year in arrear. This means the rate is a measure of students who dropped out in<br />
the 2009/10 school year. The Indicator 02 data are aligned with the Common Core of Data (CCD) requirements for<br />
grades 7-12.<br />
3. Indicator 04A and 4B (Suspension/Expulsion) is reported a year in arrear. This means the rate is a measure of<br />
students who had out-of-school suspensions and/or expulsions totaling more than 10 days.<br />
Percent of youth<br />
with IEPs<br />
graduating from<br />
high school with a<br />
regular diploma<br />
For a complete description of all the Indicators, please visit the special education website at<br />
http://arksped.k12.ar.us/sections/policy.html<br />
Indicator 01: Graduation Rates (2009/10 school year) Indicator 02: Dropout Rates (2009/10 school year)<br />
State<br />
Rate<br />
State<br />
Target<br />
75.76% 85.00%<br />
LEA<br />
Rate<br />
100.00%<br />
Target Met<br />
by LEA<br />
(Y/N)<br />
Y<br />
Percent of<br />
youth with<br />
IEPs dropping<br />
out of high<br />
school<br />
State<br />
Rate<br />
Indicator 03: Assessment on Statewide Benchmark Exam (grades 3-8, 11)<br />
A) Adequate Yearly Progress<br />
n=40<br />
Literacy<br />
Mathematics<br />
Met Disability Subgroup "n"<br />
for Reporting Purposes (Y/N)<br />
State Target for % of Districts Meeting<br />
AYP for Disability Subgroup<br />
State<br />
Target<br />
3.06% 4.20%<br />
LEA<br />
Rate<br />
1.33%<br />
% of Districts Meeting AYP<br />
for Disability Subgroup<br />
Target Met by<br />
LEA (Y/N)<br />
Y<br />
Target Met by<br />
LEA(Y/N)<br />
Overall N 17.15% 6.25%<br />
NA<br />
N<br />
N<br />
Note: For a district to qualify as having a disability subgroup it must have a minimum of 40 (n=40) students with disabilities in a school building.<br />
B) Participation<br />
Participation Rate: # of<br />
CWD Tested ÷ # of CWD<br />
Enrolled in grades tested.<br />
Participation Rate: Literacy<br />
Participation Rate: Math<br />
Note: - - denotes not applicable<br />
State<br />
Rate<br />
98.78%<br />
State<br />
Target<br />
95.00%<br />
LEA<br />
Rate<br />
100.00%<br />
Target Met<br />
by LEA (Y/N)<br />
98.61% 95.00% 100.00% Y<br />
Y<br />
C) Performance Proficiency<br />
Percent of CWD Scoring<br />
Proficient or Above<br />
Proficiency Rate: Literacy<br />
Proficiency Rate:<br />
Mathematics<br />
16.00%<br />
16.00%<br />
State<br />
Rate<br />
31.49%<br />
44.86%<br />
State<br />
Target<br />
45.22%<br />
51.14%<br />
LEA<br />
Rate<br />
19.75%<br />
33.33%<br />
NA<br />
NA<br />
Target<br />
Met by<br />
LEA (Y/N)<br />
N<br />
N<br />
Page 1 of 5
LEA: 0101 - DEWITT SCHOOL <strong>DISTRICT</strong><br />
Indicator 04: Out-of-School Suspensions and Expulsions (2009/10 school year)<br />
A) Suspension/Expulsion<br />
Percent difference of CWD with out-of- school suspensions and<br />
expulsions totaling greater than 10 days in a school year as<br />
compared to the same data for general education students in<br />
the district.<br />
B) Suspension/Expulsion by Race and Ethnicity<br />
Percent of districts that have: (a) a significant discrepancy, by race or<br />
ethnicity, in the rate of suspensions and expulsions of greater than 10<br />
days in a school year for children with IEPs; and (b) policies,<br />
procedures or practices that contribute to the significant discrepancy<br />
and do not comply with requirements relating to the development<br />
and implementation of IEPs, the use of positive behavioral<br />
interventions and supports, and procedural safeguards.<br />
Indicator 05: School Age (5-21) Least Restrictive Environment<br />
A) In the Regular Class 80% or more of the day<br />
Percent of CWD with<br />
IEPs receiving instruction<br />
in the regular class 80%<br />
or more of the day.<br />
State<br />
Rate<br />
State<br />
Target<br />
LEA<br />
Rate<br />
B) In the Regular Class less than 40% of the day<br />
Percent of CWD with<br />
IEPs receiving instruction<br />
in the regular class less<br />
than 60% of the day.<br />
53.87% 59.77%<br />
State<br />
Rate<br />
State<br />
Target<br />
12.42% 12.51%<br />
31.65%<br />
LEA<br />
Rate<br />
19.62%<br />
C) Other Settings outside the regular class<br />
Percent of CWD with IEPs served in<br />
public or private separate schools,<br />
residential placements, or<br />
homebound/hospital placements.<br />
State<br />
Rate<br />
State<br />
Target<br />
2.80% 2.56%<br />
Target Met<br />
by LEA (Y/N)<br />
N<br />
Target Met<br />
by LEA (Y/N)<br />
N<br />
LEA<br />
Rate<br />
0.00%<br />
Target Met<br />
by LEA(Y/N)<br />
Indicator 06: Early Childhood (3-5) Least Restrictive Environment<br />
A) Regular Early Childhood Program<br />
Percent of children (aged 3 through 5) with IEPs attending a regular<br />
early childhood program and receiving the majority of special<br />
education and related services in the regular early childhood program<br />
Allowable<br />
Difference<br />
LEA: 0101 - DEWITT SCHOOL <strong>DISTRICT</strong><br />
Indicator 07: Preschool (3-5) Outcomes<br />
a) Percent of preschool CWD<br />
children who did not<br />
improve functioning.<br />
b) Percent of preschool CWD<br />
who improved but whose<br />
functioning remained below<br />
same age peers.<br />
c) Percent of preschool CWD<br />
who improved at a level<br />
nearer to same aged peers.<br />
d) Percent of preschool CWD<br />
who improved functioning to<br />
reach a level comparable to<br />
same age peers.<br />
e) Percent of preschool CWD<br />
children who maintain<br />
functioning at a level<br />
comparable to same aged<br />
peers.<br />
Summary<br />
Statements<br />
1) Of those preschool<br />
children who entered<br />
the preschool program<br />
below age expectations<br />
in each Outcome, the<br />
percent who<br />
substantially increased<br />
their rate of growth by<br />
the time they turned 6<br />
years of age or exited<br />
the program.<br />
2) The percent of<br />
preschool children who<br />
were functioning<br />
within age expectations<br />
in each Outcome by the<br />
time they turned 6<br />
years of age or exited<br />
A) Positive Social -Emotional<br />
Skills*<br />
State<br />
Rate<br />
A) Positive Social -<br />
Emotional Skills<br />
(Including social<br />
relationships)<br />
State<br />
Rate<br />
2.14%<br />
5.31%<br />
25.97%<br />
38.22%<br />
28.36%<br />
State<br />
Target<br />
LEA<br />
Rate<br />
LEA<br />
Rate<br />
— —<br />
— —<br />
— —<br />
— —<br />
— —<br />
Target<br />
Met by<br />
LEA(Y/N)<br />
B) Acquisition and Use of<br />
Knowledge and Skills<br />
(Including early language/<br />
communication and early literacy)<br />
B) Acquisition and Use of<br />
Knowledge and Skills **<br />
State<br />
Rate<br />
1.75%<br />
6.59%<br />
34.23%<br />
43.51%<br />
13.92%<br />
State<br />
Target<br />
LEA<br />
Rate<br />
Target<br />
Met by<br />
LEA(Y/N)<br />
C) Use of Appropriate Behaviors<br />
to Meet Their Needs<br />
State<br />
Rate<br />
State<br />
Target<br />
LEA<br />
Rate<br />
Target<br />
Met by<br />
LEA(Y/N)<br />
89.61% 90.50% — — N/A 90.31% 90.50% — — N/A 90.82% 92.50% — — N/A<br />
66.58% 69.50% — — N/A 57.43% 60.50% — — N/A 76.69% 78.50% — — N/A<br />
NOTE: * Including social relationships ** Including early language/ communication and early literacy<br />
Note: - - denotes not applicable<br />
State<br />
Rate<br />
LEA<br />
Rate<br />
— —<br />
— —<br />
— —<br />
— —<br />
— —<br />
C) Use of<br />
Appropriate<br />
Behaviors to<br />
Meet Their Needs<br />
State<br />
Rate<br />
4.51%<br />
17.34%<br />
41.72%<br />
34.97%<br />
LEA<br />
Rate<br />
1.46% — —<br />
— —<br />
— —<br />
— —<br />
— —<br />
Page 3 of 5
LEA: 0101 - DEWITT SCHOOL <strong>DISTRICT</strong><br />
Indicator 08: Parent Involvement<br />
Percent of surveyed<br />
parents who reported<br />
school facilitated parent<br />
involvement as a means<br />
of improving services<br />
and results for children<br />
with disabilities.<br />
Early Childhood<br />
(3-5)<br />
School Age<br />
(5-21)<br />
State<br />
Rate<br />
90.47%<br />
95.05%<br />
Indicator 09: Disproportionality - Eligibility<br />
Disproportionate representation of racial<br />
and ethnic groups in special education and<br />
related services that is a result of<br />
inappropriate identification (e.g.<br />
monitoring data, review of policies,<br />
practices, and procedures under 618(d),<br />
etc.).<br />
State<br />
Rate<br />
State<br />
Target<br />
88.00%<br />
96.00%<br />
State<br />
Target<br />
0.00% 0.00%<br />
LEA<br />
Rate<br />
— —<br />
88.57%<br />
Indicator 10: Disproportionality-Child with a Disability<br />
Disproportionate representation of racial<br />
and ethnic groups in specific disability<br />
categories that is a result of inappropriate<br />
identification (e.g. monitoring data, review<br />
of policies, practices, and procedures under<br />
618(d), etc.).<br />
Indicator 11: Child Find<br />
Percent of children with<br />
parental consent to evaluate<br />
who are evaluated within<br />
the State established timeline<br />
of 60 days.<br />
Overall<br />
(3-21)<br />
Early Childhood<br />
(3-5)<br />
School Age<br />
(5-21)<br />
State<br />
Rate<br />
0.00%<br />
Indicator 12: Early Childhood Transition<br />
Percent of children referred by Part C prior to<br />
age 3, who are found eligible for Part B, and<br />
who have an IEP developed and implemented<br />
by their third birthday.<br />
Note: - - denotes not applicable<br />
State<br />
Rate<br />
99.41%<br />
99.70%<br />
98.97%<br />
State<br />
Rate<br />
State<br />
Target<br />
0.00%<br />
State<br />
Target<br />
100.00%<br />
100.00%<br />
100.00%<br />
State<br />
Target<br />
Target Met by<br />
LEA (Y/N)<br />
Y<br />
Target Met by<br />
LEA (Y/N)<br />
Y<br />
LEA<br />
Rate<br />
100.00%<br />
— —<br />
100.00%<br />
LEA<br />
Rate<br />
Target Met by<br />
LEA (Y/N)<br />
N/A<br />
N<br />
Note: The target for Indicator 09 is to have zero percent<br />
(0%) of districts identified as having disproportionate<br />
representation as a result of inappropriate<br />
identification in eligibility.<br />
Note: The target for Indicator 10 is to have zero<br />
percent (0%) of districts identified as having<br />
disproportionate representation as a result of<br />
inappropriate identification in a disability<br />
category.<br />
Target Met by<br />
LEA (Y/N)<br />
N/A<br />
Y<br />
Target Met<br />
by LEA<br />
(Y/N)<br />
99.21% 100.00% - - N/A<br />
Y<br />
Note: * Indicates a zero reponse rate for the<br />
district.<br />
Page 4 of 5
LEA: 0101 - DEWITT SCHOOL <strong>DISTRICT</strong><br />
Indicator 13: Secondary Transition<br />
Percent of youth with disabilities aged 16 and<br />
up with an IEP that includes coordinated,<br />
measurable, annual IEP goals and transition<br />
services that will reasonably enable the student<br />
to meet the post-secondary goals.<br />
Indicator 14: Post-School Outcomes<br />
A. Percent of youth enrolled in higher<br />
education within one year of leaving high<br />
school.<br />
State<br />
Rate<br />
State<br />
Target<br />
Note: Data for this Indicator is from the on-site monitoring of LEAs for the given year.<br />
B. Percent of youth enrolled in higher<br />
education or competitively employed<br />
within one year of leaving high school.<br />
C. Percent of youth enrolled in higher<br />
education or in some other postsecondary<br />
education or training program; or<br />
competitively employed or in some other<br />
employment within one year of leaving<br />
high school.<br />
State<br />
Rate<br />
Indicator 20: Reported Data-Timely and Accurate*<br />
District submitted<br />
required data elements<br />
on or before due dates;<br />
made revisions within<br />
the alloted reveiw<br />
periods.<br />
Accurate and Timely<br />
Data Submission<br />
Overall (3-21)<br />
Early Childhood (3-5)<br />
School Age (5-21)<br />
State<br />
Target<br />
100.00%<br />
100.00%<br />
100.00%<br />
State<br />
Target<br />
LEA<br />
Rate<br />
LEA<br />
Rate<br />
Target Met by<br />
LEA (Y/N)<br />
Target Met<br />
by LEA<br />
(Y/N)<br />
Target Met<br />
by LEA<br />
(Y/N)<br />
*Data reviewed for timely and accurate submissions included all APSCN cycle data except for personnel<br />
Note: - - denotes not applicable<br />
96.19 100.00 — — N/A<br />
14.53<br />
State<br />
Rate<br />
49.42<br />
State<br />
Rate<br />
54.07<br />
13.00<br />
State<br />
Target<br />
49.00<br />
State<br />
Target<br />
60.00<br />
Y<br />
N/A<br />
Y<br />
— —<br />
LEA<br />
Rate<br />
— —<br />
LEA<br />
Rate<br />
— —<br />
N/A<br />
Target Met<br />
by LEA<br />
(Y/N)<br />
N/A<br />
Target Met<br />
by LEA<br />
(Y/N)<br />
N/A<br />
Page 5 of 5
LEA: 0104 - STUTTGART SCHOOL <strong>DISTRICT</strong><br />
<strong>ARKANSAS</strong> <strong>SPECIAL</strong> <strong>EDUCATION</strong><br />
<strong>DISTRICT</strong> <strong>ANNUAL</strong> PERFORMANCE REPORT<br />
2010/11 School Year<br />
Publication Date: March 2012<br />
Each State must have in place a State Performance Plan (SPP) to evaluate the State's efforts to meet the requirements and<br />
purposes of the implementation of the Individuals with Disabilities Education Act (IDEA). The SPP is a six-year plan, which<br />
describes Arkansas's performance on 20 indicators. The Office of Special Education Programs in the U. S. Department of<br />
Education requires that States report annually to the public on the performance of each local education agency (LEA) on 14 of<br />
20 indicators as compared with targets established by the State in the SPP. Arkansas will report indicators 1 through 14 and<br />
20 for each LEA serving children with disabilities (CWD). Any LEA not meeting targets on compliance indicators (0% for<br />
Indicators 4B, 09 & 10 and 100% for Indicators 11, 12, 13, and 20) are non-compliant with IDEA.<br />
There are no report changes for the 2010/11 school year profile; However, it is important to recognize that: .<br />
1. Indicator 01 (Graduation) is reported a year in arrear (2009/10 graduates) and is based on a four-year cohort. This<br />
means the rate is a measure of students who entered in ninth grade and graduate in four years. The calculation is a<br />
requirement under Title I of the Elementary and Secondary Education Act (ESEA).<br />
2. Indicator 02 (Drop out) is reported a year in arrear. This means the rate is a measure of students who dropped out in<br />
the 2009/10 school year. The Indicator 02 data are aligned with the Common Core of Data (CCD) requirements for<br />
grades 7-12.<br />
3. Indicator 04A and 4B (Suspension/Expulsion) is reported a year in arrear. This means the rate is a measure of<br />
students who had out-of-school suspensions and/or expulsions totaling more than 10 days.<br />
Percent of youth<br />
with IEPs<br />
graduating from<br />
high school with a<br />
regular diploma<br />
For a complete description of all the Indicators, please visit the special education website at<br />
http://arksped.k12.ar.us/sections/policy.html<br />
Indicator 01: Graduation Rates (2009/10 school year) Indicator 02: Dropout Rates (2009/10 school year)<br />
State<br />
Rate<br />
State<br />
Target<br />
75.76% 85.00%<br />
LEA<br />
Rate<br />
80.00%<br />
Target Met<br />
by LEA<br />
(Y/N)<br />
N<br />
Percent of<br />
youth with<br />
IEPs dropping<br />
out of high<br />
school<br />
State<br />
Rate<br />
Indicator 03: Assessment on Statewide Benchmark Exam (grades 3-8, 11)<br />
A) Adequate Yearly Progress<br />
n=40<br />
Literacy<br />
Mathematics<br />
Met Disability Subgroup "n"<br />
for Reporting Purposes (Y/N)<br />
State Target for % of Districts Meeting<br />
AYP for Disability Subgroup<br />
State<br />
Target<br />
3.06% 4.20%<br />
LEA<br />
Rate<br />
5.56%<br />
% of Districts Meeting AYP<br />
for Disability Subgroup<br />
Target Met by<br />
LEA (Y/N)<br />
N<br />
Target Met by<br />
LEA(Y/N)<br />
Overall N 17.15% 6.25%<br />
NA<br />
N<br />
N<br />
Note: For a district to qualify as having a disability subgroup it must have a minimum of 40 (n=40) students with disabilities in a school building.<br />
B) Participation<br />
Participation Rate: # of<br />
CWD Tested ÷ # of CWD<br />
Enrolled in grades tested.<br />
Participation Rate: Literacy<br />
Participation Rate: Math<br />
Note: - - denotes not applicable<br />
State<br />
Rate<br />
98.78%<br />
State<br />
Target<br />
95.00%<br />
LEA<br />
Rate<br />
96.51%<br />
Target Met<br />
by LEA (Y/N)<br />
98.61% 95.00% 97.59% Y<br />
Y<br />
C) Performance Proficiency<br />
Percent of CWD Scoring<br />
Proficient or Above<br />
Proficiency Rate: Literacy<br />
Proficiency Rate:<br />
Mathematics<br />
16.00%<br />
16.00%<br />
State<br />
Rate<br />
31.49%<br />
44.86%<br />
State<br />
Target<br />
45.22%<br />
51.14%<br />
LEA<br />
Rate<br />
23.17%<br />
37.97%<br />
NA<br />
NA<br />
Target<br />
Met by<br />
LEA (Y/N)<br />
N<br />
N<br />
Page 1 of 5
LEA: 0104 - STUTTGART SCHOOL <strong>DISTRICT</strong><br />
Indicator 04: Out-of-School Suspensions and Expulsions (2009/10 school year)<br />
A) Suspension/Expulsion<br />
Percent difference of CWD with out-of- school suspensions and<br />
expulsions totaling greater than 10 days in a school year as<br />
compared to the same data for general education students in<br />
the district.<br />
B) Suspension/Expulsion by Race and Ethnicity<br />
Percent of districts that have: (a) a significant discrepancy, by race or<br />
ethnicity, in the rate of suspensions and expulsions of greater than 10<br />
days in a school year for children with IEPs; and (b) policies,<br />
procedures or practices that contribute to the significant discrepancy<br />
and do not comply with requirements relating to the development<br />
and implementation of IEPs, the use of positive behavioral<br />
interventions and supports, and procedural safeguards.<br />
Indicator 05: School Age (5-21) Least Restrictive Environment<br />
A) In the Regular Class 80% or more of the day<br />
Percent of CWD with<br />
IEPs receiving instruction<br />
in the regular class 80%<br />
or more of the day.<br />
State<br />
Rate<br />
State<br />
Target<br />
LEA<br />
Rate<br />
B) In the Regular Class less than 40% of the day<br />
Percent of CWD with<br />
IEPs receiving instruction<br />
in the regular class less<br />
than 60% of the day.<br />
53.87% 59.77%<br />
State<br />
Rate<br />
State<br />
Target<br />
12.42% 12.51%<br />
41.14%<br />
LEA<br />
Rate<br />
17.72%<br />
C) Other Settings outside the regular class<br />
Percent of CWD with IEPs served in<br />
public or private separate schools,<br />
residential placements, or<br />
homebound/hospital placements.<br />
State<br />
Rate<br />
State<br />
Target<br />
2.80% 2.56%<br />
Target Met<br />
by LEA (Y/N)<br />
N<br />
Target Met<br />
by LEA (Y/N)<br />
N<br />
LEA<br />
Rate<br />
0.00%<br />
Target Met<br />
by LEA(Y/N)<br />
Indicator 06: Early Childhood (3-5) Least Restrictive Environment<br />
A) Regular Early Childhood Program<br />
Percent of children (aged 3 through 5) with IEPs attending a regular<br />
early childhood program and receiving the majority of special<br />
education and related services in the regular early childhood program<br />
Allowable<br />
Difference<br />
LEA: 0104 - STUTTGART SCHOOL <strong>DISTRICT</strong><br />
Indicator 07: Preschool (3-5) Outcomes<br />
a) Percent of preschool CWD<br />
children who did not<br />
improve functioning.<br />
b) Percent of preschool CWD<br />
who improved but whose<br />
functioning remained below<br />
same age peers.<br />
c) Percent of preschool CWD<br />
who improved at a level<br />
nearer to same aged peers.<br />
d) Percent of preschool CWD<br />
who improved functioning to<br />
reach a level comparable to<br />
same age peers.<br />
e) Percent of preschool CWD<br />
children who maintain<br />
functioning at a level<br />
comparable to same aged<br />
peers.<br />
Summary<br />
Statements<br />
1) Of those preschool<br />
children who entered<br />
the preschool program<br />
below age expectations<br />
in each Outcome, the<br />
percent who<br />
substantially increased<br />
their rate of growth by<br />
the time they turned 6<br />
years of age or exited<br />
the program.<br />
2) The percent of<br />
preschool children who<br />
were functioning<br />
within age expectations<br />
in each Outcome by the<br />
time they turned 6<br />
years of age or exited<br />
A) Positive Social -Emotional<br />
Skills*<br />
State<br />
Rate<br />
A) Positive Social -<br />
Emotional Skills<br />
(Including social<br />
relationships)<br />
State<br />
Rate<br />
2.14%<br />
5.31%<br />
25.97%<br />
38.22%<br />
28.36%<br />
State<br />
Target<br />
LEA<br />
Rate<br />
LEA<br />
Rate<br />
— —<br />
— —<br />
— —<br />
100.00%<br />
— —<br />
Target<br />
Met by<br />
LEA(Y/N)<br />
B) Acquisition and Use of<br />
Knowledge and Skills<br />
(Including early language/<br />
communication and early literacy)<br />
B) Acquisition and Use of<br />
Knowledge and Skills **<br />
State<br />
Rate<br />
1.75%<br />
6.59%<br />
34.23%<br />
43.51%<br />
13.92%<br />
State<br />
Target<br />
LEA<br />
Rate<br />
Target<br />
Met by<br />
LEA(Y/N)<br />
C) Use of Appropriate Behaviors<br />
to Meet Their Needs<br />
State<br />
Rate<br />
State<br />
Target<br />
LEA<br />
Rate<br />
Target<br />
Met by<br />
LEA(Y/N)<br />
89.61% 90.50% 100.00% Y 90.31% 90.50% 100.00% Y 90.82% 92.50% 100.00% Y<br />
66.58% 69.50% 100.00% Y 57.43% 60.50% 100.00% Y 76.69% 78.50% 100.00% Y<br />
NOTE: * Including social relationships ** Including early language/ communication and early literacy<br />
Note: - - denotes not applicable<br />
State<br />
Rate<br />
LEA<br />
Rate<br />
— —<br />
— —<br />
— —<br />
100.00%<br />
— —<br />
C) Use of<br />
Appropriate<br />
Behaviors to<br />
Meet Their Needs<br />
State<br />
Rate<br />
4.51%<br />
17.34%<br />
41.72%<br />
34.97%<br />
LEA<br />
Rate<br />
1.46% — —<br />
— —<br />
— —<br />
33.33%<br />
66.67%<br />
Page 3 of 5
LEA: 0104 - STUTTGART SCHOOL <strong>DISTRICT</strong><br />
Indicator 08: Parent Involvement<br />
Percent of surveyed<br />
parents who reported<br />
school facilitated parent<br />
involvement as a means<br />
of improving services<br />
and results for children<br />
with disabilities.<br />
Early Childhood<br />
(3-5)<br />
School Age<br />
(5-21)<br />
State<br />
Rate<br />
90.47%<br />
95.05%<br />
Indicator 09: Disproportionality - Eligibility<br />
Disproportionate representation of racial<br />
and ethnic groups in special education and<br />
related services that is a result of<br />
inappropriate identification (e.g.<br />
monitoring data, review of policies,<br />
practices, and procedures under 618(d),<br />
etc.).<br />
State<br />
Rate<br />
State<br />
Target<br />
88.00%<br />
96.00%<br />
State<br />
Target<br />
0.00% 0.00%<br />
LEA<br />
Rate<br />
0.00%<br />
100.00%<br />
Indicator 10: Disproportionality-Child with a Disability<br />
Disproportionate representation of racial<br />
and ethnic groups in specific disability<br />
categories that is a result of inappropriate<br />
identification (e.g. monitoring data, review<br />
of policies, practices, and procedures under<br />
618(d), etc.).<br />
Indicator 11: Child Find<br />
Percent of children with<br />
parental consent to evaluate<br />
who are evaluated within<br />
the State established timeline<br />
of 60 days.<br />
Overall<br />
(3-21)<br />
Early Childhood<br />
(3-5)<br />
School Age<br />
(5-21)<br />
State<br />
Rate<br />
0.00%<br />
Indicator 12: Early Childhood Transition<br />
Percent of children referred by Part C prior to<br />
age 3, who are found eligible for Part B, and<br />
who have an IEP developed and implemented<br />
by their third birthday.<br />
Note: - - denotes not applicable<br />
State<br />
Rate<br />
99.41%<br />
99.70%<br />
98.97%<br />
State<br />
Rate<br />
State<br />
Target<br />
0.00%<br />
State<br />
Target<br />
100.00%<br />
100.00%<br />
100.00%<br />
State<br />
Target<br />
Target Met by<br />
LEA (Y/N)<br />
Y<br />
Target Met by<br />
LEA (Y/N)<br />
Y<br />
LEA<br />
Rate<br />
100.00%<br />
100.00%<br />
100.00%<br />
LEA<br />
Rate<br />
Target Met by<br />
LEA (Y/N)<br />
N<br />
Y<br />
Note: The target for Indicator 09 is to have zero percent<br />
(0%) of districts identified as having disproportionate<br />
representation as a result of inappropriate<br />
identification in eligibility.<br />
Note: The target for Indicator 10 is to have zero<br />
percent (0%) of districts identified as having<br />
disproportionate representation as a result of<br />
inappropriate identification in a disability<br />
category.<br />
Target Met by<br />
LEA (Y/N)<br />
Y<br />
Y<br />
Target Met<br />
by LEA<br />
(Y/N)<br />
99.21% 100.00% - - N/A<br />
Y<br />
Note: * Indicates a zero reponse rate for the<br />
district.<br />
Page 4 of 5
LEA: 0104 - STUTTGART SCHOOL <strong>DISTRICT</strong><br />
Indicator 13: Secondary Transition<br />
Percent of youth with disabilities aged 16 and<br />
up with an IEP that includes coordinated,<br />
measurable, annual IEP goals and transition<br />
services that will reasonably enable the student<br />
to meet the post-secondary goals.<br />
Indicator 14: Post-School Outcomes<br />
A. Percent of youth enrolled in higher<br />
education within one year of leaving high<br />
school.<br />
State<br />
Rate<br />
State<br />
Target<br />
Note: Data for this Indicator is from the on-site monitoring of LEAs for the given year.<br />
B. Percent of youth enrolled in higher<br />
education or competitively employed<br />
within one year of leaving high school.<br />
C. Percent of youth enrolled in higher<br />
education or in some other postsecondary<br />
education or training program; or<br />
competitively employed or in some other<br />
employment within one year of leaving<br />
high school.<br />
State<br />
Rate<br />
Indicator 20: Reported Data-Timely and Accurate*<br />
District submitted<br />
required data elements<br />
on or before due dates;<br />
made revisions within<br />
the alloted reveiw<br />
periods.<br />
Accurate and Timely<br />
Data Submission<br />
Overall (3-21)<br />
Early Childhood (3-5)<br />
School Age (5-21)<br />
State<br />
Target<br />
100.00%<br />
100.00%<br />
100.00%<br />
State<br />
Target<br />
LEA<br />
Rate<br />
LEA<br />
Rate<br />
Target Met by<br />
LEA (Y/N)<br />
Target Met<br />
by LEA<br />
(Y/N)<br />
Target Met<br />
by LEA<br />
(Y/N)<br />
*Data reviewed for timely and accurate submissions included all APSCN cycle data except for personnel<br />
Note: - - denotes not applicable<br />
96.19 100.00 — — N/A<br />
14.53<br />
State<br />
Rate<br />
49.42<br />
State<br />
Rate<br />
54.07<br />
13.00<br />
State<br />
Target<br />
49.00<br />
State<br />
Target<br />
60.00<br />
Y<br />
Y<br />
Y<br />
0.00%<br />
LEA<br />
Rate<br />
57.14%<br />
LEA<br />
Rate<br />
57.14%<br />
N<br />
Target Met<br />
by LEA<br />
(Y/N)<br />
Y<br />
Target Met<br />
by LEA<br />
(Y/N)<br />
N<br />
Page 5 of 5
LEA: 0201 - CROSSETT SCHOOL <strong>DISTRICT</strong><br />
<strong>ARKANSAS</strong> <strong>SPECIAL</strong> <strong>EDUCATION</strong><br />
<strong>DISTRICT</strong> <strong>ANNUAL</strong> PERFORMANCE REPORT<br />
2010/11 School Year<br />
Publication Date: March 2012<br />
Each State must have in place a State Performance Plan (SPP) to evaluate the State's efforts to meet the requirements and<br />
purposes of the implementation of the Individuals with Disabilities Education Act (IDEA). The SPP is a six-year plan, which<br />
describes Arkansas's performance on 20 indicators. The Office of Special Education Programs in the U. S. Department of<br />
Education requires that States report annually to the public on the performance of each local education agency (LEA) on 14 of<br />
20 indicators as compared with targets established by the State in the SPP. Arkansas will report indicators 1 through 14 and<br />
20 for each LEA serving children with disabilities (CWD). Any LEA not meeting targets on compliance indicators (0% for<br />
Indicators 4B, 09 & 10 and 100% for Indicators 11, 12, 13, and 20) are non-compliant with IDEA.<br />
There are no report changes for the 2010/11 school year profile; However, it is important to recognize that: .<br />
1. Indicator 01 (Graduation) is reported a year in arrear (2009/10 graduates) and is based on a four-year cohort. This<br />
means the rate is a measure of students who entered in ninth grade and graduate in four years. The calculation is a<br />
requirement under Title I of the Elementary and Secondary Education Act (ESEA).<br />
2. Indicator 02 (Drop out) is reported a year in arrear. This means the rate is a measure of students who dropped out in<br />
the 2009/10 school year. The Indicator 02 data are aligned with the Common Core of Data (CCD) requirements for<br />
grades 7-12.<br />
3. Indicator 04A and 4B (Suspension/Expulsion) is reported a year in arrear. This means the rate is a measure of<br />
students who had out-of-school suspensions and/or expulsions totaling more than 10 days.<br />
Percent of youth<br />
with IEPs<br />
graduating from<br />
high school with a<br />
regular diploma<br />
For a complete description of all the Indicators, please visit the special education website at<br />
http://arksped.k12.ar.us/sections/policy.html<br />
Indicator 01: Graduation Rates (2009/10 school year) Indicator 02: Dropout Rates (2009/10 school year)<br />
State<br />
Rate<br />
State<br />
Target<br />
75.76% 85.00%<br />
LEA<br />
Rate<br />
69.23%<br />
Target Met<br />
by LEA<br />
(Y/N)<br />
N<br />
Percent of<br />
youth with<br />
IEPs dropping<br />
out of high<br />
school<br />
State<br />
Rate<br />
Indicator 03: Assessment on Statewide Benchmark Exam (grades 3-8, 11)<br />
A) Adequate Yearly Progress<br />
n=40<br />
Literacy<br />
Mathematics<br />
Met Disability Subgroup "n"<br />
for Reporting Purposes (Y/N)<br />
State Target for % of Districts Meeting<br />
AYP for Disability Subgroup<br />
State<br />
Target<br />
3.06% 4.20%<br />
LEA<br />
Rate<br />
2.50%<br />
% of Districts Meeting AYP<br />
for Disability Subgroup<br />
Target Met by<br />
LEA (Y/N)<br />
Y<br />
Target Met by<br />
LEA(Y/N)<br />
Overall N 17.15% 6.25%<br />
NA<br />
N<br />
N<br />
Note: For a district to qualify as having a disability subgroup it must have a minimum of 40 (n=40) students with disabilities in a school building.<br />
B) Participation<br />
Participation Rate: # of<br />
CWD Tested ÷ # of CWD<br />
Enrolled in grades tested.<br />
Participation Rate: Literacy<br />
Participation Rate: Math<br />
Note: - - denotes not applicable<br />
State<br />
Rate<br />
98.78%<br />
State<br />
Target<br />
95.00%<br />
LEA<br />
Rate<br />
100.00%<br />
Target Met<br />
by LEA (Y/N)<br />
98.61% 95.00% 98.97% Y<br />
Y<br />
C) Performance Proficiency<br />
Percent of CWD Scoring<br />
Proficient or Above<br />
Proficiency Rate: Literacy<br />
Proficiency Rate:<br />
Mathematics<br />
16.00%<br />
16.00%<br />
State<br />
Rate<br />
31.49%<br />
44.86%<br />
State<br />
Target<br />
45.22%<br />
51.14%<br />
LEA<br />
Rate<br />
16.25%<br />
25.53%<br />
NA<br />
NA<br />
Target<br />
Met by<br />
LEA (Y/N)<br />
N<br />
N<br />
Page 1 of 5
LEA: 0201 - CROSSETT SCHOOL <strong>DISTRICT</strong><br />
Indicator 04: Out-of-School Suspensions and Expulsions (2009/10 school year)<br />
A) Suspension/Expulsion<br />
Percent difference of CWD with out-of- school suspensions and<br />
expulsions totaling greater than 10 days in a school year as<br />
compared to the same data for general education students in<br />
the district.<br />
B) Suspension/Expulsion by Race and Ethnicity<br />
Percent of districts that have: (a) a significant discrepancy, by race or<br />
ethnicity, in the rate of suspensions and expulsions of greater than 10<br />
days in a school year for children with IEPs; and (b) policies,<br />
procedures or practices that contribute to the significant discrepancy<br />
and do not comply with requirements relating to the development<br />
and implementation of IEPs, the use of positive behavioral<br />
interventions and supports, and procedural safeguards.<br />
Indicator 05: School Age (5-21) Least Restrictive Environment<br />
A) In the Regular Class 80% or more of the day<br />
Percent of CWD with<br />
IEPs receiving instruction<br />
in the regular class 80%<br />
or more of the day.<br />
State<br />
Rate<br />
State<br />
Target<br />
LEA<br />
Rate<br />
B) In the Regular Class less than 40% of the day<br />
Percent of CWD with<br />
IEPs receiving instruction<br />
in the regular class less<br />
than 60% of the day.<br />
53.87% 59.77%<br />
State<br />
Rate<br />
State<br />
Target<br />
12.42% 12.51%<br />
69.78%<br />
LEA<br />
Rate<br />
2.75%<br />
C) Other Settings outside the regular class<br />
Percent of CWD with IEPs served in<br />
public or private separate schools,<br />
residential placements, or<br />
homebound/hospital placements.<br />
State<br />
Rate<br />
State<br />
Target<br />
2.80% 2.56%<br />
Target Met<br />
by LEA (Y/N)<br />
Y<br />
Target Met<br />
by LEA (Y/N)<br />
Y<br />
LEA<br />
Rate<br />
0.00%<br />
Target Met<br />
by LEA(Y/N)<br />
Indicator 06: Early Childhood (3-5) Least Restrictive Environment<br />
A) Regular Early Childhood Program<br />
Percent of children (aged 3 through 5) with IEPs attending a regular<br />
early childhood program and receiving the majority of special<br />
education and related services in the regular early childhood program<br />
Allowable<br />
Difference<br />
LEA: 0201 - CROSSETT SCHOOL <strong>DISTRICT</strong><br />
Indicator 07: Preschool (3-5) Outcomes<br />
a) Percent of preschool CWD<br />
children who did not<br />
improve functioning.<br />
b) Percent of preschool CWD<br />
who improved but whose<br />
functioning remained below<br />
same age peers.<br />
c) Percent of preschool CWD<br />
who improved at a level<br />
nearer to same aged peers.<br />
d) Percent of preschool CWD<br />
who improved functioning to<br />
reach a level comparable to<br />
same age peers.<br />
e) Percent of preschool CWD<br />
children who maintain<br />
functioning at a level<br />
comparable to same aged<br />
peers.<br />
Summary<br />
Statements<br />
1) Of those preschool<br />
children who entered<br />
the preschool program<br />
below age expectations<br />
in each Outcome, the<br />
percent who<br />
substantially increased<br />
their rate of growth by<br />
the time they turned 6<br />
years of age or exited<br />
the program.<br />
2) The percent of<br />
preschool children who<br />
were functioning<br />
within age expectations<br />
in each Outcome by the<br />
time they turned 6<br />
years of age or exited<br />
A) Positive Social -Emotional<br />
Skills*<br />
State<br />
Rate<br />
A) Positive Social -<br />
Emotional Skills<br />
(Including social<br />
relationships)<br />
State<br />
Rate<br />
2.14%<br />
5.31%<br />
25.97%<br />
38.22%<br />
28.36%<br />
State<br />
Target<br />
LEA<br />
Rate<br />
LEA<br />
Rate<br />
— —<br />
— —<br />
— —<br />
— —<br />
— —<br />
Target<br />
Met by<br />
LEA(Y/N)<br />
B) Acquisition and Use of<br />
Knowledge and Skills<br />
(Including early language/<br />
communication and early literacy)<br />
B) Acquisition and Use of<br />
Knowledge and Skills **<br />
State<br />
Rate<br />
1.75%<br />
6.59%<br />
34.23%<br />
43.51%<br />
13.92%<br />
State<br />
Target<br />
LEA<br />
Rate<br />
Target<br />
Met by<br />
LEA(Y/N)<br />
C) Use of Appropriate Behaviors<br />
to Meet Their Needs<br />
State<br />
Rate<br />
State<br />
Target<br />
LEA<br />
Rate<br />
Target<br />
Met by<br />
LEA(Y/N)<br />
89.61% 90.50% — — N/A 90.31% 90.50% — — N/A 90.82% 92.50% — — N/A<br />
66.58% 69.50% — — N/A 57.43% 60.50% — — N/A 76.69% 78.50% — — N/A<br />
NOTE: * Including social relationships ** Including early language/ communication and early literacy<br />
Note: - - denotes not applicable<br />
State<br />
Rate<br />
LEA<br />
Rate<br />
— —<br />
— —<br />
— —<br />
— —<br />
— —<br />
C) Use of<br />
Appropriate<br />
Behaviors to<br />
Meet Their Needs<br />
State<br />
Rate<br />
4.51%<br />
17.34%<br />
41.72%<br />
34.97%<br />
LEA<br />
Rate<br />
1.46% — —<br />
— —<br />
— —<br />
— —<br />
— —<br />
Page 3 of 5
LEA: 0201 - CROSSETT SCHOOL <strong>DISTRICT</strong><br />
Indicator 08: Parent Involvement<br />
Percent of surveyed<br />
parents who reported<br />
school facilitated parent<br />
involvement as a means<br />
of improving services<br />
and results for children<br />
with disabilities.<br />
Early Childhood<br />
(3-5)<br />
School Age<br />
(5-21)<br />
State<br />
Rate<br />
90.47%<br />
95.05%<br />
Indicator 09: Disproportionality - Eligibility<br />
Disproportionate representation of racial<br />
and ethnic groups in special education and<br />
related services that is a result of<br />
inappropriate identification (e.g.<br />
monitoring data, review of policies,<br />
practices, and procedures under 618(d),<br />
etc.).<br />
State<br />
Rate<br />
State<br />
Target<br />
88.00%<br />
96.00%<br />
State<br />
Target<br />
0.00% 0.00%<br />
LEA<br />
Rate<br />
— —<br />
75.76%<br />
Indicator 10: Disproportionality-Child with a Disability<br />
Disproportionate representation of racial<br />
and ethnic groups in specific disability<br />
categories that is a result of inappropriate<br />
identification (e.g. monitoring data, review<br />
of policies, practices, and procedures under<br />
618(d), etc.).<br />
Indicator 11: Child Find<br />
Percent of children with<br />
parental consent to evaluate<br />
who are evaluated within<br />
the State established timeline<br />
of 60 days.<br />
Overall<br />
(3-21)<br />
Early Childhood<br />
(3-5)<br />
School Age<br />
(5-21)<br />
State<br />
Rate<br />
0.00%<br />
Indicator 12: Early Childhood Transition<br />
Percent of children referred by Part C prior to<br />
age 3, who are found eligible for Part B, and<br />
who have an IEP developed and implemented<br />
by their third birthday.<br />
Note: - - denotes not applicable<br />
State<br />
Rate<br />
99.41%<br />
99.70%<br />
98.97%<br />
State<br />
Rate<br />
State<br />
Target<br />
0.00%<br />
State<br />
Target<br />
100.00%<br />
100.00%<br />
100.00%<br />
State<br />
Target<br />
Target Met by<br />
LEA (Y/N)<br />
Y<br />
Target Met by<br />
LEA (Y/N)<br />
Y<br />
LEA<br />
Rate<br />
100.00%<br />
— —<br />
100.00%<br />
LEA<br />
Rate<br />
Target Met by<br />
LEA (Y/N)<br />
N/A<br />
N<br />
Note: The target for Indicator 09 is to have zero percent<br />
(0%) of districts identified as having disproportionate<br />
representation as a result of inappropriate<br />
identification in eligibility.<br />
Note: The target for Indicator 10 is to have zero<br />
percent (0%) of districts identified as having<br />
disproportionate representation as a result of<br />
inappropriate identification in a disability<br />
category.<br />
Target Met by<br />
LEA (Y/N)<br />
N/A<br />
Y<br />
Target Met<br />
by LEA<br />
(Y/N)<br />
99.21% 100.00% - - N/A<br />
Y<br />
Note: * Indicates a zero reponse rate for the<br />
district.<br />
Page 4 of 5
LEA: 0201 - CROSSETT SCHOOL <strong>DISTRICT</strong><br />
Indicator 13: Secondary Transition<br />
Percent of youth with disabilities aged 16 and<br />
up with an IEP that includes coordinated,<br />
measurable, annual IEP goals and transition<br />
services that will reasonably enable the student<br />
to meet the post-secondary goals.<br />
Indicator 14: Post-School Outcomes<br />
A. Percent of youth enrolled in higher<br />
education within one year of leaving high<br />
school.<br />
State<br />
Rate<br />
State<br />
Target<br />
Note: Data for this Indicator is from the on-site monitoring of LEAs for the given year.<br />
B. Percent of youth enrolled in higher<br />
education or competitively employed<br />
within one year of leaving high school.<br />
C. Percent of youth enrolled in higher<br />
education or in some other postsecondary<br />
education or training program; or<br />
competitively employed or in some other<br />
employment within one year of leaving<br />
high school.<br />
State<br />
Rate<br />
Indicator 20: Reported Data-Timely and Accurate*<br />
District submitted<br />
required data elements<br />
on or before due dates;<br />
made revisions within<br />
the alloted reveiw<br />
periods.<br />
Accurate and Timely<br />
Data Submission<br />
Overall (3-21)<br />
Early Childhood (3-5)<br />
School Age (5-21)<br />
State<br />
Target<br />
100.00%<br />
100.00%<br />
100.00%<br />
State<br />
Target<br />
LEA<br />
Rate<br />
LEA<br />
Rate<br />
Target Met by<br />
LEA (Y/N)<br />
Target Met<br />
by LEA<br />
(Y/N)<br />
Target Met<br />
by LEA<br />
(Y/N)<br />
*Data reviewed for timely and accurate submissions included all APSCN cycle data except for personnel<br />
Note: - - denotes not applicable<br />
96.19 100.00 — — N/A<br />
14.53<br />
State<br />
Rate<br />
49.42<br />
State<br />
Rate<br />
54.07<br />
13.00<br />
State<br />
Target<br />
49.00<br />
State<br />
Target<br />
60.00<br />
Y<br />
N/A<br />
Y<br />
— —<br />
LEA<br />
Rate<br />
— —<br />
LEA<br />
Rate<br />
— —<br />
N/A<br />
Target Met<br />
by LEA<br />
(Y/N)<br />
N/A<br />
Target Met<br />
by LEA<br />
(Y/N)<br />
N/A<br />
Page 5 of 5
LEA: 0203 - HAMBURG SCHOOL <strong>DISTRICT</strong><br />
<strong>ARKANSAS</strong> <strong>SPECIAL</strong> <strong>EDUCATION</strong><br />
<strong>DISTRICT</strong> <strong>ANNUAL</strong> PERFORMANCE REPORT<br />
2010/11 School Year<br />
Publication Date: March 2012<br />
Each State must have in place a State Performance Plan (SPP) to evaluate the State's efforts to meet the requirements and<br />
purposes of the implementation of the Individuals with Disabilities Education Act (IDEA). The SPP is a six-year plan, which<br />
describes Arkansas's performance on 20 indicators. The Office of Special Education Programs in the U. S. Department of<br />
Education requires that States report annually to the public on the performance of each local education agency (LEA) on 14 of<br />
20 indicators as compared with targets established by the State in the SPP. Arkansas will report indicators 1 through 14 and<br />
20 for each LEA serving children with disabilities (CWD). Any LEA not meeting targets on compliance indicators (0% for<br />
Indicators 4B, 09 & 10 and 100% for Indicators 11, 12, 13, and 20) are non-compliant with IDEA.<br />
There are no report changes for the 2010/11 school year profile; However, it is important to recognize that: .<br />
1. Indicator 01 (Graduation) is reported a year in arrear (2009/10 graduates) and is based on a four-year cohort. This<br />
means the rate is a measure of students who entered in ninth grade and graduate in four years. The calculation is a<br />
requirement under Title I of the Elementary and Secondary Education Act (ESEA).<br />
2. Indicator 02 (Drop out) is reported a year in arrear. This means the rate is a measure of students who dropped out in<br />
the 2009/10 school year. The Indicator 02 data are aligned with the Common Core of Data (CCD) requirements for<br />
grades 7-12.<br />
3. Indicator 04A and 4B (Suspension/Expulsion) is reported a year in arrear. This means the rate is a measure of<br />
students who had out-of-school suspensions and/or expulsions totaling more than 10 days.<br />
Percent of youth<br />
with IEPs<br />
graduating from<br />
high school with a<br />
regular diploma<br />
For a complete description of all the Indicators, please visit the special education website at<br />
http://arksped.k12.ar.us/sections/policy.html<br />
Indicator 01: Graduation Rates (2009/10 school year) Indicator 02: Dropout Rates (2009/10 school year)<br />
State<br />
Rate<br />
State<br />
Target<br />
75.76% 85.00%<br />
LEA<br />
Rate<br />
61.54%<br />
Target Met<br />
by LEA<br />
(Y/N)<br />
N<br />
Percent of<br />
youth with<br />
IEPs dropping<br />
out of high<br />
school<br />
State<br />
Rate<br />
Indicator 03: Assessment on Statewide Benchmark Exam (grades 3-8, 11)<br />
A) Adequate Yearly Progress<br />
n=40<br />
Literacy<br />
Mathematics<br />
Met Disability Subgroup "n"<br />
for Reporting Purposes (Y/N)<br />
State Target for % of Districts Meeting<br />
AYP for Disability Subgroup<br />
State<br />
Target<br />
3.06% 4.20%<br />
LEA<br />
Rate<br />
2.74%<br />
% of Districts Meeting AYP<br />
for Disability Subgroup<br />
Target Met by<br />
LEA (Y/N)<br />
Y<br />
Target Met by<br />
LEA(Y/N)<br />
Overall N 17.15% 6.25%<br />
NA<br />
N<br />
N<br />
Note: For a district to qualify as having a disability subgroup it must have a minimum of 40 (n=40) students with disabilities in a school building.<br />
B) Participation<br />
Participation Rate: # of<br />
CWD Tested ÷ # of CWD<br />
Enrolled in grades tested.<br />
Participation Rate: Literacy<br />
Participation Rate: Math<br />
Note: - - denotes not applicable<br />
State<br />
Rate<br />
98.78%<br />
State<br />
Target<br />
95.00%<br />
LEA<br />
Rate<br />
96.25%<br />
Target Met<br />
by LEA (Y/N)<br />
98.61% 95.00% 94.87% N<br />
Y<br />
C) Performance Proficiency<br />
Percent of CWD Scoring<br />
Proficient or Above<br />
Proficiency Rate: Literacy<br />
Proficiency Rate:<br />
Mathematics<br />
16.00%<br />
16.00%<br />
State<br />
Rate<br />
31.49%<br />
44.86%<br />
State<br />
Target<br />
45.22%<br />
51.14%<br />
LEA<br />
Rate<br />
21.62%<br />
40.85%<br />
NA<br />
NA<br />
Target<br />
Met by<br />
LEA (Y/N)<br />
N<br />
N<br />
Page 1 of 5
LEA: 0203 - HAMBURG SCHOOL <strong>DISTRICT</strong><br />
Indicator 04: Out-of-School Suspensions and Expulsions (2009/10 school year)<br />
A) Suspension/Expulsion<br />
Percent difference of CWD with out-of- school suspensions and<br />
expulsions totaling greater than 10 days in a school year as<br />
compared to the same data for general education students in<br />
the district.<br />
B) Suspension/Expulsion by Race and Ethnicity<br />
Percent of districts that have: (a) a significant discrepancy, by race or<br />
ethnicity, in the rate of suspensions and expulsions of greater than 10<br />
days in a school year for children with IEPs; and (b) policies,<br />
procedures or practices that contribute to the significant discrepancy<br />
and do not comply with requirements relating to the development<br />
and implementation of IEPs, the use of positive behavioral<br />
interventions and supports, and procedural safeguards.<br />
Indicator 05: School Age (5-21) Least Restrictive Environment<br />
A) In the Regular Class 80% or more of the day<br />
Percent of CWD with<br />
IEPs receiving instruction<br />
in the regular class 80%<br />
or more of the day.<br />
State<br />
Rate<br />
State<br />
Target<br />
LEA<br />
Rate<br />
B) In the Regular Class less than 40% of the day<br />
Percent of CWD with<br />
IEPs receiving instruction<br />
in the regular class less<br />
than 60% of the day.<br />
53.87% 59.77%<br />
State<br />
Rate<br />
State<br />
Target<br />
12.42% 12.51%<br />
85.89%<br />
LEA<br />
Rate<br />
0.00%<br />
C) Other Settings outside the regular class<br />
Percent of CWD with IEPs served in<br />
public or private separate schools,<br />
residential placements, or<br />
homebound/hospital placements.<br />
State<br />
Rate<br />
State<br />
Target<br />
2.80% 2.56%<br />
Target Met<br />
by LEA (Y/N)<br />
Y<br />
Target Met<br />
by LEA (Y/N)<br />
Y<br />
LEA<br />
Rate<br />
3.68%<br />
Target Met<br />
by LEA(Y/N)<br />
Indicator 06: Early Childhood (3-5) Least Restrictive Environment<br />
A) Regular Early Childhood Program<br />
Percent of children (aged 3 through 5) with IEPs attending a regular<br />
early childhood program and receiving the majority of special<br />
education and related services in the regular early childhood program<br />
Allowable<br />
Difference<br />
LEA: 0203 - HAMBURG SCHOOL <strong>DISTRICT</strong><br />
Indicator 07: Preschool (3-5) Outcomes<br />
a) Percent of preschool CWD<br />
children who did not<br />
improve functioning.<br />
b) Percent of preschool CWD<br />
who improved but whose<br />
functioning remained below<br />
same age peers.<br />
c) Percent of preschool CWD<br />
who improved at a level<br />
nearer to same aged peers.<br />
d) Percent of preschool CWD<br />
who improved functioning to<br />
reach a level comparable to<br />
same age peers.<br />
e) Percent of preschool CWD<br />
children who maintain<br />
functioning at a level<br />
comparable to same aged<br />
peers.<br />
Summary<br />
Statements<br />
1) Of those preschool<br />
children who entered<br />
the preschool program<br />
below age expectations<br />
in each Outcome, the<br />
percent who<br />
substantially increased<br />
their rate of growth by<br />
the time they turned 6<br />
years of age or exited<br />
the program.<br />
2) The percent of<br />
preschool children who<br />
were functioning<br />
within age expectations<br />
in each Outcome by the<br />
time they turned 6<br />
years of age or exited<br />
A) Positive Social -Emotional<br />
Skills*<br />
State<br />
Rate<br />
A) Positive Social -<br />
Emotional Skills<br />
(Including social<br />
relationships)<br />
State<br />
Rate<br />
2.14%<br />
5.31%<br />
25.97%<br />
38.22%<br />
28.36%<br />
State<br />
Target<br />
LEA<br />
Rate<br />
LEA<br />
Rate<br />
— —<br />
— —<br />
— —<br />
— —<br />
— —<br />
Target<br />
Met by<br />
LEA(Y/N)<br />
B) Acquisition and Use of<br />
Knowledge and Skills<br />
(Including early language/<br />
communication and early literacy)<br />
B) Acquisition and Use of<br />
Knowledge and Skills **<br />
State<br />
Rate<br />
1.75%<br />
6.59%<br />
34.23%<br />
43.51%<br />
13.92%<br />
State<br />
Target<br />
LEA<br />
Rate<br />
Target<br />
Met by<br />
LEA(Y/N)<br />
C) Use of Appropriate Behaviors<br />
to Meet Their Needs<br />
State<br />
Rate<br />
State<br />
Target<br />
LEA<br />
Rate<br />
Target<br />
Met by<br />
LEA(Y/N)<br />
89.61% 90.50% — — N/A 90.31% 90.50% — — N/A 90.82% 92.50% — — N/A<br />
66.58% 69.50% — — N/A 57.43% 60.50% — — N/A 76.69% 78.50% — — N/A<br />
NOTE: * Including social relationships ** Including early language/ communication and early literacy<br />
Note: - - denotes not applicable<br />
State<br />
Rate<br />
LEA<br />
Rate<br />
— —<br />
— —<br />
— —<br />
— —<br />
— —<br />
C) Use of<br />
Appropriate<br />
Behaviors to<br />
Meet Their Needs<br />
State<br />
Rate<br />
4.51%<br />
17.34%<br />
41.72%<br />
34.97%<br />
LEA<br />
Rate<br />
1.46% — —<br />
— —<br />
— —<br />
— —<br />
— —<br />
Page 3 of 5
LEA: 0203 - HAMBURG SCHOOL <strong>DISTRICT</strong><br />
Indicator 08: Parent Involvement<br />
Percent of surveyed<br />
parents who reported<br />
school facilitated parent<br />
involvement as a means<br />
of improving services<br />
and results for children<br />
with disabilities.<br />
Early Childhood<br />
(3-5)<br />
School Age<br />
(5-21)<br />
State<br />
Rate<br />
90.47%<br />
95.05%<br />
Indicator 09: Disproportionality - Eligibility<br />
Disproportionate representation of racial<br />
and ethnic groups in special education and<br />
related services that is a result of<br />
inappropriate identification (e.g.<br />
monitoring data, review of policies,<br />
practices, and procedures under 618(d),<br />
etc.).<br />
State<br />
Rate<br />
State<br />
Target<br />
88.00%<br />
96.00%<br />
State<br />
Target<br />
0.00% 0.00%<br />
LEA<br />
Rate<br />
— —<br />
83.87%<br />
Indicator 10: Disproportionality-Child with a Disability<br />
Disproportionate representation of racial<br />
and ethnic groups in specific disability<br />
categories that is a result of inappropriate<br />
identification (e.g. monitoring data, review<br />
of policies, practices, and procedures under<br />
618(d), etc.).<br />
Indicator 11: Child Find<br />
Percent of children with<br />
parental consent to evaluate<br />
who are evaluated within<br />
the State established timeline<br />
of 60 days.<br />
Overall<br />
(3-21)<br />
Early Childhood<br />
(3-5)<br />
School Age<br />
(5-21)<br />
State<br />
Rate<br />
0.00%<br />
Indicator 12: Early Childhood Transition<br />
Percent of children referred by Part C prior to<br />
age 3, who are found eligible for Part B, and<br />
who have an IEP developed and implemented<br />
by their third birthday.<br />
Note: - - denotes not applicable<br />
State<br />
Rate<br />
99.41%<br />
99.70%<br />
98.97%<br />
State<br />
Rate<br />
State<br />
Target<br />
0.00%<br />
State<br />
Target<br />
100.00%<br />
100.00%<br />
100.00%<br />
State<br />
Target<br />
Target Met by<br />
LEA (Y/N)<br />
Y<br />
Target Met by<br />
LEA (Y/N)<br />
Y<br />
LEA<br />
Rate<br />
100.00%<br />
— —<br />
100.00%<br />
LEA<br />
Rate<br />
Target Met by<br />
LEA (Y/N)<br />
N/A<br />
N<br />
Note: The target for Indicator 09 is to have zero percent<br />
(0%) of districts identified as having disproportionate<br />
representation as a result of inappropriate<br />
identification in eligibility.<br />
Note: The target for Indicator 10 is to have zero<br />
percent (0%) of districts identified as having<br />
disproportionate representation as a result of<br />
inappropriate identification in a disability<br />
category.<br />
Target Met by<br />
LEA (Y/N)<br />
N/A<br />
Y<br />
Target Met<br />
by LEA<br />
(Y/N)<br />
99.21% 100.00% - - N/A<br />
Y<br />
Note: * Indicates a zero reponse rate for the<br />
district.<br />
Page 4 of 5
LEA: 0203 - HAMBURG SCHOOL <strong>DISTRICT</strong><br />
Indicator 13: Secondary Transition<br />
Percent of youth with disabilities aged 16 and<br />
up with an IEP that includes coordinated,<br />
measurable, annual IEP goals and transition<br />
services that will reasonably enable the student<br />
to meet the post-secondary goals.<br />
Indicator 14: Post-School Outcomes<br />
A. Percent of youth enrolled in higher<br />
education within one year of leaving high<br />
school.<br />
State<br />
Rate<br />
State<br />
Target<br />
Note: Data for this Indicator is from the on-site monitoring of LEAs for the given year.<br />
B. Percent of youth enrolled in higher<br />
education or competitively employed<br />
within one year of leaving high school.<br />
C. Percent of youth enrolled in higher<br />
education or in some other postsecondary<br />
education or training program; or<br />
competitively employed or in some other<br />
employment within one year of leaving<br />
high school.<br />
State<br />
Rate<br />
Indicator 20: Reported Data-Timely and Accurate*<br />
District submitted<br />
required data elements<br />
on or before due dates;<br />
made revisions within<br />
the alloted reveiw<br />
periods.<br />
Accurate and Timely<br />
Data Submission<br />
Overall (3-21)<br />
Early Childhood (3-5)<br />
School Age (5-21)<br />
State<br />
Target<br />
100.00%<br />
100.00%<br />
100.00%<br />
State<br />
Target<br />
LEA<br />
Rate<br />
LEA<br />
Rate<br />
Target Met by<br />
LEA (Y/N)<br />
Target Met<br />
by LEA<br />
(Y/N)<br />
Target Met<br />
by LEA<br />
(Y/N)<br />
*Data reviewed for timely and accurate submissions included all APSCN cycle data except for personnel<br />
Note: - - denotes not applicable<br />
96.19 100.00 — — N/A<br />
14.53<br />
State<br />
Rate<br />
49.42<br />
State<br />
Rate<br />
54.07<br />
13.00<br />
State<br />
Target<br />
49.00<br />
State<br />
Target<br />
60.00<br />
Y<br />
N/A<br />
Y<br />
0.00%<br />
LEA<br />
Rate<br />
50.00%<br />
LEA<br />
Rate<br />
50.00%<br />
N<br />
Target Met<br />
by LEA<br />
(Y/N)<br />
Y<br />
Target Met<br />
by LEA<br />
(Y/N)<br />
N<br />
Page 5 of 5
LEA: 0302 - COTTER SCHOOL <strong>DISTRICT</strong><br />
<strong>ARKANSAS</strong> <strong>SPECIAL</strong> <strong>EDUCATION</strong><br />
<strong>DISTRICT</strong> <strong>ANNUAL</strong> PERFORMANCE REPORT<br />
2010/11 School Year<br />
Publication Date: March 2012<br />
Each State must have in place a State Performance Plan (SPP) to evaluate the State's efforts to meet the requirements and<br />
purposes of the implementation of the Individuals with Disabilities Education Act (IDEA). The SPP is a six-year plan, which<br />
describes Arkansas's performance on 20 indicators. The Office of Special Education Programs in the U. S. Department of<br />
Education requires that States report annually to the public on the performance of each local education agency (LEA) on 14 of<br />
20 indicators as compared with targets established by the State in the SPP. Arkansas will report indicators 1 through 14 and<br />
20 for each LEA serving children with disabilities (CWD). Any LEA not meeting targets on compliance indicators (0% for<br />
Indicators 4B, 09 & 10 and 100% for Indicators 11, 12, 13, and 20) are non-compliant with IDEA.<br />
There are no report changes for the 2010/11 school year profile; However, it is important to recognize that: .<br />
1. Indicator 01 (Graduation) is reported a year in arrear (2009/10 graduates) and is based on a four-year cohort. This<br />
means the rate is a measure of students who entered in ninth grade and graduate in four years. The calculation is a<br />
requirement under Title I of the Elementary and Secondary Education Act (ESEA).<br />
2. Indicator 02 (Drop out) is reported a year in arrear. This means the rate is a measure of students who dropped out in<br />
the 2009/10 school year. The Indicator 02 data are aligned with the Common Core of Data (CCD) requirements for<br />
grades 7-12.<br />
3. Indicator 04A and 4B (Suspension/Expulsion) is reported a year in arrear. This means the rate is a measure of<br />
students who had out-of-school suspensions and/or expulsions totaling more than 10 days.<br />
Percent of youth<br />
with IEPs<br />
graduating from<br />
high school with a<br />
regular diploma<br />
For a complete description of all the Indicators, please visit the special education website at<br />
http://arksped.k12.ar.us/sections/policy.html<br />
Indicator 01: Graduation Rates (2009/10 school year) Indicator 02: Dropout Rates (2009/10 school year)<br />
State<br />
Rate<br />
State<br />
Target<br />
75.76% 85.00%<br />
LEA<br />
Rate<br />
60.00%<br />
Target Met<br />
by LEA<br />
(Y/N)<br />
N<br />
Percent of<br />
youth with<br />
IEPs dropping<br />
out of high<br />
school<br />
State<br />
Rate<br />
Indicator 03: Assessment on Statewide Benchmark Exam (grades 3-8, 11)<br />
A) Adequate Yearly Progress<br />
n=40<br />
Literacy<br />
Mathematics<br />
Met Disability Subgroup "n"<br />
for Reporting Purposes (Y/N)<br />
State Target for % of Districts Meeting<br />
AYP for Disability Subgroup<br />
State<br />
Target<br />
3.06% 4.20%<br />
LEA<br />
Rate<br />
2.86%<br />
% of Districts Meeting AYP<br />
for Disability Subgroup<br />
Target Met by<br />
LEA (Y/N)<br />
Y<br />
Target Met by<br />
LEA(Y/N)<br />
Overall N 17.15% 6.25%<br />
NA<br />
N<br />
N<br />
Note: For a district to qualify as having a disability subgroup it must have a minimum of 40 (n=40) students with disabilities in a school building.<br />
B) Participation<br />
Participation Rate: # of<br />
CWD Tested ÷ # of CWD<br />
Enrolled in grades tested.<br />
Participation Rate: Literacy<br />
Participation Rate: Math<br />
Note: - - denotes not applicable<br />
State<br />
Rate<br />
98.78%<br />
State<br />
Target<br />
95.00%<br />
LEA<br />
Rate<br />
100.00%<br />
Target Met<br />
by LEA (Y/N)<br />
98.61% 95.00% 100.00% Y<br />
Y<br />
C) Performance Proficiency<br />
Percent of CWD Scoring<br />
Proficient or Above<br />
Proficiency Rate: Literacy<br />
Proficiency Rate:<br />
Mathematics<br />
16.00%<br />
16.00%<br />
State<br />
Rate<br />
31.49%<br />
44.86%<br />
State<br />
Target<br />
45.22%<br />
51.14%<br />
LEA<br />
Rate<br />
35.00%<br />
61.22%<br />
NA<br />
NA<br />
Target<br />
Met by<br />
LEA (Y/N)<br />
N<br />
Y<br />
Page 1 of 5
LEA: 0302 - COTTER SCHOOL <strong>DISTRICT</strong><br />
Indicator 04: Out-of-School Suspensions and Expulsions (2009/10 school year)<br />
A) Suspension/Expulsion<br />
Percent difference of CWD with out-of- school suspensions and<br />
expulsions totaling greater than 10 days in a school year as<br />
compared to the same data for general education students in<br />
the district.<br />
B) Suspension/Expulsion by Race and Ethnicity<br />
Percent of districts that have: (a) a significant discrepancy, by race or<br />
ethnicity, in the rate of suspensions and expulsions of greater than 10<br />
days in a school year for children with IEPs; and (b) policies,<br />
procedures or practices that contribute to the significant discrepancy<br />
and do not comply with requirements relating to the development<br />
and implementation of IEPs, the use of positive behavioral<br />
interventions and supports, and procedural safeguards.<br />
Indicator 05: School Age (5-21) Least Restrictive Environment<br />
A) In the Regular Class 80% or more of the day<br />
Percent of CWD with<br />
IEPs receiving instruction<br />
in the regular class 80%<br />
or more of the day.<br />
State<br />
Rate<br />
State<br />
Target<br />
LEA<br />
Rate<br />
B) In the Regular Class less than 40% of the day<br />
Percent of CWD with<br />
IEPs receiving instruction<br />
in the regular class less<br />
than 60% of the day.<br />
53.87% 59.77%<br />
State<br />
Rate<br />
State<br />
Target<br />
12.42% 12.51%<br />
76.29%<br />
LEA<br />
Rate<br />
5.15%<br />
C) Other Settings outside the regular class<br />
Percent of CWD with IEPs served in<br />
public or private separate schools,<br />
residential placements, or<br />
homebound/hospital placements.<br />
State<br />
Rate<br />
State<br />
Target<br />
2.80% 2.56%<br />
Target Met<br />
by LEA (Y/N)<br />
Y<br />
Target Met<br />
by LEA (Y/N)<br />
Y<br />
LEA<br />
Rate<br />
0.00%<br />
Target Met<br />
by LEA(Y/N)<br />
Indicator 06: Early Childhood (3-5) Least Restrictive Environment<br />
A) Regular Early Childhood Program<br />
Percent of children (aged 3 through 5) with IEPs attending a regular<br />
early childhood program and receiving the majority of special<br />
education and related services in the regular early childhood program<br />
Allowable<br />
Difference<br />
LEA: 0302 - COTTER SCHOOL <strong>DISTRICT</strong><br />
Indicator 07: Preschool (3-5) Outcomes<br />
a) Percent of preschool CWD<br />
children who did not<br />
improve functioning.<br />
b) Percent of preschool CWD<br />
who improved but whose<br />
functioning remained below<br />
same age peers.<br />
c) Percent of preschool CWD<br />
who improved at a level<br />
nearer to same aged peers.<br />
d) Percent of preschool CWD<br />
who improved functioning to<br />
reach a level comparable to<br />
same age peers.<br />
e) Percent of preschool CWD<br />
children who maintain<br />
functioning at a level<br />
comparable to same aged<br />
peers.<br />
Summary<br />
Statements<br />
1) Of those preschool<br />
children who entered<br />
the preschool program<br />
below age expectations<br />
in each Outcome, the<br />
percent who<br />
substantially increased<br />
their rate of growth by<br />
the time they turned 6<br />
years of age or exited<br />
the program.<br />
2) The percent of<br />
preschool children who<br />
were functioning<br />
within age expectations<br />
in each Outcome by the<br />
time they turned 6<br />
years of age or exited<br />
A) Positive Social -Emotional<br />
Skills*<br />
State<br />
Rate<br />
A) Positive Social -<br />
Emotional Skills<br />
(Including social<br />
relationships)<br />
State<br />
Rate<br />
2.14%<br />
5.31%<br />
25.97%<br />
38.22%<br />
28.36%<br />
State<br />
Target<br />
LEA<br />
Rate<br />
LEA<br />
Rate<br />
— —<br />
— —<br />
— —<br />
— —<br />
— —<br />
Target<br />
Met by<br />
LEA(Y/N)<br />
B) Acquisition and Use of<br />
Knowledge and Skills<br />
(Including early language/<br />
communication and early literacy)<br />
B) Acquisition and Use of<br />
Knowledge and Skills **<br />
State<br />
Rate<br />
1.75%<br />
6.59%<br />
34.23%<br />
43.51%<br />
13.92%<br />
State<br />
Target<br />
LEA<br />
Rate<br />
Target<br />
Met by<br />
LEA(Y/N)<br />
C) Use of Appropriate Behaviors<br />
to Meet Their Needs<br />
State<br />
Rate<br />
State<br />
Target<br />
LEA<br />
Rate<br />
Target<br />
Met by<br />
LEA(Y/N)<br />
89.61% 90.50% — — N/A 90.31% 90.50% — — N/A 90.82% 92.50% — — N/A<br />
66.58% 69.50% — — N/A 57.43% 60.50% — — N/A 76.69% 78.50% — — N/A<br />
NOTE: * Including social relationships ** Including early language/ communication and early literacy<br />
Note: - - denotes not applicable<br />
State<br />
Rate<br />
LEA<br />
Rate<br />
— —<br />
— —<br />
— —<br />
— —<br />
— —<br />
C) Use of<br />
Appropriate<br />
Behaviors to<br />
Meet Their Needs<br />
State<br />
Rate<br />
4.51%<br />
17.34%<br />
41.72%<br />
34.97%<br />
LEA<br />
Rate<br />
1.46% — —<br />
— —<br />
— —<br />
— —<br />
— —<br />
Page 3 of 5
LEA: 0302 - COTTER SCHOOL <strong>DISTRICT</strong><br />
Indicator 08: Parent Involvement<br />
Percent of surveyed<br />
parents who reported<br />
school facilitated parent<br />
involvement as a means<br />
of improving services<br />
and results for children<br />
with disabilities.<br />
Early Childhood<br />
(3-5)<br />
School Age<br />
(5-21)<br />
State<br />
Rate<br />
90.47%<br />
95.05%<br />
Indicator 09: Disproportionality - Eligibility<br />
Disproportionate representation of racial<br />
and ethnic groups in special education and<br />
related services that is a result of<br />
inappropriate identification (e.g.<br />
monitoring data, review of policies,<br />
practices, and procedures under 618(d),<br />
etc.).<br />
State<br />
Rate<br />
State<br />
Target<br />
88.00%<br />
96.00%<br />
State<br />
Target<br />
0.00% 0.00%<br />
LEA<br />
Rate<br />
— —<br />
100.00%<br />
Indicator 10: Disproportionality-Child with a Disability<br />
Disproportionate representation of racial<br />
and ethnic groups in specific disability<br />
categories that is a result of inappropriate<br />
identification (e.g. monitoring data, review<br />
of policies, practices, and procedures under<br />
618(d), etc.).<br />
Indicator 11: Child Find<br />
Percent of children with<br />
parental consent to evaluate<br />
who are evaluated within<br />
the State established timeline<br />
of 60 days.<br />
Overall<br />
(3-21)<br />
Early Childhood<br />
(3-5)<br />
School Age<br />
(5-21)<br />
State<br />
Rate<br />
0.00%<br />
Indicator 12: Early Childhood Transition<br />
Percent of children referred by Part C prior to<br />
age 3, who are found eligible for Part B, and<br />
who have an IEP developed and implemented<br />
by their third birthday.<br />
Note: - - denotes not applicable<br />
State<br />
Rate<br />
99.41%<br />
99.70%<br />
98.97%<br />
State<br />
Rate<br />
State<br />
Target<br />
0.00%<br />
State<br />
Target<br />
100.00%<br />
100.00%<br />
100.00%<br />
State<br />
Target<br />
Target Met by<br />
LEA (Y/N)<br />
Y<br />
Target Met by<br />
LEA (Y/N)<br />
Y<br />
LEA<br />
Rate<br />
100.00%<br />
— —<br />
100.00%<br />
LEA<br />
Rate<br />
Target Met by<br />
LEA (Y/N)<br />
N/A<br />
Y<br />
Note: The target for Indicator 09 is to have zero percent<br />
(0%) of districts identified as having disproportionate<br />
representation as a result of inappropriate<br />
identification in eligibility.<br />
Note: The target for Indicator 10 is to have zero<br />
percent (0%) of districts identified as having<br />
disproportionate representation as a result of<br />
inappropriate identification in a disability<br />
category.<br />
Target Met by<br />
LEA (Y/N)<br />
N/A<br />
Y<br />
Target Met<br />
by LEA<br />
(Y/N)<br />
99.21% 100.00% - - N/A<br />
Y<br />
Note: * Indicates a zero reponse rate for the<br />
district.<br />
Page 4 of 5
LEA: 0302 - COTTER SCHOOL <strong>DISTRICT</strong><br />
Indicator 13: Secondary Transition<br />
Percent of youth with disabilities aged 16 and<br />
up with an IEP that includes coordinated,<br />
measurable, annual IEP goals and transition<br />
services that will reasonably enable the student<br />
to meet the post-secondary goals.<br />
Indicator 14: Post-School Outcomes<br />
A. Percent of youth enrolled in higher<br />
education within one year of leaving high<br />
school.<br />
State<br />
Rate<br />
State<br />
Target<br />
Note: Data for this Indicator is from the on-site monitoring of LEAs for the given year.<br />
B. Percent of youth enrolled in higher<br />
education or competitively employed<br />
within one year of leaving high school.<br />
C. Percent of youth enrolled in higher<br />
education or in some other postsecondary<br />
education or training program; or<br />
competitively employed or in some other<br />
employment within one year of leaving<br />
high school.<br />
State<br />
Rate<br />
Indicator 20: Reported Data-Timely and Accurate*<br />
District submitted<br />
required data elements<br />
on or before due dates;<br />
made revisions within<br />
the alloted reveiw<br />
periods.<br />
Accurate and Timely<br />
Data Submission<br />
Overall (3-21)<br />
Early Childhood (3-5)<br />
School Age (5-21)<br />
State<br />
Target<br />
100.00%<br />
100.00%<br />
100.00%<br />
State<br />
Target<br />
LEA<br />
Rate<br />
LEA<br />
Rate<br />
Target Met by<br />
LEA (Y/N)<br />
Target Met<br />
by LEA<br />
(Y/N)<br />
Target Met<br />
by LEA<br />
(Y/N)<br />
*Data reviewed for timely and accurate submissions included all APSCN cycle data except for personnel<br />
Note: - - denotes not applicable<br />
96.19 100.00 — — N/A<br />
14.53<br />
State<br />
Rate<br />
49.42<br />
State<br />
Rate<br />
54.07<br />
13.00<br />
State<br />
Target<br />
49.00<br />
State<br />
Target<br />
60.00<br />
Y<br />
N/A<br />
Y<br />
— —<br />
LEA<br />
Rate<br />
— —<br />
LEA<br />
Rate<br />
— —<br />
N/A<br />
Target Met<br />
by LEA<br />
(Y/N)<br />
N/A<br />
Target Met<br />
by LEA<br />
(Y/N)<br />
N/A<br />
Page 5 of 5
<strong>ARKANSAS</strong> <strong>SPECIAL</strong> <strong>EDUCATION</strong><br />
<strong>DISTRICT</strong> <strong>ANNUAL</strong> PERFORMANCE REPORT<br />
2010/11 School Year<br />
Publication Date: March 2012<br />
Each State must have in place a State Performance Plan (SPP) to evaluate the State's efforts to meet the requirements and<br />
purposes of the implementation of the Individuals with Disabilities Education Act (IDEA). The SPP is a six-year plan, which<br />
describes Arkansas's performance on 20 indicators. The Office of Special Education Programs in the U. S. Department of<br />
Education requires that States report annually to the public on the performance of each local education agency (LEA) on 14 of<br />
20 indicators as compared with targets established by the State in the SPP. Arkansas will report indicators 1 through 14 and<br />
20 for each LEA serving children with disabilities (CWD). Any LEA not meeting targets on compliance indicators (0% for<br />
Indicators 4B, 09 & 10 and 100% for Indicators 11, 12, 13, and 20) are non-compliant with IDEA.<br />
There are no report changes for the 2010/11 school year profile; However, it is important to recognize that: .<br />
1. Indicator 01 (Graduation) is reported a year in arrear (2009/10 graduates) and is based on a four-year cohort. This<br />
means the rate is a measure of students who entered in ninth grade and graduate in four years. The calculation is a<br />
requirement under Title I of the Elementary and Secondary Education Act (ESEA).<br />
2. Indicator 02 (Drop out) is reported a year in arrear. This means the rate is a measure of students who dropped out in<br />
the 2009/10 school year. The Indicator 02 data are aligned with the Common Core of Data (CCD) requirements for<br />
grades 7-12.<br />
3. Indicator 04A and 4B (Suspension/Expulsion) is reported a year in arrear. This means the rate is a measure of<br />
students who had out-of-school suspensions and/or expulsions totaling more than 10 days.<br />
For a complete description of all the Indicators, please visit the special education website at<br />
http://arksped.k12.ar.us/sections/policy.html<br />
LEA: 0303 - MOUNTAIN HOME SCHOOL <strong>DISTRICT</strong><br />
Indicator 01: Graduation Rates (2009/10 school year) Indicator 02: Dropout Rates (2009/10 school year)<br />
Percent of youth<br />
with IEPs<br />
graduating from<br />
high school with a<br />
regular diploma<br />
State<br />
Rate<br />
State<br />
Target<br />
75.76% 85.00%<br />
LEA<br />
Rate<br />
43.75%<br />
Target Met<br />
by LEA<br />
(Y/N)<br />
N<br />
Percent of<br />
youth with<br />
IEPs dropping<br />
out of high<br />
school<br />
State<br />
Rate<br />
Indicator 03: Assessment on Statewide Benchmark Exam (grades 3-8, 11)<br />
A) Adequate Yearly Progress<br />
n=40<br />
Literacy<br />
Mathematics<br />
Met Disability Subgroup "n"<br />
for Reporting Purposes (Y/N)<br />
State Target for % of Districts Meeting<br />
AYP for Disability Subgroup<br />
State<br />
Target<br />
3.06% 4.20%<br />
LEA<br />
Rate<br />
9.89%<br />
% of Districts Meeting AYP<br />
for Disability Subgroup<br />
Target Met by<br />
LEA (Y/N)<br />
N<br />
Target Met by<br />
LEA(Y/N)<br />
Overall N 17.15% 6.25%<br />
NA<br />
N<br />
N<br />
Note: For a district to qualify as having a disability subgroup it must have a minimum of 40 (n=40) students with disabilities in a school building.<br />
B) Participation<br />
Participation Rate: # of<br />
CWD Tested ÷ # of CWD<br />
Enrolled in grades tested.<br />
Participation Rate: Literacy<br />
Participation Rate: Math<br />
Note: - - denotes not applicable<br />
State<br />
Rate<br />
98.78%<br />
State<br />
Target<br />
95.00%<br />
LEA<br />
Rate<br />
100.00%<br />
Target Met<br />
by LEA (Y/N)<br />
98.61% 95.00% 98.99% Y<br />
Y<br />
C) Performance Proficiency<br />
Percent of CWD Scoring<br />
Proficient or Above<br />
Proficiency Rate: Literacy<br />
Proficiency Rate:<br />
Mathematics<br />
16.00%<br />
16.00%<br />
State<br />
Rate<br />
31.49%<br />
44.86%<br />
State<br />
Target<br />
45.22%<br />
51.14%<br />
LEA<br />
Rate<br />
37.89%<br />
43.65%<br />
NA<br />
NA<br />
Target<br />
Met by<br />
LEA (Y/N)<br />
N<br />
N<br />
Page 1 of 5
LEA: 0303 - MOUNTAIN HOME SCHOOL <strong>DISTRICT</strong><br />
Indicator 04: Out-of-School Suspensions and Expulsions (2009/10 school year)<br />
A) Suspension/Expulsion<br />
Percent difference of CWD with out-of- school suspensions and<br />
expulsions totaling greater than 10 days in a school year as<br />
compared to the same data for general education students in<br />
the district.<br />
B) Suspension/Expulsion by Race and Ethnicity<br />
Percent of districts that have: (a) a significant discrepancy, by race or<br />
ethnicity, in the rate of suspensions and expulsions of greater than 10<br />
days in a school year for children with IEPs; and (b) policies,<br />
procedures or practices that contribute to the significant discrepancy<br />
and do not comply with requirements relating to the development<br />
and implementation of IEPs, the use of positive behavioral<br />
interventions and supports, and procedural safeguards.<br />
Indicator 05: School Age (5-21) Least Restrictive Environment<br />
A) In the Regular Class 80% or more of the day<br />
Percent of CWD with<br />
IEPs receiving instruction<br />
in the regular class 80%<br />
or more of the day.<br />
State<br />
Rate<br />
State<br />
Target<br />
LEA<br />
Rate<br />
B) In the Regular Class less than 40% of the day<br />
Percent of CWD with<br />
IEPs receiving instruction<br />
in the regular class less<br />
than 60% of the day.<br />
53.87% 59.77%<br />
State<br />
Rate<br />
State<br />
Target<br />
12.42% 12.51%<br />
72.51%<br />
LEA<br />
Rate<br />
15.71%<br />
C) Other Settings outside the regular class<br />
Percent of CWD with IEPs served in<br />
public or private separate schools,<br />
residential placements, or<br />
homebound/hospital placements.<br />
State<br />
Rate<br />
State<br />
Target<br />
2.80% 2.56%<br />
Target Met<br />
by LEA (Y/N)<br />
Y<br />
Target Met<br />
by LEA (Y/N)<br />
N<br />
LEA<br />
Rate<br />
0.26%<br />
Target Met<br />
by LEA(Y/N)<br />
Indicator 06: Early Childhood (3-5) Least Restrictive Environment<br />
A) Regular Early Childhood Program<br />
Percent of children (aged 3 through 5) with IEPs attending a regular<br />
early childhood program and receiving the majority of special<br />
education and related services in the regular early childhood program<br />
Allowable<br />
Difference<br />
LEA: 0303 - MOUNTAIN HOME SCHOOL <strong>DISTRICT</strong><br />
Indicator 07: Preschool (3-5) Outcomes<br />
a) Percent of preschool CWD<br />
children who did not<br />
improve functioning.<br />
b) Percent of preschool CWD<br />
who improved but whose<br />
functioning remained below<br />
same age peers.<br />
c) Percent of preschool CWD<br />
who improved at a level<br />
nearer to same aged peers.<br />
d) Percent of preschool CWD<br />
who improved functioning to<br />
reach a level comparable to<br />
same age peers.<br />
e) Percent of preschool CWD<br />
children who maintain<br />
functioning at a level<br />
comparable to same aged<br />
peers.<br />
Summary<br />
Statements<br />
1) Of those preschool<br />
children who entered<br />
the preschool program<br />
below age expectations<br />
in each Outcome, the<br />
percent who<br />
substantially increased<br />
their rate of growth by<br />
the time they turned 6<br />
years of age or exited<br />
the program.<br />
2) The percent of<br />
preschool children who<br />
were functioning<br />
within age expectations<br />
in each Outcome by the<br />
time they turned 6<br />
years of age or exited<br />
A) Positive Social -Emotional<br />
Skills*<br />
State<br />
Rate<br />
A) Positive Social -<br />
Emotional Skills<br />
(Including social<br />
relationships)<br />
State<br />
Rate<br />
2.14%<br />
5.31%<br />
25.97%<br />
38.22%<br />
28.36%<br />
State<br />
Target<br />
LEA<br />
Rate<br />
LEA<br />
Rate<br />
— —<br />
— —<br />
— —<br />
— —<br />
— —<br />
Target<br />
Met by<br />
LEA(Y/N)<br />
B) Acquisition and Use of<br />
Knowledge and Skills<br />
(Including early language/<br />
communication and early literacy)<br />
B) Acquisition and Use of<br />
Knowledge and Skills **<br />
State<br />
Rate<br />
1.75%<br />
6.59%<br />
34.23%<br />
43.51%<br />
13.92%<br />
State<br />
Target<br />
LEA<br />
Rate<br />
Target<br />
Met by<br />
LEA(Y/N)<br />
C) Use of Appropriate Behaviors<br />
to Meet Their Needs<br />
State<br />
Rate<br />
State<br />
Target<br />
LEA<br />
Rate<br />
Target<br />
Met by<br />
LEA(Y/N)<br />
89.61% 90.50% — — N/A 90.31% 90.50% — — N/A 90.82% 92.50% — — N/A<br />
66.58% 69.50% — — N/A 57.43% 60.50% — — N/A 76.69% 78.50% — — N/A<br />
NOTE: * Including social relationships ** Including early language/ communication and early literacy<br />
Note: - - denotes not applicable<br />
State<br />
Rate<br />
LEA<br />
Rate<br />
— —<br />
— —<br />
— —<br />
— —<br />
— —<br />
C) Use of<br />
Appropriate<br />
Behaviors to<br />
Meet Their Needs<br />
State<br />
Rate<br />
4.51%<br />
17.34%<br />
41.72%<br />
34.97%<br />
LEA<br />
Rate<br />
1.46% — —<br />
— —<br />
— —<br />
— —<br />
— —<br />
Page 3 of 5
LEA: 0303 - MOUNTAIN HOME SCHOOL <strong>DISTRICT</strong><br />
Indicator 08: Parent Involvement<br />
Percent of surveyed<br />
parents who reported<br />
school facilitated parent<br />
involvement as a means<br />
of improving services<br />
and results for children<br />
with disabilities.<br />
Early Childhood<br />
(3-5)<br />
School Age<br />
(5-21)<br />
State<br />
Rate<br />
90.47%<br />
95.05%<br />
Indicator 09: Disproportionality - Eligibility<br />
Disproportionate representation of racial<br />
and ethnic groups in special education and<br />
related services that is a result of<br />
inappropriate identification (e.g.<br />
monitoring data, review of policies,<br />
practices, and procedures under 618(d),<br />
etc.).<br />
State<br />
Rate<br />
State<br />
Target<br />
88.00%<br />
96.00%<br />
State<br />
Target<br />
0.00% 0.00%<br />
LEA<br />
Rate<br />
— —<br />
98.59%<br />
Indicator 10: Disproportionality-Child with a Disability<br />
Disproportionate representation of racial<br />
and ethnic groups in specific disability<br />
categories that is a result of inappropriate<br />
identification (e.g. monitoring data, review<br />
of policies, practices, and procedures under<br />
618(d), etc.).<br />
Indicator 11: Child Find<br />
Percent of children with<br />
parental consent to evaluate<br />
who are evaluated within<br />
the State established timeline<br />
of 60 days.<br />
Overall<br />
(3-21)<br />
Early Childhood<br />
(3-5)<br />
School Age<br />
(5-21)<br />
State<br />
Rate<br />
0.00%<br />
Indicator 12: Early Childhood Transition<br />
Percent of children referred by Part C prior to<br />
age 3, who are found eligible for Part B, and<br />
who have an IEP developed and implemented<br />
by their third birthday.<br />
Note: - - denotes not applicable<br />
State<br />
Rate<br />
99.41%<br />
99.70%<br />
98.97%<br />
State<br />
Rate<br />
State<br />
Target<br />
0.00%<br />
State<br />
Target<br />
100.00%<br />
100.00%<br />
100.00%<br />
State<br />
Target<br />
Target Met by<br />
LEA (Y/N)<br />
Y<br />
Target Met by<br />
LEA (Y/N)<br />
Y<br />
LEA<br />
Rate<br />
100.00%<br />
— —<br />
100.00%<br />
LEA<br />
Rate<br />
Target Met by<br />
LEA (Y/N)<br />
N/A<br />
Y<br />
Note: The target for Indicator 09 is to have zero percent<br />
(0%) of districts identified as having disproportionate<br />
representation as a result of inappropriate<br />
identification in eligibility.<br />
Note: The target for Indicator 10 is to have zero<br />
percent (0%) of districts identified as having<br />
disproportionate representation as a result of<br />
inappropriate identification in a disability<br />
category.<br />
Target Met by<br />
LEA (Y/N)<br />
N/A<br />
Y<br />
Target Met<br />
by LEA<br />
(Y/N)<br />
99.21% 100.00% - - N/A<br />
Y<br />
Note: * Indicates a zero reponse rate for the<br />
district.<br />
Page 4 of 5
LEA: 0303 - MOUNTAIN HOME SCHOOL <strong>DISTRICT</strong><br />
Indicator 13: Secondary Transition<br />
Percent of youth with disabilities aged 16 and<br />
up with an IEP that includes coordinated,<br />
measurable, annual IEP goals and transition<br />
services that will reasonably enable the student<br />
to meet the post-secondary goals.<br />
Indicator 14: Post-School Outcomes<br />
A. Percent of youth enrolled in higher<br />
education within one year of leaving high<br />
school.<br />
State<br />
Rate<br />
State<br />
Target<br />
Note: Data for this Indicator is from the on-site monitoring of LEAs for the given year.<br />
B. Percent of youth enrolled in higher<br />
education or competitively employed<br />
within one year of leaving high school.<br />
C. Percent of youth enrolled in higher<br />
education or in some other postsecondary<br />
education or training program; or<br />
competitively employed or in some other<br />
employment within one year of leaving<br />
high school.<br />
State<br />
Rate<br />
Indicator 20: Reported Data-Timely and Accurate*<br />
District submitted<br />
required data elements<br />
on or before due dates;<br />
made revisions within<br />
the alloted reveiw<br />
periods.<br />
Accurate and Timely<br />
Data Submission<br />
Overall (3-21)<br />
Early Childhood (3-5)<br />
School Age (5-21)<br />
State<br />
Target<br />
100.00%<br />
100.00%<br />
100.00%<br />
State<br />
Target<br />
LEA<br />
Rate<br />
LEA<br />
Rate<br />
Target Met by<br />
LEA (Y/N)<br />
Target Met<br />
by LEA<br />
(Y/N)<br />
Target Met<br />
by LEA<br />
(Y/N)<br />
*Data reviewed for timely and accurate submissions included all APSCN cycle data except for personnel<br />
Note: - - denotes not applicable<br />
96.19 100.00 — — N/A<br />
14.53<br />
State<br />
Rate<br />
49.42<br />
State<br />
Rate<br />
54.07<br />
13.00<br />
State<br />
Target<br />
49.00<br />
State<br />
Target<br />
60.00<br />
Y<br />
N/A<br />
Y<br />
— —<br />
LEA<br />
Rate<br />
— —<br />
LEA<br />
Rate<br />
— —<br />
N/A<br />
Target Met<br />
by LEA<br />
(Y/N)<br />
N/A<br />
Target Met<br />
by LEA<br />
(Y/N)<br />
N/A<br />
Page 5 of 5
LEA: 0304 - NORFORK SCHOOL <strong>DISTRICT</strong><br />
<strong>ARKANSAS</strong> <strong>SPECIAL</strong> <strong>EDUCATION</strong><br />
<strong>DISTRICT</strong> <strong>ANNUAL</strong> PERFORMANCE REPORT<br />
2010/11 School Year<br />
Publication Date: March 2012<br />
Each State must have in place a State Performance Plan (SPP) to evaluate the State's efforts to meet the requirements and<br />
purposes of the implementation of the Individuals with Disabilities Education Act (IDEA). The SPP is a six-year plan, which<br />
describes Arkansas's performance on 20 indicators. The Office of Special Education Programs in the U. S. Department of<br />
Education requires that States report annually to the public on the performance of each local education agency (LEA) on 14 of<br />
20 indicators as compared with targets established by the State in the SPP. Arkansas will report indicators 1 through 14 and<br />
20 for each LEA serving children with disabilities (CWD). Any LEA not meeting targets on compliance indicators (0% for<br />
Indicators 4B, 09 & 10 and 100% for Indicators 11, 12, 13, and 20) are non-compliant with IDEA.<br />
There are no report changes for the 2010/11 school year profile; However, it is important to recognize that: .<br />
1. Indicator 01 (Graduation) is reported a year in arrear (2009/10 graduates) and is based on a four-year cohort. This<br />
means the rate is a measure of students who entered in ninth grade and graduate in four years. The calculation is a<br />
requirement under Title I of the Elementary and Secondary Education Act (ESEA).<br />
2. Indicator 02 (Drop out) is reported a year in arrear. This means the rate is a measure of students who dropped out in<br />
the 2009/10 school year. The Indicator 02 data are aligned with the Common Core of Data (CCD) requirements for<br />
grades 7-12.<br />
3. Indicator 04A and 4B (Suspension/Expulsion) is reported a year in arrear. This means the rate is a measure of<br />
students who had out-of-school suspensions and/or expulsions totaling more than 10 days.<br />
Percent of youth<br />
with IEPs<br />
graduating from<br />
high school with a<br />
regular diploma<br />
For a complete description of all the Indicators, please visit the special education website at<br />
http://arksped.k12.ar.us/sections/policy.html<br />
Indicator 01: Graduation Rates (2009/10 school year) Indicator 02: Dropout Rates (2009/10 school year)<br />
State<br />
Rate<br />
State<br />
Target<br />
75.76% 85.00%<br />
LEA<br />
Rate<br />
100.00%<br />
Target Met<br />
by LEA<br />
(Y/N)<br />
Y<br />
Percent of<br />
youth with<br />
IEPs dropping<br />
out of high<br />
school<br />
State<br />
Rate<br />
Indicator 03: Assessment on Statewide Benchmark Exam (grades 3-8, 11)<br />
A) Adequate Yearly Progress<br />
n=40<br />
Literacy<br />
Mathematics<br />
Met Disability Subgroup "n"<br />
for Reporting Purposes (Y/N)<br />
State Target for % of Districts Meeting<br />
AYP for Disability Subgroup<br />
State<br />
Target<br />
3.06% 4.20%<br />
LEA<br />
Rate<br />
0.00%<br />
% of Districts Meeting AYP<br />
for Disability Subgroup<br />
Target Met by<br />
LEA (Y/N)<br />
Y<br />
Target Met by<br />
LEA(Y/N)<br />
Overall N 17.15% 6.25%<br />
NA<br />
N<br />
N<br />
Note: For a district to qualify as having a disability subgroup it must have a minimum of 40 (n=40) students with disabilities in a school building.<br />
B) Participation<br />
Participation Rate: # of<br />
CWD Tested ÷ # of CWD<br />
Enrolled in grades tested.<br />
Participation Rate: Literacy<br />
Participation Rate: Math<br />
Note: - - denotes not applicable<br />
State<br />
Rate<br />
98.78%<br />
State<br />
Target<br />
95.00%<br />
LEA<br />
Rate<br />
100.00%<br />
Target Met<br />
by LEA (Y/N)<br />
98.61% 95.00% 100.00% Y<br />
Y<br />
C) Performance Proficiency<br />
Percent of CWD Scoring<br />
Proficient or Above<br />
Proficiency Rate: Literacy<br />
Proficiency Rate:<br />
Mathematics<br />
16.00%<br />
16.00%<br />
State<br />
Rate<br />
31.49%<br />
44.86%<br />
State<br />
Target<br />
45.22%<br />
51.14%<br />
LEA<br />
Rate<br />
46.88%<br />
40.54%<br />
NA<br />
NA<br />
Target<br />
Met by<br />
LEA (Y/N)<br />
Y<br />
N<br />
Page 1 of 5
LEA: 0304 - NORFORK SCHOOL <strong>DISTRICT</strong><br />
Indicator 04: Out-of-School Suspensions and Expulsions (2009/10 school year)<br />
A) Suspension/Expulsion<br />
Percent difference of CWD with out-of- school suspensions and<br />
expulsions totaling greater than 10 days in a school year as<br />
compared to the same data for general education students in<br />
the district.<br />
B) Suspension/Expulsion by Race and Ethnicity<br />
Percent of districts that have: (a) a significant discrepancy, by race or<br />
ethnicity, in the rate of suspensions and expulsions of greater than 10<br />
days in a school year for children with IEPs; and (b) policies,<br />
procedures or practices that contribute to the significant discrepancy<br />
and do not comply with requirements relating to the development<br />
and implementation of IEPs, the use of positive behavioral<br />
interventions and supports, and procedural safeguards.<br />
Indicator 05: School Age (5-21) Least Restrictive Environment<br />
A) In the Regular Class 80% or more of the day<br />
Percent of CWD with<br />
IEPs receiving instruction<br />
in the regular class 80%<br />
or more of the day.<br />
State<br />
Rate<br />
State<br />
Target<br />
LEA<br />
Rate<br />
B) In the Regular Class less than 40% of the day<br />
Percent of CWD with<br />
IEPs receiving instruction<br />
in the regular class less<br />
than 60% of the day.<br />
53.87% 59.77%<br />
State<br />
Rate<br />
State<br />
Target<br />
12.42% 12.51%<br />
80.00%<br />
LEA<br />
Rate<br />
6.15%<br />
C) Other Settings outside the regular class<br />
Percent of CWD with IEPs served in<br />
public or private separate schools,<br />
residential placements, or<br />
homebound/hospital placements.<br />
State<br />
Rate<br />
State<br />
Target<br />
2.80% 2.56%<br />
Target Met<br />
by LEA (Y/N)<br />
Y<br />
Target Met<br />
by LEA (Y/N)<br />
Y<br />
LEA<br />
Rate<br />
0.00%<br />
Target Met<br />
by LEA(Y/N)<br />
Indicator 06: Early Childhood (3-5) Least Restrictive Environment<br />
A) Regular Early Childhood Program<br />
Percent of children (aged 3 through 5) with IEPs attending a regular<br />
early childhood program and receiving the majority of special<br />
education and related services in the regular early childhood program<br />
Allowable<br />
Difference<br />
LEA: 0304 - NORFORK SCHOOL <strong>DISTRICT</strong><br />
Indicator 07: Preschool (3-5) Outcomes<br />
a) Percent of preschool CWD<br />
children who did not<br />
improve functioning.<br />
b) Percent of preschool CWD<br />
who improved but whose<br />
functioning remained below<br />
same age peers.<br />
c) Percent of preschool CWD<br />
who improved at a level<br />
nearer to same aged peers.<br />
d) Percent of preschool CWD<br />
who improved functioning to<br />
reach a level comparable to<br />
same age peers.<br />
e) Percent of preschool CWD<br />
children who maintain<br />
functioning at a level<br />
comparable to same aged<br />
peers.<br />
Summary<br />
Statements<br />
1) Of those preschool<br />
children who entered<br />
the preschool program<br />
below age expectations<br />
in each Outcome, the<br />
percent who<br />
substantially increased<br />
their rate of growth by<br />
the time they turned 6<br />
years of age or exited<br />
the program.<br />
2) The percent of<br />
preschool children who<br />
were functioning<br />
within age expectations<br />
in each Outcome by the<br />
time they turned 6<br />
years of age or exited<br />
A) Positive Social -Emotional<br />
Skills*<br />
State<br />
Rate<br />
A) Positive Social -<br />
Emotional Skills<br />
(Including social<br />
relationships)<br />
State<br />
Rate<br />
2.14%<br />
5.31%<br />
25.97%<br />
38.22%<br />
28.36%<br />
State<br />
Target<br />
LEA<br />
Rate<br />
LEA<br />
Rate<br />
— —<br />
— —<br />
— —<br />
— —<br />
— —<br />
Target<br />
Met by<br />
LEA(Y/N)<br />
B) Acquisition and Use of<br />
Knowledge and Skills<br />
(Including early language/<br />
communication and early literacy)<br />
B) Acquisition and Use of<br />
Knowledge and Skills **<br />
State<br />
Rate<br />
1.75%<br />
6.59%<br />
34.23%<br />
43.51%<br />
13.92%<br />
State<br />
Target<br />
LEA<br />
Rate<br />
Target<br />
Met by<br />
LEA(Y/N)<br />
C) Use of Appropriate Behaviors<br />
to Meet Their Needs<br />
State<br />
Rate<br />
State<br />
Target<br />
LEA<br />
Rate<br />
Target<br />
Met by<br />
LEA(Y/N)<br />
89.61% 90.50% — — N/A 90.31% 90.50% — — N/A 90.82% 92.50% — — N/A<br />
66.58% 69.50% — — N/A 57.43% 60.50% — — N/A 76.69% 78.50% — — N/A<br />
NOTE: * Including social relationships ** Including early language/ communication and early literacy<br />
Note: - - denotes not applicable<br />
State<br />
Rate<br />
LEA<br />
Rate<br />
— —<br />
— —<br />
— —<br />
— —<br />
— —<br />
C) Use of<br />
Appropriate<br />
Behaviors to<br />
Meet Their Needs<br />
State<br />
Rate<br />
4.51%<br />
17.34%<br />
41.72%<br />
34.97%<br />
LEA<br />
Rate<br />
1.46% — —<br />
— —<br />
— —<br />
— —<br />
— —<br />
Page 3 of 5
LEA: 0304 - NORFORK SCHOOL <strong>DISTRICT</strong><br />
Indicator 08: Parent Involvement<br />
Percent of surveyed<br />
parents who reported<br />
school facilitated parent<br />
involvement as a means<br />
of improving services<br />
and results for children<br />
with disabilities.<br />
Early Childhood<br />
(3-5)<br />
School Age<br />
(5-21)<br />
State<br />
Rate<br />
90.47%<br />
95.05%<br />
Indicator 09: Disproportionality - Eligibility<br />
Disproportionate representation of racial<br />
and ethnic groups in special education and<br />
related services that is a result of<br />
inappropriate identification (e.g.<br />
monitoring data, review of policies,<br />
practices, and procedures under 618(d),<br />
etc.).<br />
State<br />
Rate<br />
State<br />
Target<br />
88.00%<br />
96.00%<br />
State<br />
Target<br />
0.00% 0.00%<br />
LEA<br />
Rate<br />
— —<br />
93.33%<br />
Indicator 10: Disproportionality-Child with a Disability<br />
Disproportionate representation of racial<br />
and ethnic groups in specific disability<br />
categories that is a result of inappropriate<br />
identification (e.g. monitoring data, review<br />
of policies, practices, and procedures under<br />
618(d), etc.).<br />
Indicator 11: Child Find<br />
Percent of children with<br />
parental consent to evaluate<br />
who are evaluated within<br />
the State established timeline<br />
of 60 days.<br />
Overall<br />
(3-21)<br />
Early Childhood<br />
(3-5)<br />
School Age<br />
(5-21)<br />
State<br />
Rate<br />
0.00%<br />
Indicator 12: Early Childhood Transition<br />
Percent of children referred by Part C prior to<br />
age 3, who are found eligible for Part B, and<br />
who have an IEP developed and implemented<br />
by their third birthday.<br />
Note: - - denotes not applicable<br />
State<br />
Rate<br />
99.41%<br />
99.70%<br />
98.97%<br />
State<br />
Rate<br />
State<br />
Target<br />
0.00%<br />
State<br />
Target<br />
100.00%<br />
100.00%<br />
100.00%<br />
State<br />
Target<br />
Target Met by<br />
LEA (Y/N)<br />
Y<br />
Target Met by<br />
LEA (Y/N)<br />
Y<br />
LEA<br />
Rate<br />
100.00%<br />
— —<br />
100.00%<br />
LEA<br />
Rate<br />
Target Met by<br />
LEA (Y/N)<br />
N/A<br />
N<br />
Note: The target for Indicator 09 is to have zero percent<br />
(0%) of districts identified as having disproportionate<br />
representation as a result of inappropriate<br />
identification in eligibility.<br />
Note: The target for Indicator 10 is to have zero<br />
percent (0%) of districts identified as having<br />
disproportionate representation as a result of<br />
inappropriate identification in a disability<br />
category.<br />
Target Met by<br />
LEA (Y/N)<br />
N/A<br />
Y<br />
Target Met<br />
by LEA<br />
(Y/N)<br />
99.21% 100.00% - - N/A<br />
Y<br />
Note: * Indicates a zero reponse rate for the<br />
district.<br />
Page 4 of 5
LEA: 0304 - NORFORK SCHOOL <strong>DISTRICT</strong><br />
Indicator 13: Secondary Transition<br />
Percent of youth with disabilities aged 16 and<br />
up with an IEP that includes coordinated,<br />
measurable, annual IEP goals and transition<br />
services that will reasonably enable the student<br />
to meet the post-secondary goals.<br />
Indicator 14: Post-School Outcomes<br />
A. Percent of youth enrolled in higher<br />
education within one year of leaving high<br />
school.<br />
State<br />
Rate<br />
State<br />
Target<br />
Note: Data for this Indicator is from the on-site monitoring of LEAs for the given year.<br />
B. Percent of youth enrolled in higher<br />
education or competitively employed<br />
within one year of leaving high school.<br />
C. Percent of youth enrolled in higher<br />
education or in some other postsecondary<br />
education or training program; or<br />
competitively employed or in some other<br />
employment within one year of leaving<br />
high school.<br />
State<br />
Rate<br />
Indicator 20: Reported Data-Timely and Accurate*<br />
District submitted<br />
required data elements<br />
on or before due dates;<br />
made revisions within<br />
the alloted reveiw<br />
periods.<br />
Accurate and Timely<br />
Data Submission<br />
Overall (3-21)<br />
Early Childhood (3-5)<br />
School Age (5-21)<br />
State<br />
Target<br />
100.00%<br />
100.00%<br />
100.00%<br />
State<br />
Target<br />
LEA<br />
Rate<br />
LEA<br />
Rate<br />
Target Met by<br />
LEA (Y/N)<br />
Target Met<br />
by LEA<br />
(Y/N)<br />
Target Met<br />
by LEA<br />
(Y/N)<br />
*Data reviewed for timely and accurate submissions included all APSCN cycle data except for personnel<br />
Note: - - denotes not applicable<br />
96.19 100.00 100.00% Y<br />
14.53<br />
State<br />
Rate<br />
49.42<br />
State<br />
Rate<br />
54.07<br />
13.00<br />
State<br />
Target<br />
49.00<br />
State<br />
Target<br />
60.00<br />
Y<br />
N/A<br />
Y<br />
— —<br />
LEA<br />
Rate<br />
— —<br />
LEA<br />
Rate<br />
— —<br />
N/A<br />
Target Met<br />
by LEA<br />
(Y/N)<br />
N/A<br />
Target Met<br />
by LEA<br />
(Y/N)<br />
N/A<br />
Page 5 of 5
<strong>ARKANSAS</strong> <strong>SPECIAL</strong> <strong>EDUCATION</strong><br />
<strong>DISTRICT</strong> <strong>ANNUAL</strong> PERFORMANCE REPORT<br />
2010/11 School Year<br />
Publication Date: March 2012<br />
Each State must have in place a State Performance Plan (SPP) to evaluate the State's efforts to meet the requirements and<br />
purposes of the implementation of the Individuals with Disabilities Education Act (IDEA). The SPP is a six-year plan, which<br />
describes Arkansas's performance on 20 indicators. The Office of Special Education Programs in the U. S. Department of<br />
Education requires that States report annually to the public on the performance of each local education agency (LEA) on 14 of<br />
20 indicators as compared with targets established by the State in the SPP. Arkansas will report indicators 1 through 14 and<br />
20 for each LEA serving children with disabilities (CWD). Any LEA not meeting targets on compliance indicators (0% for<br />
Indicators 4B, 09 & 10 and 100% for Indicators 11, 12, 13, and 20) are non-compliant with IDEA.<br />
There are no report changes for the 2010/11 school year profile; However, it is important to recognize that: .<br />
1. Indicator 01 (Graduation) is reported a year in arrear (2009/10 graduates) and is based on a four-year cohort. This<br />
means the rate is a measure of students who entered in ninth grade and graduate in four years. The calculation is a<br />
requirement under Title I of the Elementary and Secondary Education Act (ESEA).<br />
2. Indicator 02 (Drop out) is reported a year in arrear. This means the rate is a measure of students who dropped out in<br />
the 2009/10 school year. The Indicator 02 data are aligned with the Common Core of Data (CCD) requirements for<br />
grades 7-12.<br />
3. Indicator 04A and 4B (Suspension/Expulsion) is reported a year in arrear. This means the rate is a measure of<br />
students who had out-of-school suspensions and/or expulsions totaling more than 10 days.<br />
For a complete description of all the Indicators, please visit the special education website at<br />
http://arksped.k12.ar.us/sections/policy.html<br />
LEA: 0401 - BENTONVILLE SCHOOL <strong>DISTRICT</strong><br />
Indicator 01: Graduation Rates (2009/10 school year) Indicator 02: Dropout Rates (2009/10 school year)<br />
Percent of youth<br />
with IEPs<br />
graduating from<br />
high school with a<br />
regular diploma<br />
State<br />
Rate<br />
State<br />
Target<br />
75.76% 85.00%<br />
LEA<br />
Rate<br />
74.63%<br />
Target Met<br />
by LEA<br />
(Y/N)<br />
N<br />
Percent of<br />
youth with<br />
IEPs dropping<br />
out of high<br />
school<br />
State<br />
Rate<br />
Indicator 03: Assessment on Statewide Benchmark Exam (grades 3-8, 11)<br />
A) Adequate Yearly Progress<br />
n=40<br />
Literacy<br />
Mathematics<br />
Met Disability Subgroup "n"<br />
for Reporting Purposes (Y/N)<br />
State Target for % of Districts Meeting<br />
AYP for Disability Subgroup<br />
State<br />
Target<br />
3.06% 4.20%<br />
LEA<br />
Rate<br />
2.22%<br />
% of Districts Meeting AYP<br />
for Disability Subgroup<br />
Target Met by<br />
LEA (Y/N)<br />
Y<br />
Target Met by<br />
LEA(Y/N)<br />
Overall Y 17.15% 6.25%<br />
N<br />
Y<br />
Y<br />
Note: For a district to qualify as having a disability subgroup it must have a minimum of 40 (n=40) students with disabilities in a school building.<br />
B) Participation<br />
Participation Rate: # of<br />
CWD Tested ÷ # of CWD<br />
Enrolled in grades tested.<br />
Participation Rate: Literacy<br />
Participation Rate: Math<br />
Note: - - denotes not applicable<br />
State<br />
Rate<br />
98.78%<br />
State<br />
Target<br />
95.00%<br />
LEA<br />
Rate<br />
99.18%<br />
Target Met<br />
by LEA (Y/N)<br />
98.61% 95.00% 99.25% Y<br />
Y<br />
C) Performance Proficiency<br />
Percent of CWD Scoring<br />
Proficient or Above<br />
Proficiency Rate: Literacy<br />
Proficiency Rate:<br />
Mathematics<br />
16.00%<br />
16.00%<br />
State<br />
Rate<br />
31.49%<br />
44.86%<br />
State<br />
Target<br />
45.22%<br />
51.14%<br />
LEA<br />
Rate<br />
53.94%<br />
71.90%<br />
N<br />
N<br />
Target<br />
Met by<br />
LEA (Y/N)<br />
Y<br />
Y<br />
Page 1 of 5
LEA: 0401 - BENTONVILLE SCHOOL <strong>DISTRICT</strong><br />
Indicator 04: Out-of-School Suspensions and Expulsions (2009/10 school year)<br />
A) Suspension/Expulsion<br />
Percent difference of CWD with out-of- school suspensions and<br />
expulsions totaling greater than 10 days in a school year as<br />
compared to the same data for general education students in<br />
the district.<br />
B) Suspension/Expulsion by Race and Ethnicity<br />
Percent of districts that have: (a) a significant discrepancy, by race or<br />
ethnicity, in the rate of suspensions and expulsions of greater than 10<br />
days in a school year for children with IEPs; and (b) policies,<br />
procedures or practices that contribute to the significant discrepancy<br />
and do not comply with requirements relating to the development<br />
and implementation of IEPs, the use of positive behavioral<br />
interventions and supports, and procedural safeguards.<br />
Indicator 05: School Age (5-21) Least Restrictive Environment<br />
A) In the Regular Class 80% or more of the day<br />
Percent of CWD with<br />
IEPs receiving instruction<br />
in the regular class 80%<br />
or more of the day.<br />
State<br />
Rate<br />
State<br />
Target<br />
LEA<br />
Rate<br />
B) In the Regular Class less than 40% of the day<br />
Percent of CWD with<br />
IEPs receiving instruction<br />
in the regular class less<br />
than 60% of the day.<br />
53.87% 59.77%<br />
State<br />
Rate<br />
State<br />
Target<br />
12.42% 12.51%<br />
48.92%<br />
LEA<br />
Rate<br />
22.67%<br />
C) Other Settings outside the regular class<br />
Percent of CWD with IEPs served in<br />
public or private separate schools,<br />
residential placements, or<br />
homebound/hospital placements.<br />
State<br />
Rate<br />
State<br />
Target<br />
2.80% 2.56%<br />
Target Met<br />
by LEA (Y/N)<br />
N<br />
Target Met<br />
by LEA (Y/N)<br />
N<br />
LEA<br />
Rate<br />
2.16%<br />
Target Met<br />
by LEA(Y/N)<br />
Indicator 06: Early Childhood (3-5) Least Restrictive Environment<br />
A) Regular Early Childhood Program<br />
Percent of children (aged 3 through 5) with IEPs attending a regular<br />
early childhood program and receiving the majority of special<br />
education and related services in the regular early childhood program<br />
Allowable<br />
Difference<br />
LEA: 0401 - BENTONVILLE SCHOOL <strong>DISTRICT</strong><br />
Indicator 07: Preschool (3-5) Outcomes<br />
a) Percent of preschool CWD<br />
children who did not<br />
improve functioning.<br />
b) Percent of preschool CWD<br />
who improved but whose<br />
functioning remained below<br />
same age peers.<br />
c) Percent of preschool CWD<br />
who improved at a level<br />
nearer to same aged peers.<br />
d) Percent of preschool CWD<br />
who improved functioning to<br />
reach a level comparable to<br />
same age peers.<br />
e) Percent of preschool CWD<br />
children who maintain<br />
functioning at a level<br />
comparable to same aged<br />
peers.<br />
Summary<br />
Statements<br />
1) Of those preschool<br />
children who entered<br />
the preschool program<br />
below age expectations<br />
in each Outcome, the<br />
percent who<br />
substantially increased<br />
their rate of growth by<br />
the time they turned 6<br />
years of age or exited<br />
the program.<br />
2) The percent of<br />
preschool children who<br />
were functioning<br />
within age expectations<br />
in each Outcome by the<br />
time they turned 6<br />
years of age or exited<br />
A) Positive Social -Emotional<br />
Skills*<br />
State<br />
Rate<br />
A) Positive Social -<br />
Emotional Skills<br />
(Including social<br />
relationships)<br />
State<br />
Rate<br />
2.14%<br />
5.31%<br />
25.97%<br />
38.22%<br />
28.36%<br />
State<br />
Target<br />
LEA<br />
Rate<br />
LEA<br />
Rate<br />
5.13%<br />
20.51%<br />
38.46%<br />
7.69%<br />
28.21%<br />
Target<br />
Met by<br />
LEA(Y/N)<br />
B) Acquisition and Use of<br />
Knowledge and Skills<br />
(Including early language/<br />
communication and early literacy)<br />
B) Acquisition and Use of<br />
Knowledge and Skills **<br />
State<br />
Rate<br />
1.75%<br />
6.59%<br />
34.23%<br />
43.51%<br />
13.92%<br />
State<br />
Target<br />
LEA<br />
Rate<br />
Target<br />
Met by<br />
LEA(Y/N)<br />
C) Use of Appropriate Behaviors<br />
to Meet Their Needs<br />
State<br />
Rate<br />
State<br />
Target<br />
LEA<br />
Rate<br />
Target<br />
Met by<br />
LEA(Y/N)<br />
89.61% 90.50% 64.29% N 90.31% 90.50% 62.50% N 90.82% 92.50% 59.26% N<br />
66.58% 69.50% 35.90% N 57.43% 60.50% 35.90% N 76.69% 78.50% 46.15% N<br />
NOTE: * Including social relationships ** Including early language/ communication and early literacy<br />
Note: - - denotes not applicable<br />
State<br />
Rate<br />
LEA<br />
Rate<br />
7.69%<br />
23.08%<br />
33.33%<br />
17.95%<br />
17.95%<br />
C) Use of<br />
Appropriate<br />
Behaviors to<br />
Meet Their Needs<br />
State<br />
Rate<br />
4.51%<br />
17.34%<br />
41.72%<br />
34.97%<br />
LEA<br />
Rate<br />
1.46% 5.13%<br />
23.08%<br />
25.64%<br />
15.38%<br />
30.77%<br />
Page 3 of 5
LEA: 0401 - BENTONVILLE SCHOOL <strong>DISTRICT</strong><br />
Indicator 08: Parent Involvement<br />
Percent of surveyed<br />
parents who reported<br />
school facilitated parent<br />
involvement as a means<br />
of improving services<br />
and results for children<br />
with disabilities.<br />
Early Childhood<br />
(3-5)<br />
School Age<br />
(5-21)<br />
State<br />
Rate<br />
90.47%<br />
95.05%<br />
Indicator 09: Disproportionality - Eligibility<br />
Disproportionate representation of racial<br />
and ethnic groups in special education and<br />
related services that is a result of<br />
inappropriate identification (e.g.<br />
monitoring data, review of policies,<br />
practices, and procedures under 618(d),<br />
etc.).<br />
State<br />
Rate<br />
State<br />
Target<br />
88.00%<br />
96.00%<br />
State<br />
Target<br />
0.00% 0.00%<br />
LEA<br />
Rate<br />
83.08%<br />
94.29%<br />
Indicator 10: Disproportionality-Child with a Disability<br />
Disproportionate representation of racial<br />
and ethnic groups in specific disability<br />
categories that is a result of inappropriate<br />
identification (e.g. monitoring data, review<br />
of policies, practices, and procedures under<br />
618(d), etc.).<br />
Indicator 11: Child Find<br />
Percent of children with<br />
parental consent to evaluate<br />
who are evaluated within<br />
the State established timeline<br />
of 60 days.<br />
Overall<br />
(3-21)<br />
Early Childhood<br />
(3-5)<br />
School Age<br />
(5-21)<br />
State<br />
Rate<br />
0.00%<br />
Indicator 12: Early Childhood Transition<br />
Percent of children referred by Part C prior to<br />
age 3, who are found eligible for Part B, and<br />
who have an IEP developed and implemented<br />
by their third birthday.<br />
Note: - - denotes not applicable<br />
State<br />
Rate<br />
99.41%<br />
99.70%<br />
98.97%<br />
State<br />
Rate<br />
State<br />
Target<br />
0.00%<br />
State<br />
Target<br />
100.00%<br />
100.00%<br />
100.00%<br />
State<br />
Target<br />
Target Met by<br />
LEA (Y/N)<br />
Y<br />
Target Met by<br />
LEA (Y/N)<br />
Y<br />
LEA<br />
Rate<br />
100.00%<br />
100.00%<br />
100.00%<br />
LEA<br />
Rate<br />
Target Met by<br />
LEA (Y/N)<br />
N<br />
N<br />
Note: The target for Indicator 09 is to have zero percent<br />
(0%) of districts identified as having disproportionate<br />
representation as a result of inappropriate<br />
identification in eligibility.<br />
Note: The target for Indicator 10 is to have zero<br />
percent (0%) of districts identified as having<br />
disproportionate representation as a result of<br />
inappropriate identification in a disability<br />
category.<br />
Target Met by<br />
LEA (Y/N)<br />
Y<br />
Y<br />
Target Met<br />
by LEA<br />
(Y/N)<br />
99.21% 100.00% - - N/A<br />
Y<br />
Note: * Indicates a zero reponse rate for the<br />
district.<br />
Page 4 of 5
LEA: 0401 - BENTONVILLE SCHOOL <strong>DISTRICT</strong><br />
Indicator 13: Secondary Transition<br />
Percent of youth with disabilities aged 16 and<br />
up with an IEP that includes coordinated,<br />
measurable, annual IEP goals and transition<br />
services that will reasonably enable the student<br />
to meet the post-secondary goals.<br />
Indicator 14: Post-School Outcomes<br />
A. Percent of youth enrolled in higher<br />
education within one year of leaving high<br />
school.<br />
State<br />
Rate<br />
State<br />
Target<br />
Note: Data for this Indicator is from the on-site monitoring of LEAs for the given year.<br />
B. Percent of youth enrolled in higher<br />
education or competitively employed<br />
within one year of leaving high school.<br />
C. Percent of youth enrolled in higher<br />
education or in some other postsecondary<br />
education or training program; or<br />
competitively employed or in some other<br />
employment within one year of leaving<br />
high school.<br />
State<br />
Rate<br />
Indicator 20: Reported Data-Timely and Accurate*<br />
District submitted<br />
required data elements<br />
on or before due dates;<br />
made revisions within<br />
the alloted reveiw<br />
periods.<br />
Accurate and Timely<br />
Data Submission<br />
Overall (3-21)<br />
Early Childhood (3-5)<br />
School Age (5-21)<br />
State<br />
Target<br />
100.00%<br />
100.00%<br />
100.00%<br />
State<br />
Target<br />
LEA<br />
Rate<br />
LEA<br />
Rate<br />
Target Met by<br />
LEA (Y/N)<br />
Target Met<br />
by LEA<br />
(Y/N)<br />
Target Met<br />
by LEA<br />
(Y/N)<br />
*Data reviewed for timely and accurate submissions included all APSCN cycle data except for personnel<br />
Note: - - denotes not applicable<br />
96.19 100.00 — — N/A<br />
14.53<br />
State<br />
Rate<br />
49.42<br />
State<br />
Rate<br />
54.07<br />
13.00<br />
State<br />
Target<br />
49.00<br />
State<br />
Target<br />
60.00<br />
Y<br />
Y<br />
Y<br />
— —<br />
LEA<br />
Rate<br />
— —<br />
LEA<br />
Rate<br />
— —<br />
N/A<br />
Target Met<br />
by LEA<br />
(Y/N)<br />
N/A<br />
Target Met<br />
by LEA<br />
(Y/N)<br />
N/A<br />
Page 5 of 5
LEA: 0402 - DECATUR SCHOOL <strong>DISTRICT</strong><br />
<strong>ARKANSAS</strong> <strong>SPECIAL</strong> <strong>EDUCATION</strong><br />
<strong>DISTRICT</strong> <strong>ANNUAL</strong> PERFORMANCE REPORT<br />
2010/11 School Year<br />
Publication Date: March 2012<br />
Each State must have in place a State Performance Plan (SPP) to evaluate the State's efforts to meet the requirements and<br />
purposes of the implementation of the Individuals with Disabilities Education Act (IDEA). The SPP is a six-year plan, which<br />
describes Arkansas's performance on 20 indicators. The Office of Special Education Programs in the U. S. Department of<br />
Education requires that States report annually to the public on the performance of each local education agency (LEA) on 14 of<br />
20 indicators as compared with targets established by the State in the SPP. Arkansas will report indicators 1 through 14 and<br />
20 for each LEA serving children with disabilities (CWD). Any LEA not meeting targets on compliance indicators (0% for<br />
Indicators 4B, 09 & 10 and 100% for Indicators 11, 12, 13, and 20) are non-compliant with IDEA.<br />
There are no report changes for the 2010/11 school year profile; However, it is important to recognize that: .<br />
1. Indicator 01 (Graduation) is reported a year in arrear (2009/10 graduates) and is based on a four-year cohort. This<br />
means the rate is a measure of students who entered in ninth grade and graduate in four years. The calculation is a<br />
requirement under Title I of the Elementary and Secondary Education Act (ESEA).<br />
2. Indicator 02 (Drop out) is reported a year in arrear. This means the rate is a measure of students who dropped out in<br />
the 2009/10 school year. The Indicator 02 data are aligned with the Common Core of Data (CCD) requirements for<br />
grades 7-12.<br />
3. Indicator 04A and 4B (Suspension/Expulsion) is reported a year in arrear. This means the rate is a measure of<br />
students who had out-of-school suspensions and/or expulsions totaling more than 10 days.<br />
Percent of youth<br />
with IEPs<br />
graduating from<br />
high school with a<br />
regular diploma<br />
For a complete description of all the Indicators, please visit the special education website at<br />
http://arksped.k12.ar.us/sections/policy.html<br />
Indicator 01: Graduation Rates (2009/10 school year) Indicator 02: Dropout Rates (2009/10 school year)<br />
State<br />
Rate<br />
State<br />
Target<br />
75.76% 85.00%<br />
LEA<br />
Rate<br />
100.00%<br />
Target Met<br />
by LEA<br />
(Y/N)<br />
Y<br />
Percent of<br />
youth with<br />
IEPs dropping<br />
out of high<br />
school<br />
State<br />
Rate<br />
Indicator 03: Assessment on Statewide Benchmark Exam (grades 3-8, 11)<br />
A) Adequate Yearly Progress<br />
n=40<br />
Literacy<br />
Mathematics<br />
Met Disability Subgroup "n"<br />
for Reporting Purposes (Y/N)<br />
State Target for % of Districts Meeting<br />
AYP for Disability Subgroup<br />
State<br />
Target<br />
3.06% 4.20%<br />
LEA<br />
Rate<br />
5.00%<br />
% of Districts Meeting AYP<br />
for Disability Subgroup<br />
Target Met by<br />
LEA (Y/N)<br />
N<br />
Target Met by<br />
LEA(Y/N)<br />
Overall N 17.15% 6.25%<br />
NA<br />
N<br />
N<br />
Note: For a district to qualify as having a disability subgroup it must have a minimum of 40 (n=40) students with disabilities in a school building.<br />
B) Participation<br />
Participation Rate: # of<br />
CWD Tested ÷ # of CWD<br />
Enrolled in grades tested.<br />
Participation Rate: Literacy<br />
Participation Rate: Math<br />
Note: - - denotes not applicable<br />
State<br />
Rate<br />
98.78%<br />
State<br />
Target<br />
95.00%<br />
LEA<br />
Rate<br />
100.00%<br />
Target Met<br />
by LEA (Y/N)<br />
98.61% 95.00% 100.00% Y<br />
Y<br />
C) Performance Proficiency<br />
Percent of CWD Scoring<br />
Proficient or Above<br />
Proficiency Rate: Literacy<br />
Proficiency Rate:<br />
Mathematics<br />
16.00%<br />
16.00%<br />
State<br />
Rate<br />
31.49%<br />
44.86%<br />
State<br />
Target<br />
45.22%<br />
51.14%<br />
LEA<br />
Rate<br />
45.16%<br />
48.39%<br />
NA<br />
NA<br />
Target<br />
Met by<br />
LEA (Y/N)<br />
N<br />
N<br />
Page 1 of 5
LEA: 0402 - DECATUR SCHOOL <strong>DISTRICT</strong><br />
Indicator 04: Out-of-School Suspensions and Expulsions (2009/10 school year)<br />
A) Suspension/Expulsion<br />
Percent difference of CWD with out-of- school suspensions and<br />
expulsions totaling greater than 10 days in a school year as<br />
compared to the same data for general education students in<br />
the district.<br />
B) Suspension/Expulsion by Race and Ethnicity<br />
Percent of districts that have: (a) a significant discrepancy, by race or<br />
ethnicity, in the rate of suspensions and expulsions of greater than 10<br />
days in a school year for children with IEPs; and (b) policies,<br />
procedures or practices that contribute to the significant discrepancy<br />
and do not comply with requirements relating to the development<br />
and implementation of IEPs, the use of positive behavioral<br />
interventions and supports, and procedural safeguards.<br />
Indicator 05: School Age (5-21) Least Restrictive Environment<br />
A) In the Regular Class 80% or more of the day<br />
Percent of CWD with<br />
IEPs receiving instruction<br />
in the regular class 80%<br />
or more of the day.<br />
State<br />
Rate<br />
State<br />
Target<br />
LEA<br />
Rate<br />
B) In the Regular Class less than 40% of the day<br />
Percent of CWD with<br />
IEPs receiving instruction<br />
in the regular class less<br />
than 60% of the day.<br />
53.87% 59.77%<br />
State<br />
Rate<br />
State<br />
Target<br />
12.42% 12.51%<br />
61.67%<br />
LEA<br />
Rate<br />
5.00%<br />
C) Other Settings outside the regular class<br />
Percent of CWD with IEPs served in<br />
public or private separate schools,<br />
residential placements, or<br />
homebound/hospital placements.<br />
State<br />
Rate<br />
State<br />
Target<br />
2.80% 2.56%<br />
Target Met<br />
by LEA (Y/N)<br />
Y<br />
Target Met<br />
by LEA (Y/N)<br />
Y<br />
LEA<br />
Rate<br />
3.33%<br />
Target Met<br />
by LEA(Y/N)<br />
Indicator 06: Early Childhood (3-5) Least Restrictive Environment<br />
A) Regular Early Childhood Program<br />
Percent of children (aged 3 through 5) with IEPs attending a regular<br />
early childhood program and receiving the majority of special<br />
education and related services in the regular early childhood program<br />
Allowable<br />
Difference<br />
LEA: 0402 - DECATUR SCHOOL <strong>DISTRICT</strong><br />
Indicator 07: Preschool (3-5) Outcomes<br />
a) Percent of preschool CWD<br />
children who did not<br />
improve functioning.<br />
b) Percent of preschool CWD<br />
who improved but whose<br />
functioning remained below<br />
same age peers.<br />
c) Percent of preschool CWD<br />
who improved at a level<br />
nearer to same aged peers.<br />
d) Percent of preschool CWD<br />
who improved functioning to<br />
reach a level comparable to<br />
same age peers.<br />
e) Percent of preschool CWD<br />
children who maintain<br />
functioning at a level<br />
comparable to same aged<br />
peers.<br />
Summary<br />
Statements<br />
1) Of those preschool<br />
children who entered<br />
the preschool program<br />
below age expectations<br />
in each Outcome, the<br />
percent who<br />
substantially increased<br />
their rate of growth by<br />
the time they turned 6<br />
years of age or exited<br />
the program.<br />
2) The percent of<br />
preschool children who<br />
were functioning<br />
within age expectations<br />
in each Outcome by the<br />
time they turned 6<br />
years of age or exited<br />
A) Positive Social -Emotional<br />
Skills*<br />
State<br />
Rate<br />
A) Positive Social -<br />
Emotional Skills<br />
(Including social<br />
relationships)<br />
State<br />
Rate<br />
2.14%<br />
5.31%<br />
25.97%<br />
38.22%<br />
28.36%<br />
State<br />
Target<br />
LEA<br />
Rate<br />
LEA<br />
Rate<br />
— —<br />
— —<br />
— —<br />
— —<br />
— —<br />
Target<br />
Met by<br />
LEA(Y/N)<br />
B) Acquisition and Use of<br />
Knowledge and Skills<br />
(Including early language/<br />
communication and early literacy)<br />
B) Acquisition and Use of<br />
Knowledge and Skills **<br />
State<br />
Rate<br />
1.75%<br />
6.59%<br />
34.23%<br />
43.51%<br />
13.92%<br />
State<br />
Target<br />
LEA<br />
Rate<br />
Target<br />
Met by<br />
LEA(Y/N)<br />
C) Use of Appropriate Behaviors<br />
to Meet Their Needs<br />
State<br />
Rate<br />
State<br />
Target<br />
LEA<br />
Rate<br />
Target<br />
Met by<br />
LEA(Y/N)<br />
89.61% 90.50% — — N/A 90.31% 90.50% — — N/A 90.82% 92.50% — — N/A<br />
66.58% 69.50% — — N/A 57.43% 60.50% — — N/A 76.69% 78.50% — — N/A<br />
NOTE: * Including social relationships ** Including early language/ communication and early literacy<br />
Note: - - denotes not applicable<br />
State<br />
Rate<br />
LEA<br />
Rate<br />
— —<br />
— —<br />
— —<br />
— —<br />
— —<br />
C) Use of<br />
Appropriate<br />
Behaviors to<br />
Meet Their Needs<br />
State<br />
Rate<br />
4.51%<br />
17.34%<br />
41.72%<br />
34.97%<br />
LEA<br />
Rate<br />
1.46% — —<br />
— —<br />
— —<br />
— —<br />
— —<br />
Page 3 of 5
LEA: 0402 - DECATUR SCHOOL <strong>DISTRICT</strong><br />
Indicator 08: Parent Involvement<br />
Percent of surveyed<br />
parents who reported<br />
school facilitated parent<br />
involvement as a means<br />
of improving services<br />
and results for children<br />
with disabilities.<br />
Early Childhood<br />
(3-5)<br />
School Age<br />
(5-21)<br />
State<br />
Rate<br />
90.47%<br />
95.05%<br />
Indicator 09: Disproportionality - Eligibility<br />
Disproportionate representation of racial<br />
and ethnic groups in special education and<br />
related services that is a result of<br />
inappropriate identification (e.g.<br />
monitoring data, review of policies,<br />
practices, and procedures under 618(d),<br />
etc.).<br />
State<br />
Rate<br />
State<br />
Target<br />
88.00%<br />
96.00%<br />
State<br />
Target<br />
0.00% 0.00%<br />
LEA<br />
Rate<br />
— —<br />
100.00%<br />
Indicator 10: Disproportionality-Child with a Disability<br />
Disproportionate representation of racial<br />
and ethnic groups in specific disability<br />
categories that is a result of inappropriate<br />
identification (e.g. monitoring data, review<br />
of policies, practices, and procedures under<br />
618(d), etc.).<br />
Indicator 11: Child Find<br />
Percent of children with<br />
parental consent to evaluate<br />
who are evaluated within<br />
the State established timeline<br />
of 60 days.<br />
Overall<br />
(3-21)<br />
Early Childhood<br />
(3-5)<br />
School Age<br />
(5-21)<br />
State<br />
Rate<br />
0.00%<br />
Indicator 12: Early Childhood Transition<br />
Percent of children referred by Part C prior to<br />
age 3, who are found eligible for Part B, and<br />
who have an IEP developed and implemented<br />
by their third birthday.<br />
Note: - - denotes not applicable<br />
State<br />
Rate<br />
99.41%<br />
99.70%<br />
98.97%<br />
State<br />
Rate<br />
State<br />
Target<br />
0.00%<br />
State<br />
Target<br />
100.00%<br />
100.00%<br />
100.00%<br />
State<br />
Target<br />
Target Met by<br />
LEA (Y/N)<br />
Y<br />
Target Met by<br />
LEA (Y/N)<br />
Y<br />
LEA<br />
Rate<br />
100.00%<br />
— —<br />
100.00%<br />
LEA<br />
Rate<br />
Target Met by<br />
LEA (Y/N)<br />
N/A<br />
Y<br />
Note: The target for Indicator 09 is to have zero percent<br />
(0%) of districts identified as having disproportionate<br />
representation as a result of inappropriate<br />
identification in eligibility.<br />
Note: The target for Indicator 10 is to have zero<br />
percent (0%) of districts identified as having<br />
disproportionate representation as a result of<br />
inappropriate identification in a disability<br />
category.<br />
Target Met by<br />
LEA (Y/N)<br />
N/A<br />
Y<br />
Target Met<br />
by LEA<br />
(Y/N)<br />
99.21% 100.00% - - N/A<br />
Y<br />
Note: * Indicates a zero reponse rate for the<br />
district.<br />
Page 4 of 5
LEA: 0402 - DECATUR SCHOOL <strong>DISTRICT</strong><br />
Indicator 13: Secondary Transition<br />
Percent of youth with disabilities aged 16 and<br />
up with an IEP that includes coordinated,<br />
measurable, annual IEP goals and transition<br />
services that will reasonably enable the student<br />
to meet the post-secondary goals.<br />
Indicator 14: Post-School Outcomes<br />
A. Percent of youth enrolled in higher<br />
education within one year of leaving high<br />
school.<br />
State<br />
Rate<br />
State<br />
Target<br />
Note: Data for this Indicator is from the on-site monitoring of LEAs for the given year.<br />
B. Percent of youth enrolled in higher<br />
education or competitively employed<br />
within one year of leaving high school.<br />
C. Percent of youth enrolled in higher<br />
education or in some other postsecondary<br />
education or training program; or<br />
competitively employed or in some other<br />
employment within one year of leaving<br />
high school.<br />
State<br />
Rate<br />
Indicator 20: Reported Data-Timely and Accurate*<br />
District submitted<br />
required data elements<br />
on or before due dates;<br />
made revisions within<br />
the alloted reveiw<br />
periods.<br />
Accurate and Timely<br />
Data Submission<br />
Overall (3-21)<br />
Early Childhood (3-5)<br />
School Age (5-21)<br />
State<br />
Target<br />
100.00%<br />
100.00%<br />
100.00%<br />
State<br />
Target<br />
LEA<br />
Rate<br />
LEA<br />
Rate<br />
Target Met by<br />
LEA (Y/N)<br />
Target Met<br />
by LEA<br />
(Y/N)<br />
Target Met<br />
by LEA<br />
(Y/N)<br />
*Data reviewed for timely and accurate submissions included all APSCN cycle data except for personnel<br />
Note: - - denotes not applicable<br />
96.19 100.00 — — N/A<br />
14.53<br />
State<br />
Rate<br />
49.42<br />
State<br />
Rate<br />
54.07<br />
13.00<br />
State<br />
Target<br />
49.00<br />
State<br />
Target<br />
60.00<br />
Y<br />
N/A<br />
Y<br />
— —<br />
LEA<br />
Rate<br />
— —<br />
LEA<br />
Rate<br />
— —<br />
N/A<br />
Target Met<br />
by LEA<br />
(Y/N)<br />
N/A<br />
Target Met<br />
by LEA<br />
(Y/N)<br />
N/A<br />
Page 5 of 5
LEA: 0403 - GENTRY SCHOOL <strong>DISTRICT</strong><br />
<strong>ARKANSAS</strong> <strong>SPECIAL</strong> <strong>EDUCATION</strong><br />
<strong>DISTRICT</strong> <strong>ANNUAL</strong> PERFORMANCE REPORT<br />
2010/11 School Year<br />
Publication Date: March 2012<br />
Each State must have in place a State Performance Plan (SPP) to evaluate the State's efforts to meet the requirements and<br />
purposes of the implementation of the Individuals with Disabilities Education Act (IDEA). The SPP is a six-year plan, which<br />
describes Arkansas's performance on 20 indicators. The Office of Special Education Programs in the U. S. Department of<br />
Education requires that States report annually to the public on the performance of each local education agency (LEA) on 14 of<br />
20 indicators as compared with targets established by the State in the SPP. Arkansas will report indicators 1 through 14 and<br />
20 for each LEA serving children with disabilities (CWD). Any LEA not meeting targets on compliance indicators (0% for<br />
Indicators 4B, 09 & 10 and 100% for Indicators 11, 12, 13, and 20) are non-compliant with IDEA.<br />
There are no report changes for the 2010/11 school year profile; However, it is important to recognize that: .<br />
1. Indicator 01 (Graduation) is reported a year in arrear (2009/10 graduates) and is based on a four-year cohort. This<br />
means the rate is a measure of students who entered in ninth grade and graduate in four years. The calculation is a<br />
requirement under Title I of the Elementary and Secondary Education Act (ESEA).<br />
2. Indicator 02 (Drop out) is reported a year in arrear. This means the rate is a measure of students who dropped out in<br />
the 2009/10 school year. The Indicator 02 data are aligned with the Common Core of Data (CCD) requirements for<br />
grades 7-12.<br />
3. Indicator 04A and 4B (Suspension/Expulsion) is reported a year in arrear. This means the rate is a measure of<br />
students who had out-of-school suspensions and/or expulsions totaling more than 10 days.<br />
Percent of youth<br />
with IEPs<br />
graduating from<br />
high school with a<br />
regular diploma<br />
For a complete description of all the Indicators, please visit the special education website at<br />
http://arksped.k12.ar.us/sections/policy.html<br />
Indicator 01: Graduation Rates (2009/10 school year) Indicator 02: Dropout Rates (2009/10 school year)<br />
State<br />
Rate<br />
State<br />
Target<br />
75.76% 85.00%<br />
LEA<br />
Rate<br />
90.00%<br />
Target Met<br />
by LEA<br />
(Y/N)<br />
Y<br />
Percent of<br />
youth with<br />
IEPs dropping<br />
out of high<br />
school<br />
State<br />
Rate<br />
Indicator 03: Assessment on Statewide Benchmark Exam (grades 3-8, 11)<br />
A) Adequate Yearly Progress<br />
n=40<br />
Literacy<br />
Mathematics<br />
Met Disability Subgroup "n"<br />
for Reporting Purposes (Y/N)<br />
State Target for % of Districts Meeting<br />
AYP for Disability Subgroup<br />
State<br />
Target<br />
3.06% 4.20%<br />
LEA<br />
Rate<br />
1.82%<br />
% of Districts Meeting AYP<br />
for Disability Subgroup<br />
Target Met by<br />
LEA (Y/N)<br />
Y<br />
Target Met by<br />
LEA(Y/N)<br />
Overall N 17.15% 6.25%<br />
NA<br />
N<br />
N<br />
Note: For a district to qualify as having a disability subgroup it must have a minimum of 40 (n=40) students with disabilities in a school building.<br />
B) Participation<br />
Participation Rate: # of<br />
CWD Tested ÷ # of CWD<br />
Enrolled in grades tested.<br />
Participation Rate: Literacy<br />
Participation Rate: Math<br />
Note: - - denotes not applicable<br />
State<br />
Rate<br />
98.78%<br />
State<br />
Target<br />
95.00%<br />
LEA<br />
Rate<br />
98.97%<br />
Target Met<br />
by LEA (Y/N)<br />
98.61% 95.00% 98.02% Y<br />
Y<br />
C) Performance Proficiency<br />
Percent of CWD Scoring<br />
Proficient or Above<br />
Proficiency Rate: Literacy<br />
Proficiency Rate:<br />
Mathematics<br />
16.00%<br />
16.00%<br />
State<br />
Rate<br />
31.49%<br />
44.86%<br />
State<br />
Target<br />
45.22%<br />
51.14%<br />
LEA<br />
Rate<br />
36.84%<br />
43.88%<br />
NA<br />
NA<br />
Target<br />
Met by<br />
LEA (Y/N)<br />
N<br />
N<br />
Page 1 of 5
LEA: 0403 - GENTRY SCHOOL <strong>DISTRICT</strong><br />
Indicator 04: Out-of-School Suspensions and Expulsions (2009/10 school year)<br />
A) Suspension/Expulsion<br />
Percent difference of CWD with out-of- school suspensions and<br />
expulsions totaling greater than 10 days in a school year as<br />
compared to the same data for general education students in<br />
the district.<br />
B) Suspension/Expulsion by Race and Ethnicity<br />
Percent of districts that have: (a) a significant discrepancy, by race or<br />
ethnicity, in the rate of suspensions and expulsions of greater than 10<br />
days in a school year for children with IEPs; and (b) policies,<br />
procedures or practices that contribute to the significant discrepancy<br />
and do not comply with requirements relating to the development<br />
and implementation of IEPs, the use of positive behavioral<br />
interventions and supports, and procedural safeguards.<br />
Indicator 05: School Age (5-21) Least Restrictive Environment<br />
A) In the Regular Class 80% or more of the day<br />
Percent of CWD with<br />
IEPs receiving instruction<br />
in the regular class 80%<br />
or more of the day.<br />
State<br />
Rate<br />
State<br />
Target<br />
LEA<br />
Rate<br />
B) In the Regular Class less than 40% of the day<br />
Percent of CWD with<br />
IEPs receiving instruction<br />
in the regular class less<br />
than 60% of the day.<br />
53.87% 59.77%<br />
State<br />
Rate<br />
State<br />
Target<br />
12.42% 12.51%<br />
64.15%<br />
LEA<br />
Rate<br />
5.03%<br />
C) Other Settings outside the regular class<br />
Percent of CWD with IEPs served in<br />
public or private separate schools,<br />
residential placements, or<br />
homebound/hospital placements.<br />
State<br />
Rate<br />
State<br />
Target<br />
2.80% 2.56%<br />
Target Met<br />
by LEA (Y/N)<br />
Y<br />
Target Met<br />
by LEA (Y/N)<br />
Y<br />
LEA<br />
Rate<br />
1.26%<br />
Target Met<br />
by LEA(Y/N)<br />
Indicator 06: Early Childhood (3-5) Least Restrictive Environment<br />
A) Regular Early Childhood Program<br />
Percent of children (aged 3 through 5) with IEPs attending a regular<br />
early childhood program and receiving the majority of special<br />
education and related services in the regular early childhood program<br />
Allowable<br />
Difference<br />
LEA: 0403 - GENTRY SCHOOL <strong>DISTRICT</strong><br />
Indicator 07: Preschool (3-5) Outcomes<br />
a) Percent of preschool CWD<br />
children who did not<br />
improve functioning.<br />
b) Percent of preschool CWD<br />
who improved but whose<br />
functioning remained below<br />
same age peers.<br />
c) Percent of preschool CWD<br />
who improved at a level<br />
nearer to same aged peers.<br />
d) Percent of preschool CWD<br />
who improved functioning to<br />
reach a level comparable to<br />
same age peers.<br />
e) Percent of preschool CWD<br />
children who maintain<br />
functioning at a level<br />
comparable to same aged<br />
peers.<br />
Summary<br />
Statements<br />
1) Of those preschool<br />
children who entered<br />
the preschool program<br />
below age expectations<br />
in each Outcome, the<br />
percent who<br />
substantially increased<br />
their rate of growth by<br />
the time they turned 6<br />
years of age or exited<br />
the program.<br />
2) The percent of<br />
preschool children who<br />
were functioning<br />
within age expectations<br />
in each Outcome by the<br />
time they turned 6<br />
years of age or exited<br />
A) Positive Social -Emotional<br />
Skills*<br />
State<br />
Rate<br />
A) Positive Social -<br />
Emotional Skills<br />
(Including social<br />
relationships)<br />
State<br />
Rate<br />
2.14%<br />
5.31%<br />
25.97%<br />
38.22%<br />
28.36%<br />
State<br />
Target<br />
LEA<br />
Rate<br />
LEA<br />
Rate<br />
— —<br />
— —<br />
— —<br />
— —<br />
— —<br />
Target<br />
Met by<br />
LEA(Y/N)<br />
B) Acquisition and Use of<br />
Knowledge and Skills<br />
(Including early language/<br />
communication and early literacy)<br />
B) Acquisition and Use of<br />
Knowledge and Skills **<br />
State<br />
Rate<br />
1.75%<br />
6.59%<br />
34.23%<br />
43.51%<br />
13.92%<br />
State<br />
Target<br />
LEA<br />
Rate<br />
Target<br />
Met by<br />
LEA(Y/N)<br />
C) Use of Appropriate Behaviors<br />
to Meet Their Needs<br />
State<br />
Rate<br />
State<br />
Target<br />
LEA<br />
Rate<br />
Target<br />
Met by<br />
LEA(Y/N)<br />
89.61% 90.50% — — N/A 90.31% 90.50% — — N/A 90.82% 92.50% — — N/A<br />
66.58% 69.50% — — N/A 57.43% 60.50% — — N/A 76.69% 78.50% — — N/A<br />
NOTE: * Including social relationships ** Including early language/ communication and early literacy<br />
Note: - - denotes not applicable<br />
State<br />
Rate<br />
LEA<br />
Rate<br />
— —<br />
— —<br />
— —<br />
— —<br />
— —<br />
C) Use of<br />
Appropriate<br />
Behaviors to<br />
Meet Their Needs<br />
State<br />
Rate<br />
4.51%<br />
17.34%<br />
41.72%<br />
34.97%<br />
LEA<br />
Rate<br />
1.46% — —<br />
— —<br />
— —<br />
— —<br />
— —<br />
Page 3 of 5
LEA: 0403 - GENTRY SCHOOL <strong>DISTRICT</strong><br />
Indicator 08: Parent Involvement<br />
Percent of surveyed<br />
parents who reported<br />
school facilitated parent<br />
involvement as a means<br />
of improving services<br />
and results for children<br />
with disabilities.<br />
Early Childhood<br />
(3-5)<br />
School Age<br />
(5-21)<br />
State<br />
Rate<br />
90.47%<br />
95.05%<br />
Indicator 09: Disproportionality - Eligibility<br />
Disproportionate representation of racial<br />
and ethnic groups in special education and<br />
related services that is a result of<br />
inappropriate identification (e.g.<br />
monitoring data, review of policies,<br />
practices, and procedures under 618(d),<br />
etc.).<br />
State<br />
Rate<br />
State<br />
Target<br />
88.00%<br />
96.00%<br />
State<br />
Target<br />
0.00% 0.00%<br />
LEA<br />
Rate<br />
— —<br />
94.34%<br />
Indicator 10: Disproportionality-Child with a Disability<br />
Disproportionate representation of racial<br />
and ethnic groups in specific disability<br />
categories that is a result of inappropriate<br />
identification (e.g. monitoring data, review<br />
of policies, practices, and procedures under<br />
618(d), etc.).<br />
Indicator 11: Child Find<br />
Percent of children with<br />
parental consent to evaluate<br />
who are evaluated within<br />
the State established timeline<br />
of 60 days.<br />
Overall<br />
(3-21)<br />
Early Childhood<br />
(3-5)<br />
School Age<br />
(5-21)<br />
State<br />
Rate<br />
0.00%<br />
Indicator 12: Early Childhood Transition<br />
Percent of children referred by Part C prior to<br />
age 3, who are found eligible for Part B, and<br />
who have an IEP developed and implemented<br />
by their third birthday.<br />
Note: - - denotes not applicable<br />
State<br />
Rate<br />
99.41%<br />
99.70%<br />
98.97%<br />
State<br />
Rate<br />
State<br />
Target<br />
0.00%<br />
State<br />
Target<br />
100.00%<br />
100.00%<br />
100.00%<br />
State<br />
Target<br />
Target Met by<br />
LEA (Y/N)<br />
Y<br />
Target Met by<br />
LEA (Y/N)<br />
Y<br />
LEA<br />
Rate<br />
100.00%<br />
— —<br />
100.00%<br />
LEA<br />
Rate<br />
Target Met by<br />
LEA (Y/N)<br />
N/A<br />
N<br />
Note: The target for Indicator 09 is to have zero percent<br />
(0%) of districts identified as having disproportionate<br />
representation as a result of inappropriate<br />
identification in eligibility.<br />
Note: The target for Indicator 10 is to have zero<br />
percent (0%) of districts identified as having<br />
disproportionate representation as a result of<br />
inappropriate identification in a disability<br />
category.<br />
Target Met by<br />
LEA (Y/N)<br />
N/A<br />
Y<br />
Target Met<br />
by LEA<br />
(Y/N)<br />
99.21% 100.00% - - N/A<br />
Y<br />
Note: * Indicates a zero reponse rate for the<br />
district.<br />
Page 4 of 5
LEA: 0403 - GENTRY SCHOOL <strong>DISTRICT</strong><br />
Indicator 13: Secondary Transition<br />
Percent of youth with disabilities aged 16 and<br />
up with an IEP that includes coordinated,<br />
measurable, annual IEP goals and transition<br />
services that will reasonably enable the student<br />
to meet the post-secondary goals.<br />
Indicator 14: Post-School Outcomes<br />
A. Percent of youth enrolled in higher<br />
education within one year of leaving high<br />
school.<br />
State<br />
Rate<br />
State<br />
Target<br />
Note: Data for this Indicator is from the on-site monitoring of LEAs for the given year.<br />
B. Percent of youth enrolled in higher<br />
education or competitively employed<br />
within one year of leaving high school.<br />
C. Percent of youth enrolled in higher<br />
education or in some other postsecondary<br />
education or training program; or<br />
competitively employed or in some other<br />
employment within one year of leaving<br />
high school.<br />
State<br />
Rate<br />
Indicator 20: Reported Data-Timely and Accurate*<br />
District submitted<br />
required data elements<br />
on or before due dates;<br />
made revisions within<br />
the alloted reveiw<br />
periods.<br />
Accurate and Timely<br />
Data Submission<br />
Overall (3-21)<br />
Early Childhood (3-5)<br />
School Age (5-21)<br />
State<br />
Target<br />
100.00%<br />
100.00%<br />
100.00%<br />
State<br />
Target<br />
LEA<br />
Rate<br />
LEA<br />
Rate<br />
Target Met by<br />
LEA (Y/N)<br />
Target Met<br />
by LEA<br />
(Y/N)<br />
Target Met<br />
by LEA<br />
(Y/N)<br />
*Data reviewed for timely and accurate submissions included all APSCN cycle data except for personnel<br />
Note: - - denotes not applicable<br />
96.19 100.00 — — N/A<br />
14.53<br />
State<br />
Rate<br />
49.42<br />
State<br />
Rate<br />
54.07<br />
13.00<br />
State<br />
Target<br />
49.00<br />
State<br />
Target<br />
60.00<br />
Y<br />
N/A<br />
Y<br />
0.00%<br />
LEA<br />
Rate<br />
100.00%<br />
LEA<br />
Rate<br />
100.00%<br />
N<br />
Target Met<br />
by LEA<br />
(Y/N)<br />
Y<br />
Target Met<br />
by LEA<br />
(Y/N)<br />
Y<br />
Page 5 of 5
LEA: 0404 - GRAVETTE SCHOOL <strong>DISTRICT</strong><br />
<strong>ARKANSAS</strong> <strong>SPECIAL</strong> <strong>EDUCATION</strong><br />
<strong>DISTRICT</strong> <strong>ANNUAL</strong> PERFORMANCE REPORT<br />
2010/11 School Year<br />
Publication Date: March 2012<br />
Each State must have in place a State Performance Plan (SPP) to evaluate the State's efforts to meet the requirements and<br />
purposes of the implementation of the Individuals with Disabilities Education Act (IDEA). The SPP is a six-year plan, which<br />
describes Arkansas's performance on 20 indicators. The Office of Special Education Programs in the U. S. Department of<br />
Education requires that States report annually to the public on the performance of each local education agency (LEA) on 14 of<br />
20 indicators as compared with targets established by the State in the SPP. Arkansas will report indicators 1 through 14 and<br />
20 for each LEA serving children with disabilities (CWD). Any LEA not meeting targets on compliance indicators (0% for<br />
Indicators 4B, 09 & 10 and 100% for Indicators 11, 12, 13, and 20) are non-compliant with IDEA.<br />
There are no report changes for the 2010/11 school year profile; However, it is important to recognize that: .<br />
1. Indicator 01 (Graduation) is reported a year in arrear (2009/10 graduates) and is based on a four-year cohort. This<br />
means the rate is a measure of students who entered in ninth grade and graduate in four years. The calculation is a<br />
requirement under Title I of the Elementary and Secondary Education Act (ESEA).<br />
2. Indicator 02 (Drop out) is reported a year in arrear. This means the rate is a measure of students who dropped out in<br />
the 2009/10 school year. The Indicator 02 data are aligned with the Common Core of Data (CCD) requirements for<br />
grades 7-12.<br />
3. Indicator 04A and 4B (Suspension/Expulsion) is reported a year in arrear. This means the rate is a measure of<br />
students who had out-of-school suspensions and/or expulsions totaling more than 10 days.<br />
Percent of youth<br />
with IEPs<br />
graduating from<br />
high school with a<br />
regular diploma<br />
For a complete description of all the Indicators, please visit the special education website at<br />
http://arksped.k12.ar.us/sections/policy.html<br />
Indicator 01: Graduation Rates (2009/10 school year) Indicator 02: Dropout Rates (2009/10 school year)<br />
State<br />
Rate<br />
State<br />
Target<br />
75.76% 85.00%<br />
LEA<br />
Rate<br />
76.92%<br />
Target Met<br />
by LEA<br />
(Y/N)<br />
N<br />
Percent of<br />
youth with<br />
IEPs dropping<br />
out of high<br />
school<br />
State<br />
Rate<br />
Indicator 03: Assessment on Statewide Benchmark Exam (grades 3-8, 11)<br />
A) Adequate Yearly Progress<br />
n=40<br />
Literacy<br />
Mathematics<br />
Met Disability Subgroup "n"<br />
for Reporting Purposes (Y/N)<br />
State Target for % of Districts Meeting<br />
AYP for Disability Subgroup<br />
State<br />
Target<br />
3.06% 4.20%<br />
LEA<br />
Rate<br />
1.20%<br />
% of Districts Meeting AYP<br />
for Disability Subgroup<br />
Target Met by<br />
LEA (Y/N)<br />
Y<br />
Target Met by<br />
LEA(Y/N)<br />
Overall N 17.15% 6.25%<br />
NA<br />
N<br />
N<br />
Note: For a district to qualify as having a disability subgroup it must have a minimum of 40 (n=40) students with disabilities in a school building.<br />
B) Participation<br />
Participation Rate: # of<br />
CWD Tested ÷ # of CWD<br />
Enrolled in grades tested.<br />
Participation Rate: Literacy<br />
Participation Rate: Math<br />
Note: - - denotes not applicable<br />
State<br />
Rate<br />
98.78%<br />
State<br />
Target<br />
95.00%<br />
LEA<br />
Rate<br />
99.00%<br />
Target Met<br />
by LEA (Y/N)<br />
98.61% 95.00% 96.36% Y<br />
Y<br />
C) Performance Proficiency<br />
Percent of CWD Scoring<br />
Proficient or Above<br />
Proficiency Rate: Literacy<br />
Proficiency Rate:<br />
Mathematics<br />
16.00%<br />
16.00%<br />
State<br />
Rate<br />
31.49%<br />
44.86%<br />
State<br />
Target<br />
45.22%<br />
51.14%<br />
LEA<br />
Rate<br />
32.26%<br />
48.04%<br />
NA<br />
NA<br />
Target<br />
Met by<br />
LEA (Y/N)<br />
N<br />
N<br />
Page 1 of 5
LEA: 0404 - GRAVETTE SCHOOL <strong>DISTRICT</strong><br />
Indicator 04: Out-of-School Suspensions and Expulsions (2009/10 school year)<br />
A) Suspension/Expulsion<br />
Percent difference of CWD with out-of- school suspensions and<br />
expulsions totaling greater than 10 days in a school year as<br />
compared to the same data for general education students in<br />
the district.<br />
B) Suspension/Expulsion by Race and Ethnicity<br />
Percent of districts that have: (a) a significant discrepancy, by race or<br />
ethnicity, in the rate of suspensions and expulsions of greater than 10<br />
days in a school year for children with IEPs; and (b) policies,<br />
procedures or practices that contribute to the significant discrepancy<br />
and do not comply with requirements relating to the development<br />
and implementation of IEPs, the use of positive behavioral<br />
interventions and supports, and procedural safeguards.<br />
Indicator 05: School Age (5-21) Least Restrictive Environment<br />
A) In the Regular Class 80% or more of the day<br />
Percent of CWD with<br />
IEPs receiving instruction<br />
in the regular class 80%<br />
or more of the day.<br />
State<br />
Rate<br />
State<br />
Target<br />
LEA<br />
Rate<br />
B) In the Regular Class less than 40% of the day<br />
Percent of CWD with<br />
IEPs receiving instruction<br />
in the regular class less<br />
than 60% of the day.<br />
53.87% 59.77%<br />
State<br />
Rate<br />
State<br />
Target<br />
12.42% 12.51%<br />
58.91%<br />
LEA<br />
Rate<br />
9.41%<br />
C) Other Settings outside the regular class<br />
Percent of CWD with IEPs served in<br />
public or private separate schools,<br />
residential placements, or<br />
homebound/hospital placements.<br />
State<br />
Rate<br />
State<br />
Target<br />
2.80% 2.56%<br />
Target Met<br />
by LEA (Y/N)<br />
N<br />
Target Met<br />
by LEA (Y/N)<br />
Y<br />
LEA<br />
Rate<br />
0.99%<br />
Target Met<br />
by LEA(Y/N)<br />
Indicator 06: Early Childhood (3-5) Least Restrictive Environment<br />
A) Regular Early Childhood Program<br />
Percent of children (aged 3 through 5) with IEPs attending a regular<br />
early childhood program and receiving the majority of special<br />
education and related services in the regular early childhood program<br />
Allowable<br />
Difference<br />
LEA: 0404 - GRAVETTE SCHOOL <strong>DISTRICT</strong><br />
Indicator 07: Preschool (3-5) Outcomes<br />
a) Percent of preschool CWD<br />
children who did not<br />
improve functioning.<br />
b) Percent of preschool CWD<br />
who improved but whose<br />
functioning remained below<br />
same age peers.<br />
c) Percent of preschool CWD<br />
who improved at a level<br />
nearer to same aged peers.<br />
d) Percent of preschool CWD<br />
who improved functioning to<br />
reach a level comparable to<br />
same age peers.<br />
e) Percent of preschool CWD<br />
children who maintain<br />
functioning at a level<br />
comparable to same aged<br />
peers.<br />
Summary<br />
Statements<br />
1) Of those preschool<br />
children who entered<br />
the preschool program<br />
below age expectations<br />
in each Outcome, the<br />
percent who<br />
substantially increased<br />
their rate of growth by<br />
the time they turned 6<br />
years of age or exited<br />
the program.<br />
2) The percent of<br />
preschool children who<br />
were functioning<br />
within age expectations<br />
in each Outcome by the<br />
time they turned 6<br />
years of age or exited<br />
A) Positive Social -Emotional<br />
Skills*<br />
State<br />
Rate<br />
A) Positive Social -<br />
Emotional Skills<br />
(Including social<br />
relationships)<br />
State<br />
Rate<br />
2.14%<br />
5.31%<br />
25.97%<br />
38.22%<br />
28.36%<br />
State<br />
Target<br />
LEA<br />
Rate<br />
LEA<br />
Rate<br />
— —<br />
— —<br />
— —<br />
— —<br />
— —<br />
Target<br />
Met by<br />
LEA(Y/N)<br />
B) Acquisition and Use of<br />
Knowledge and Skills<br />
(Including early language/<br />
communication and early literacy)<br />
B) Acquisition and Use of<br />
Knowledge and Skills **<br />
State<br />
Rate<br />
1.75%<br />
6.59%<br />
34.23%<br />
43.51%<br />
13.92%<br />
State<br />
Target<br />
LEA<br />
Rate<br />
Target<br />
Met by<br />
LEA(Y/N)<br />
C) Use of Appropriate Behaviors<br />
to Meet Their Needs<br />
State<br />
Rate<br />
State<br />
Target<br />
LEA<br />
Rate<br />
Target<br />
Met by<br />
LEA(Y/N)<br />
89.61% 90.50% — — N/A 90.31% 90.50% — — N/A 90.82% 92.50% — — N/A<br />
66.58% 69.50% — — N/A 57.43% 60.50% — — N/A 76.69% 78.50% — — N/A<br />
NOTE: * Including social relationships ** Including early language/ communication and early literacy<br />
Note: - - denotes not applicable<br />
State<br />
Rate<br />
LEA<br />
Rate<br />
— —<br />
— —<br />
— —<br />
— —<br />
— —<br />
C) Use of<br />
Appropriate<br />
Behaviors to<br />
Meet Their Needs<br />
State<br />
Rate<br />
4.51%<br />
17.34%<br />
41.72%<br />
34.97%<br />
LEA<br />
Rate<br />
1.46% — —<br />
— —<br />
— —<br />
— —<br />
— —<br />
Page 3 of 5
LEA: 0404 - GRAVETTE SCHOOL <strong>DISTRICT</strong><br />
Indicator 08: Parent Involvement<br />
Percent of surveyed<br />
parents who reported<br />
school facilitated parent<br />
involvement as a means<br />
of improving services<br />
and results for children<br />
with disabilities.<br />
Early Childhood<br />
(3-5)<br />
School Age<br />
(5-21)<br />
State<br />
Rate<br />
90.47%<br />
95.05%<br />
Indicator 09: Disproportionality - Eligibility<br />
Disproportionate representation of racial<br />
and ethnic groups in special education and<br />
related services that is a result of<br />
inappropriate identification (e.g.<br />
monitoring data, review of policies,<br />
practices, and procedures under 618(d),<br />
etc.).<br />
State<br />
Rate<br />
State<br />
Target<br />
88.00%<br />
96.00%<br />
State<br />
Target<br />
0.00% 0.00%<br />
LEA<br />
Rate<br />
— —<br />
98.44%<br />
Indicator 10: Disproportionality-Child with a Disability<br />
Disproportionate representation of racial<br />
and ethnic groups in specific disability<br />
categories that is a result of inappropriate<br />
identification (e.g. monitoring data, review<br />
of policies, practices, and procedures under<br />
618(d), etc.).<br />
Indicator 11: Child Find<br />
Percent of children with<br />
parental consent to evaluate<br />
who are evaluated within<br />
the State established timeline<br />
of 60 days.<br />
Overall<br />
(3-21)<br />
Early Childhood<br />
(3-5)<br />
School Age<br />
(5-21)<br />
State<br />
Rate<br />
0.00%<br />
Indicator 12: Early Childhood Transition<br />
Percent of children referred by Part C prior to<br />
age 3, who are found eligible for Part B, and<br />
who have an IEP developed and implemented<br />
by their third birthday.<br />
Note: - - denotes not applicable<br />
State<br />
Rate<br />
99.41%<br />
99.70%<br />
98.97%<br />
State<br />
Rate<br />
State<br />
Target<br />
0.00%<br />
State<br />
Target<br />
100.00%<br />
100.00%<br />
100.00%<br />
State<br />
Target<br />
Target Met by<br />
LEA (Y/N)<br />
Y<br />
Target Met by<br />
LEA (Y/N)<br />
Y<br />
LEA<br />
Rate<br />
100.00%<br />
— —<br />
100.00%<br />
LEA<br />
Rate<br />
Target Met by<br />
LEA (Y/N)<br />
N/A<br />
Y<br />
Note: The target for Indicator 09 is to have zero percent<br />
(0%) of districts identified as having disproportionate<br />
representation as a result of inappropriate<br />
identification in eligibility.<br />
Note: The target for Indicator 10 is to have zero<br />
percent (0%) of districts identified as having<br />
disproportionate representation as a result of<br />
inappropriate identification in a disability<br />
category.<br />
Target Met by<br />
LEA (Y/N)<br />
N/A<br />
Y<br />
Target Met<br />
by LEA<br />
(Y/N)<br />
99.21% 100.00% - - N/A<br />
Y<br />
Note: * Indicates a zero reponse rate for the<br />
district.<br />
Page 4 of 5
LEA: 0404 - GRAVETTE SCHOOL <strong>DISTRICT</strong><br />
Indicator 13: Secondary Transition<br />
Percent of youth with disabilities aged 16 and<br />
up with an IEP that includes coordinated,<br />
measurable, annual IEP goals and transition<br />
services that will reasonably enable the student<br />
to meet the post-secondary goals.<br />
Indicator 14: Post-School Outcomes<br />
A. Percent of youth enrolled in higher<br />
education within one year of leaving high<br />
school.<br />
State<br />
Rate<br />
State<br />
Target<br />
Note: Data for this Indicator is from the on-site monitoring of LEAs for the given year.<br />
B. Percent of youth enrolled in higher<br />
education or competitively employed<br />
within one year of leaving high school.<br />
C. Percent of youth enrolled in higher<br />
education or in some other postsecondary<br />
education or training program; or<br />
competitively employed or in some other<br />
employment within one year of leaving<br />
high school.<br />
State<br />
Rate<br />
Indicator 20: Reported Data-Timely and Accurate*<br />
District submitted<br />
required data elements<br />
on or before due dates;<br />
made revisions within<br />
the alloted reveiw<br />
periods.<br />
Accurate and Timely<br />
Data Submission<br />
Overall (3-21)<br />
Early Childhood (3-5)<br />
School Age (5-21)<br />
State<br />
Target<br />
100.00%<br />
100.00%<br />
100.00%<br />
State<br />
Target<br />
LEA<br />
Rate<br />
LEA<br />
Rate<br />
Target Met by<br />
LEA (Y/N)<br />
Target Met<br />
by LEA<br />
(Y/N)<br />
Target Met<br />
by LEA<br />
(Y/N)<br />
*Data reviewed for timely and accurate submissions included all APSCN cycle data except for personnel<br />
Note: - - denotes not applicable<br />
96.19 100.00 100.00% Y<br />
14.53<br />
State<br />
Rate<br />
49.42<br />
State<br />
Rate<br />
54.07<br />
13.00<br />
State<br />
Target<br />
49.00<br />
State<br />
Target<br />
60.00<br />
Y<br />
N/A<br />
Y<br />
— —<br />
LEA<br />
Rate<br />
— —<br />
LEA<br />
Rate<br />
— —<br />
N/A<br />
Target Met<br />
by LEA<br />
(Y/N)<br />
N/A<br />
Target Met<br />
by LEA<br />
(Y/N)<br />
N/A<br />
Page 5 of 5
LEA: 0405 - ROGERS SCHOOL <strong>DISTRICT</strong><br />
<strong>ARKANSAS</strong> <strong>SPECIAL</strong> <strong>EDUCATION</strong><br />
<strong>DISTRICT</strong> <strong>ANNUAL</strong> PERFORMANCE REPORT<br />
2010/11 School Year<br />
Publication Date: March 2012<br />
Each State must have in place a State Performance Plan (SPP) to evaluate the State's efforts to meet the requirements and<br />
purposes of the implementation of the Individuals with Disabilities Education Act (IDEA). The SPP is a six-year plan, which<br />
describes Arkansas's performance on 20 indicators. The Office of Special Education Programs in the U. S. Department of<br />
Education requires that States report annually to the public on the performance of each local education agency (LEA) on 14 of<br />
20 indicators as compared with targets established by the State in the SPP. Arkansas will report indicators 1 through 14 and<br />
20 for each LEA serving children with disabilities (CWD). Any LEA not meeting targets on compliance indicators (0% for<br />
Indicators 4B, 09 & 10 and 100% for Indicators 11, 12, 13, and 20) are non-compliant with IDEA.<br />
There are no report changes for the 2010/11 school year profile; However, it is important to recognize that: .<br />
1. Indicator 01 (Graduation) is reported a year in arrear (2009/10 graduates) and is based on a four-year cohort. This<br />
means the rate is a measure of students who entered in ninth grade and graduate in four years. The calculation is a<br />
requirement under Title I of the Elementary and Secondary Education Act (ESEA).<br />
2. Indicator 02 (Drop out) is reported a year in arrear. This means the rate is a measure of students who dropped out in<br />
the 2009/10 school year. The Indicator 02 data are aligned with the Common Core of Data (CCD) requirements for<br />
grades 7-12.<br />
3. Indicator 04A and 4B (Suspension/Expulsion) is reported a year in arrear. This means the rate is a measure of<br />
students who had out-of-school suspensions and/or expulsions totaling more than 10 days.<br />
Percent of youth<br />
with IEPs<br />
graduating from<br />
high school with a<br />
regular diploma<br />
For a complete description of all the Indicators, please visit the special education website at<br />
http://arksped.k12.ar.us/sections/policy.html<br />
Indicator 01: Graduation Rates (2009/10 school year) Indicator 02: Dropout Rates (2009/10 school year)<br />
State<br />
Rate<br />
State<br />
Target<br />
75.76% 85.00%<br />
LEA<br />
Rate<br />
87.50%<br />
Target Met<br />
by LEA<br />
(Y/N)<br />
Y<br />
Percent of<br />
youth with<br />
IEPs dropping<br />
out of high<br />
school<br />
State<br />
Rate<br />
Indicator 03: Assessment on Statewide Benchmark Exam (grades 3-8, 11)<br />
A) Adequate Yearly Progress<br />
n=40<br />
Literacy<br />
Mathematics<br />
Met Disability Subgroup "n"<br />
for Reporting Purposes (Y/N)<br />
State Target for % of Districts Meeting<br />
AYP for Disability Subgroup<br />
State<br />
Target<br />
3.06% 4.20%<br />
LEA<br />
Rate<br />
2.69%<br />
% of Districts Meeting AYP<br />
for Disability Subgroup<br />
Target Met by<br />
LEA (Y/N)<br />
Y<br />
Target Met by<br />
LEA(Y/N)<br />
Overall Y 17.15% 6.25%<br />
N<br />
Y<br />
Y<br />
Note: For a district to qualify as having a disability subgroup it must have a minimum of 40 (n=40) students with disabilities in a school building.<br />
B) Participation<br />
Participation Rate: # of<br />
CWD Tested ÷ # of CWD<br />
Enrolled in grades tested.<br />
Participation Rate: Literacy<br />
Participation Rate: Math<br />
Note: - - denotes not applicable<br />
State<br />
Rate<br />
98.78%<br />
State<br />
Target<br />
95.00%<br />
LEA<br />
Rate<br />
99.89%<br />
Target Met<br />
by LEA (Y/N)<br />
98.61% 95.00% 99.69% Y<br />
Y<br />
C) Performance Proficiency<br />
Percent of CWD Scoring<br />
Proficient or Above<br />
Proficiency Rate: Literacy<br />
Proficiency Rate:<br />
Mathematics<br />
16.00%<br />
16.00%<br />
State<br />
Rate<br />
31.49%<br />
44.86%<br />
State<br />
Target<br />
45.22%<br />
51.14%<br />
LEA<br />
Rate<br />
43.92%<br />
58.20%<br />
N<br />
N<br />
Target<br />
Met by<br />
LEA (Y/N)<br />
N<br />
Y<br />
Page 1 of 5
LEA: 0405 - ROGERS SCHOOL <strong>DISTRICT</strong><br />
Indicator 04: Out-of-School Suspensions and Expulsions (2009/10 school year)<br />
A) Suspension/Expulsion<br />
Percent difference of CWD with out-of- school suspensions and<br />
expulsions totaling greater than 10 days in a school year as<br />
compared to the same data for general education students in<br />
the district.<br />
B) Suspension/Expulsion by Race and Ethnicity<br />
Percent of districts that have: (a) a significant discrepancy, by race or<br />
ethnicity, in the rate of suspensions and expulsions of greater than 10<br />
days in a school year for children with IEPs; and (b) policies,<br />
procedures or practices that contribute to the significant discrepancy<br />
and do not comply with requirements relating to the development<br />
and implementation of IEPs, the use of positive behavioral<br />
interventions and supports, and procedural safeguards.<br />
Indicator 05: School Age (5-21) Least Restrictive Environment<br />
A) In the Regular Class 80% or more of the day<br />
Percent of CWD with<br />
IEPs receiving instruction<br />
in the regular class 80%<br />
or more of the day.<br />
State<br />
Rate<br />
State<br />
Target<br />
LEA<br />
Rate<br />
B) In the Regular Class less than 40% of the day<br />
Percent of CWD with<br />
IEPs receiving instruction<br />
in the regular class less<br />
than 60% of the day.<br />
53.87% 59.77%<br />
State<br />
Rate<br />
State<br />
Target<br />
12.42% 12.51%<br />
53.16%<br />
LEA<br />
Rate<br />
19.02%<br />
C) Other Settings outside the regular class<br />
Percent of CWD with IEPs served in<br />
public or private separate schools,<br />
residential placements, or<br />
homebound/hospital placements.<br />
State<br />
Rate<br />
State<br />
Target<br />
2.80% 2.56%<br />
Target Met<br />
by LEA (Y/N)<br />
N<br />
Target Met<br />
by LEA (Y/N)<br />
N<br />
LEA<br />
Rate<br />
0.87%<br />
Target Met<br />
by LEA(Y/N)<br />
Indicator 06: Early Childhood (3-5) Least Restrictive Environment<br />
A) Regular Early Childhood Program<br />
Percent of children (aged 3 through 5) with IEPs attending a regular<br />
early childhood program and receiving the majority of special<br />
education and related services in the regular early childhood program<br />
Allowable<br />
Difference<br />
LEA: 0405 - ROGERS SCHOOL <strong>DISTRICT</strong><br />
Indicator 07: Preschool (3-5) Outcomes<br />
a) Percent of preschool CWD<br />
children who did not<br />
improve functioning.<br />
b) Percent of preschool CWD<br />
who improved but whose<br />
functioning remained below<br />
same age peers.<br />
c) Percent of preschool CWD<br />
who improved at a level<br />
nearer to same aged peers.<br />
d) Percent of preschool CWD<br />
who improved functioning to<br />
reach a level comparable to<br />
same age peers.<br />
e) Percent of preschool CWD<br />
children who maintain<br />
functioning at a level<br />
comparable to same aged<br />
peers.<br />
Summary<br />
Statements<br />
1) Of those preschool<br />
children who entered<br />
the preschool program<br />
below age expectations<br />
in each Outcome, the<br />
percent who<br />
substantially increased<br />
their rate of growth by<br />
the time they turned 6<br />
years of age or exited<br />
the program.<br />
2) The percent of<br />
preschool children who<br />
were functioning<br />
within age expectations<br />
in each Outcome by the<br />
time they turned 6<br />
years of age or exited<br />
A) Positive Social -Emotional<br />
Skills*<br />
State<br />
Rate<br />
A) Positive Social -<br />
Emotional Skills<br />
(Including social<br />
relationships)<br />
State<br />
Rate<br />
2.14%<br />
5.31%<br />
25.97%<br />
38.22%<br />
28.36%<br />
State<br />
Target<br />
LEA<br />
Rate<br />
LEA<br />
Rate<br />
— —<br />
— —<br />
— —<br />
— —<br />
— —<br />
Target<br />
Met by<br />
LEA(Y/N)<br />
B) Acquisition and Use of<br />
Knowledge and Skills<br />
(Including early language/<br />
communication and early literacy)<br />
B) Acquisition and Use of<br />
Knowledge and Skills **<br />
State<br />
Rate<br />
1.75%<br />
6.59%<br />
34.23%<br />
43.51%<br />
13.92%<br />
State<br />
Target<br />
LEA<br />
Rate<br />
Target<br />
Met by<br />
LEA(Y/N)<br />
C) Use of Appropriate Behaviors<br />
to Meet Their Needs<br />
State<br />
Rate<br />
State<br />
Target<br />
LEA<br />
Rate<br />
Target<br />
Met by<br />
LEA(Y/N)<br />
89.61% 90.50% — — N/A 90.31% 90.50% — — N/A 90.82% 92.50% — — N/A<br />
66.58% 69.50% — — N/A 57.43% 60.50% — — N/A 76.69% 78.50% — — N/A<br />
NOTE: * Including social relationships ** Including early language/ communication and early literacy<br />
Note: - - denotes not applicable<br />
State<br />
Rate<br />
LEA<br />
Rate<br />
— —<br />
— —<br />
— —<br />
— —<br />
— —<br />
C) Use of<br />
Appropriate<br />
Behaviors to<br />
Meet Their Needs<br />
State<br />
Rate<br />
4.51%<br />
17.34%<br />
41.72%<br />
34.97%<br />
LEA<br />
Rate<br />
1.46% — —<br />
— —<br />
— —<br />
— —<br />
— —<br />
Page 3 of 5
LEA: 0405 - ROGERS SCHOOL <strong>DISTRICT</strong><br />
Indicator 08: Parent Involvement<br />
Percent of surveyed<br />
parents who reported<br />
school facilitated parent<br />
involvement as a means<br />
of improving services<br />
and results for children<br />
with disabilities.<br />
Early Childhood<br />
(3-5)<br />
School Age<br />
(5-21)<br />
State<br />
Rate<br />
90.47%<br />
95.05%<br />
Indicator 09: Disproportionality - Eligibility<br />
Disproportionate representation of racial<br />
and ethnic groups in special education and<br />
related services that is a result of<br />
inappropriate identification (e.g.<br />
monitoring data, review of policies,<br />
practices, and procedures under 618(d),<br />
etc.).<br />
State<br />
Rate<br />
State<br />
Target<br />
88.00%<br />
96.00%<br />
State<br />
Target<br />
0.00% 0.00%<br />
LEA<br />
Rate<br />
— —<br />
93.75%<br />
Indicator 10: Disproportionality-Child with a Disability<br />
Disproportionate representation of racial<br />
and ethnic groups in specific disability<br />
categories that is a result of inappropriate<br />
identification (e.g. monitoring data, review<br />
of policies, practices, and procedures under<br />
618(d), etc.).<br />
Indicator 11: Child Find<br />
Percent of children with<br />
parental consent to evaluate<br />
who are evaluated within<br />
the State established timeline<br />
of 60 days.<br />
Overall<br />
(3-21)<br />
Early Childhood<br />
(3-5)<br />
School Age<br />
(5-21)<br />
State<br />
Rate<br />
0.00%<br />
Indicator 12: Early Childhood Transition<br />
Percent of children referred by Part C prior to<br />
age 3, who are found eligible for Part B, and<br />
who have an IEP developed and implemented<br />
by their third birthday.<br />
Note: - - denotes not applicable<br />
State<br />
Rate<br />
99.41%<br />
99.70%<br />
98.97%<br />
State<br />
Rate<br />
State<br />
Target<br />
0.00%<br />
State<br />
Target<br />
100.00%<br />
100.00%<br />
100.00%<br />
State<br />
Target<br />
Target Met by<br />
LEA (Y/N)<br />
Y<br />
Target Met by<br />
LEA (Y/N)<br />
Y<br />
LEA<br />
Rate<br />
100.00%<br />
— —<br />
100.00%<br />
LEA<br />
Rate<br />
Target Met by<br />
LEA (Y/N)<br />
N/A<br />
N<br />
Note: The target for Indicator 09 is to have zero percent<br />
(0%) of districts identified as having disproportionate<br />
representation as a result of inappropriate<br />
identification in eligibility.<br />
Note: The target for Indicator 10 is to have zero<br />
percent (0%) of districts identified as having<br />
disproportionate representation as a result of<br />
inappropriate identification in a disability<br />
category.<br />
Target Met by<br />
LEA (Y/N)<br />
N/A<br />
Y<br />
Target Met<br />
by LEA<br />
(Y/N)<br />
99.21% 100.00% - - N/A<br />
Y<br />
Note: * Indicates a zero reponse rate for the<br />
district.<br />
Page 4 of 5
LEA: 0405 - ROGERS SCHOOL <strong>DISTRICT</strong><br />
Indicator 13: Secondary Transition<br />
Percent of youth with disabilities aged 16 and<br />
up with an IEP that includes coordinated,<br />
measurable, annual IEP goals and transition<br />
services that will reasonably enable the student<br />
to meet the post-secondary goals.<br />
Indicator 14: Post-School Outcomes<br />
A. Percent of youth enrolled in higher<br />
education within one year of leaving high<br />
school.<br />
State<br />
Rate<br />
State<br />
Target<br />
Note: Data for this Indicator is from the on-site monitoring of LEAs for the given year.<br />
B. Percent of youth enrolled in higher<br />
education or competitively employed<br />
within one year of leaving high school.<br />
C. Percent of youth enrolled in higher<br />
education or in some other postsecondary<br />
education or training program; or<br />
competitively employed or in some other<br />
employment within one year of leaving<br />
high school.<br />
State<br />
Rate<br />
Indicator 20: Reported Data-Timely and Accurate*<br />
District submitted<br />
required data elements<br />
on or before due dates;<br />
made revisions within<br />
the alloted reveiw<br />
periods.<br />
Accurate and Timely<br />
Data Submission<br />
Overall (3-21)<br />
Early Childhood (3-5)<br />
School Age (5-21)<br />
State<br />
Target<br />
100.00%<br />
100.00%<br />
100.00%<br />
State<br />
Target<br />
LEA<br />
Rate<br />
LEA<br />
Rate<br />
Target Met by<br />
LEA (Y/N)<br />
Target Met<br />
by LEA<br />
(Y/N)<br />
Target Met<br />
by LEA<br />
(Y/N)<br />
*Data reviewed for timely and accurate submissions included all APSCN cycle data except for personnel<br />
Note: - - denotes not applicable<br />
96.19 100.00 100.00% Y<br />
14.53<br />
State<br />
Rate<br />
49.42<br />
State<br />
Rate<br />
54.07<br />
13.00<br />
State<br />
Target<br />
49.00<br />
State<br />
Target<br />
60.00<br />
Y<br />
N/A<br />
Y<br />
— —<br />
LEA<br />
Rate<br />
— —<br />
LEA<br />
Rate<br />
— —<br />
N/A<br />
Target Met<br />
by LEA<br />
(Y/N)<br />
N/A<br />
Target Met<br />
by LEA<br />
(Y/N)<br />
N/A<br />
Page 5 of 5
<strong>ARKANSAS</strong> <strong>SPECIAL</strong> <strong>EDUCATION</strong><br />
<strong>DISTRICT</strong> <strong>ANNUAL</strong> PERFORMANCE REPORT<br />
2010/11 School Year<br />
Publication Date: March 2012<br />
Each State must have in place a State Performance Plan (SPP) to evaluate the State's efforts to meet the requirements and<br />
purposes of the implementation of the Individuals with Disabilities Education Act (IDEA). The SPP is a six-year plan, which<br />
describes Arkansas's performance on 20 indicators. The Office of Special Education Programs in the U. S. Department of<br />
Education requires that States report annually to the public on the performance of each local education agency (LEA) on 14 of<br />
20 indicators as compared with targets established by the State in the SPP. Arkansas will report indicators 1 through 14 and<br />
20 for each LEA serving children with disabilities (CWD). Any LEA not meeting targets on compliance indicators (0% for<br />
Indicators 4B, 09 & 10 and 100% for Indicators 11, 12, 13, and 20) are non-compliant with IDEA.<br />
There are no report changes for the 2010/11 school year profile; However, it is important to recognize that: .<br />
1. Indicator 01 (Graduation) is reported a year in arrear (2009/10 graduates) and is based on a four-year cohort. This<br />
means the rate is a measure of students who entered in ninth grade and graduate in four years. The calculation is a<br />
requirement under Title I of the Elementary and Secondary Education Act (ESEA).<br />
2. Indicator 02 (Drop out) is reported a year in arrear. This means the rate is a measure of students who dropped out in<br />
the 2009/10 school year. The Indicator 02 data are aligned with the Common Core of Data (CCD) requirements for<br />
grades 7-12.<br />
3. Indicator 04A and 4B (Suspension/Expulsion) is reported a year in arrear. This means the rate is a measure of<br />
students who had out-of-school suspensions and/or expulsions totaling more than 10 days.<br />
For a complete description of all the Indicators, please visit the special education website at<br />
http://arksped.k12.ar.us/sections/policy.html<br />
LEA: 0406 - SILOAM SPRINGS SCHOOL <strong>DISTRICT</strong><br />
Indicator 01: Graduation Rates (2009/10 school year) Indicator 02: Dropout Rates (2009/10 school year)<br />
Percent of youth<br />
with IEPs<br />
graduating from<br />
high school with a<br />
regular diploma<br />
State<br />
Rate<br />
State<br />
Target<br />
75.76% 85.00%<br />
LEA<br />
Rate<br />
86.67%<br />
Target Met<br />
by LEA<br />
(Y/N)<br />
Y<br />
Percent of<br />
youth with<br />
IEPs dropping<br />
out of high<br />
school<br />
State<br />
Rate<br />
Indicator 03: Assessment on Statewide Benchmark Exam (grades 3-8, 11)<br />
A) Adequate Yearly Progress<br />
n=40<br />
Literacy<br />
Mathematics<br />
Met Disability Subgroup "n"<br />
for Reporting Purposes (Y/N)<br />
State Target for % of Districts Meeting<br />
AYP for Disability Subgroup<br />
State<br />
Target<br />
3.06% 4.20%<br />
LEA<br />
Rate<br />
0.66%<br />
% of Districts Meeting AYP<br />
for Disability Subgroup<br />
Target Met by<br />
LEA (Y/N)<br />
Y<br />
Target Met by<br />
LEA(Y/N)<br />
Overall N 17.15% 6.25%<br />
NA<br />
N<br />
N<br />
Note: For a district to qualify as having a disability subgroup it must have a minimum of 40 (n=40) students with disabilities in a school building.<br />
B) Participation<br />
Participation Rate: # of<br />
CWD Tested ÷ # of CWD<br />
Enrolled in grades tested.<br />
Participation Rate: Literacy<br />
Participation Rate: Math<br />
Note: - - denotes not applicable<br />
State<br />
Rate<br />
98.78%<br />
State<br />
Target<br />
95.00%<br />
LEA<br />
Rate<br />
100.00%<br />
Target Met<br />
by LEA (Y/N)<br />
98.61% 95.00% 99.56% Y<br />
Y<br />
C) Performance Proficiency<br />
Percent of CWD Scoring<br />
Proficient or Above<br />
Proficiency Rate: Literacy<br />
Proficiency Rate:<br />
Mathematics<br />
16.00%<br />
16.00%<br />
State<br />
Rate<br />
31.49%<br />
44.86%<br />
State<br />
Target<br />
45.22%<br />
51.14%<br />
LEA<br />
Rate<br />
26.56%<br />
53.88%<br />
NA<br />
NA<br />
Target<br />
Met by<br />
LEA (Y/N)<br />
N<br />
Y<br />
Page 1 of 5
LEA: 0406 - SILOAM SPRINGS SCHOOL <strong>DISTRICT</strong><br />
Indicator 04: Out-of-School Suspensions and Expulsions (2009/10 school year)<br />
A) Suspension/Expulsion<br />
Percent difference of CWD with out-of- school suspensions and<br />
expulsions totaling greater than 10 days in a school year as<br />
compared to the same data for general education students in<br />
the district.<br />
B) Suspension/Expulsion by Race and Ethnicity<br />
Percent of districts that have: (a) a significant discrepancy, by race or<br />
ethnicity, in the rate of suspensions and expulsions of greater than 10<br />
days in a school year for children with IEPs; and (b) policies,<br />
procedures or practices that contribute to the significant discrepancy<br />
and do not comply with requirements relating to the development<br />
and implementation of IEPs, the use of positive behavioral<br />
interventions and supports, and procedural safeguards.<br />
Indicator 05: School Age (5-21) Least Restrictive Environment<br />
A) In the Regular Class 80% or more of the day<br />
Percent of CWD with<br />
IEPs receiving instruction<br />
in the regular class 80%<br />
or more of the day.<br />
State<br />
Rate<br />
State<br />
Target<br />
LEA<br />
Rate<br />
B) In the Regular Class less than 40% of the day<br />
Percent of CWD with<br />
IEPs receiving instruction<br />
in the regular class less<br />
than 60% of the day.<br />
53.87% 59.77%<br />
State<br />
Rate<br />
State<br />
Target<br />
12.42% 12.51%<br />
76.28%<br />
LEA<br />
Rate<br />
1.62%<br />
C) Other Settings outside the regular class<br />
Percent of CWD with IEPs served in<br />
public or private separate schools,<br />
residential placements, or<br />
homebound/hospital placements.<br />
State<br />
Rate<br />
State<br />
Target<br />
2.80% 2.56%<br />
Target Met<br />
by LEA (Y/N)<br />
Y<br />
Target Met<br />
by LEA (Y/N)<br />
Y<br />
LEA<br />
Rate<br />
3.50%<br />
Target Met<br />
by LEA(Y/N)<br />
Indicator 06: Early Childhood (3-5) Least Restrictive Environment<br />
A) Regular Early Childhood Program<br />
Percent of children (aged 3 through 5) with IEPs attending a regular<br />
early childhood program and receiving the majority of special<br />
education and related services in the regular early childhood program<br />
Allowable<br />
Difference<br />
LEA: 0406 - SILOAM SPRINGS SCHOOL <strong>DISTRICT</strong><br />
Indicator 07: Preschool (3-5) Outcomes<br />
a) Percent of preschool CWD<br />
children who did not<br />
improve functioning.<br />
b) Percent of preschool CWD<br />
who improved but whose<br />
functioning remained below<br />
same age peers.<br />
c) Percent of preschool CWD<br />
who improved at a level<br />
nearer to same aged peers.<br />
d) Percent of preschool CWD<br />
who improved functioning to<br />
reach a level comparable to<br />
same age peers.<br />
e) Percent of preschool CWD<br />
children who maintain<br />
functioning at a level<br />
comparable to same aged<br />
peers.<br />
Summary<br />
Statements<br />
1) Of those preschool<br />
children who entered<br />
the preschool program<br />
below age expectations<br />
in each Outcome, the<br />
percent who<br />
substantially increased<br />
their rate of growth by<br />
the time they turned 6<br />
years of age or exited<br />
the program.<br />
2) The percent of<br />
preschool children who<br />
were functioning<br />
within age expectations<br />
in each Outcome by the<br />
time they turned 6<br />
years of age or exited<br />
A) Positive Social -Emotional<br />
Skills*<br />
State<br />
Rate<br />
A) Positive Social -<br />
Emotional Skills<br />
(Including social<br />
relationships)<br />
State<br />
Rate<br />
2.14%<br />
5.31%<br />
25.97%<br />
38.22%<br />
28.36%<br />
State<br />
Target<br />
LEA<br />
Rate<br />
LEA<br />
Rate<br />
— —<br />
— —<br />
— —<br />
— —<br />
— —<br />
Target<br />
Met by<br />
LEA(Y/N)<br />
B) Acquisition and Use of<br />
Knowledge and Skills<br />
(Including early language/<br />
communication and early literacy)<br />
B) Acquisition and Use of<br />
Knowledge and Skills **<br />
State<br />
Rate<br />
1.75%<br />
6.59%<br />
34.23%<br />
43.51%<br />
13.92%<br />
State<br />
Target<br />
LEA<br />
Rate<br />
Target<br />
Met by<br />
LEA(Y/N)<br />
C) Use of Appropriate Behaviors<br />
to Meet Their Needs<br />
State<br />
Rate<br />
State<br />
Target<br />
LEA<br />
Rate<br />
Target<br />
Met by<br />
LEA(Y/N)<br />
89.61% 90.50% — — N/A 90.31% 90.50% — — N/A 90.82% 92.50% — — N/A<br />
66.58% 69.50% — — N/A 57.43% 60.50% — — N/A 76.69% 78.50% — — N/A<br />
NOTE: * Including social relationships ** Including early language/ communication and early literacy<br />
Note: - - denotes not applicable<br />
State<br />
Rate<br />
LEA<br />
Rate<br />
— —<br />
— —<br />
— —<br />
— —<br />
— —<br />
C) Use of<br />
Appropriate<br />
Behaviors to<br />
Meet Their Needs<br />
State<br />
Rate<br />
4.51%<br />
17.34%<br />
41.72%<br />
34.97%<br />
LEA<br />
Rate<br />
1.46% — —<br />
— —<br />
— —<br />
— —<br />
— —<br />
Page 3 of 5
LEA: 0406 - SILOAM SPRINGS SCHOOL <strong>DISTRICT</strong><br />
Indicator 08: Parent Involvement<br />
Percent of surveyed<br />
parents who reported<br />
school facilitated parent<br />
involvement as a means<br />
of improving services<br />
and results for children<br />
with disabilities.<br />
Early Childhood<br />
(3-5)<br />
School Age<br />
(5-21)<br />
State<br />
Rate<br />
90.47%<br />
95.05%<br />
Indicator 09: Disproportionality - Eligibility<br />
Disproportionate representation of racial<br />
and ethnic groups in special education and<br />
related services that is a result of<br />
inappropriate identification (e.g.<br />
monitoring data, review of policies,<br />
practices, and procedures under 618(d),<br />
etc.).<br />
State<br />
Rate<br />
State<br />
Target<br />
88.00%<br />
96.00%<br />
State<br />
Target<br />
0.00% 0.00%<br />
LEA<br />
Rate<br />
— —<br />
86.36%<br />
Indicator 10: Disproportionality-Child with a Disability<br />
Disproportionate representation of racial<br />
and ethnic groups in specific disability<br />
categories that is a result of inappropriate<br />
identification (e.g. monitoring data, review<br />
of policies, practices, and procedures under<br />
618(d), etc.).<br />
Indicator 11: Child Find<br />
Percent of children with<br />
parental consent to evaluate<br />
who are evaluated within<br />
the State established timeline<br />
of 60 days.<br />
Overall<br />
(3-21)<br />
Early Childhood<br />
(3-5)<br />
School Age<br />
(5-21)<br />
State<br />
Rate<br />
0.00%<br />
Indicator 12: Early Childhood Transition<br />
Percent of children referred by Part C prior to<br />
age 3, who are found eligible for Part B, and<br />
who have an IEP developed and implemented<br />
by their third birthday.<br />
Note: - - denotes not applicable<br />
State<br />
Rate<br />
99.41%<br />
99.70%<br />
98.97%<br />
State<br />
Rate<br />
State<br />
Target<br />
0.00%<br />
State<br />
Target<br />
100.00%<br />
100.00%<br />
100.00%<br />
State<br />
Target<br />
Target Met by<br />
LEA (Y/N)<br />
Y<br />
Target Met by<br />
LEA (Y/N)<br />
Y<br />
LEA<br />
Rate<br />
100.00%<br />
— —<br />
100.00%<br />
LEA<br />
Rate<br />
Target Met by<br />
LEA (Y/N)<br />
N/A<br />
N<br />
Note: The target for Indicator 09 is to have zero percent<br />
(0%) of districts identified as having disproportionate<br />
representation as a result of inappropriate<br />
identification in eligibility.<br />
Note: The target for Indicator 10 is to have zero<br />
percent (0%) of districts identified as having<br />
disproportionate representation as a result of<br />
inappropriate identification in a disability<br />
category.<br />
Target Met by<br />
LEA (Y/N)<br />
N/A<br />
Y<br />
Target Met<br />
by LEA<br />
(Y/N)<br />
99.21% 100.00% - - N/A<br />
Y<br />
Note: * Indicates a zero reponse rate for the<br />
district.<br />
Page 4 of 5
LEA: 0406 - SILOAM SPRINGS SCHOOL <strong>DISTRICT</strong><br />
Indicator 13: Secondary Transition<br />
Percent of youth with disabilities aged 16 and<br />
up with an IEP that includes coordinated,<br />
measurable, annual IEP goals and transition<br />
services that will reasonably enable the student<br />
to meet the post-secondary goals.<br />
Indicator 14: Post-School Outcomes<br />
A. Percent of youth enrolled in higher<br />
education within one year of leaving high<br />
school.<br />
State<br />
Rate<br />
State<br />
Target<br />
Note: Data for this Indicator is from the on-site monitoring of LEAs for the given year.<br />
B. Percent of youth enrolled in higher<br />
education or competitively employed<br />
within one year of leaving high school.<br />
C. Percent of youth enrolled in higher<br />
education or in some other postsecondary<br />
education or training program; or<br />
competitively employed or in some other<br />
employment within one year of leaving<br />
high school.<br />
State<br />
Rate<br />
Indicator 20: Reported Data-Timely and Accurate*<br />
District submitted<br />
required data elements<br />
on or before due dates;<br />
made revisions within<br />
the alloted reveiw<br />
periods.<br />
Accurate and Timely<br />
Data Submission<br />
Overall (3-21)<br />
Early Childhood (3-5)<br />
School Age (5-21)<br />
State<br />
Target<br />
100.00%<br />
100.00%<br />
100.00%<br />
State<br />
Target<br />
LEA<br />
Rate<br />
LEA<br />
Rate<br />
Target Met by<br />
LEA (Y/N)<br />
Target Met<br />
by LEA<br />
(Y/N)<br />
Target Met<br />
by LEA<br />
(Y/N)<br />
*Data reviewed for timely and accurate submissions included all APSCN cycle data except for personnel<br />
Note: - - denotes not applicable<br />
96.19 100.00 — — N/A<br />
14.53<br />
State<br />
Rate<br />
49.42<br />
State<br />
Rate<br />
54.07<br />
13.00<br />
State<br />
Target<br />
49.00<br />
State<br />
Target<br />
60.00<br />
Y<br />
N/A<br />
Y<br />
— —<br />
LEA<br />
Rate<br />
— —<br />
LEA<br />
Rate<br />
— —<br />
N/A<br />
Target Met<br />
by LEA<br />
(Y/N)<br />
N/A<br />
Target Met<br />
by LEA<br />
(Y/N)<br />
N/A<br />
Page 5 of 5
LEA: 0407 - PEA RIDGE SCHOOL <strong>DISTRICT</strong><br />
<strong>ARKANSAS</strong> <strong>SPECIAL</strong> <strong>EDUCATION</strong><br />
<strong>DISTRICT</strong> <strong>ANNUAL</strong> PERFORMANCE REPORT<br />
2010/11 School Year<br />
Publication Date: March 2012<br />
Each State must have in place a State Performance Plan (SPP) to evaluate the State's efforts to meet the requirements and<br />
purposes of the implementation of the Individuals with Disabilities Education Act (IDEA). The SPP is a six-year plan, which<br />
describes Arkansas's performance on 20 indicators. The Office of Special Education Programs in the U. S. Department of<br />
Education requires that States report annually to the public on the performance of each local education agency (LEA) on 14 of<br />
20 indicators as compared with targets established by the State in the SPP. Arkansas will report indicators 1 through 14 and<br />
20 for each LEA serving children with disabilities (CWD). Any LEA not meeting targets on compliance indicators (0% for<br />
Indicators 4B, 09 & 10 and 100% for Indicators 11, 12, 13, and 20) are non-compliant with IDEA.<br />
There are no report changes for the 2010/11 school year profile; However, it is important to recognize that: .<br />
1. Indicator 01 (Graduation) is reported a year in arrear (2009/10 graduates) and is based on a four-year cohort. This<br />
means the rate is a measure of students who entered in ninth grade and graduate in four years. The calculation is a<br />
requirement under Title I of the Elementary and Secondary Education Act (ESEA).<br />
2. Indicator 02 (Drop out) is reported a year in arrear. This means the rate is a measure of students who dropped out in<br />
the 2009/10 school year. The Indicator 02 data are aligned with the Common Core of Data (CCD) requirements for<br />
grades 7-12.<br />
3. Indicator 04A and 4B (Suspension/Expulsion) is reported a year in arrear. This means the rate is a measure of<br />
students who had out-of-school suspensions and/or expulsions totaling more than 10 days.<br />
Percent of youth<br />
with IEPs<br />
graduating from<br />
high school with a<br />
regular diploma<br />
For a complete description of all the Indicators, please visit the special education website at<br />
http://arksped.k12.ar.us/sections/policy.html<br />
Indicator 01: Graduation Rates (2009/10 school year) Indicator 02: Dropout Rates (2009/10 school year)<br />
State<br />
Rate<br />
State<br />
Target<br />
75.76% 85.00%<br />
LEA<br />
Rate<br />
75.00%<br />
Target Met<br />
by LEA<br />
(Y/N)<br />
N<br />
Percent of<br />
youth with<br />
IEPs dropping<br />
out of high<br />
school<br />
State<br />
Rate<br />
Indicator 03: Assessment on Statewide Benchmark Exam (grades 3-8, 11)<br />
A) Adequate Yearly Progress<br />
n=40<br />
Literacy<br />
Mathematics<br />
Met Disability Subgroup "n"<br />
for Reporting Purposes (Y/N)<br />
State Target for % of Districts Meeting<br />
AYP for Disability Subgroup<br />
State<br />
Target<br />
3.06% 4.20%<br />
LEA<br />
Rate<br />
1.52%<br />
% of Districts Meeting AYP<br />
for Disability Subgroup<br />
Target Met by<br />
LEA (Y/N)<br />
Y<br />
Target Met by<br />
LEA(Y/N)<br />
Overall N 17.15% 6.25%<br />
NA<br />
N<br />
N<br />
Note: For a district to qualify as having a disability subgroup it must have a minimum of 40 (n=40) students with disabilities in a school building.<br />
B) Participation<br />
Participation Rate: # of<br />
CWD Tested ÷ # of CWD<br />
Enrolled in grades tested.<br />
Participation Rate: Literacy<br />
Participation Rate: Math<br />
Note: - - denotes not applicable<br />
State<br />
Rate<br />
98.78%<br />
State<br />
Target<br />
95.00%<br />
LEA<br />
Rate<br />
100.00%<br />
Target Met<br />
by LEA (Y/N)<br />
98.61% 95.00% 100.00% Y<br />
Y<br />
C) Performance Proficiency<br />
Percent of CWD Scoring<br />
Proficient or Above<br />
Proficiency Rate: Literacy<br />
Proficiency Rate:<br />
Mathematics<br />
16.00%<br />
16.00%<br />
State<br />
Rate<br />
31.49%<br />
44.86%<br />
State<br />
Target<br />
45.22%<br />
51.14%<br />
LEA<br />
Rate<br />
32.81%<br />
67.95%<br />
NA<br />
NA<br />
Target<br />
Met by<br />
LEA (Y/N)<br />
N<br />
Y<br />
Page 1 of 5
LEA: 0407 - PEA RIDGE SCHOOL <strong>DISTRICT</strong><br />
Indicator 04: Out-of-School Suspensions and Expulsions (2009/10 school year)<br />
A) Suspension/Expulsion<br />
Percent difference of CWD with out-of- school suspensions and<br />
expulsions totaling greater than 10 days in a school year as<br />
compared to the same data for general education students in<br />
the district.<br />
B) Suspension/Expulsion by Race and Ethnicity<br />
Percent of districts that have: (a) a significant discrepancy, by race or<br />
ethnicity, in the rate of suspensions and expulsions of greater than 10<br />
days in a school year for children with IEPs; and (b) policies,<br />
procedures or practices that contribute to the significant discrepancy<br />
and do not comply with requirements relating to the development<br />
and implementation of IEPs, the use of positive behavioral<br />
interventions and supports, and procedural safeguards.<br />
Indicator 05: School Age (5-21) Least Restrictive Environment<br />
A) In the Regular Class 80% or more of the day<br />
Percent of CWD with<br />
IEPs receiving instruction<br />
in the regular class 80%<br />
or more of the day.<br />
State<br />
Rate<br />
State<br />
Target<br />
LEA<br />
Rate<br />
B) In the Regular Class less than 40% of the day<br />
Percent of CWD with<br />
IEPs receiving instruction<br />
in the regular class less<br />
than 60% of the day.<br />
53.87% 59.77%<br />
State<br />
Rate<br />
State<br />
Target<br />
12.42% 12.51%<br />
61.27%<br />
LEA<br />
Rate<br />
6.34%<br />
C) Other Settings outside the regular class<br />
Percent of CWD with IEPs served in<br />
public or private separate schools,<br />
residential placements, or<br />
homebound/hospital placements.<br />
State<br />
Rate<br />
State<br />
Target<br />
2.80% 2.56%<br />
Target Met<br />
by LEA (Y/N)<br />
Y<br />
Target Met<br />
by LEA (Y/N)<br />
Y<br />
LEA<br />
Rate<br />
0.70%<br />
Target Met<br />
by LEA(Y/N)<br />
Indicator 06: Early Childhood (3-5) Least Restrictive Environment<br />
A) Regular Early Childhood Program<br />
Percent of children (aged 3 through 5) with IEPs attending a regular<br />
early childhood program and receiving the majority of special<br />
education and related services in the regular early childhood program<br />
Allowable<br />
Difference<br />
LEA: 0407 - PEA RIDGE SCHOOL <strong>DISTRICT</strong><br />
Indicator 07: Preschool (3-5) Outcomes<br />
a) Percent of preschool CWD<br />
children who did not<br />
improve functioning.<br />
b) Percent of preschool CWD<br />
who improved but whose<br />
functioning remained below<br />
same age peers.<br />
c) Percent of preschool CWD<br />
who improved at a level<br />
nearer to same aged peers.<br />
d) Percent of preschool CWD<br />
who improved functioning to<br />
reach a level comparable to<br />
same age peers.<br />
e) Percent of preschool CWD<br />
children who maintain<br />
functioning at a level<br />
comparable to same aged<br />
peers.<br />
Summary<br />
Statements<br />
1) Of those preschool<br />
children who entered<br />
the preschool program<br />
below age expectations<br />
in each Outcome, the<br />
percent who<br />
substantially increased<br />
their rate of growth by<br />
the time they turned 6<br />
years of age or exited<br />
the program.<br />
2) The percent of<br />
preschool children who<br />
were functioning<br />
within age expectations<br />
in each Outcome by the<br />
time they turned 6<br />
years of age or exited<br />
A) Positive Social -Emotional<br />
Skills*<br />
State<br />
Rate<br />
A) Positive Social -<br />
Emotional Skills<br />
(Including social<br />
relationships)<br />
State<br />
Rate<br />
2.14%<br />
5.31%<br />
25.97%<br />
38.22%<br />
28.36%<br />
State<br />
Target<br />
LEA<br />
Rate<br />
LEA<br />
Rate<br />
— —<br />
— —<br />
— —<br />
— —<br />
— —<br />
Target<br />
Met by<br />
LEA(Y/N)<br />
B) Acquisition and Use of<br />
Knowledge and Skills<br />
(Including early language/<br />
communication and early literacy)<br />
B) Acquisition and Use of<br />
Knowledge and Skills **<br />
State<br />
Rate<br />
1.75%<br />
6.59%<br />
34.23%<br />
43.51%<br />
13.92%<br />
State<br />
Target<br />
LEA<br />
Rate<br />
Target<br />
Met by<br />
LEA(Y/N)<br />
C) Use of Appropriate Behaviors<br />
to Meet Their Needs<br />
State<br />
Rate<br />
State<br />
Target<br />
LEA<br />
Rate<br />
Target<br />
Met by<br />
LEA(Y/N)<br />
89.61% 90.50% — — N/A 90.31% 90.50% — — N/A 90.82% 92.50% — — N/A<br />
66.58% 69.50% — — N/A 57.43% 60.50% — — N/A 76.69% 78.50% — — N/A<br />
NOTE: * Including social relationships ** Including early language/ communication and early literacy<br />
Note: - - denotes not applicable<br />
State<br />
Rate<br />
LEA<br />
Rate<br />
— —<br />
— —<br />
— —<br />
— —<br />
— —<br />
C) Use of<br />
Appropriate<br />
Behaviors to<br />
Meet Their Needs<br />
State<br />
Rate<br />
4.51%<br />
17.34%<br />
41.72%<br />
34.97%<br />
LEA<br />
Rate<br />
1.46% — —<br />
— —<br />
— —<br />
— —<br />
— —<br />
Page 3 of 5
LEA: 0407 - PEA RIDGE SCHOOL <strong>DISTRICT</strong><br />
Indicator 08: Parent Involvement<br />
Percent of surveyed<br />
parents who reported<br />
school facilitated parent<br />
involvement as a means<br />
of improving services<br />
and results for children<br />
with disabilities.<br />
Early Childhood<br />
(3-5)<br />
School Age<br />
(5-21)<br />
State<br />
Rate<br />
90.47%<br />
95.05%<br />
Indicator 09: Disproportionality - Eligibility<br />
Disproportionate representation of racial<br />
and ethnic groups in special education and<br />
related services that is a result of<br />
inappropriate identification (e.g.<br />
monitoring data, review of policies,<br />
practices, and procedures under 618(d),<br />
etc.).<br />
State<br />
Rate<br />
State<br />
Target<br />
88.00%<br />
96.00%<br />
State<br />
Target<br />
0.00% 0.00%<br />
LEA<br />
Rate<br />
— —<br />
100.00%<br />
Indicator 10: Disproportionality-Child with a Disability<br />
Disproportionate representation of racial<br />
and ethnic groups in specific disability<br />
categories that is a result of inappropriate<br />
identification (e.g. monitoring data, review<br />
of policies, practices, and procedures under<br />
618(d), etc.).<br />
Indicator 11: Child Find<br />
Percent of children with<br />
parental consent to evaluate<br />
who are evaluated within<br />
the State established timeline<br />
of 60 days.<br />
Overall<br />
(3-21)<br />
Early Childhood<br />
(3-5)<br />
School Age<br />
(5-21)<br />
State<br />
Rate<br />
0.00%<br />
Indicator 12: Early Childhood Transition<br />
Percent of children referred by Part C prior to<br />
age 3, who are found eligible for Part B, and<br />
who have an IEP developed and implemented<br />
by their third birthday.<br />
Note: - - denotes not applicable<br />
State<br />
Rate<br />
99.41%<br />
99.70%<br />
98.97%<br />
State<br />
Rate<br />
State<br />
Target<br />
0.00%<br />
State<br />
Target<br />
100.00%<br />
100.00%<br />
100.00%<br />
State<br />
Target<br />
Target Met by<br />
LEA (Y/N)<br />
Y<br />
Target Met by<br />
LEA (Y/N)<br />
Y<br />
LEA<br />
Rate<br />
100.00%<br />
— —<br />
100.00%<br />
LEA<br />
Rate<br />
Target Met by<br />
LEA (Y/N)<br />
N/A<br />
Y<br />
Note: The target for Indicator 09 is to have zero percent<br />
(0%) of districts identified as having disproportionate<br />
representation as a result of inappropriate<br />
identification in eligibility.<br />
Note: The target for Indicator 10 is to have zero<br />
percent (0%) of districts identified as having<br />
disproportionate representation as a result of<br />
inappropriate identification in a disability<br />
category.<br />
Target Met by<br />
LEA (Y/N)<br />
N/A<br />
Y<br />
Target Met<br />
by LEA<br />
(Y/N)<br />
99.21% 100.00% - - N/A<br />
Y<br />
Note: * Indicates a zero reponse rate for the<br />
district.<br />
Page 4 of 5
LEA: 0407 - PEA RIDGE SCHOOL <strong>DISTRICT</strong><br />
Indicator 13: Secondary Transition<br />
Percent of youth with disabilities aged 16 and<br />
up with an IEP that includes coordinated,<br />
measurable, annual IEP goals and transition<br />
services that will reasonably enable the student<br />
to meet the post-secondary goals.<br />
Indicator 14: Post-School Outcomes<br />
A. Percent of youth enrolled in higher<br />
education within one year of leaving high<br />
school.<br />
State<br />
Rate<br />
State<br />
Target<br />
Note: Data for this Indicator is from the on-site monitoring of LEAs for the given year.<br />
B. Percent of youth enrolled in higher<br />
education or competitively employed<br />
within one year of leaving high school.<br />
C. Percent of youth enrolled in higher<br />
education or in some other postsecondary<br />
education or training program; or<br />
competitively employed or in some other<br />
employment within one year of leaving<br />
high school.<br />
State<br />
Rate<br />
Indicator 20: Reported Data-Timely and Accurate*<br />
District submitted<br />
required data elements<br />
on or before due dates;<br />
made revisions within<br />
the alloted reveiw<br />
periods.<br />
Accurate and Timely<br />
Data Submission<br />
Overall (3-21)<br />
Early Childhood (3-5)<br />
School Age (5-21)<br />
State<br />
Target<br />
100.00%<br />
100.00%<br />
100.00%<br />
State<br />
Target<br />
LEA<br />
Rate<br />
LEA<br />
Rate<br />
Target Met by<br />
LEA (Y/N)<br />
Target Met<br />
by LEA<br />
(Y/N)<br />
Target Met<br />
by LEA<br />
(Y/N)<br />
*Data reviewed for timely and accurate submissions included all APSCN cycle data except for personnel<br />
Note: - - denotes not applicable<br />
96.19 100.00 — — N/A<br />
14.53<br />
State<br />
Rate<br />
49.42<br />
State<br />
Rate<br />
54.07<br />
13.00<br />
State<br />
Target<br />
49.00<br />
State<br />
Target<br />
60.00<br />
Y<br />
N/A<br />
Y<br />
— —<br />
LEA<br />
Rate<br />
— —<br />
LEA<br />
Rate<br />
— —<br />
N/A<br />
Target Met<br />
by LEA<br />
(Y/N)<br />
N/A<br />
Target Met<br />
by LEA<br />
(Y/N)<br />
N/A<br />
Page 5 of 5
<strong>ARKANSAS</strong> <strong>SPECIAL</strong> <strong>EDUCATION</strong><br />
<strong>DISTRICT</strong> <strong>ANNUAL</strong> PERFORMANCE REPORT<br />
2010/11 School Year<br />
Publication Date: March 2012<br />
Each State must have in place a State Performance Plan (SPP) to evaluate the State's efforts to meet the requirements and<br />
purposes of the implementation of the Individuals with Disabilities Education Act (IDEA). The SPP is a six-year plan, which<br />
describes Arkansas's performance on 20 indicators. The Office of Special Education Programs in the U. S. Department of<br />
Education requires that States report annually to the public on the performance of each local education agency (LEA) on 14 of<br />
20 indicators as compared with targets established by the State in the SPP. Arkansas will report indicators 1 through 14 and<br />
20 for each LEA serving children with disabilities (CWD). Any LEA not meeting targets on compliance indicators (0% for<br />
Indicators 4B, 09 & 10 and 100% for Indicators 11, 12, 13, and 20) are non-compliant with IDEA.<br />
There are no report changes for the 2010/11 school year profile; However, it is important to recognize that: .<br />
1. Indicator 01 (Graduation) is reported a year in arrear (2009/10 graduates) and is based on a four-year cohort. This<br />
means the rate is a measure of students who entered in ninth grade and graduate in four years. The calculation is a<br />
requirement under Title I of the Elementary and Secondary Education Act (ESEA).<br />
2. Indicator 02 (Drop out) is reported a year in arrear. This means the rate is a measure of students who dropped out in<br />
the 2009/10 school year. The Indicator 02 data are aligned with the Common Core of Data (CCD) requirements for<br />
grades 7-12.<br />
3. Indicator 04A and 4B (Suspension/Expulsion) is reported a year in arrear. This means the rate is a measure of<br />
students who had out-of-school suspensions and/or expulsions totaling more than 10 days.<br />
For a complete description of all the Indicators, please visit the special education website at<br />
http://arksped.k12.ar.us/sections/policy.html<br />
LEA: 0440 - BENTON COUNTY SCHOOL OF ARTS<br />
Indicator 01: Graduation Rates (2009/10 school year) Indicator 02: Dropout Rates (2009/10 school year)<br />
Percent of youth<br />
with IEPs<br />
graduating from<br />
high school with a<br />
regular diploma<br />
State<br />
Rate<br />
State<br />
Target<br />
75.76% 85.00%<br />
LEA<br />
Rate<br />
100.00%<br />
Target Met<br />
by LEA<br />
(Y/N)<br />
Y<br />
Percent of<br />
youth with<br />
IEPs dropping<br />
out of high<br />
school<br />
State<br />
Rate<br />
Indicator 03: Assessment on Statewide Benchmark Exam (grades 3-8, 11)<br />
A) Adequate Yearly Progress<br />
n=40<br />
Literacy<br />
Mathematics<br />
Met Disability Subgroup "n"<br />
for Reporting Purposes (Y/N)<br />
State Target for % of Districts Meeting<br />
AYP for Disability Subgroup<br />
State<br />
Target<br />
3.06% 4.20%<br />
LEA<br />
Rate<br />
0.00%<br />
% of Districts Meeting AYP<br />
for Disability Subgroup<br />
Target Met by<br />
LEA (Y/N)<br />
Y<br />
Target Met by<br />
LEA(Y/N)<br />
Overall N 17.15% 6.25%<br />
NA<br />
N<br />
N<br />
Note: For a district to qualify as having a disability subgroup it must have a minimum of 40 (n=40) students with disabilities in a school building.<br />
B) Participation<br />
Participation Rate: # of<br />
CWD Tested ÷ # of CWD<br />
Enrolled in grades tested.<br />
Participation Rate: Literacy<br />
Participation Rate: Math<br />
Note: - - denotes not applicable<br />
State<br />
Rate<br />
98.78%<br />
State<br />
Target<br />
95.00%<br />
LEA<br />
Rate<br />
100.00%<br />
Target Met<br />
by LEA (Y/N)<br />
98.61% 95.00% 95.45% Y<br />
Y<br />
C) Performance Proficiency<br />
Percent of CWD Scoring<br />
Proficient or Above<br />
Proficiency Rate: Literacy<br />
Proficiency Rate:<br />
Mathematics<br />
16.00%<br />
16.00%<br />
State<br />
Rate<br />
31.49%<br />
44.86%<br />
State<br />
Target<br />
45.22%<br />
51.14%<br />
LEA<br />
Rate<br />
29.41%<br />
36.84%<br />
NA<br />
NA<br />
Target<br />
Met by<br />
LEA (Y/N)<br />
N<br />
N<br />
Page 1 of 5
LEA: 0440 - BENTON COUNTY SCHOOL OF ARTS<br />
Indicator 04: Out-of-School Suspensions and Expulsions (2009/10 school year)<br />
A) Suspension/Expulsion<br />
Percent difference of CWD with out-of- school suspensions and<br />
expulsions totaling greater than 10 days in a school year as<br />
compared to the same data for general education students in<br />
the district.<br />
B) Suspension/Expulsion by Race and Ethnicity<br />
Percent of districts that have: (a) a significant discrepancy, by race or<br />
ethnicity, in the rate of suspensions and expulsions of greater than 10<br />
days in a school year for children with IEPs; and (b) policies,<br />
procedures or practices that contribute to the significant discrepancy<br />
and do not comply with requirements relating to the development<br />
and implementation of IEPs, the use of positive behavioral<br />
interventions and supports, and procedural safeguards.<br />
Indicator 05: School Age (5-21) Least Restrictive Environment<br />
A) In the Regular Class 80% or more of the day<br />
Percent of CWD with<br />
IEPs receiving instruction<br />
in the regular class 80%<br />
or more of the day.<br />
State<br />
Rate<br />
State<br />
Target<br />
LEA<br />
Rate<br />
B) In the Regular Class less than 40% of the day<br />
Percent of CWD with<br />
IEPs receiving instruction<br />
in the regular class less<br />
than 60% of the day.<br />
53.87% 59.77%<br />
State<br />
Rate<br />
State<br />
Target<br />
12.42% 12.51%<br />
90.00%<br />
LEA<br />
Rate<br />
0.00%<br />
C) Other Settings outside the regular class<br />
Percent of CWD with IEPs served in<br />
public or private separate schools,<br />
residential placements, or<br />
homebound/hospital placements.<br />
State<br />
Rate<br />
State<br />
Target<br />
2.80% 2.56%<br />
Target Met<br />
by LEA (Y/N)<br />
Y<br />
Target Met<br />
by LEA (Y/N)<br />
Y<br />
LEA<br />
Rate<br />
0.00%<br />
Target Met<br />
by LEA(Y/N)<br />
Indicator 06: Early Childhood (3-5) Least Restrictive Environment<br />
A) Regular Early Childhood Program<br />
Percent of children (aged 3 through 5) with IEPs attending a regular<br />
early childhood program and receiving the majority of special<br />
education and related services in the regular early childhood program<br />
Allowable<br />
Difference<br />
LEA: 0440 - BENTON COUNTY SCHOOL OF ARTS<br />
Indicator 07: Preschool (3-5) Outcomes<br />
a) Percent of preschool CWD<br />
children who did not<br />
improve functioning.<br />
b) Percent of preschool CWD<br />
who improved but whose<br />
functioning remained below<br />
same age peers.<br />
c) Percent of preschool CWD<br />
who improved at a level<br />
nearer to same aged peers.<br />
d) Percent of preschool CWD<br />
who improved functioning to<br />
reach a level comparable to<br />
same age peers.<br />
e) Percent of preschool CWD<br />
children who maintain<br />
functioning at a level<br />
comparable to same aged<br />
peers.<br />
Summary<br />
Statements<br />
1) Of those preschool<br />
children who entered<br />
the preschool program<br />
below age expectations<br />
in each Outcome, the<br />
percent who<br />
substantially increased<br />
their rate of growth by<br />
the time they turned 6<br />
years of age or exited<br />
the program.<br />
2) The percent of<br />
preschool children who<br />
were functioning<br />
within age expectations<br />
in each Outcome by the<br />
time they turned 6<br />
years of age or exited<br />
A) Positive Social -Emotional<br />
Skills*<br />
State<br />
Rate<br />
A) Positive Social -<br />
Emotional Skills<br />
(Including social<br />
relationships)<br />
State<br />
Rate<br />
2.14%<br />
5.31%<br />
25.97%<br />
38.22%<br />
28.36%<br />
State<br />
Target<br />
LEA<br />
Rate<br />
LEA<br />
Rate<br />
— —<br />
— —<br />
— —<br />
— —<br />
— —<br />
Target<br />
Met by<br />
LEA(Y/N)<br />
B) Acquisition and Use of<br />
Knowledge and Skills<br />
(Including early language/<br />
communication and early literacy)<br />
B) Acquisition and Use of<br />
Knowledge and Skills **<br />
State<br />
Rate<br />
1.75%<br />
6.59%<br />
34.23%<br />
43.51%<br />
13.92%<br />
State<br />
Target<br />
LEA<br />
Rate<br />
Target<br />
Met by<br />
LEA(Y/N)<br />
C) Use of Appropriate Behaviors<br />
to Meet Their Needs<br />
State<br />
Rate<br />
State<br />
Target<br />
LEA<br />
Rate<br />
Target<br />
Met by<br />
LEA(Y/N)<br />
89.61% 90.50% — — N/A 90.31% 90.50% — — N/A 90.82% 92.50% — — N/A<br />
66.58% 69.50% — — N/A 57.43% 60.50% — — N/A 76.69% 78.50% — — N/A<br />
NOTE: * Including social relationships ** Including early language/ communication and early literacy<br />
Note: - - denotes not applicable<br />
State<br />
Rate<br />
LEA<br />
Rate<br />
— —<br />
— —<br />
— —<br />
— —<br />
— —<br />
C) Use of<br />
Appropriate<br />
Behaviors to<br />
Meet Their Needs<br />
State<br />
Rate<br />
4.51%<br />
17.34%<br />
41.72%<br />
34.97%<br />
LEA<br />
Rate<br />
1.46% — —<br />
— —<br />
— —<br />
— —<br />
— —<br />
Page 3 of 5
LEA: 0440 - BENTON COUNTY SCHOOL OF ARTS<br />
Indicator 08: Parent Involvement<br />
Percent of surveyed<br />
parents who reported<br />
school facilitated parent<br />
involvement as a means<br />
of improving services<br />
and results for children<br />
with disabilities.<br />
Early Childhood<br />
(3-5)<br />
School Age<br />
(5-21)<br />
State<br />
Rate<br />
90.47%<br />
95.05%<br />
Indicator 09: Disproportionality - Eligibility<br />
Disproportionate representation of racial<br />
and ethnic groups in special education and<br />
related services that is a result of<br />
inappropriate identification (e.g.<br />
monitoring data, review of policies,<br />
practices, and procedures under 618(d),<br />
etc.).<br />
State<br />
Rate<br />
State<br />
Target<br />
88.00%<br />
96.00%<br />
State<br />
Target<br />
0.00% 0.00%<br />
LEA<br />
Rate<br />
— —<br />
100.00%<br />
Indicator 10: Disproportionality-Child with a Disability<br />
Disproportionate representation of racial<br />
and ethnic groups in specific disability<br />
categories that is a result of inappropriate<br />
identification (e.g. monitoring data, review<br />
of policies, practices, and procedures under<br />
618(d), etc.).<br />
Indicator 11: Child Find<br />
Percent of children with<br />
parental consent to evaluate<br />
who are evaluated within<br />
the State established timeline<br />
of 60 days.<br />
Overall<br />
(3-21)<br />
Early Childhood<br />
(3-5)<br />
School Age<br />
(5-21)<br />
State<br />
Rate<br />
0.00%<br />
Indicator 12: Early Childhood Transition<br />
Percent of children referred by Part C prior to<br />
age 3, who are found eligible for Part B, and<br />
who have an IEP developed and implemented<br />
by their third birthday.<br />
Note: - - denotes not applicable<br />
State<br />
Rate<br />
99.41%<br />
99.70%<br />
98.97%<br />
State<br />
Rate<br />
State<br />
Target<br />
0.00%<br />
State<br />
Target<br />
100.00%<br />
100.00%<br />
100.00%<br />
State<br />
Target<br />
Target Met by<br />
LEA (Y/N)<br />
Y<br />
Target Met by<br />
LEA (Y/N)<br />
Y<br />
LEA<br />
Rate<br />
100.00%<br />
— —<br />
100.00%<br />
LEA<br />
Rate<br />
Target Met by<br />
LEA (Y/N)<br />
N/A<br />
Y<br />
Note: The target for Indicator 09 is to have zero percent<br />
(0%) of districts identified as having disproportionate<br />
representation as a result of inappropriate<br />
identification in eligibility.<br />
Note: The target for Indicator 10 is to have zero<br />
percent (0%) of districts identified as having<br />
disproportionate representation as a result of<br />
inappropriate identification in a disability<br />
category.<br />
Target Met by<br />
LEA (Y/N)<br />
N/A<br />
Y<br />
Target Met<br />
by LEA<br />
(Y/N)<br />
99.21% 100.00% - - N/A<br />
Y<br />
Note: * Indicates a zero reponse rate for the<br />
district.<br />
Page 4 of 5
LEA: 0440 - BENTON COUNTY SCHOOL OF ARTS<br />
Indicator 13: Secondary Transition<br />
Percent of youth with disabilities aged 16 and<br />
up with an IEP that includes coordinated,<br />
measurable, annual IEP goals and transition<br />
services that will reasonably enable the student<br />
to meet the post-secondary goals.<br />
Indicator 14: Post-School Outcomes<br />
A. Percent of youth enrolled in higher<br />
education within one year of leaving high<br />
school.<br />
State<br />
Rate<br />
State<br />
Target<br />
Note: Data for this Indicator is from the on-site monitoring of LEAs for the given year.<br />
B. Percent of youth enrolled in higher<br />
education or competitively employed<br />
within one year of leaving high school.<br />
C. Percent of youth enrolled in higher<br />
education or in some other postsecondary<br />
education or training program; or<br />
competitively employed or in some other<br />
employment within one year of leaving<br />
high school.<br />
State<br />
Rate<br />
Indicator 20: Reported Data-Timely and Accurate*<br />
District submitted<br />
required data elements<br />
on or before due dates;<br />
made revisions within<br />
the alloted reveiw<br />
periods.<br />
Accurate and Timely<br />
Data Submission<br />
Overall (3-21)<br />
Early Childhood (3-5)<br />
School Age (5-21)<br />
State<br />
Target<br />
100.00%<br />
100.00%<br />
100.00%<br />
State<br />
Target<br />
LEA<br />
Rate<br />
LEA<br />
Rate<br />
Target Met by<br />
LEA (Y/N)<br />
Target Met<br />
by LEA<br />
(Y/N)<br />
Target Met<br />
by LEA<br />
(Y/N)<br />
*Data reviewed for timely and accurate submissions included all APSCN cycle data except for personnel<br />
Note: - - denotes not applicable<br />
96.19 100.00 — — N/A<br />
14.53<br />
State<br />
Rate<br />
49.42<br />
State<br />
Rate<br />
54.07<br />
13.00<br />
State<br />
Target<br />
49.00<br />
State<br />
Target<br />
60.00<br />
Y<br />
N/A<br />
Y<br />
— —<br />
LEA<br />
Rate<br />
— —<br />
LEA<br />
Rate<br />
— —<br />
N/A<br />
Target Met<br />
by LEA<br />
(Y/N)<br />
N/A<br />
Target Met<br />
by LEA<br />
(Y/N)<br />
N/A<br />
Page 5 of 5
LEA: 0501 - ALPENA SCHOOL <strong>DISTRICT</strong><br />
<strong>ARKANSAS</strong> <strong>SPECIAL</strong> <strong>EDUCATION</strong><br />
<strong>DISTRICT</strong> <strong>ANNUAL</strong> PERFORMANCE REPORT<br />
2010/11 School Year<br />
Publication Date: March 2012<br />
Each State must have in place a State Performance Plan (SPP) to evaluate the State's efforts to meet the requirements and<br />
purposes of the implementation of the Individuals with Disabilities Education Act (IDEA). The SPP is a six-year plan, which<br />
describes Arkansas's performance on 20 indicators. The Office of Special Education Programs in the U. S. Department of<br />
Education requires that States report annually to the public on the performance of each local education agency (LEA) on 14 of<br />
20 indicators as compared with targets established by the State in the SPP. Arkansas will report indicators 1 through 14 and<br />
20 for each LEA serving children with disabilities (CWD). Any LEA not meeting targets on compliance indicators (0% for<br />
Indicators 4B, 09 & 10 and 100% for Indicators 11, 12, 13, and 20) are non-compliant with IDEA.<br />
There are no report changes for the 2010/11 school year profile; However, it is important to recognize that: .<br />
1. Indicator 01 (Graduation) is reported a year in arrear (2009/10 graduates) and is based on a four-year cohort. This<br />
means the rate is a measure of students who entered in ninth grade and graduate in four years. The calculation is a<br />
requirement under Title I of the Elementary and Secondary Education Act (ESEA).<br />
2. Indicator 02 (Drop out) is reported a year in arrear. This means the rate is a measure of students who dropped out in<br />
the 2009/10 school year. The Indicator 02 data are aligned with the Common Core of Data (CCD) requirements for<br />
grades 7-12.<br />
3. Indicator 04A and 4B (Suspension/Expulsion) is reported a year in arrear. This means the rate is a measure of<br />
students who had out-of-school suspensions and/or expulsions totaling more than 10 days.<br />
Percent of youth<br />
with IEPs<br />
graduating from<br />
high school with a<br />
regular diploma<br />
For a complete description of all the Indicators, please visit the special education website at<br />
http://arksped.k12.ar.us/sections/policy.html<br />
Indicator 01: Graduation Rates (2009/10 school year) Indicator 02: Dropout Rates (2009/10 school year)<br />
State<br />
Rate<br />
State<br />
Target<br />
75.76% 85.00%<br />
LEA<br />
Rate<br />
77.78%<br />
Target Met<br />
by LEA<br />
(Y/N)<br />
N<br />
Percent of<br />
youth with<br />
IEPs dropping<br />
out of high<br />
school<br />
State<br />
Rate<br />
Indicator 03: Assessment on Statewide Benchmark Exam (grades 3-8, 11)<br />
A) Adequate Yearly Progress<br />
n=40<br />
Literacy<br />
Mathematics<br />
Met Disability Subgroup "n"<br />
for Reporting Purposes (Y/N)<br />
State Target for % of Districts Meeting<br />
AYP for Disability Subgroup<br />
State<br />
Target<br />
3.06% 4.20%<br />
LEA<br />
Rate<br />
2.38%<br />
% of Districts Meeting AYP<br />
for Disability Subgroup<br />
Target Met by<br />
LEA (Y/N)<br />
Y<br />
Target Met by<br />
LEA(Y/N)<br />
Overall N 17.15% 6.25%<br />
NA<br />
N<br />
N<br />
Note: For a district to qualify as having a disability subgroup it must have a minimum of 40 (n=40) students with disabilities in a school building.<br />
B) Participation<br />
Participation Rate: # of<br />
CWD Tested ÷ # of CWD<br />
Enrolled in grades tested.<br />
Participation Rate: Literacy<br />
Participation Rate: Math<br />
Note: - - denotes not applicable<br />
State<br />
Rate<br />
98.78%<br />
State<br />
Target<br />
95.00%<br />
LEA<br />
Rate<br />
100.00%<br />
Target Met<br />
by LEA (Y/N)<br />
98.61% 95.00% 100.00% Y<br />
Y<br />
C) Performance Proficiency<br />
Percent of CWD Scoring<br />
Proficient or Above<br />
Proficiency Rate: Literacy<br />
Proficiency Rate:<br />
Mathematics<br />
16.00%<br />
16.00%<br />
State<br />
Rate<br />
31.49%<br />
44.86%<br />
State<br />
Target<br />
45.22%<br />
51.14%<br />
LEA<br />
Rate<br />
28.89%<br />
47.73%<br />
NA<br />
NA<br />
Target<br />
Met by<br />
LEA (Y/N)<br />
N<br />
N<br />
Page 1 of 5
LEA: 0501 - ALPENA SCHOOL <strong>DISTRICT</strong><br />
Indicator 04: Out-of-School Suspensions and Expulsions (2009/10 school year)<br />
A) Suspension/Expulsion<br />
Percent difference of CWD with out-of- school suspensions and<br />
expulsions totaling greater than 10 days in a school year as<br />
compared to the same data for general education students in<br />
the district.<br />
B) Suspension/Expulsion by Race and Ethnicity<br />
Percent of districts that have: (a) a significant discrepancy, by race or<br />
ethnicity, in the rate of suspensions and expulsions of greater than 10<br />
days in a school year for children with IEPs; and (b) policies,<br />
procedures or practices that contribute to the significant discrepancy<br />
and do not comply with requirements relating to the development<br />
and implementation of IEPs, the use of positive behavioral<br />
interventions and supports, and procedural safeguards.<br />
Indicator 05: School Age (5-21) Least Restrictive Environment<br />
A) In the Regular Class 80% or more of the day<br />
Percent of CWD with<br />
IEPs receiving instruction<br />
in the regular class 80%<br />
or more of the day.<br />
State<br />
Rate<br />
State<br />
Target<br />
LEA<br />
Rate<br />
B) In the Regular Class less than 40% of the day<br />
Percent of CWD with<br />
IEPs receiving instruction<br />
in the regular class less<br />
than 60% of the day.<br />
53.87% 59.77%<br />
State<br />
Rate<br />
State<br />
Target<br />
12.42% 12.51%<br />
71.60%<br />
LEA<br />
Rate<br />
1.23%<br />
C) Other Settings outside the regular class<br />
Percent of CWD with IEPs served in<br />
public or private separate schools,<br />
residential placements, or<br />
homebound/hospital placements.<br />
State<br />
Rate<br />
State<br />
Target<br />
2.80% 2.56%<br />
Target Met<br />
by LEA (Y/N)<br />
Y<br />
Target Met<br />
by LEA (Y/N)<br />
Y<br />
LEA<br />
Rate<br />
0.00%<br />
Target Met<br />
by LEA(Y/N)<br />
Indicator 06: Early Childhood (3-5) Least Restrictive Environment<br />
A) Regular Early Childhood Program<br />
Percent of children (aged 3 through 5) with IEPs attending a regular<br />
early childhood program and receiving the majority of special<br />
education and related services in the regular early childhood program<br />
Allowable<br />
Difference<br />
LEA: 0501 - ALPENA SCHOOL <strong>DISTRICT</strong><br />
Indicator 07: Preschool (3-5) Outcomes<br />
a) Percent of preschool CWD<br />
children who did not<br />
improve functioning.<br />
b) Percent of preschool CWD<br />
who improved but whose<br />
functioning remained below<br />
same age peers.<br />
c) Percent of preschool CWD<br />
who improved at a level<br />
nearer to same aged peers.<br />
d) Percent of preschool CWD<br />
who improved functioning to<br />
reach a level comparable to<br />
same age peers.<br />
e) Percent of preschool CWD<br />
children who maintain<br />
functioning at a level<br />
comparable to same aged<br />
peers.<br />
Summary<br />
Statements<br />
1) Of those preschool<br />
children who entered<br />
the preschool program<br />
below age expectations<br />
in each Outcome, the<br />
percent who<br />
substantially increased<br />
their rate of growth by<br />
the time they turned 6<br />
years of age or exited<br />
the program.<br />
2) The percent of<br />
preschool children who<br />
were functioning<br />
within age expectations<br />
in each Outcome by the<br />
time they turned 6<br />
years of age or exited<br />
A) Positive Social -Emotional<br />
Skills*<br />
State<br />
Rate<br />
A) Positive Social -<br />
Emotional Skills<br />
(Including social<br />
relationships)<br />
State<br />
Rate<br />
2.14%<br />
5.31%<br />
25.97%<br />
38.22%<br />
28.36%<br />
State<br />
Target<br />
LEA<br />
Rate<br />
LEA<br />
Rate<br />
— —<br />
— —<br />
— —<br />
— —<br />
— —<br />
Target<br />
Met by<br />
LEA(Y/N)<br />
B) Acquisition and Use of<br />
Knowledge and Skills<br />
(Including early language/<br />
communication and early literacy)<br />
B) Acquisition and Use of<br />
Knowledge and Skills **<br />
State<br />
Rate<br />
1.75%<br />
6.59%<br />
34.23%<br />
43.51%<br />
13.92%<br />
State<br />
Target<br />
LEA<br />
Rate<br />
Target<br />
Met by<br />
LEA(Y/N)<br />
C) Use of Appropriate Behaviors<br />
to Meet Their Needs<br />
State<br />
Rate<br />
State<br />
Target<br />
LEA<br />
Rate<br />
Target<br />
Met by<br />
LEA(Y/N)<br />
89.61% 90.50% — — N/A 90.31% 90.50% — — N/A 90.82% 92.50% — — N/A<br />
66.58% 69.50% — — N/A 57.43% 60.50% — — N/A 76.69% 78.50% — — N/A<br />
NOTE: * Including social relationships ** Including early language/ communication and early literacy<br />
Note: - - denotes not applicable<br />
State<br />
Rate<br />
LEA<br />
Rate<br />
— —<br />
— —<br />
— —<br />
— —<br />
— —<br />
C) Use of<br />
Appropriate<br />
Behaviors to<br />
Meet Their Needs<br />
State<br />
Rate<br />
4.51%<br />
17.34%<br />
41.72%<br />
34.97%<br />
LEA<br />
Rate<br />
1.46% — —<br />
— —<br />
— —<br />
— —<br />
— —<br />
Page 3 of 5
LEA: 0501 - ALPENA SCHOOL <strong>DISTRICT</strong><br />
Indicator 08: Parent Involvement<br />
Percent of surveyed<br />
parents who reported<br />
school facilitated parent<br />
involvement as a means<br />
of improving services<br />
and results for children<br />
with disabilities.<br />
Early Childhood<br />
(3-5)<br />
School Age<br />
(5-21)<br />
State<br />
Rate<br />
90.47%<br />
95.05%<br />
Indicator 09: Disproportionality - Eligibility<br />
Disproportionate representation of racial<br />
and ethnic groups in special education and<br />
related services that is a result of<br />
inappropriate identification (e.g.<br />
monitoring data, review of policies,<br />
practices, and procedures under 618(d),<br />
etc.).<br />
State<br />
Rate<br />
State<br />
Target<br />
88.00%<br />
96.00%<br />
State<br />
Target<br />
0.00% 0.00%<br />
LEA<br />
Rate<br />
— —<br />
94.00%<br />
Indicator 10: Disproportionality-Child with a Disability<br />
Disproportionate representation of racial<br />
and ethnic groups in specific disability<br />
categories that is a result of inappropriate<br />
identification (e.g. monitoring data, review<br />
of policies, practices, and procedures under<br />
618(d), etc.).<br />
Indicator 11: Child Find<br />
Percent of children with<br />
parental consent to evaluate<br />
who are evaluated within<br />
the State established timeline<br />
of 60 days.<br />
Overall<br />
(3-21)<br />
Early Childhood<br />
(3-5)<br />
School Age<br />
(5-21)<br />
State<br />
Rate<br />
0.00%<br />
Indicator 12: Early Childhood Transition<br />
Percent of children referred by Part C prior to<br />
age 3, who are found eligible for Part B, and<br />
who have an IEP developed and implemented<br />
by their third birthday.<br />
Note: - - denotes not applicable<br />
State<br />
Rate<br />
99.41%<br />
99.70%<br />
98.97%<br />
State<br />
Rate<br />
State<br />
Target<br />
0.00%<br />
State<br />
Target<br />
100.00%<br />
100.00%<br />
100.00%<br />
State<br />
Target<br />
Target Met by<br />
LEA (Y/N)<br />
Y<br />
Target Met by<br />
LEA (Y/N)<br />
Y<br />
LEA<br />
Rate<br />
100.00%<br />
— —<br />
100.00%<br />
LEA<br />
Rate<br />
Target Met by<br />
LEA (Y/N)<br />
N/A<br />
N<br />
Note: The target for Indicator 09 is to have zero percent<br />
(0%) of districts identified as having disproportionate<br />
representation as a result of inappropriate<br />
identification in eligibility.<br />
Note: The target for Indicator 10 is to have zero<br />
percent (0%) of districts identified as having<br />
disproportionate representation as a result of<br />
inappropriate identification in a disability<br />
category.<br />
Target Met by<br />
LEA (Y/N)<br />
N/A<br />
Y<br />
Target Met<br />
by LEA<br />
(Y/N)<br />
99.21% 100.00% - - N/A<br />
Y<br />
Note: * Indicates a zero reponse rate for the<br />
district.<br />
Page 4 of 5
LEA: 0501 - ALPENA SCHOOL <strong>DISTRICT</strong><br />
Indicator 13: Secondary Transition<br />
Percent of youth with disabilities aged 16 and<br />
up with an IEP that includes coordinated,<br />
measurable, annual IEP goals and transition<br />
services that will reasonably enable the student<br />
to meet the post-secondary goals.<br />
Indicator 14: Post-School Outcomes<br />
A. Percent of youth enrolled in higher<br />
education within one year of leaving high<br />
school.<br />
State<br />
Rate<br />
State<br />
Target<br />
Note: Data for this Indicator is from the on-site monitoring of LEAs for the given year.<br />
B. Percent of youth enrolled in higher<br />
education or competitively employed<br />
within one year of leaving high school.<br />
C. Percent of youth enrolled in higher<br />
education or in some other postsecondary<br />
education or training program; or<br />
competitively employed or in some other<br />
employment within one year of leaving<br />
high school.<br />
State<br />
Rate<br />
Indicator 20: Reported Data-Timely and Accurate*<br />
District submitted<br />
required data elements<br />
on or before due dates;<br />
made revisions within<br />
the alloted reveiw<br />
periods.<br />
Accurate and Timely<br />
Data Submission<br />
Overall (3-21)<br />
Early Childhood (3-5)<br />
School Age (5-21)<br />
State<br />
Target<br />
100.00%<br />
100.00%<br />
100.00%<br />
State<br />
Target<br />
LEA<br />
Rate<br />
LEA<br />
Rate<br />
Target Met by<br />
LEA (Y/N)<br />
Target Met<br />
by LEA<br />
(Y/N)<br />
Target Met<br />
by LEA<br />
(Y/N)<br />
*Data reviewed for timely and accurate submissions included all APSCN cycle data except for personnel<br />
Note: - - denotes not applicable<br />
96.19 100.00 — — N/A<br />
14.53<br />
State<br />
Rate<br />
49.42<br />
State<br />
Rate<br />
54.07<br />
13.00<br />
State<br />
Target<br />
49.00<br />
State<br />
Target<br />
60.00<br />
Y<br />
N/A<br />
Y<br />
— —<br />
LEA<br />
Rate<br />
— —<br />
LEA<br />
Rate<br />
— —<br />
N/A<br />
Target Met<br />
by LEA<br />
(Y/N)<br />
N/A<br />
Target Met<br />
by LEA<br />
(Y/N)<br />
N/A<br />
Page 5 of 5
LEA: 0502 - BERGMAN SCHOOL <strong>DISTRICT</strong><br />
<strong>ARKANSAS</strong> <strong>SPECIAL</strong> <strong>EDUCATION</strong><br />
<strong>DISTRICT</strong> <strong>ANNUAL</strong> PERFORMANCE REPORT<br />
2010/11 School Year<br />
Publication Date: March 2012<br />
Each State must have in place a State Performance Plan (SPP) to evaluate the State's efforts to meet the requirements and<br />
purposes of the implementation of the Individuals with Disabilities Education Act (IDEA). The SPP is a six-year plan, which<br />
describes Arkansas's performance on 20 indicators. The Office of Special Education Programs in the U. S. Department of<br />
Education requires that States report annually to the public on the performance of each local education agency (LEA) on 14 of<br />
20 indicators as compared with targets established by the State in the SPP. Arkansas will report indicators 1 through 14 and<br />
20 for each LEA serving children with disabilities (CWD). Any LEA not meeting targets on compliance indicators (0% for<br />
Indicators 4B, 09 & 10 and 100% for Indicators 11, 12, 13, and 20) are non-compliant with IDEA.<br />
There are no report changes for the 2010/11 school year profile; However, it is important to recognize that: .<br />
1. Indicator 01 (Graduation) is reported a year in arrear (2009/10 graduates) and is based on a four-year cohort. This<br />
means the rate is a measure of students who entered in ninth grade and graduate in four years. The calculation is a<br />
requirement under Title I of the Elementary and Secondary Education Act (ESEA).<br />
2. Indicator 02 (Drop out) is reported a year in arrear. This means the rate is a measure of students who dropped out in<br />
the 2009/10 school year. The Indicator 02 data are aligned with the Common Core of Data (CCD) requirements for<br />
grades 7-12.<br />
3. Indicator 04A and 4B (Suspension/Expulsion) is reported a year in arrear. This means the rate is a measure of<br />
students who had out-of-school suspensions and/or expulsions totaling more than 10 days.<br />
Percent of youth<br />
with IEPs<br />
graduating from<br />
high school with a<br />
regular diploma<br />
For a complete description of all the Indicators, please visit the special education website at<br />
http://arksped.k12.ar.us/sections/policy.html<br />
Indicator 01: Graduation Rates (2009/10 school year) Indicator 02: Dropout Rates (2009/10 school year)<br />
State<br />
Rate<br />
State<br />
Target<br />
75.76% 85.00%<br />
LEA<br />
Rate<br />
100.00%<br />
Target Met<br />
by LEA<br />
(Y/N)<br />
Y<br />
Percent of<br />
youth with<br />
IEPs dropping<br />
out of high<br />
school<br />
State<br />
Rate<br />
Indicator 03: Assessment on Statewide Benchmark Exam (grades 3-8, 11)<br />
A) Adequate Yearly Progress<br />
n=40<br />
Literacy<br />
Mathematics<br />
Met Disability Subgroup "n"<br />
for Reporting Purposes (Y/N)<br />
State Target for % of Districts Meeting<br />
AYP for Disability Subgroup<br />
State<br />
Target<br />
3.06% 4.20%<br />
LEA<br />
Rate<br />
3.45%<br />
% of Districts Meeting AYP<br />
for Disability Subgroup<br />
Target Met by<br />
LEA (Y/N)<br />
Y<br />
Target Met by<br />
LEA(Y/N)<br />
Overall N 17.15% 6.25%<br />
NA<br />
N<br />
N<br />
Note: For a district to qualify as having a disability subgroup it must have a minimum of 40 (n=40) students with disabilities in a school building.<br />
B) Participation<br />
Participation Rate: # of<br />
CWD Tested ÷ # of CWD<br />
Enrolled in grades tested.<br />
Participation Rate: Literacy<br />
Participation Rate: Math<br />
Note: - - denotes not applicable<br />
State<br />
Rate<br />
98.78%<br />
State<br />
Target<br />
95.00%<br />
LEA<br />
Rate<br />
100.00%<br />
Target Met<br />
by LEA (Y/N)<br />
98.61% 95.00% 100.00% Y<br />
Y<br />
C) Performance Proficiency<br />
Percent of CWD Scoring<br />
Proficient or Above<br />
Proficiency Rate: Literacy<br />
Proficiency Rate:<br />
Mathematics<br />
16.00%<br />
16.00%<br />
State<br />
Rate<br />
31.49%<br />
44.86%<br />
State<br />
Target<br />
45.22%<br />
51.14%<br />
LEA<br />
Rate<br />
45.16%<br />
54.69%<br />
NA<br />
NA<br />
Target<br />
Met by<br />
LEA (Y/N)<br />
N<br />
Y<br />
Page 1 of 5
LEA: 0502 - BERGMAN SCHOOL <strong>DISTRICT</strong><br />
Indicator 04: Out-of-School Suspensions and Expulsions (2009/10 school year)<br />
A) Suspension/Expulsion<br />
Percent difference of CWD with out-of- school suspensions and<br />
expulsions totaling greater than 10 days in a school year as<br />
compared to the same data for general education students in<br />
the district.<br />
B) Suspension/Expulsion by Race and Ethnicity<br />
Percent of districts that have: (a) a significant discrepancy, by race or<br />
ethnicity, in the rate of suspensions and expulsions of greater than 10<br />
days in a school year for children with IEPs; and (b) policies,<br />
procedures or practices that contribute to the significant discrepancy<br />
and do not comply with requirements relating to the development<br />
and implementation of IEPs, the use of positive behavioral<br />
interventions and supports, and procedural safeguards.<br />
Indicator 05: School Age (5-21) Least Restrictive Environment<br />
A) In the Regular Class 80% or more of the day<br />
Percent of CWD with<br />
IEPs receiving instruction<br />
in the regular class 80%<br />
or more of the day.<br />
State<br />
Rate<br />
State<br />
Target<br />
LEA<br />
Rate<br />
B) In the Regular Class less than 40% of the day<br />
Percent of CWD with<br />
IEPs receiving instruction<br />
in the regular class less<br />
than 60% of the day.<br />
53.87% 59.77%<br />
State<br />
Rate<br />
State<br />
Target<br />
12.42% 12.51%<br />
62.88%<br />
LEA<br />
Rate<br />
4.55%<br />
C) Other Settings outside the regular class<br />
Percent of CWD with IEPs served in<br />
public or private separate schools,<br />
residential placements, or<br />
homebound/hospital placements.<br />
State<br />
Rate<br />
State<br />
Target<br />
2.80% 2.56%<br />
Target Met<br />
by LEA (Y/N)<br />
Y<br />
Target Met<br />
by LEA (Y/N)<br />
Y<br />
LEA<br />
Rate<br />
0.00%<br />
Target Met<br />
by LEA(Y/N)<br />
Indicator 06: Early Childhood (3-5) Least Restrictive Environment<br />
A) Regular Early Childhood Program<br />
Percent of children (aged 3 through 5) with IEPs attending a regular<br />
early childhood program and receiving the majority of special<br />
education and related services in the regular early childhood program<br />
Allowable<br />
Difference<br />
LEA: 0502 - BERGMAN SCHOOL <strong>DISTRICT</strong><br />
Indicator 07: Preschool (3-5) Outcomes<br />
a) Percent of preschool CWD<br />
children who did not<br />
improve functioning.<br />
b) Percent of preschool CWD<br />
who improved but whose<br />
functioning remained below<br />
same age peers.<br />
c) Percent of preschool CWD<br />
who improved at a level<br />
nearer to same aged peers.<br />
d) Percent of preschool CWD<br />
who improved functioning to<br />
reach a level comparable to<br />
same age peers.<br />
e) Percent of preschool CWD<br />
children who maintain<br />
functioning at a level<br />
comparable to same aged<br />
peers.<br />
Summary<br />
Statements<br />
1) Of those preschool<br />
children who entered<br />
the preschool program<br />
below age expectations<br />
in each Outcome, the<br />
percent who<br />
substantially increased<br />
their rate of growth by<br />
the time they turned 6<br />
years of age or exited<br />
the program.<br />
2) The percent of<br />
preschool children who<br />
were functioning<br />
within age expectations<br />
in each Outcome by the<br />
time they turned 6<br />
years of age or exited<br />
A) Positive Social -Emotional<br />
Skills*<br />
State<br />
Rate<br />
A) Positive Social -<br />
Emotional Skills<br />
(Including social<br />
relationships)<br />
State<br />
Rate<br />
2.14%<br />
5.31%<br />
25.97%<br />
38.22%<br />
28.36%<br />
State<br />
Target<br />
LEA<br />
Rate<br />
LEA<br />
Rate<br />
— —<br />
— —<br />
— —<br />
— —<br />
— —<br />
Target<br />
Met by<br />
LEA(Y/N)<br />
B) Acquisition and Use of<br />
Knowledge and Skills<br />
(Including early language/<br />
communication and early literacy)<br />
B) Acquisition and Use of<br />
Knowledge and Skills **<br />
State<br />
Rate<br />
1.75%<br />
6.59%<br />
34.23%<br />
43.51%<br />
13.92%<br />
State<br />
Target<br />
LEA<br />
Rate<br />
Target<br />
Met by<br />
LEA(Y/N)<br />
C) Use of Appropriate Behaviors<br />
to Meet Their Needs<br />
State<br />
Rate<br />
State<br />
Target<br />
LEA<br />
Rate<br />
Target<br />
Met by<br />
LEA(Y/N)<br />
89.61% 90.50% — — N/A 90.31% 90.50% — — N/A 90.82% 92.50% — — N/A<br />
66.58% 69.50% — — N/A 57.43% 60.50% — — N/A 76.69% 78.50% — — N/A<br />
NOTE: * Including social relationships ** Including early language/ communication and early literacy<br />
Note: - - denotes not applicable<br />
State<br />
Rate<br />
LEA<br />
Rate<br />
— —<br />
— —<br />
— —<br />
— —<br />
— —<br />
C) Use of<br />
Appropriate<br />
Behaviors to<br />
Meet Their Needs<br />
State<br />
Rate<br />
4.51%<br />
17.34%<br />
41.72%<br />
34.97%<br />
LEA<br />
Rate<br />
1.46% — —<br />
— —<br />
— —<br />
— —<br />
— —<br />
Page 3 of 5
LEA: 0502 - BERGMAN SCHOOL <strong>DISTRICT</strong><br />
Indicator 08: Parent Involvement<br />
Percent of surveyed<br />
parents who reported<br />
school facilitated parent<br />
involvement as a means<br />
of improving services<br />
and results for children<br />
with disabilities.<br />
Early Childhood<br />
(3-5)<br />
School Age<br />
(5-21)<br />
State<br />
Rate<br />
90.47%<br />
95.05%<br />
Indicator 09: Disproportionality - Eligibility<br />
Disproportionate representation of racial<br />
and ethnic groups in special education and<br />
related services that is a result of<br />
inappropriate identification (e.g.<br />
monitoring data, review of policies,<br />
practices, and procedures under 618(d),<br />
etc.).<br />
State<br />
Rate<br />
State<br />
Target<br />
88.00%<br />
96.00%<br />
State<br />
Target<br />
0.00% 0.00%<br />
LEA<br />
Rate<br />
— —<br />
97.26%<br />
Indicator 10: Disproportionality-Child with a Disability<br />
Disproportionate representation of racial<br />
and ethnic groups in specific disability<br />
categories that is a result of inappropriate<br />
identification (e.g. monitoring data, review<br />
of policies, practices, and procedures under<br />
618(d), etc.).<br />
Indicator 11: Child Find<br />
Percent of children with<br />
parental consent to evaluate<br />
who are evaluated within<br />
the State established timeline<br />
of 60 days.<br />
Overall<br />
(3-21)<br />
Early Childhood<br />
(3-5)<br />
School Age<br />
(5-21)<br />
State<br />
Rate<br />
0.00%<br />
Indicator 12: Early Childhood Transition<br />
Percent of children referred by Part C prior to<br />
age 3, who are found eligible for Part B, and<br />
who have an IEP developed and implemented<br />
by their third birthday.<br />
Note: - - denotes not applicable<br />
State<br />
Rate<br />
99.41%<br />
99.70%<br />
98.97%<br />
State<br />
Rate<br />
State<br />
Target<br />
0.00%<br />
State<br />
Target<br />
100.00%<br />
100.00%<br />
100.00%<br />
State<br />
Target<br />
Target Met by<br />
LEA (Y/N)<br />
Y<br />
Target Met by<br />
LEA (Y/N)<br />
Y<br />
LEA<br />
Rate<br />
100.00%<br />
— —<br />
100.00%<br />
LEA<br />
Rate<br />
Target Met by<br />
LEA (Y/N)<br />
N/A<br />
Y<br />
Note: The target for Indicator 09 is to have zero percent<br />
(0%) of districts identified as having disproportionate<br />
representation as a result of inappropriate<br />
identification in eligibility.<br />
Note: The target for Indicator 10 is to have zero<br />
percent (0%) of districts identified as having<br />
disproportionate representation as a result of<br />
inappropriate identification in a disability<br />
category.<br />
Target Met by<br />
LEA (Y/N)<br />
N/A<br />
Y<br />
Target Met<br />
by LEA<br />
(Y/N)<br />
99.21% 100.00% - - N/A<br />
Y<br />
Note: * Indicates a zero reponse rate for the<br />
district.<br />
Page 4 of 5
LEA: 0502 - BERGMAN SCHOOL <strong>DISTRICT</strong><br />
Indicator 13: Secondary Transition<br />
Percent of youth with disabilities aged 16 and<br />
up with an IEP that includes coordinated,<br />
measurable, annual IEP goals and transition<br />
services that will reasonably enable the student<br />
to meet the post-secondary goals.<br />
Indicator 14: Post-School Outcomes<br />
A. Percent of youth enrolled in higher<br />
education within one year of leaving high<br />
school.<br />
State<br />
Rate<br />
State<br />
Target<br />
Note: Data for this Indicator is from the on-site monitoring of LEAs for the given year.<br />
B. Percent of youth enrolled in higher<br />
education or competitively employed<br />
within one year of leaving high school.<br />
C. Percent of youth enrolled in higher<br />
education or in some other postsecondary<br />
education or training program; or<br />
competitively employed or in some other<br />
employment within one year of leaving<br />
high school.<br />
State<br />
Rate<br />
Indicator 20: Reported Data-Timely and Accurate*<br />
District submitted<br />
required data elements<br />
on or before due dates;<br />
made revisions within<br />
the alloted reveiw<br />
periods.<br />
Accurate and Timely<br />
Data Submission<br />
Overall (3-21)<br />
Early Childhood (3-5)<br />
School Age (5-21)<br />
State<br />
Target<br />
100.00%<br />
100.00%<br />
100.00%<br />
State<br />
Target<br />
LEA<br />
Rate<br />
LEA<br />
Rate<br />
Target Met by<br />
LEA (Y/N)<br />
Target Met<br />
by LEA<br />
(Y/N)<br />
Target Met<br />
by LEA<br />
(Y/N)<br />
*Data reviewed for timely and accurate submissions included all APSCN cycle data except for personnel<br />
Note: - - denotes not applicable<br />
96.19 100.00 100.00% Y<br />
14.53<br />
State<br />
Rate<br />
49.42<br />
State<br />
Rate<br />
54.07<br />
13.00<br />
State<br />
Target<br />
49.00<br />
State<br />
Target<br />
60.00<br />
Y<br />
N/A<br />
Y<br />
— —<br />
LEA<br />
Rate<br />
— —<br />
LEA<br />
Rate<br />
— —<br />
N/A<br />
Target Met<br />
by LEA<br />
(Y/N)<br />
N/A<br />
Target Met<br />
by LEA<br />
(Y/N)<br />
N/A<br />
Page 5 of 5
LEA: 0503 - HARRISON SCHOOL <strong>DISTRICT</strong><br />
<strong>ARKANSAS</strong> <strong>SPECIAL</strong> <strong>EDUCATION</strong><br />
<strong>DISTRICT</strong> <strong>ANNUAL</strong> PERFORMANCE REPORT<br />
2010/11 School Year<br />
Publication Date: March 2012<br />
Each State must have in place a State Performance Plan (SPP) to evaluate the State's efforts to meet the requirements and<br />
purposes of the implementation of the Individuals with Disabilities Education Act (IDEA). The SPP is a six-year plan, which<br />
describes Arkansas's performance on 20 indicators. The Office of Special Education Programs in the U. S. Department of<br />
Education requires that States report annually to the public on the performance of each local education agency (LEA) on 14 of<br />
20 indicators as compared with targets established by the State in the SPP. Arkansas will report indicators 1 through 14 and<br />
20 for each LEA serving children with disabilities (CWD). Any LEA not meeting targets on compliance indicators (0% for<br />
Indicators 4B, 09 & 10 and 100% for Indicators 11, 12, 13, and 20) are non-compliant with IDEA.<br />
There are no report changes for the 2010/11 school year profile; However, it is important to recognize that: .<br />
1. Indicator 01 (Graduation) is reported a year in arrear (2009/10 graduates) and is based on a four-year cohort. This<br />
means the rate is a measure of students who entered in ninth grade and graduate in four years. The calculation is a<br />
requirement under Title I of the Elementary and Secondary Education Act (ESEA).<br />
2. Indicator 02 (Drop out) is reported a year in arrear. This means the rate is a measure of students who dropped out in<br />
the 2009/10 school year. The Indicator 02 data are aligned with the Common Core of Data (CCD) requirements for<br />
grades 7-12.<br />
3. Indicator 04A and 4B (Suspension/Expulsion) is reported a year in arrear. This means the rate is a measure of<br />
students who had out-of-school suspensions and/or expulsions totaling more than 10 days.<br />
Percent of youth<br />
with IEPs<br />
graduating from<br />
high school with a<br />
regular diploma<br />
For a complete description of all the Indicators, please visit the special education website at<br />
http://arksped.k12.ar.us/sections/policy.html<br />
Indicator 01: Graduation Rates (2009/10 school year) Indicator 02: Dropout Rates (2009/10 school year)<br />
State<br />
Rate<br />
State<br />
Target<br />
75.76% 85.00%<br />
LEA<br />
Rate<br />
56.25%<br />
Target Met<br />
by LEA<br />
(Y/N)<br />
N<br />
Percent of<br />
youth with<br />
IEPs dropping<br />
out of high<br />
school<br />
State<br />
Rate<br />
Indicator 03: Assessment on Statewide Benchmark Exam (grades 3-8, 11)<br />
A) Adequate Yearly Progress<br />
n=40<br />
Literacy<br />
Mathematics<br />
Met Disability Subgroup "n"<br />
for Reporting Purposes (Y/N)<br />
State Target for % of Districts Meeting<br />
AYP for Disability Subgroup<br />
State<br />
Target<br />
3.06% 4.20%<br />
LEA<br />
Rate<br />
2.78%<br />
% of Districts Meeting AYP<br />
for Disability Subgroup<br />
Target Met by<br />
LEA (Y/N)<br />
Y<br />
Target Met by<br />
LEA(Y/N)<br />
Overall N 17.15% 6.25%<br />
NA<br />
N<br />
N<br />
Note: For a district to qualify as having a disability subgroup it must have a minimum of 40 (n=40) students with disabilities in a school building.<br />
B) Participation<br />
Participation Rate: # of<br />
CWD Tested ÷ # of CWD<br />
Enrolled in grades tested.<br />
Participation Rate: Literacy<br />
Participation Rate: Math<br />
Note: - - denotes not applicable<br />
State<br />
Rate<br />
98.78%<br />
State<br />
Target<br />
95.00%<br />
LEA<br />
Rate<br />
100.00%<br />
Target Met<br />
by LEA (Y/N)<br />
98.61% 95.00% 100.00% Y<br />
Y<br />
C) Performance Proficiency<br />
Percent of CWD Scoring<br />
Proficient or Above<br />
Proficiency Rate: Literacy<br />
Proficiency Rate:<br />
Mathematics<br />
16.00%<br />
16.00%<br />
State<br />
Rate<br />
31.49%<br />
44.86%<br />
State<br />
Target<br />
45.22%<br />
51.14%<br />
LEA<br />
Rate<br />
38.39%<br />
45.60%<br />
NA<br />
NA<br />
Target<br />
Met by<br />
LEA (Y/N)<br />
N<br />
N<br />
Page 1 of 5
LEA: 0503 - HARRISON SCHOOL <strong>DISTRICT</strong><br />
Indicator 04: Out-of-School Suspensions and Expulsions (2009/10 school year)<br />
A) Suspension/Expulsion<br />
Percent difference of CWD with out-of- school suspensions and<br />
expulsions totaling greater than 10 days in a school year as<br />
compared to the same data for general education students in<br />
the district.<br />
B) Suspension/Expulsion by Race and Ethnicity<br />
Percent of districts that have: (a) a significant discrepancy, by race or<br />
ethnicity, in the rate of suspensions and expulsions of greater than 10<br />
days in a school year for children with IEPs; and (b) policies,<br />
procedures or practices that contribute to the significant discrepancy<br />
and do not comply with requirements relating to the development<br />
and implementation of IEPs, the use of positive behavioral<br />
interventions and supports, and procedural safeguards.<br />
Indicator 05: School Age (5-21) Least Restrictive Environment<br />
A) In the Regular Class 80% or more of the day<br />
Percent of CWD with<br />
IEPs receiving instruction<br />
in the regular class 80%<br />
or more of the day.<br />
State<br />
Rate<br />
State<br />
Target<br />
LEA<br />
Rate<br />
B) In the Regular Class less than 40% of the day<br />
Percent of CWD with<br />
IEPs receiving instruction<br />
in the regular class less<br />
than 60% of the day.<br />
53.87% 59.77%<br />
State<br />
Rate<br />
State<br />
Target<br />
12.42% 12.51%<br />
56.42%<br />
LEA<br />
Rate<br />
11.28%<br />
C) Other Settings outside the regular class<br />
Percent of CWD with IEPs served in<br />
public or private separate schools,<br />
residential placements, or<br />
homebound/hospital placements.<br />
State<br />
Rate<br />
State<br />
Target<br />
2.80% 2.56%<br />
Target Met<br />
by LEA (Y/N)<br />
N<br />
Target Met<br />
by LEA (Y/N)<br />
Y<br />
LEA<br />
Rate<br />
1.56%<br />
Target Met<br />
by LEA(Y/N)<br />
Indicator 06: Early Childhood (3-5) Least Restrictive Environment<br />
A) Regular Early Childhood Program<br />
Percent of children (aged 3 through 5) with IEPs attending a regular<br />
early childhood program and receiving the majority of special<br />
education and related services in the regular early childhood program<br />
Allowable<br />
Difference<br />
LEA: 0503 - HARRISON SCHOOL <strong>DISTRICT</strong><br />
Indicator 07: Preschool (3-5) Outcomes<br />
a) Percent of preschool CWD<br />
children who did not<br />
improve functioning.<br />
b) Percent of preschool CWD<br />
who improved but whose<br />
functioning remained below<br />
same age peers.<br />
c) Percent of preschool CWD<br />
who improved at a level<br />
nearer to same aged peers.<br />
d) Percent of preschool CWD<br />
who improved functioning to<br />
reach a level comparable to<br />
same age peers.<br />
e) Percent of preschool CWD<br />
children who maintain<br />
functioning at a level<br />
comparable to same aged<br />
peers.<br />
Summary<br />
Statements<br />
1) Of those preschool<br />
children who entered<br />
the preschool program<br />
below age expectations<br />
in each Outcome, the<br />
percent who<br />
substantially increased<br />
their rate of growth by<br />
the time they turned 6<br />
years of age or exited<br />
the program.<br />
2) The percent of<br />
preschool children who<br />
were functioning<br />
within age expectations<br />
in each Outcome by the<br />
time they turned 6<br />
years of age or exited<br />
A) Positive Social -Emotional<br />
Skills*<br />
State<br />
Rate<br />
A) Positive Social -<br />
Emotional Skills<br />
(Including social<br />
relationships)<br />
State<br />
Rate<br />
2.14%<br />
5.31%<br />
25.97%<br />
38.22%<br />
28.36%<br />
State<br />
Target<br />
LEA<br />
Rate<br />
LEA<br />
Rate<br />
— —<br />
10.00%<br />
10.00%<br />
50.00%<br />
30.00%<br />
Target<br />
Met by<br />
LEA(Y/N)<br />
B) Acquisition and Use of<br />
Knowledge and Skills<br />
(Including early language/<br />
communication and early literacy)<br />
B) Acquisition and Use of<br />
Knowledge and Skills **<br />
State<br />
Rate<br />
1.75%<br />
6.59%<br />
34.23%<br />
43.51%<br />
13.92%<br />
State<br />
Target<br />
LEA<br />
Rate<br />
Target<br />
Met by<br />
LEA(Y/N)<br />
C) Use of Appropriate Behaviors<br />
to Meet Their Needs<br />
State<br />
Rate<br />
State<br />
Target<br />
LEA<br />
Rate<br />
Target<br />
Met by<br />
LEA(Y/N)<br />
89.61% 90.50% 85.71% N 90.31% 90.50% 60.00% N 90.82% 92.50% 85.71% N<br />
66.58% 69.50% 80.00% Y 57.43% 60.50% 50.00% N 76.69% 78.50% 90.00% Y<br />
NOTE: * Including social relationships ** Including early language/ communication and early literacy<br />
Note: - - denotes not applicable<br />
State<br />
Rate<br />
LEA<br />
Rate<br />
— —<br />
40.00%<br />
10.00%<br />
50.00%<br />
— —<br />
C) Use of<br />
Appropriate<br />
Behaviors to<br />
Meet Their Needs<br />
State<br />
Rate<br />
4.51%<br />
17.34%<br />
41.72%<br />
34.97%<br />
LEA<br />
Rate<br />
1.46% — —<br />
10.00%<br />
— —<br />
60.00%<br />
30.00%<br />
Page 3 of 5
LEA: 0503 - HARRISON SCHOOL <strong>DISTRICT</strong><br />
Indicator 08: Parent Involvement<br />
Percent of surveyed<br />
parents who reported<br />
school facilitated parent<br />
involvement as a means<br />
of improving services<br />
and results for children<br />
with disabilities.<br />
Early Childhood<br />
(3-5)<br />
School Age<br />
(5-21)<br />
State<br />
Rate<br />
90.47%<br />
95.05%<br />
Indicator 09: Disproportionality - Eligibility<br />
Disproportionate representation of racial<br />
and ethnic groups in special education and<br />
related services that is a result of<br />
inappropriate identification (e.g.<br />
monitoring data, review of policies,<br />
practices, and procedures under 618(d),<br />
etc.).<br />
State<br />
Rate<br />
State<br />
Target<br />
88.00%<br />
96.00%<br />
State<br />
Target<br />
0.00% 0.00%<br />
LEA<br />
Rate<br />
100.00%<br />
100.00%<br />
Indicator 10: Disproportionality-Child with a Disability<br />
Disproportionate representation of racial<br />
and ethnic groups in specific disability<br />
categories that is a result of inappropriate<br />
identification (e.g. monitoring data, review<br />
of policies, practices, and procedures under<br />
618(d), etc.).<br />
Indicator 11: Child Find<br />
Percent of children with<br />
parental consent to evaluate<br />
who are evaluated within<br />
the State established timeline<br />
of 60 days.<br />
Overall<br />
(3-21)<br />
Early Childhood<br />
(3-5)<br />
School Age<br />
(5-21)<br />
State<br />
Rate<br />
0.00%<br />
Indicator 12: Early Childhood Transition<br />
Percent of children referred by Part C prior to<br />
age 3, who are found eligible for Part B, and<br />
who have an IEP developed and implemented<br />
by their third birthday.<br />
Note: - - denotes not applicable<br />
State<br />
Rate<br />
99.41%<br />
99.70%<br />
98.97%<br />
State<br />
Rate<br />
State<br />
Target<br />
0.00%<br />
State<br />
Target<br />
100.00%<br />
100.00%<br />
100.00%<br />
State<br />
Target<br />
Target Met by<br />
LEA (Y/N)<br />
Y<br />
Target Met by<br />
LEA (Y/N)<br />
Y<br />
LEA<br />
Rate<br />
100.00%<br />
100.00%<br />
100.00%<br />
LEA<br />
Rate<br />
Target Met by<br />
LEA (Y/N)<br />
Y<br />
Y<br />
Note: The target for Indicator 09 is to have zero percent<br />
(0%) of districts identified as having disproportionate<br />
representation as a result of inappropriate<br />
identification in eligibility.<br />
Note: The target for Indicator 10 is to have zero<br />
percent (0%) of districts identified as having<br />
disproportionate representation as a result of<br />
inappropriate identification in a disability<br />
category.<br />
Target Met by<br />
LEA (Y/N)<br />
Y<br />
Y<br />
Target Met<br />
by LEA<br />
(Y/N)<br />
99.21% 100.00% - - N/A<br />
Y<br />
Note: * Indicates a zero reponse rate for the<br />
district.<br />
Page 4 of 5
LEA: 0503 - HARRISON SCHOOL <strong>DISTRICT</strong><br />
Indicator 13: Secondary Transition<br />
Percent of youth with disabilities aged 16 and<br />
up with an IEP that includes coordinated,<br />
measurable, annual IEP goals and transition<br />
services that will reasonably enable the student<br />
to meet the post-secondary goals.<br />
Indicator 14: Post-School Outcomes<br />
A. Percent of youth enrolled in higher<br />
education within one year of leaving high<br />
school.<br />
State<br />
Rate<br />
State<br />
Target<br />
Note: Data for this Indicator is from the on-site monitoring of LEAs for the given year.<br />
B. Percent of youth enrolled in higher<br />
education or competitively employed<br />
within one year of leaving high school.<br />
C. Percent of youth enrolled in higher<br />
education or in some other postsecondary<br />
education or training program; or<br />
competitively employed or in some other<br />
employment within one year of leaving<br />
high school.<br />
State<br />
Rate<br />
Indicator 20: Reported Data-Timely and Accurate*<br />
District submitted<br />
required data elements<br />
on or before due dates;<br />
made revisions within<br />
the alloted reveiw<br />
periods.<br />
Accurate and Timely<br />
Data Submission<br />
Overall (3-21)<br />
Early Childhood (3-5)<br />
School Age (5-21)<br />
State<br />
Target<br />
100.00%<br />
100.00%<br />
100.00%<br />
State<br />
Target<br />
LEA<br />
Rate<br />
LEA<br />
Rate<br />
Target Met by<br />
LEA (Y/N)<br />
Target Met<br />
by LEA<br />
(Y/N)<br />
Target Met<br />
by LEA<br />
(Y/N)<br />
*Data reviewed for timely and accurate submissions included all APSCN cycle data except for personnel<br />
Note: - - denotes not applicable<br />
96.19 100.00 100.00% Y<br />
14.53<br />
State<br />
Rate<br />
49.42<br />
State<br />
Rate<br />
54.07<br />
13.00<br />
State<br />
Target<br />
49.00<br />
State<br />
Target<br />
60.00<br />
Y<br />
Y<br />
Y<br />
— —<br />
LEA<br />
Rate<br />
— —<br />
LEA<br />
Rate<br />
— —<br />
N/A<br />
Target Met<br />
by LEA<br />
(Y/N)<br />
N/A<br />
Target Met<br />
by LEA<br />
(Y/N)<br />
N/A<br />
Page 5 of 5
LEA: 0504 - OMAHA SCHOOL <strong>DISTRICT</strong><br />
<strong>ARKANSAS</strong> <strong>SPECIAL</strong> <strong>EDUCATION</strong><br />
<strong>DISTRICT</strong> <strong>ANNUAL</strong> PERFORMANCE REPORT<br />
2010/11 School Year<br />
Publication Date: March 2012<br />
Each State must have in place a State Performance Plan (SPP) to evaluate the State's efforts to meet the requirements and<br />
purposes of the implementation of the Individuals with Disabilities Education Act (IDEA). The SPP is a six-year plan, which<br />
describes Arkansas's performance on 20 indicators. The Office of Special Education Programs in the U. S. Department of<br />
Education requires that States report annually to the public on the performance of each local education agency (LEA) on 14 of<br />
20 indicators as compared with targets established by the State in the SPP. Arkansas will report indicators 1 through 14 and<br />
20 for each LEA serving children with disabilities (CWD). Any LEA not meeting targets on compliance indicators (0% for<br />
Indicators 4B, 09 & 10 and 100% for Indicators 11, 12, 13, and 20) are non-compliant with IDEA.<br />
There are no report changes for the 2010/11 school year profile; However, it is important to recognize that: .<br />
1. Indicator 01 (Graduation) is reported a year in arrear (2009/10 graduates) and is based on a four-year cohort. This<br />
means the rate is a measure of students who entered in ninth grade and graduate in four years. The calculation is a<br />
requirement under Title I of the Elementary and Secondary Education Act (ESEA).<br />
2. Indicator 02 (Drop out) is reported a year in arrear. This means the rate is a measure of students who dropped out in<br />
the 2009/10 school year. The Indicator 02 data are aligned with the Common Core of Data (CCD) requirements for<br />
grades 7-12.<br />
3. Indicator 04A and 4B (Suspension/Expulsion) is reported a year in arrear. This means the rate is a measure of<br />
students who had out-of-school suspensions and/or expulsions totaling more than 10 days.<br />
Percent of youth<br />
with IEPs<br />
graduating from<br />
high school with a<br />
regular diploma<br />
For a complete description of all the Indicators, please visit the special education website at<br />
http://arksped.k12.ar.us/sections/policy.html<br />
Indicator 01: Graduation Rates (2009/10 school year) Indicator 02: Dropout Rates (2009/10 school year)<br />
State<br />
Rate<br />
State<br />
Target<br />
75.76% 85.00%<br />
LEA<br />
Rate<br />
33.33%<br />
Target Met<br />
by LEA<br />
(Y/N)<br />
N<br />
Percent of<br />
youth with<br />
IEPs dropping<br />
out of high<br />
school<br />
State<br />
Rate<br />
Indicator 03: Assessment on Statewide Benchmark Exam (grades 3-8, 11)<br />
A) Adequate Yearly Progress<br />
n=40<br />
Literacy<br />
Mathematics<br />
Met Disability Subgroup "n"<br />
for Reporting Purposes (Y/N)<br />
State Target for % of Districts Meeting<br />
AYP for Disability Subgroup<br />
State<br />
Target<br />
3.06% 4.20%<br />
LEA<br />
Rate<br />
8.33%<br />
% of Districts Meeting AYP<br />
for Disability Subgroup<br />
Target Met by<br />
LEA (Y/N)<br />
N<br />
Target Met by<br />
LEA(Y/N)<br />
Overall N 17.15% 6.25%<br />
NA<br />
N<br />
N<br />
Note: For a district to qualify as having a disability subgroup it must have a minimum of 40 (n=40) students with disabilities in a school building.<br />
B) Participation<br />
Participation Rate: # of<br />
CWD Tested ÷ # of CWD<br />
Enrolled in grades tested.<br />
Participation Rate: Literacy<br />
Participation Rate: Math<br />
Note: - - denotes not applicable<br />
State<br />
Rate<br />
98.78%<br />
State<br />
Target<br />
95.00%<br />
LEA<br />
Rate<br />
100.00%<br />
Target Met<br />
by LEA (Y/N)<br />
98.61% 95.00% 100.00% Y<br />
Y<br />
C) Performance Proficiency<br />
Percent of CWD Scoring<br />
Proficient or Above<br />
Proficiency Rate: Literacy<br />
Proficiency Rate:<br />
Mathematics<br />
16.00%<br />
16.00%<br />
State<br />
Rate<br />
31.49%<br />
44.86%<br />
State<br />
Target<br />
45.22%<br />
51.14%<br />
LEA<br />
Rate<br />
18.52%<br />
31.25%<br />
NA<br />
NA<br />
Target<br />
Met by<br />
LEA (Y/N)<br />
N<br />
N<br />
Page 1 of 5
LEA: 0504 - OMAHA SCHOOL <strong>DISTRICT</strong><br />
Indicator 04: Out-of-School Suspensions and Expulsions (2009/10 school year)<br />
A) Suspension/Expulsion<br />
Percent difference of CWD with out-of- school suspensions and<br />
expulsions totaling greater than 10 days in a school year as<br />
compared to the same data for general education students in<br />
the district.<br />
B) Suspension/Expulsion by Race and Ethnicity<br />
Percent of districts that have: (a) a significant discrepancy, by race or<br />
ethnicity, in the rate of suspensions and expulsions of greater than 10<br />
days in a school year for children with IEPs; and (b) policies,<br />
procedures or practices that contribute to the significant discrepancy<br />
and do not comply with requirements relating to the development<br />
and implementation of IEPs, the use of positive behavioral<br />
interventions and supports, and procedural safeguards.<br />
Indicator 05: School Age (5-21) Least Restrictive Environment<br />
A) In the Regular Class 80% or more of the day<br />
Percent of CWD with<br />
IEPs receiving instruction<br />
in the regular class 80%<br />
or more of the day.<br />
State<br />
Rate<br />
State<br />
Target<br />
LEA<br />
Rate<br />
B) In the Regular Class less than 40% of the day<br />
Percent of CWD with<br />
IEPs receiving instruction<br />
in the regular class less<br />
than 60% of the day.<br />
53.87% 59.77%<br />
State<br />
Rate<br />
State<br />
Target<br />
12.42% 12.51%<br />
78.43%<br />
LEA<br />
Rate<br />
0.00%<br />
C) Other Settings outside the regular class<br />
Percent of CWD with IEPs served in<br />
public or private separate schools,<br />
residential placements, or<br />
homebound/hospital placements.<br />
State<br />
Rate<br />
State<br />
Target<br />
2.80% 2.56%<br />
Target Met<br />
by LEA (Y/N)<br />
Y<br />
Target Met<br />
by LEA (Y/N)<br />
Y<br />
LEA<br />
Rate<br />
0.00%<br />
Target Met<br />
by LEA(Y/N)<br />
Indicator 06: Early Childhood (3-5) Least Restrictive Environment<br />
A) Regular Early Childhood Program<br />
Percent of children (aged 3 through 5) with IEPs attending a regular<br />
early childhood program and receiving the majority of special<br />
education and related services in the regular early childhood program<br />
Allowable<br />
Difference<br />
LEA: 0504 - OMAHA SCHOOL <strong>DISTRICT</strong><br />
Indicator 07: Preschool (3-5) Outcomes<br />
a) Percent of preschool CWD<br />
children who did not<br />
improve functioning.<br />
b) Percent of preschool CWD<br />
who improved but whose<br />
functioning remained below<br />
same age peers.<br />
c) Percent of preschool CWD<br />
who improved at a level<br />
nearer to same aged peers.<br />
d) Percent of preschool CWD<br />
who improved functioning to<br />
reach a level comparable to<br />
same age peers.<br />
e) Percent of preschool CWD<br />
children who maintain<br />
functioning at a level<br />
comparable to same aged<br />
peers.<br />
Summary<br />
Statements<br />
1) Of those preschool<br />
children who entered<br />
the preschool program<br />
below age expectations<br />
in each Outcome, the<br />
percent who<br />
substantially increased<br />
their rate of growth by<br />
the time they turned 6<br />
years of age or exited<br />
the program.<br />
2) The percent of<br />
preschool children who<br />
were functioning<br />
within age expectations<br />
in each Outcome by the<br />
time they turned 6<br />
years of age or exited<br />
A) Positive Social -Emotional<br />
Skills*<br />
State<br />
Rate<br />
A) Positive Social -<br />
Emotional Skills<br />
(Including social<br />
relationships)<br />
State<br />
Rate<br />
2.14%<br />
5.31%<br />
25.97%<br />
38.22%<br />
28.36%<br />
State<br />
Target<br />
LEA<br />
Rate<br />
LEA<br />
Rate<br />
— —<br />
— —<br />
— —<br />
— —<br />
— —<br />
Target<br />
Met by<br />
LEA(Y/N)<br />
B) Acquisition and Use of<br />
Knowledge and Skills<br />
(Including early language/<br />
communication and early literacy)<br />
B) Acquisition and Use of<br />
Knowledge and Skills **<br />
State<br />
Rate<br />
1.75%<br />
6.59%<br />
34.23%<br />
43.51%<br />
13.92%<br />
State<br />
Target<br />
LEA<br />
Rate<br />
Target<br />
Met by<br />
LEA(Y/N)<br />
C) Use of Appropriate Behaviors<br />
to Meet Their Needs<br />
State<br />
Rate<br />
State<br />
Target<br />
LEA<br />
Rate<br />
Target<br />
Met by<br />
LEA(Y/N)<br />
89.61% 90.50% — — N/A 90.31% 90.50% — — N/A 90.82% 92.50% — — N/A<br />
66.58% 69.50% — — N/A 57.43% 60.50% — — N/A 76.69% 78.50% — — N/A<br />
NOTE: * Including social relationships ** Including early language/ communication and early literacy<br />
Note: - - denotes not applicable<br />
State<br />
Rate<br />
LEA<br />
Rate<br />
— —<br />
— —<br />
— —<br />
— —<br />
— —<br />
C) Use of<br />
Appropriate<br />
Behaviors to<br />
Meet Their Needs<br />
State<br />
Rate<br />
4.51%<br />
17.34%<br />
41.72%<br />
34.97%<br />
LEA<br />
Rate<br />
1.46% — —<br />
— —<br />
— —<br />
— —<br />
— —<br />
Page 3 of 5
LEA: 0504 - OMAHA SCHOOL <strong>DISTRICT</strong><br />
Indicator 08: Parent Involvement<br />
Percent of surveyed<br />
parents who reported<br />
school facilitated parent<br />
involvement as a means<br />
of improving services<br />
and results for children<br />
with disabilities.<br />
Early Childhood<br />
(3-5)<br />
School Age<br />
(5-21)<br />
State<br />
Rate<br />
90.47%<br />
95.05%<br />
Indicator 09: Disproportionality - Eligibility<br />
Disproportionate representation of racial<br />
and ethnic groups in special education and<br />
related services that is a result of<br />
inappropriate identification (e.g.<br />
monitoring data, review of policies,<br />
practices, and procedures under 618(d),<br />
etc.).<br />
State<br />
Rate<br />
State<br />
Target<br />
88.00%<br />
96.00%<br />
State<br />
Target<br />
0.00% 0.00%<br />
LEA<br />
Rate<br />
— —<br />
100.00%<br />
Indicator 10: Disproportionality-Child with a Disability<br />
Disproportionate representation of racial<br />
and ethnic groups in specific disability<br />
categories that is a result of inappropriate<br />
identification (e.g. monitoring data, review<br />
of policies, practices, and procedures under<br />
618(d), etc.).<br />
Indicator 11: Child Find<br />
Percent of children with<br />
parental consent to evaluate<br />
who are evaluated within<br />
the State established timeline<br />
of 60 days.<br />
Overall<br />
(3-21)<br />
Early Childhood<br />
(3-5)<br />
School Age<br />
(5-21)<br />
State<br />
Rate<br />
0.00%<br />
Indicator 12: Early Childhood Transition<br />
Percent of children referred by Part C prior to<br />
age 3, who are found eligible for Part B, and<br />
who have an IEP developed and implemented<br />
by their third birthday.<br />
Note: - - denotes not applicable<br />
State<br />
Rate<br />
99.41%<br />
99.70%<br />
98.97%<br />
State<br />
Rate<br />
State<br />
Target<br />
0.00%<br />
State<br />
Target<br />
100.00%<br />
100.00%<br />
100.00%<br />
State<br />
Target<br />
Target Met by<br />
LEA (Y/N)<br />
Y<br />
Target Met by<br />
LEA (Y/N)<br />
Y<br />
LEA<br />
Rate<br />
100.00%<br />
— —<br />
100.00%<br />
LEA<br />
Rate<br />
Target Met by<br />
LEA (Y/N)<br />
N/A<br />
Y<br />
Note: The target for Indicator 09 is to have zero percent<br />
(0%) of districts identified as having disproportionate<br />
representation as a result of inappropriate<br />
identification in eligibility.<br />
Note: The target for Indicator 10 is to have zero<br />
percent (0%) of districts identified as having<br />
disproportionate representation as a result of<br />
inappropriate identification in a disability<br />
category.<br />
Target Met by<br />
LEA (Y/N)<br />
N/A<br />
Y<br />
Target Met<br />
by LEA<br />
(Y/N)<br />
99.21% 100.00% - - N/A<br />
Y<br />
Note: * Indicates a zero reponse rate for the<br />
district.<br />
Page 4 of 5
LEA: 0504 - OMAHA SCHOOL <strong>DISTRICT</strong><br />
Indicator 13: Secondary Transition<br />
Percent of youth with disabilities aged 16 and<br />
up with an IEP that includes coordinated,<br />
measurable, annual IEP goals and transition<br />
services that will reasonably enable the student<br />
to meet the post-secondary goals.<br />
Indicator 14: Post-School Outcomes<br />
A. Percent of youth enrolled in higher<br />
education within one year of leaving high<br />
school.<br />
State<br />
Rate<br />
State<br />
Target<br />
Note: Data for this Indicator is from the on-site monitoring of LEAs for the given year.<br />
B. Percent of youth enrolled in higher<br />
education or competitively employed<br />
within one year of leaving high school.<br />
C. Percent of youth enrolled in higher<br />
education or in some other postsecondary<br />
education or training program; or<br />
competitively employed or in some other<br />
employment within one year of leaving<br />
high school.<br />
State<br />
Rate<br />
Indicator 20: Reported Data-Timely and Accurate*<br />
District submitted<br />
required data elements<br />
on or before due dates;<br />
made revisions within<br />
the alloted reveiw<br />
periods.<br />
Accurate and Timely<br />
Data Submission<br />
Overall (3-21)<br />
Early Childhood (3-5)<br />
School Age (5-21)<br />
State<br />
Target<br />
100.00%<br />
100.00%<br />
100.00%<br />
State<br />
Target<br />
LEA<br />
Rate<br />
LEA<br />
Rate<br />
Target Met by<br />
LEA (Y/N)<br />
Target Met<br />
by LEA<br />
(Y/N)<br />
Target Met<br />
by LEA<br />
(Y/N)<br />
*Data reviewed for timely and accurate submissions included all APSCN cycle data except for personnel<br />
Note: - - denotes not applicable<br />
96.19 100.00 100.00% Y<br />
14.53<br />
State<br />
Rate<br />
49.42<br />
State<br />
Rate<br />
54.07<br />
13.00<br />
State<br />
Target<br />
49.00<br />
State<br />
Target<br />
60.00<br />
Y<br />
N/A<br />
Y<br />
— —<br />
LEA<br />
Rate<br />
— —<br />
LEA<br />
Rate<br />
— —<br />
N/A<br />
Target Met<br />
by LEA<br />
(Y/N)<br />
N/A<br />
Target Met<br />
by LEA<br />
(Y/N)<br />
N/A<br />
Page 5 of 5
<strong>ARKANSAS</strong> <strong>SPECIAL</strong> <strong>EDUCATION</strong><br />
<strong>DISTRICT</strong> <strong>ANNUAL</strong> PERFORMANCE REPORT<br />
2010/11 School Year<br />
Publication Date: March 2012<br />
Each State must have in place a State Performance Plan (SPP) to evaluate the State's efforts to meet the requirements and<br />
purposes of the implementation of the Individuals with Disabilities Education Act (IDEA). The SPP is a six-year plan, which<br />
describes Arkansas's performance on 20 indicators. The Office of Special Education Programs in the U. S. Department of<br />
Education requires that States report annually to the public on the performance of each local education agency (LEA) on 14 of<br />
20 indicators as compared with targets established by the State in the SPP. Arkansas will report indicators 1 through 14 and<br />
20 for each LEA serving children with disabilities (CWD). Any LEA not meeting targets on compliance indicators (0% for<br />
Indicators 4B, 09 & 10 and 100% for Indicators 11, 12, 13, and 20) are non-compliant with IDEA.<br />
There are no report changes for the 2010/11 school year profile; However, it is important to recognize that: .<br />
1. Indicator 01 (Graduation) is reported a year in arrear (2009/10 graduates) and is based on a four-year cohort. This<br />
means the rate is a measure of students who entered in ninth grade and graduate in four years. The calculation is a<br />
requirement under Title I of the Elementary and Secondary Education Act (ESEA).<br />
2. Indicator 02 (Drop out) is reported a year in arrear. This means the rate is a measure of students who dropped out in<br />
the 2009/10 school year. The Indicator 02 data are aligned with the Common Core of Data (CCD) requirements for<br />
grades 7-12.<br />
3. Indicator 04A and 4B (Suspension/Expulsion) is reported a year in arrear. This means the rate is a measure of<br />
students who had out-of-school suspensions and/or expulsions totaling more than 10 days.<br />
For a complete description of all the Indicators, please visit the special education website at<br />
http://arksped.k12.ar.us/sections/policy.html<br />
LEA: 0505 - VALLEY SPRINGS SCHOOL <strong>DISTRICT</strong><br />
Indicator 01: Graduation Rates (2009/10 school year) Indicator 02: Dropout Rates (2009/10 school year)<br />
Percent of youth<br />
with IEPs<br />
graduating from<br />
high school with a<br />
regular diploma<br />
State<br />
Rate<br />
State<br />
Target<br />
75.76% 85.00%<br />
LEA<br />
Rate<br />
58.33%<br />
Target Met<br />
by LEA<br />
(Y/N)<br />
N<br />
Percent of<br />
youth with<br />
IEPs dropping<br />
out of high<br />
school<br />
State<br />
Rate<br />
Indicator 03: Assessment on Statewide Benchmark Exam (grades 3-8, 11)<br />
A) Adequate Yearly Progress<br />
n=40<br />
Literacy<br />
Mathematics<br />
Met Disability Subgroup "n"<br />
for Reporting Purposes (Y/N)<br />
State Target for % of Districts Meeting<br />
AYP for Disability Subgroup<br />
State<br />
Target<br />
3.06% 4.20%<br />
LEA<br />
Rate<br />
4.26%<br />
% of Districts Meeting AYP<br />
for Disability Subgroup<br />
Target Met by<br />
LEA (Y/N)<br />
N<br />
Target Met by<br />
LEA(Y/N)<br />
Overall N 17.15% 6.25%<br />
NA<br />
N<br />
N<br />
Note: For a district to qualify as having a disability subgroup it must have a minimum of 40 (n=40) students with disabilities in a school building.<br />
B) Participation<br />
Participation Rate: # of<br />
CWD Tested ÷ # of CWD<br />
Enrolled in grades tested.<br />
Participation Rate: Literacy<br />
Participation Rate: Math<br />
Note: - - denotes not applicable<br />
State<br />
Rate<br />
98.78%<br />
State<br />
Target<br />
95.00%<br />
LEA<br />
Rate<br />
100.00%<br />
Target Met<br />
by LEA (Y/N)<br />
98.61% 95.00% 100.00% Y<br />
Y<br />
C) Performance Proficiency<br />
Percent of CWD Scoring<br />
Proficient or Above<br />
Proficiency Rate: Literacy<br />
Proficiency Rate:<br />
Mathematics<br />
16.00%<br />
16.00%<br />
State<br />
Rate<br />
31.49%<br />
44.86%<br />
State<br />
Target<br />
45.22%<br />
51.14%<br />
LEA<br />
Rate<br />
38.60%<br />
62.50%<br />
NA<br />
NA<br />
Target<br />
Met by<br />
LEA (Y/N)<br />
N<br />
Y<br />
Page 1 of 5
LEA: 0505 - VALLEY SPRINGS SCHOOL <strong>DISTRICT</strong><br />
Indicator 04: Out-of-School Suspensions and Expulsions (2009/10 school year)<br />
A) Suspension/Expulsion<br />
Percent difference of CWD with out-of- school suspensions and<br />
expulsions totaling greater than 10 days in a school year as<br />
compared to the same data for general education students in<br />
the district.<br />
B) Suspension/Expulsion by Race and Ethnicity<br />
Percent of districts that have: (a) a significant discrepancy, by race or<br />
ethnicity, in the rate of suspensions and expulsions of greater than 10<br />
days in a school year for children with IEPs; and (b) policies,<br />
procedures or practices that contribute to the significant discrepancy<br />
and do not comply with requirements relating to the development<br />
and implementation of IEPs, the use of positive behavioral<br />
interventions and supports, and procedural safeguards.<br />
Indicator 05: School Age (5-21) Least Restrictive Environment<br />
A) In the Regular Class 80% or more of the day<br />
Percent of CWD with<br />
IEPs receiving instruction<br />
in the regular class 80%<br />
or more of the day.<br />
State<br />
Rate<br />
State<br />
Target<br />
LEA<br />
Rate<br />
B) In the Regular Class less than 40% of the day<br />
Percent of CWD with<br />
IEPs receiving instruction<br />
in the regular class less<br />
than 60% of the day.<br />
53.87% 59.77%<br />
State<br />
Rate<br />
State<br />
Target<br />
12.42% 12.51%<br />
73.91%<br />
LEA<br />
Rate<br />
5.22%<br />
C) Other Settings outside the regular class<br />
Percent of CWD with IEPs served in<br />
public or private separate schools,<br />
residential placements, or<br />
homebound/hospital placements.<br />
State<br />
Rate<br />
State<br />
Target<br />
2.80% 2.56%<br />
Target Met<br />
by LEA (Y/N)<br />
Y<br />
Target Met<br />
by LEA (Y/N)<br />
Y<br />
LEA<br />
Rate<br />
0.87%<br />
Target Met<br />
by LEA(Y/N)<br />
Indicator 06: Early Childhood (3-5) Least Restrictive Environment<br />
A) Regular Early Childhood Program<br />
Percent of children (aged 3 through 5) with IEPs attending a regular<br />
early childhood program and receiving the majority of special<br />
education and related services in the regular early childhood program<br />
Allowable<br />
Difference<br />
LEA: 0505 - VALLEY SPRINGS SCHOOL <strong>DISTRICT</strong><br />
Indicator 07: Preschool (3-5) Outcomes<br />
a) Percent of preschool CWD<br />
children who did not<br />
improve functioning.<br />
b) Percent of preschool CWD<br />
who improved but whose<br />
functioning remained below<br />
same age peers.<br />
c) Percent of preschool CWD<br />
who improved at a level<br />
nearer to same aged peers.<br />
d) Percent of preschool CWD<br />
who improved functioning to<br />
reach a level comparable to<br />
same age peers.<br />
e) Percent of preschool CWD<br />
children who maintain<br />
functioning at a level<br />
comparable to same aged<br />
peers.<br />
Summary<br />
Statements<br />
1) Of those preschool<br />
children who entered<br />
the preschool program<br />
below age expectations<br />
in each Outcome, the<br />
percent who<br />
substantially increased<br />
their rate of growth by<br />
the time they turned 6<br />
years of age or exited<br />
the program.<br />
2) The percent of<br />
preschool children who<br />
were functioning<br />
within age expectations<br />
in each Outcome by the<br />
time they turned 6<br />
years of age or exited<br />
A) Positive Social -Emotional<br />
Skills*<br />
State<br />
Rate<br />
A) Positive Social -<br />
Emotional Skills<br />
(Including social<br />
relationships)<br />
State<br />
Rate<br />
2.14%<br />
5.31%<br />
25.97%<br />
38.22%<br />
28.36%<br />
State<br />
Target<br />
LEA<br />
Rate<br />
LEA<br />
Rate<br />
— —<br />
— —<br />
— —<br />
— —<br />
— —<br />
Target<br />
Met by<br />
LEA(Y/N)<br />
B) Acquisition and Use of<br />
Knowledge and Skills<br />
(Including early language/<br />
communication and early literacy)<br />
B) Acquisition and Use of<br />
Knowledge and Skills **<br />
State<br />
Rate<br />
1.75%<br />
6.59%<br />
34.23%<br />
43.51%<br />
13.92%<br />
State<br />
Target<br />
LEA<br />
Rate<br />
Target<br />
Met by<br />
LEA(Y/N)<br />
C) Use of Appropriate Behaviors<br />
to Meet Their Needs<br />
State<br />
Rate<br />
State<br />
Target<br />
LEA<br />
Rate<br />
Target<br />
Met by<br />
LEA(Y/N)<br />
89.61% 90.50% — — N/A 90.31% 90.50% — — N/A 90.82% 92.50% — — N/A<br />
66.58% 69.50% — — N/A 57.43% 60.50% — — N/A 76.69% 78.50% — — N/A<br />
NOTE: * Including social relationships ** Including early language/ communication and early literacy<br />
Note: - - denotes not applicable<br />
State<br />
Rate<br />
LEA<br />
Rate<br />
— —<br />
— —<br />
— —<br />
— —<br />
— —<br />
C) Use of<br />
Appropriate<br />
Behaviors to<br />
Meet Their Needs<br />
State<br />
Rate<br />
4.51%<br />
17.34%<br />
41.72%<br />
34.97%<br />
LEA<br />
Rate<br />
1.46% — —<br />
— —<br />
— —<br />
— —<br />
— —<br />
Page 3 of 5
LEA: 0505 - VALLEY SPRINGS SCHOOL <strong>DISTRICT</strong><br />
Indicator 08: Parent Involvement<br />
Percent of surveyed<br />
parents who reported<br />
school facilitated parent<br />
involvement as a means<br />
of improving services<br />
and results for children<br />
with disabilities.<br />
Early Childhood<br />
(3-5)<br />
School Age<br />
(5-21)<br />
State<br />
Rate<br />
90.47%<br />
95.05%<br />
Indicator 09: Disproportionality - Eligibility<br />
Disproportionate representation of racial<br />
and ethnic groups in special education and<br />
related services that is a result of<br />
inappropriate identification (e.g.<br />
monitoring data, review of policies,<br />
practices, and procedures under 618(d),<br />
etc.).<br />
State<br />
Rate<br />
State<br />
Target<br />
88.00%<br />
96.00%<br />
State<br />
Target<br />
0.00% 0.00%<br />
LEA<br />
Rate<br />
— —<br />
100.00%<br />
Indicator 10: Disproportionality-Child with a Disability<br />
Disproportionate representation of racial<br />
and ethnic groups in specific disability<br />
categories that is a result of inappropriate<br />
identification (e.g. monitoring data, review<br />
of policies, practices, and procedures under<br />
618(d), etc.).<br />
Indicator 11: Child Find<br />
Percent of children with<br />
parental consent to evaluate<br />
who are evaluated within<br />
the State established timeline<br />
of 60 days.<br />
Overall<br />
(3-21)<br />
Early Childhood<br />
(3-5)<br />
School Age<br />
(5-21)<br />
State<br />
Rate<br />
0.00%<br />
Indicator 12: Early Childhood Transition<br />
Percent of children referred by Part C prior to<br />
age 3, who are found eligible for Part B, and<br />
who have an IEP developed and implemented<br />
by their third birthday.<br />
Note: - - denotes not applicable<br />
State<br />
Rate<br />
99.41%<br />
99.70%<br />
98.97%<br />
State<br />
Rate<br />
State<br />
Target<br />
0.00%<br />
State<br />
Target<br />
100.00%<br />
100.00%<br />
100.00%<br />
State<br />
Target<br />
Target Met by<br />
LEA (Y/N)<br />
Y<br />
Target Met by<br />
LEA (Y/N)<br />
Y<br />
LEA<br />
Rate<br />
100.00%<br />
— —<br />
100.00%<br />
LEA<br />
Rate<br />
Target Met by<br />
LEA (Y/N)<br />
N/A<br />
Y<br />
Note: The target for Indicator 09 is to have zero percent<br />
(0%) of districts identified as having disproportionate<br />
representation as a result of inappropriate<br />
identification in eligibility.<br />
Note: The target for Indicator 10 is to have zero<br />
percent (0%) of districts identified as having<br />
disproportionate representation as a result of<br />
inappropriate identification in a disability<br />
category.<br />
Target Met by<br />
LEA (Y/N)<br />
N/A<br />
Y<br />
Target Met<br />
by LEA<br />
(Y/N)<br />
99.21% 100.00% - - N/A<br />
Y<br />
Note: * Indicates a zero reponse rate for the<br />
district.<br />
Page 4 of 5
LEA: 0505 - VALLEY SPRINGS SCHOOL <strong>DISTRICT</strong><br />
Indicator 13: Secondary Transition<br />
Percent of youth with disabilities aged 16 and<br />
up with an IEP that includes coordinated,<br />
measurable, annual IEP goals and transition<br />
services that will reasonably enable the student<br />
to meet the post-secondary goals.<br />
Indicator 14: Post-School Outcomes<br />
A. Percent of youth enrolled in higher<br />
education within one year of leaving high<br />
school.<br />
State<br />
Rate<br />
State<br />
Target<br />
Note: Data for this Indicator is from the on-site monitoring of LEAs for the given year.<br />
B. Percent of youth enrolled in higher<br />
education or competitively employed<br />
within one year of leaving high school.<br />
C. Percent of youth enrolled in higher<br />
education or in some other postsecondary<br />
education or training program; or<br />
competitively employed or in some other<br />
employment within one year of leaving<br />
high school.<br />
State<br />
Rate<br />
Indicator 20: Reported Data-Timely and Accurate*<br />
District submitted<br />
required data elements<br />
on or before due dates;<br />
made revisions within<br />
the alloted reveiw<br />
periods.<br />
Accurate and Timely<br />
Data Submission<br />
Overall (3-21)<br />
Early Childhood (3-5)<br />
School Age (5-21)<br />
State<br />
Target<br />
100.00%<br />
100.00%<br />
100.00%<br />
State<br />
Target<br />
LEA<br />
Rate<br />
LEA<br />
Rate<br />
Target Met by<br />
LEA (Y/N)<br />
Target Met<br />
by LEA<br />
(Y/N)<br />
Target Met<br />
by LEA<br />
(Y/N)<br />
*Data reviewed for timely and accurate submissions included all APSCN cycle data except for personnel<br />
Note: - - denotes not applicable<br />
96.19 100.00 — — N/A<br />
14.53<br />
State<br />
Rate<br />
49.42<br />
State<br />
Rate<br />
54.07<br />
13.00<br />
State<br />
Target<br />
49.00<br />
State<br />
Target<br />
60.00<br />
Y<br />
N/A<br />
Y<br />
60.00%<br />
LEA<br />
Rate<br />
100.00%<br />
LEA<br />
Rate<br />
100.00%<br />
Y<br />
Target Met<br />
by LEA<br />
(Y/N)<br />
Y<br />
Target Met<br />
by LEA<br />
(Y/N)<br />
Y<br />
Page 5 of 5
LEA: 0506 - LEAD HILL SCHOOL <strong>DISTRICT</strong><br />
<strong>ARKANSAS</strong> <strong>SPECIAL</strong> <strong>EDUCATION</strong><br />
<strong>DISTRICT</strong> <strong>ANNUAL</strong> PERFORMANCE REPORT<br />
2010/11 School Year<br />
Publication Date: March 2012<br />
Each State must have in place a State Performance Plan (SPP) to evaluate the State's efforts to meet the requirements and<br />
purposes of the implementation of the Individuals with Disabilities Education Act (IDEA). The SPP is a six-year plan, which<br />
describes Arkansas's performance on 20 indicators. The Office of Special Education Programs in the U. S. Department of<br />
Education requires that States report annually to the public on the performance of each local education agency (LEA) on 14 of<br />
20 indicators as compared with targets established by the State in the SPP. Arkansas will report indicators 1 through 14 and<br />
20 for each LEA serving children with disabilities (CWD). Any LEA not meeting targets on compliance indicators (0% for<br />
Indicators 4B, 09 & 10 and 100% for Indicators 11, 12, 13, and 20) are non-compliant with IDEA.<br />
There are no report changes for the 2010/11 school year profile; However, it is important to recognize that: .<br />
1. Indicator 01 (Graduation) is reported a year in arrear (2009/10 graduates) and is based on a four-year cohort. This<br />
means the rate is a measure of students who entered in ninth grade and graduate in four years. The calculation is a<br />
requirement under Title I of the Elementary and Secondary Education Act (ESEA).<br />
2. Indicator 02 (Drop out) is reported a year in arrear. This means the rate is a measure of students who dropped out in<br />
the 2009/10 school year. The Indicator 02 data are aligned with the Common Core of Data (CCD) requirements for<br />
grades 7-12.<br />
3. Indicator 04A and 4B (Suspension/Expulsion) is reported a year in arrear. This means the rate is a measure of<br />
students who had out-of-school suspensions and/or expulsions totaling more than 10 days.<br />
Percent of youth<br />
with IEPs<br />
graduating from<br />
high school with a<br />
regular diploma<br />
For a complete description of all the Indicators, please visit the special education website at<br />
http://arksped.k12.ar.us/sections/policy.html<br />
Indicator 01: Graduation Rates (2009/10 school year) Indicator 02: Dropout Rates (2009/10 school year)<br />
State<br />
Rate<br />
State<br />
Target<br />
75.76% 85.00%<br />
LEA<br />
Rate<br />
50.00%<br />
Target Met<br />
by LEA<br />
(Y/N)<br />
N<br />
Percent of<br />
youth with<br />
IEPs dropping<br />
out of high<br />
school<br />
State<br />
Rate<br />
Indicator 03: Assessment on Statewide Benchmark Exam (grades 3-8, 11)<br />
A) Adequate Yearly Progress<br />
n=40<br />
Literacy<br />
Mathematics<br />
Met Disability Subgroup "n"<br />
for Reporting Purposes (Y/N)<br />
State Target for % of Districts Meeting<br />
AYP for Disability Subgroup<br />
State<br />
Target<br />
3.06% 4.20%<br />
LEA<br />
Rate<br />
0.00%<br />
% of Districts Meeting AYP<br />
for Disability Subgroup<br />
Target Met by<br />
LEA (Y/N)<br />
Y<br />
Target Met by<br />
LEA(Y/N)<br />
Overall N 17.15% 6.25%<br />
NA<br />
N<br />
N<br />
Note: For a district to qualify as having a disability subgroup it must have a minimum of 40 (n=40) students with disabilities in a school building.<br />
B) Participation<br />
Participation Rate: # of<br />
CWD Tested ÷ # of CWD<br />
Enrolled in grades tested.<br />
Participation Rate: Literacy<br />
Participation Rate: Math<br />
Note: - - denotes not applicable<br />
State<br />
Rate<br />
98.78%<br />
State<br />
Target<br />
95.00%<br />
LEA<br />
Rate<br />
97.30%<br />
Target Met<br />
by LEA (Y/N)<br />
98.61% 95.00% 96.77% Y<br />
Y<br />
C) Performance Proficiency<br />
Percent of CWD Scoring<br />
Proficient or Above<br />
Proficiency Rate: Literacy<br />
Proficiency Rate:<br />
Mathematics<br />
16.00%<br />
16.00%<br />
State<br />
Rate<br />
31.49%<br />
44.86%<br />
State<br />
Target<br />
45.22%<br />
51.14%<br />
LEA<br />
Rate<br />
22.22%<br />
26.67%<br />
NA<br />
NA<br />
Target<br />
Met by<br />
LEA (Y/N)<br />
N<br />
N<br />
Page 1 of 5
LEA: 0506 - LEAD HILL SCHOOL <strong>DISTRICT</strong><br />
Indicator 04: Out-of-School Suspensions and Expulsions (2009/10 school year)<br />
A) Suspension/Expulsion<br />
Percent difference of CWD with out-of- school suspensions and<br />
expulsions totaling greater than 10 days in a school year as<br />
compared to the same data for general education students in<br />
the district.<br />
B) Suspension/Expulsion by Race and Ethnicity<br />
Percent of districts that have: (a) a significant discrepancy, by race or<br />
ethnicity, in the rate of suspensions and expulsions of greater than 10<br />
days in a school year for children with IEPs; and (b) policies,<br />
procedures or practices that contribute to the significant discrepancy<br />
and do not comply with requirements relating to the development<br />
and implementation of IEPs, the use of positive behavioral<br />
interventions and supports, and procedural safeguards.<br />
Indicator 05: School Age (5-21) Least Restrictive Environment<br />
A) In the Regular Class 80% or more of the day<br />
Percent of CWD with<br />
IEPs receiving instruction<br />
in the regular class 80%<br />
or more of the day.<br />
State<br />
Rate<br />
State<br />
Target<br />
LEA<br />
Rate<br />
B) In the Regular Class less than 40% of the day<br />
Percent of CWD with<br />
IEPs receiving instruction<br />
in the regular class less<br />
than 60% of the day.<br />
53.87% 59.77%<br />
State<br />
Rate<br />
State<br />
Target<br />
12.42% 12.51%<br />
56.67%<br />
LEA<br />
Rate<br />
5.00%<br />
C) Other Settings outside the regular class<br />
Percent of CWD with IEPs served in<br />
public or private separate schools,<br />
residential placements, or<br />
homebound/hospital placements.<br />
State<br />
Rate<br />
State<br />
Target<br />
2.80% 2.56%<br />
Target Met<br />
by LEA (Y/N)<br />
N<br />
Target Met<br />
by LEA (Y/N)<br />
Y<br />
LEA<br />
Rate<br />
0.00%<br />
Target Met<br />
by LEA(Y/N)<br />
Indicator 06: Early Childhood (3-5) Least Restrictive Environment<br />
A) Regular Early Childhood Program<br />
Percent of children (aged 3 through 5) with IEPs attending a regular<br />
early childhood program and receiving the majority of special<br />
education and related services in the regular early childhood program<br />
Allowable<br />
Difference<br />
LEA: 0506 - LEAD HILL SCHOOL <strong>DISTRICT</strong><br />
Indicator 07: Preschool (3-5) Outcomes<br />
a) Percent of preschool CWD<br />
children who did not<br />
improve functioning.<br />
b) Percent of preschool CWD<br />
who improved but whose<br />
functioning remained below<br />
same age peers.<br />
c) Percent of preschool CWD<br />
who improved at a level<br />
nearer to same aged peers.<br />
d) Percent of preschool CWD<br />
who improved functioning to<br />
reach a level comparable to<br />
same age peers.<br />
e) Percent of preschool CWD<br />
children who maintain<br />
functioning at a level<br />
comparable to same aged<br />
peers.<br />
Summary<br />
Statements<br />
1) Of those preschool<br />
children who entered<br />
the preschool program<br />
below age expectations<br />
in each Outcome, the<br />
percent who<br />
substantially increased<br />
their rate of growth by<br />
the time they turned 6<br />
years of age or exited<br />
the program.<br />
2) The percent of<br />
preschool children who<br />
were functioning<br />
within age expectations<br />
in each Outcome by the<br />
time they turned 6<br />
years of age or exited<br />
A) Positive Social -Emotional<br />
Skills*<br />
State<br />
Rate<br />
A) Positive Social -<br />
Emotional Skills<br />
(Including social<br />
relationships)<br />
State<br />
Rate<br />
2.14%<br />
5.31%<br />
25.97%<br />
38.22%<br />
28.36%<br />
State<br />
Target<br />
LEA<br />
Rate<br />
LEA<br />
Rate<br />
— —<br />
— —<br />
— —<br />
— —<br />
— —<br />
Target<br />
Met by<br />
LEA(Y/N)<br />
B) Acquisition and Use of<br />
Knowledge and Skills<br />
(Including early language/<br />
communication and early literacy)<br />
B) Acquisition and Use of<br />
Knowledge and Skills **<br />
State<br />
Rate<br />
1.75%<br />
6.59%<br />
34.23%<br />
43.51%<br />
13.92%<br />
State<br />
Target<br />
LEA<br />
Rate<br />
Target<br />
Met by<br />
LEA(Y/N)<br />
C) Use of Appropriate Behaviors<br />
to Meet Their Needs<br />
State<br />
Rate<br />
State<br />
Target<br />
LEA<br />
Rate<br />
Target<br />
Met by<br />
LEA(Y/N)<br />
89.61% 90.50% — — N/A 90.31% 90.50% — — N/A 90.82% 92.50% — — N/A<br />
66.58% 69.50% — — N/A 57.43% 60.50% — — N/A 76.69% 78.50% — — N/A<br />
NOTE: * Including social relationships ** Including early language/ communication and early literacy<br />
Note: - - denotes not applicable<br />
State<br />
Rate<br />
LEA<br />
Rate<br />
— —<br />
— —<br />
— —<br />
— —<br />
— —<br />
C) Use of<br />
Appropriate<br />
Behaviors to<br />
Meet Their Needs<br />
State<br />
Rate<br />
4.51%<br />
17.34%<br />
41.72%<br />
34.97%<br />
LEA<br />
Rate<br />
1.46% — —<br />
— —<br />
— —<br />
— —<br />
— —<br />
Page 3 of 5
LEA: 0506 - LEAD HILL SCHOOL <strong>DISTRICT</strong><br />
Indicator 08: Parent Involvement<br />
Percent of surveyed<br />
parents who reported<br />
school facilitated parent<br />
involvement as a means<br />
of improving services<br />
and results for children<br />
with disabilities.<br />
Early Childhood<br />
(3-5)<br />
School Age<br />
(5-21)<br />
State<br />
Rate<br />
90.47%<br />
95.05%<br />
Indicator 09: Disproportionality - Eligibility<br />
Disproportionate representation of racial<br />
and ethnic groups in special education and<br />
related services that is a result of<br />
inappropriate identification (e.g.<br />
monitoring data, review of policies,<br />
practices, and procedures under 618(d),<br />
etc.).<br />
State<br />
Rate<br />
State<br />
Target<br />
88.00%<br />
96.00%<br />
State<br />
Target<br />
0.00% 0.00%<br />
LEA<br />
Rate<br />
— —<br />
91.94%<br />
Indicator 10: Disproportionality-Child with a Disability<br />
Disproportionate representation of racial<br />
and ethnic groups in specific disability<br />
categories that is a result of inappropriate<br />
identification (e.g. monitoring data, review<br />
of policies, practices, and procedures under<br />
618(d), etc.).<br />
Indicator 11: Child Find<br />
Percent of children with<br />
parental consent to evaluate<br />
who are evaluated within<br />
the State established timeline<br />
of 60 days.<br />
Overall<br />
(3-21)<br />
Early Childhood<br />
(3-5)<br />
School Age<br />
(5-21)<br />
State<br />
Rate<br />
0.00%<br />
Indicator 12: Early Childhood Transition<br />
Percent of children referred by Part C prior to<br />
age 3, who are found eligible for Part B, and<br />
who have an IEP developed and implemented<br />
by their third birthday.<br />
Note: - - denotes not applicable<br />
State<br />
Rate<br />
99.41%<br />
99.70%<br />
98.97%<br />
State<br />
Rate<br />
State<br />
Target<br />
0.00%<br />
State<br />
Target<br />
100.00%<br />
100.00%<br />
100.00%<br />
State<br />
Target<br />
Target Met by<br />
LEA (Y/N)<br />
Y<br />
Target Met by<br />
LEA (Y/N)<br />
Y<br />
LEA<br />
Rate<br />
100.00%<br />
— —<br />
100.00%<br />
LEA<br />
Rate<br />
Target Met by<br />
LEA (Y/N)<br />
N/A<br />
N<br />
Note: The target for Indicator 09 is to have zero percent<br />
(0%) of districts identified as having disproportionate<br />
representation as a result of inappropriate<br />
identification in eligibility.<br />
Note: The target for Indicator 10 is to have zero<br />
percent (0%) of districts identified as having<br />
disproportionate representation as a result of<br />
inappropriate identification in a disability<br />
category.<br />
Target Met by<br />
LEA (Y/N)<br />
N/A<br />
Y<br />
Target Met<br />
by LEA<br />
(Y/N)<br />
99.21% 100.00% - - N/A<br />
Y<br />
Note: * Indicates a zero reponse rate for the<br />
district.<br />
Page 4 of 5
LEA: 0506 - LEAD HILL SCHOOL <strong>DISTRICT</strong><br />
Indicator 13: Secondary Transition<br />
Percent of youth with disabilities aged 16 and<br />
up with an IEP that includes coordinated,<br />
measurable, annual IEP goals and transition<br />
services that will reasonably enable the student<br />
to meet the post-secondary goals.<br />
Indicator 14: Post-School Outcomes<br />
A. Percent of youth enrolled in higher<br />
education within one year of leaving high<br />
school.<br />
State<br />
Rate<br />
State<br />
Target<br />
Note: Data for this Indicator is from the on-site monitoring of LEAs for the given year.<br />
B. Percent of youth enrolled in higher<br />
education or competitively employed<br />
within one year of leaving high school.<br />
C. Percent of youth enrolled in higher<br />
education or in some other postsecondary<br />
education or training program; or<br />
competitively employed or in some other<br />
employment within one year of leaving<br />
high school.<br />
State<br />
Rate<br />
Indicator 20: Reported Data-Timely and Accurate*<br />
District submitted<br />
required data elements<br />
on or before due dates;<br />
made revisions within<br />
the alloted reveiw<br />
periods.<br />
Accurate and Timely<br />
Data Submission<br />
Overall (3-21)<br />
Early Childhood (3-5)<br />
School Age (5-21)<br />
State<br />
Target<br />
100.00%<br />
100.00%<br />
100.00%<br />
State<br />
Target<br />
LEA<br />
Rate<br />
LEA<br />
Rate<br />
Target Met by<br />
LEA (Y/N)<br />
Target Met<br />
by LEA<br />
(Y/N)<br />
Target Met<br />
by LEA<br />
(Y/N)<br />
*Data reviewed for timely and accurate submissions included all APSCN cycle data except for personnel<br />
Note: - - denotes not applicable<br />
96.19 100.00 — — N/A<br />
14.53<br />
State<br />
Rate<br />
49.42<br />
State<br />
Rate<br />
54.07<br />
13.00<br />
State<br />
Target<br />
49.00<br />
State<br />
Target<br />
60.00<br />
Y<br />
N/A<br />
Y<br />
— —<br />
LEA<br />
Rate<br />
— —<br />
LEA<br />
Rate<br />
— —<br />
N/A<br />
Target Met<br />
by LEA<br />
(Y/N)<br />
N/A<br />
Target Met<br />
by LEA<br />
(Y/N)<br />
N/A<br />
Page 5 of 5
LEA: 0601 - HERMITAGE SCHOOL <strong>DISTRICT</strong><br />
<strong>ARKANSAS</strong> <strong>SPECIAL</strong> <strong>EDUCATION</strong><br />
<strong>DISTRICT</strong> <strong>ANNUAL</strong> PERFORMANCE REPORT<br />
2010/11 School Year<br />
Publication Date: March 2012<br />
Each State must have in place a State Performance Plan (SPP) to evaluate the State's efforts to meet the requirements and<br />
purposes of the implementation of the Individuals with Disabilities Education Act (IDEA). The SPP is a six-year plan, which<br />
describes Arkansas's performance on 20 indicators. The Office of Special Education Programs in the U. S. Department of<br />
Education requires that States report annually to the public on the performance of each local education agency (LEA) on 14 of<br />
20 indicators as compared with targets established by the State in the SPP. Arkansas will report indicators 1 through 14 and<br />
20 for each LEA serving children with disabilities (CWD). Any LEA not meeting targets on compliance indicators (0% for<br />
Indicators 4B, 09 & 10 and 100% for Indicators 11, 12, 13, and 20) are non-compliant with IDEA.<br />
There are no report changes for the 2010/11 school year profile; However, it is important to recognize that: .<br />
1. Indicator 01 (Graduation) is reported a year in arrear (2009/10 graduates) and is based on a four-year cohort. This<br />
means the rate is a measure of students who entered in ninth grade and graduate in four years. The calculation is a<br />
requirement under Title I of the Elementary and Secondary Education Act (ESEA).<br />
2. Indicator 02 (Drop out) is reported a year in arrear. This means the rate is a measure of students who dropped out in<br />
the 2009/10 school year. The Indicator 02 data are aligned with the Common Core of Data (CCD) requirements for<br />
grades 7-12.<br />
3. Indicator 04A and 4B (Suspension/Expulsion) is reported a year in arrear. This means the rate is a measure of<br />
students who had out-of-school suspensions and/or expulsions totaling more than 10 days.<br />
Percent of youth<br />
with IEPs<br />
graduating from<br />
high school with a<br />
regular diploma<br />
For a complete description of all the Indicators, please visit the special education website at<br />
http://arksped.k12.ar.us/sections/policy.html<br />
Indicator 01: Graduation Rates (2009/10 school year) Indicator 02: Dropout Rates (2009/10 school year)<br />
State<br />
Rate<br />
State<br />
Target<br />
75.76% 85.00%<br />
LEA<br />
Rate<br />
90.00%<br />
Target Met<br />
by LEA<br />
(Y/N)<br />
Y<br />
Percent of<br />
youth with<br />
IEPs dropping<br />
out of high<br />
school<br />
State<br />
Rate<br />
Indicator 03: Assessment on Statewide Benchmark Exam (grades 3-8, 11)<br />
A) Adequate Yearly Progress<br />
n=40<br />
Literacy<br />
Mathematics<br />
Met Disability Subgroup "n"<br />
for Reporting Purposes (Y/N)<br />
State Target for % of Districts Meeting<br />
AYP for Disability Subgroup<br />
State<br />
Target<br />
3.06% 4.20%<br />
LEA<br />
Rate<br />
0.00%<br />
% of Districts Meeting AYP<br />
for Disability Subgroup<br />
Target Met by<br />
LEA (Y/N)<br />
Y<br />
Target Met by<br />
LEA(Y/N)<br />
Overall N 17.15% 6.25%<br />
NA<br />
N<br />
N<br />
Note: For a district to qualify as having a disability subgroup it must have a minimum of 40 (n=40) students with disabilities in a school building.<br />
B) Participation<br />
Participation Rate: # of<br />
CWD Tested ÷ # of CWD<br />
Enrolled in grades tested.<br />
Participation Rate: Literacy<br />
Participation Rate: Math<br />
Note: - - denotes not applicable<br />
State<br />
Rate<br />
98.78%<br />
State<br />
Target<br />
95.00%<br />
LEA<br />
Rate<br />
100.00%<br />
Target Met<br />
by LEA (Y/N)<br />
98.61% 95.00% 100.00% Y<br />
Y<br />
C) Performance Proficiency<br />
Percent of CWD Scoring<br />
Proficient or Above<br />
Proficiency Rate: Literacy<br />
Proficiency Rate:<br />
Mathematics<br />
16.00%<br />
16.00%<br />
State<br />
Rate<br />
31.49%<br />
44.86%<br />
State<br />
Target<br />
45.22%<br />
51.14%<br />
LEA<br />
Rate<br />
10.00%<br />
21.74%<br />
NA<br />
NA<br />
Target<br />
Met by<br />
LEA (Y/N)<br />
N<br />
N<br />
Page 1 of 5
LEA: 0601 - HERMITAGE SCHOOL <strong>DISTRICT</strong><br />
Indicator 04: Out-of-School Suspensions and Expulsions (2009/10 school year)<br />
A) Suspension/Expulsion<br />
Percent difference of CWD with out-of- school suspensions and<br />
expulsions totaling greater than 10 days in a school year as<br />
compared to the same data for general education students in<br />
the district.<br />
B) Suspension/Expulsion by Race and Ethnicity<br />
Percent of districts that have: (a) a significant discrepancy, by race or<br />
ethnicity, in the rate of suspensions and expulsions of greater than 10<br />
days in a school year for children with IEPs; and (b) policies,<br />
procedures or practices that contribute to the significant discrepancy<br />
and do not comply with requirements relating to the development<br />
and implementation of IEPs, the use of positive behavioral<br />
interventions and supports, and procedural safeguards.<br />
Indicator 05: School Age (5-21) Least Restrictive Environment<br />
A) In the Regular Class 80% or more of the day<br />
Percent of CWD with<br />
IEPs receiving instruction<br />
in the regular class 80%<br />
or more of the day.<br />
State<br />
Rate<br />
State<br />
Target<br />
LEA<br />
Rate<br />
B) In the Regular Class less than 40% of the day<br />
Percent of CWD with<br />
IEPs receiving instruction<br />
in the regular class less<br />
than 60% of the day.<br />
53.87% 59.77%<br />
State<br />
Rate<br />
State<br />
Target<br />
12.42% 12.51%<br />
88.24%<br />
LEA<br />
Rate<br />
1.96%<br />
C) Other Settings outside the regular class<br />
Percent of CWD with IEPs served in<br />
public or private separate schools,<br />
residential placements, or<br />
homebound/hospital placements.<br />
State<br />
Rate<br />
State<br />
Target<br />
2.80% 2.56%<br />
Target Met<br />
by LEA (Y/N)<br />
Y<br />
Target Met<br />
by LEA (Y/N)<br />
Y<br />
LEA<br />
Rate<br />
0.00%<br />
Target Met<br />
by LEA(Y/N)<br />
Indicator 06: Early Childhood (3-5) Least Restrictive Environment<br />
A) Regular Early Childhood Program<br />
Percent of children (aged 3 through 5) with IEPs attending a regular<br />
early childhood program and receiving the majority of special<br />
education and related services in the regular early childhood program<br />
Allowable<br />
Difference<br />
LEA: 0601 - HERMITAGE SCHOOL <strong>DISTRICT</strong><br />
Indicator 07: Preschool (3-5) Outcomes<br />
a) Percent of preschool CWD<br />
children who did not<br />
improve functioning.<br />
b) Percent of preschool CWD<br />
who improved but whose<br />
functioning remained below<br />
same age peers.<br />
c) Percent of preschool CWD<br />
who improved at a level<br />
nearer to same aged peers.<br />
d) Percent of preschool CWD<br />
who improved functioning to<br />
reach a level comparable to<br />
same age peers.<br />
e) Percent of preschool CWD<br />
children who maintain<br />
functioning at a level<br />
comparable to same aged<br />
peers.<br />
Summary<br />
Statements<br />
1) Of those preschool<br />
children who entered<br />
the preschool program<br />
below age expectations<br />
in each Outcome, the<br />
percent who<br />
substantially increased<br />
their rate of growth by<br />
the time they turned 6<br />
years of age or exited<br />
the program.<br />
2) The percent of<br />
preschool children who<br />
were functioning<br />
within age expectations<br />
in each Outcome by the<br />
time they turned 6<br />
years of age or exited<br />
A) Positive Social -Emotional<br />
Skills*<br />
State<br />
Rate<br />
A) Positive Social -<br />
Emotional Skills<br />
(Including social<br />
relationships)<br />
State<br />
Rate<br />
2.14%<br />
5.31%<br />
25.97%<br />
38.22%<br />
28.36%<br />
State<br />
Target<br />
LEA<br />
Rate<br />
LEA<br />
Rate<br />
— —<br />
— —<br />
— —<br />
— —<br />
— —<br />
Target<br />
Met by<br />
LEA(Y/N)<br />
B) Acquisition and Use of<br />
Knowledge and Skills<br />
(Including early language/<br />
communication and early literacy)<br />
B) Acquisition and Use of<br />
Knowledge and Skills **<br />
State<br />
Rate<br />
1.75%<br />
6.59%<br />
34.23%<br />
43.51%<br />
13.92%<br />
State<br />
Target<br />
LEA<br />
Rate<br />
Target<br />
Met by<br />
LEA(Y/N)<br />
C) Use of Appropriate Behaviors<br />
to Meet Their Needs<br />
State<br />
Rate<br />
State<br />
Target<br />
LEA<br />
Rate<br />
Target<br />
Met by<br />
LEA(Y/N)<br />
89.61% 90.50% — — N/A 90.31% 90.50% — — N/A 90.82% 92.50% — — N/A<br />
66.58% 69.50% — — N/A 57.43% 60.50% — — N/A 76.69% 78.50% — — N/A<br />
NOTE: * Including social relationships ** Including early language/ communication and early literacy<br />
Note: - - denotes not applicable<br />
State<br />
Rate<br />
LEA<br />
Rate<br />
— —<br />
— —<br />
— —<br />
— —<br />
— —<br />
C) Use of<br />
Appropriate<br />
Behaviors to<br />
Meet Their Needs<br />
State<br />
Rate<br />
4.51%<br />
17.34%<br />
41.72%<br />
34.97%<br />
LEA<br />
Rate<br />
1.46% — —<br />
— —<br />
— —<br />
— —<br />
— —<br />
Page 3 of 5
LEA: 0601 - HERMITAGE SCHOOL <strong>DISTRICT</strong><br />
Indicator 08: Parent Involvement<br />
Percent of surveyed<br />
parents who reported<br />
school facilitated parent<br />
involvement as a means<br />
of improving services<br />
and results for children<br />
with disabilities.<br />
Early Childhood<br />
(3-5)<br />
School Age<br />
(5-21)<br />
State<br />
Rate<br />
90.47%<br />
95.05%<br />
Indicator 09: Disproportionality - Eligibility<br />
Disproportionate representation of racial<br />
and ethnic groups in special education and<br />
related services that is a result of<br />
inappropriate identification (e.g.<br />
monitoring data, review of policies,<br />
practices, and procedures under 618(d),<br />
etc.).<br />
State<br />
Rate<br />
State<br />
Target<br />
88.00%<br />
96.00%<br />
State<br />
Target<br />
0.00% 0.00%<br />
LEA<br />
Rate<br />
— —<br />
97.83%<br />
Indicator 10: Disproportionality-Child with a Disability<br />
Disproportionate representation of racial<br />
and ethnic groups in specific disability<br />
categories that is a result of inappropriate<br />
identification (e.g. monitoring data, review<br />
of policies, practices, and procedures under<br />
618(d), etc.).<br />
Indicator 11: Child Find<br />
Percent of children with<br />
parental consent to evaluate<br />
who are evaluated within<br />
the State established timeline<br />
of 60 days.<br />
Overall<br />
(3-21)<br />
Early Childhood<br />
(3-5)<br />
School Age<br />
(5-21)<br />
State<br />
Rate<br />
0.00%<br />
Indicator 12: Early Childhood Transition<br />
Percent of children referred by Part C prior to<br />
age 3, who are found eligible for Part B, and<br />
who have an IEP developed and implemented<br />
by their third birthday.<br />
Note: - - denotes not applicable<br />
State<br />
Rate<br />
99.41%<br />
99.70%<br />
98.97%<br />
State<br />
Rate<br />
State<br />
Target<br />
0.00%<br />
State<br />
Target<br />
100.00%<br />
100.00%<br />
100.00%<br />
State<br />
Target<br />
Target Met by<br />
LEA (Y/N)<br />
Y<br />
Target Met by<br />
LEA (Y/N)<br />
Y<br />
LEA<br />
Rate<br />
100.00%<br />
— —<br />
100.00%<br />
LEA<br />
Rate<br />
Target Met by<br />
LEA (Y/N)<br />
N/A<br />
Y<br />
Note: The target for Indicator 09 is to have zero percent<br />
(0%) of districts identified as having disproportionate<br />
representation as a result of inappropriate<br />
identification in eligibility.<br />
Note: The target for Indicator 10 is to have zero<br />
percent (0%) of districts identified as having<br />
disproportionate representation as a result of<br />
inappropriate identification in a disability<br />
category.<br />
Target Met by<br />
LEA (Y/N)<br />
N/A<br />
Y<br />
Target Met<br />
by LEA<br />
(Y/N)<br />
99.21% 100.00% - - N/A<br />
Y<br />
Note: * Indicates a zero reponse rate for the<br />
district.<br />
Page 4 of 5
LEA: 0601 - HERMITAGE SCHOOL <strong>DISTRICT</strong><br />
Indicator 13: Secondary Transition<br />
Percent of youth with disabilities aged 16 and<br />
up with an IEP that includes coordinated,<br />
measurable, annual IEP goals and transition<br />
services that will reasonably enable the student<br />
to meet the post-secondary goals.<br />
Indicator 14: Post-School Outcomes<br />
A. Percent of youth enrolled in higher<br />
education within one year of leaving high<br />
school.<br />
State<br />
Rate<br />
State<br />
Target<br />
Note: Data for this Indicator is from the on-site monitoring of LEAs for the given year.<br />
B. Percent of youth enrolled in higher<br />
education or competitively employed<br />
within one year of leaving high school.<br />
C. Percent of youth enrolled in higher<br />
education or in some other postsecondary<br />
education or training program; or<br />
competitively employed or in some other<br />
employment within one year of leaving<br />
high school.<br />
State<br />
Rate<br />
Indicator 20: Reported Data-Timely and Accurate*<br />
District submitted<br />
required data elements<br />
on or before due dates;<br />
made revisions within<br />
the alloted reveiw<br />
periods.<br />
Accurate and Timely<br />
Data Submission<br />
Overall (3-21)<br />
Early Childhood (3-5)<br />
School Age (5-21)<br />
State<br />
Target<br />
100.00%<br />
100.00%<br />
100.00%<br />
State<br />
Target<br />
LEA<br />
Rate<br />
LEA<br />
Rate<br />
Target Met by<br />
LEA (Y/N)<br />
Target Met<br />
by LEA<br />
(Y/N)<br />
Target Met<br />
by LEA<br />
(Y/N)<br />
*Data reviewed for timely and accurate submissions included all APSCN cycle data except for personnel<br />
Note: - - denotes not applicable<br />
96.19 100.00 — — N/A<br />
14.53<br />
State<br />
Rate<br />
49.42<br />
State<br />
Rate<br />
54.07<br />
13.00<br />
State<br />
Target<br />
49.00<br />
State<br />
Target<br />
60.00<br />
Y<br />
N/A<br />
Y<br />
— —<br />
LEA<br />
Rate<br />
— —<br />
LEA<br />
Rate<br />
— —<br />
N/A<br />
Target Met<br />
by LEA<br />
(Y/N)<br />
N/A<br />
Target Met<br />
by LEA<br />
(Y/N)<br />
N/A<br />
Page 5 of 5
LEA: 0602 - WARREN SCHOOL <strong>DISTRICT</strong><br />
<strong>ARKANSAS</strong> <strong>SPECIAL</strong> <strong>EDUCATION</strong><br />
<strong>DISTRICT</strong> <strong>ANNUAL</strong> PERFORMANCE REPORT<br />
2010/11 School Year<br />
Publication Date: March 2012<br />
Each State must have in place a State Performance Plan (SPP) to evaluate the State's efforts to meet the requirements and<br />
purposes of the implementation of the Individuals with Disabilities Education Act (IDEA). The SPP is a six-year plan, which<br />
describes Arkansas's performance on 20 indicators. The Office of Special Education Programs in the U. S. Department of<br />
Education requires that States report annually to the public on the performance of each local education agency (LEA) on 14 of<br />
20 indicators as compared with targets established by the State in the SPP. Arkansas will report indicators 1 through 14 and<br />
20 for each LEA serving children with disabilities (CWD). Any LEA not meeting targets on compliance indicators (0% for<br />
Indicators 4B, 09 & 10 and 100% for Indicators 11, 12, 13, and 20) are non-compliant with IDEA.<br />
There are no report changes for the 2010/11 school year profile; However, it is important to recognize that: .<br />
1. Indicator 01 (Graduation) is reported a year in arrear (2009/10 graduates) and is based on a four-year cohort. This<br />
means the rate is a measure of students who entered in ninth grade and graduate in four years. The calculation is a<br />
requirement under Title I of the Elementary and Secondary Education Act (ESEA).<br />
2. Indicator 02 (Drop out) is reported a year in arrear. This means the rate is a measure of students who dropped out in<br />
the 2009/10 school year. The Indicator 02 data are aligned with the Common Core of Data (CCD) requirements for<br />
grades 7-12.<br />
3. Indicator 04A and 4B (Suspension/Expulsion) is reported a year in arrear. This means the rate is a measure of<br />
students who had out-of-school suspensions and/or expulsions totaling more than 10 days.<br />
Percent of youth<br />
with IEPs<br />
graduating from<br />
high school with a<br />
regular diploma<br />
For a complete description of all the Indicators, please visit the special education website at<br />
http://arksped.k12.ar.us/sections/policy.html<br />
Indicator 01: Graduation Rates (2009/10 school year) Indicator 02: Dropout Rates (2009/10 school year)<br />
State<br />
Rate<br />
State<br />
Target<br />
75.76% 85.00%<br />
LEA<br />
Rate<br />
61.54%<br />
Target Met<br />
by LEA<br />
(Y/N)<br />
N<br />
Percent of<br />
youth with<br />
IEPs dropping<br />
out of high<br />
school<br />
State<br />
Rate<br />
Indicator 03: Assessment on Statewide Benchmark Exam (grades 3-8, 11)<br />
A) Adequate Yearly Progress<br />
n=40<br />
Literacy<br />
Mathematics<br />
Met Disability Subgroup "n"<br />
for Reporting Purposes (Y/N)<br />
State Target for % of Districts Meeting<br />
AYP for Disability Subgroup<br />
State<br />
Target<br />
3.06% 4.20%<br />
LEA<br />
Rate<br />
3.17%<br />
% of Districts Meeting AYP<br />
for Disability Subgroup<br />
Target Met by<br />
LEA (Y/N)<br />
Y<br />
Target Met by<br />
LEA(Y/N)<br />
Overall N 17.15% 6.25%<br />
NA<br />
N<br />
N<br />
Note: For a district to qualify as having a disability subgroup it must have a minimum of 40 (n=40) students with disabilities in a school building.<br />
B) Participation<br />
Participation Rate: # of<br />
CWD Tested ÷ # of CWD<br />
Enrolled in grades tested.<br />
Participation Rate: Literacy<br />
Participation Rate: Math<br />
Note: - - denotes not applicable<br />
State<br />
Rate<br />
98.78%<br />
State<br />
Target<br />
95.00%<br />
LEA<br />
Rate<br />
98.63%<br />
Target Met<br />
by LEA (Y/N)<br />
98.61% 95.00% 98.61% Y<br />
Y<br />
C) Performance Proficiency<br />
Percent of CWD Scoring<br />
Proficient or Above<br />
Proficiency Rate: Literacy<br />
Proficiency Rate:<br />
Mathematics<br />
16.00%<br />
16.00%<br />
State<br />
Rate<br />
31.49%<br />
44.86%<br />
State<br />
Target<br />
45.22%<br />
51.14%<br />
LEA<br />
Rate<br />
15.28%<br />
18.57%<br />
NA<br />
NA<br />
Target<br />
Met by<br />
LEA (Y/N)<br />
N<br />
N<br />
Page 1 of 5
LEA: 0602 - WARREN SCHOOL <strong>DISTRICT</strong><br />
Indicator 04: Out-of-School Suspensions and Expulsions (2009/10 school year)<br />
A) Suspension/Expulsion<br />
Percent difference of CWD with out-of- school suspensions and<br />
expulsions totaling greater than 10 days in a school year as<br />
compared to the same data for general education students in<br />
the district.<br />
B) Suspension/Expulsion by Race and Ethnicity<br />
Percent of districts that have: (a) a significant discrepancy, by race or<br />
ethnicity, in the rate of suspensions and expulsions of greater than 10<br />
days in a school year for children with IEPs; and (b) policies,<br />
procedures or practices that contribute to the significant discrepancy<br />
and do not comply with requirements relating to the development<br />
and implementation of IEPs, the use of positive behavioral<br />
interventions and supports, and procedural safeguards.<br />
Indicator 05: School Age (5-21) Least Restrictive Environment<br />
A) In the Regular Class 80% or more of the day<br />
Percent of CWD with<br />
IEPs receiving instruction<br />
in the regular class 80%<br />
or more of the day.<br />
State<br />
Rate<br />
State<br />
Target<br />
LEA<br />
Rate<br />
B) In the Regular Class less than 40% of the day<br />
Percent of CWD with<br />
IEPs receiving instruction<br />
in the regular class less<br />
than 60% of the day.<br />
53.87% 59.77%<br />
State<br />
Rate<br />
State<br />
Target<br />
12.42% 12.51%<br />
67.86%<br />
LEA<br />
Rate<br />
4.29%<br />
C) Other Settings outside the regular class<br />
Percent of CWD with IEPs served in<br />
public or private separate schools,<br />
residential placements, or<br />
homebound/hospital placements.<br />
State<br />
Rate<br />
State<br />
Target<br />
2.80% 2.56%<br />
Target Met<br />
by LEA (Y/N)<br />
Y<br />
Target Met<br />
by LEA (Y/N)<br />
Y<br />
LEA<br />
Rate<br />
0.00%<br />
Target Met<br />
by LEA(Y/N)<br />
Indicator 06: Early Childhood (3-5) Least Restrictive Environment<br />
A) Regular Early Childhood Program<br />
Percent of children (aged 3 through 5) with IEPs attending a regular<br />
early childhood program and receiving the majority of special<br />
education and related services in the regular early childhood program<br />
Allowable<br />
Difference<br />
LEA: 0602 - WARREN SCHOOL <strong>DISTRICT</strong><br />
Indicator 07: Preschool (3-5) Outcomes<br />
a) Percent of preschool CWD<br />
children who did not<br />
improve functioning.<br />
b) Percent of preschool CWD<br />
who improved but whose<br />
functioning remained below<br />
same age peers.<br />
c) Percent of preschool CWD<br />
who improved at a level<br />
nearer to same aged peers.<br />
d) Percent of preschool CWD<br />
who improved functioning to<br />
reach a level comparable to<br />
same age peers.<br />
e) Percent of preschool CWD<br />
children who maintain<br />
functioning at a level<br />
comparable to same aged<br />
peers.<br />
Summary<br />
Statements<br />
1) Of those preschool<br />
children who entered<br />
the preschool program<br />
below age expectations<br />
in each Outcome, the<br />
percent who<br />
substantially increased<br />
their rate of growth by<br />
the time they turned 6<br />
years of age or exited<br />
the program.<br />
2) The percent of<br />
preschool children who<br />
were functioning<br />
within age expectations<br />
in each Outcome by the<br />
time they turned 6<br />
years of age or exited<br />
A) Positive Social -Emotional<br />
Skills*<br />
State<br />
Rate<br />
A) Positive Social -<br />
Emotional Skills<br />
(Including social<br />
relationships)<br />
State<br />
Rate<br />
2.14%<br />
5.31%<br />
25.97%<br />
38.22%<br />
28.36%<br />
State<br />
Target<br />
LEA<br />
Rate<br />
LEA<br />
Rate<br />
— —<br />
— —<br />
— —<br />
— —<br />
— —<br />
Target<br />
Met by<br />
LEA(Y/N)<br />
B) Acquisition and Use of<br />
Knowledge and Skills<br />
(Including early language/<br />
communication and early literacy)<br />
B) Acquisition and Use of<br />
Knowledge and Skills **<br />
State<br />
Rate<br />
1.75%<br />
6.59%<br />
34.23%<br />
43.51%<br />
13.92%<br />
State<br />
Target<br />
LEA<br />
Rate<br />
Target<br />
Met by<br />
LEA(Y/N)<br />
C) Use of Appropriate Behaviors<br />
to Meet Their Needs<br />
State<br />
Rate<br />
State<br />
Target<br />
LEA<br />
Rate<br />
Target<br />
Met by<br />
LEA(Y/N)<br />
89.61% 90.50% — — N/A 90.31% 90.50% — — N/A 90.82% 92.50% — — N/A<br />
66.58% 69.50% — — N/A 57.43% 60.50% — — N/A 76.69% 78.50% — — N/A<br />
NOTE: * Including social relationships ** Including early language/ communication and early literacy<br />
Note: - - denotes not applicable<br />
State<br />
Rate<br />
LEA<br />
Rate<br />
— —<br />
— —<br />
— —<br />
— —<br />
— —<br />
C) Use of<br />
Appropriate<br />
Behaviors to<br />
Meet Their Needs<br />
State<br />
Rate<br />
4.51%<br />
17.34%<br />
41.72%<br />
34.97%<br />
LEA<br />
Rate<br />
1.46% — —<br />
— —<br />
— —<br />
— —<br />
— —<br />
Page 3 of 5
LEA: 0602 - WARREN SCHOOL <strong>DISTRICT</strong><br />
Indicator 08: Parent Involvement<br />
Percent of surveyed<br />
parents who reported<br />
school facilitated parent<br />
involvement as a means<br />
of improving services<br />
and results for children<br />
with disabilities.<br />
Early Childhood<br />
(3-5)<br />
School Age<br />
(5-21)<br />
State<br />
Rate<br />
90.47%<br />
95.05%<br />
Indicator 09: Disproportionality - Eligibility<br />
Disproportionate representation of racial<br />
and ethnic groups in special education and<br />
related services that is a result of<br />
inappropriate identification (e.g.<br />
monitoring data, review of policies,<br />
practices, and procedures under 618(d),<br />
etc.).<br />
State<br />
Rate<br />
State<br />
Target<br />
88.00%<br />
96.00%<br />
State<br />
Target<br />
0.00% 0.00%<br />
LEA<br />
Rate<br />
— —<br />
96.55%<br />
Indicator 10: Disproportionality-Child with a Disability<br />
Disproportionate representation of racial<br />
and ethnic groups in specific disability<br />
categories that is a result of inappropriate<br />
identification (e.g. monitoring data, review<br />
of policies, practices, and procedures under<br />
618(d), etc.).<br />
Indicator 11: Child Find<br />
Percent of children with<br />
parental consent to evaluate<br />
who are evaluated within<br />
the State established timeline<br />
of 60 days.<br />
Overall<br />
(3-21)<br />
Early Childhood<br />
(3-5)<br />
School Age<br />
(5-21)<br />
State<br />
Rate<br />
0.00%<br />
Indicator 12: Early Childhood Transition<br />
Percent of children referred by Part C prior to<br />
age 3, who are found eligible for Part B, and<br />
who have an IEP developed and implemented<br />
by their third birthday.<br />
Note: - - denotes not applicable<br />
State<br />
Rate<br />
99.41%<br />
99.70%<br />
98.97%<br />
State<br />
Rate<br />
State<br />
Target<br />
0.00%<br />
State<br />
Target<br />
100.00%<br />
100.00%<br />
100.00%<br />
State<br />
Target<br />
Target Met by<br />
LEA (Y/N)<br />
Y<br />
Target Met by<br />
LEA (Y/N)<br />
Y<br />
LEA<br />
Rate<br />
100.00%<br />
— —<br />
100.00%<br />
LEA<br />
Rate<br />
Target Met by<br />
LEA (Y/N)<br />
N/A<br />
Y<br />
Note: The target for Indicator 09 is to have zero percent<br />
(0%) of districts identified as having disproportionate<br />
representation as a result of inappropriate<br />
identification in eligibility.<br />
Note: The target for Indicator 10 is to have zero<br />
percent (0%) of districts identified as having<br />
disproportionate representation as a result of<br />
inappropriate identification in a disability<br />
category.<br />
Target Met by<br />
LEA (Y/N)<br />
N/A<br />
Y<br />
Target Met<br />
by LEA<br />
(Y/N)<br />
99.21% 100.00% - - N/A<br />
Y<br />
Note: * Indicates a zero reponse rate for the<br />
district.<br />
Page 4 of 5
LEA: 0602 - WARREN SCHOOL <strong>DISTRICT</strong><br />
Indicator 13: Secondary Transition<br />
Percent of youth with disabilities aged 16 and<br />
up with an IEP that includes coordinated,<br />
measurable, annual IEP goals and transition<br />
services that will reasonably enable the student<br />
to meet the post-secondary goals.<br />
Indicator 14: Post-School Outcomes<br />
A. Percent of youth enrolled in higher<br />
education within one year of leaving high<br />
school.<br />
State<br />
Rate<br />
State<br />
Target<br />
Note: Data for this Indicator is from the on-site monitoring of LEAs for the given year.<br />
B. Percent of youth enrolled in higher<br />
education or competitively employed<br />
within one year of leaving high school.<br />
C. Percent of youth enrolled in higher<br />
education or in some other postsecondary<br />
education or training program; or<br />
competitively employed or in some other<br />
employment within one year of leaving<br />
high school.<br />
State<br />
Rate<br />
Indicator 20: Reported Data-Timely and Accurate*<br />
District submitted<br />
required data elements<br />
on or before due dates;<br />
made revisions within<br />
the alloted reveiw<br />
periods.<br />
Accurate and Timely<br />
Data Submission<br />
Overall (3-21)<br />
Early Childhood (3-5)<br />
School Age (5-21)<br />
State<br />
Target<br />
100.00%<br />
100.00%<br />
100.00%<br />
State<br />
Target<br />
LEA<br />
Rate<br />
LEA<br />
Rate<br />
Target Met by<br />
LEA (Y/N)<br />
Target Met<br />
by LEA<br />
(Y/N)<br />
Target Met<br />
by LEA<br />
(Y/N)<br />
*Data reviewed for timely and accurate submissions included all APSCN cycle data except for personnel<br />
Note: - - denotes not applicable<br />
96.19 100.00 — — N/A<br />
14.53<br />
State<br />
Rate<br />
49.42<br />
State<br />
Rate<br />
54.07<br />
13.00<br />
State<br />
Target<br />
49.00<br />
State<br />
Target<br />
60.00<br />
Y<br />
N/A<br />
Y<br />
— —<br />
LEA<br />
Rate<br />
— —<br />
LEA<br />
Rate<br />
— —<br />
N/A<br />
Target Met<br />
by LEA<br />
(Y/N)<br />
N/A<br />
Target Met<br />
by LEA<br />
(Y/N)<br />
N/A<br />
Page 5 of 5
LEA: 0701 - HAMPTON SCHOOL <strong>DISTRICT</strong><br />
<strong>ARKANSAS</strong> <strong>SPECIAL</strong> <strong>EDUCATION</strong><br />
<strong>DISTRICT</strong> <strong>ANNUAL</strong> PERFORMANCE REPORT<br />
2010/11 School Year<br />
Publication Date: March 2012<br />
Each State must have in place a State Performance Plan (SPP) to evaluate the State's efforts to meet the requirements and<br />
purposes of the implementation of the Individuals with Disabilities Education Act (IDEA). The SPP is a six-year plan, which<br />
describes Arkansas's performance on 20 indicators. The Office of Special Education Programs in the U. S. Department of<br />
Education requires that States report annually to the public on the performance of each local education agency (LEA) on 14 of<br />
20 indicators as compared with targets established by the State in the SPP. Arkansas will report indicators 1 through 14 and<br />
20 for each LEA serving children with disabilities (CWD). Any LEA not meeting targets on compliance indicators (0% for<br />
Indicators 4B, 09 & 10 and 100% for Indicators 11, 12, 13, and 20) are non-compliant with IDEA.<br />
There are no report changes for the 2010/11 school year profile; However, it is important to recognize that: .<br />
1. Indicator 01 (Graduation) is reported a year in arrear (2009/10 graduates) and is based on a four-year cohort. This<br />
means the rate is a measure of students who entered in ninth grade and graduate in four years. The calculation is a<br />
requirement under Title I of the Elementary and Secondary Education Act (ESEA).<br />
2. Indicator 02 (Drop out) is reported a year in arrear. This means the rate is a measure of students who dropped out in<br />
the 2009/10 school year. The Indicator 02 data are aligned with the Common Core of Data (CCD) requirements for<br />
grades 7-12.<br />
3. Indicator 04A and 4B (Suspension/Expulsion) is reported a year in arrear. This means the rate is a measure of<br />
students who had out-of-school suspensions and/or expulsions totaling more than 10 days.<br />
Percent of youth<br />
with IEPs<br />
graduating from<br />
high school with a<br />
regular diploma<br />
For a complete description of all the Indicators, please visit the special education website at<br />
http://arksped.k12.ar.us/sections/policy.html<br />
Indicator 01: Graduation Rates (2009/10 school year) Indicator 02: Dropout Rates (2009/10 school year)<br />
State<br />
Rate<br />
State<br />
Target<br />
75.76% 85.00%<br />
LEA<br />
Rate<br />
100.00%<br />
Target Met<br />
by LEA<br />
(Y/N)<br />
Y<br />
Percent of<br />
youth with<br />
IEPs dropping<br />
out of high<br />
school<br />
State<br />
Rate<br />
Indicator 03: Assessment on Statewide Benchmark Exam (grades 3-8, 11)<br />
A) Adequate Yearly Progress<br />
n=40<br />
Literacy<br />
Mathematics<br />
Met Disability Subgroup "n"<br />
for Reporting Purposes (Y/N)<br />
State Target for % of Districts Meeting<br />
AYP for Disability Subgroup<br />
State<br />
Target<br />
3.06% 4.20%<br />
LEA<br />
Rate<br />
0.00%<br />
% of Districts Meeting AYP<br />
for Disability Subgroup<br />
Target Met by<br />
LEA (Y/N)<br />
Y<br />
Target Met by<br />
LEA(Y/N)<br />
Overall N 17.15% 6.25%<br />
NA<br />
N<br />
N<br />
Note: For a district to qualify as having a disability subgroup it must have a minimum of 40 (n=40) students with disabilities in a school building.<br />
B) Participation<br />
Participation Rate: # of<br />
CWD Tested ÷ # of CWD<br />
Enrolled in grades tested.<br />
Participation Rate: Literacy<br />
Participation Rate: Math<br />
Note: - - denotes not applicable<br />
State<br />
Rate<br />
98.78%<br />
State<br />
Target<br />
95.00%<br />
LEA<br />
Rate<br />
100.00%<br />
Target Met<br />
by LEA (Y/N)<br />
98.61% 95.00% 100.00% Y<br />
Y<br />
C) Performance Proficiency<br />
Percent of CWD Scoring<br />
Proficient or Above<br />
Proficiency Rate: Literacy<br />
Proficiency Rate:<br />
Mathematics<br />
16.00%<br />
16.00%<br />
State<br />
Rate<br />
31.49%<br />
44.86%<br />
State<br />
Target<br />
45.22%<br />
51.14%<br />
LEA<br />
Rate<br />
20.00%<br />
24.24%<br />
NA<br />
NA<br />
Target<br />
Met by<br />
LEA (Y/N)<br />
N<br />
N<br />
Page 1 of 5
LEA: 0701 - HAMPTON SCHOOL <strong>DISTRICT</strong><br />
Indicator 04: Out-of-School Suspensions and Expulsions (2009/10 school year)<br />
A) Suspension/Expulsion<br />
Percent difference of CWD with out-of- school suspensions and<br />
expulsions totaling greater than 10 days in a school year as<br />
compared to the same data for general education students in<br />
the district.<br />
B) Suspension/Expulsion by Race and Ethnicity<br />
Percent of districts that have: (a) a significant discrepancy, by race or<br />
ethnicity, in the rate of suspensions and expulsions of greater than 10<br />
days in a school year for children with IEPs; and (b) policies,<br />
procedures or practices that contribute to the significant discrepancy<br />
and do not comply with requirements relating to the development<br />
and implementation of IEPs, the use of positive behavioral<br />
interventions and supports, and procedural safeguards.<br />
Indicator 05: School Age (5-21) Least Restrictive Environment<br />
A) In the Regular Class 80% or more of the day<br />
Percent of CWD with<br />
IEPs receiving instruction<br />
in the regular class 80%<br />
or more of the day.<br />
State<br />
Rate<br />
State<br />
Target<br />
LEA<br />
Rate<br />
B) In the Regular Class less than 40% of the day<br />
Percent of CWD with<br />
IEPs receiving instruction<br />
in the regular class less<br />
than 60% of the day.<br />
53.87% 59.77%<br />
State<br />
Rate<br />
State<br />
Target<br />
12.42% 12.51%<br />
56.25%<br />
LEA<br />
Rate<br />
3.13%<br />
C) Other Settings outside the regular class<br />
Percent of CWD with IEPs served in<br />
public or private separate schools,<br />
residential placements, or<br />
homebound/hospital placements.<br />
State<br />
Rate<br />
State<br />
Target<br />
2.80% 2.56%<br />
Target Met<br />
by LEA (Y/N)<br />
N<br />
Target Met<br />
by LEA (Y/N)<br />
Y<br />
LEA<br />
Rate<br />
0.00%<br />
Target Met<br />
by LEA(Y/N)<br />
Indicator 06: Early Childhood (3-5) Least Restrictive Environment<br />
A) Regular Early Childhood Program<br />
Percent of children (aged 3 through 5) with IEPs attending a regular<br />
early childhood program and receiving the majority of special<br />
education and related services in the regular early childhood program<br />
Allowable<br />
Difference<br />
LEA: 0701 - HAMPTON SCHOOL <strong>DISTRICT</strong><br />
Indicator 07: Preschool (3-5) Outcomes<br />
a) Percent of preschool CWD<br />
children who did not<br />
improve functioning.<br />
b) Percent of preschool CWD<br />
who improved but whose<br />
functioning remained below<br />
same age peers.<br />
c) Percent of preschool CWD<br />
who improved at a level<br />
nearer to same aged peers.<br />
d) Percent of preschool CWD<br />
who improved functioning to<br />
reach a level comparable to<br />
same age peers.<br />
e) Percent of preschool CWD<br />
children who maintain<br />
functioning at a level<br />
comparable to same aged<br />
peers.<br />
Summary<br />
Statements<br />
1) Of those preschool<br />
children who entered<br />
the preschool program<br />
below age expectations<br />
in each Outcome, the<br />
percent who<br />
substantially increased<br />
their rate of growth by<br />
the time they turned 6<br />
years of age or exited<br />
the program.<br />
2) The percent of<br />
preschool children who<br />
were functioning<br />
within age expectations<br />
in each Outcome by the<br />
time they turned 6<br />
years of age or exited<br />
A) Positive Social -Emotional<br />
Skills*<br />
State<br />
Rate<br />
A) Positive Social -<br />
Emotional Skills<br />
(Including social<br />
relationships)<br />
State<br />
Rate<br />
2.14%<br />
5.31%<br />
25.97%<br />
38.22%<br />
28.36%<br />
State<br />
Target<br />
LEA<br />
Rate<br />
LEA<br />
Rate<br />
— —<br />
— —<br />
— —<br />
— —<br />
— —<br />
Target<br />
Met by<br />
LEA(Y/N)<br />
B) Acquisition and Use of<br />
Knowledge and Skills<br />
(Including early language/<br />
communication and early literacy)<br />
B) Acquisition and Use of<br />
Knowledge and Skills **<br />
State<br />
Rate<br />
1.75%<br />
6.59%<br />
34.23%<br />
43.51%<br />
13.92%<br />
State<br />
Target<br />
LEA<br />
Rate<br />
Target<br />
Met by<br />
LEA(Y/N)<br />
C) Use of Appropriate Behaviors<br />
to Meet Their Needs<br />
State<br />
Rate<br />
State<br />
Target<br />
LEA<br />
Rate<br />
Target<br />
Met by<br />
LEA(Y/N)<br />
89.61% 90.50% — — N/A 90.31% 90.50% — — N/A 90.82% 92.50% — — N/A<br />
66.58% 69.50% — — N/A 57.43% 60.50% — — N/A 76.69% 78.50% — — N/A<br />
NOTE: * Including social relationships ** Including early language/ communication and early literacy<br />
Note: - - denotes not applicable<br />
State<br />
Rate<br />
LEA<br />
Rate<br />
— —<br />
— —<br />
— —<br />
— —<br />
— —<br />
C) Use of<br />
Appropriate<br />
Behaviors to<br />
Meet Their Needs<br />
State<br />
Rate<br />
4.51%<br />
17.34%<br />
41.72%<br />
34.97%<br />
LEA<br />
Rate<br />
1.46% — —<br />
— —<br />
— —<br />
— —<br />
— —<br />
Page 3 of 5
LEA: 0701 - HAMPTON SCHOOL <strong>DISTRICT</strong><br />
Indicator 08: Parent Involvement<br />
Percent of surveyed<br />
parents who reported<br />
school facilitated parent<br />
involvement as a means<br />
of improving services<br />
and results for children<br />
with disabilities.<br />
Early Childhood<br />
(3-5)<br />
School Age<br />
(5-21)<br />
State<br />
Rate<br />
90.47%<br />
95.05%<br />
Indicator 09: Disproportionality - Eligibility<br />
Disproportionate representation of racial<br />
and ethnic groups in special education and<br />
related services that is a result of<br />
inappropriate identification (e.g.<br />
monitoring data, review of policies,<br />
practices, and procedures under 618(d),<br />
etc.).<br />
State<br />
Rate<br />
State<br />
Target<br />
88.00%<br />
96.00%<br />
State<br />
Target<br />
0.00% 0.00%<br />
LEA<br />
Rate<br />
— —<br />
85.71%<br />
Indicator 10: Disproportionality-Child with a Disability<br />
Disproportionate representation of racial<br />
and ethnic groups in specific disability<br />
categories that is a result of inappropriate<br />
identification (e.g. monitoring data, review<br />
of policies, practices, and procedures under<br />
618(d), etc.).<br />
Indicator 11: Child Find<br />
Percent of children with<br />
parental consent to evaluate<br />
who are evaluated within<br />
the State established timeline<br />
of 60 days.<br />
Overall<br />
(3-21)<br />
Early Childhood<br />
(3-5)<br />
School Age<br />
(5-21)<br />
State<br />
Rate<br />
0.00%<br />
Indicator 12: Early Childhood Transition<br />
Percent of children referred by Part C prior to<br />
age 3, who are found eligible for Part B, and<br />
who have an IEP developed and implemented<br />
by their third birthday.<br />
Note: - - denotes not applicable<br />
State<br />
Rate<br />
99.41%<br />
99.70%<br />
98.97%<br />
State<br />
Rate<br />
State<br />
Target<br />
0.00%<br />
State<br />
Target<br />
100.00%<br />
100.00%<br />
100.00%<br />
State<br />
Target<br />
Target Met by<br />
LEA (Y/N)<br />
Y<br />
Target Met by<br />
LEA (Y/N)<br />
Y<br />
LEA<br />
Rate<br />
100.00%<br />
— —<br />
100.00%<br />
LEA<br />
Rate<br />
Target Met by<br />
LEA (Y/N)<br />
N/A<br />
N<br />
Note: The target for Indicator 09 is to have zero percent<br />
(0%) of districts identified as having disproportionate<br />
representation as a result of inappropriate<br />
identification in eligibility.<br />
Note: The target for Indicator 10 is to have zero<br />
percent (0%) of districts identified as having<br />
disproportionate representation as a result of<br />
inappropriate identification in a disability<br />
category.<br />
Target Met by<br />
LEA (Y/N)<br />
N/A<br />
Y<br />
Target Met<br />
by LEA<br />
(Y/N)<br />
99.21% 100.00% - - N/A<br />
Y<br />
Note: * Indicates a zero reponse rate for the<br />
district.<br />
Page 4 of 5
LEA: 0701 - HAMPTON SCHOOL <strong>DISTRICT</strong><br />
Indicator 13: Secondary Transition<br />
Percent of youth with disabilities aged 16 and<br />
up with an IEP that includes coordinated,<br />
measurable, annual IEP goals and transition<br />
services that will reasonably enable the student<br />
to meet the post-secondary goals.<br />
Indicator 14: Post-School Outcomes<br />
A. Percent of youth enrolled in higher<br />
education within one year of leaving high<br />
school.<br />
State<br />
Rate<br />
State<br />
Target<br />
Note: Data for this Indicator is from the on-site monitoring of LEAs for the given year.<br />
B. Percent of youth enrolled in higher<br />
education or competitively employed<br />
within one year of leaving high school.<br />
C. Percent of youth enrolled in higher<br />
education or in some other postsecondary<br />
education or training program; or<br />
competitively employed or in some other<br />
employment within one year of leaving<br />
high school.<br />
State<br />
Rate<br />
Indicator 20: Reported Data-Timely and Accurate*<br />
District submitted<br />
required data elements<br />
on or before due dates;<br />
made revisions within<br />
the alloted reveiw<br />
periods.<br />
Accurate and Timely<br />
Data Submission<br />
Overall (3-21)<br />
Early Childhood (3-5)<br />
School Age (5-21)<br />
State<br />
Target<br />
100.00%<br />
100.00%<br />
100.00%<br />
State<br />
Target<br />
LEA<br />
Rate<br />
LEA<br />
Rate<br />
Target Met by<br />
LEA (Y/N)<br />
Target Met<br />
by LEA<br />
(Y/N)<br />
Target Met<br />
by LEA<br />
(Y/N)<br />
*Data reviewed for timely and accurate submissions included all APSCN cycle data except for personnel<br />
Note: - - denotes not applicable<br />
96.19 100.00 100.00% Y<br />
14.53<br />
State<br />
Rate<br />
49.42<br />
State<br />
Rate<br />
54.07<br />
13.00<br />
State<br />
Target<br />
49.00<br />
State<br />
Target<br />
60.00<br />
Y<br />
N/A<br />
Y<br />
0.00%<br />
LEA<br />
Rate<br />
0.00%<br />
LEA<br />
Rate<br />
0.00%<br />
N<br />
Target Met<br />
by LEA<br />
(Y/N)<br />
N<br />
Target Met<br />
by LEA<br />
(Y/N)<br />
N<br />
Page 5 of 5
LEA: 0801 - BERRYVILLE SCHOOL <strong>DISTRICT</strong><br />
<strong>ARKANSAS</strong> <strong>SPECIAL</strong> <strong>EDUCATION</strong><br />
<strong>DISTRICT</strong> <strong>ANNUAL</strong> PERFORMANCE REPORT<br />
2010/11 School Year<br />
Publication Date: March 2012<br />
Each State must have in place a State Performance Plan (SPP) to evaluate the State's efforts to meet the requirements and<br />
purposes of the implementation of the Individuals with Disabilities Education Act (IDEA). The SPP is a six-year plan, which<br />
describes Arkansas's performance on 20 indicators. The Office of Special Education Programs in the U. S. Department of<br />
Education requires that States report annually to the public on the performance of each local education agency (LEA) on 14 of<br />
20 indicators as compared with targets established by the State in the SPP. Arkansas will report indicators 1 through 14 and<br />
20 for each LEA serving children with disabilities (CWD). Any LEA not meeting targets on compliance indicators (0% for<br />
Indicators 4B, 09 & 10 and 100% for Indicators 11, 12, 13, and 20) are non-compliant with IDEA.<br />
There are no report changes for the 2010/11 school year profile; However, it is important to recognize that: .<br />
1. Indicator 01 (Graduation) is reported a year in arrear (2009/10 graduates) and is based on a four-year cohort. This<br />
means the rate is a measure of students who entered in ninth grade and graduate in four years. The calculation is a<br />
requirement under Title I of the Elementary and Secondary Education Act (ESEA).<br />
2. Indicator 02 (Drop out) is reported a year in arrear. This means the rate is a measure of students who dropped out in<br />
the 2009/10 school year. The Indicator 02 data are aligned with the Common Core of Data (CCD) requirements for<br />
grades 7-12.<br />
3. Indicator 04A and 4B (Suspension/Expulsion) is reported a year in arrear. This means the rate is a measure of<br />
students who had out-of-school suspensions and/or expulsions totaling more than 10 days.<br />
Percent of youth<br />
with IEPs<br />
graduating from<br />
high school with a<br />
regular diploma<br />
For a complete description of all the Indicators, please visit the special education website at<br />
http://arksped.k12.ar.us/sections/policy.html<br />
Indicator 01: Graduation Rates (2009/10 school year) Indicator 02: Dropout Rates (2009/10 school year)<br />
State<br />
Rate<br />
State<br />
Target<br />
75.76% 85.00%<br />
LEA<br />
Rate<br />
70.59%<br />
Target Met<br />
by LEA<br />
(Y/N)<br />
N<br />
Percent of<br />
youth with<br />
IEPs dropping<br />
out of high<br />
school<br />
State<br />
Rate<br />
Indicator 03: Assessment on Statewide Benchmark Exam (grades 3-8, 11)<br />
A) Adequate Yearly Progress<br />
n=40<br />
Literacy<br />
Mathematics<br />
Met Disability Subgroup "n"<br />
for Reporting Purposes (Y/N)<br />
State Target for % of Districts Meeting<br />
AYP for Disability Subgroup<br />
State<br />
Target<br />
3.06% 4.20%<br />
LEA<br />
Rate<br />
6.02%<br />
% of Districts Meeting AYP<br />
for Disability Subgroup<br />
Target Met by<br />
LEA (Y/N)<br />
N<br />
Target Met by<br />
LEA(Y/N)<br />
Overall N 17.15% 6.25%<br />
NA<br />
N<br />
N<br />
Note: For a district to qualify as having a disability subgroup it must have a minimum of 40 (n=40) students with disabilities in a school building.<br />
B) Participation<br />
Participation Rate: # of<br />
CWD Tested ÷ # of CWD<br />
Enrolled in grades tested.<br />
Participation Rate: Literacy<br />
Participation Rate: Math<br />
Note: - - denotes not applicable<br />
State<br />
Rate<br />
98.78%<br />
State<br />
Target<br />
95.00%<br />
LEA<br />
Rate<br />
99.20%<br />
Target Met<br />
by LEA (Y/N)<br />
98.61% 95.00% 99.24% Y<br />
Y<br />
C) Performance Proficiency<br />
Percent of CWD Scoring<br />
Proficient or Above<br />
Proficiency Rate: Literacy<br />
Proficiency Rate:<br />
Mathematics<br />
16.00%<br />
16.00%<br />
State<br />
Rate<br />
31.49%<br />
44.86%<br />
State<br />
Target<br />
45.22%<br />
51.14%<br />
LEA<br />
Rate<br />
33.05%<br />
51.20%<br />
NA<br />
NA<br />
Target<br />
Met by<br />
LEA (Y/N)<br />
N<br />
Y<br />
Page 1 of 5
LEA: 0801 - BERRYVILLE SCHOOL <strong>DISTRICT</strong><br />
Indicator 04: Out-of-School Suspensions and Expulsions (2009/10 school year)<br />
A) Suspension/Expulsion<br />
Percent difference of CWD with out-of- school suspensions and<br />
expulsions totaling greater than 10 days in a school year as<br />
compared to the same data for general education students in<br />
the district.<br />
B) Suspension/Expulsion by Race and Ethnicity<br />
Percent of districts that have: (a) a significant discrepancy, by race or<br />
ethnicity, in the rate of suspensions and expulsions of greater than 10<br />
days in a school year for children with IEPs; and (b) policies,<br />
procedures or practices that contribute to the significant discrepancy<br />
and do not comply with requirements relating to the development<br />
and implementation of IEPs, the use of positive behavioral<br />
interventions and supports, and procedural safeguards.<br />
Indicator 05: School Age (5-21) Least Restrictive Environment<br />
A) In the Regular Class 80% or more of the day<br />
Percent of CWD with<br />
IEPs receiving instruction<br />
in the regular class 80%<br />
or more of the day.<br />
State<br />
Rate<br />
State<br />
Target<br />
LEA<br />
Rate<br />
B) In the Regular Class less than 40% of the day<br />
Percent of CWD with<br />
IEPs receiving instruction<br />
in the regular class less<br />
than 60% of the day.<br />
53.87% 59.77%<br />
State<br />
Rate<br />
State<br />
Target<br />
12.42% 12.51%<br />
57.28%<br />
LEA<br />
Rate<br />
8.45%<br />
C) Other Settings outside the regular class<br />
Percent of CWD with IEPs served in<br />
public or private separate schools,<br />
residential placements, or<br />
homebound/hospital placements.<br />
State<br />
Rate<br />
State<br />
Target<br />
2.80% 2.56%<br />
Target Met<br />
by LEA (Y/N)<br />
N<br />
Target Met<br />
by LEA (Y/N)<br />
Y<br />
LEA<br />
Rate<br />
0.47%<br />
Target Met<br />
by LEA(Y/N)<br />
Indicator 06: Early Childhood (3-5) Least Restrictive Environment<br />
A) Regular Early Childhood Program<br />
Percent of children (aged 3 through 5) with IEPs attending a regular<br />
early childhood program and receiving the majority of special<br />
education and related services in the regular early childhood program<br />
Allowable<br />
Difference<br />
LEA: 0801 - BERRYVILLE SCHOOL <strong>DISTRICT</strong><br />
Indicator 07: Preschool (3-5) Outcomes<br />
a) Percent of preschool CWD<br />
children who did not<br />
improve functioning.<br />
b) Percent of preschool CWD<br />
who improved but whose<br />
functioning remained below<br />
same age peers.<br />
c) Percent of preschool CWD<br />
who improved at a level<br />
nearer to same aged peers.<br />
d) Percent of preschool CWD<br />
who improved functioning to<br />
reach a level comparable to<br />
same age peers.<br />
e) Percent of preschool CWD<br />
children who maintain<br />
functioning at a level<br />
comparable to same aged<br />
peers.<br />
Summary<br />
Statements<br />
1) Of those preschool<br />
children who entered<br />
the preschool program<br />
below age expectations<br />
in each Outcome, the<br />
percent who<br />
substantially increased<br />
their rate of growth by<br />
the time they turned 6<br />
years of age or exited<br />
the program.<br />
2) The percent of<br />
preschool children who<br />
were functioning<br />
within age expectations<br />
in each Outcome by the<br />
time they turned 6<br />
years of age or exited<br />
A) Positive Social -Emotional<br />
Skills*<br />
State<br />
Rate<br />
A) Positive Social -<br />
Emotional Skills<br />
(Including social<br />
relationships)<br />
State<br />
Rate<br />
2.14%<br />
5.31%<br />
25.97%<br />
38.22%<br />
28.36%<br />
State<br />
Target<br />
LEA<br />
Rate<br />
LEA<br />
Rate<br />
— —<br />
— —<br />
— —<br />
— —<br />
— —<br />
Target<br />
Met by<br />
LEA(Y/N)<br />
B) Acquisition and Use of<br />
Knowledge and Skills<br />
(Including early language/<br />
communication and early literacy)<br />
B) Acquisition and Use of<br />
Knowledge and Skills **<br />
State<br />
Rate<br />
1.75%<br />
6.59%<br />
34.23%<br />
43.51%<br />
13.92%<br />
State<br />
Target<br />
LEA<br />
Rate<br />
Target<br />
Met by<br />
LEA(Y/N)<br />
C) Use of Appropriate Behaviors<br />
to Meet Their Needs<br />
State<br />
Rate<br />
State<br />
Target<br />
LEA<br />
Rate<br />
Target<br />
Met by<br />
LEA(Y/N)<br />
89.61% 90.50% — — N/A 90.31% 90.50% — — N/A 90.82% 92.50% — — N/A<br />
66.58% 69.50% — — N/A 57.43% 60.50% — — N/A 76.69% 78.50% — — N/A<br />
NOTE: * Including social relationships ** Including early language/ communication and early literacy<br />
Note: - - denotes not applicable<br />
State<br />
Rate<br />
LEA<br />
Rate<br />
— —<br />
— —<br />
— —<br />
— —<br />
— —<br />
C) Use of<br />
Appropriate<br />
Behaviors to<br />
Meet Their Needs<br />
State<br />
Rate<br />
4.51%<br />
17.34%<br />
41.72%<br />
34.97%<br />
LEA<br />
Rate<br />
1.46% — —<br />
— —<br />
— —<br />
— —<br />
— —<br />
Page 3 of 5
LEA: 0801 - BERRYVILLE SCHOOL <strong>DISTRICT</strong><br />
Indicator 08: Parent Involvement<br />
Percent of surveyed<br />
parents who reported<br />
school facilitated parent<br />
involvement as a means<br />
of improving services<br />
and results for children<br />
with disabilities.<br />
Early Childhood<br />
(3-5)<br />
School Age<br />
(5-21)<br />
State<br />
Rate<br />
90.47%<br />
95.05%<br />
Indicator 09: Disproportionality - Eligibility<br />
Disproportionate representation of racial<br />
and ethnic groups in special education and<br />
related services that is a result of<br />
inappropriate identification (e.g.<br />
monitoring data, review of policies,<br />
practices, and procedures under 618(d),<br />
etc.).<br />
State<br />
Rate<br />
State<br />
Target<br />
88.00%<br />
96.00%<br />
State<br />
Target<br />
0.00% 0.00%<br />
LEA<br />
Rate<br />
100.00%<br />
95.73%<br />
Indicator 10: Disproportionality-Child with a Disability<br />
Disproportionate representation of racial<br />
and ethnic groups in specific disability<br />
categories that is a result of inappropriate<br />
identification (e.g. monitoring data, review<br />
of policies, practices, and procedures under<br />
618(d), etc.).<br />
Indicator 11: Child Find<br />
Percent of children with<br />
parental consent to evaluate<br />
who are evaluated within<br />
the State established timeline<br />
of 60 days.<br />
Overall<br />
(3-21)<br />
Early Childhood<br />
(3-5)<br />
School Age<br />
(5-21)<br />
State<br />
Rate<br />
0.00%<br />
Indicator 12: Early Childhood Transition<br />
Percent of children referred by Part C prior to<br />
age 3, who are found eligible for Part B, and<br />
who have an IEP developed and implemented<br />
by their third birthday.<br />
Note: - - denotes not applicable<br />
State<br />
Rate<br />
99.41%<br />
99.70%<br />
98.97%<br />
State<br />
Rate<br />
State<br />
Target<br />
0.00%<br />
State<br />
Target<br />
100.00%<br />
100.00%<br />
100.00%<br />
State<br />
Target<br />
Target Met by<br />
LEA (Y/N)<br />
Y<br />
Target Met by<br />
LEA (Y/N)<br />
Y<br />
LEA<br />
Rate<br />
100.00%<br />
— —<br />
100.00%<br />
LEA<br />
Rate<br />
Target Met by<br />
LEA (Y/N)<br />
Y<br />
N<br />
Note: The target for Indicator 09 is to have zero percent<br />
(0%) of districts identified as having disproportionate<br />
representation as a result of inappropriate<br />
identification in eligibility.<br />
Note: The target for Indicator 10 is to have zero<br />
percent (0%) of districts identified as having<br />
disproportionate representation as a result of<br />
inappropriate identification in a disability<br />
category.<br />
Target Met by<br />
LEA (Y/N)<br />
N/A<br />
Y<br />
Target Met<br />
by LEA<br />
(Y/N)<br />
99.21% 100.00% - - N/A<br />
Y<br />
Note: * Indicates a zero reponse rate for the<br />
district.<br />
Page 4 of 5
LEA: 0801 - BERRYVILLE SCHOOL <strong>DISTRICT</strong><br />
Indicator 13: Secondary Transition<br />
Percent of youth with disabilities aged 16 and<br />
up with an IEP that includes coordinated,<br />
measurable, annual IEP goals and transition<br />
services that will reasonably enable the student<br />
to meet the post-secondary goals.<br />
Indicator 14: Post-School Outcomes<br />
A. Percent of youth enrolled in higher<br />
education within one year of leaving high<br />
school.<br />
State<br />
Rate<br />
State<br />
Target<br />
Note: Data for this Indicator is from the on-site monitoring of LEAs for the given year.<br />
B. Percent of youth enrolled in higher<br />
education or competitively employed<br />
within one year of leaving high school.<br />
C. Percent of youth enrolled in higher<br />
education or in some other postsecondary<br />
education or training program; or<br />
competitively employed or in some other<br />
employment within one year of leaving<br />
high school.<br />
State<br />
Rate<br />
Indicator 20: Reported Data-Timely and Accurate*<br />
District submitted<br />
required data elements<br />
on or before due dates;<br />
made revisions within<br />
the alloted reveiw<br />
periods.<br />
Accurate and Timely<br />
Data Submission<br />
Overall (3-21)<br />
Early Childhood (3-5)<br />
School Age (5-21)<br />
State<br />
Target<br />
100.00%<br />
100.00%<br />
100.00%<br />
State<br />
Target<br />
LEA<br />
Rate<br />
LEA<br />
Rate<br />
Target Met by<br />
LEA (Y/N)<br />
Target Met<br />
by LEA<br />
(Y/N)<br />
Target Met<br />
by LEA<br />
(Y/N)<br />
*Data reviewed for timely and accurate submissions included all APSCN cycle data except for personnel<br />
Note: - - denotes not applicable<br />
96.19 100.00 — — N/A<br />
14.53<br />
State<br />
Rate<br />
49.42<br />
State<br />
Rate<br />
54.07<br />
13.00<br />
State<br />
Target<br />
49.00<br />
State<br />
Target<br />
60.00<br />
Y<br />
N/A<br />
Y<br />
0.00%<br />
LEA<br />
Rate<br />
50.00%<br />
LEA<br />
Rate<br />
50.00%<br />
N<br />
Target Met<br />
by LEA<br />
(Y/N)<br />
Y<br />
Target Met<br />
by LEA<br />
(Y/N)<br />
N<br />
Page 5 of 5
<strong>ARKANSAS</strong> <strong>SPECIAL</strong> <strong>EDUCATION</strong><br />
<strong>DISTRICT</strong> <strong>ANNUAL</strong> PERFORMANCE REPORT<br />
2010/11 School Year<br />
Publication Date: March 2012<br />
Each State must have in place a State Performance Plan (SPP) to evaluate the State's efforts to meet the requirements and<br />
purposes of the implementation of the Individuals with Disabilities Education Act (IDEA). The SPP is a six-year plan, which<br />
describes Arkansas's performance on 20 indicators. The Office of Special Education Programs in the U. S. Department of<br />
Education requires that States report annually to the public on the performance of each local education agency (LEA) on 14 of<br />
20 indicators as compared with targets established by the State in the SPP. Arkansas will report indicators 1 through 14 and<br />
20 for each LEA serving children with disabilities (CWD). Any LEA not meeting targets on compliance indicators (0% for<br />
Indicators 4B, 09 & 10 and 100% for Indicators 11, 12, 13, and 20) are non-compliant with IDEA.<br />
There are no report changes for the 2010/11 school year profile; However, it is important to recognize that: .<br />
1. Indicator 01 (Graduation) is reported a year in arrear (2009/10 graduates) and is based on a four-year cohort. This<br />
means the rate is a measure of students who entered in ninth grade and graduate in four years. The calculation is a<br />
requirement under Title I of the Elementary and Secondary Education Act (ESEA).<br />
2. Indicator 02 (Drop out) is reported a year in arrear. This means the rate is a measure of students who dropped out in<br />
the 2009/10 school year. The Indicator 02 data are aligned with the Common Core of Data (CCD) requirements for<br />
grades 7-12.<br />
3. Indicator 04A and 4B (Suspension/Expulsion) is reported a year in arrear. This means the rate is a measure of<br />
students who had out-of-school suspensions and/or expulsions totaling more than 10 days.<br />
For a complete description of all the Indicators, please visit the special education website at<br />
http://arksped.k12.ar.us/sections/policy.html<br />
LEA: 0802 - EUREKA SPRINGS SCHOOL <strong>DISTRICT</strong><br />
Indicator 01: Graduation Rates (2009/10 school year) Indicator 02: Dropout Rates (2009/10 school year)<br />
Percent of youth<br />
with IEPs<br />
graduating from<br />
high school with a<br />
regular diploma<br />
State<br />
Rate<br />
State<br />
Target<br />
75.76% 85.00%<br />
LEA<br />
Rate<br />
100.00%<br />
Target Met<br />
by LEA<br />
(Y/N)<br />
Y<br />
Percent of<br />
youth with<br />
IEPs dropping<br />
out of high<br />
school<br />
State<br />
Rate<br />
Indicator 03: Assessment on Statewide Benchmark Exam (grades 3-8, 11)<br />
A) Adequate Yearly Progress<br />
n=40<br />
Literacy<br />
Mathematics<br />
Met Disability Subgroup "n"<br />
for Reporting Purposes (Y/N)<br />
State Target for % of Districts Meeting<br />
AYP for Disability Subgroup<br />
State<br />
Target<br />
3.06% 4.20%<br />
LEA<br />
Rate<br />
4.44%<br />
% of Districts Meeting AYP<br />
for Disability Subgroup<br />
Target Met by<br />
LEA (Y/N)<br />
N<br />
Target Met by<br />
LEA(Y/N)<br />
Overall N 17.15% 6.25%<br />
NA<br />
N<br />
N<br />
Note: For a district to qualify as having a disability subgroup it must have a minimum of 40 (n=40) students with disabilities in a school building.<br />
B) Participation<br />
Participation Rate: # of<br />
CWD Tested ÷ # of CWD<br />
Enrolled in grades tested.<br />
Participation Rate: Literacy<br />
Participation Rate: Math<br />
Note: - - denotes not applicable<br />
State<br />
Rate<br />
98.78%<br />
State<br />
Target<br />
95.00%<br />
LEA<br />
Rate<br />
100.00%<br />
Target Met<br />
by LEA (Y/N)<br />
98.61% 95.00% 100.00% Y<br />
Y<br />
C) Performance Proficiency<br />
Percent of CWD Scoring<br />
Proficient or Above<br />
Proficiency Rate: Literacy<br />
Proficiency Rate:<br />
Mathematics<br />
16.00%<br />
16.00%<br />
State<br />
Rate<br />
31.49%<br />
44.86%<br />
State<br />
Target<br />
45.22%<br />
51.14%<br />
LEA<br />
Rate<br />
21.62%<br />
40.54%<br />
NA<br />
NA<br />
Target<br />
Met by<br />
LEA (Y/N)<br />
N<br />
N<br />
Page 1 of 5
LEA: 0802 - EUREKA SPRINGS SCHOOL <strong>DISTRICT</strong><br />
Indicator 04: Out-of-School Suspensions and Expulsions (2009/10 school year)<br />
A) Suspension/Expulsion<br />
Percent difference of CWD with out-of- school suspensions and<br />
expulsions totaling greater than 10 days in a school year as<br />
compared to the same data for general education students in<br />
the district.<br />
B) Suspension/Expulsion by Race and Ethnicity<br />
Percent of districts that have: (a) a significant discrepancy, by race or<br />
ethnicity, in the rate of suspensions and expulsions of greater than 10<br />
days in a school year for children with IEPs; and (b) policies,<br />
procedures or practices that contribute to the significant discrepancy<br />
and do not comply with requirements relating to the development<br />
and implementation of IEPs, the use of positive behavioral<br />
interventions and supports, and procedural safeguards.<br />
Indicator 05: School Age (5-21) Least Restrictive Environment<br />
A) In the Regular Class 80% or more of the day<br />
Percent of CWD with<br />
IEPs receiving instruction<br />
in the regular class 80%<br />
or more of the day.<br />
State<br />
Rate<br />
State<br />
Target<br />
LEA<br />
Rate<br />
B) In the Regular Class less than 40% of the day<br />
Percent of CWD with<br />
IEPs receiving instruction<br />
in the regular class less<br />
than 60% of the day.<br />
53.87% 59.77%<br />
State<br />
Rate<br />
State<br />
Target<br />
12.42% 12.51%<br />
58.14%<br />
LEA<br />
Rate<br />
18.60%<br />
C) Other Settings outside the regular class<br />
Percent of CWD with IEPs served in<br />
public or private separate schools,<br />
residential placements, or<br />
homebound/hospital placements.<br />
State<br />
Rate<br />
State<br />
Target<br />
2.80% 2.56%<br />
Target Met<br />
by LEA (Y/N)<br />
N<br />
Target Met<br />
by LEA (Y/N)<br />
N<br />
LEA<br />
Rate<br />
0.00%<br />
Target Met<br />
by LEA(Y/N)<br />
Indicator 06: Early Childhood (3-5) Least Restrictive Environment<br />
A) Regular Early Childhood Program<br />
Percent of children (aged 3 through 5) with IEPs attending a regular<br />
early childhood program and receiving the majority of special<br />
education and related services in the regular early childhood program<br />
Allowable<br />
Difference<br />
LEA: 0802 - EUREKA SPRINGS SCHOOL <strong>DISTRICT</strong><br />
Indicator 07: Preschool (3-5) Outcomes<br />
a) Percent of preschool CWD<br />
children who did not<br />
improve functioning.<br />
b) Percent of preschool CWD<br />
who improved but whose<br />
functioning remained below<br />
same age peers.<br />
c) Percent of preschool CWD<br />
who improved at a level<br />
nearer to same aged peers.<br />
d) Percent of preschool CWD<br />
who improved functioning to<br />
reach a level comparable to<br />
same age peers.<br />
e) Percent of preschool CWD<br />
children who maintain<br />
functioning at a level<br />
comparable to same aged<br />
peers.<br />
Summary<br />
Statements<br />
1) Of those preschool<br />
children who entered<br />
the preschool program<br />
below age expectations<br />
in each Outcome, the<br />
percent who<br />
substantially increased<br />
their rate of growth by<br />
the time they turned 6<br />
years of age or exited<br />
the program.<br />
2) The percent of<br />
preschool children who<br />
were functioning<br />
within age expectations<br />
in each Outcome by the<br />
time they turned 6<br />
years of age or exited<br />
A) Positive Social -Emotional<br />
Skills*<br />
State<br />
Rate<br />
A) Positive Social -<br />
Emotional Skills<br />
(Including social<br />
relationships)<br />
State<br />
Rate<br />
2.14%<br />
5.31%<br />
25.97%<br />
38.22%<br />
28.36%<br />
State<br />
Target<br />
LEA<br />
Rate<br />
LEA<br />
Rate<br />
— —<br />
— —<br />
— —<br />
— —<br />
— —<br />
Target<br />
Met by<br />
LEA(Y/N)<br />
B) Acquisition and Use of<br />
Knowledge and Skills<br />
(Including early language/<br />
communication and early literacy)<br />
B) Acquisition and Use of<br />
Knowledge and Skills **<br />
State<br />
Rate<br />
1.75%<br />
6.59%<br />
34.23%<br />
43.51%<br />
13.92%<br />
State<br />
Target<br />
LEA<br />
Rate<br />
Target<br />
Met by<br />
LEA(Y/N)<br />
C) Use of Appropriate Behaviors<br />
to Meet Their Needs<br />
State<br />
Rate<br />
State<br />
Target<br />
LEA<br />
Rate<br />
Target<br />
Met by<br />
LEA(Y/N)<br />
89.61% 90.50% — — N/A 90.31% 90.50% — — N/A 90.82% 92.50% — — N/A<br />
66.58% 69.50% — — N/A 57.43% 60.50% — — N/A 76.69% 78.50% — — N/A<br />
NOTE: * Including social relationships ** Including early language/ communication and early literacy<br />
Note: - - denotes not applicable<br />
State<br />
Rate<br />
LEA<br />
Rate<br />
— —<br />
— —<br />
— —<br />
— —<br />
— —<br />
C) Use of<br />
Appropriate<br />
Behaviors to<br />
Meet Their Needs<br />
State<br />
Rate<br />
4.51%<br />
17.34%<br />
41.72%<br />
34.97%<br />
LEA<br />
Rate<br />
1.46% — —<br />
— —<br />
— —<br />
— —<br />
— —<br />
Page 3 of 5
LEA: 0802 - EUREKA SPRINGS SCHOOL <strong>DISTRICT</strong><br />
Indicator 08: Parent Involvement<br />
Percent of surveyed<br />
parents who reported<br />
school facilitated parent<br />
involvement as a means<br />
of improving services<br />
and results for children<br />
with disabilities.<br />
Early Childhood<br />
(3-5)<br />
School Age<br />
(5-21)<br />
State<br />
Rate<br />
90.47%<br />
95.05%<br />
Indicator 09: Disproportionality - Eligibility<br />
Disproportionate representation of racial<br />
and ethnic groups in special education and<br />
related services that is a result of<br />
inappropriate identification (e.g.<br />
monitoring data, review of policies,<br />
practices, and procedures under 618(d),<br />
etc.).<br />
State<br />
Rate<br />
State<br />
Target<br />
88.00%<br />
96.00%<br />
State<br />
Target<br />
0.00% 0.00%<br />
LEA<br />
Rate<br />
— —<br />
98.59%<br />
Indicator 10: Disproportionality-Child with a Disability<br />
Disproportionate representation of racial<br />
and ethnic groups in specific disability<br />
categories that is a result of inappropriate<br />
identification (e.g. monitoring data, review<br />
of policies, practices, and procedures under<br />
618(d), etc.).<br />
Indicator 11: Child Find<br />
Percent of children with<br />
parental consent to evaluate<br />
who are evaluated within<br />
the State established timeline<br />
of 60 days.<br />
Overall<br />
(3-21)<br />
Early Childhood<br />
(3-5)<br />
School Age<br />
(5-21)<br />
State<br />
Rate<br />
0.00%<br />
Indicator 12: Early Childhood Transition<br />
Percent of children referred by Part C prior to<br />
age 3, who are found eligible for Part B, and<br />
who have an IEP developed and implemented<br />
by their third birthday.<br />
Note: - - denotes not applicable<br />
State<br />
Rate<br />
99.41%<br />
99.70%<br />
98.97%<br />
State<br />
Rate<br />
State<br />
Target<br />
0.00%<br />
State<br />
Target<br />
100.00%<br />
100.00%<br />
100.00%<br />
State<br />
Target<br />
Target Met by<br />
LEA (Y/N)<br />
Y<br />
Target Met by<br />
LEA (Y/N)<br />
Y<br />
LEA<br />
Rate<br />
100.00%<br />
— —<br />
100.00%<br />
LEA<br />
Rate<br />
Target Met by<br />
LEA (Y/N)<br />
N/A<br />
Y<br />
Note: The target for Indicator 09 is to have zero percent<br />
(0%) of districts identified as having disproportionate<br />
representation as a result of inappropriate<br />
identification in eligibility.<br />
Note: The target for Indicator 10 is to have zero<br />
percent (0%) of districts identified as having<br />
disproportionate representation as a result of<br />
inappropriate identification in a disability<br />
category.<br />
Target Met by<br />
LEA (Y/N)<br />
N/A<br />
Y<br />
Target Met<br />
by LEA<br />
(Y/N)<br />
99.21% 100.00% - - N/A<br />
Y<br />
Note: * Indicates a zero reponse rate for the<br />
district.<br />
Page 4 of 5
LEA: 0802 - EUREKA SPRINGS SCHOOL <strong>DISTRICT</strong><br />
Indicator 13: Secondary Transition<br />
Percent of youth with disabilities aged 16 and<br />
up with an IEP that includes coordinated,<br />
measurable, annual IEP goals and transition<br />
services that will reasonably enable the student<br />
to meet the post-secondary goals.<br />
Indicator 14: Post-School Outcomes<br />
A. Percent of youth enrolled in higher<br />
education within one year of leaving high<br />
school.<br />
State<br />
Rate<br />
State<br />
Target<br />
Note: Data for this Indicator is from the on-site monitoring of LEAs for the given year.<br />
B. Percent of youth enrolled in higher<br />
education or competitively employed<br />
within one year of leaving high school.<br />
C. Percent of youth enrolled in higher<br />
education or in some other postsecondary<br />
education or training program; or<br />
competitively employed or in some other<br />
employment within one year of leaving<br />
high school.<br />
State<br />
Rate<br />
Indicator 20: Reported Data-Timely and Accurate*<br />
District submitted<br />
required data elements<br />
on or before due dates;<br />
made revisions within<br />
the alloted reveiw<br />
periods.<br />
Accurate and Timely<br />
Data Submission<br />
Overall (3-21)<br />
Early Childhood (3-5)<br />
School Age (5-21)<br />
State<br />
Target<br />
100.00%<br />
100.00%<br />
100.00%<br />
State<br />
Target<br />
LEA<br />
Rate<br />
LEA<br />
Rate<br />
Target Met by<br />
LEA (Y/N)<br />
Target Met<br />
by LEA<br />
(Y/N)<br />
Target Met<br />
by LEA<br />
(Y/N)<br />
*Data reviewed for timely and accurate submissions included all APSCN cycle data except for personnel<br />
Note: - - denotes not applicable<br />
96.19 100.00 — — N/A<br />
14.53<br />
State<br />
Rate<br />
49.42<br />
State<br />
Rate<br />
54.07<br />
13.00<br />
State<br />
Target<br />
49.00<br />
State<br />
Target<br />
60.00<br />
Y<br />
N/A<br />
Y<br />
— —<br />
LEA<br />
Rate<br />
— —<br />
LEA<br />
Rate<br />
— —<br />
N/A<br />
Target Met<br />
by LEA<br />
(Y/N)<br />
N/A<br />
Target Met<br />
by LEA<br />
(Y/N)<br />
N/A<br />
Page 5 of 5
<strong>ARKANSAS</strong> <strong>SPECIAL</strong> <strong>EDUCATION</strong><br />
<strong>DISTRICT</strong> <strong>ANNUAL</strong> PERFORMANCE REPORT<br />
2010/11 School Year<br />
Publication Date: March 2012<br />
Each State must have in place a State Performance Plan (SPP) to evaluate the State's efforts to meet the requirements and<br />
purposes of the implementation of the Individuals with Disabilities Education Act (IDEA). The SPP is a six-year plan, which<br />
describes Arkansas's performance on 20 indicators. The Office of Special Education Programs in the U. S. Department of<br />
Education requires that States report annually to the public on the performance of each local education agency (LEA) on 14 of<br />
20 indicators as compared with targets established by the State in the SPP. Arkansas will report indicators 1 through 14 and<br />
20 for each LEA serving children with disabilities (CWD). Any LEA not meeting targets on compliance indicators (0% for<br />
Indicators 4B, 09 & 10 and 100% for Indicators 11, 12, 13, and 20) are non-compliant with IDEA.<br />
There are no report changes for the 2010/11 school year profile; However, it is important to recognize that: .<br />
1. Indicator 01 (Graduation) is reported a year in arrear (2009/10 graduates) and is based on a four-year cohort. This<br />
means the rate is a measure of students who entered in ninth grade and graduate in four years. The calculation is a<br />
requirement under Title I of the Elementary and Secondary Education Act (ESEA).<br />
2. Indicator 02 (Drop out) is reported a year in arrear. This means the rate is a measure of students who dropped out in<br />
the 2009/10 school year. The Indicator 02 data are aligned with the Common Core of Data (CCD) requirements for<br />
grades 7-12.<br />
3. Indicator 04A and 4B (Suspension/Expulsion) is reported a year in arrear. This means the rate is a measure of<br />
students who had out-of-school suspensions and/or expulsions totaling more than 10 days.<br />
For a complete description of all the Indicators, please visit the special education website at<br />
http://arksped.k12.ar.us/sections/policy.html<br />
LEA: 0803 - GREEN FOREST SCHOOL <strong>DISTRICT</strong><br />
Indicator 01: Graduation Rates (2009/10 school year) Indicator 02: Dropout Rates (2009/10 school year)<br />
Percent of youth<br />
with IEPs<br />
graduating from<br />
high school with a<br />
regular diploma<br />
State<br />
Rate<br />
State<br />
Target<br />
75.76% 85.00%<br />
LEA<br />
Rate<br />
75.00%<br />
Target Met<br />
by LEA<br />
(Y/N)<br />
N<br />
Percent of<br />
youth with<br />
IEPs dropping<br />
out of high<br />
school<br />
State<br />
Rate<br />
Indicator 03: Assessment on Statewide Benchmark Exam (grades 3-8, 11)<br />
A) Adequate Yearly Progress<br />
n=40<br />
Literacy<br />
Mathematics<br />
Met Disability Subgroup "n"<br />
for Reporting Purposes (Y/N)<br />
State Target for % of Districts Meeting<br />
AYP for Disability Subgroup<br />
State<br />
Target<br />
3.06% 4.20%<br />
LEA<br />
Rate<br />
1.64%<br />
% of Districts Meeting AYP<br />
for Disability Subgroup<br />
Target Met by<br />
LEA (Y/N)<br />
Y<br />
Target Met by<br />
LEA(Y/N)<br />
Overall N 17.15% 6.25%<br />
NA<br />
N<br />
N<br />
Note: For a district to qualify as having a disability subgroup it must have a minimum of 40 (n=40) students with disabilities in a school building.<br />
B) Participation<br />
Participation Rate: # of<br />
CWD Tested ÷ # of CWD<br />
Enrolled in grades tested.<br />
Participation Rate: Literacy<br />
Participation Rate: Math<br />
Note: - - denotes not applicable<br />
State<br />
Rate<br />
98.78%<br />
State<br />
Target<br />
95.00%<br />
LEA<br />
Rate<br />
100.00%<br />
Target Met<br />
by LEA (Y/N)<br />
98.61% 95.00% 100.00% Y<br />
Y<br />
C) Performance Proficiency<br />
Percent of CWD Scoring<br />
Proficient or Above<br />
Proficiency Rate: Literacy<br />
Proficiency Rate:<br />
Mathematics<br />
16.00%<br />
16.00%<br />
State<br />
Rate<br />
31.49%<br />
44.86%<br />
State<br />
Target<br />
45.22%<br />
51.14%<br />
LEA<br />
Rate<br />
35.19%<br />
44.23%<br />
NA<br />
NA<br />
Target<br />
Met by<br />
LEA (Y/N)<br />
N<br />
N<br />
Page 1 of 5
LEA: 0803 - GREEN FOREST SCHOOL <strong>DISTRICT</strong><br />
Indicator 04: Out-of-School Suspensions and Expulsions (2009/10 school year)<br />
A) Suspension/Expulsion<br />
Percent difference of CWD with out-of- school suspensions and<br />
expulsions totaling greater than 10 days in a school year as<br />
compared to the same data for general education students in<br />
the district.<br />
B) Suspension/Expulsion by Race and Ethnicity<br />
Percent of districts that have: (a) a significant discrepancy, by race or<br />
ethnicity, in the rate of suspensions and expulsions of greater than 10<br />
days in a school year for children with IEPs; and (b) policies,<br />
procedures or practices that contribute to the significant discrepancy<br />
and do not comply with requirements relating to the development<br />
and implementation of IEPs, the use of positive behavioral<br />
interventions and supports, and procedural safeguards.<br />
Indicator 05: School Age (5-21) Least Restrictive Environment<br />
A) In the Regular Class 80% or more of the day<br />
Percent of CWD with<br />
IEPs receiving instruction<br />
in the regular class 80%<br />
or more of the day.<br />
State<br />
Rate<br />
State<br />
Target<br />
LEA<br />
Rate<br />
B) In the Regular Class less than 40% of the day<br />
Percent of CWD with<br />
IEPs receiving instruction<br />
in the regular class less<br />
than 60% of the day.<br />
53.87% 59.77%<br />
State<br />
Rate<br />
State<br />
Target<br />
12.42% 12.51%<br />
52.03%<br />
LEA<br />
Rate<br />
11.38%<br />
C) Other Settings outside the regular class<br />
Percent of CWD with IEPs served in<br />
public or private separate schools,<br />
residential placements, or<br />
homebound/hospital placements.<br />
State<br />
Rate<br />
State<br />
Target<br />
2.80% 2.56%<br />
Target Met<br />
by LEA (Y/N)<br />
N<br />
Target Met<br />
by LEA (Y/N)<br />
Y<br />
LEA<br />
Rate<br />
0.00%<br />
Target Met<br />
by LEA(Y/N)<br />
Indicator 06: Early Childhood (3-5) Least Restrictive Environment<br />
A) Regular Early Childhood Program<br />
Percent of children (aged 3 through 5) with IEPs attending a regular<br />
early childhood program and receiving the majority of special<br />
education and related services in the regular early childhood program<br />
Allowable<br />
Difference<br />
LEA: 0803 - GREEN FOREST SCHOOL <strong>DISTRICT</strong><br />
Indicator 07: Preschool (3-5) Outcomes<br />
a) Percent of preschool CWD<br />
children who did not<br />
improve functioning.<br />
b) Percent of preschool CWD<br />
who improved but whose<br />
functioning remained below<br />
same age peers.<br />
c) Percent of preschool CWD<br />
who improved at a level<br />
nearer to same aged peers.<br />
d) Percent of preschool CWD<br />
who improved functioning to<br />
reach a level comparable to<br />
same age peers.<br />
e) Percent of preschool CWD<br />
children who maintain<br />
functioning at a level<br />
comparable to same aged<br />
peers.<br />
Summary<br />
Statements<br />
1) Of those preschool<br />
children who entered<br />
the preschool program<br />
below age expectations<br />
in each Outcome, the<br />
percent who<br />
substantially increased<br />
their rate of growth by<br />
the time they turned 6<br />
years of age or exited<br />
the program.<br />
2) The percent of<br />
preschool children who<br />
were functioning<br />
within age expectations<br />
in each Outcome by the<br />
time they turned 6<br />
years of age or exited<br />
A) Positive Social -Emotional<br />
Skills*<br />
State<br />
Rate<br />
A) Positive Social -<br />
Emotional Skills<br />
(Including social<br />
relationships)<br />
State<br />
Rate<br />
2.14%<br />
5.31%<br />
25.97%<br />
38.22%<br />
28.36%<br />
State<br />
Target<br />
LEA<br />
Rate<br />
LEA<br />
Rate<br />
— —<br />
— —<br />
— —<br />
— —<br />
— —<br />
Target<br />
Met by<br />
LEA(Y/N)<br />
B) Acquisition and Use of<br />
Knowledge and Skills<br />
(Including early language/<br />
communication and early literacy)<br />
B) Acquisition and Use of<br />
Knowledge and Skills **<br />
State<br />
Rate<br />
1.75%<br />
6.59%<br />
34.23%<br />
43.51%<br />
13.92%<br />
State<br />
Target<br />
LEA<br />
Rate<br />
Target<br />
Met by<br />
LEA(Y/N)<br />
C) Use of Appropriate Behaviors<br />
to Meet Their Needs<br />
State<br />
Rate<br />
State<br />
Target<br />
LEA<br />
Rate<br />
Target<br />
Met by<br />
LEA(Y/N)<br />
89.61% 90.50% — — N/A 90.31% 90.50% — — N/A 90.82% 92.50% — — N/A<br />
66.58% 69.50% — — N/A 57.43% 60.50% — — N/A 76.69% 78.50% — — N/A<br />
NOTE: * Including social relationships ** Including early language/ communication and early literacy<br />
Note: - - denotes not applicable<br />
State<br />
Rate<br />
LEA<br />
Rate<br />
— —<br />
— —<br />
— —<br />
— —<br />
— —<br />
C) Use of<br />
Appropriate<br />
Behaviors to<br />
Meet Their Needs<br />
State<br />
Rate<br />
4.51%<br />
17.34%<br />
41.72%<br />
34.97%<br />
LEA<br />
Rate<br />
1.46% — —<br />
— —<br />
— —<br />
— —<br />
— —<br />
Page 3 of 5
LEA: 0803 - GREEN FOREST SCHOOL <strong>DISTRICT</strong><br />
Indicator 08: Parent Involvement<br />
Percent of surveyed<br />
parents who reported<br />
school facilitated parent<br />
involvement as a means<br />
of improving services<br />
and results for children<br />
with disabilities.<br />
Early Childhood<br />
(3-5)<br />
School Age<br />
(5-21)<br />
State<br />
Rate<br />
90.47%<br />
95.05%<br />
Indicator 09: Disproportionality - Eligibility<br />
Disproportionate representation of racial<br />
and ethnic groups in special education and<br />
related services that is a result of<br />
inappropriate identification (e.g.<br />
monitoring data, review of policies,<br />
practices, and procedures under 618(d),<br />
etc.).<br />
State<br />
Rate<br />
State<br />
Target<br />
88.00%<br />
96.00%<br />
State<br />
Target<br />
0.00% 0.00%<br />
LEA<br />
Rate<br />
85.71%<br />
96.69%<br />
Indicator 10: Disproportionality-Child with a Disability<br />
Disproportionate representation of racial<br />
and ethnic groups in specific disability<br />
categories that is a result of inappropriate<br />
identification (e.g. monitoring data, review<br />
of policies, practices, and procedures under<br />
618(d), etc.).<br />
Indicator 11: Child Find<br />
Percent of children with<br />
parental consent to evaluate<br />
who are evaluated within<br />
the State established timeline<br />
of 60 days.<br />
Overall<br />
(3-21)<br />
Early Childhood<br />
(3-5)<br />
School Age<br />
(5-21)<br />
State<br />
Rate<br />
0.00%<br />
Indicator 12: Early Childhood Transition<br />
Percent of children referred by Part C prior to<br />
age 3, who are found eligible for Part B, and<br />
who have an IEP developed and implemented<br />
by their third birthday.<br />
Note: - - denotes not applicable<br />
State<br />
Rate<br />
99.41%<br />
99.70%<br />
98.97%<br />
State<br />
Rate<br />
State<br />
Target<br />
0.00%<br />
State<br />
Target<br />
100.00%<br />
100.00%<br />
100.00%<br />
State<br />
Target<br />
Target Met by<br />
LEA (Y/N)<br />
Y<br />
Target Met by<br />
LEA (Y/N)<br />
Y<br />
LEA<br />
Rate<br />
100.00%<br />
— —<br />
100.00%<br />
LEA<br />
Rate<br />
Target Met by<br />
LEA (Y/N)<br />
N<br />
Y<br />
Note: The target for Indicator 09 is to have zero percent<br />
(0%) of districts identified as having disproportionate<br />
representation as a result of inappropriate<br />
identification in eligibility.<br />
Note: The target for Indicator 10 is to have zero<br />
percent (0%) of districts identified as having<br />
disproportionate representation as a result of<br />
inappropriate identification in a disability<br />
category.<br />
Target Met by<br />
LEA (Y/N)<br />
N/A<br />
Y<br />
Target Met<br />
by LEA<br />
(Y/N)<br />
99.21% 100.00% - - N/A<br />
Y<br />
Note: * Indicates a zero reponse rate for the<br />
district.<br />
Page 4 of 5
LEA: 0803 - GREEN FOREST SCHOOL <strong>DISTRICT</strong><br />
Indicator 13: Secondary Transition<br />
Percent of youth with disabilities aged 16 and<br />
up with an IEP that includes coordinated,<br />
measurable, annual IEP goals and transition<br />
services that will reasonably enable the student<br />
to meet the post-secondary goals.<br />
Indicator 14: Post-School Outcomes<br />
A. Percent of youth enrolled in higher<br />
education within one year of leaving high<br />
school.<br />
State<br />
Rate<br />
State<br />
Target<br />
Note: Data for this Indicator is from the on-site monitoring of LEAs for the given year.<br />
B. Percent of youth enrolled in higher<br />
education or competitively employed<br />
within one year of leaving high school.<br />
C. Percent of youth enrolled in higher<br />
education or in some other postsecondary<br />
education or training program; or<br />
competitively employed or in some other<br />
employment within one year of leaving<br />
high school.<br />
State<br />
Rate<br />
Indicator 20: Reported Data-Timely and Accurate*<br />
District submitted<br />
required data elements<br />
on or before due dates;<br />
made revisions within<br />
the alloted reveiw<br />
periods.<br />
Accurate and Timely<br />
Data Submission<br />
Overall (3-21)<br />
Early Childhood (3-5)<br />
School Age (5-21)<br />
State<br />
Target<br />
100.00%<br />
100.00%<br />
100.00%<br />
State<br />
Target<br />
LEA<br />
Rate<br />
LEA<br />
Rate<br />
Target Met by<br />
LEA (Y/N)<br />
Target Met<br />
by LEA<br />
(Y/N)<br />
Target Met<br />
by LEA<br />
(Y/N)<br />
*Data reviewed for timely and accurate submissions included all APSCN cycle data except for personnel<br />
Note: - - denotes not applicable<br />
96.19 100.00 — — N/A<br />
14.53<br />
State<br />
Rate<br />
49.42<br />
State<br />
Rate<br />
54.07<br />
13.00<br />
State<br />
Target<br />
49.00<br />
State<br />
Target<br />
60.00<br />
Y<br />
N/A<br />
Y<br />
— —<br />
LEA<br />
Rate<br />
— —<br />
LEA<br />
Rate<br />
— —<br />
N/A<br />
Target Met<br />
by LEA<br />
(Y/N)<br />
N/A<br />
Target Met<br />
by LEA<br />
(Y/N)<br />
N/A<br />
Page 5 of 5
LEA: 0901 - DERMOTT SCHOOL <strong>DISTRICT</strong><br />
<strong>ARKANSAS</strong> <strong>SPECIAL</strong> <strong>EDUCATION</strong><br />
<strong>DISTRICT</strong> <strong>ANNUAL</strong> PERFORMANCE REPORT<br />
2010/11 School Year<br />
Publication Date: March 2012<br />
Each State must have in place a State Performance Plan (SPP) to evaluate the State's efforts to meet the requirements and<br />
purposes of the implementation of the Individuals with Disabilities Education Act (IDEA). The SPP is a six-year plan, which<br />
describes Arkansas's performance on 20 indicators. The Office of Special Education Programs in the U. S. Department of<br />
Education requires that States report annually to the public on the performance of each local education agency (LEA) on 14 of<br />
20 indicators as compared with targets established by the State in the SPP. Arkansas will report indicators 1 through 14 and<br />
20 for each LEA serving children with disabilities (CWD). Any LEA not meeting targets on compliance indicators (0% for<br />
Indicators 4B, 09 & 10 and 100% for Indicators 11, 12, 13, and 20) are non-compliant with IDEA.<br />
There are no report changes for the 2010/11 school year profile; However, it is important to recognize that: .<br />
1. Indicator 01 (Graduation) is reported a year in arrear (2009/10 graduates) and is based on a four-year cohort. This<br />
means the rate is a measure of students who entered in ninth grade and graduate in four years. The calculation is a<br />
requirement under Title I of the Elementary and Secondary Education Act (ESEA).<br />
2. Indicator 02 (Drop out) is reported a year in arrear. This means the rate is a measure of students who dropped out in<br />
the 2009/10 school year. The Indicator 02 data are aligned with the Common Core of Data (CCD) requirements for<br />
grades 7-12.<br />
3. Indicator 04A and 4B (Suspension/Expulsion) is reported a year in arrear. This means the rate is a measure of<br />
students who had out-of-school suspensions and/or expulsions totaling more than 10 days.<br />
Percent of youth<br />
with IEPs<br />
graduating from<br />
high school with a<br />
regular diploma<br />
For a complete description of all the Indicators, please visit the special education website at<br />
http://arksped.k12.ar.us/sections/policy.html<br />
Indicator 01: Graduation Rates (2009/10 school year) Indicator 02: Dropout Rates (2009/10 school year)<br />
State<br />
Rate<br />
State<br />
Target<br />
75.76% 85.00%<br />
LEA<br />
Rate<br />
71.43%<br />
Target Met<br />
by LEA<br />
(Y/N)<br />
N<br />
Percent of<br />
youth with<br />
IEPs dropping<br />
out of high<br />
school<br />
State<br />
Rate<br />
Indicator 03: Assessment on Statewide Benchmark Exam (grades 3-8, 11)<br />
A) Adequate Yearly Progress<br />
n=40<br />
Literacy<br />
Mathematics<br />
Met Disability Subgroup "n"<br />
for Reporting Purposes (Y/N)<br />
State Target for % of Districts Meeting<br />
AYP for Disability Subgroup<br />
State<br />
Target<br />
3.06% 4.20%<br />
LEA<br />
Rate<br />
0.00%<br />
% of Districts Meeting AYP<br />
for Disability Subgroup<br />
Target Met by<br />
LEA (Y/N)<br />
Y<br />
Target Met by<br />
LEA(Y/N)<br />
Overall N 17.15% 6.25%<br />
NA<br />
N<br />
N<br />
Note: For a district to qualify as having a disability subgroup it must have a minimum of 40 (n=40) students with disabilities in a school building.<br />
B) Participation<br />
Participation Rate: # of<br />
CWD Tested ÷ # of CWD<br />
Enrolled in grades tested.<br />
Participation Rate: Literacy<br />
Participation Rate: Math<br />
Note: - - denotes not applicable<br />
State<br />
Rate<br />
98.78%<br />
State<br />
Target<br />
95.00%<br />
LEA<br />
Rate<br />
100.00%<br />
Target Met<br />
by LEA (Y/N)<br />
98.61% 95.00% 100.00% Y<br />
Y<br />
C) Performance Proficiency<br />
Percent of CWD Scoring<br />
Proficient or Above<br />
Proficiency Rate: Literacy<br />
Proficiency Rate:<br />
Mathematics<br />
16.00%<br />
16.00%<br />
State<br />
Rate<br />
31.49%<br />
44.86%<br />
State<br />
Target<br />
45.22%<br />
51.14%<br />
LEA<br />
Rate<br />
21.43%<br />
12.90%<br />
NA<br />
NA<br />
Target<br />
Met by<br />
LEA (Y/N)<br />
N<br />
N<br />
Page 1 of 5
LEA: 0901 - DERMOTT SCHOOL <strong>DISTRICT</strong><br />
Indicator 04: Out-of-School Suspensions and Expulsions (2009/10 school year)<br />
A) Suspension/Expulsion<br />
Percent difference of CWD with out-of- school suspensions and<br />
expulsions totaling greater than 10 days in a school year as<br />
compared to the same data for general education students in<br />
the district.<br />
B) Suspension/Expulsion by Race and Ethnicity<br />
Percent of districts that have: (a) a significant discrepancy, by race or<br />
ethnicity, in the rate of suspensions and expulsions of greater than 10<br />
days in a school year for children with IEPs; and (b) policies,<br />
procedures or practices that contribute to the significant discrepancy<br />
and do not comply with requirements relating to the development<br />
and implementation of IEPs, the use of positive behavioral<br />
interventions and supports, and procedural safeguards.<br />
Indicator 05: School Age (5-21) Least Restrictive Environment<br />
A) In the Regular Class 80% or more of the day<br />
Percent of CWD with<br />
IEPs receiving instruction<br />
in the regular class 80%<br />
or more of the day.<br />
State<br />
Rate<br />
State<br />
Target<br />
LEA<br />
Rate<br />
B) In the Regular Class less than 40% of the day<br />
Percent of CWD with<br />
IEPs receiving instruction<br />
in the regular class less<br />
than 60% of the day.<br />
53.87% 59.77%<br />
State<br />
Rate<br />
State<br />
Target<br />
12.42% 12.51%<br />
62.30%<br />
LEA<br />
Rate<br />
19.67%<br />
C) Other Settings outside the regular class<br />
Percent of CWD with IEPs served in<br />
public or private separate schools,<br />
residential placements, or<br />
homebound/hospital placements.<br />
State<br />
Rate<br />
State<br />
Target<br />
2.80% 2.56%<br />
Target Met<br />
by LEA (Y/N)<br />
Y<br />
Target Met<br />
by LEA (Y/N)<br />
N<br />
LEA<br />
Rate<br />
0.00%<br />
Target Met<br />
by LEA(Y/N)<br />
Indicator 06: Early Childhood (3-5) Least Restrictive Environment<br />
A) Regular Early Childhood Program<br />
Percent of children (aged 3 through 5) with IEPs attending a regular<br />
early childhood program and receiving the majority of special<br />
education and related services in the regular early childhood program<br />
Allowable<br />
Difference<br />
LEA: 0901 - DERMOTT SCHOOL <strong>DISTRICT</strong><br />
Indicator 07: Preschool (3-5) Outcomes<br />
a) Percent of preschool CWD<br />
children who did not<br />
improve functioning.<br />
b) Percent of preschool CWD<br />
who improved but whose<br />
functioning remained below<br />
same age peers.<br />
c) Percent of preschool CWD<br />
who improved at a level<br />
nearer to same aged peers.<br />
d) Percent of preschool CWD<br />
who improved functioning to<br />
reach a level comparable to<br />
same age peers.<br />
e) Percent of preschool CWD<br />
children who maintain<br />
functioning at a level<br />
comparable to same aged<br />
peers.<br />
Summary<br />
Statements<br />
1) Of those preschool<br />
children who entered<br />
the preschool program<br />
below age expectations<br />
in each Outcome, the<br />
percent who<br />
substantially increased<br />
their rate of growth by<br />
the time they turned 6<br />
years of age or exited<br />
the program.<br />
2) The percent of<br />
preschool children who<br />
were functioning<br />
within age expectations<br />
in each Outcome by the<br />
time they turned 6<br />
years of age or exited<br />
A) Positive Social -Emotional<br />
Skills*<br />
State<br />
Rate<br />
A) Positive Social -<br />
Emotional Skills<br />
(Including social<br />
relationships)<br />
State<br />
Rate<br />
2.14%<br />
5.31%<br />
25.97%<br />
38.22%<br />
28.36%<br />
State<br />
Target<br />
LEA<br />
Rate<br />
LEA<br />
Rate<br />
— —<br />
— —<br />
— —<br />
— —<br />
— —<br />
Target<br />
Met by<br />
LEA(Y/N)<br />
B) Acquisition and Use of<br />
Knowledge and Skills<br />
(Including early language/<br />
communication and early literacy)<br />
B) Acquisition and Use of<br />
Knowledge and Skills **<br />
State<br />
Rate<br />
1.75%<br />
6.59%<br />
34.23%<br />
43.51%<br />
13.92%<br />
State<br />
Target<br />
LEA<br />
Rate<br />
Target<br />
Met by<br />
LEA(Y/N)<br />
C) Use of Appropriate Behaviors<br />
to Meet Their Needs<br />
State<br />
Rate<br />
State<br />
Target<br />
LEA<br />
Rate<br />
Target<br />
Met by<br />
LEA(Y/N)<br />
89.61% 90.50% — — N/A 90.31% 90.50% — — N/A 90.82% 92.50% — — N/A<br />
66.58% 69.50% — — N/A 57.43% 60.50% — — N/A 76.69% 78.50% — — N/A<br />
NOTE: * Including social relationships ** Including early language/ communication and early literacy<br />
Note: - - denotes not applicable<br />
State<br />
Rate<br />
LEA<br />
Rate<br />
— —<br />
— —<br />
— —<br />
— —<br />
— —<br />
C) Use of<br />
Appropriate<br />
Behaviors to<br />
Meet Their Needs<br />
State<br />
Rate<br />
4.51%<br />
17.34%<br />
41.72%<br />
34.97%<br />
LEA<br />
Rate<br />
1.46% — —<br />
— —<br />
— —<br />
— —<br />
— —<br />
Page 3 of 5
LEA: 0901 - DERMOTT SCHOOL <strong>DISTRICT</strong><br />
Indicator 08: Parent Involvement<br />
Percent of surveyed<br />
parents who reported<br />
school facilitated parent<br />
involvement as a means<br />
of improving services<br />
and results for children<br />
with disabilities.<br />
Early Childhood<br />
(3-5)<br />
School Age<br />
(5-21)<br />
State<br />
Rate<br />
90.47%<br />
95.05%<br />
Indicator 09: Disproportionality - Eligibility<br />
Disproportionate representation of racial<br />
and ethnic groups in special education and<br />
related services that is a result of<br />
inappropriate identification (e.g.<br />
monitoring data, review of policies,<br />
practices, and procedures under 618(d),<br />
etc.).<br />
State<br />
Rate<br />
State<br />
Target<br />
88.00%<br />
96.00%<br />
State<br />
Target<br />
0.00% 0.00%<br />
LEA<br />
Rate<br />
— —<br />
97.96%<br />
Indicator 10: Disproportionality-Child with a Disability<br />
Disproportionate representation of racial<br />
and ethnic groups in specific disability<br />
categories that is a result of inappropriate<br />
identification (e.g. monitoring data, review<br />
of policies, practices, and procedures under<br />
618(d), etc.).<br />
Indicator 11: Child Find<br />
Percent of children with<br />
parental consent to evaluate<br />
who are evaluated within<br />
the State established timeline<br />
of 60 days.<br />
Overall<br />
(3-21)<br />
Early Childhood<br />
(3-5)<br />
School Age<br />
(5-21)<br />
State<br />
Rate<br />
0.00%<br />
Indicator 12: Early Childhood Transition<br />
Percent of children referred by Part C prior to<br />
age 3, who are found eligible for Part B, and<br />
who have an IEP developed and implemented<br />
by their third birthday.<br />
Note: - - denotes not applicable<br />
State<br />
Rate<br />
99.41%<br />
99.70%<br />
98.97%<br />
State<br />
Rate<br />
State<br />
Target<br />
0.00%<br />
State<br />
Target<br />
100.00%<br />
100.00%<br />
100.00%<br />
State<br />
Target<br />
Target Met by<br />
LEA (Y/N)<br />
Y<br />
Target Met by<br />
LEA (Y/N)<br />
Y<br />
LEA<br />
Rate<br />
— —<br />
— —<br />
— —<br />
LEA<br />
Rate<br />
Target Met by<br />
LEA (Y/N)<br />
N/A<br />
Y<br />
Note: The target for Indicator 09 is to have zero percent<br />
(0%) of districts identified as having disproportionate<br />
representation as a result of inappropriate<br />
identification in eligibility.<br />
Note: The target for Indicator 10 is to have zero<br />
percent (0%) of districts identified as having<br />
disproportionate representation as a result of<br />
inappropriate identification in a disability<br />
category.<br />
Target Met by<br />
LEA (Y/N)<br />
N/A<br />
N/A<br />
N/A<br />
Target Met<br />
by LEA<br />
(Y/N)<br />
99.21% 100.00% - - N/A<br />
Note: * Indicates a zero reponse rate for the<br />
district.<br />
Page 4 of 5
LEA: 0901 - DERMOTT SCHOOL <strong>DISTRICT</strong><br />
Indicator 13: Secondary Transition<br />
Percent of youth with disabilities aged 16 and<br />
up with an IEP that includes coordinated,<br />
measurable, annual IEP goals and transition<br />
services that will reasonably enable the student<br />
to meet the post-secondary goals.<br />
Indicator 14: Post-School Outcomes<br />
A. Percent of youth enrolled in higher<br />
education within one year of leaving high<br />
school.<br />
State<br />
Rate<br />
State<br />
Target<br />
Note: Data for this Indicator is from the on-site monitoring of LEAs for the given year.<br />
B. Percent of youth enrolled in higher<br />
education or competitively employed<br />
within one year of leaving high school.<br />
C. Percent of youth enrolled in higher<br />
education or in some other postsecondary<br />
education or training program; or<br />
competitively employed or in some other<br />
employment within one year of leaving<br />
high school.<br />
State<br />
Rate<br />
Indicator 20: Reported Data-Timely and Accurate*<br />
District submitted<br />
required data elements<br />
on or before due dates;<br />
made revisions within<br />
the alloted reveiw<br />
periods.<br />
Accurate and Timely<br />
Data Submission<br />
Overall (3-21)<br />
Early Childhood (3-5)<br />
School Age (5-21)<br />
State<br />
Target<br />
100.00%<br />
100.00%<br />
100.00%<br />
State<br />
Target<br />
LEA<br />
Rate<br />
LEA<br />
Rate<br />
Target Met by<br />
LEA (Y/N)<br />
Target Met<br />
by LEA<br />
(Y/N)<br />
Target Met<br />
by LEA<br />
(Y/N)<br />
*Data reviewed for timely and accurate submissions included all APSCN cycle data except for personnel<br />
Note: - - denotes not applicable<br />
96.19 100.00 — — N/A<br />
14.53<br />
State<br />
Rate<br />
49.42<br />
State<br />
Rate<br />
54.07<br />
13.00<br />
State<br />
Target<br />
49.00<br />
State<br />
Target<br />
60.00<br />
Y<br />
N/A<br />
Y<br />
— —<br />
LEA<br />
Rate<br />
— —<br />
LEA<br />
Rate<br />
— —<br />
N/A<br />
Target Met<br />
by LEA<br />
(Y/N)<br />
N/A<br />
Target Met<br />
by LEA<br />
(Y/N)<br />
N/A<br />
Page 5 of 5
LEA: 0903 - LAKESIDE SCHOOL <strong>DISTRICT</strong><br />
<strong>ARKANSAS</strong> <strong>SPECIAL</strong> <strong>EDUCATION</strong><br />
<strong>DISTRICT</strong> <strong>ANNUAL</strong> PERFORMANCE REPORT<br />
2010/11 School Year<br />
Publication Date: March 2012<br />
Each State must have in place a State Performance Plan (SPP) to evaluate the State's efforts to meet the requirements and<br />
purposes of the implementation of the Individuals with Disabilities Education Act (IDEA). The SPP is a six-year plan, which<br />
describes Arkansas's performance on 20 indicators. The Office of Special Education Programs in the U. S. Department of<br />
Education requires that States report annually to the public on the performance of each local education agency (LEA) on 14 of<br />
20 indicators as compared with targets established by the State in the SPP. Arkansas will report indicators 1 through 14 and<br />
20 for each LEA serving children with disabilities (CWD). Any LEA not meeting targets on compliance indicators (0% for<br />
Indicators 4B, 09 & 10 and 100% for Indicators 11, 12, 13, and 20) are non-compliant with IDEA.<br />
There are no report changes for the 2010/11 school year profile; However, it is important to recognize that: .<br />
1. Indicator 01 (Graduation) is reported a year in arrear (2009/10 graduates) and is based on a four-year cohort. This<br />
means the rate is a measure of students who entered in ninth grade and graduate in four years. The calculation is a<br />
requirement under Title I of the Elementary and Secondary Education Act (ESEA).<br />
2. Indicator 02 (Drop out) is reported a year in arrear. This means the rate is a measure of students who dropped out in<br />
the 2009/10 school year. The Indicator 02 data are aligned with the Common Core of Data (CCD) requirements for<br />
grades 7-12.<br />
3. Indicator 04A and 4B (Suspension/Expulsion) is reported a year in arrear. This means the rate is a measure of<br />
students who had out-of-school suspensions and/or expulsions totaling more than 10 days.<br />
Percent of youth<br />
with IEPs<br />
graduating from<br />
high school with a<br />
regular diploma<br />
For a complete description of all the Indicators, please visit the special education website at<br />
http://arksped.k12.ar.us/sections/policy.html<br />
Indicator 01: Graduation Rates (2009/10 school year) Indicator 02: Dropout Rates (2009/10 school year)<br />
State<br />
Rate<br />
State<br />
Target<br />
75.76% 85.00%<br />
LEA<br />
Rate<br />
66.67%<br />
Target Met<br />
by LEA<br />
(Y/N)<br />
N<br />
Percent of<br />
youth with<br />
IEPs dropping<br />
out of high<br />
school<br />
State<br />
Rate<br />
Indicator 03: Assessment on Statewide Benchmark Exam (grades 3-8, 11)<br />
A) Adequate Yearly Progress<br />
n=40<br />
Literacy<br />
Mathematics<br />
Met Disability Subgroup "n"<br />
for Reporting Purposes (Y/N)<br />
State Target for % of Districts Meeting<br />
AYP for Disability Subgroup<br />
State<br />
Target<br />
3.06% 4.20%<br />
LEA<br />
Rate<br />
1.75%<br />
% of Districts Meeting AYP<br />
for Disability Subgroup<br />
Target Met by<br />
LEA (Y/N)<br />
Y<br />
Target Met by<br />
LEA(Y/N)<br />
Overall N 17.15% 6.25%<br />
NA<br />
N<br />
N<br />
Note: For a district to qualify as having a disability subgroup it must have a minimum of 40 (n=40) students with disabilities in a school building.<br />
B) Participation<br />
Participation Rate: # of<br />
CWD Tested ÷ # of CWD<br />
Enrolled in grades tested.<br />
Participation Rate: Literacy<br />
Participation Rate: Math<br />
Note: - - denotes not applicable<br />
State<br />
Rate<br />
98.78%<br />
State<br />
Target<br />
95.00%<br />
LEA<br />
Rate<br />
100.00%<br />
Target Met<br />
by LEA (Y/N)<br />
98.61% 95.00% 100.00% Y<br />
Y<br />
C) Performance Proficiency<br />
Percent of CWD Scoring<br />
Proficient or Above<br />
Proficiency Rate: Literacy<br />
Proficiency Rate:<br />
Mathematics<br />
16.00%<br />
16.00%<br />
State<br />
Rate<br />
31.49%<br />
44.86%<br />
State<br />
Target<br />
45.22%<br />
51.14%<br />
LEA<br />
Rate<br />
10.91%<br />
16.39%<br />
NA<br />
NA<br />
Target<br />
Met by<br />
LEA (Y/N)<br />
N<br />
N<br />
Page 1 of 5
LEA: 0903 - LAKESIDE SCHOOL <strong>DISTRICT</strong><br />
Indicator 04: Out-of-School Suspensions and Expulsions (2009/10 school year)<br />
A) Suspension/Expulsion<br />
Percent difference of CWD with out-of- school suspensions and<br />
expulsions totaling greater than 10 days in a school year as<br />
compared to the same data for general education students in<br />
the district.<br />
B) Suspension/Expulsion by Race and Ethnicity<br />
Percent of districts that have: (a) a significant discrepancy, by race or<br />
ethnicity, in the rate of suspensions and expulsions of greater than 10<br />
days in a school year for children with IEPs; and (b) policies,<br />
procedures or practices that contribute to the significant discrepancy<br />
and do not comply with requirements relating to the development<br />
and implementation of IEPs, the use of positive behavioral<br />
interventions and supports, and procedural safeguards.<br />
Indicator 05: School Age (5-21) Least Restrictive Environment<br />
A) In the Regular Class 80% or more of the day<br />
Percent of CWD with<br />
IEPs receiving instruction<br />
in the regular class 80%<br />
or more of the day.<br />
State<br />
Rate<br />
State<br />
Target<br />
LEA<br />
Rate<br />
B) In the Regular Class less than 40% of the day<br />
Percent of CWD with<br />
IEPs receiving instruction<br />
in the regular class less<br />
than 60% of the day.<br />
53.87% 59.77%<br />
State<br />
Rate<br />
State<br />
Target<br />
12.42% 12.51%<br />
65.31%<br />
LEA<br />
Rate<br />
14.29%<br />
C) Other Settings outside the regular class<br />
Percent of CWD with IEPs served in<br />
public or private separate schools,<br />
residential placements, or<br />
homebound/hospital placements.<br />
State<br />
Rate<br />
State<br />
Target<br />
2.80% 2.56%<br />
Target Met<br />
by LEA (Y/N)<br />
Y<br />
Target Met<br />
by LEA (Y/N)<br />
N<br />
LEA<br />
Rate<br />
1.02%<br />
Target Met<br />
by LEA(Y/N)<br />
Indicator 06: Early Childhood (3-5) Least Restrictive Environment<br />
A) Regular Early Childhood Program<br />
Percent of children (aged 3 through 5) with IEPs attending a regular<br />
early childhood program and receiving the majority of special<br />
education and related services in the regular early childhood program<br />
Allowable<br />
Difference<br />
LEA: 0903 - LAKESIDE SCHOOL <strong>DISTRICT</strong><br />
Indicator 07: Preschool (3-5) Outcomes<br />
a) Percent of preschool CWD<br />
children who did not<br />
improve functioning.<br />
b) Percent of preschool CWD<br />
who improved but whose<br />
functioning remained below<br />
same age peers.<br />
c) Percent of preschool CWD<br />
who improved at a level<br />
nearer to same aged peers.<br />
d) Percent of preschool CWD<br />
who improved functioning to<br />
reach a level comparable to<br />
same age peers.<br />
e) Percent of preschool CWD<br />
children who maintain<br />
functioning at a level<br />
comparable to same aged<br />
peers.<br />
Summary<br />
Statements<br />
1) Of those preschool<br />
children who entered<br />
the preschool program<br />
below age expectations<br />
in each Outcome, the<br />
percent who<br />
substantially increased<br />
their rate of growth by<br />
the time they turned 6<br />
years of age or exited<br />
the program.<br />
2) The percent of<br />
preschool children who<br />
were functioning<br />
within age expectations<br />
in each Outcome by the<br />
time they turned 6<br />
years of age or exited<br />
A) Positive Social -Emotional<br />
Skills*<br />
State<br />
Rate<br />
A) Positive Social -<br />
Emotional Skills<br />
(Including social<br />
relationships)<br />
State<br />
Rate<br />
2.14%<br />
5.31%<br />
25.97%<br />
38.22%<br />
28.36%<br />
State<br />
Target<br />
LEA<br />
Rate<br />
LEA<br />
Rate<br />
— —<br />
— —<br />
— —<br />
— —<br />
— —<br />
Target<br />
Met by<br />
LEA(Y/N)<br />
B) Acquisition and Use of<br />
Knowledge and Skills<br />
(Including early language/<br />
communication and early literacy)<br />
B) Acquisition and Use of<br />
Knowledge and Skills **<br />
State<br />
Rate<br />
1.75%<br />
6.59%<br />
34.23%<br />
43.51%<br />
13.92%<br />
State<br />
Target<br />
LEA<br />
Rate<br />
Target<br />
Met by<br />
LEA(Y/N)<br />
C) Use of Appropriate Behaviors<br />
to Meet Their Needs<br />
State<br />
Rate<br />
State<br />
Target<br />
LEA<br />
Rate<br />
Target<br />
Met by<br />
LEA(Y/N)<br />
89.61% 90.50% — — N/A 90.31% 90.50% — — N/A 90.82% 92.50% — — N/A<br />
66.58% 69.50% — — N/A 57.43% 60.50% — — N/A 76.69% 78.50% — — N/A<br />
NOTE: * Including social relationships ** Including early language/ communication and early literacy<br />
Note: - - denotes not applicable<br />
State<br />
Rate<br />
LEA<br />
Rate<br />
— —<br />
— —<br />
— —<br />
— —<br />
— —<br />
C) Use of<br />
Appropriate<br />
Behaviors to<br />
Meet Their Needs<br />
State<br />
Rate<br />
4.51%<br />
17.34%<br />
41.72%<br />
34.97%<br />
LEA<br />
Rate<br />
1.46% — —<br />
— —<br />
— —<br />
— —<br />
— —<br />
Page 3 of 5
LEA: 0903 - LAKESIDE SCHOOL <strong>DISTRICT</strong><br />
Indicator 08: Parent Involvement<br />
Percent of surveyed<br />
parents who reported<br />
school facilitated parent<br />
involvement as a means<br />
of improving services<br />
and results for children<br />
with disabilities.<br />
Early Childhood<br />
(3-5)<br />
School Age<br />
(5-21)<br />
State<br />
Rate<br />
90.47%<br />
95.05%<br />
Indicator 09: Disproportionality - Eligibility<br />
Disproportionate representation of racial<br />
and ethnic groups in special education and<br />
related services that is a result of<br />
inappropriate identification (e.g.<br />
monitoring data, review of policies,<br />
practices, and procedures under 618(d),<br />
etc.).<br />
State<br />
Rate<br />
State<br />
Target<br />
88.00%<br />
96.00%<br />
State<br />
Target<br />
0.00% 0.00%<br />
LEA<br />
Rate<br />
— —<br />
100.00%<br />
Indicator 10: Disproportionality-Child with a Disability<br />
Disproportionate representation of racial<br />
and ethnic groups in specific disability<br />
categories that is a result of inappropriate<br />
identification (e.g. monitoring data, review<br />
of policies, practices, and procedures under<br />
618(d), etc.).<br />
Indicator 11: Child Find<br />
Percent of children with<br />
parental consent to evaluate<br />
who are evaluated within<br />
the State established timeline<br />
of 60 days.<br />
Overall<br />
(3-21)<br />
Early Childhood<br />
(3-5)<br />
School Age<br />
(5-21)<br />
State<br />
Rate<br />
0.00%<br />
Indicator 12: Early Childhood Transition<br />
Percent of children referred by Part C prior to<br />
age 3, who are found eligible for Part B, and<br />
who have an IEP developed and implemented<br />
by their third birthday.<br />
Note: - - denotes not applicable<br />
State<br />
Rate<br />
99.41%<br />
99.70%<br />
98.97%<br />
State<br />
Rate<br />
State<br />
Target<br />
0.00%<br />
State<br />
Target<br />
100.00%<br />
100.00%<br />
100.00%<br />
State<br />
Target<br />
Target Met by<br />
LEA (Y/N)<br />
Y<br />
Target Met by<br />
LEA (Y/N)<br />
Y<br />
LEA<br />
Rate<br />
100.00%<br />
— —<br />
100.00%<br />
LEA<br />
Rate<br />
Target Met by<br />
LEA (Y/N)<br />
N/A<br />
Y<br />
Note: The target for Indicator 09 is to have zero percent<br />
(0%) of districts identified as having disproportionate<br />
representation as a result of inappropriate<br />
identification in eligibility.<br />
Note: The target for Indicator 10 is to have zero<br />
percent (0%) of districts identified as having<br />
disproportionate representation as a result of<br />
inappropriate identification in a disability<br />
category.<br />
Target Met by<br />
LEA (Y/N)<br />
N/A<br />
Y<br />
Target Met<br />
by LEA<br />
(Y/N)<br />
99.21% 100.00% - - N/A<br />
Y<br />
Note: * Indicates a zero reponse rate for the<br />
district.<br />
Page 4 of 5
LEA: 0903 - LAKESIDE SCHOOL <strong>DISTRICT</strong><br />
Indicator 13: Secondary Transition<br />
Percent of youth with disabilities aged 16 and<br />
up with an IEP that includes coordinated,<br />
measurable, annual IEP goals and transition<br />
services that will reasonably enable the student<br />
to meet the post-secondary goals.<br />
Indicator 14: Post-School Outcomes<br />
A. Percent of youth enrolled in higher<br />
education within one year of leaving high<br />
school.<br />
State<br />
Rate<br />
State<br />
Target<br />
Note: Data for this Indicator is from the on-site monitoring of LEAs for the given year.<br />
B. Percent of youth enrolled in higher<br />
education or competitively employed<br />
within one year of leaving high school.<br />
C. Percent of youth enrolled in higher<br />
education or in some other postsecondary<br />
education or training program; or<br />
competitively employed or in some other<br />
employment within one year of leaving<br />
high school.<br />
State<br />
Rate<br />
Indicator 20: Reported Data-Timely and Accurate*<br />
District submitted<br />
required data elements<br />
on or before due dates;<br />
made revisions within<br />
the alloted reveiw<br />
periods.<br />
Accurate and Timely<br />
Data Submission<br />
Overall (3-21)<br />
Early Childhood (3-5)<br />
School Age (5-21)<br />
State<br />
Target<br />
100.00%<br />
100.00%<br />
100.00%<br />
State<br />
Target<br />
LEA<br />
Rate<br />
LEA<br />
Rate<br />
Target Met by<br />
LEA (Y/N)<br />
Target Met<br />
by LEA<br />
(Y/N)<br />
Target Met<br />
by LEA<br />
(Y/N)<br />
*Data reviewed for timely and accurate submissions included all APSCN cycle data except for personnel<br />
Note: - - denotes not applicable<br />
96.19 100.00 — — N/A<br />
14.53<br />
State<br />
Rate<br />
49.42<br />
State<br />
Rate<br />
54.07<br />
13.00<br />
State<br />
Target<br />
49.00<br />
State<br />
Target<br />
60.00<br />
Y<br />
N/A<br />
Y<br />
— —<br />
LEA<br />
Rate<br />
— —<br />
LEA<br />
Rate<br />
— —<br />
N/A<br />
Target Met<br />
by LEA<br />
(Y/N)<br />
N/A<br />
Target Met<br />
by LEA<br />
(Y/N)<br />
N/A<br />
Page 5 of 5
<strong>ARKANSAS</strong> <strong>SPECIAL</strong> <strong>EDUCATION</strong><br />
<strong>DISTRICT</strong> <strong>ANNUAL</strong> PERFORMANCE REPORT<br />
2010/11 School Year<br />
Publication Date: March 2012<br />
Each State must have in place a State Performance Plan (SPP) to evaluate the State's efforts to meet the requirements and<br />
purposes of the implementation of the Individuals with Disabilities Education Act (IDEA). The SPP is a six-year plan, which<br />
describes Arkansas's performance on 20 indicators. The Office of Special Education Programs in the U. S. Department of<br />
Education requires that States report annually to the public on the performance of each local education agency (LEA) on 14 of<br />
20 indicators as compared with targets established by the State in the SPP. Arkansas will report indicators 1 through 14 and<br />
20 for each LEA serving children with disabilities (CWD). Any LEA not meeting targets on compliance indicators (0% for<br />
Indicators 4B, 09 & 10 and 100% for Indicators 11, 12, 13, and 20) are non-compliant with IDEA.<br />
There are no report changes for the 2010/11 school year profile; However, it is important to recognize that: .<br />
1. Indicator 01 (Graduation) is reported a year in arrear (2009/10 graduates) and is based on a four-year cohort. This<br />
means the rate is a measure of students who entered in ninth grade and graduate in four years. The calculation is a<br />
requirement under Title I of the Elementary and Secondary Education Act (ESEA).<br />
2. Indicator 02 (Drop out) is reported a year in arrear. This means the rate is a measure of students who dropped out in<br />
the 2009/10 school year. The Indicator 02 data are aligned with the Common Core of Data (CCD) requirements for<br />
grades 7-12.<br />
3. Indicator 04A and 4B (Suspension/Expulsion) is reported a year in arrear. This means the rate is a measure of<br />
students who had out-of-school suspensions and/or expulsions totaling more than 10 days.<br />
For a complete description of all the Indicators, please visit the special education website at<br />
http://arksped.k12.ar.us/sections/policy.html<br />
LEA: 1002 - ARKADELPHIA SCHOOL <strong>DISTRICT</strong><br />
Indicator 01: Graduation Rates (2009/10 school year) Indicator 02: Dropout Rates (2009/10 school year)<br />
Percent of youth<br />
with IEPs<br />
graduating from<br />
high school with a<br />
regular diploma<br />
State<br />
Rate<br />
State<br />
Target<br />
75.76% 85.00%<br />
LEA<br />
Rate<br />
69.57%<br />
Target Met<br />
by LEA<br />
(Y/N)<br />
N<br />
Percent of<br />
youth with<br />
IEPs dropping<br />
out of high<br />
school<br />
State<br />
Rate<br />
Indicator 03: Assessment on Statewide Benchmark Exam (grades 3-8, 11)<br />
A) Adequate Yearly Progress<br />
n=40<br />
Literacy<br />
Mathematics<br />
Met Disability Subgroup "n"<br />
for Reporting Purposes (Y/N)<br />
State Target for % of Districts Meeting<br />
AYP for Disability Subgroup<br />
State<br />
Target<br />
3.06% 4.20%<br />
LEA<br />
Rate<br />
3.80%<br />
% of Districts Meeting AYP<br />
for Disability Subgroup<br />
Target Met by<br />
LEA (Y/N)<br />
Y<br />
Target Met by<br />
LEA(Y/N)<br />
Overall N 17.15% 6.25%<br />
NA<br />
N<br />
N<br />
Note: For a district to qualify as having a disability subgroup it must have a minimum of 40 (n=40) students with disabilities in a school building.<br />
B) Participation<br />
Participation Rate: # of<br />
CWD Tested ÷ # of CWD<br />
Enrolled in grades tested.<br />
Participation Rate: Literacy<br />
Participation Rate: Math<br />
Note: - - denotes not applicable<br />
State<br />
Rate<br />
98.78%<br />
State<br />
Target<br />
95.00%<br />
LEA<br />
Rate<br />
100.00%<br />
Target Met<br />
by LEA (Y/N)<br />
98.61% 95.00% 100.00% Y<br />
Y<br />
C) Performance Proficiency<br />
Percent of CWD Scoring<br />
Proficient or Above<br />
Proficiency Rate: Literacy<br />
Proficiency Rate:<br />
Mathematics<br />
16.00%<br />
16.00%<br />
State<br />
Rate<br />
31.49%<br />
44.86%<br />
State<br />
Target<br />
45.22%<br />
51.14%<br />
LEA<br />
Rate<br />
25.81%<br />
38.24%<br />
NA<br />
NA<br />
Target<br />
Met by<br />
LEA (Y/N)<br />
N<br />
N<br />
Page 1 of 5
LEA: 1002 - ARKADELPHIA SCHOOL <strong>DISTRICT</strong><br />
Indicator 04: Out-of-School Suspensions and Expulsions (2009/10 school year)<br />
A) Suspension/Expulsion<br />
Percent difference of CWD with out-of- school suspensions and<br />
expulsions totaling greater than 10 days in a school year as<br />
compared to the same data for general education students in<br />
the district.<br />
B) Suspension/Expulsion by Race and Ethnicity<br />
Percent of districts that have: (a) a significant discrepancy, by race or<br />
ethnicity, in the rate of suspensions and expulsions of greater than 10<br />
days in a school year for children with IEPs; and (b) policies,<br />
procedures or practices that contribute to the significant discrepancy<br />
and do not comply with requirements relating to the development<br />
and implementation of IEPs, the use of positive behavioral<br />
interventions and supports, and procedural safeguards.<br />
Indicator 05: School Age (5-21) Least Restrictive Environment<br />
A) In the Regular Class 80% or more of the day<br />
Percent of CWD with<br />
IEPs receiving instruction<br />
in the regular class 80%<br />
or more of the day.<br />
State<br />
Rate<br />
State<br />
Target<br />
LEA<br />
Rate<br />
B) In the Regular Class less than 40% of the day<br />
Percent of CWD with<br />
IEPs receiving instruction<br />
in the regular class less<br />
than 60% of the day.<br />
53.87% 59.77%<br />
State<br />
Rate<br />
State<br />
Target<br />
12.42% 12.51%<br />
48.59%<br />
LEA<br />
Rate<br />
14.12%<br />
C) Other Settings outside the regular class<br />
Percent of CWD with IEPs served in<br />
public or private separate schools,<br />
residential placements, or<br />
homebound/hospital placements.<br />
State<br />
Rate<br />
State<br />
Target<br />
2.80% 2.56%<br />
Target Met<br />
by LEA (Y/N)<br />
N<br />
Target Met<br />
by LEA (Y/N)<br />
N<br />
LEA<br />
Rate<br />
0.00%<br />
Target Met<br />
by LEA(Y/N)<br />
Indicator 06: Early Childhood (3-5) Least Restrictive Environment<br />
A) Regular Early Childhood Program<br />
Percent of children (aged 3 through 5) with IEPs attending a regular<br />
early childhood program and receiving the majority of special<br />
education and related services in the regular early childhood program<br />
Allowable<br />
Difference<br />
LEA: 1002 - ARKADELPHIA SCHOOL <strong>DISTRICT</strong><br />
Indicator 07: Preschool (3-5) Outcomes<br />
a) Percent of preschool CWD<br />
children who did not<br />
improve functioning.<br />
b) Percent of preschool CWD<br />
who improved but whose<br />
functioning remained below<br />
same age peers.<br />
c) Percent of preschool CWD<br />
who improved at a level<br />
nearer to same aged peers.<br />
d) Percent of preschool CWD<br />
who improved functioning to<br />
reach a level comparable to<br />
same age peers.<br />
e) Percent of preschool CWD<br />
children who maintain<br />
functioning at a level<br />
comparable to same aged<br />
peers.<br />
Summary<br />
Statements<br />
1) Of those preschool<br />
children who entered<br />
the preschool program<br />
below age expectations<br />
in each Outcome, the<br />
percent who<br />
substantially increased<br />
their rate of growth by<br />
the time they turned 6<br />
years of age or exited<br />
the program.<br />
2) The percent of<br />
preschool children who<br />
were functioning<br />
within age expectations<br />
in each Outcome by the<br />
time they turned 6<br />
years of age or exited<br />
A) Positive Social -Emotional<br />
Skills*<br />
State<br />
Rate<br />
A) Positive Social -<br />
Emotional Skills<br />
(Including social<br />
relationships)<br />
State<br />
Rate<br />
2.14%<br />
5.31%<br />
25.97%<br />
38.22%<br />
28.36%<br />
State<br />
Target<br />
LEA<br />
Rate<br />
LEA<br />
Rate<br />
— —<br />
— —<br />
— —<br />
— —<br />
— —<br />
Target<br />
Met by<br />
LEA(Y/N)<br />
B) Acquisition and Use of<br />
Knowledge and Skills<br />
(Including early language/<br />
communication and early literacy)<br />
B) Acquisition and Use of<br />
Knowledge and Skills **<br />
State<br />
Rate<br />
1.75%<br />
6.59%<br />
34.23%<br />
43.51%<br />
13.92%<br />
State<br />
Target<br />
LEA<br />
Rate<br />
Target<br />
Met by<br />
LEA(Y/N)<br />
C) Use of Appropriate Behaviors<br />
to Meet Their Needs<br />
State<br />
Rate<br />
State<br />
Target<br />
LEA<br />
Rate<br />
Target<br />
Met by<br />
LEA(Y/N)<br />
89.61% 90.50% — — N/A 90.31% 90.50% — — N/A 90.82% 92.50% — — N/A<br />
66.58% 69.50% — — N/A 57.43% 60.50% — — N/A 76.69% 78.50% — — N/A<br />
NOTE: * Including social relationships ** Including early language/ communication and early literacy<br />
Note: - - denotes not applicable<br />
State<br />
Rate<br />
LEA<br />
Rate<br />
— —<br />
— —<br />
— —<br />
— —<br />
— —<br />
C) Use of<br />
Appropriate<br />
Behaviors to<br />
Meet Their Needs<br />
State<br />
Rate<br />
4.51%<br />
17.34%<br />
41.72%<br />
34.97%<br />
LEA<br />
Rate<br />
1.46% — —<br />
— —<br />
— —<br />
— —<br />
— —<br />
Page 3 of 5
LEA: 1002 - ARKADELPHIA SCHOOL <strong>DISTRICT</strong><br />
Indicator 08: Parent Involvement<br />
Percent of surveyed<br />
parents who reported<br />
school facilitated parent<br />
involvement as a means<br />
of improving services<br />
and results for children<br />
with disabilities.<br />
Early Childhood<br />
(3-5)<br />
School Age<br />
(5-21)<br />
State<br />
Rate<br />
90.47%<br />
95.05%<br />
Indicator 09: Disproportionality - Eligibility<br />
Disproportionate representation of racial<br />
and ethnic groups in special education and<br />
related services that is a result of<br />
inappropriate identification (e.g.<br />
monitoring data, review of policies,<br />
practices, and procedures under 618(d),<br />
etc.).<br />
State<br />
Rate<br />
State<br />
Target<br />
88.00%<br />
96.00%<br />
State<br />
Target<br />
0.00% 0.00%<br />
LEA<br />
Rate<br />
— —<br />
89.83%<br />
Indicator 10: Disproportionality-Child with a Disability<br />
Disproportionate representation of racial<br />
and ethnic groups in specific disability<br />
categories that is a result of inappropriate<br />
identification (e.g. monitoring data, review<br />
of policies, practices, and procedures under<br />
618(d), etc.).<br />
Indicator 11: Child Find<br />
Percent of children with<br />
parental consent to evaluate<br />
who are evaluated within<br />
the State established timeline<br />
of 60 days.<br />
Overall<br />
(3-21)<br />
Early Childhood<br />
(3-5)<br />
School Age<br />
(5-21)<br />
State<br />
Rate<br />
0.00%<br />
Indicator 12: Early Childhood Transition<br />
Percent of children referred by Part C prior to<br />
age 3, who are found eligible for Part B, and<br />
who have an IEP developed and implemented<br />
by their third birthday.<br />
Note: - - denotes not applicable<br />
State<br />
Rate<br />
99.41%<br />
99.70%<br />
98.97%<br />
State<br />
Rate<br />
State<br />
Target<br />
0.00%<br />
State<br />
Target<br />
100.00%<br />
100.00%<br />
100.00%<br />
State<br />
Target<br />
Target Met by<br />
LEA (Y/N)<br />
Y<br />
Target Met by<br />
LEA (Y/N)<br />
Y<br />
LEA<br />
Rate<br />
100.00%<br />
— —<br />
100.00%<br />
LEA<br />
Rate<br />
Target Met by<br />
LEA (Y/N)<br />
N/A<br />
N<br />
Note: The target for Indicator 09 is to have zero percent<br />
(0%) of districts identified as having disproportionate<br />
representation as a result of inappropriate<br />
identification in eligibility.<br />
Note: The target for Indicator 10 is to have zero<br />
percent (0%) of districts identified as having<br />
disproportionate representation as a result of<br />
inappropriate identification in a disability<br />
category.<br />
Target Met by<br />
LEA (Y/N)<br />
N/A<br />
Y<br />
Target Met<br />
by LEA<br />
(Y/N)<br />
99.21% 100.00% - - N/A<br />
Y<br />
Note: * Indicates a zero reponse rate for the<br />
district.<br />
Page 4 of 5
LEA: 1002 - ARKADELPHIA SCHOOL <strong>DISTRICT</strong><br />
Indicator 13: Secondary Transition<br />
Percent of youth with disabilities aged 16 and<br />
up with an IEP that includes coordinated,<br />
measurable, annual IEP goals and transition<br />
services that will reasonably enable the student<br />
to meet the post-secondary goals.<br />
Indicator 14: Post-School Outcomes<br />
A. Percent of youth enrolled in higher<br />
education within one year of leaving high<br />
school.<br />
State<br />
Rate<br />
State<br />
Target<br />
Note: Data for this Indicator is from the on-site monitoring of LEAs for the given year.<br />
B. Percent of youth enrolled in higher<br />
education or competitively employed<br />
within one year of leaving high school.<br />
C. Percent of youth enrolled in higher<br />
education or in some other postsecondary<br />
education or training program; or<br />
competitively employed or in some other<br />
employment within one year of leaving<br />
high school.<br />
State<br />
Rate<br />
Indicator 20: Reported Data-Timely and Accurate*<br />
District submitted<br />
required data elements<br />
on or before due dates;<br />
made revisions within<br />
the alloted reveiw<br />
periods.<br />
Accurate and Timely<br />
Data Submission<br />
Overall (3-21)<br />
Early Childhood (3-5)<br />
School Age (5-21)<br />
State<br />
Target<br />
100.00%<br />
100.00%<br />
100.00%<br />
State<br />
Target<br />
LEA<br />
Rate<br />
LEA<br />
Rate<br />
Target Met by<br />
LEA (Y/N)<br />
Target Met<br />
by LEA<br />
(Y/N)<br />
Target Met<br />
by LEA<br />
(Y/N)<br />
*Data reviewed for timely and accurate submissions included all APSCN cycle data except for personnel<br />
Note: - - denotes not applicable<br />
96.19 100.00 100.00% Y<br />
14.53<br />
State<br />
Rate<br />
49.42<br />
State<br />
Rate<br />
54.07<br />
13.00<br />
State<br />
Target<br />
49.00<br />
State<br />
Target<br />
60.00<br />
Y<br />
N/A<br />
Y<br />
— —<br />
LEA<br />
Rate<br />
— —<br />
LEA<br />
Rate<br />
— —<br />
N/A<br />
Target Met<br />
by LEA<br />
(Y/N)<br />
N/A<br />
Target Met<br />
by LEA<br />
(Y/N)<br />
N/A<br />
Page 5 of 5
LEA: 1003 - GURDON SCHOOL <strong>DISTRICT</strong><br />
<strong>ARKANSAS</strong> <strong>SPECIAL</strong> <strong>EDUCATION</strong><br />
<strong>DISTRICT</strong> <strong>ANNUAL</strong> PERFORMANCE REPORT<br />
2010/11 School Year<br />
Publication Date: March 2012<br />
Each State must have in place a State Performance Plan (SPP) to evaluate the State's efforts to meet the requirements and<br />
purposes of the implementation of the Individuals with Disabilities Education Act (IDEA). The SPP is a six-year plan, which<br />
describes Arkansas's performance on 20 indicators. The Office of Special Education Programs in the U. S. Department of<br />
Education requires that States report annually to the public on the performance of each local education agency (LEA) on 14 of<br />
20 indicators as compared with targets established by the State in the SPP. Arkansas will report indicators 1 through 14 and<br />
20 for each LEA serving children with disabilities (CWD). Any LEA not meeting targets on compliance indicators (0% for<br />
Indicators 4B, 09 & 10 and 100% for Indicators 11, 12, 13, and 20) are non-compliant with IDEA.<br />
There are no report changes for the 2010/11 school year profile; However, it is important to recognize that: .<br />
1. Indicator 01 (Graduation) is reported a year in arrear (2009/10 graduates) and is based on a four-year cohort. This<br />
means the rate is a measure of students who entered in ninth grade and graduate in four years. The calculation is a<br />
requirement under Title I of the Elementary and Secondary Education Act (ESEA).<br />
2. Indicator 02 (Drop out) is reported a year in arrear. This means the rate is a measure of students who dropped out in<br />
the 2009/10 school year. The Indicator 02 data are aligned with the Common Core of Data (CCD) requirements for<br />
grades 7-12.<br />
3. Indicator 04A and 4B (Suspension/Expulsion) is reported a year in arrear. This means the rate is a measure of<br />
students who had out-of-school suspensions and/or expulsions totaling more than 10 days.<br />
Percent of youth<br />
with IEPs<br />
graduating from<br />
high school with a<br />
regular diploma<br />
For a complete description of all the Indicators, please visit the special education website at<br />
http://arksped.k12.ar.us/sections/policy.html<br />
Indicator 01: Graduation Rates (2009/10 school year) Indicator 02: Dropout Rates (2009/10 school year)<br />
State<br />
Rate<br />
State<br />
Target<br />
75.76% 85.00%<br />
LEA<br />
Rate<br />
57.14%<br />
Target Met<br />
by LEA<br />
(Y/N)<br />
N<br />
Percent of<br />
youth with<br />
IEPs dropping<br />
out of high<br />
school<br />
State<br />
Rate<br />
Indicator 03: Assessment on Statewide Benchmark Exam (grades 3-8, 11)<br />
A) Adequate Yearly Progress<br />
n=40<br />
Literacy<br />
Mathematics<br />
Met Disability Subgroup "n"<br />
for Reporting Purposes (Y/N)<br />
State Target for % of Districts Meeting<br />
AYP for Disability Subgroup<br />
State<br />
Target<br />
3.06% 4.20%<br />
LEA<br />
Rate<br />
8.16%<br />
% of Districts Meeting AYP<br />
for Disability Subgroup<br />
Target Met by<br />
LEA (Y/N)<br />
N<br />
Target Met by<br />
LEA(Y/N)<br />
Overall N 17.15% 6.25%<br />
NA<br />
N<br />
N<br />
Note: For a district to qualify as having a disability subgroup it must have a minimum of 40 (n=40) students with disabilities in a school building.<br />
B) Participation<br />
Participation Rate: # of<br />
CWD Tested ÷ # of CWD<br />
Enrolled in grades tested.<br />
Participation Rate: Literacy<br />
Participation Rate: Math<br />
Note: - - denotes not applicable<br />
State<br />
Rate<br />
98.78%<br />
State<br />
Target<br />
95.00%<br />
LEA<br />
Rate<br />
100.00%<br />
Target Met<br />
by LEA (Y/N)<br />
98.61% 95.00% 100.00% Y<br />
Y<br />
C) Performance Proficiency<br />
Percent of CWD Scoring<br />
Proficient or Above<br />
Proficiency Rate: Literacy<br />
Proficiency Rate:<br />
Mathematics<br />
16.00%<br />
16.00%<br />
State<br />
Rate<br />
31.49%<br />
44.86%<br />
State<br />
Target<br />
45.22%<br />
51.14%<br />
LEA<br />
Rate<br />
36.36%<br />
45.24%<br />
NA<br />
NA<br />
Target<br />
Met by<br />
LEA (Y/N)<br />
N<br />
N<br />
Page 1 of 5
LEA: 1003 - GURDON SCHOOL <strong>DISTRICT</strong><br />
Indicator 04: Out-of-School Suspensions and Expulsions (2009/10 school year)<br />
A) Suspension/Expulsion<br />
Percent difference of CWD with out-of- school suspensions and<br />
expulsions totaling greater than 10 days in a school year as<br />
compared to the same data for general education students in<br />
the district.<br />
B) Suspension/Expulsion by Race and Ethnicity<br />
Percent of districts that have: (a) a significant discrepancy, by race or<br />
ethnicity, in the rate of suspensions and expulsions of greater than 10<br />
days in a school year for children with IEPs; and (b) policies,<br />
procedures or practices that contribute to the significant discrepancy<br />
and do not comply with requirements relating to the development<br />
and implementation of IEPs, the use of positive behavioral<br />
interventions and supports, and procedural safeguards.<br />
Indicator 05: School Age (5-21) Least Restrictive Environment<br />
A) In the Regular Class 80% or more of the day<br />
Percent of CWD with<br />
IEPs receiving instruction<br />
in the regular class 80%<br />
or more of the day.<br />
State<br />
Rate<br />
State<br />
Target<br />
LEA<br />
Rate<br />
B) In the Regular Class less than 40% of the day<br />
Percent of CWD with<br />
IEPs receiving instruction<br />
in the regular class less<br />
than 60% of the day.<br />
53.87% 59.77%<br />
State<br />
Rate<br />
State<br />
Target<br />
12.42% 12.51%<br />
81.48%<br />
LEA<br />
Rate<br />
3.70%<br />
C) Other Settings outside the regular class<br />
Percent of CWD with IEPs served in<br />
public or private separate schools,<br />
residential placements, or<br />
homebound/hospital placements.<br />
State<br />
Rate<br />
State<br />
Target<br />
2.80% 2.56%<br />
Target Met<br />
by LEA (Y/N)<br />
Y<br />
Target Met<br />
by LEA (Y/N)<br />
Y<br />
LEA<br />
Rate<br />
1.23%<br />
Target Met<br />
by LEA(Y/N)<br />
Indicator 06: Early Childhood (3-5) Least Restrictive Environment<br />
A) Regular Early Childhood Program<br />
Percent of children (aged 3 through 5) with IEPs attending a regular<br />
early childhood program and receiving the majority of special<br />
education and related services in the regular early childhood program<br />
Allowable<br />
Difference<br />
LEA: 1003 - GURDON SCHOOL <strong>DISTRICT</strong><br />
Indicator 07: Preschool (3-5) Outcomes<br />
a) Percent of preschool CWD<br />
children who did not<br />
improve functioning.<br />
b) Percent of preschool CWD<br />
who improved but whose<br />
functioning remained below<br />
same age peers.<br />
c) Percent of preschool CWD<br />
who improved at a level<br />
nearer to same aged peers.<br />
d) Percent of preschool CWD<br />
who improved functioning to<br />
reach a level comparable to<br />
same age peers.<br />
e) Percent of preschool CWD<br />
children who maintain<br />
functioning at a level<br />
comparable to same aged<br />
peers.<br />
Summary<br />
Statements<br />
1) Of those preschool<br />
children who entered<br />
the preschool program<br />
below age expectations<br />
in each Outcome, the<br />
percent who<br />
substantially increased<br />
their rate of growth by<br />
the time they turned 6<br />
years of age or exited<br />
the program.<br />
2) The percent of<br />
preschool children who<br />
were functioning<br />
within age expectations<br />
in each Outcome by the<br />
time they turned 6<br />
years of age or exited<br />
A) Positive Social -Emotional<br />
Skills*<br />
State<br />
Rate<br />
A) Positive Social -<br />
Emotional Skills<br />
(Including social<br />
relationships)<br />
State<br />
Rate<br />
2.14%<br />
5.31%<br />
25.97%<br />
38.22%<br />
28.36%<br />
State<br />
Target<br />
LEA<br />
Rate<br />
LEA<br />
Rate<br />
— —<br />
— —<br />
— —<br />
— —<br />
— —<br />
Target<br />
Met by<br />
LEA(Y/N)<br />
B) Acquisition and Use of<br />
Knowledge and Skills<br />
(Including early language/<br />
communication and early literacy)<br />
B) Acquisition and Use of<br />
Knowledge and Skills **<br />
State<br />
Rate<br />
1.75%<br />
6.59%<br />
34.23%<br />
43.51%<br />
13.92%<br />
State<br />
Target<br />
LEA<br />
Rate<br />
Target<br />
Met by<br />
LEA(Y/N)<br />
C) Use of Appropriate Behaviors<br />
to Meet Their Needs<br />
State<br />
Rate<br />
State<br />
Target<br />
LEA<br />
Rate<br />
Target<br />
Met by<br />
LEA(Y/N)<br />
89.61% 90.50% — — N/A 90.31% 90.50% — — N/A 90.82% 92.50% — — N/A<br />
66.58% 69.50% — — N/A 57.43% 60.50% — — N/A 76.69% 78.50% — — N/A<br />
NOTE: * Including social relationships ** Including early language/ communication and early literacy<br />
Note: - - denotes not applicable<br />
State<br />
Rate<br />
LEA<br />
Rate<br />
— —<br />
— —<br />
— —<br />
— —<br />
— —<br />
C) Use of<br />
Appropriate<br />
Behaviors to<br />
Meet Their Needs<br />
State<br />
Rate<br />
4.51%<br />
17.34%<br />
41.72%<br />
34.97%<br />
LEA<br />
Rate<br />
1.46% — —<br />
— —<br />
— —<br />
— —<br />
— —<br />
Page 3 of 5
LEA: 1003 - GURDON SCHOOL <strong>DISTRICT</strong><br />
Indicator 08: Parent Involvement<br />
Percent of surveyed<br />
parents who reported<br />
school facilitated parent<br />
involvement as a means<br />
of improving services<br />
and results for children<br />
with disabilities.<br />
Early Childhood<br />
(3-5)<br />
School Age<br />
(5-21)<br />
State<br />
Rate<br />
90.47%<br />
95.05%<br />
Indicator 09: Disproportionality - Eligibility<br />
Disproportionate representation of racial<br />
and ethnic groups in special education and<br />
related services that is a result of<br />
inappropriate identification (e.g.<br />
monitoring data, review of policies,<br />
practices, and procedures under 618(d),<br />
etc.).<br />
State<br />
Rate<br />
State<br />
Target<br />
88.00%<br />
96.00%<br />
State<br />
Target<br />
0.00% 0.00%<br />
LEA<br />
Rate<br />
— —<br />
100.00%<br />
Indicator 10: Disproportionality-Child with a Disability<br />
Disproportionate representation of racial<br />
and ethnic groups in specific disability<br />
categories that is a result of inappropriate<br />
identification (e.g. monitoring data, review<br />
of policies, practices, and procedures under<br />
618(d), etc.).<br />
Indicator 11: Child Find<br />
Percent of children with<br />
parental consent to evaluate<br />
who are evaluated within<br />
the State established timeline<br />
of 60 days.<br />
Overall<br />
(3-21)<br />
Early Childhood<br />
(3-5)<br />
School Age<br />
(5-21)<br />
State<br />
Rate<br />
0.00%<br />
Indicator 12: Early Childhood Transition<br />
Percent of children referred by Part C prior to<br />
age 3, who are found eligible for Part B, and<br />
who have an IEP developed and implemented<br />
by their third birthday.<br />
Note: - - denotes not applicable<br />
State<br />
Rate<br />
99.41%<br />
99.70%<br />
98.97%<br />
State<br />
Rate<br />
State<br />
Target<br />
0.00%<br />
State<br />
Target<br />
100.00%<br />
100.00%<br />
100.00%<br />
State<br />
Target<br />
Target Met by<br />
LEA (Y/N)<br />
Y<br />
Target Met by<br />
LEA (Y/N)<br />
Y<br />
LEA<br />
Rate<br />
100.00%<br />
— —<br />
100.00%<br />
LEA<br />
Rate<br />
Target Met by<br />
LEA (Y/N)<br />
N/A<br />
Y<br />
Note: The target for Indicator 09 is to have zero percent<br />
(0%) of districts identified as having disproportionate<br />
representation as a result of inappropriate<br />
identification in eligibility.<br />
Note: The target for Indicator 10 is to have zero<br />
percent (0%) of districts identified as having<br />
disproportionate representation as a result of<br />
inappropriate identification in a disability<br />
category.<br />
Target Met by<br />
LEA (Y/N)<br />
N/A<br />
Y<br />
Target Met<br />
by LEA<br />
(Y/N)<br />
99.21% 100.00% - - N/A<br />
Y<br />
Note: * Indicates a zero reponse rate for the<br />
district.<br />
Page 4 of 5
LEA: 1003 - GURDON SCHOOL <strong>DISTRICT</strong><br />
Indicator 13: Secondary Transition<br />
Percent of youth with disabilities aged 16 and<br />
up with an IEP that includes coordinated,<br />
measurable, annual IEP goals and transition<br />
services that will reasonably enable the student<br />
to meet the post-secondary goals.<br />
Indicator 14: Post-School Outcomes<br />
A. Percent of youth enrolled in higher<br />
education within one year of leaving high<br />
school.<br />
State<br />
Rate<br />
State<br />
Target<br />
Note: Data for this Indicator is from the on-site monitoring of LEAs for the given year.<br />
B. Percent of youth enrolled in higher<br />
education or competitively employed<br />
within one year of leaving high school.<br />
C. Percent of youth enrolled in higher<br />
education or in some other postsecondary<br />
education or training program; or<br />
competitively employed or in some other<br />
employment within one year of leaving<br />
high school.<br />
State<br />
Rate<br />
Indicator 20: Reported Data-Timely and Accurate*<br />
District submitted<br />
required data elements<br />
on or before due dates;<br />
made revisions within<br />
the alloted reveiw<br />
periods.<br />
Accurate and Timely<br />
Data Submission<br />
Overall (3-21)<br />
Early Childhood (3-5)<br />
School Age (5-21)<br />
State<br />
Target<br />
100.00%<br />
100.00%<br />
100.00%<br />
State<br />
Target<br />
LEA<br />
Rate<br />
LEA<br />
Rate<br />
Target Met by<br />
LEA (Y/N)<br />
Target Met<br />
by LEA<br />
(Y/N)<br />
Target Met<br />
by LEA<br />
(Y/N)<br />
*Data reviewed for timely and accurate submissions included all APSCN cycle data except for personnel<br />
Note: - - denotes not applicable<br />
96.19 100.00 — — N/A<br />
14.53<br />
State<br />
Rate<br />
49.42<br />
State<br />
Rate<br />
54.07<br />
13.00<br />
State<br />
Target<br />
49.00<br />
State<br />
Target<br />
60.00<br />
Y<br />
N/A<br />
Y<br />
— —<br />
LEA<br />
Rate<br />
— —<br />
LEA<br />
Rate<br />
— —<br />
N/A<br />
Target Met<br />
by LEA<br />
(Y/N)<br />
N/A<br />
Target Met<br />
by LEA<br />
(Y/N)<br />
N/A<br />
Page 5 of 5
<strong>ARKANSAS</strong> <strong>SPECIAL</strong> <strong>EDUCATION</strong><br />
<strong>DISTRICT</strong> <strong>ANNUAL</strong> PERFORMANCE REPORT<br />
2010/11 School Year<br />
Publication Date: March 2012<br />
Each State must have in place a State Performance Plan (SPP) to evaluate the State's efforts to meet the requirements and<br />
purposes of the implementation of the Individuals with Disabilities Education Act (IDEA). The SPP is a six-year plan, which<br />
describes Arkansas's performance on 20 indicators. The Office of Special Education Programs in the U. S. Department of<br />
Education requires that States report annually to the public on the performance of each local education agency (LEA) on 14 of<br />
20 indicators as compared with targets established by the State in the SPP. Arkansas will report indicators 1 through 14 and<br />
20 for each LEA serving children with disabilities (CWD). Any LEA not meeting targets on compliance indicators (0% for<br />
Indicators 4B, 09 & 10 and 100% for Indicators 11, 12, 13, and 20) are non-compliant with IDEA.<br />
There are no report changes for the 2010/11 school year profile; However, it is important to recognize that: .<br />
1. Indicator 01 (Graduation) is reported a year in arrear (2009/10 graduates) and is based on a four-year cohort. This<br />
means the rate is a measure of students who entered in ninth grade and graduate in four years. The calculation is a<br />
requirement under Title I of the Elementary and Secondary Education Act (ESEA).<br />
2. Indicator 02 (Drop out) is reported a year in arrear. This means the rate is a measure of students who dropped out in<br />
the 2009/10 school year. The Indicator 02 data are aligned with the Common Core of Data (CCD) requirements for<br />
grades 7-12.<br />
3. Indicator 04A and 4B (Suspension/Expulsion) is reported a year in arrear. This means the rate is a measure of<br />
students who had out-of-school suspensions and/or expulsions totaling more than 10 days.<br />
For a complete description of all the Indicators, please visit the special education website at<br />
http://arksped.k12.ar.us/sections/policy.html<br />
LEA: 1020 - DAWSON <strong>EDUCATION</strong> SERVICE CO-OP<br />
Indicator 01: Graduation Rates (2009/10 school year) Indicator 02: Dropout Rates (2009/10 school year)<br />
Percent of youth<br />
with IEPs<br />
graduating from<br />
high school with a<br />
regular diploma<br />
State<br />
Rate<br />
State<br />
Target<br />
75.76% 85.00%<br />
LEA<br />
Rate<br />
— —<br />
Target Met<br />
by LEA<br />
(Y/N)<br />
NA<br />
Percent of<br />
youth with<br />
IEPs dropping<br />
out of high<br />
school<br />
State<br />
Rate<br />
Indicator 03: Assessment on Statewide Benchmark Exam (grades 3-8, 11)<br />
A) Adequate Yearly Progress<br />
n=40<br />
Literacy<br />
Mathematics<br />
Met Disability Subgroup "n"<br />
for Reporting Purposes (Y/N)<br />
State Target for % of Districts Meeting<br />
AYP for Disability Subgroup<br />
State<br />
Target<br />
3.06% 4.20%<br />
LEA<br />
Rate<br />
— —<br />
% of Districts Meeting AYP<br />
for Disability Subgroup<br />
Target Met by<br />
LEA (Y/N)<br />
N/A<br />
Target Met by<br />
LEA(Y/N)<br />
Overall N/A 17.15% 6.25%<br />
N/A<br />
N/A<br />
N/A<br />
Note: For a district to qualify as having a disability subgroup it must have a minimum of 40 (n=40) students with disabilities in a school building.<br />
B) Participation<br />
Participation Rate: # of<br />
CWD Tested ÷ # of CWD<br />
Enrolled in grades tested.<br />
Participation Rate: Literacy<br />
Participation Rate: Math<br />
Note: - - denotes not applicable<br />
State<br />
Rate<br />
98.78%<br />
State<br />
Target<br />
95.00%<br />
LEA<br />
Rate<br />
— —<br />
Target Met<br />
by LEA (Y/N)<br />
N/A<br />
98.61% 95.00% — — N/A<br />
C) Performance Proficiency<br />
Percent of CWD Scoring<br />
Proficient or Above<br />
Proficiency Rate: Literacy<br />
Proficiency Rate:<br />
Mathematics<br />
16.00%<br />
16.00%<br />
State<br />
Rate<br />
31.49%<br />
44.86%<br />
State<br />
Target<br />
45.22%<br />
51.14%<br />
LEA<br />
Rate<br />
— —<br />
— —<br />
N/A<br />
N/A<br />
Target<br />
Met by<br />
LEA (Y/N)<br />
N/A<br />
N/A<br />
Page 1 of 5
LEA: 1020 - DAWSON <strong>EDUCATION</strong> SERVICE CO-OP<br />
Indicator 04: Out-of-School Suspensions and Expulsions (2009/10 school year)<br />
A) Suspension/Expulsion<br />
Percent difference of CWD with out-of- school suspensions and<br />
expulsions totaling greater than 10 days in a school year as<br />
compared to the same data for general education students in<br />
the district.<br />
B) Suspension/Expulsion by Race and Ethnicity<br />
Percent of districts that have: (a) a significant discrepancy, by race or<br />
ethnicity, in the rate of suspensions and expulsions of greater than 10<br />
days in a school year for children with IEPs; and (b) policies,<br />
procedures or practices that contribute to the significant discrepancy<br />
and do not comply with requirements relating to the development<br />
and implementation of IEPs, the use of positive behavioral<br />
interventions and supports, and procedural safeguards.<br />
Indicator 05: School Age (5-21) Least Restrictive Environment<br />
A) In the Regular Class 80% or more of the day<br />
Percent of CWD with<br />
IEPs receiving instruction<br />
in the regular class 80%<br />
or more of the day.<br />
State<br />
Rate<br />
State<br />
Target<br />
LEA<br />
Rate<br />
B) In the Regular Class less than 40% of the day<br />
Percent of CWD with<br />
IEPs receiving instruction<br />
in the regular class less<br />
than 60% of the day.<br />
53.87% 59.77%<br />
State<br />
Rate<br />
State<br />
Target<br />
12.42% 12.51%<br />
— —<br />
LEA<br />
Rate<br />
— —<br />
C) Other Settings outside the regular class<br />
Percent of CWD with IEPs served in<br />
public or private separate schools,<br />
residential placements, or<br />
homebound/hospital placements.<br />
State<br />
Rate<br />
State<br />
Target<br />
2.80% 2.56%<br />
Target Met<br />
by LEA (Y/N)<br />
N/A<br />
Target Met<br />
by LEA (Y/N)<br />
N/A<br />
LEA<br />
Rate<br />
— —<br />
Target Met<br />
by LEA(Y/N)<br />
N/A<br />
Indicator 06: Early Childhood (3-5) Least Restrictive Environment<br />
A) Regular Early Childhood Program<br />
Percent of children (aged 3 through 5) with IEPs attending a regular<br />
early childhood program and receiving the majority of special<br />
education and related services in the regular early childhood program<br />
Allowable<br />
Difference<br />
LEA: 1020 - DAWSON <strong>EDUCATION</strong> SERVICE CO-OP<br />
Indicator 07: Preschool (3-5) Outcomes<br />
a) Percent of preschool CWD<br />
children who did not<br />
improve functioning.<br />
b) Percent of preschool CWD<br />
who improved but whose<br />
functioning remained below<br />
same age peers.<br />
c) Percent of preschool CWD<br />
who improved at a level<br />
nearer to same aged peers.<br />
d) Percent of preschool CWD<br />
who improved functioning to<br />
reach a level comparable to<br />
same age peers.<br />
e) Percent of preschool CWD<br />
children who maintain<br />
functioning at a level<br />
comparable to same aged<br />
peers.<br />
Summary<br />
Statements<br />
1) Of those preschool<br />
children who entered<br />
the preschool program<br />
below age expectations<br />
in each Outcome, the<br />
percent who<br />
substantially increased<br />
their rate of growth by<br />
the time they turned 6<br />
years of age or exited<br />
the program.<br />
2) The percent of<br />
preschool children who<br />
were functioning<br />
within age expectations<br />
in each Outcome by the<br />
time they turned 6<br />
years of age or exited<br />
A) Positive Social -Emotional<br />
Skills*<br />
State<br />
Rate<br />
A) Positive Social -<br />
Emotional Skills<br />
(Including social<br />
relationships)<br />
State<br />
Rate<br />
2.14%<br />
5.31%<br />
25.97%<br />
38.22%<br />
28.36%<br />
State<br />
Target<br />
LEA<br />
Rate<br />
LEA<br />
Rate<br />
— —<br />
4.27%<br />
37.18%<br />
42.74%<br />
15.81%<br />
Target<br />
Met by<br />
LEA(Y/N)<br />
B) Acquisition and Use of<br />
Knowledge and Skills<br />
(Including early language/<br />
communication and early literacy)<br />
B) Acquisition and Use of<br />
Knowledge and Skills **<br />
State<br />
Rate<br />
1.75%<br />
6.59%<br />
34.23%<br />
43.51%<br />
13.92%<br />
State<br />
Target<br />
LEA<br />
Rate<br />
Target<br />
Met by<br />
LEA(Y/N)<br />
C) Use of Appropriate Behaviors<br />
to Meet Their Needs<br />
State<br />
Rate<br />
State<br />
Target<br />
LEA<br />
Rate<br />
Target<br />
Met by<br />
LEA(Y/N)<br />
89.61% 90.50% 94.92% Y 90.31% 90.50% 98.17% Y 90.82% 92.50% 97.84% Y<br />
66.58% 69.50% 58.55% N 57.43% 60.50% 54.70% N 76.69% 78.50% 71.37% N<br />
NOTE: * Including social relationships ** Including early language/ communication and early literacy<br />
Note: - - denotes not applicable<br />
State<br />
Rate<br />
LEA<br />
Rate<br />
— —<br />
1.71%<br />
43.59%<br />
48.29%<br />
6.41%<br />
C) Use of<br />
Appropriate<br />
Behaviors to<br />
Meet Their Needs<br />
State<br />
Rate<br />
4.51%<br />
17.34%<br />
41.72%<br />
34.97%<br />
LEA<br />
Rate<br />
1.46% — —<br />
1.71%<br />
26.92%<br />
50.43%<br />
20.94%<br />
Page 3 of 5
LEA: 1020 - DAWSON <strong>EDUCATION</strong> SERVICE CO-OP<br />
Indicator 08: Parent Involvement<br />
Percent of surveyed<br />
parents who reported<br />
school facilitated parent<br />
involvement as a means<br />
of improving services<br />
and results for children<br />
with disabilities.<br />
Early Childhood<br />
(3-5)<br />
School Age<br />
(5-21)<br />
State<br />
Rate<br />
90.47%<br />
95.05%<br />
Indicator 09: Disproportionality - Eligibility<br />
Disproportionate representation of racial<br />
and ethnic groups in special education and<br />
related services that is a result of<br />
inappropriate identification (e.g.<br />
monitoring data, review of policies,<br />
practices, and procedures under 618(d),<br />
etc.).<br />
State<br />
Rate<br />
State<br />
Target<br />
88.00%<br />
96.00%<br />
State<br />
Target<br />
0.00% 0.00%<br />
LEA<br />
Rate<br />
84.38%<br />
— —<br />
Indicator 10: Disproportionality-Child with a Disability<br />
Disproportionate representation of racial<br />
and ethnic groups in specific disability<br />
categories that is a result of inappropriate<br />
identification (e.g. monitoring data, review<br />
of policies, practices, and procedures under<br />
618(d), etc.).<br />
Indicator 11: Child Find<br />
Percent of children with<br />
parental consent to evaluate<br />
who are evaluated within<br />
the State established timeline<br />
of 60 days.<br />
Overall<br />
(3-21)<br />
Early Childhood<br />
(3-5)<br />
School Age<br />
(5-21)<br />
State<br />
Rate<br />
0.00%<br />
Indicator 12: Early Childhood Transition<br />
Percent of children referred by Part C prior to<br />
age 3, who are found eligible for Part B, and<br />
who have an IEP developed and implemented<br />
by their third birthday.<br />
Note: - - denotes not applicable<br />
State<br />
Rate<br />
99.41%<br />
99.70%<br />
98.97%<br />
State<br />
Rate<br />
State<br />
Target<br />
0.00%<br />
State<br />
Target<br />
100.00%<br />
100.00%<br />
100.00%<br />
State<br />
Target<br />
Target Met by<br />
LEA (Y/N)<br />
N/A<br />
Target Met by<br />
LEA (Y/N)<br />
N/A<br />
LEA<br />
Rate<br />
100.00%<br />
100.00%<br />
— —<br />
LEA<br />
Rate<br />
Target Met by<br />
LEA (Y/N)<br />
N<br />
N/A<br />
Note: The target for Indicator 09 is to have zero percent<br />
(0%) of districts identified as having disproportionate<br />
representation as a result of inappropriate<br />
identification in eligibility.<br />
Note: The target for Indicator 10 is to have zero<br />
percent (0%) of districts identified as having<br />
disproportionate representation as a result of<br />
inappropriate identification in a disability<br />
category.<br />
Target Met by<br />
LEA (Y/N)<br />
Y<br />
N/A<br />
Target Met<br />
by LEA<br />
(Y/N)<br />
99.21% 100.00% 100.00% Y<br />
Y<br />
Note: * Indicates a zero reponse rate for the<br />
district.<br />
Page 4 of 5
LEA: 1020 - DAWSON <strong>EDUCATION</strong> SERVICE CO-OP<br />
Indicator 13: Secondary Transition<br />
Percent of youth with disabilities aged 16 and<br />
up with an IEP that includes coordinated,<br />
measurable, annual IEP goals and transition<br />
services that will reasonably enable the student<br />
to meet the post-secondary goals.<br />
Indicator 14: Post-School Outcomes<br />
A. Percent of youth enrolled in higher<br />
education within one year of leaving high<br />
school.<br />
State<br />
Rate<br />
State<br />
Target<br />
Note: Data for this Indicator is from the on-site monitoring of LEAs for the given year.<br />
B. Percent of youth enrolled in higher<br />
education or competitively employed<br />
within one year of leaving high school.<br />
C. Percent of youth enrolled in higher<br />
education or in some other postsecondary<br />
education or training program; or<br />
competitively employed or in some other<br />
employment within one year of leaving<br />
high school.<br />
State<br />
Rate<br />
Indicator 20: Reported Data-Timely and Accurate*<br />
District submitted<br />
required data elements<br />
on or before due dates;<br />
made revisions within<br />
the alloted reveiw<br />
periods.<br />
Accurate and Timely<br />
Data Submission<br />
Overall (3-21)<br />
Early Childhood (3-5)<br />
School Age (5-21)<br />
State<br />
Target<br />
100.00%<br />
100.00%<br />
100.00%<br />
State<br />
Target<br />
LEA<br />
Rate<br />
LEA<br />
Rate<br />
Target Met by<br />
LEA (Y/N)<br />
Target Met<br />
by LEA<br />
(Y/N)<br />
Target Met<br />
by LEA<br />
(Y/N)<br />
*Data reviewed for timely and accurate submissions included all APSCN cycle data except for personnel<br />
Note: - - denotes not applicable<br />
96.19 100.00 — — N/A<br />
14.53<br />
State<br />
Rate<br />
49.42<br />
State<br />
Rate<br />
54.07<br />
13.00<br />
State<br />
Target<br />
49.00<br />
State<br />
Target<br />
60.00<br />
Y<br />
Y<br />
N/A<br />
— —<br />
LEA<br />
Rate<br />
— —<br />
LEA<br />
Rate<br />
— —<br />
N/A<br />
Target Met<br />
by LEA<br />
(Y/N)<br />
N/A<br />
Target Met<br />
by LEA<br />
(Y/N)<br />
N/A<br />
Page 5 of 5
LEA: 1101 - CORNING SCHOOL <strong>DISTRICT</strong><br />
<strong>ARKANSAS</strong> <strong>SPECIAL</strong> <strong>EDUCATION</strong><br />
<strong>DISTRICT</strong> <strong>ANNUAL</strong> PERFORMANCE REPORT<br />
2010/11 School Year<br />
Publication Date: March 2012<br />
Each State must have in place a State Performance Plan (SPP) to evaluate the State's efforts to meet the requirements and<br />
purposes of the implementation of the Individuals with Disabilities Education Act (IDEA). The SPP is a six-year plan, which<br />
describes Arkansas's performance on 20 indicators. The Office of Special Education Programs in the U. S. Department of<br />
Education requires that States report annually to the public on the performance of each local education agency (LEA) on 14 of<br />
20 indicators as compared with targets established by the State in the SPP. Arkansas will report indicators 1 through 14 and<br />
20 for each LEA serving children with disabilities (CWD). Any LEA not meeting targets on compliance indicators (0% for<br />
Indicators 4B, 09 & 10 and 100% for Indicators 11, 12, 13, and 20) are non-compliant with IDEA.<br />
There are no report changes for the 2010/11 school year profile; However, it is important to recognize that: .<br />
1. Indicator 01 (Graduation) is reported a year in arrear (2009/10 graduates) and is based on a four-year cohort. This<br />
means the rate is a measure of students who entered in ninth grade and graduate in four years. The calculation is a<br />
requirement under Title I of the Elementary and Secondary Education Act (ESEA).<br />
2. Indicator 02 (Drop out) is reported a year in arrear. This means the rate is a measure of students who dropped out in<br />
the 2009/10 school year. The Indicator 02 data are aligned with the Common Core of Data (CCD) requirements for<br />
grades 7-12.<br />
3. Indicator 04A and 4B (Suspension/Expulsion) is reported a year in arrear. This means the rate is a measure of<br />
students who had out-of-school suspensions and/or expulsions totaling more than 10 days.<br />
Percent of youth<br />
with IEPs<br />
graduating from<br />
high school with a<br />
regular diploma<br />
For a complete description of all the Indicators, please visit the special education website at<br />
http://arksped.k12.ar.us/sections/policy.html<br />
Indicator 01: Graduation Rates (2009/10 school year) Indicator 02: Dropout Rates (2009/10 school year)<br />
State<br />
Rate<br />
State<br />
Target<br />
75.76% 85.00%<br />
LEA<br />
Rate<br />
87.50%<br />
Target Met<br />
by LEA<br />
(Y/N)<br />
Y<br />
Percent of<br />
youth with<br />
IEPs dropping<br />
out of high<br />
school<br />
State<br />
Rate<br />
Indicator 03: Assessment on Statewide Benchmark Exam (grades 3-8, 11)<br />
A) Adequate Yearly Progress<br />
n=40<br />
Literacy<br />
Mathematics<br />
Met Disability Subgroup "n"<br />
for Reporting Purposes (Y/N)<br />
State Target for % of Districts Meeting<br />
AYP for Disability Subgroup<br />
State<br />
Target<br />
3.06% 4.20%<br />
LEA<br />
Rate<br />
1.47%<br />
% of Districts Meeting AYP<br />
for Disability Subgroup<br />
Target Met by<br />
LEA (Y/N)<br />
Y<br />
Target Met by<br />
LEA(Y/N)<br />
Overall N 17.15% 6.25%<br />
NA<br />
N<br />
N<br />
Note: For a district to qualify as having a disability subgroup it must have a minimum of 40 (n=40) students with disabilities in a school building.<br />
B) Participation<br />
Participation Rate: # of<br />
CWD Tested ÷ # of CWD<br />
Enrolled in grades tested.<br />
Participation Rate: Literacy<br />
Participation Rate: Math<br />
Note: - - denotes not applicable<br />
State<br />
Rate<br />
98.78%<br />
State<br />
Target<br />
95.00%<br />
LEA<br />
Rate<br />
100.00%<br />
Target Met<br />
by LEA (Y/N)<br />
98.61% 95.00% 100.00% Y<br />
Y<br />
C) Performance Proficiency<br />
Percent of CWD Scoring<br />
Proficient or Above<br />
Proficiency Rate: Literacy<br />
Proficiency Rate:<br />
Mathematics<br />
16.00%<br />
16.00%<br />
State<br />
Rate<br />
31.49%<br />
44.86%<br />
State<br />
Target<br />
45.22%<br />
51.14%<br />
LEA<br />
Rate<br />
43.94%<br />
47.62%<br />
NA<br />
NA<br />
Target<br />
Met by<br />
LEA (Y/N)<br />
N<br />
N<br />
Page 1 of 5
LEA: 1101 - CORNING SCHOOL <strong>DISTRICT</strong><br />
Indicator 04: Out-of-School Suspensions and Expulsions (2009/10 school year)<br />
A) Suspension/Expulsion<br />
Percent difference of CWD with out-of- school suspensions and<br />
expulsions totaling greater than 10 days in a school year as<br />
compared to the same data for general education students in<br />
the district.<br />
B) Suspension/Expulsion by Race and Ethnicity<br />
Percent of districts that have: (a) a significant discrepancy, by race or<br />
ethnicity, in the rate of suspensions and expulsions of greater than 10<br />
days in a school year for children with IEPs; and (b) policies,<br />
procedures or practices that contribute to the significant discrepancy<br />
and do not comply with requirements relating to the development<br />
and implementation of IEPs, the use of positive behavioral<br />
interventions and supports, and procedural safeguards.<br />
Indicator 05: School Age (5-21) Least Restrictive Environment<br />
A) In the Regular Class 80% or more of the day<br />
Percent of CWD with<br />
IEPs receiving instruction<br />
in the regular class 80%<br />
or more of the day.<br />
State<br />
Rate<br />
State<br />
Target<br />
LEA<br />
Rate<br />
B) In the Regular Class less than 40% of the day<br />
Percent of CWD with<br />
IEPs receiving instruction<br />
in the regular class less<br />
than 60% of the day.<br />
53.87% 59.77%<br />
State<br />
Rate<br />
State<br />
Target<br />
12.42% 12.51%<br />
41.33%<br />
LEA<br />
Rate<br />
3.33%<br />
C) Other Settings outside the regular class<br />
Percent of CWD with IEPs served in<br />
public or private separate schools,<br />
residential placements, or<br />
homebound/hospital placements.<br />
State<br />
Rate<br />
State<br />
Target<br />
2.80% 2.56%<br />
Target Met<br />
by LEA (Y/N)<br />
N<br />
Target Met<br />
by LEA (Y/N)<br />
Y<br />
LEA<br />
Rate<br />
2.00%<br />
Target Met<br />
by LEA(Y/N)<br />
Indicator 06: Early Childhood (3-5) Least Restrictive Environment<br />
A) Regular Early Childhood Program<br />
Percent of children (aged 3 through 5) with IEPs attending a regular<br />
early childhood program and receiving the majority of special<br />
education and related services in the regular early childhood program<br />
Allowable<br />
Difference<br />
LEA: 1101 - CORNING SCHOOL <strong>DISTRICT</strong><br />
Indicator 07: Preschool (3-5) Outcomes<br />
a) Percent of preschool CWD<br />
children who did not<br />
improve functioning.<br />
b) Percent of preschool CWD<br />
who improved but whose<br />
functioning remained below<br />
same age peers.<br />
c) Percent of preschool CWD<br />
who improved at a level<br />
nearer to same aged peers.<br />
d) Percent of preschool CWD<br />
who improved functioning to<br />
reach a level comparable to<br />
same age peers.<br />
e) Percent of preschool CWD<br />
children who maintain<br />
functioning at a level<br />
comparable to same aged<br />
peers.<br />
Summary<br />
Statements<br />
1) Of those preschool<br />
children who entered<br />
the preschool program<br />
below age expectations<br />
in each Outcome, the<br />
percent who<br />
substantially increased<br />
their rate of growth by<br />
the time they turned 6<br />
years of age or exited<br />
the program.<br />
2) The percent of<br />
preschool children who<br />
were functioning<br />
within age expectations<br />
in each Outcome by the<br />
time they turned 6<br />
years of age or exited<br />
A) Positive Social -Emotional<br />
Skills*<br />
State<br />
Rate<br />
A) Positive Social -<br />
Emotional Skills<br />
(Including social<br />
relationships)<br />
State<br />
Rate<br />
2.14%<br />
5.31%<br />
25.97%<br />
38.22%<br />
28.36%<br />
State<br />
Target<br />
LEA<br />
Rate<br />
LEA<br />
Rate<br />
— —<br />
— —<br />
— —<br />
— —<br />
— —<br />
Target<br />
Met by<br />
LEA(Y/N)<br />
B) Acquisition and Use of<br />
Knowledge and Skills<br />
(Including early language/<br />
communication and early literacy)<br />
B) Acquisition and Use of<br />
Knowledge and Skills **<br />
State<br />
Rate<br />
1.75%<br />
6.59%<br />
34.23%<br />
43.51%<br />
13.92%<br />
State<br />
Target<br />
LEA<br />
Rate<br />
Target<br />
Met by<br />
LEA(Y/N)<br />
C) Use of Appropriate Behaviors<br />
to Meet Their Needs<br />
State<br />
Rate<br />
State<br />
Target<br />
LEA<br />
Rate<br />
Target<br />
Met by<br />
LEA(Y/N)<br />
89.61% 90.50% — — N/A 90.31% 90.50% — — N/A 90.82% 92.50% — — N/A<br />
66.58% 69.50% — — N/A 57.43% 60.50% — — N/A 76.69% 78.50% — — N/A<br />
NOTE: * Including social relationships ** Including early language/ communication and early literacy<br />
Note: - - denotes not applicable<br />
State<br />
Rate<br />
LEA<br />
Rate<br />
— —<br />
— —<br />
— —<br />
— —<br />
— —<br />
C) Use of<br />
Appropriate<br />
Behaviors to<br />
Meet Their Needs<br />
State<br />
Rate<br />
4.51%<br />
17.34%<br />
41.72%<br />
34.97%<br />
LEA<br />
Rate<br />
1.46% — —<br />
— —<br />
— —<br />
— —<br />
— —<br />
Page 3 of 5
LEA: 1101 - CORNING SCHOOL <strong>DISTRICT</strong><br />
Indicator 08: Parent Involvement<br />
Percent of surveyed<br />
parents who reported<br />
school facilitated parent<br />
involvement as a means<br />
of improving services<br />
and results for children<br />
with disabilities.<br />
Early Childhood<br />
(3-5)<br />
School Age<br />
(5-21)<br />
State<br />
Rate<br />
90.47%<br />
95.05%<br />
Indicator 09: Disproportionality - Eligibility<br />
Disproportionate representation of racial<br />
and ethnic groups in special education and<br />
related services that is a result of<br />
inappropriate identification (e.g.<br />
monitoring data, review of policies,<br />
practices, and procedures under 618(d),<br />
etc.).<br />
State<br />
Rate<br />
State<br />
Target<br />
88.00%<br />
96.00%<br />
State<br />
Target<br />
0.00% 0.00%<br />
LEA<br />
Rate<br />
— —<br />
97.27%<br />
Indicator 10: Disproportionality-Child with a Disability<br />
Disproportionate representation of racial<br />
and ethnic groups in specific disability<br />
categories that is a result of inappropriate<br />
identification (e.g. monitoring data, review<br />
of policies, practices, and procedures under<br />
618(d), etc.).<br />
Indicator 11: Child Find<br />
Percent of children with<br />
parental consent to evaluate<br />
who are evaluated within<br />
the State established timeline<br />
of 60 days.<br />
Overall<br />
(3-21)<br />
Early Childhood<br />
(3-5)<br />
School Age<br />
(5-21)<br />
State<br />
Rate<br />
0.00%<br />
Indicator 12: Early Childhood Transition<br />
Percent of children referred by Part C prior to<br />
age 3, who are found eligible for Part B, and<br />
who have an IEP developed and implemented<br />
by their third birthday.<br />
Note: - - denotes not applicable<br />
State<br />
Rate<br />
99.41%<br />
99.70%<br />
98.97%<br />
State<br />
Rate<br />
State<br />
Target<br />
0.00%<br />
State<br />
Target<br />
100.00%<br />
100.00%<br />
100.00%<br />
State<br />
Target<br />
Target Met by<br />
LEA (Y/N)<br />
Y<br />
Target Met by<br />
LEA (Y/N)<br />
Y<br />
LEA<br />
Rate<br />
100.00%<br />
— —<br />
100.00%<br />
LEA<br />
Rate<br />
Target Met by<br />
LEA (Y/N)<br />
N/A<br />
Y<br />
Note: The target for Indicator 09 is to have zero percent<br />
(0%) of districts identified as having disproportionate<br />
representation as a result of inappropriate<br />
identification in eligibility.<br />
Note: The target for Indicator 10 is to have zero<br />
percent (0%) of districts identified as having<br />
disproportionate representation as a result of<br />
inappropriate identification in a disability<br />
category.<br />
Target Met by<br />
LEA (Y/N)<br />
N/A<br />
Y<br />
Target Met<br />
by LEA<br />
(Y/N)<br />
99.21% 100.00% - - N/A<br />
Y<br />
Note: * Indicates a zero reponse rate for the<br />
district.<br />
Page 4 of 5
LEA: 1101 - CORNING SCHOOL <strong>DISTRICT</strong><br />
Indicator 13: Secondary Transition<br />
Percent of youth with disabilities aged 16 and<br />
up with an IEP that includes coordinated,<br />
measurable, annual IEP goals and transition<br />
services that will reasonably enable the student<br />
to meet the post-secondary goals.<br />
Indicator 14: Post-School Outcomes<br />
A. Percent of youth enrolled in higher<br />
education within one year of leaving high<br />
school.<br />
State<br />
Rate<br />
State<br />
Target<br />
Note: Data for this Indicator is from the on-site monitoring of LEAs for the given year.<br />
B. Percent of youth enrolled in higher<br />
education or competitively employed<br />
within one year of leaving high school.<br />
C. Percent of youth enrolled in higher<br />
education or in some other postsecondary<br />
education or training program; or<br />
competitively employed or in some other<br />
employment within one year of leaving<br />
high school.<br />
State<br />
Rate<br />
Indicator 20: Reported Data-Timely and Accurate*<br />
District submitted<br />
required data elements<br />
on or before due dates;<br />
made revisions within<br />
the alloted reveiw<br />
periods.<br />
Accurate and Timely<br />
Data Submission<br />
Overall (3-21)<br />
Early Childhood (3-5)<br />
School Age (5-21)<br />
State<br />
Target<br />
100.00%<br />
100.00%<br />
100.00%<br />
State<br />
Target<br />
LEA<br />
Rate<br />
LEA<br />
Rate<br />
Target Met by<br />
LEA (Y/N)<br />
Target Met<br />
by LEA<br />
(Y/N)<br />
Target Met<br />
by LEA<br />
(Y/N)<br />
*Data reviewed for timely and accurate submissions included all APSCN cycle data except for personnel<br />
Note: - - denotes not applicable<br />
96.19 100.00 — — N/A<br />
14.53<br />
State<br />
Rate<br />
49.42<br />
State<br />
Rate<br />
54.07<br />
13.00<br />
State<br />
Target<br />
49.00<br />
State<br />
Target<br />
60.00<br />
Y<br />
N/A<br />
Y<br />
— —<br />
LEA<br />
Rate<br />
— —<br />
LEA<br />
Rate<br />
— —<br />
N/A<br />
Target Met<br />
by LEA<br />
(Y/N)<br />
N/A<br />
Target Met<br />
by LEA<br />
(Y/N)<br />
N/A<br />
Page 5 of 5
LEA: 1104 - PIGGOTT SCHOOL <strong>DISTRICT</strong><br />
<strong>ARKANSAS</strong> <strong>SPECIAL</strong> <strong>EDUCATION</strong><br />
<strong>DISTRICT</strong> <strong>ANNUAL</strong> PERFORMANCE REPORT<br />
2010/11 School Year<br />
Publication Date: March 2012<br />
Each State must have in place a State Performance Plan (SPP) to evaluate the State's efforts to meet the requirements and<br />
purposes of the implementation of the Individuals with Disabilities Education Act (IDEA). The SPP is a six-year plan, which<br />
describes Arkansas's performance on 20 indicators. The Office of Special Education Programs in the U. S. Department of<br />
Education requires that States report annually to the public on the performance of each local education agency (LEA) on 14 of<br />
20 indicators as compared with targets established by the State in the SPP. Arkansas will report indicators 1 through 14 and<br />
20 for each LEA serving children with disabilities (CWD). Any LEA not meeting targets on compliance indicators (0% for<br />
Indicators 4B, 09 & 10 and 100% for Indicators 11, 12, 13, and 20) are non-compliant with IDEA.<br />
There are no report changes for the 2010/11 school year profile; However, it is important to recognize that: .<br />
1. Indicator 01 (Graduation) is reported a year in arrear (2009/10 graduates) and is based on a four-year cohort. This<br />
means the rate is a measure of students who entered in ninth grade and graduate in four years. The calculation is a<br />
requirement under Title I of the Elementary and Secondary Education Act (ESEA).<br />
2. Indicator 02 (Drop out) is reported a year in arrear. This means the rate is a measure of students who dropped out in<br />
the 2009/10 school year. The Indicator 02 data are aligned with the Common Core of Data (CCD) requirements for<br />
grades 7-12.<br />
3. Indicator 04A and 4B (Suspension/Expulsion) is reported a year in arrear. This means the rate is a measure of<br />
students who had out-of-school suspensions and/or expulsions totaling more than 10 days.<br />
Percent of youth<br />
with IEPs<br />
graduating from<br />
high school with a<br />
regular diploma<br />
For a complete description of all the Indicators, please visit the special education website at<br />
http://arksped.k12.ar.us/sections/policy.html<br />
Indicator 01: Graduation Rates (2009/10 school year) Indicator 02: Dropout Rates (2009/10 school year)<br />
State<br />
Rate<br />
State<br />
Target<br />
75.76% 85.00%<br />
LEA<br />
Rate<br />
83.33%<br />
Target Met<br />
by LEA<br />
(Y/N)<br />
N<br />
Percent of<br />
youth with<br />
IEPs dropping<br />
out of high<br />
school<br />
State<br />
Rate<br />
Indicator 03: Assessment on Statewide Benchmark Exam (grades 3-8, 11)<br />
A) Adequate Yearly Progress<br />
n=40<br />
Literacy<br />
Mathematics<br />
Met Disability Subgroup "n"<br />
for Reporting Purposes (Y/N)<br />
State Target for % of Districts Meeting<br />
AYP for Disability Subgroup<br />
State<br />
Target<br />
3.06% 4.20%<br />
LEA<br />
Rate<br />
1.39%<br />
% of Districts Meeting AYP<br />
for Disability Subgroup<br />
Target Met by<br />
LEA (Y/N)<br />
Y<br />
Target Met by<br />
LEA(Y/N)<br />
Overall N 17.15% 6.25%<br />
NA<br />
N<br />
N<br />
Note: For a district to qualify as having a disability subgroup it must have a minimum of 40 (n=40) students with disabilities in a school building.<br />
B) Participation<br />
Participation Rate: # of<br />
CWD Tested ÷ # of CWD<br />
Enrolled in grades tested.<br />
Participation Rate: Literacy<br />
Participation Rate: Math<br />
Note: - - denotes not applicable<br />
State<br />
Rate<br />
98.78%<br />
State<br />
Target<br />
95.00%<br />
LEA<br />
Rate<br />
95.31%<br />
Target Met<br />
by LEA (Y/N)<br />
98.61% 95.00% 95.77% Y<br />
Y<br />
C) Performance Proficiency<br />
Percent of CWD Scoring<br />
Proficient or Above<br />
Proficiency Rate: Literacy<br />
Proficiency Rate:<br />
Mathematics<br />
16.00%<br />
16.00%<br />
State<br />
Rate<br />
31.49%<br />
44.86%<br />
State<br />
Target<br />
45.22%<br />
51.14%<br />
LEA<br />
Rate<br />
18.97%<br />
49.23%<br />
NA<br />
NA<br />
Target<br />
Met by<br />
LEA (Y/N)<br />
N<br />
N<br />
Page 1 of 5
LEA: 1104 - PIGGOTT SCHOOL <strong>DISTRICT</strong><br />
Indicator 04: Out-of-School Suspensions and Expulsions (2009/10 school year)<br />
A) Suspension/Expulsion<br />
Percent difference of CWD with out-of- school suspensions and<br />
expulsions totaling greater than 10 days in a school year as<br />
compared to the same data for general education students in<br />
the district.<br />
B) Suspension/Expulsion by Race and Ethnicity<br />
Percent of districts that have: (a) a significant discrepancy, by race or<br />
ethnicity, in the rate of suspensions and expulsions of greater than 10<br />
days in a school year for children with IEPs; and (b) policies,<br />
procedures or practices that contribute to the significant discrepancy<br />
and do not comply with requirements relating to the development<br />
and implementation of IEPs, the use of positive behavioral<br />
interventions and supports, and procedural safeguards.<br />
Indicator 05: School Age (5-21) Least Restrictive Environment<br />
A) In the Regular Class 80% or more of the day<br />
Percent of CWD with<br />
IEPs receiving instruction<br />
in the regular class 80%<br />
or more of the day.<br />
State<br />
Rate<br />
State<br />
Target<br />
LEA<br />
Rate<br />
B) In the Regular Class less than 40% of the day<br />
Percent of CWD with<br />
IEPs receiving instruction<br />
in the regular class less<br />
than 60% of the day.<br />
53.87% 59.77%<br />
State<br />
Rate<br />
State<br />
Target<br />
12.42% 12.51%<br />
51.03%<br />
LEA<br />
Rate<br />
5.52%<br />
C) Other Settings outside the regular class<br />
Percent of CWD with IEPs served in<br />
public or private separate schools,<br />
residential placements, or<br />
homebound/hospital placements.<br />
State<br />
Rate<br />
State<br />
Target<br />
2.80% 2.56%<br />
Target Met<br />
by LEA (Y/N)<br />
N<br />
Target Met<br />
by LEA (Y/N)<br />
Y<br />
LEA<br />
Rate<br />
0.00%<br />
Target Met<br />
by LEA(Y/N)<br />
Indicator 06: Early Childhood (3-5) Least Restrictive Environment<br />
A) Regular Early Childhood Program<br />
Percent of children (aged 3 through 5) with IEPs attending a regular<br />
early childhood program and receiving the majority of special<br />
education and related services in the regular early childhood program<br />
Allowable<br />
Difference<br />
LEA: 1104 - PIGGOTT SCHOOL <strong>DISTRICT</strong><br />
Indicator 07: Preschool (3-5) Outcomes<br />
a) Percent of preschool CWD<br />
children who did not<br />
improve functioning.<br />
b) Percent of preschool CWD<br />
who improved but whose<br />
functioning remained below<br />
same age peers.<br />
c) Percent of preschool CWD<br />
who improved at a level<br />
nearer to same aged peers.<br />
d) Percent of preschool CWD<br />
who improved functioning to<br />
reach a level comparable to<br />
same age peers.<br />
e) Percent of preschool CWD<br />
children who maintain<br />
functioning at a level<br />
comparable to same aged<br />
peers.<br />
Summary<br />
Statements<br />
1) Of those preschool<br />
children who entered<br />
the preschool program<br />
below age expectations<br />
in each Outcome, the<br />
percent who<br />
substantially increased<br />
their rate of growth by<br />
the time they turned 6<br />
years of age or exited<br />
the program.<br />
2) The percent of<br />
preschool children who<br />
were functioning<br />
within age expectations<br />
in each Outcome by the<br />
time they turned 6<br />
years of age or exited<br />
A) Positive Social -Emotional<br />
Skills*<br />
State<br />
Rate<br />
A) Positive Social -<br />
Emotional Skills<br />
(Including social<br />
relationships)<br />
State<br />
Rate<br />
2.14%<br />
5.31%<br />
25.97%<br />
38.22%<br />
28.36%<br />
State<br />
Target<br />
LEA<br />
Rate<br />
LEA<br />
Rate<br />
— —<br />
— —<br />
— —<br />
— —<br />
— —<br />
Target<br />
Met by<br />
LEA(Y/N)<br />
B) Acquisition and Use of<br />
Knowledge and Skills<br />
(Including early language/<br />
communication and early literacy)<br />
B) Acquisition and Use of<br />
Knowledge and Skills **<br />
State<br />
Rate<br />
1.75%<br />
6.59%<br />
34.23%<br />
43.51%<br />
13.92%<br />
State<br />
Target<br />
LEA<br />
Rate<br />
Target<br />
Met by<br />
LEA(Y/N)<br />
C) Use of Appropriate Behaviors<br />
to Meet Their Needs<br />
State<br />
Rate<br />
State<br />
Target<br />
LEA<br />
Rate<br />
Target<br />
Met by<br />
LEA(Y/N)<br />
89.61% 90.50% — — N/A 90.31% 90.50% — — N/A 90.82% 92.50% — — N/A<br />
66.58% 69.50% — — N/A 57.43% 60.50% — — N/A 76.69% 78.50% — — N/A<br />
NOTE: * Including social relationships ** Including early language/ communication and early literacy<br />
Note: - - denotes not applicable<br />
State<br />
Rate<br />
LEA<br />
Rate<br />
— —<br />
— —<br />
— —<br />
— —<br />
— —<br />
C) Use of<br />
Appropriate<br />
Behaviors to<br />
Meet Their Needs<br />
State<br />
Rate<br />
4.51%<br />
17.34%<br />
41.72%<br />
34.97%<br />
LEA<br />
Rate<br />
1.46% — —<br />
— —<br />
— —<br />
— —<br />
— —<br />
Page 3 of 5
LEA: 1104 - PIGGOTT SCHOOL <strong>DISTRICT</strong><br />
Indicator 08: Parent Involvement<br />
Percent of surveyed<br />
parents who reported<br />
school facilitated parent<br />
involvement as a means<br />
of improving services<br />
and results for children<br />
with disabilities.<br />
Early Childhood<br />
(3-5)<br />
School Age<br />
(5-21)<br />
State<br />
Rate<br />
90.47%<br />
95.05%<br />
Indicator 09: Disproportionality - Eligibility<br />
Disproportionate representation of racial<br />
and ethnic groups in special education and<br />
related services that is a result of<br />
inappropriate identification (e.g.<br />
monitoring data, review of policies,<br />
practices, and procedures under 618(d),<br />
etc.).<br />
State<br />
Rate<br />
State<br />
Target<br />
88.00%<br />
96.00%<br />
State<br />
Target<br />
0.00% 0.00%<br />
LEA<br />
Rate<br />
— —<br />
100.00%<br />
Indicator 10: Disproportionality-Child with a Disability<br />
Disproportionate representation of racial<br />
and ethnic groups in specific disability<br />
categories that is a result of inappropriate<br />
identification (e.g. monitoring data, review<br />
of policies, practices, and procedures under<br />
618(d), etc.).<br />
Indicator 11: Child Find<br />
Percent of children with<br />
parental consent to evaluate<br />
who are evaluated within<br />
the State established timeline<br />
of 60 days.<br />
Overall<br />
(3-21)<br />
Early Childhood<br />
(3-5)<br />
School Age<br />
(5-21)<br />
State<br />
Rate<br />
0.00%<br />
Indicator 12: Early Childhood Transition<br />
Percent of children referred by Part C prior to<br />
age 3, who are found eligible for Part B, and<br />
who have an IEP developed and implemented<br />
by their third birthday.<br />
Note: - - denotes not applicable<br />
State<br />
Rate<br />
99.41%<br />
99.70%<br />
98.97%<br />
State<br />
Rate<br />
State<br />
Target<br />
0.00%<br />
State<br />
Target<br />
100.00%<br />
100.00%<br />
100.00%<br />
State<br />
Target<br />
Target Met by<br />
LEA (Y/N)<br />
Y<br />
Target Met by<br />
LEA (Y/N)<br />
Y<br />
LEA<br />
Rate<br />
100.00%<br />
— —<br />
100.00%<br />
LEA<br />
Rate<br />
Target Met by<br />
LEA (Y/N)<br />
N/A<br />
Y<br />
Note: The target for Indicator 09 is to have zero percent<br />
(0%) of districts identified as having disproportionate<br />
representation as a result of inappropriate<br />
identification in eligibility.<br />
Note: The target for Indicator 10 is to have zero<br />
percent (0%) of districts identified as having<br />
disproportionate representation as a result of<br />
inappropriate identification in a disability<br />
category.<br />
Target Met by<br />
LEA (Y/N)<br />
N/A<br />
Y<br />
Target Met<br />
by LEA<br />
(Y/N)<br />
99.21% 100.00% - - N/A<br />
Y<br />
Note: * Indicates a zero reponse rate for the<br />
district.<br />
Page 4 of 5
LEA: 1104 - PIGGOTT SCHOOL <strong>DISTRICT</strong><br />
Indicator 13: Secondary Transition<br />
Percent of youth with disabilities aged 16 and<br />
up with an IEP that includes coordinated,<br />
measurable, annual IEP goals and transition<br />
services that will reasonably enable the student<br />
to meet the post-secondary goals.<br />
Indicator 14: Post-School Outcomes<br />
A. Percent of youth enrolled in higher<br />
education within one year of leaving high<br />
school.<br />
State<br />
Rate<br />
State<br />
Target<br />
Note: Data for this Indicator is from the on-site monitoring of LEAs for the given year.<br />
B. Percent of youth enrolled in higher<br />
education or competitively employed<br />
within one year of leaving high school.<br />
C. Percent of youth enrolled in higher<br />
education or in some other postsecondary<br />
education or training program; or<br />
competitively employed or in some other<br />
employment within one year of leaving<br />
high school.<br />
State<br />
Rate<br />
Indicator 20: Reported Data-Timely and Accurate*<br />
District submitted<br />
required data elements<br />
on or before due dates;<br />
made revisions within<br />
the alloted reveiw<br />
periods.<br />
Accurate and Timely<br />
Data Submission<br />
Overall (3-21)<br />
Early Childhood (3-5)<br />
School Age (5-21)<br />
State<br />
Target<br />
100.00%<br />
100.00%<br />
100.00%<br />
State<br />
Target<br />
LEA<br />
Rate<br />
LEA<br />
Rate<br />
Target Met by<br />
LEA (Y/N)<br />
Target Met<br />
by LEA<br />
(Y/N)<br />
Target Met<br />
by LEA<br />
(Y/N)<br />
*Data reviewed for timely and accurate submissions included all APSCN cycle data except for personnel<br />
Note: - - denotes not applicable<br />
96.19 100.00 — — N/A<br />
14.53<br />
State<br />
Rate<br />
49.42<br />
State<br />
Rate<br />
54.07<br />
13.00<br />
State<br />
Target<br />
49.00<br />
State<br />
Target<br />
60.00<br />
Y<br />
N/A<br />
Y<br />
— —<br />
LEA<br />
Rate<br />
— —<br />
LEA<br />
Rate<br />
— —<br />
N/A<br />
Target Met<br />
by LEA<br />
(Y/N)<br />
N/A<br />
Target Met<br />
by LEA<br />
(Y/N)<br />
N/A<br />
Page 5 of 5
LEA: 1106 - RECTOR SCHOOL <strong>DISTRICT</strong><br />
<strong>ARKANSAS</strong> <strong>SPECIAL</strong> <strong>EDUCATION</strong><br />
<strong>DISTRICT</strong> <strong>ANNUAL</strong> PERFORMANCE REPORT<br />
2010/11 School Year<br />
Publication Date: March 2012<br />
Each State must have in place a State Performance Plan (SPP) to evaluate the State's efforts to meet the requirements and<br />
purposes of the implementation of the Individuals with Disabilities Education Act (IDEA). The SPP is a six-year plan, which<br />
describes Arkansas's performance on 20 indicators. The Office of Special Education Programs in the U. S. Department of<br />
Education requires that States report annually to the public on the performance of each local education agency (LEA) on 14 of<br />
20 indicators as compared with targets established by the State in the SPP. Arkansas will report indicators 1 through 14 and<br />
20 for each LEA serving children with disabilities (CWD). Any LEA not meeting targets on compliance indicators (0% for<br />
Indicators 4B, 09 & 10 and 100% for Indicators 11, 12, 13, and 20) are non-compliant with IDEA.<br />
There are no report changes for the 2010/11 school year profile; However, it is important to recognize that: .<br />
1. Indicator 01 (Graduation) is reported a year in arrear (2009/10 graduates) and is based on a four-year cohort. This<br />
means the rate is a measure of students who entered in ninth grade and graduate in four years. The calculation is a<br />
requirement under Title I of the Elementary and Secondary Education Act (ESEA).<br />
2. Indicator 02 (Drop out) is reported a year in arrear. This means the rate is a measure of students who dropped out in<br />
the 2009/10 school year. The Indicator 02 data are aligned with the Common Core of Data (CCD) requirements for<br />
grades 7-12.<br />
3. Indicator 04A and 4B (Suspension/Expulsion) is reported a year in arrear. This means the rate is a measure of<br />
students who had out-of-school suspensions and/or expulsions totaling more than 10 days.<br />
Percent of youth<br />
with IEPs<br />
graduating from<br />
high school with a<br />
regular diploma<br />
For a complete description of all the Indicators, please visit the special education website at<br />
http://arksped.k12.ar.us/sections/policy.html<br />
Indicator 01: Graduation Rates (2009/10 school year) Indicator 02: Dropout Rates (2009/10 school year)<br />
State<br />
Rate<br />
State<br />
Target<br />
75.76% 85.00%<br />
LEA<br />
Rate<br />
88.89%<br />
Target Met<br />
by LEA<br />
(Y/N)<br />
Y<br />
Percent of<br />
youth with<br />
IEPs dropping<br />
out of high<br />
school<br />
State<br />
Rate<br />
Indicator 03: Assessment on Statewide Benchmark Exam (grades 3-8, 11)<br />
A) Adequate Yearly Progress<br />
n=40<br />
Literacy<br />
Mathematics<br />
Met Disability Subgroup "n"<br />
for Reporting Purposes (Y/N)<br />
State Target for % of Districts Meeting<br />
AYP for Disability Subgroup<br />
State<br />
Target<br />
3.06% 4.20%<br />
LEA<br />
Rate<br />
1.85%<br />
% of Districts Meeting AYP<br />
for Disability Subgroup<br />
Target Met by<br />
LEA (Y/N)<br />
Y<br />
Target Met by<br />
LEA(Y/N)<br />
Overall N 17.15% 6.25%<br />
NA<br />
N<br />
N<br />
Note: For a district to qualify as having a disability subgroup it must have a minimum of 40 (n=40) students with disabilities in a school building.<br />
B) Participation<br />
Participation Rate: # of<br />
CWD Tested ÷ # of CWD<br />
Enrolled in grades tested.<br />
Participation Rate: Literacy<br />
Participation Rate: Math<br />
Note: - - denotes not applicable<br />
State<br />
Rate<br />
98.78%<br />
State<br />
Target<br />
95.00%<br />
LEA<br />
Rate<br />
100.00%<br />
Target Met<br />
by LEA (Y/N)<br />
98.61% 95.00% 100.00% Y<br />
Y<br />
C) Performance Proficiency<br />
Percent of CWD Scoring<br />
Proficient or Above<br />
Proficiency Rate: Literacy<br />
Proficiency Rate:<br />
Mathematics<br />
16.00%<br />
16.00%<br />
State<br />
Rate<br />
31.49%<br />
44.86%<br />
State<br />
Target<br />
45.22%<br />
51.14%<br />
LEA<br />
Rate<br />
19.35%<br />
63.49%<br />
NA<br />
NA<br />
Target<br />
Met by<br />
LEA (Y/N)<br />
N<br />
Y<br />
Page 1 of 5
LEA: 1106 - RECTOR SCHOOL <strong>DISTRICT</strong><br />
Indicator 04: Out-of-School Suspensions and Expulsions (2009/10 school year)<br />
A) Suspension/Expulsion<br />
Percent difference of CWD with out-of- school suspensions and<br />
expulsions totaling greater than 10 days in a school year as<br />
compared to the same data for general education students in<br />
the district.<br />
B) Suspension/Expulsion by Race and Ethnicity<br />
Percent of districts that have: (a) a significant discrepancy, by race or<br />
ethnicity, in the rate of suspensions and expulsions of greater than 10<br />
days in a school year for children with IEPs; and (b) policies,<br />
procedures or practices that contribute to the significant discrepancy<br />
and do not comply with requirements relating to the development<br />
and implementation of IEPs, the use of positive behavioral<br />
interventions and supports, and procedural safeguards.<br />
Indicator 05: School Age (5-21) Least Restrictive Environment<br />
A) In the Regular Class 80% or more of the day<br />
Percent of CWD with<br />
IEPs receiving instruction<br />
in the regular class 80%<br />
or more of the day.<br />
State<br />
Rate<br />
State<br />
Target<br />
LEA<br />
Rate<br />
B) In the Regular Class less than 40% of the day<br />
Percent of CWD with<br />
IEPs receiving instruction<br />
in the regular class less<br />
than 60% of the day.<br />
53.87% 59.77%<br />
State<br />
Rate<br />
State<br />
Target<br />
12.42% 12.51%<br />
58.26%<br />
LEA<br />
Rate<br />
3.48%<br />
C) Other Settings outside the regular class<br />
Percent of CWD with IEPs served in<br />
public or private separate schools,<br />
residential placements, or<br />
homebound/hospital placements.<br />
State<br />
Rate<br />
State<br />
Target<br />
2.80% 2.56%<br />
Target Met<br />
by LEA (Y/N)<br />
N<br />
Target Met<br />
by LEA (Y/N)<br />
Y<br />
LEA<br />
Rate<br />
0.00%<br />
Target Met<br />
by LEA(Y/N)<br />
Indicator 06: Early Childhood (3-5) Least Restrictive Environment<br />
A) Regular Early Childhood Program<br />
Percent of children (aged 3 through 5) with IEPs attending a regular<br />
early childhood program and receiving the majority of special<br />
education and related services in the regular early childhood program<br />
Allowable<br />
Difference<br />
LEA: 1106 - RECTOR SCHOOL <strong>DISTRICT</strong><br />
Indicator 07: Preschool (3-5) Outcomes<br />
a) Percent of preschool CWD<br />
children who did not<br />
improve functioning.<br />
b) Percent of preschool CWD<br />
who improved but whose<br />
functioning remained below<br />
same age peers.<br />
c) Percent of preschool CWD<br />
who improved at a level<br />
nearer to same aged peers.<br />
d) Percent of preschool CWD<br />
who improved functioning to<br />
reach a level comparable to<br />
same age peers.<br />
e) Percent of preschool CWD<br />
children who maintain<br />
functioning at a level<br />
comparable to same aged<br />
peers.<br />
Summary<br />
Statements<br />
1) Of those preschool<br />
children who entered<br />
the preschool program<br />
below age expectations<br />
in each Outcome, the<br />
percent who<br />
substantially increased<br />
their rate of growth by<br />
the time they turned 6<br />
years of age or exited<br />
the program.<br />
2) The percent of<br />
preschool children who<br />
were functioning<br />
within age expectations<br />
in each Outcome by the<br />
time they turned 6<br />
years of age or exited<br />
A) Positive Social -Emotional<br />
Skills*<br />
State<br />
Rate<br />
A) Positive Social -<br />
Emotional Skills<br />
(Including social<br />
relationships)<br />
State<br />
Rate<br />
2.14%<br />
5.31%<br />
25.97%<br />
38.22%<br />
28.36%<br />
State<br />
Target<br />
LEA<br />
Rate<br />
LEA<br />
Rate<br />
— —<br />
— —<br />
— —<br />
— —<br />
— —<br />
Target<br />
Met by<br />
LEA(Y/N)<br />
B) Acquisition and Use of<br />
Knowledge and Skills<br />
(Including early language/<br />
communication and early literacy)<br />
B) Acquisition and Use of<br />
Knowledge and Skills **<br />
State<br />
Rate<br />
1.75%<br />
6.59%<br />
34.23%<br />
43.51%<br />
13.92%<br />
State<br />
Target<br />
LEA<br />
Rate<br />
Target<br />
Met by<br />
LEA(Y/N)<br />
C) Use of Appropriate Behaviors<br />
to Meet Their Needs<br />
State<br />
Rate<br />
State<br />
Target<br />
LEA<br />
Rate<br />
Target<br />
Met by<br />
LEA(Y/N)<br />
89.61% 90.50% — — N/A 90.31% 90.50% — — N/A 90.82% 92.50% — — N/A<br />
66.58% 69.50% — — N/A 57.43% 60.50% — — N/A 76.69% 78.50% — — N/A<br />
NOTE: * Including social relationships ** Including early language/ communication and early literacy<br />
Note: - - denotes not applicable<br />
State<br />
Rate<br />
LEA<br />
Rate<br />
— —<br />
— —<br />
— —<br />
— —<br />
— —<br />
C) Use of<br />
Appropriate<br />
Behaviors to<br />
Meet Their Needs<br />
State<br />
Rate<br />
4.51%<br />
17.34%<br />
41.72%<br />
34.97%<br />
LEA<br />
Rate<br />
1.46% — —<br />
— —<br />
— —<br />
— —<br />
— —<br />
Page 3 of 5
LEA: 1106 - RECTOR SCHOOL <strong>DISTRICT</strong><br />
Indicator 08: Parent Involvement<br />
Percent of surveyed<br />
parents who reported<br />
school facilitated parent<br />
involvement as a means<br />
of improving services<br />
and results for children<br />
with disabilities.<br />
Early Childhood<br />
(3-5)<br />
School Age<br />
(5-21)<br />
State<br />
Rate<br />
90.47%<br />
95.05%<br />
Indicator 09: Disproportionality - Eligibility<br />
Disproportionate representation of racial<br />
and ethnic groups in special education and<br />
related services that is a result of<br />
inappropriate identification (e.g.<br />
monitoring data, review of policies,<br />
practices, and procedures under 618(d),<br />
etc.).<br />
State<br />
Rate<br />
State<br />
Target<br />
88.00%<br />
96.00%<br />
State<br />
Target<br />
0.00% 0.00%<br />
LEA<br />
Rate<br />
— —<br />
98.73%<br />
Indicator 10: Disproportionality-Child with a Disability<br />
Disproportionate representation of racial<br />
and ethnic groups in specific disability<br />
categories that is a result of inappropriate<br />
identification (e.g. monitoring data, review<br />
of policies, practices, and procedures under<br />
618(d), etc.).<br />
Indicator 11: Child Find<br />
Percent of children with<br />
parental consent to evaluate<br />
who are evaluated within<br />
the State established timeline<br />
of 60 days.<br />
Overall<br />
(3-21)<br />
Early Childhood<br />
(3-5)<br />
School Age<br />
(5-21)<br />
State<br />
Rate<br />
0.00%<br />
Indicator 12: Early Childhood Transition<br />
Percent of children referred by Part C prior to<br />
age 3, who are found eligible for Part B, and<br />
who have an IEP developed and implemented<br />
by their third birthday.<br />
Note: - - denotes not applicable<br />
State<br />
Rate<br />
99.41%<br />
99.70%<br />
98.97%<br />
State<br />
Rate<br />
State<br />
Target<br />
0.00%<br />
State<br />
Target<br />
100.00%<br />
100.00%<br />
100.00%<br />
State<br />
Target<br />
Target Met by<br />
LEA (Y/N)<br />
Y<br />
Target Met by<br />
LEA (Y/N)<br />
Y<br />
LEA<br />
Rate<br />
100.00%<br />
— —<br />
100.00%<br />
LEA<br />
Rate<br />
Target Met by<br />
LEA (Y/N)<br />
N/A<br />
Y<br />
Note: The target for Indicator 09 is to have zero percent<br />
(0%) of districts identified as having disproportionate<br />
representation as a result of inappropriate<br />
identification in eligibility.<br />
Note: The target for Indicator 10 is to have zero<br />
percent (0%) of districts identified as having<br />
disproportionate representation as a result of<br />
inappropriate identification in a disability<br />
category.<br />
Target Met by<br />
LEA (Y/N)<br />
N/A<br />
Y<br />
Target Met<br />
by LEA<br />
(Y/N)<br />
99.21% 100.00% - - N/A<br />
Y<br />
Note: * Indicates a zero reponse rate for the<br />
district.<br />
Page 4 of 5
LEA: 1106 - RECTOR SCHOOL <strong>DISTRICT</strong><br />
Indicator 13: Secondary Transition<br />
Percent of youth with disabilities aged 16 and<br />
up with an IEP that includes coordinated,<br />
measurable, annual IEP goals and transition<br />
services that will reasonably enable the student<br />
to meet the post-secondary goals.<br />
Indicator 14: Post-School Outcomes<br />
A. Percent of youth enrolled in higher<br />
education within one year of leaving high<br />
school.<br />
State<br />
Rate<br />
State<br />
Target<br />
Note: Data for this Indicator is from the on-site monitoring of LEAs for the given year.<br />
B. Percent of youth enrolled in higher<br />
education or competitively employed<br />
within one year of leaving high school.<br />
C. Percent of youth enrolled in higher<br />
education or in some other postsecondary<br />
education or training program; or<br />
competitively employed or in some other<br />
employment within one year of leaving<br />
high school.<br />
State<br />
Rate<br />
Indicator 20: Reported Data-Timely and Accurate*<br />
District submitted<br />
required data elements<br />
on or before due dates;<br />
made revisions within<br />
the alloted reveiw<br />
periods.<br />
Accurate and Timely<br />
Data Submission<br />
Overall (3-21)<br />
Early Childhood (3-5)<br />
School Age (5-21)<br />
State<br />
Target<br />
100.00%<br />
100.00%<br />
100.00%<br />
State<br />
Target<br />
LEA<br />
Rate<br />
LEA<br />
Rate<br />
Target Met by<br />
LEA (Y/N)<br />
Target Met<br />
by LEA<br />
(Y/N)<br />
Target Met<br />
by LEA<br />
(Y/N)<br />
*Data reviewed for timely and accurate submissions included all APSCN cycle data except for personnel<br />
Note: - - denotes not applicable<br />
96.19 100.00 — — N/A<br />
14.53<br />
State<br />
Rate<br />
49.42<br />
State<br />
Rate<br />
54.07<br />
13.00<br />
State<br />
Target<br />
49.00<br />
State<br />
Target<br />
60.00<br />
Y<br />
N/A<br />
Y<br />
0.00%<br />
LEA<br />
Rate<br />
66.67%<br />
LEA<br />
Rate<br />
66.67%<br />
N<br />
Target Met<br />
by LEA<br />
(Y/N)<br />
Y<br />
Target Met<br />
by LEA<br />
(Y/N)<br />
Y<br />
Page 5 of 5
LEA: 1201 - CONCORD SCHOOL <strong>DISTRICT</strong><br />
<strong>ARKANSAS</strong> <strong>SPECIAL</strong> <strong>EDUCATION</strong><br />
<strong>DISTRICT</strong> <strong>ANNUAL</strong> PERFORMANCE REPORT<br />
2010/11 School Year<br />
Publication Date: March 2012<br />
Each State must have in place a State Performance Plan (SPP) to evaluate the State's efforts to meet the requirements and<br />
purposes of the implementation of the Individuals with Disabilities Education Act (IDEA). The SPP is a six-year plan, which<br />
describes Arkansas's performance on 20 indicators. The Office of Special Education Programs in the U. S. Department of<br />
Education requires that States report annually to the public on the performance of each local education agency (LEA) on 14 of<br />
20 indicators as compared with targets established by the State in the SPP. Arkansas will report indicators 1 through 14 and<br />
20 for each LEA serving children with disabilities (CWD). Any LEA not meeting targets on compliance indicators (0% for<br />
Indicators 4B, 09 & 10 and 100% for Indicators 11, 12, 13, and 20) are non-compliant with IDEA.<br />
There are no report changes for the 2010/11 school year profile; However, it is important to recognize that: .<br />
1. Indicator 01 (Graduation) is reported a year in arrear (2009/10 graduates) and is based on a four-year cohort. This<br />
means the rate is a measure of students who entered in ninth grade and graduate in four years. The calculation is a<br />
requirement under Title I of the Elementary and Secondary Education Act (ESEA).<br />
2. Indicator 02 (Drop out) is reported a year in arrear. This means the rate is a measure of students who dropped out in<br />
the 2009/10 school year. The Indicator 02 data are aligned with the Common Core of Data (CCD) requirements for<br />
grades 7-12.<br />
3. Indicator 04A and 4B (Suspension/Expulsion) is reported a year in arrear. This means the rate is a measure of<br />
students who had out-of-school suspensions and/or expulsions totaling more than 10 days.<br />
Percent of youth<br />
with IEPs<br />
graduating from<br />
high school with a<br />
regular diploma<br />
For a complete description of all the Indicators, please visit the special education website at<br />
http://arksped.k12.ar.us/sections/policy.html<br />
Indicator 01: Graduation Rates (2009/10 school year) Indicator 02: Dropout Rates (2009/10 school year)<br />
State<br />
Rate<br />
State<br />
Target<br />
75.76% 85.00%<br />
LEA<br />
Rate<br />
87.50%<br />
Target Met<br />
by LEA<br />
(Y/N)<br />
Y<br />
Percent of<br />
youth with<br />
IEPs dropping<br />
out of high<br />
school<br />
State<br />
Rate<br />
Indicator 03: Assessment on Statewide Benchmark Exam (grades 3-8, 11)<br />
A) Adequate Yearly Progress<br />
n=40<br />
Literacy<br />
Mathematics<br />
Met Disability Subgroup "n"<br />
for Reporting Purposes (Y/N)<br />
State Target for % of Districts Meeting<br />
AYP for Disability Subgroup<br />
State<br />
Target<br />
3.06% 4.20%<br />
LEA<br />
Rate<br />
0.00%<br />
% of Districts Meeting AYP<br />
for Disability Subgroup<br />
Target Met by<br />
LEA (Y/N)<br />
Y<br />
Target Met by<br />
LEA(Y/N)<br />
Overall N 17.15% 6.25%<br />
NA<br />
N<br />
N<br />
Note: For a district to qualify as having a disability subgroup it must have a minimum of 40 (n=40) students with disabilities in a school building.<br />
B) Participation<br />
Participation Rate: # of<br />
CWD Tested ÷ # of CWD<br />
Enrolled in grades tested.<br />
Participation Rate: Literacy<br />
Participation Rate: Math<br />
Note: - - denotes not applicable<br />
State<br />
Rate<br />
98.78%<br />
State<br />
Target<br />
95.00%<br />
LEA<br />
Rate<br />
100.00%<br />
Target Met<br />
by LEA (Y/N)<br />
98.61% 95.00% 100.00% Y<br />
Y<br />
C) Performance Proficiency<br />
Percent of CWD Scoring<br />
Proficient or Above<br />
Proficiency Rate: Literacy<br />
Proficiency Rate:<br />
Mathematics<br />
16.00%<br />
16.00%<br />
State<br />
Rate<br />
31.49%<br />
44.86%<br />
State<br />
Target<br />
45.22%<br />
51.14%<br />
LEA<br />
Rate<br />
40.48%<br />
56.25%<br />
NA<br />
NA<br />
Target<br />
Met by<br />
LEA (Y/N)<br />
N<br />
Y<br />
Page 1 of 5
LEA: 1201 - CONCORD SCHOOL <strong>DISTRICT</strong><br />
Indicator 04: Out-of-School Suspensions and Expulsions (2009/10 school year)<br />
A) Suspension/Expulsion<br />
Percent difference of CWD with out-of- school suspensions and<br />
expulsions totaling greater than 10 days in a school year as<br />
compared to the same data for general education students in<br />
the district.<br />
B) Suspension/Expulsion by Race and Ethnicity<br />
Percent of districts that have: (a) a significant discrepancy, by race or<br />
ethnicity, in the rate of suspensions and expulsions of greater than 10<br />
days in a school year for children with IEPs; and (b) policies,<br />
procedures or practices that contribute to the significant discrepancy<br />
and do not comply with requirements relating to the development<br />
and implementation of IEPs, the use of positive behavioral<br />
interventions and supports, and procedural safeguards.<br />
Indicator 05: School Age (5-21) Least Restrictive Environment<br />
A) In the Regular Class 80% or more of the day<br />
Percent of CWD with<br />
IEPs receiving instruction<br />
in the regular class 80%<br />
or more of the day.<br />
State<br />
Rate<br />
State<br />
Target<br />
LEA<br />
Rate<br />
B) In the Regular Class less than 40% of the day<br />
Percent of CWD with<br />
IEPs receiving instruction<br />
in the regular class less<br />
than 60% of the day.<br />
53.87% 59.77%<br />
State<br />
Rate<br />
State<br />
Target<br />
12.42% 12.51%<br />
60.00%<br />
LEA<br />
Rate<br />
2.67%<br />
C) Other Settings outside the regular class<br />
Percent of CWD with IEPs served in<br />
public or private separate schools,<br />
residential placements, or<br />
homebound/hospital placements.<br />
State<br />
Rate<br />
State<br />
Target<br />
2.80% 2.56%<br />
Target Met<br />
by LEA (Y/N)<br />
Y<br />
Target Met<br />
by LEA (Y/N)<br />
Y<br />
LEA<br />
Rate<br />
1.33%<br />
Target Met<br />
by LEA(Y/N)<br />
Indicator 06: Early Childhood (3-5) Least Restrictive Environment<br />
A) Regular Early Childhood Program<br />
Percent of children (aged 3 through 5) with IEPs attending a regular<br />
early childhood program and receiving the majority of special<br />
education and related services in the regular early childhood program<br />
Allowable<br />
Difference<br />
LEA: 1201 - CONCORD SCHOOL <strong>DISTRICT</strong><br />
Indicator 07: Preschool (3-5) Outcomes<br />
a) Percent of preschool CWD<br />
children who did not<br />
improve functioning.<br />
b) Percent of preschool CWD<br />
who improved but whose<br />
functioning remained below<br />
same age peers.<br />
c) Percent of preschool CWD<br />
who improved at a level<br />
nearer to same aged peers.<br />
d) Percent of preschool CWD<br />
who improved functioning to<br />
reach a level comparable to<br />
same age peers.<br />
e) Percent of preschool CWD<br />
children who maintain<br />
functioning at a level<br />
comparable to same aged<br />
peers.<br />
Summary<br />
Statements<br />
1) Of those preschool<br />
children who entered<br />
the preschool program<br />
below age expectations<br />
in each Outcome, the<br />
percent who<br />
substantially increased<br />
their rate of growth by<br />
the time they turned 6<br />
years of age or exited<br />
the program.<br />
2) The percent of<br />
preschool children who<br />
were functioning<br />
within age expectations<br />
in each Outcome by the<br />
time they turned 6<br />
years of age or exited<br />
A) Positive Social -Emotional<br />
Skills*<br />
State<br />
Rate<br />
A) Positive Social -<br />
Emotional Skills<br />
(Including social<br />
relationships)<br />
State<br />
Rate<br />
2.14%<br />
5.31%<br />
25.97%<br />
38.22%<br />
28.36%<br />
State<br />
Target<br />
LEA<br />
Rate<br />
LEA<br />
Rate<br />
— —<br />
— —<br />
— —<br />
— —<br />
— —<br />
Target<br />
Met by<br />
LEA(Y/N)<br />
B) Acquisition and Use of<br />
Knowledge and Skills<br />
(Including early language/<br />
communication and early literacy)<br />
B) Acquisition and Use of<br />
Knowledge and Skills **<br />
State<br />
Rate<br />
1.75%<br />
6.59%<br />
34.23%<br />
43.51%<br />
13.92%<br />
State<br />
Target<br />
LEA<br />
Rate<br />
Target<br />
Met by<br />
LEA(Y/N)<br />
C) Use of Appropriate Behaviors<br />
to Meet Their Needs<br />
State<br />
Rate<br />
State<br />
Target<br />
LEA<br />
Rate<br />
Target<br />
Met by<br />
LEA(Y/N)<br />
89.61% 90.50% — — N/A 90.31% 90.50% — — N/A 90.82% 92.50% — — N/A<br />
66.58% 69.50% — — N/A 57.43% 60.50% — — N/A 76.69% 78.50% — — N/A<br />
NOTE: * Including social relationships ** Including early language/ communication and early literacy<br />
Note: - - denotes not applicable<br />
State<br />
Rate<br />
LEA<br />
Rate<br />
— —<br />
— —<br />
— —<br />
— —<br />
— —<br />
C) Use of<br />
Appropriate<br />
Behaviors to<br />
Meet Their Needs<br />
State<br />
Rate<br />
4.51%<br />
17.34%<br />
41.72%<br />
34.97%<br />
LEA<br />
Rate<br />
1.46% — —<br />
— —<br />
— —<br />
— —<br />
— —<br />
Page 3 of 5
LEA: 1201 - CONCORD SCHOOL <strong>DISTRICT</strong><br />
Indicator 08: Parent Involvement<br />
Percent of surveyed<br />
parents who reported<br />
school facilitated parent<br />
involvement as a means<br />
of improving services<br />
and results for children<br />
with disabilities.<br />
Early Childhood<br />
(3-5)<br />
School Age<br />
(5-21)<br />
State<br />
Rate<br />
90.47%<br />
95.05%<br />
Indicator 09: Disproportionality - Eligibility<br />
Disproportionate representation of racial<br />
and ethnic groups in special education and<br />
related services that is a result of<br />
inappropriate identification (e.g.<br />
monitoring data, review of policies,<br />
practices, and procedures under 618(d),<br />
etc.).<br />
State<br />
Rate<br />
State<br />
Target<br />
88.00%<br />
96.00%<br />
State<br />
Target<br />
0.00% 0.00%<br />
LEA<br />
Rate<br />
— —<br />
89.66%<br />
Indicator 10: Disproportionality-Child with a Disability<br />
Disproportionate representation of racial<br />
and ethnic groups in specific disability<br />
categories that is a result of inappropriate<br />
identification (e.g. monitoring data, review<br />
of policies, practices, and procedures under<br />
618(d), etc.).<br />
Indicator 11: Child Find<br />
Percent of children with<br />
parental consent to evaluate<br />
who are evaluated within<br />
the State established timeline<br />
of 60 days.<br />
Overall<br />
(3-21)<br />
Early Childhood<br />
(3-5)<br />
School Age<br />
(5-21)<br />
State<br />
Rate<br />
0.00%<br />
Indicator 12: Early Childhood Transition<br />
Percent of children referred by Part C prior to<br />
age 3, who are found eligible for Part B, and<br />
who have an IEP developed and implemented<br />
by their third birthday.<br />
Note: - - denotes not applicable<br />
State<br />
Rate<br />
99.41%<br />
99.70%<br />
98.97%<br />
State<br />
Rate<br />
State<br />
Target<br />
0.00%<br />
State<br />
Target<br />
100.00%<br />
100.00%<br />
100.00%<br />
State<br />
Target<br />
Target Met by<br />
LEA (Y/N)<br />
Y<br />
Target Met by<br />
LEA (Y/N)<br />
Y<br />
LEA<br />
Rate<br />
100.00%<br />
— —<br />
100.00%<br />
LEA<br />
Rate<br />
Target Met by<br />
LEA (Y/N)<br />
N/A<br />
N<br />
Note: The target for Indicator 09 is to have zero percent<br />
(0%) of districts identified as having disproportionate<br />
representation as a result of inappropriate<br />
identification in eligibility.<br />
Note: The target for Indicator 10 is to have zero<br />
percent (0%) of districts identified as having<br />
disproportionate representation as a result of<br />
inappropriate identification in a disability<br />
category.<br />
Target Met by<br />
LEA (Y/N)<br />
N/A<br />
Y<br />
Target Met<br />
by LEA<br />
(Y/N)<br />
99.21% 100.00% - - N/A<br />
Y<br />
Note: * Indicates a zero reponse rate for the<br />
district.<br />
Page 4 of 5
LEA: 1201 - CONCORD SCHOOL <strong>DISTRICT</strong><br />
Indicator 13: Secondary Transition<br />
Percent of youth with disabilities aged 16 and<br />
up with an IEP that includes coordinated,<br />
measurable, annual IEP goals and transition<br />
services that will reasonably enable the student<br />
to meet the post-secondary goals.<br />
Indicator 14: Post-School Outcomes<br />
A. Percent of youth enrolled in higher<br />
education within one year of leaving high<br />
school.<br />
State<br />
Rate<br />
State<br />
Target<br />
Note: Data for this Indicator is from the on-site monitoring of LEAs for the given year.<br />
B. Percent of youth enrolled in higher<br />
education or competitively employed<br />
within one year of leaving high school.<br />
C. Percent of youth enrolled in higher<br />
education or in some other postsecondary<br />
education or training program; or<br />
competitively employed or in some other<br />
employment within one year of leaving<br />
high school.<br />
State<br />
Rate<br />
Indicator 20: Reported Data-Timely and Accurate*<br />
District submitted<br />
required data elements<br />
on or before due dates;<br />
made revisions within<br />
the alloted reveiw<br />
periods.<br />
Accurate and Timely<br />
Data Submission<br />
Overall (3-21)<br />
Early Childhood (3-5)<br />
School Age (5-21)<br />
State<br />
Target<br />
100.00%<br />
100.00%<br />
100.00%<br />
State<br />
Target<br />
LEA<br />
Rate<br />
LEA<br />
Rate<br />
Target Met by<br />
LEA (Y/N)<br />
Target Met<br />
by LEA<br />
(Y/N)<br />
Target Met<br />
by LEA<br />
(Y/N)<br />
*Data reviewed for timely and accurate submissions included all APSCN cycle data except for personnel<br />
Note: - - denotes not applicable<br />
96.19 100.00 100.00% Y<br />
14.53<br />
State<br />
Rate<br />
49.42<br />
State<br />
Rate<br />
54.07<br />
13.00<br />
State<br />
Target<br />
49.00<br />
State<br />
Target<br />
60.00<br />
Y<br />
N/A<br />
Y<br />
— —<br />
LEA<br />
Rate<br />
— —<br />
LEA<br />
Rate<br />
— —<br />
N/A<br />
Target Met<br />
by LEA<br />
(Y/N)<br />
N/A<br />
Target Met<br />
by LEA<br />
(Y/N)<br />
N/A<br />
Page 5 of 5
<strong>ARKANSAS</strong> <strong>SPECIAL</strong> <strong>EDUCATION</strong><br />
<strong>DISTRICT</strong> <strong>ANNUAL</strong> PERFORMANCE REPORT<br />
2010/11 School Year<br />
Publication Date: March 2012<br />
Each State must have in place a State Performance Plan (SPP) to evaluate the State's efforts to meet the requirements and<br />
purposes of the implementation of the Individuals with Disabilities Education Act (IDEA). The SPP is a six-year plan, which<br />
describes Arkansas's performance on 20 indicators. The Office of Special Education Programs in the U. S. Department of<br />
Education requires that States report annually to the public on the performance of each local education agency (LEA) on 14 of<br />
20 indicators as compared with targets established by the State in the SPP. Arkansas will report indicators 1 through 14 and<br />
20 for each LEA serving children with disabilities (CWD). Any LEA not meeting targets on compliance indicators (0% for<br />
Indicators 4B, 09 & 10 and 100% for Indicators 11, 12, 13, and 20) are non-compliant with IDEA.<br />
There are no report changes for the 2010/11 school year profile; However, it is important to recognize that: .<br />
1. Indicator 01 (Graduation) is reported a year in arrear (2009/10 graduates) and is based on a four-year cohort. This<br />
means the rate is a measure of students who entered in ninth grade and graduate in four years. The calculation is a<br />
requirement under Title I of the Elementary and Secondary Education Act (ESEA).<br />
2. Indicator 02 (Drop out) is reported a year in arrear. This means the rate is a measure of students who dropped out in<br />
the 2009/10 school year. The Indicator 02 data are aligned with the Common Core of Data (CCD) requirements for<br />
grades 7-12.<br />
3. Indicator 04A and 4B (Suspension/Expulsion) is reported a year in arrear. This means the rate is a measure of<br />
students who had out-of-school suspensions and/or expulsions totaling more than 10 days.<br />
For a complete description of all the Indicators, please visit the special education website at<br />
http://arksped.k12.ar.us/sections/policy.html<br />
LEA: 1202 - HEBER SPRINGS SCHOOL <strong>DISTRICT</strong><br />
Indicator 01: Graduation Rates (2009/10 school year) Indicator 02: Dropout Rates (2009/10 school year)<br />
Percent of youth<br />
with IEPs<br />
graduating from<br />
high school with a<br />
regular diploma<br />
State<br />
Rate<br />
State<br />
Target<br />
75.76% 85.00%<br />
LEA<br />
Rate<br />
78.95%<br />
Target Met<br />
by LEA<br />
(Y/N)<br />
N<br />
Percent of<br />
youth with<br />
IEPs dropping<br />
out of high<br />
school<br />
State<br />
Rate<br />
Indicator 03: Assessment on Statewide Benchmark Exam (grades 3-8, 11)<br />
A) Adequate Yearly Progress<br />
n=40<br />
Literacy<br />
Mathematics<br />
Met Disability Subgroup "n"<br />
for Reporting Purposes (Y/N)<br />
State Target for % of Districts Meeting<br />
AYP for Disability Subgroup<br />
State<br />
Target<br />
3.06% 4.20%<br />
LEA<br />
Rate<br />
2.90%<br />
% of Districts Meeting AYP<br />
for Disability Subgroup<br />
Target Met by<br />
LEA (Y/N)<br />
Y<br />
Target Met by<br />
LEA(Y/N)<br />
Overall N 17.15% 6.25%<br />
NA<br />
N<br />
N<br />
Note: For a district to qualify as having a disability subgroup it must have a minimum of 40 (n=40) students with disabilities in a school building.<br />
B) Participation<br />
Participation Rate: # of<br />
CWD Tested ÷ # of CWD<br />
Enrolled in grades tested.<br />
Participation Rate: Literacy<br />
Participation Rate: Math<br />
Note: - - denotes not applicable<br />
State<br />
Rate<br />
98.78%<br />
State<br />
Target<br />
95.00%<br />
LEA<br />
Rate<br />
98.90%<br />
Target Met<br />
by LEA (Y/N)<br />
98.61% 95.00% 97.89% Y<br />
Y<br />
C) Performance Proficiency<br />
Percent of CWD Scoring<br />
Proficient or Above<br />
Proficiency Rate: Literacy<br />
Proficiency Rate:<br />
Mathematics<br />
16.00%<br />
16.00%<br />
State<br />
Rate<br />
31.49%<br />
44.86%<br />
State<br />
Target<br />
45.22%<br />
51.14%<br />
LEA<br />
Rate<br />
18.82%<br />
35.23%<br />
NA<br />
NA<br />
Target<br />
Met by<br />
LEA (Y/N)<br />
N<br />
N<br />
Page 1 of 5
LEA: 1202 - HEBER SPRINGS SCHOOL <strong>DISTRICT</strong><br />
Indicator 04: Out-of-School Suspensions and Expulsions (2009/10 school year)<br />
A) Suspension/Expulsion<br />
Percent difference of CWD with out-of- school suspensions and<br />
expulsions totaling greater than 10 days in a school year as<br />
compared to the same data for general education students in<br />
the district.<br />
B) Suspension/Expulsion by Race and Ethnicity<br />
Percent of districts that have: (a) a significant discrepancy, by race or<br />
ethnicity, in the rate of suspensions and expulsions of greater than 10<br />
days in a school year for children with IEPs; and (b) policies,<br />
procedures or practices that contribute to the significant discrepancy<br />
and do not comply with requirements relating to the development<br />
and implementation of IEPs, the use of positive behavioral<br />
interventions and supports, and procedural safeguards.<br />
Indicator 05: School Age (5-21) Least Restrictive Environment<br />
A) In the Regular Class 80% or more of the day<br />
Percent of CWD with<br />
IEPs receiving instruction<br />
in the regular class 80%<br />
or more of the day.<br />
State<br />
Rate<br />
State<br />
Target<br />
LEA<br />
Rate<br />
B) In the Regular Class less than 40% of the day<br />
Percent of CWD with<br />
IEPs receiving instruction<br />
in the regular class less<br />
than 60% of the day.<br />
53.87% 59.77%<br />
State<br />
Rate<br />
State<br />
Target<br />
12.42% 12.51%<br />
60.24%<br />
LEA<br />
Rate<br />
9.64%<br />
C) Other Settings outside the regular class<br />
Percent of CWD with IEPs served in<br />
public or private separate schools,<br />
residential placements, or<br />
homebound/hospital placements.<br />
State<br />
Rate<br />
State<br />
Target<br />
2.80% 2.56%<br />
Target Met<br />
by LEA (Y/N)<br />
Y<br />
Target Met<br />
by LEA (Y/N)<br />
Y<br />
LEA<br />
Rate<br />
1.20%<br />
Target Met<br />
by LEA(Y/N)<br />
Indicator 06: Early Childhood (3-5) Least Restrictive Environment<br />
A) Regular Early Childhood Program<br />
Percent of children (aged 3 through 5) with IEPs attending a regular<br />
early childhood program and receiving the majority of special<br />
education and related services in the regular early childhood program<br />
Allowable<br />
Difference<br />
LEA: 1202 - HEBER SPRINGS SCHOOL <strong>DISTRICT</strong><br />
Indicator 07: Preschool (3-5) Outcomes<br />
a) Percent of preschool CWD<br />
children who did not<br />
improve functioning.<br />
b) Percent of preschool CWD<br />
who improved but whose<br />
functioning remained below<br />
same age peers.<br />
c) Percent of preschool CWD<br />
who improved at a level<br />
nearer to same aged peers.<br />
d) Percent of preschool CWD<br />
who improved functioning to<br />
reach a level comparable to<br />
same age peers.<br />
e) Percent of preschool CWD<br />
children who maintain<br />
functioning at a level<br />
comparable to same aged<br />
peers.<br />
Summary<br />
Statements<br />
1) Of those preschool<br />
children who entered<br />
the preschool program<br />
below age expectations<br />
in each Outcome, the<br />
percent who<br />
substantially increased<br />
their rate of growth by<br />
the time they turned 6<br />
years of age or exited<br />
the program.<br />
2) The percent of<br />
preschool children who<br />
were functioning<br />
within age expectations<br />
in each Outcome by the<br />
time they turned 6<br />
years of age or exited<br />
A) Positive Social -Emotional<br />
Skills*<br />
State<br />
Rate<br />
A) Positive Social -<br />
Emotional Skills<br />
(Including social<br />
relationships)<br />
State<br />
Rate<br />
2.14%<br />
5.31%<br />
25.97%<br />
38.22%<br />
28.36%<br />
State<br />
Target<br />
LEA<br />
Rate<br />
LEA<br />
Rate<br />
— —<br />
— —<br />
— —<br />
— —<br />
— —<br />
Target<br />
Met by<br />
LEA(Y/N)<br />
B) Acquisition and Use of<br />
Knowledge and Skills<br />
(Including early language/<br />
communication and early literacy)<br />
B) Acquisition and Use of<br />
Knowledge and Skills **<br />
State<br />
Rate<br />
1.75%<br />
6.59%<br />
34.23%<br />
43.51%<br />
13.92%<br />
State<br />
Target<br />
LEA<br />
Rate<br />
Target<br />
Met by<br />
LEA(Y/N)<br />
C) Use of Appropriate Behaviors<br />
to Meet Their Needs<br />
State<br />
Rate<br />
State<br />
Target<br />
LEA<br />
Rate<br />
Target<br />
Met by<br />
LEA(Y/N)<br />
89.61% 90.50% — — N/A 90.31% 90.50% — — N/A 90.82% 92.50% — — N/A<br />
66.58% 69.50% — — N/A 57.43% 60.50% — — N/A 76.69% 78.50% — — N/A<br />
NOTE: * Including social relationships ** Including early language/ communication and early literacy<br />
Note: - - denotes not applicable<br />
State<br />
Rate<br />
LEA<br />
Rate<br />
— —<br />
— —<br />
— —<br />
— —<br />
— —<br />
C) Use of<br />
Appropriate<br />
Behaviors to<br />
Meet Their Needs<br />
State<br />
Rate<br />
4.51%<br />
17.34%<br />
41.72%<br />
34.97%<br />
LEA<br />
Rate<br />
1.46% — —<br />
— —<br />
— —<br />
— —<br />
— —<br />
Page 3 of 5
LEA: 1202 - HEBER SPRINGS SCHOOL <strong>DISTRICT</strong><br />
Indicator 08: Parent Involvement<br />
Percent of surveyed<br />
parents who reported<br />
school facilitated parent<br />
involvement as a means<br />
of improving services<br />
and results for children<br />
with disabilities.<br />
Early Childhood<br />
(3-5)<br />
School Age<br />
(5-21)<br />
State<br />
Rate<br />
90.47%<br />
95.05%<br />
Indicator 09: Disproportionality - Eligibility<br />
Disproportionate representation of racial<br />
and ethnic groups in special education and<br />
related services that is a result of<br />
inappropriate identification (e.g.<br />
monitoring data, review of policies,<br />
practices, and procedures under 618(d),<br />
etc.).<br />
State<br />
Rate<br />
State<br />
Target<br />
88.00%<br />
96.00%<br />
State<br />
Target<br />
0.00% 0.00%<br />
LEA<br />
Rate<br />
— —<br />
89.80%<br />
Indicator 10: Disproportionality-Child with a Disability<br />
Disproportionate representation of racial<br />
and ethnic groups in specific disability<br />
categories that is a result of inappropriate<br />
identification (e.g. monitoring data, review<br />
of policies, practices, and procedures under<br />
618(d), etc.).<br />
Indicator 11: Child Find<br />
Percent of children with<br />
parental consent to evaluate<br />
who are evaluated within<br />
the State established timeline<br />
of 60 days.<br />
Overall<br />
(3-21)<br />
Early Childhood<br />
(3-5)<br />
School Age<br />
(5-21)<br />
State<br />
Rate<br />
0.00%<br />
Indicator 12: Early Childhood Transition<br />
Percent of children referred by Part C prior to<br />
age 3, who are found eligible for Part B, and<br />
who have an IEP developed and implemented<br />
by their third birthday.<br />
Note: - - denotes not applicable<br />
State<br />
Rate<br />
99.41%<br />
99.70%<br />
98.97%<br />
State<br />
Rate<br />
State<br />
Target<br />
0.00%<br />
State<br />
Target<br />
100.00%<br />
100.00%<br />
100.00%<br />
State<br />
Target<br />
Target Met by<br />
LEA (Y/N)<br />
Y<br />
Target Met by<br />
LEA (Y/N)<br />
Y<br />
LEA<br />
Rate<br />
100.00%<br />
— —<br />
100.00%<br />
LEA<br />
Rate<br />
Target Met by<br />
LEA (Y/N)<br />
N/A<br />
N<br />
Note: The target for Indicator 09 is to have zero percent<br />
(0%) of districts identified as having disproportionate<br />
representation as a result of inappropriate<br />
identification in eligibility.<br />
Note: The target for Indicator 10 is to have zero<br />
percent (0%) of districts identified as having<br />
disproportionate representation as a result of<br />
inappropriate identification in a disability<br />
category.<br />
Target Met by<br />
LEA (Y/N)<br />
N/A<br />
Y<br />
Target Met<br />
by LEA<br />
(Y/N)<br />
99.21% 100.00% - - N/A<br />
Y<br />
Note: * Indicates a zero reponse rate for the<br />
district.<br />
Page 4 of 5
LEA: 1202 - HEBER SPRINGS SCHOOL <strong>DISTRICT</strong><br />
Indicator 13: Secondary Transition<br />
Percent of youth with disabilities aged 16 and<br />
up with an IEP that includes coordinated,<br />
measurable, annual IEP goals and transition<br />
services that will reasonably enable the student<br />
to meet the post-secondary goals.<br />
Indicator 14: Post-School Outcomes<br />
A. Percent of youth enrolled in higher<br />
education within one year of leaving high<br />
school.<br />
State<br />
Rate<br />
State<br />
Target<br />
Note: Data for this Indicator is from the on-site monitoring of LEAs for the given year.<br />
B. Percent of youth enrolled in higher<br />
education or competitively employed<br />
within one year of leaving high school.<br />
C. Percent of youth enrolled in higher<br />
education or in some other postsecondary<br />
education or training program; or<br />
competitively employed or in some other<br />
employment within one year of leaving<br />
high school.<br />
State<br />
Rate<br />
Indicator 20: Reported Data-Timely and Accurate*<br />
District submitted<br />
required data elements<br />
on or before due dates;<br />
made revisions within<br />
the alloted reveiw<br />
periods.<br />
Accurate and Timely<br />
Data Submission<br />
Overall (3-21)<br />
Early Childhood (3-5)<br />
School Age (5-21)<br />
State<br />
Target<br />
100.00%<br />
100.00%<br />
100.00%<br />
State<br />
Target<br />
LEA<br />
Rate<br />
LEA<br />
Rate<br />
Target Met by<br />
LEA (Y/N)<br />
Target Met<br />
by LEA<br />
(Y/N)<br />
Target Met<br />
by LEA<br />
(Y/N)<br />
*Data reviewed for timely and accurate submissions included all APSCN cycle data except for personnel<br />
Note: - - denotes not applicable<br />
96.19 100.00 — — N/A<br />
14.53<br />
State<br />
Rate<br />
49.42<br />
State<br />
Rate<br />
54.07<br />
13.00<br />
State<br />
Target<br />
49.00<br />
State<br />
Target<br />
60.00<br />
Y<br />
N/A<br />
Y<br />
16.67%<br />
LEA<br />
Rate<br />
50.00%<br />
LEA<br />
Rate<br />
50.00%<br />
Y<br />
Target Met<br />
by LEA<br />
(Y/N)<br />
Y<br />
Target Met<br />
by LEA<br />
(Y/N)<br />
N<br />
Page 5 of 5
LEA: 1203 - QUITMAN SCHOOL <strong>DISTRICT</strong><br />
<strong>ARKANSAS</strong> <strong>SPECIAL</strong> <strong>EDUCATION</strong><br />
<strong>DISTRICT</strong> <strong>ANNUAL</strong> PERFORMANCE REPORT<br />
2010/11 School Year<br />
Publication Date: March 2012<br />
Each State must have in place a State Performance Plan (SPP) to evaluate the State's efforts to meet the requirements and<br />
purposes of the implementation of the Individuals with Disabilities Education Act (IDEA). The SPP is a six-year plan, which<br />
describes Arkansas's performance on 20 indicators. The Office of Special Education Programs in the U. S. Department of<br />
Education requires that States report annually to the public on the performance of each local education agency (LEA) on 14 of<br />
20 indicators as compared with targets established by the State in the SPP. Arkansas will report indicators 1 through 14 and<br />
20 for each LEA serving children with disabilities (CWD). Any LEA not meeting targets on compliance indicators (0% for<br />
Indicators 4B, 09 & 10 and 100% for Indicators 11, 12, 13, and 20) are non-compliant with IDEA.<br />
There are no report changes for the 2010/11 school year profile; However, it is important to recognize that: .<br />
1. Indicator 01 (Graduation) is reported a year in arrear (2009/10 graduates) and is based on a four-year cohort. This<br />
means the rate is a measure of students who entered in ninth grade and graduate in four years. The calculation is a<br />
requirement under Title I of the Elementary and Secondary Education Act (ESEA).<br />
2. Indicator 02 (Drop out) is reported a year in arrear. This means the rate is a measure of students who dropped out in<br />
the 2009/10 school year. The Indicator 02 data are aligned with the Common Core of Data (CCD) requirements for<br />
grades 7-12.<br />
3. Indicator 04A and 4B (Suspension/Expulsion) is reported a year in arrear. This means the rate is a measure of<br />
students who had out-of-school suspensions and/or expulsions totaling more than 10 days.<br />
Percent of youth<br />
with IEPs<br />
graduating from<br />
high school with a<br />
regular diploma<br />
For a complete description of all the Indicators, please visit the special education website at<br />
http://arksped.k12.ar.us/sections/policy.html<br />
Indicator 01: Graduation Rates (2009/10 school year) Indicator 02: Dropout Rates (2009/10 school year)<br />
State<br />
Rate<br />
State<br />
Target<br />
75.76% 85.00%<br />
LEA<br />
Rate<br />
100.00%<br />
Target Met<br />
by LEA<br />
(Y/N)<br />
Y<br />
Percent of<br />
youth with<br />
IEPs dropping<br />
out of high<br />
school<br />
State<br />
Rate<br />
Indicator 03: Assessment on Statewide Benchmark Exam (grades 3-8, 11)<br />
A) Adequate Yearly Progress<br />
n=40<br />
Literacy<br />
Mathematics<br />
Met Disability Subgroup "n"<br />
for Reporting Purposes (Y/N)<br />
State Target for % of Districts Meeting<br />
AYP for Disability Subgroup<br />
State<br />
Target<br />
3.06% 4.20%<br />
LEA<br />
Rate<br />
0.00%<br />
% of Districts Meeting AYP<br />
for Disability Subgroup<br />
Target Met by<br />
LEA (Y/N)<br />
Y<br />
Target Met by<br />
LEA(Y/N)<br />
Overall N 17.15% 6.25%<br />
NA<br />
N<br />
N<br />
Note: For a district to qualify as having a disability subgroup it must have a minimum of 40 (n=40) students with disabilities in a school building.<br />
B) Participation<br />
Participation Rate: # of<br />
CWD Tested ÷ # of CWD<br />
Enrolled in grades tested.<br />
Participation Rate: Literacy<br />
Participation Rate: Math<br />
Note: - - denotes not applicable<br />
State<br />
Rate<br />
98.78%<br />
State<br />
Target<br />
95.00%<br />
LEA<br />
Rate<br />
100.00%<br />
Target Met<br />
by LEA (Y/N)<br />
98.61% 95.00% 100.00% Y<br />
Y<br />
C) Performance Proficiency<br />
Percent of CWD Scoring<br />
Proficient or Above<br />
Proficiency Rate: Literacy<br />
Proficiency Rate:<br />
Mathematics<br />
16.00%<br />
16.00%<br />
State<br />
Rate<br />
31.49%<br />
44.86%<br />
State<br />
Target<br />
45.22%<br />
51.14%<br />
LEA<br />
Rate<br />
27.78%<br />
47.73%<br />
NA<br />
NA<br />
Target<br />
Met by<br />
LEA (Y/N)<br />
N<br />
N<br />
Page 1 of 5
LEA: 1203 - QUITMAN SCHOOL <strong>DISTRICT</strong><br />
Indicator 04: Out-of-School Suspensions and Expulsions (2009/10 school year)<br />
A) Suspension/Expulsion<br />
Percent difference of CWD with out-of- school suspensions and<br />
expulsions totaling greater than 10 days in a school year as<br />
compared to the same data for general education students in<br />
the district.<br />
B) Suspension/Expulsion by Race and Ethnicity<br />
Percent of districts that have: (a) a significant discrepancy, by race or<br />
ethnicity, in the rate of suspensions and expulsions of greater than 10<br />
days in a school year for children with IEPs; and (b) policies,<br />
procedures or practices that contribute to the significant discrepancy<br />
and do not comply with requirements relating to the development<br />
and implementation of IEPs, the use of positive behavioral<br />
interventions and supports, and procedural safeguards.<br />
Indicator 05: School Age (5-21) Least Restrictive Environment<br />
A) In the Regular Class 80% or more of the day<br />
Percent of CWD with<br />
IEPs receiving instruction<br />
in the regular class 80%<br />
or more of the day.<br />
State<br />
Rate<br />
State<br />
Target<br />
LEA<br />
Rate<br />
B) In the Regular Class less than 40% of the day<br />
Percent of CWD with<br />
IEPs receiving instruction<br />
in the regular class less<br />
than 60% of the day.<br />
53.87% 59.77%<br />
State<br />
Rate<br />
State<br />
Target<br />
12.42% 12.51%<br />
50.00%<br />
LEA<br />
Rate<br />
5.13%<br />
C) Other Settings outside the regular class<br />
Percent of CWD with IEPs served in<br />
public or private separate schools,<br />
residential placements, or<br />
homebound/hospital placements.<br />
State<br />
Rate<br />
State<br />
Target<br />
2.80% 2.56%<br />
Target Met<br />
by LEA (Y/N)<br />
N<br />
Target Met<br />
by LEA (Y/N)<br />
Y<br />
LEA<br />
Rate<br />
0.00%<br />
Target Met<br />
by LEA(Y/N)<br />
Indicator 06: Early Childhood (3-5) Least Restrictive Environment<br />
A) Regular Early Childhood Program<br />
Percent of children (aged 3 through 5) with IEPs attending a regular<br />
early childhood program and receiving the majority of special<br />
education and related services in the regular early childhood program<br />
Allowable<br />
Difference<br />
LEA: 1203 - QUITMAN SCHOOL <strong>DISTRICT</strong><br />
Indicator 07: Preschool (3-5) Outcomes<br />
a) Percent of preschool CWD<br />
children who did not<br />
improve functioning.<br />
b) Percent of preschool CWD<br />
who improved but whose<br />
functioning remained below<br />
same age peers.<br />
c) Percent of preschool CWD<br />
who improved at a level<br />
nearer to same aged peers.<br />
d) Percent of preschool CWD<br />
who improved functioning to<br />
reach a level comparable to<br />
same age peers.<br />
e) Percent of preschool CWD<br />
children who maintain<br />
functioning at a level<br />
comparable to same aged<br />
peers.<br />
Summary<br />
Statements<br />
1) Of those preschool<br />
children who entered<br />
the preschool program<br />
below age expectations<br />
in each Outcome, the<br />
percent who<br />
substantially increased<br />
their rate of growth by<br />
the time they turned 6<br />
years of age or exited<br />
the program.<br />
2) The percent of<br />
preschool children who<br />
were functioning<br />
within age expectations<br />
in each Outcome by the<br />
time they turned 6<br />
years of age or exited<br />
A) Positive Social -Emotional<br />
Skills*<br />
State<br />
Rate<br />
A) Positive Social -<br />
Emotional Skills<br />
(Including social<br />
relationships)<br />
State<br />
Rate<br />
2.14%<br />
5.31%<br />
25.97%<br />
38.22%<br />
28.36%<br />
State<br />
Target<br />
LEA<br />
Rate<br />
LEA<br />
Rate<br />
— —<br />
— —<br />
— —<br />
— —<br />
— —<br />
Target<br />
Met by<br />
LEA(Y/N)<br />
B) Acquisition and Use of<br />
Knowledge and Skills<br />
(Including early language/<br />
communication and early literacy)<br />
B) Acquisition and Use of<br />
Knowledge and Skills **<br />
State<br />
Rate<br />
1.75%<br />
6.59%<br />
34.23%<br />
43.51%<br />
13.92%<br />
State<br />
Target<br />
LEA<br />
Rate<br />
Target<br />
Met by<br />
LEA(Y/N)<br />
C) Use of Appropriate Behaviors<br />
to Meet Their Needs<br />
State<br />
Rate<br />
State<br />
Target<br />
LEA<br />
Rate<br />
Target<br />
Met by<br />
LEA(Y/N)<br />
89.61% 90.50% — — N/A 90.31% 90.50% — — N/A 90.82% 92.50% — — N/A<br />
66.58% 69.50% — — N/A 57.43% 60.50% — — N/A 76.69% 78.50% — — N/A<br />
NOTE: * Including social relationships ** Including early language/ communication and early literacy<br />
Note: - - denotes not applicable<br />
State<br />
Rate<br />
LEA<br />
Rate<br />
— —<br />
— —<br />
— —<br />
— —<br />
— —<br />
C) Use of<br />
Appropriate<br />
Behaviors to<br />
Meet Their Needs<br />
State<br />
Rate<br />
4.51%<br />
17.34%<br />
41.72%<br />
34.97%<br />
LEA<br />
Rate<br />
1.46% — —<br />
— —<br />
— —<br />
— —<br />
— —<br />
Page 3 of 5
LEA: 1203 - QUITMAN SCHOOL <strong>DISTRICT</strong><br />
Indicator 08: Parent Involvement<br />
Percent of surveyed<br />
parents who reported<br />
school facilitated parent<br />
involvement as a means<br />
of improving services<br />
and results for children<br />
with disabilities.<br />
Early Childhood<br />
(3-5)<br />
School Age<br />
(5-21)<br />
State<br />
Rate<br />
90.47%<br />
95.05%<br />
Indicator 09: Disproportionality - Eligibility<br />
Disproportionate representation of racial<br />
and ethnic groups in special education and<br />
related services that is a result of<br />
inappropriate identification (e.g.<br />
monitoring data, review of policies,<br />
practices, and procedures under 618(d),<br />
etc.).<br />
State<br />
Rate<br />
State<br />
Target<br />
88.00%<br />
96.00%<br />
State<br />
Target<br />
0.00% 0.00%<br />
LEA<br />
Rate<br />
— —<br />
100.00%<br />
Indicator 10: Disproportionality-Child with a Disability<br />
Disproportionate representation of racial<br />
and ethnic groups in specific disability<br />
categories that is a result of inappropriate<br />
identification (e.g. monitoring data, review<br />
of policies, practices, and procedures under<br />
618(d), etc.).<br />
Indicator 11: Child Find<br />
Percent of children with<br />
parental consent to evaluate<br />
who are evaluated within<br />
the State established timeline<br />
of 60 days.<br />
Overall<br />
(3-21)<br />
Early Childhood<br />
(3-5)<br />
School Age<br />
(5-21)<br />
State<br />
Rate<br />
0.00%<br />
Indicator 12: Early Childhood Transition<br />
Percent of children referred by Part C prior to<br />
age 3, who are found eligible for Part B, and<br />
who have an IEP developed and implemented<br />
by their third birthday.<br />
Note: - - denotes not applicable<br />
State<br />
Rate<br />
99.41%<br />
99.70%<br />
98.97%<br />
State<br />
Rate<br />
State<br />
Target<br />
0.00%<br />
State<br />
Target<br />
100.00%<br />
100.00%<br />
100.00%<br />
State<br />
Target<br />
Target Met by<br />
LEA (Y/N)<br />
Y<br />
Target Met by<br />
LEA (Y/N)<br />
Y<br />
LEA<br />
Rate<br />
100.00%<br />
— —<br />
100.00%<br />
LEA<br />
Rate<br />
Target Met by<br />
LEA (Y/N)<br />
N/A<br />
Y<br />
Note: The target for Indicator 09 is to have zero percent<br />
(0%) of districts identified as having disproportionate<br />
representation as a result of inappropriate<br />
identification in eligibility.<br />
Note: The target for Indicator 10 is to have zero<br />
percent (0%) of districts identified as having<br />
disproportionate representation as a result of<br />
inappropriate identification in a disability<br />
category.<br />
Target Met by<br />
LEA (Y/N)<br />
N/A<br />
Y<br />
Target Met<br />
by LEA<br />
(Y/N)<br />
99.21% 100.00% - - N/A<br />
Y<br />
Note: * Indicates a zero reponse rate for the<br />
district.<br />
Page 4 of 5
LEA: 1203 - QUITMAN SCHOOL <strong>DISTRICT</strong><br />
Indicator 13: Secondary Transition<br />
Percent of youth with disabilities aged 16 and<br />
up with an IEP that includes coordinated,<br />
measurable, annual IEP goals and transition<br />
services that will reasonably enable the student<br />
to meet the post-secondary goals.<br />
Indicator 14: Post-School Outcomes<br />
A. Percent of youth enrolled in higher<br />
education within one year of leaving high<br />
school.<br />
State<br />
Rate<br />
State<br />
Target<br />
Note: Data for this Indicator is from the on-site monitoring of LEAs for the given year.<br />
B. Percent of youth enrolled in higher<br />
education or competitively employed<br />
within one year of leaving high school.<br />
C. Percent of youth enrolled in higher<br />
education or in some other postsecondary<br />
education or training program; or<br />
competitively employed or in some other<br />
employment within one year of leaving<br />
high school.<br />
State<br />
Rate<br />
Indicator 20: Reported Data-Timely and Accurate*<br />
District submitted<br />
required data elements<br />
on or before due dates;<br />
made revisions within<br />
the alloted reveiw<br />
periods.<br />
Accurate and Timely<br />
Data Submission<br />
Overall (3-21)<br />
Early Childhood (3-5)<br />
School Age (5-21)<br />
State<br />
Target<br />
100.00%<br />
100.00%<br />
100.00%<br />
State<br />
Target<br />
LEA<br />
Rate<br />
LEA<br />
Rate<br />
Target Met by<br />
LEA (Y/N)<br />
Target Met<br />
by LEA<br />
(Y/N)<br />
Target Met<br />
by LEA<br />
(Y/N)<br />
*Data reviewed for timely and accurate submissions included all APSCN cycle data except for personnel<br />
Note: - - denotes not applicable<br />
96.19 100.00 — — N/A<br />
14.53<br />
State<br />
Rate<br />
49.42<br />
State<br />
Rate<br />
54.07<br />
13.00<br />
State<br />
Target<br />
49.00<br />
State<br />
Target<br />
60.00<br />
Y<br />
N/A<br />
Y<br />
— —<br />
LEA<br />
Rate<br />
— —<br />
LEA<br />
Rate<br />
— —<br />
N/A<br />
Target Met<br />
by LEA<br />
(Y/N)<br />
N/A<br />
Target Met<br />
by LEA<br />
(Y/N)<br />
N/A<br />
Page 5 of 5
LEA: 1204 - WEST SIDE SCHOOL <strong>DISTRICT</strong><br />
<strong>ARKANSAS</strong> <strong>SPECIAL</strong> <strong>EDUCATION</strong><br />
<strong>DISTRICT</strong> <strong>ANNUAL</strong> PERFORMANCE REPORT<br />
2010/11 School Year<br />
Publication Date: March 2012<br />
Each State must have in place a State Performance Plan (SPP) to evaluate the State's efforts to meet the requirements and<br />
purposes of the implementation of the Individuals with Disabilities Education Act (IDEA). The SPP is a six-year plan, which<br />
describes Arkansas's performance on 20 indicators. The Office of Special Education Programs in the U. S. Department of<br />
Education requires that States report annually to the public on the performance of each local education agency (LEA) on 14 of<br />
20 indicators as compared with targets established by the State in the SPP. Arkansas will report indicators 1 through 14 and<br />
20 for each LEA serving children with disabilities (CWD). Any LEA not meeting targets on compliance indicators (0% for<br />
Indicators 4B, 09 & 10 and 100% for Indicators 11, 12, 13, and 20) are non-compliant with IDEA.<br />
There are no report changes for the 2010/11 school year profile; However, it is important to recognize that: .<br />
1. Indicator 01 (Graduation) is reported a year in arrear (2009/10 graduates) and is based on a four-year cohort. This<br />
means the rate is a measure of students who entered in ninth grade and graduate in four years. The calculation is a<br />
requirement under Title I of the Elementary and Secondary Education Act (ESEA).<br />
2. Indicator 02 (Drop out) is reported a year in arrear. This means the rate is a measure of students who dropped out in<br />
the 2009/10 school year. The Indicator 02 data are aligned with the Common Core of Data (CCD) requirements for<br />
grades 7-12.<br />
3. Indicator 04A and 4B (Suspension/Expulsion) is reported a year in arrear. This means the rate is a measure of<br />
students who had out-of-school suspensions and/or expulsions totaling more than 10 days.<br />
Percent of youth<br />
with IEPs<br />
graduating from<br />
high school with a<br />
regular diploma<br />
For a complete description of all the Indicators, please visit the special education website at<br />
http://arksped.k12.ar.us/sections/policy.html<br />
Indicator 01: Graduation Rates (2009/10 school year) Indicator 02: Dropout Rates (2009/10 school year)<br />
State<br />
Rate<br />
State<br />
Target<br />
75.76% 85.00%<br />
LEA<br />
Rate<br />
100.00%<br />
Target Met<br />
by LEA<br />
(Y/N)<br />
Y<br />
Percent of<br />
youth with<br />
IEPs dropping<br />
out of high<br />
school<br />
State<br />
Rate<br />
Indicator 03: Assessment on Statewide Benchmark Exam (grades 3-8, 11)<br />
A) Adequate Yearly Progress<br />
n=40<br />
Literacy<br />
Mathematics<br />
Met Disability Subgroup "n"<br />
for Reporting Purposes (Y/N)<br />
State Target for % of Districts Meeting<br />
AYP for Disability Subgroup<br />
State<br />
Target<br />
3.06% 4.20%<br />
LEA<br />
Rate<br />
0.00%<br />
% of Districts Meeting AYP<br />
for Disability Subgroup<br />
Target Met by<br />
LEA (Y/N)<br />
Y<br />
Target Met by<br />
LEA(Y/N)<br />
Overall N 17.15% 6.25%<br />
NA<br />
N<br />
N<br />
Note: For a district to qualify as having a disability subgroup it must have a minimum of 40 (n=40) students with disabilities in a school building.<br />
B) Participation<br />
Participation Rate: # of<br />
CWD Tested ÷ # of CWD<br />
Enrolled in grades tested.<br />
Participation Rate: Literacy<br />
Participation Rate: Math<br />
Note: - - denotes not applicable<br />
State<br />
Rate<br />
98.78%<br />
State<br />
Target<br />
95.00%<br />
LEA<br />
Rate<br />
100.00%<br />
Target Met<br />
by LEA (Y/N)<br />
98.61% 95.00% 100.00% Y<br />
Y<br />
C) Performance Proficiency<br />
Percent of CWD Scoring<br />
Proficient or Above<br />
Proficiency Rate: Literacy<br />
Proficiency Rate:<br />
Mathematics<br />
16.00%<br />
16.00%<br />
State<br />
Rate<br />
31.49%<br />
44.86%<br />
State<br />
Target<br />
45.22%<br />
51.14%<br />
LEA<br />
Rate<br />
41.67%<br />
60.00%<br />
NA<br />
NA<br />
Target<br />
Met by<br />
LEA (Y/N)<br />
N<br />
Y<br />
Page 1 of 5
LEA: 1204 - WEST SIDE SCHOOL <strong>DISTRICT</strong><br />
Indicator 04: Out-of-School Suspensions and Expulsions (2009/10 school year)<br />
A) Suspension/Expulsion<br />
Percent difference of CWD with out-of- school suspensions and<br />
expulsions totaling greater than 10 days in a school year as<br />
compared to the same data for general education students in<br />
the district.<br />
B) Suspension/Expulsion by Race and Ethnicity<br />
Percent of districts that have: (a) a significant discrepancy, by race or<br />
ethnicity, in the rate of suspensions and expulsions of greater than 10<br />
days in a school year for children with IEPs; and (b) policies,<br />
procedures or practices that contribute to the significant discrepancy<br />
and do not comply with requirements relating to the development<br />
and implementation of IEPs, the use of positive behavioral<br />
interventions and supports, and procedural safeguards.<br />
Indicator 05: School Age (5-21) Least Restrictive Environment<br />
A) In the Regular Class 80% or more of the day<br />
Percent of CWD with<br />
IEPs receiving instruction<br />
in the regular class 80%<br />
or more of the day.<br />
State<br />
Rate<br />
State<br />
Target<br />
LEA<br />
Rate<br />
B) In the Regular Class less than 40% of the day<br />
Percent of CWD with<br />
IEPs receiving instruction<br />
in the regular class less<br />
than 60% of the day.<br />
53.87% 59.77%<br />
State<br />
Rate<br />
State<br />
Target<br />
12.42% 12.51%<br />
77.97%<br />
LEA<br />
Rate<br />
0.00%<br />
C) Other Settings outside the regular class<br />
Percent of CWD with IEPs served in<br />
public or private separate schools,<br />
residential placements, or<br />
homebound/hospital placements.<br />
State<br />
Rate<br />
State<br />
Target<br />
2.80% 2.56%<br />
Target Met<br />
by LEA (Y/N)<br />
Y<br />
Target Met<br />
by LEA (Y/N)<br />
Y<br />
LEA<br />
Rate<br />
8.47%<br />
Target Met<br />
by LEA(Y/N)<br />
Indicator 06: Early Childhood (3-5) Least Restrictive Environment<br />
A) Regular Early Childhood Program<br />
Percent of children (aged 3 through 5) with IEPs attending a regular<br />
early childhood program and receiving the majority of special<br />
education and related services in the regular early childhood program<br />
Allowable<br />
Difference<br />
LEA: 1204 - WEST SIDE SCHOOL <strong>DISTRICT</strong><br />
Indicator 07: Preschool (3-5) Outcomes<br />
a) Percent of preschool CWD<br />
children who did not<br />
improve functioning.<br />
b) Percent of preschool CWD<br />
who improved but whose<br />
functioning remained below<br />
same age peers.<br />
c) Percent of preschool CWD<br />
who improved at a level<br />
nearer to same aged peers.<br />
d) Percent of preschool CWD<br />
who improved functioning to<br />
reach a level comparable to<br />
same age peers.<br />
e) Percent of preschool CWD<br />
children who maintain<br />
functioning at a level<br />
comparable to same aged<br />
peers.<br />
Summary<br />
Statements<br />
1) Of those preschool<br />
children who entered<br />
the preschool program<br />
below age expectations<br />
in each Outcome, the<br />
percent who<br />
substantially increased<br />
their rate of growth by<br />
the time they turned 6<br />
years of age or exited<br />
the program.<br />
2) The percent of<br />
preschool children who<br />
were functioning<br />
within age expectations<br />
in each Outcome by the<br />
time they turned 6<br />
years of age or exited<br />
A) Positive Social -Emotional<br />
Skills*<br />
State<br />
Rate<br />
A) Positive Social -<br />
Emotional Skills<br />
(Including social<br />
relationships)<br />
State<br />
Rate<br />
2.14%<br />
5.31%<br />
25.97%<br />
38.22%<br />
28.36%<br />
State<br />
Target<br />
LEA<br />
Rate<br />
LEA<br />
Rate<br />
— —<br />
— —<br />
— —<br />
— —<br />
— —<br />
Target<br />
Met by<br />
LEA(Y/N)<br />
B) Acquisition and Use of<br />
Knowledge and Skills<br />
(Including early language/<br />
communication and early literacy)<br />
B) Acquisition and Use of<br />
Knowledge and Skills **<br />
State<br />
Rate<br />
1.75%<br />
6.59%<br />
34.23%<br />
43.51%<br />
13.92%<br />
State<br />
Target<br />
LEA<br />
Rate<br />
Target<br />
Met by<br />
LEA(Y/N)<br />
C) Use of Appropriate Behaviors<br />
to Meet Their Needs<br />
State<br />
Rate<br />
State<br />
Target<br />
LEA<br />
Rate<br />
Target<br />
Met by<br />
LEA(Y/N)<br />
89.61% 90.50% — — N/A 90.31% 90.50% — — N/A 90.82% 92.50% — — N/A<br />
66.58% 69.50% — — N/A 57.43% 60.50% — — N/A 76.69% 78.50% — — N/A<br />
NOTE: * Including social relationships ** Including early language/ communication and early literacy<br />
Note: - - denotes not applicable<br />
State<br />
Rate<br />
LEA<br />
Rate<br />
— —<br />
— —<br />
— —<br />
— —<br />
— —<br />
C) Use of<br />
Appropriate<br />
Behaviors to<br />
Meet Their Needs<br />
State<br />
Rate<br />
4.51%<br />
17.34%<br />
41.72%<br />
34.97%<br />
LEA<br />
Rate<br />
1.46% — —<br />
— —<br />
— —<br />
— —<br />
— —<br />
Page 3 of 5
LEA: 1204 - WEST SIDE SCHOOL <strong>DISTRICT</strong><br />
Indicator 08: Parent Involvement<br />
Percent of surveyed<br />
parents who reported<br />
school facilitated parent<br />
involvement as a means<br />
of improving services<br />
and results for children<br />
with disabilities.<br />
Early Childhood<br />
(3-5)<br />
School Age<br />
(5-21)<br />
State<br />
Rate<br />
90.47%<br />
95.05%<br />
Indicator 09: Disproportionality - Eligibility<br />
Disproportionate representation of racial<br />
and ethnic groups in special education and<br />
related services that is a result of<br />
inappropriate identification (e.g.<br />
monitoring data, review of policies,<br />
practices, and procedures under 618(d),<br />
etc.).<br />
State<br />
Rate<br />
State<br />
Target<br />
88.00%<br />
96.00%<br />
State<br />
Target<br />
0.00% 0.00%<br />
LEA<br />
Rate<br />
— —<br />
97.62%<br />
Indicator 10: Disproportionality-Child with a Disability<br />
Disproportionate representation of racial<br />
and ethnic groups in specific disability<br />
categories that is a result of inappropriate<br />
identification (e.g. monitoring data, review<br />
of policies, practices, and procedures under<br />
618(d), etc.).<br />
Indicator 11: Child Find<br />
Percent of children with<br />
parental consent to evaluate<br />
who are evaluated within<br />
the State established timeline<br />
of 60 days.<br />
Overall<br />
(3-21)<br />
Early Childhood<br />
(3-5)<br />
School Age<br />
(5-21)<br />
State<br />
Rate<br />
0.00%<br />
Indicator 12: Early Childhood Transition<br />
Percent of children referred by Part C prior to<br />
age 3, who are found eligible for Part B, and<br />
who have an IEP developed and implemented<br />
by their third birthday.<br />
Note: - - denotes not applicable<br />
State<br />
Rate<br />
99.41%<br />
99.70%<br />
98.97%<br />
State<br />
Rate<br />
State<br />
Target<br />
0.00%<br />
State<br />
Target<br />
100.00%<br />
100.00%<br />
100.00%<br />
State<br />
Target<br />
Target Met by<br />
LEA (Y/N)<br />
Y<br />
Target Met by<br />
LEA (Y/N)<br />
Y<br />
LEA<br />
Rate<br />
100.00%<br />
— —<br />
100.00%<br />
LEA<br />
Rate<br />
Target Met by<br />
LEA (Y/N)<br />
N/A<br />
Y<br />
Note: The target for Indicator 09 is to have zero percent<br />
(0%) of districts identified as having disproportionate<br />
representation as a result of inappropriate<br />
identification in eligibility.<br />
Note: The target for Indicator 10 is to have zero<br />
percent (0%) of districts identified as having<br />
disproportionate representation as a result of<br />
inappropriate identification in a disability<br />
category.<br />
Target Met by<br />
LEA (Y/N)<br />
N/A<br />
Y<br />
Target Met<br />
by LEA<br />
(Y/N)<br />
99.21% 100.00% - - N/A<br />
Y<br />
Note: * Indicates a zero reponse rate for the<br />
district.<br />
Page 4 of 5
LEA: 1204 - WEST SIDE SCHOOL <strong>DISTRICT</strong><br />
Indicator 13: Secondary Transition<br />
Percent of youth with disabilities aged 16 and<br />
up with an IEP that includes coordinated,<br />
measurable, annual IEP goals and transition<br />
services that will reasonably enable the student<br />
to meet the post-secondary goals.<br />
Indicator 14: Post-School Outcomes<br />
A. Percent of youth enrolled in higher<br />
education within one year of leaving high<br />
school.<br />
State<br />
Rate<br />
State<br />
Target<br />
Note: Data for this Indicator is from the on-site monitoring of LEAs for the given year.<br />
B. Percent of youth enrolled in higher<br />
education or competitively employed<br />
within one year of leaving high school.<br />
C. Percent of youth enrolled in higher<br />
education or in some other postsecondary<br />
education or training program; or<br />
competitively employed or in some other<br />
employment within one year of leaving<br />
high school.<br />
State<br />
Rate<br />
Indicator 20: Reported Data-Timely and Accurate*<br />
District submitted<br />
required data elements<br />
on or before due dates;<br />
made revisions within<br />
the alloted reveiw<br />
periods.<br />
Accurate and Timely<br />
Data Submission<br />
Overall (3-21)<br />
Early Childhood (3-5)<br />
School Age (5-21)<br />
State<br />
Target<br />
100.00%<br />
100.00%<br />
100.00%<br />
State<br />
Target<br />
LEA<br />
Rate<br />
LEA<br />
Rate<br />
Target Met by<br />
LEA (Y/N)<br />
Target Met<br />
by LEA<br />
(Y/N)<br />
Target Met<br />
by LEA<br />
(Y/N)<br />
*Data reviewed for timely and accurate submissions included all APSCN cycle data except for personnel<br />
Note: - - denotes not applicable<br />
96.19 100.00 — — N/A<br />
14.53<br />
State<br />
Rate<br />
49.42<br />
State<br />
Rate<br />
54.07<br />
13.00<br />
State<br />
Target<br />
49.00<br />
State<br />
Target<br />
60.00<br />
Y<br />
N/A<br />
Y<br />
— —<br />
LEA<br />
Rate<br />
— —<br />
LEA<br />
Rate<br />
— —<br />
N/A<br />
Target Met<br />
by LEA<br />
(Y/N)<br />
N/A<br />
Target Met<br />
by LEA<br />
(Y/N)<br />
N/A<br />
Page 5 of 5
<strong>ARKANSAS</strong> <strong>SPECIAL</strong> <strong>EDUCATION</strong><br />
<strong>DISTRICT</strong> <strong>ANNUAL</strong> PERFORMANCE REPORT<br />
2010/11 School Year<br />
Publication Date: March 2012<br />
Each State must have in place a State Performance Plan (SPP) to evaluate the State's efforts to meet the requirements and<br />
purposes of the implementation of the Individuals with Disabilities Education Act (IDEA). The SPP is a six-year plan, which<br />
describes Arkansas's performance on 20 indicators. The Office of Special Education Programs in the U. S. Department of<br />
Education requires that States report annually to the public on the performance of each local education agency (LEA) on 14 of<br />
20 indicators as compared with targets established by the State in the SPP. Arkansas will report indicators 1 through 14 and<br />
20 for each LEA serving children with disabilities (CWD). Any LEA not meeting targets on compliance indicators (0% for<br />
Indicators 4B, 09 & 10 and 100% for Indicators 11, 12, 13, and 20) are non-compliant with IDEA.<br />
There are no report changes for the 2010/11 school year profile; However, it is important to recognize that: .<br />
1. Indicator 01 (Graduation) is reported a year in arrear (2009/10 graduates) and is based on a four-year cohort. This<br />
means the rate is a measure of students who entered in ninth grade and graduate in four years. The calculation is a<br />
requirement under Title I of the Elementary and Secondary Education Act (ESEA).<br />
2. Indicator 02 (Drop out) is reported a year in arrear. This means the rate is a measure of students who dropped out in<br />
the 2009/10 school year. The Indicator 02 data are aligned with the Common Core of Data (CCD) requirements for<br />
grades 7-12.<br />
3. Indicator 04A and 4B (Suspension/Expulsion) is reported a year in arrear. This means the rate is a measure of<br />
students who had out-of-school suspensions and/or expulsions totaling more than 10 days.<br />
For a complete description of all the Indicators, please visit the special education website at<br />
http://arksped.k12.ar.us/sections/policy.html<br />
LEA: 1304 - WOODLAWN SCHOOL <strong>DISTRICT</strong><br />
Indicator 01: Graduation Rates (2009/10 school year) Indicator 02: Dropout Rates (2009/10 school year)<br />
Percent of youth<br />
with IEPs<br />
graduating from<br />
high school with a<br />
regular diploma<br />
State<br />
Rate<br />
State<br />
Target<br />
75.76% 85.00%<br />
LEA<br />
Rate<br />
100.00%<br />
Target Met<br />
by LEA<br />
(Y/N)<br />
Y<br />
Percent of<br />
youth with<br />
IEPs dropping<br />
out of high<br />
school<br />
State<br />
Rate<br />
Indicator 03: Assessment on Statewide Benchmark Exam (grades 3-8, 11)<br />
A) Adequate Yearly Progress<br />
n=40<br />
Literacy<br />
Mathematics<br />
Met Disability Subgroup "n"<br />
for Reporting Purposes (Y/N)<br />
State Target for % of Districts Meeting<br />
AYP for Disability Subgroup<br />
State<br />
Target<br />
3.06% 4.20%<br />
LEA<br />
Rate<br />
0.00%<br />
% of Districts Meeting AYP<br />
for Disability Subgroup<br />
Target Met by<br />
LEA (Y/N)<br />
Y<br />
Target Met by<br />
LEA(Y/N)<br />
Overall N 17.15% 6.25%<br />
NA<br />
N<br />
N<br />
Note: For a district to qualify as having a disability subgroup it must have a minimum of 40 (n=40) students with disabilities in a school building.<br />
B) Participation<br />
Participation Rate: # of<br />
CWD Tested ÷ # of CWD<br />
Enrolled in grades tested.<br />
Participation Rate: Literacy<br />
Participation Rate: Math<br />
Note: - - denotes not applicable<br />
State<br />
Rate<br />
98.78%<br />
State<br />
Target<br />
95.00%<br />
LEA<br />
Rate<br />
100.00%<br />
Target Met<br />
by LEA (Y/N)<br />
98.61% 95.00% 100.00% Y<br />
Y<br />
C) Performance Proficiency<br />
Percent of CWD Scoring<br />
Proficient or Above<br />
Proficiency Rate: Literacy<br />
Proficiency Rate:<br />
Mathematics<br />
16.00%<br />
16.00%<br />
State<br />
Rate<br />
31.49%<br />
44.86%<br />
State<br />
Target<br />
45.22%<br />
51.14%<br />
LEA<br />
Rate<br />
44.12%<br />
47.37%<br />
NA<br />
NA<br />
Target<br />
Met by<br />
LEA (Y/N)<br />
N<br />
N<br />
Page 1 of 5
LEA: 1304 - WOODLAWN SCHOOL <strong>DISTRICT</strong><br />
Indicator 04: Out-of-School Suspensions and Expulsions (2009/10 school year)<br />
A) Suspension/Expulsion<br />
Percent difference of CWD with out-of- school suspensions and<br />
expulsions totaling greater than 10 days in a school year as<br />
compared to the same data for general education students in<br />
the district.<br />
B) Suspension/Expulsion by Race and Ethnicity<br />
Percent of districts that have: (a) a significant discrepancy, by race or<br />
ethnicity, in the rate of suspensions and expulsions of greater than 10<br />
days in a school year for children with IEPs; and (b) policies,<br />
procedures or practices that contribute to the significant discrepancy<br />
and do not comply with requirements relating to the development<br />
and implementation of IEPs, the use of positive behavioral<br />
interventions and supports, and procedural safeguards.<br />
Indicator 05: School Age (5-21) Least Restrictive Environment<br />
A) In the Regular Class 80% or more of the day<br />
Percent of CWD with<br />
IEPs receiving instruction<br />
in the regular class 80%<br />
or more of the day.<br />
State<br />
Rate<br />
State<br />
Target<br />
LEA<br />
Rate<br />
B) In the Regular Class less than 40% of the day<br />
Percent of CWD with<br />
IEPs receiving instruction<br />
in the regular class less<br />
than 60% of the day.<br />
53.87% 59.77%<br />
State<br />
Rate<br />
State<br />
Target<br />
12.42% 12.51%<br />
82.26%<br />
LEA<br />
Rate<br />
1.61%<br />
C) Other Settings outside the regular class<br />
Percent of CWD with IEPs served in<br />
public or private separate schools,<br />
residential placements, or<br />
homebound/hospital placements.<br />
State<br />
Rate<br />
State<br />
Target<br />
2.80% 2.56%<br />
Target Met<br />
by LEA (Y/N)<br />
Y<br />
Target Met<br />
by LEA (Y/N)<br />
Y<br />
LEA<br />
Rate<br />
0.00%<br />
Target Met<br />
by LEA(Y/N)<br />
Indicator 06: Early Childhood (3-5) Least Restrictive Environment<br />
A) Regular Early Childhood Program<br />
Percent of children (aged 3 through 5) with IEPs attending a regular<br />
early childhood program and receiving the majority of special<br />
education and related services in the regular early childhood program<br />
Allowable<br />
Difference<br />
LEA: 1304 - WOODLAWN SCHOOL <strong>DISTRICT</strong><br />
Indicator 07: Preschool (3-5) Outcomes<br />
a) Percent of preschool CWD<br />
children who did not<br />
improve functioning.<br />
b) Percent of preschool CWD<br />
who improved but whose<br />
functioning remained below<br />
same age peers.<br />
c) Percent of preschool CWD<br />
who improved at a level<br />
nearer to same aged peers.<br />
d) Percent of preschool CWD<br />
who improved functioning to<br />
reach a level comparable to<br />
same age peers.<br />
e) Percent of preschool CWD<br />
children who maintain<br />
functioning at a level<br />
comparable to same aged<br />
peers.<br />
Summary<br />
Statements<br />
1) Of those preschool<br />
children who entered<br />
the preschool program<br />
below age expectations<br />
in each Outcome, the<br />
percent who<br />
substantially increased<br />
their rate of growth by<br />
the time they turned 6<br />
years of age or exited<br />
the program.<br />
2) The percent of<br />
preschool children who<br />
were functioning<br />
within age expectations<br />
in each Outcome by the<br />
time they turned 6<br />
years of age or exited<br />
A) Positive Social -Emotional<br />
Skills*<br />
State<br />
Rate<br />
A) Positive Social -<br />
Emotional Skills<br />
(Including social<br />
relationships)<br />
State<br />
Rate<br />
2.14%<br />
5.31%<br />
25.97%<br />
38.22%<br />
28.36%<br />
State<br />
Target<br />
LEA<br />
Rate<br />
LEA<br />
Rate<br />
— —<br />
— —<br />
— —<br />
— —<br />
— —<br />
Target<br />
Met by<br />
LEA(Y/N)<br />
B) Acquisition and Use of<br />
Knowledge and Skills<br />
(Including early language/<br />
communication and early literacy)<br />
B) Acquisition and Use of<br />
Knowledge and Skills **<br />
State<br />
Rate<br />
1.75%<br />
6.59%<br />
34.23%<br />
43.51%<br />
13.92%<br />
State<br />
Target<br />
LEA<br />
Rate<br />
Target<br />
Met by<br />
LEA(Y/N)<br />
C) Use of Appropriate Behaviors<br />
to Meet Their Needs<br />
State<br />
Rate<br />
State<br />
Target<br />
LEA<br />
Rate<br />
Target<br />
Met by<br />
LEA(Y/N)<br />
89.61% 90.50% — — N/A 90.31% 90.50% — — N/A 90.82% 92.50% — — N/A<br />
66.58% 69.50% — — N/A 57.43% 60.50% — — N/A 76.69% 78.50% — — N/A<br />
NOTE: * Including social relationships ** Including early language/ communication and early literacy<br />
Note: - - denotes not applicable<br />
State<br />
Rate<br />
LEA<br />
Rate<br />
— —<br />
— —<br />
— —<br />
— —<br />
— —<br />
C) Use of<br />
Appropriate<br />
Behaviors to<br />
Meet Their Needs<br />
State<br />
Rate<br />
4.51%<br />
17.34%<br />
41.72%<br />
34.97%<br />
LEA<br />
Rate<br />
1.46% — —<br />
— —<br />
— —<br />
— —<br />
— —<br />
Page 3 of 5
LEA: 1304 - WOODLAWN SCHOOL <strong>DISTRICT</strong><br />
Indicator 08: Parent Involvement<br />
Percent of surveyed<br />
parents who reported<br />
school facilitated parent<br />
involvement as a means<br />
of improving services<br />
and results for children<br />
with disabilities.<br />
Early Childhood<br />
(3-5)<br />
School Age<br />
(5-21)<br />
State<br />
Rate<br />
90.47%<br />
95.05%<br />
Indicator 09: Disproportionality - Eligibility<br />
Disproportionate representation of racial<br />
and ethnic groups in special education and<br />
related services that is a result of<br />
inappropriate identification (e.g.<br />
monitoring data, review of policies,<br />
practices, and procedures under 618(d),<br />
etc.).<br />
State<br />
Rate<br />
State<br />
Target<br />
88.00%<br />
96.00%<br />
State<br />
Target<br />
0.00% 0.00%<br />
LEA<br />
Rate<br />
— —<br />
100.00%<br />
Indicator 10: Disproportionality-Child with a Disability<br />
Disproportionate representation of racial<br />
and ethnic groups in specific disability<br />
categories that is a result of inappropriate<br />
identification (e.g. monitoring data, review<br />
of policies, practices, and procedures under<br />
618(d), etc.).<br />
Indicator 11: Child Find<br />
Percent of children with<br />
parental consent to evaluate<br />
who are evaluated within<br />
the State established timeline<br />
of 60 days.<br />
Overall<br />
(3-21)<br />
Early Childhood<br />
(3-5)<br />
School Age<br />
(5-21)<br />
State<br />
Rate<br />
0.00%<br />
Indicator 12: Early Childhood Transition<br />
Percent of children referred by Part C prior to<br />
age 3, who are found eligible for Part B, and<br />
who have an IEP developed and implemented<br />
by their third birthday.<br />
Note: - - denotes not applicable<br />
State<br />
Rate<br />
99.41%<br />
99.70%<br />
98.97%<br />
State<br />
Rate<br />
State<br />
Target<br />
0.00%<br />
State<br />
Target<br />
100.00%<br />
100.00%<br />
100.00%<br />
State<br />
Target<br />
Target Met by<br />
LEA (Y/N)<br />
Y<br />
Target Met by<br />
LEA (Y/N)<br />
Y<br />
LEA<br />
Rate<br />
100.00%<br />
— —<br />
100.00%<br />
LEA<br />
Rate<br />
Target Met by<br />
LEA (Y/N)<br />
N/A<br />
Y<br />
Note: The target for Indicator 09 is to have zero percent<br />
(0%) of districts identified as having disproportionate<br />
representation as a result of inappropriate<br />
identification in eligibility.<br />
Note: The target for Indicator 10 is to have zero<br />
percent (0%) of districts identified as having<br />
disproportionate representation as a result of<br />
inappropriate identification in a disability<br />
category.<br />
Target Met by<br />
LEA (Y/N)<br />
N/A<br />
Y<br />
Target Met<br />
by LEA<br />
(Y/N)<br />
99.21% 100.00% - - N/A<br />
Y<br />
Note: * Indicates a zero reponse rate for the<br />
district.<br />
Page 4 of 5
LEA: 1304 - WOODLAWN SCHOOL <strong>DISTRICT</strong><br />
Indicator 13: Secondary Transition<br />
Percent of youth with disabilities aged 16 and<br />
up with an IEP that includes coordinated,<br />
measurable, annual IEP goals and transition<br />
services that will reasonably enable the student<br />
to meet the post-secondary goals.<br />
Indicator 14: Post-School Outcomes<br />
A. Percent of youth enrolled in higher<br />
education within one year of leaving high<br />
school.<br />
State<br />
Rate<br />
State<br />
Target<br />
Note: Data for this Indicator is from the on-site monitoring of LEAs for the given year.<br />
B. Percent of youth enrolled in higher<br />
education or competitively employed<br />
within one year of leaving high school.<br />
C. Percent of youth enrolled in higher<br />
education or in some other postsecondary<br />
education or training program; or<br />
competitively employed or in some other<br />
employment within one year of leaving<br />
high school.<br />
State<br />
Rate<br />
Indicator 20: Reported Data-Timely and Accurate*<br />
District submitted<br />
required data elements<br />
on or before due dates;<br />
made revisions within<br />
the alloted reveiw<br />
periods.<br />
Accurate and Timely<br />
Data Submission<br />
Overall (3-21)<br />
Early Childhood (3-5)<br />
School Age (5-21)<br />
State<br />
Target<br />
100.00%<br />
100.00%<br />
100.00%<br />
State<br />
Target<br />
LEA<br />
Rate<br />
LEA<br />
Rate<br />
Target Met by<br />
LEA (Y/N)<br />
Target Met<br />
by LEA<br />
(Y/N)<br />
Target Met<br />
by LEA<br />
(Y/N)<br />
*Data reviewed for timely and accurate submissions included all APSCN cycle data except for personnel<br />
Note: - - denotes not applicable<br />
96.19 100.00 — — N/A<br />
14.53<br />
State<br />
Rate<br />
49.42<br />
State<br />
Rate<br />
54.07<br />
13.00<br />
State<br />
Target<br />
49.00<br />
State<br />
Target<br />
60.00<br />
Y<br />
N/A<br />
Y<br />
— —<br />
LEA<br />
Rate<br />
— —<br />
LEA<br />
Rate<br />
— —<br />
N/A<br />
Target Met<br />
by LEA<br />
(Y/N)<br />
N/A<br />
Target Met<br />
by LEA<br />
(Y/N)<br />
N/A<br />
Page 5 of 5
<strong>ARKANSAS</strong> <strong>SPECIAL</strong> <strong>EDUCATION</strong><br />
<strong>DISTRICT</strong> <strong>ANNUAL</strong> PERFORMANCE REPORT<br />
2010/11 School Year<br />
Publication Date: March 2012<br />
Each State must have in place a State Performance Plan (SPP) to evaluate the State's efforts to meet the requirements and<br />
purposes of the implementation of the Individuals with Disabilities Education Act (IDEA). The SPP is a six-year plan, which<br />
describes Arkansas's performance on 20 indicators. The Office of Special Education Programs in the U. S. Department of<br />
Education requires that States report annually to the public on the performance of each local education agency (LEA) on 14 of<br />
20 indicators as compared with targets established by the State in the SPP. Arkansas will report indicators 1 through 14 and<br />
20 for each LEA serving children with disabilities (CWD). Any LEA not meeting targets on compliance indicators (0% for<br />
Indicators 4B, 09 & 10 and 100% for Indicators 11, 12, 13, and 20) are non-compliant with IDEA.<br />
There are no report changes for the 2010/11 school year profile; However, it is important to recognize that: .<br />
1. Indicator 01 (Graduation) is reported a year in arrear (2009/10 graduates) and is based on a four-year cohort. This<br />
means the rate is a measure of students who entered in ninth grade and graduate in four years. The calculation is a<br />
requirement under Title I of the Elementary and Secondary Education Act (ESEA).<br />
2. Indicator 02 (Drop out) is reported a year in arrear. This means the rate is a measure of students who dropped out in<br />
the 2009/10 school year. The Indicator 02 data are aligned with the Common Core of Data (CCD) requirements for<br />
grades 7-12.<br />
3. Indicator 04A and 4B (Suspension/Expulsion) is reported a year in arrear. This means the rate is a measure of<br />
students who had out-of-school suspensions and/or expulsions totaling more than 10 days.<br />
For a complete description of all the Indicators, please visit the special education website at<br />
http://arksped.k12.ar.us/sections/policy.html<br />
LEA: 1305 - CLEVELAND COUNTY SCHOOL <strong>DISTRICT</strong><br />
Indicator 01: Graduation Rates (2009/10 school year) Indicator 02: Dropout Rates (2009/10 school year)<br />
Percent of youth<br />
with IEPs<br />
graduating from<br />
high school with a<br />
regular diploma<br />
State<br />
Rate<br />
State<br />
Target<br />
75.76% 85.00%<br />
LEA<br />
Rate<br />
100.00%<br />
Target Met<br />
by LEA<br />
(Y/N)<br />
Y<br />
Percent of<br />
youth with<br />
IEPs dropping<br />
out of high<br />
school<br />
State<br />
Rate<br />
Indicator 03: Assessment on Statewide Benchmark Exam (grades 3-8, 11)<br />
A) Adequate Yearly Progress<br />
n=40<br />
Literacy<br />
Mathematics<br />
Met Disability Subgroup "n"<br />
for Reporting Purposes (Y/N)<br />
State Target for % of Districts Meeting<br />
AYP for Disability Subgroup<br />
State<br />
Target<br />
3.06% 4.20%<br />
LEA<br />
Rate<br />
2.22%<br />
% of Districts Meeting AYP<br />
for Disability Subgroup<br />
Target Met by<br />
LEA (Y/N)<br />
Y<br />
Target Met by<br />
LEA(Y/N)<br />
Overall N 17.15% 6.25%<br />
NA<br />
N<br />
N<br />
Note: For a district to qualify as having a disability subgroup it must have a minimum of 40 (n=40) students with disabilities in a school building.<br />
B) Participation<br />
Participation Rate: # of<br />
CWD Tested ÷ # of CWD<br />
Enrolled in grades tested.<br />
Participation Rate: Literacy<br />
Participation Rate: Math<br />
Note: - - denotes not applicable<br />
State<br />
Rate<br />
98.78%<br />
State<br />
Target<br />
95.00%<br />
LEA<br />
Rate<br />
100.00%<br />
Target Met<br />
by LEA (Y/N)<br />
98.61% 95.00% 100.00% Y<br />
Y<br />
C) Performance Proficiency<br />
Percent of CWD Scoring<br />
Proficient or Above<br />
Proficiency Rate: Literacy<br />
Proficiency Rate:<br />
Mathematics<br />
16.00%<br />
16.00%<br />
State<br />
Rate<br />
31.49%<br />
44.86%<br />
State<br />
Target<br />
45.22%<br />
51.14%<br />
LEA<br />
Rate<br />
15.79%<br />
28.57%<br />
NA<br />
NA<br />
Target<br />
Met by<br />
LEA (Y/N)<br />
N<br />
N<br />
Page 1 of 5
LEA: 1305 - CLEVELAND COUNTY SCHOOL <strong>DISTRICT</strong><br />
Indicator 04: Out-of-School Suspensions and Expulsions (2009/10 school year)<br />
A) Suspension/Expulsion<br />
Percent difference of CWD with out-of- school suspensions and<br />
expulsions totaling greater than 10 days in a school year as<br />
compared to the same data for general education students in<br />
the district.<br />
B) Suspension/Expulsion by Race and Ethnicity<br />
Percent of districts that have: (a) a significant discrepancy, by race or<br />
ethnicity, in the rate of suspensions and expulsions of greater than 10<br />
days in a school year for children with IEPs; and (b) policies,<br />
procedures or practices that contribute to the significant discrepancy<br />
and do not comply with requirements relating to the development<br />
and implementation of IEPs, the use of positive behavioral<br />
interventions and supports, and procedural safeguards.<br />
Indicator 05: School Age (5-21) Least Restrictive Environment<br />
A) In the Regular Class 80% or more of the day<br />
Percent of CWD with<br />
IEPs receiving instruction<br />
in the regular class 80%<br />
or more of the day.<br />
State<br />
Rate<br />
State<br />
Target<br />
LEA<br />
Rate<br />
B) In the Regular Class less than 40% of the day<br />
Percent of CWD with<br />
IEPs receiving instruction<br />
in the regular class less<br />
than 60% of the day.<br />
53.87% 59.77%<br />
State<br />
Rate<br />
State<br />
Target<br />
12.42% 12.51%<br />
79.76%<br />
LEA<br />
Rate<br />
2.38%<br />
C) Other Settings outside the regular class<br />
Percent of CWD with IEPs served in<br />
public or private separate schools,<br />
residential placements, or<br />
homebound/hospital placements.<br />
State<br />
Rate<br />
State<br />
Target<br />
2.80% 2.56%<br />
Target Met<br />
by LEA (Y/N)<br />
Y<br />
Target Met<br />
by LEA (Y/N)<br />
Y<br />
LEA<br />
Rate<br />
0.00%<br />
Target Met<br />
by LEA(Y/N)<br />
Indicator 06: Early Childhood (3-5) Least Restrictive Environment<br />
A) Regular Early Childhood Program<br />
Percent of children (aged 3 through 5) with IEPs attending a regular<br />
early childhood program and receiving the majority of special<br />
education and related services in the regular early childhood program<br />
Allowable<br />
Difference<br />
LEA: 1305 - CLEVELAND COUNTY SCHOOL <strong>DISTRICT</strong><br />
Indicator 07: Preschool (3-5) Outcomes<br />
a) Percent of preschool CWD<br />
children who did not<br />
improve functioning.<br />
b) Percent of preschool CWD<br />
who improved but whose<br />
functioning remained below<br />
same age peers.<br />
c) Percent of preschool CWD<br />
who improved at a level<br />
nearer to same aged peers.<br />
d) Percent of preschool CWD<br />
who improved functioning to<br />
reach a level comparable to<br />
same age peers.<br />
e) Percent of preschool CWD<br />
children who maintain<br />
functioning at a level<br />
comparable to same aged<br />
peers.<br />
Summary<br />
Statements<br />
1) Of those preschool<br />
children who entered<br />
the preschool program<br />
below age expectations<br />
in each Outcome, the<br />
percent who<br />
substantially increased<br />
their rate of growth by<br />
the time they turned 6<br />
years of age or exited<br />
the program.<br />
2) The percent of<br />
preschool children who<br />
were functioning<br />
within age expectations<br />
in each Outcome by the<br />
time they turned 6<br />
years of age or exited<br />
A) Positive Social -Emotional<br />
Skills*<br />
State<br />
Rate<br />
A) Positive Social -<br />
Emotional Skills<br />
(Including social<br />
relationships)<br />
State<br />
Rate<br />
2.14%<br />
5.31%<br />
25.97%<br />
38.22%<br />
28.36%<br />
State<br />
Target<br />
LEA<br />
Rate<br />
LEA<br />
Rate<br />
— —<br />
— —<br />
— —<br />
— —<br />
— —<br />
Target<br />
Met by<br />
LEA(Y/N)<br />
B) Acquisition and Use of<br />
Knowledge and Skills<br />
(Including early language/<br />
communication and early literacy)<br />
B) Acquisition and Use of<br />
Knowledge and Skills **<br />
State<br />
Rate<br />
1.75%<br />
6.59%<br />
34.23%<br />
43.51%<br />
13.92%<br />
State<br />
Target<br />
LEA<br />
Rate<br />
Target<br />
Met by<br />
LEA(Y/N)<br />
C) Use of Appropriate Behaviors<br />
to Meet Their Needs<br />
State<br />
Rate<br />
State<br />
Target<br />
LEA<br />
Rate<br />
Target<br />
Met by<br />
LEA(Y/N)<br />
89.61% 90.50% — — N/A 90.31% 90.50% — — N/A 90.82% 92.50% — — N/A<br />
66.58% 69.50% — — N/A 57.43% 60.50% — — N/A 76.69% 78.50% — — N/A<br />
NOTE: * Including social relationships ** Including early language/ communication and early literacy<br />
Note: - - denotes not applicable<br />
State<br />
Rate<br />
LEA<br />
Rate<br />
— —<br />
— —<br />
— —<br />
— —<br />
— —<br />
C) Use of<br />
Appropriate<br />
Behaviors to<br />
Meet Their Needs<br />
State<br />
Rate<br />
4.51%<br />
17.34%<br />
41.72%<br />
34.97%<br />
LEA<br />
Rate<br />
1.46% — —<br />
— —<br />
— —<br />
— —<br />
— —<br />
Page 3 of 5
LEA: 1305 - CLEVELAND COUNTY SCHOOL <strong>DISTRICT</strong><br />
Indicator 08: Parent Involvement<br />
Percent of surveyed<br />
parents who reported<br />
school facilitated parent<br />
involvement as a means<br />
of improving services<br />
and results for children<br />
with disabilities.<br />
Early Childhood<br />
(3-5)<br />
School Age<br />
(5-21)<br />
State<br />
Rate<br />
90.47%<br />
95.05%<br />
Indicator 09: Disproportionality - Eligibility<br />
Disproportionate representation of racial<br />
and ethnic groups in special education and<br />
related services that is a result of<br />
inappropriate identification (e.g.<br />
monitoring data, review of policies,<br />
practices, and procedures under 618(d),<br />
etc.).<br />
State<br />
Rate<br />
State<br />
Target<br />
88.00%<br />
96.00%<br />
State<br />
Target<br />
0.00% 0.00%<br />
LEA<br />
Rate<br />
— —<br />
91.30%<br />
Indicator 10: Disproportionality-Child with a Disability<br />
Disproportionate representation of racial<br />
and ethnic groups in specific disability<br />
categories that is a result of inappropriate<br />
identification (e.g. monitoring data, review<br />
of policies, practices, and procedures under<br />
618(d), etc.).<br />
Indicator 11: Child Find<br />
Percent of children with<br />
parental consent to evaluate<br />
who are evaluated within<br />
the State established timeline<br />
of 60 days.<br />
Overall<br />
(3-21)<br />
Early Childhood<br />
(3-5)<br />
School Age<br />
(5-21)<br />
State<br />
Rate<br />
0.00%<br />
Indicator 12: Early Childhood Transition<br />
Percent of children referred by Part C prior to<br />
age 3, who are found eligible for Part B, and<br />
who have an IEP developed and implemented<br />
by their third birthday.<br />
Note: - - denotes not applicable<br />
State<br />
Rate<br />
99.41%<br />
99.70%<br />
98.97%<br />
State<br />
Rate<br />
State<br />
Target<br />
0.00%<br />
State<br />
Target<br />
100.00%<br />
100.00%<br />
100.00%<br />
State<br />
Target<br />
Target Met by<br />
LEA (Y/N)<br />
Y<br />
Target Met by<br />
LEA (Y/N)<br />
Y<br />
LEA<br />
Rate<br />
100.00%<br />
— —<br />
100.00%<br />
LEA<br />
Rate<br />
Target Met by<br />
LEA (Y/N)<br />
N/A<br />
N<br />
Note: The target for Indicator 09 is to have zero percent<br />
(0%) of districts identified as having disproportionate<br />
representation as a result of inappropriate<br />
identification in eligibility.<br />
Note: The target for Indicator 10 is to have zero<br />
percent (0%) of districts identified as having<br />
disproportionate representation as a result of<br />
inappropriate identification in a disability<br />
category.<br />
Target Met by<br />
LEA (Y/N)<br />
N/A<br />
Y<br />
Target Met<br />
by LEA<br />
(Y/N)<br />
99.21% 100.00% - - N/A<br />
Y<br />
Note: * Indicates a zero reponse rate for the<br />
district.<br />
Page 4 of 5
LEA: 1305 - CLEVELAND COUNTY SCHOOL <strong>DISTRICT</strong><br />
Indicator 13: Secondary Transition<br />
Percent of youth with disabilities aged 16 and<br />
up with an IEP that includes coordinated,<br />
measurable, annual IEP goals and transition<br />
services that will reasonably enable the student<br />
to meet the post-secondary goals.<br />
Indicator 14: Post-School Outcomes<br />
A. Percent of youth enrolled in higher<br />
education within one year of leaving high<br />
school.<br />
State<br />
Rate<br />
State<br />
Target<br />
Note: Data for this Indicator is from the on-site monitoring of LEAs for the given year.<br />
B. Percent of youth enrolled in higher<br />
education or competitively employed<br />
within one year of leaving high school.<br />
C. Percent of youth enrolled in higher<br />
education or in some other postsecondary<br />
education or training program; or<br />
competitively employed or in some other<br />
employment within one year of leaving<br />
high school.<br />
State<br />
Rate<br />
Indicator 20: Reported Data-Timely and Accurate*<br />
District submitted<br />
required data elements<br />
on or before due dates;<br />
made revisions within<br />
the alloted reveiw<br />
periods.<br />
Accurate and Timely<br />
Data Submission<br />
Overall (3-21)<br />
Early Childhood (3-5)<br />
School Age (5-21)<br />
State<br />
Target<br />
100.00%<br />
100.00%<br />
100.00%<br />
State<br />
Target<br />
LEA<br />
Rate<br />
LEA<br />
Rate<br />
Target Met by<br />
LEA (Y/N)<br />
Target Met<br />
by LEA<br />
(Y/N)<br />
Target Met<br />
by LEA<br />
(Y/N)<br />
*Data reviewed for timely and accurate submissions included all APSCN cycle data except for personnel<br />
Note: - - denotes not applicable<br />
96.19 100.00 — — N/A<br />
14.53<br />
State<br />
Rate<br />
49.42<br />
State<br />
Rate<br />
54.07<br />
13.00<br />
State<br />
Target<br />
49.00<br />
State<br />
Target<br />
60.00<br />
Y<br />
N/A<br />
Y<br />
— —<br />
LEA<br />
Rate<br />
— —<br />
LEA<br />
Rate<br />
— —<br />
N/A<br />
Target Met<br />
by LEA<br />
(Y/N)<br />
N/A<br />
Target Met<br />
by LEA<br />
(Y/N)<br />
N/A<br />
Page 5 of 5
LEA: 1402 - MAGNOLIA SCHOOL <strong>DISTRICT</strong><br />
<strong>ARKANSAS</strong> <strong>SPECIAL</strong> <strong>EDUCATION</strong><br />
<strong>DISTRICT</strong> <strong>ANNUAL</strong> PERFORMANCE REPORT<br />
2010/11 School Year<br />
Publication Date: March 2012<br />
Each State must have in place a State Performance Plan (SPP) to evaluate the State's efforts to meet the requirements and<br />
purposes of the implementation of the Individuals with Disabilities Education Act (IDEA). The SPP is a six-year plan, which<br />
describes Arkansas's performance on 20 indicators. The Office of Special Education Programs in the U. S. Department of<br />
Education requires that States report annually to the public on the performance of each local education agency (LEA) on 14 of<br />
20 indicators as compared with targets established by the State in the SPP. Arkansas will report indicators 1 through 14 and<br />
20 for each LEA serving children with disabilities (CWD). Any LEA not meeting targets on compliance indicators (0% for<br />
Indicators 4B, 09 & 10 and 100% for Indicators 11, 12, 13, and 20) are non-compliant with IDEA.<br />
There are no report changes for the 2010/11 school year profile; However, it is important to recognize that: .<br />
1. Indicator 01 (Graduation) is reported a year in arrear (2009/10 graduates) and is based on a four-year cohort. This<br />
means the rate is a measure of students who entered in ninth grade and graduate in four years. The calculation is a<br />
requirement under Title I of the Elementary and Secondary Education Act (ESEA).<br />
2. Indicator 02 (Drop out) is reported a year in arrear. This means the rate is a measure of students who dropped out in<br />
the 2009/10 school year. The Indicator 02 data are aligned with the Common Core of Data (CCD) requirements for<br />
grades 7-12.<br />
3. Indicator 04A and 4B (Suspension/Expulsion) is reported a year in arrear. This means the rate is a measure of<br />
students who had out-of-school suspensions and/or expulsions totaling more than 10 days.<br />
Percent of youth<br />
with IEPs<br />
graduating from<br />
high school with a<br />
regular diploma<br />
For a complete description of all the Indicators, please visit the special education website at<br />
http://arksped.k12.ar.us/sections/policy.html<br />
Indicator 01: Graduation Rates (2009/10 school year) Indicator 02: Dropout Rates (2009/10 school year)<br />
State<br />
Rate<br />
State<br />
Target<br />
75.76% 85.00%<br />
LEA<br />
Rate<br />
87.50%<br />
Target Met<br />
by LEA<br />
(Y/N)<br />
Y<br />
Percent of<br />
youth with<br />
IEPs dropping<br />
out of high<br />
school<br />
State<br />
Rate<br />
Indicator 03: Assessment on Statewide Benchmark Exam (grades 3-8, 11)<br />
A) Adequate Yearly Progress<br />
n=40<br />
Literacy<br />
Mathematics<br />
Met Disability Subgroup "n"<br />
for Reporting Purposes (Y/N)<br />
State Target for % of Districts Meeting<br />
AYP for Disability Subgroup<br />
State<br />
Target<br />
3.06% 4.20%<br />
LEA<br />
Rate<br />
4.90%<br />
% of Districts Meeting AYP<br />
for Disability Subgroup<br />
Target Met by<br />
LEA (Y/N)<br />
N<br />
Target Met by<br />
LEA(Y/N)<br />
Overall N 17.15% 6.25%<br />
NA<br />
N<br />
N<br />
Note: For a district to qualify as having a disability subgroup it must have a minimum of 40 (n=40) students with disabilities in a school building.<br />
B) Participation<br />
Participation Rate: # of<br />
CWD Tested ÷ # of CWD<br />
Enrolled in grades tested.<br />
Participation Rate: Literacy<br />
Participation Rate: Math<br />
Note: - - denotes not applicable<br />
State<br />
Rate<br />
98.78%<br />
State<br />
Target<br />
95.00%<br />
LEA<br />
Rate<br />
100.00%<br />
Target Met<br />
by LEA (Y/N)<br />
98.61% 95.00% 100.00% Y<br />
Y<br />
C) Performance Proficiency<br />
Percent of CWD Scoring<br />
Proficient or Above<br />
Proficiency Rate: Literacy<br />
Proficiency Rate:<br />
Mathematics<br />
16.00%<br />
16.00%<br />
State<br />
Rate<br />
31.49%<br />
44.86%<br />
State<br />
Target<br />
45.22%<br />
51.14%<br />
LEA<br />
Rate<br />
14.62%<br />
24.19%<br />
NA<br />
NA<br />
Target<br />
Met by<br />
LEA (Y/N)<br />
N<br />
N<br />
Page 1 of 5
LEA: 1402 - MAGNOLIA SCHOOL <strong>DISTRICT</strong><br />
Indicator 04: Out-of-School Suspensions and Expulsions (2009/10 school year)<br />
A) Suspension/Expulsion<br />
Percent difference of CWD with out-of- school suspensions and<br />
expulsions totaling greater than 10 days in a school year as<br />
compared to the same data for general education students in<br />
the district.<br />
B) Suspension/Expulsion by Race and Ethnicity<br />
Percent of districts that have: (a) a significant discrepancy, by race or<br />
ethnicity, in the rate of suspensions and expulsions of greater than 10<br />
days in a school year for children with IEPs; and (b) policies,<br />
procedures or practices that contribute to the significant discrepancy<br />
and do not comply with requirements relating to the development<br />
and implementation of IEPs, the use of positive behavioral<br />
interventions and supports, and procedural safeguards.<br />
Indicator 05: School Age (5-21) Least Restrictive Environment<br />
A) In the Regular Class 80% or more of the day<br />
Percent of CWD with<br />
IEPs receiving instruction<br />
in the regular class 80%<br />
or more of the day.<br />
State<br />
Rate<br />
State<br />
Target<br />
LEA<br />
Rate<br />
B) In the Regular Class less than 40% of the day<br />
Percent of CWD with<br />
IEPs receiving instruction<br />
in the regular class less<br />
than 60% of the day.<br />
53.87% 59.77%<br />
State<br />
Rate<br />
State<br />
Target<br />
12.42% 12.51%<br />
46.80%<br />
LEA<br />
Rate<br />
9.60%<br />
C) Other Settings outside the regular class<br />
Percent of CWD with IEPs served in<br />
public or private separate schools,<br />
residential placements, or<br />
homebound/hospital placements.<br />
State<br />
Rate<br />
State<br />
Target<br />
2.80% 2.56%<br />
Target Met<br />
by LEA (Y/N)<br />
N<br />
Target Met<br />
by LEA (Y/N)<br />
Y<br />
LEA<br />
Rate<br />
3.20%<br />
Target Met<br />
by LEA(Y/N)<br />
Indicator 06: Early Childhood (3-5) Least Restrictive Environment<br />
A) Regular Early Childhood Program<br />
Percent of children (aged 3 through 5) with IEPs attending a regular<br />
early childhood program and receiving the majority of special<br />
education and related services in the regular early childhood program<br />
Allowable<br />
Difference<br />
LEA: 1402 - MAGNOLIA SCHOOL <strong>DISTRICT</strong><br />
Indicator 07: Preschool (3-5) Outcomes<br />
a) Percent of preschool CWD<br />
children who did not<br />
improve functioning.<br />
b) Percent of preschool CWD<br />
who improved but whose<br />
functioning remained below<br />
same age peers.<br />
c) Percent of preschool CWD<br />
who improved at a level<br />
nearer to same aged peers.<br />
d) Percent of preschool CWD<br />
who improved functioning to<br />
reach a level comparable to<br />
same age peers.<br />
e) Percent of preschool CWD<br />
children who maintain<br />
functioning at a level<br />
comparable to same aged<br />
peers.<br />
Summary<br />
Statements<br />
1) Of those preschool<br />
children who entered<br />
the preschool program<br />
below age expectations<br />
in each Outcome, the<br />
percent who<br />
substantially increased<br />
their rate of growth by<br />
the time they turned 6<br />
years of age or exited<br />
the program.<br />
2) The percent of<br />
preschool children who<br />
were functioning<br />
within age expectations<br />
in each Outcome by the<br />
time they turned 6<br />
years of age or exited<br />
A) Positive Social -Emotional<br />
Skills*<br />
State<br />
Rate<br />
A) Positive Social -<br />
Emotional Skills<br />
(Including social<br />
relationships)<br />
State<br />
Rate<br />
2.14%<br />
5.31%<br />
25.97%<br />
38.22%<br />
28.36%<br />
State<br />
Target<br />
LEA<br />
Rate<br />
LEA<br />
Rate<br />
— —<br />
— —<br />
— —<br />
— —<br />
— —<br />
Target<br />
Met by<br />
LEA(Y/N)<br />
B) Acquisition and Use of<br />
Knowledge and Skills<br />
(Including early language/<br />
communication and early literacy)<br />
B) Acquisition and Use of<br />
Knowledge and Skills **<br />
State<br />
Rate<br />
1.75%<br />
6.59%<br />
34.23%<br />
43.51%<br />
13.92%<br />
State<br />
Target<br />
LEA<br />
Rate<br />
Target<br />
Met by<br />
LEA(Y/N)<br />
C) Use of Appropriate Behaviors<br />
to Meet Their Needs<br />
State<br />
Rate<br />
State<br />
Target<br />
LEA<br />
Rate<br />
Target<br />
Met by<br />
LEA(Y/N)<br />
89.61% 90.50% — — N/A 90.31% 90.50% — — N/A 90.82% 92.50% — — N/A<br />
66.58% 69.50% — — N/A 57.43% 60.50% — — N/A 76.69% 78.50% — — N/A<br />
NOTE: * Including social relationships ** Including early language/ communication and early literacy<br />
Note: - - denotes not applicable<br />
State<br />
Rate<br />
LEA<br />
Rate<br />
— —<br />
— —<br />
— —<br />
— —<br />
— —<br />
C) Use of<br />
Appropriate<br />
Behaviors to<br />
Meet Their Needs<br />
State<br />
Rate<br />
4.51%<br />
17.34%<br />
41.72%<br />
34.97%<br />
LEA<br />
Rate<br />
1.46% — —<br />
— —<br />
— —<br />
— —<br />
— —<br />
Page 3 of 5
LEA: 1402 - MAGNOLIA SCHOOL <strong>DISTRICT</strong><br />
Indicator 08: Parent Involvement<br />
Percent of surveyed<br />
parents who reported<br />
school facilitated parent<br />
involvement as a means<br />
of improving services<br />
and results for children<br />
with disabilities.<br />
Early Childhood<br />
(3-5)<br />
School Age<br />
(5-21)<br />
State<br />
Rate<br />
90.47%<br />
95.05%<br />
Indicator 09: Disproportionality - Eligibility<br />
Disproportionate representation of racial<br />
and ethnic groups in special education and<br />
related services that is a result of<br />
inappropriate identification (e.g.<br />
monitoring data, review of policies,<br />
practices, and procedures under 618(d),<br />
etc.).<br />
State<br />
Rate<br />
State<br />
Target<br />
88.00%<br />
96.00%<br />
State<br />
Target<br />
0.00% 0.00%<br />
LEA<br />
Rate<br />
— —<br />
93.06%<br />
Indicator 10: Disproportionality-Child with a Disability<br />
Disproportionate representation of racial<br />
and ethnic groups in specific disability<br />
categories that is a result of inappropriate<br />
identification (e.g. monitoring data, review<br />
of policies, practices, and procedures under<br />
618(d), etc.).<br />
Indicator 11: Child Find<br />
Percent of children with<br />
parental consent to evaluate<br />
who are evaluated within<br />
the State established timeline<br />
of 60 days.<br />
Overall<br />
(3-21)<br />
Early Childhood<br />
(3-5)<br />
School Age<br />
(5-21)<br />
State<br />
Rate<br />
0.00%<br />
Indicator 12: Early Childhood Transition<br />
Percent of children referred by Part C prior to<br />
age 3, who are found eligible for Part B, and<br />
who have an IEP developed and implemented<br />
by their third birthday.<br />
Note: - - denotes not applicable<br />
State<br />
Rate<br />
99.41%<br />
99.70%<br />
98.97%<br />
State<br />
Rate<br />
State<br />
Target<br />
0.00%<br />
State<br />
Target<br />
100.00%<br />
100.00%<br />
100.00%<br />
State<br />
Target<br />
Target Met by<br />
LEA (Y/N)<br />
Y<br />
Target Met by<br />
LEA (Y/N)<br />
Y<br />
LEA<br />
Rate<br />
100.00%<br />
— —<br />
100.00%<br />
LEA<br />
Rate<br />
Target Met by<br />
LEA (Y/N)<br />
N/A<br />
N<br />
Note: The target for Indicator 09 is to have zero percent<br />
(0%) of districts identified as having disproportionate<br />
representation as a result of inappropriate<br />
identification in eligibility.<br />
Note: The target for Indicator 10 is to have zero<br />
percent (0%) of districts identified as having<br />
disproportionate representation as a result of<br />
inappropriate identification in a disability<br />
category.<br />
Target Met by<br />
LEA (Y/N)<br />
N/A<br />
Y<br />
Target Met<br />
by LEA<br />
(Y/N)<br />
99.21% 100.00% - - N/A<br />
Y<br />
Note: * Indicates a zero reponse rate for the<br />
district.<br />
Page 4 of 5
LEA: 1402 - MAGNOLIA SCHOOL <strong>DISTRICT</strong><br />
Indicator 13: Secondary Transition<br />
Percent of youth with disabilities aged 16 and<br />
up with an IEP that includes coordinated,<br />
measurable, annual IEP goals and transition<br />
services that will reasonably enable the student<br />
to meet the post-secondary goals.<br />
Indicator 14: Post-School Outcomes<br />
A. Percent of youth enrolled in higher<br />
education within one year of leaving high<br />
school.<br />
State<br />
Rate<br />
State<br />
Target<br />
Note: Data for this Indicator is from the on-site monitoring of LEAs for the given year.<br />
B. Percent of youth enrolled in higher<br />
education or competitively employed<br />
within one year of leaving high school.<br />
C. Percent of youth enrolled in higher<br />
education or in some other postsecondary<br />
education or training program; or<br />
competitively employed or in some other<br />
employment within one year of leaving<br />
high school.<br />
State<br />
Rate<br />
Indicator 20: Reported Data-Timely and Accurate*<br />
District submitted<br />
required data elements<br />
on or before due dates;<br />
made revisions within<br />
the alloted reveiw<br />
periods.<br />
Accurate and Timely<br />
Data Submission<br />
Overall (3-21)<br />
Early Childhood (3-5)<br />
School Age (5-21)<br />
State<br />
Target<br />
100.00%<br />
100.00%<br />
100.00%<br />
State<br />
Target<br />
LEA<br />
Rate<br />
LEA<br />
Rate<br />
Target Met by<br />
LEA (Y/N)<br />
Target Met<br />
by LEA<br />
(Y/N)<br />
Target Met<br />
by LEA<br />
(Y/N)<br />
*Data reviewed for timely and accurate submissions included all APSCN cycle data except for personnel<br />
Note: - - denotes not applicable<br />
96.19 100.00 — — N/A<br />
14.53<br />
State<br />
Rate<br />
49.42<br />
State<br />
Rate<br />
54.07<br />
13.00<br />
State<br />
Target<br />
49.00<br />
State<br />
Target<br />
60.00<br />
Y<br />
N/A<br />
Y<br />
21.43%<br />
LEA<br />
Rate<br />
35.71%<br />
LEA<br />
Rate<br />
35.71%<br />
Y<br />
Target Met<br />
by LEA<br />
(Y/N)<br />
N<br />
Target Met<br />
by LEA<br />
(Y/N)<br />
N<br />
Page 5 of 5
<strong>ARKANSAS</strong> <strong>SPECIAL</strong> <strong>EDUCATION</strong><br />
<strong>DISTRICT</strong> <strong>ANNUAL</strong> PERFORMANCE REPORT<br />
2010/11 School Year<br />
Publication Date: March 2012<br />
Each State must have in place a State Performance Plan (SPP) to evaluate the State's efforts to meet the requirements and<br />
purposes of the implementation of the Individuals with Disabilities Education Act (IDEA). The SPP is a six-year plan, which<br />
describes Arkansas's performance on 20 indicators. The Office of Special Education Programs in the U. S. Department of<br />
Education requires that States report annually to the public on the performance of each local education agency (LEA) on 14 of<br />
20 indicators as compared with targets established by the State in the SPP. Arkansas will report indicators 1 through 14 and<br />
20 for each LEA serving children with disabilities (CWD). Any LEA not meeting targets on compliance indicators (0% for<br />
Indicators 4B, 09 & 10 and 100% for Indicators 11, 12, 13, and 20) are non-compliant with IDEA.<br />
There are no report changes for the 2010/11 school year profile; However, it is important to recognize that: .<br />
1. Indicator 01 (Graduation) is reported a year in arrear (2009/10 graduates) and is based on a four-year cohort. This<br />
means the rate is a measure of students who entered in ninth grade and graduate in four years. The calculation is a<br />
requirement under Title I of the Elementary and Secondary Education Act (ESEA).<br />
2. Indicator 02 (Drop out) is reported a year in arrear. This means the rate is a measure of students who dropped out in<br />
the 2009/10 school year. The Indicator 02 data are aligned with the Common Core of Data (CCD) requirements for<br />
grades 7-12.<br />
3. Indicator 04A and 4B (Suspension/Expulsion) is reported a year in arrear. This means the rate is a measure of<br />
students who had out-of-school suspensions and/or expulsions totaling more than 10 days.<br />
For a complete description of all the Indicators, please visit the special education website at<br />
http://arksped.k12.ar.us/sections/policy.html<br />
LEA: 1408 - EMERSON-TAYLOR SCHOOL <strong>DISTRICT</strong><br />
Indicator 01: Graduation Rates (2009/10 school year) Indicator 02: Dropout Rates (2009/10 school year)<br />
Percent of youth<br />
with IEPs<br />
graduating from<br />
high school with a<br />
regular diploma<br />
State<br />
Rate<br />
State<br />
Target<br />
75.76% 85.00%<br />
LEA<br />
Rate<br />
62.50%<br />
Target Met<br />
by LEA<br />
(Y/N)<br />
N<br />
Percent of<br />
youth with<br />
IEPs dropping<br />
out of high<br />
school<br />
State<br />
Rate<br />
Indicator 03: Assessment on Statewide Benchmark Exam (grades 3-8, 11)<br />
A) Adequate Yearly Progress<br />
n=40<br />
Literacy<br />
Mathematics<br />
Met Disability Subgroup "n"<br />
for Reporting Purposes (Y/N)<br />
State Target for % of Districts Meeting<br />
AYP for Disability Subgroup<br />
State<br />
Target<br />
3.06% 4.20%<br />
LEA<br />
Rate<br />
6.06%<br />
% of Districts Meeting AYP<br />
for Disability Subgroup<br />
Target Met by<br />
LEA (Y/N)<br />
N<br />
Target Met by<br />
LEA(Y/N)<br />
Overall N 17.15% 6.25%<br />
NA<br />
N<br />
N<br />
Note: For a district to qualify as having a disability subgroup it must have a minimum of 40 (n=40) students with disabilities in a school building.<br />
B) Participation<br />
Participation Rate: # of<br />
CWD Tested ÷ # of CWD<br />
Enrolled in grades tested.<br />
Participation Rate: Literacy<br />
Participation Rate: Math<br />
Note: - - denotes not applicable<br />
State<br />
Rate<br />
98.78%<br />
State<br />
Target<br />
95.00%<br />
LEA<br />
Rate<br />
96.77%<br />
Target Met<br />
by LEA (Y/N)<br />
98.61% 95.00% 93.33% N<br />
Y<br />
C) Performance Proficiency<br />
Percent of CWD Scoring<br />
Proficient or Above<br />
Proficiency Rate: Literacy<br />
Proficiency Rate:<br />
Mathematics<br />
16.00%<br />
16.00%<br />
State<br />
Rate<br />
31.49%<br />
44.86%<br />
State<br />
Target<br />
45.22%<br />
51.14%<br />
LEA<br />
Rate<br />
26.67%<br />
60.71%<br />
NA<br />
NA<br />
Target<br />
Met by<br />
LEA (Y/N)<br />
N<br />
Y<br />
Page 1 of 5
LEA: 1408 - EMERSON-TAYLOR SCHOOL <strong>DISTRICT</strong><br />
Indicator 04: Out-of-School Suspensions and Expulsions (2009/10 school year)<br />
A) Suspension/Expulsion<br />
Percent difference of CWD with out-of- school suspensions and<br />
expulsions totaling greater than 10 days in a school year as<br />
compared to the same data for general education students in<br />
the district.<br />
B) Suspension/Expulsion by Race and Ethnicity<br />
Percent of districts that have: (a) a significant discrepancy, by race or<br />
ethnicity, in the rate of suspensions and expulsions of greater than 10<br />
days in a school year for children with IEPs; and (b) policies,<br />
procedures or practices that contribute to the significant discrepancy<br />
and do not comply with requirements relating to the development<br />
and implementation of IEPs, the use of positive behavioral<br />
interventions and supports, and procedural safeguards.<br />
Indicator 05: School Age (5-21) Least Restrictive Environment<br />
A) In the Regular Class 80% or more of the day<br />
Percent of CWD with<br />
IEPs receiving instruction<br />
in the regular class 80%<br />
or more of the day.<br />
State<br />
Rate<br />
State<br />
Target<br />
LEA<br />
Rate<br />
B) In the Regular Class less than 40% of the day<br />
Percent of CWD with<br />
IEPs receiving instruction<br />
in the regular class less<br />
than 60% of the day.<br />
53.87% 59.77%<br />
State<br />
Rate<br />
State<br />
Target<br />
12.42% 12.51%<br />
81.43%<br />
LEA<br />
Rate<br />
4.29%<br />
C) Other Settings outside the regular class<br />
Percent of CWD with IEPs served in<br />
public or private separate schools,<br />
residential placements, or<br />
homebound/hospital placements.<br />
State<br />
Rate<br />
State<br />
Target<br />
2.80% 2.56%<br />
Target Met<br />
by LEA (Y/N)<br />
Y<br />
Target Met<br />
by LEA (Y/N)<br />
Y<br />
LEA<br />
Rate<br />
0.00%<br />
Target Met<br />
by LEA(Y/N)<br />
Indicator 06: Early Childhood (3-5) Least Restrictive Environment<br />
A) Regular Early Childhood Program<br />
Percent of children (aged 3 through 5) with IEPs attending a regular<br />
early childhood program and receiving the majority of special<br />
education and related services in the regular early childhood program<br />
Allowable<br />
Difference<br />
LEA: 1408 - EMERSON-TAYLOR SCHOOL <strong>DISTRICT</strong><br />
Indicator 07: Preschool (3-5) Outcomes<br />
a) Percent of preschool CWD<br />
children who did not<br />
improve functioning.<br />
b) Percent of preschool CWD<br />
who improved but whose<br />
functioning remained below<br />
same age peers.<br />
c) Percent of preschool CWD<br />
who improved at a level<br />
nearer to same aged peers.<br />
d) Percent of preschool CWD<br />
who improved functioning to<br />
reach a level comparable to<br />
same age peers.<br />
e) Percent of preschool CWD<br />
children who maintain<br />
functioning at a level<br />
comparable to same aged<br />
peers.<br />
Summary<br />
Statements<br />
1) Of those preschool<br />
children who entered<br />
the preschool program<br />
below age expectations<br />
in each Outcome, the<br />
percent who<br />
substantially increased<br />
their rate of growth by<br />
the time they turned 6<br />
years of age or exited<br />
the program.<br />
2) The percent of<br />
preschool children who<br />
were functioning<br />
within age expectations<br />
in each Outcome by the<br />
time they turned 6<br />
years of age or exited<br />
A) Positive Social -Emotional<br />
Skills*<br />
State<br />
Rate<br />
A) Positive Social -<br />
Emotional Skills<br />
(Including social<br />
relationships)<br />
State<br />
Rate<br />
2.14%<br />
5.31%<br />
25.97%<br />
38.22%<br />
28.36%<br />
State<br />
Target<br />
LEA<br />
Rate<br />
LEA<br />
Rate<br />
— —<br />
— —<br />
— —<br />
— —<br />
— —<br />
Target<br />
Met by<br />
LEA(Y/N)<br />
B) Acquisition and Use of<br />
Knowledge and Skills<br />
(Including early language/<br />
communication and early literacy)<br />
B) Acquisition and Use of<br />
Knowledge and Skills **<br />
State<br />
Rate<br />
1.75%<br />
6.59%<br />
34.23%<br />
43.51%<br />
13.92%<br />
State<br />
Target<br />
LEA<br />
Rate<br />
Target<br />
Met by<br />
LEA(Y/N)<br />
C) Use of Appropriate Behaviors<br />
to Meet Their Needs<br />
State<br />
Rate<br />
State<br />
Target<br />
LEA<br />
Rate<br />
Target<br />
Met by<br />
LEA(Y/N)<br />
89.61% 90.50% — — N/A 90.31% 90.50% — — N/A 90.82% 92.50% — — N/A<br />
66.58% 69.50% — — N/A 57.43% 60.50% — — N/A 76.69% 78.50% — — N/A<br />
NOTE: * Including social relationships ** Including early language/ communication and early literacy<br />
Note: - - denotes not applicable<br />
State<br />
Rate<br />
LEA<br />
Rate<br />
— —<br />
— —<br />
— —<br />
— —<br />
— —<br />
C) Use of<br />
Appropriate<br />
Behaviors to<br />
Meet Their Needs<br />
State<br />
Rate<br />
4.51%<br />
17.34%<br />
41.72%<br />
34.97%<br />
LEA<br />
Rate<br />
1.46% — —<br />
— —<br />
— —<br />
— —<br />
— —<br />
Page 3 of 5
LEA: 1408 - EMERSON-TAYLOR SCHOOL <strong>DISTRICT</strong><br />
Indicator 08: Parent Involvement<br />
Percent of surveyed<br />
parents who reported<br />
school facilitated parent<br />
involvement as a means<br />
of improving services<br />
and results for children<br />
with disabilities.<br />
Early Childhood<br />
(3-5)<br />
School Age<br />
(5-21)<br />
State<br />
Rate<br />
90.47%<br />
95.05%<br />
Indicator 09: Disproportionality - Eligibility<br />
Disproportionate representation of racial<br />
and ethnic groups in special education and<br />
related services that is a result of<br />
inappropriate identification (e.g.<br />
monitoring data, review of policies,<br />
practices, and procedures under 618(d),<br />
etc.).<br />
State<br />
Rate<br />
State<br />
Target<br />
88.00%<br />
96.00%<br />
State<br />
Target<br />
0.00% 0.00%<br />
LEA<br />
Rate<br />
— —<br />
97.87%<br />
Indicator 10: Disproportionality-Child with a Disability<br />
Disproportionate representation of racial<br />
and ethnic groups in specific disability<br />
categories that is a result of inappropriate<br />
identification (e.g. monitoring data, review<br />
of policies, practices, and procedures under<br />
618(d), etc.).<br />
Indicator 11: Child Find<br />
Percent of children with<br />
parental consent to evaluate<br />
who are evaluated within<br />
the State established timeline<br />
of 60 days.<br />
Overall<br />
(3-21)<br />
Early Childhood<br />
(3-5)<br />
School Age<br />
(5-21)<br />
State<br />
Rate<br />
0.00%<br />
Indicator 12: Early Childhood Transition<br />
Percent of children referred by Part C prior to<br />
age 3, who are found eligible for Part B, and<br />
who have an IEP developed and implemented<br />
by their third birthday.<br />
Note: - - denotes not applicable<br />
State<br />
Rate<br />
99.41%<br />
99.70%<br />
98.97%<br />
State<br />
Rate<br />
State<br />
Target<br />
0.00%<br />
State<br />
Target<br />
100.00%<br />
100.00%<br />
100.00%<br />
State<br />
Target<br />
Target Met by<br />
LEA (Y/N)<br />
Y<br />
Target Met by<br />
LEA (Y/N)<br />
Y<br />
LEA<br />
Rate<br />
100.00%<br />
— —<br />
100.00%<br />
LEA<br />
Rate<br />
Target Met by<br />
LEA (Y/N)<br />
N/A<br />
Y<br />
Note: The target for Indicator 09 is to have zero percent<br />
(0%) of districts identified as having disproportionate<br />
representation as a result of inappropriate<br />
identification in eligibility.<br />
Note: The target for Indicator 10 is to have zero<br />
percent (0%) of districts identified as having<br />
disproportionate representation as a result of<br />
inappropriate identification in a disability<br />
category.<br />
Target Met by<br />
LEA (Y/N)<br />
N/A<br />
Y<br />
Target Met<br />
by LEA<br />
(Y/N)<br />
99.21% 100.00% - - N/A<br />
Y<br />
Note: * Indicates a zero reponse rate for the<br />
district.<br />
Page 4 of 5
LEA: 1408 - EMERSON-TAYLOR SCHOOL <strong>DISTRICT</strong><br />
Indicator 13: Secondary Transition<br />
Percent of youth with disabilities aged 16 and<br />
up with an IEP that includes coordinated,<br />
measurable, annual IEP goals and transition<br />
services that will reasonably enable the student<br />
to meet the post-secondary goals.<br />
Indicator 14: Post-School Outcomes<br />
A. Percent of youth enrolled in higher<br />
education within one year of leaving high<br />
school.<br />
State<br />
Rate<br />
State<br />
Target<br />
Note: Data for this Indicator is from the on-site monitoring of LEAs for the given year.<br />
B. Percent of youth enrolled in higher<br />
education or competitively employed<br />
within one year of leaving high school.<br />
C. Percent of youth enrolled in higher<br />
education or in some other postsecondary<br />
education or training program; or<br />
competitively employed or in some other<br />
employment within one year of leaving<br />
high school.<br />
State<br />
Rate<br />
Indicator 20: Reported Data-Timely and Accurate*<br />
District submitted<br />
required data elements<br />
on or before due dates;<br />
made revisions within<br />
the alloted reveiw<br />
periods.<br />
Accurate and Timely<br />
Data Submission<br />
Overall (3-21)<br />
Early Childhood (3-5)<br />
School Age (5-21)<br />
State<br />
Target<br />
100.00%<br />
100.00%<br />
100.00%<br />
State<br />
Target<br />
LEA<br />
Rate<br />
LEA<br />
Rate<br />
Target Met by<br />
LEA (Y/N)<br />
Target Met<br />
by LEA<br />
(Y/N)<br />
Target Met<br />
by LEA<br />
(Y/N)<br />
*Data reviewed for timely and accurate submissions included all APSCN cycle data except for personnel<br />
Note: - - denotes not applicable<br />
96.19 100.00 — — N/A<br />
14.53<br />
State<br />
Rate<br />
49.42<br />
State<br />
Rate<br />
54.07<br />
13.00<br />
State<br />
Target<br />
49.00<br />
State<br />
Target<br />
60.00<br />
Y<br />
N/A<br />
Y<br />
— —<br />
LEA<br />
Rate<br />
— —<br />
LEA<br />
Rate<br />
— —<br />
N/A<br />
Target Met<br />
by LEA<br />
(Y/N)<br />
N/A<br />
Target Met<br />
by LEA<br />
(Y/N)<br />
N/A<br />
Page 5 of 5
<strong>ARKANSAS</strong> <strong>SPECIAL</strong> <strong>EDUCATION</strong><br />
<strong>DISTRICT</strong> <strong>ANNUAL</strong> PERFORMANCE REPORT<br />
2010/11 School Year<br />
Publication Date: March 2012<br />
Each State must have in place a State Performance Plan (SPP) to evaluate the State's efforts to meet the requirements and<br />
purposes of the implementation of the Individuals with Disabilities Education Act (IDEA). The SPP is a six-year plan, which<br />
describes Arkansas's performance on 20 indicators. The Office of Special Education Programs in the U. S. Department of<br />
Education requires that States report annually to the public on the performance of each local education agency (LEA) on 14 of<br />
20 indicators as compared with targets established by the State in the SPP. Arkansas will report indicators 1 through 14 and<br />
20 for each LEA serving children with disabilities (CWD). Any LEA not meeting targets on compliance indicators (0% for<br />
Indicators 4B, 09 & 10 and 100% for Indicators 11, 12, 13, and 20) are non-compliant with IDEA.<br />
There are no report changes for the 2010/11 school year profile; However, it is important to recognize that: .<br />
1. Indicator 01 (Graduation) is reported a year in arrear (2009/10 graduates) and is based on a four-year cohort. This<br />
means the rate is a measure of students who entered in ninth grade and graduate in four years. The calculation is a<br />
requirement under Title I of the Elementary and Secondary Education Act (ESEA).<br />
2. Indicator 02 (Drop out) is reported a year in arrear. This means the rate is a measure of students who dropped out in<br />
the 2009/10 school year. The Indicator 02 data are aligned with the Common Core of Data (CCD) requirements for<br />
grades 7-12.<br />
3. Indicator 04A and 4B (Suspension/Expulsion) is reported a year in arrear. This means the rate is a measure of<br />
students who had out-of-school suspensions and/or expulsions totaling more than 10 days.<br />
For a complete description of all the Indicators, please visit the special education website at<br />
http://arksped.k12.ar.us/sections/policy.html<br />
LEA: 1503 - NEMO VISTA SCHOOL <strong>DISTRICT</strong><br />
Indicator 01: Graduation Rates (2009/10 school year) Indicator 02: Dropout Rates (2009/10 school year)<br />
Percent of youth<br />
with IEPs<br />
graduating from<br />
high school with a<br />
regular diploma<br />
State<br />
Rate<br />
State<br />
Target<br />
75.76% 85.00%<br />
LEA<br />
Rate<br />
100.00%<br />
Target Met<br />
by LEA<br />
(Y/N)<br />
Y<br />
Percent of<br />
youth with<br />
IEPs dropping<br />
out of high<br />
school<br />
State<br />
Rate<br />
Indicator 03: Assessment on Statewide Benchmark Exam (grades 3-8, 11)<br />
A) Adequate Yearly Progress<br />
n=40<br />
Literacy<br />
Mathematics<br />
Met Disability Subgroup "n"<br />
for Reporting Purposes (Y/N)<br />
State Target for % of Districts Meeting<br />
AYP for Disability Subgroup<br />
State<br />
Target<br />
3.06% 4.20%<br />
LEA<br />
Rate<br />
3.03%<br />
% of Districts Meeting AYP<br />
for Disability Subgroup<br />
Target Met by<br />
LEA (Y/N)<br />
Y<br />
Target Met by<br />
LEA(Y/N)<br />
Overall N 17.15% 6.25%<br />
NA<br />
N<br />
N<br />
Note: For a district to qualify as having a disability subgroup it must have a minimum of 40 (n=40) students with disabilities in a school building.<br />
B) Participation<br />
Participation Rate: # of<br />
CWD Tested ÷ # of CWD<br />
Enrolled in grades tested.<br />
Participation Rate: Literacy<br />
Participation Rate: Math<br />
Note: - - denotes not applicable<br />
State<br />
Rate<br />
98.78%<br />
State<br />
Target<br />
95.00%<br />
LEA<br />
Rate<br />
100.00%<br />
Target Met<br />
by LEA (Y/N)<br />
98.61% 95.00% 100.00% Y<br />
Y<br />
C) Performance Proficiency<br />
Percent of CWD Scoring<br />
Proficient or Above<br />
Proficiency Rate: Literacy<br />
Proficiency Rate:<br />
Mathematics<br />
16.00%<br />
16.00%<br />
State<br />
Rate<br />
31.49%<br />
44.86%<br />
State<br />
Target<br />
45.22%<br />
51.14%<br />
LEA<br />
Rate<br />
39.02%<br />
69.23%<br />
NA<br />
NA<br />
Target<br />
Met by<br />
LEA (Y/N)<br />
N<br />
Y<br />
Page 1 of 5
LEA: 1503 - NEMO VISTA SCHOOL <strong>DISTRICT</strong><br />
Indicator 04: Out-of-School Suspensions and Expulsions (2009/10 school year)<br />
A) Suspension/Expulsion<br />
Percent difference of CWD with out-of- school suspensions and<br />
expulsions totaling greater than 10 days in a school year as<br />
compared to the same data for general education students in<br />
the district.<br />
B) Suspension/Expulsion by Race and Ethnicity<br />
Percent of districts that have: (a) a significant discrepancy, by race or<br />
ethnicity, in the rate of suspensions and expulsions of greater than 10<br />
days in a school year for children with IEPs; and (b) policies,<br />
procedures or practices that contribute to the significant discrepancy<br />
and do not comply with requirements relating to the development<br />
and implementation of IEPs, the use of positive behavioral<br />
interventions and supports, and procedural safeguards.<br />
Indicator 05: School Age (5-21) Least Restrictive Environment<br />
A) In the Regular Class 80% or more of the day<br />
Percent of CWD with<br />
IEPs receiving instruction<br />
in the regular class 80%<br />
or more of the day.<br />
State<br />
Rate<br />
State<br />
Target<br />
LEA<br />
Rate<br />
B) In the Regular Class less than 40% of the day<br />
Percent of CWD with<br />
IEPs receiving instruction<br />
in the regular class less<br />
than 60% of the day.<br />
53.87% 59.77%<br />
State<br />
Rate<br />
State<br />
Target<br />
12.42% 12.51%<br />
61.33%<br />
LEA<br />
Rate<br />
5.33%<br />
C) Other Settings outside the regular class<br />
Percent of CWD with IEPs served in<br />
public or private separate schools,<br />
residential placements, or<br />
homebound/hospital placements.<br />
State<br />
Rate<br />
State<br />
Target<br />
2.80% 2.56%<br />
Target Met<br />
by LEA (Y/N)<br />
Y<br />
Target Met<br />
by LEA (Y/N)<br />
Y<br />
LEA<br />
Rate<br />
0.00%<br />
Target Met<br />
by LEA(Y/N)<br />
Indicator 06: Early Childhood (3-5) Least Restrictive Environment<br />
A) Regular Early Childhood Program<br />
Percent of children (aged 3 through 5) with IEPs attending a regular<br />
early childhood program and receiving the majority of special<br />
education and related services in the regular early childhood program<br />
Allowable<br />
Difference<br />
LEA: 1503 - NEMO VISTA SCHOOL <strong>DISTRICT</strong><br />
Indicator 07: Preschool (3-5) Outcomes<br />
a) Percent of preschool CWD<br />
children who did not<br />
improve functioning.<br />
b) Percent of preschool CWD<br />
who improved but whose<br />
functioning remained below<br />
same age peers.<br />
c) Percent of preschool CWD<br />
who improved at a level<br />
nearer to same aged peers.<br />
d) Percent of preschool CWD<br />
who improved functioning to<br />
reach a level comparable to<br />
same age peers.<br />
e) Percent of preschool CWD<br />
children who maintain<br />
functioning at a level<br />
comparable to same aged<br />
peers.<br />
Summary<br />
Statements<br />
1) Of those preschool<br />
children who entered<br />
the preschool program<br />
below age expectations<br />
in each Outcome, the<br />
percent who<br />
substantially increased<br />
their rate of growth by<br />
the time they turned 6<br />
years of age or exited<br />
the program.<br />
2) The percent of<br />
preschool children who<br />
were functioning<br />
within age expectations<br />
in each Outcome by the<br />
time they turned 6<br />
years of age or exited<br />
A) Positive Social -Emotional<br />
Skills*<br />
State<br />
Rate<br />
A) Positive Social -<br />
Emotional Skills<br />
(Including social<br />
relationships)<br />
State<br />
Rate<br />
2.14%<br />
5.31%<br />
25.97%<br />
38.22%<br />
28.36%<br />
State<br />
Target<br />
LEA<br />
Rate<br />
LEA<br />
Rate<br />
— —<br />
— —<br />
— —<br />
— —<br />
— —<br />
Target<br />
Met by<br />
LEA(Y/N)<br />
B) Acquisition and Use of<br />
Knowledge and Skills<br />
(Including early language/<br />
communication and early literacy)<br />
B) Acquisition and Use of<br />
Knowledge and Skills **<br />
State<br />
Rate<br />
1.75%<br />
6.59%<br />
34.23%<br />
43.51%<br />
13.92%<br />
State<br />
Target<br />
LEA<br />
Rate<br />
Target<br />
Met by<br />
LEA(Y/N)<br />
C) Use of Appropriate Behaviors<br />
to Meet Their Needs<br />
State<br />
Rate<br />
State<br />
Target<br />
LEA<br />
Rate<br />
Target<br />
Met by<br />
LEA(Y/N)<br />
89.61% 90.50% — — N/A 90.31% 90.50% — — N/A 90.82% 92.50% — — N/A<br />
66.58% 69.50% — — N/A 57.43% 60.50% — — N/A 76.69% 78.50% — — N/A<br />
NOTE: * Including social relationships ** Including early language/ communication and early literacy<br />
Note: - - denotes not applicable<br />
State<br />
Rate<br />
LEA<br />
Rate<br />
— —<br />
— —<br />
— —<br />
— —<br />
— —<br />
C) Use of<br />
Appropriate<br />
Behaviors to<br />
Meet Their Needs<br />
State<br />
Rate<br />
4.51%<br />
17.34%<br />
41.72%<br />
34.97%<br />
LEA<br />
Rate<br />
1.46% — —<br />
— —<br />
— —<br />
— —<br />
— —<br />
Page 3 of 5
LEA: 1503 - NEMO VISTA SCHOOL <strong>DISTRICT</strong><br />
Indicator 08: Parent Involvement<br />
Percent of surveyed<br />
parents who reported<br />
school facilitated parent<br />
involvement as a means<br />
of improving services<br />
and results for children<br />
with disabilities.<br />
Early Childhood<br />
(3-5)<br />
School Age<br />
(5-21)<br />
State<br />
Rate<br />
90.47%<br />
95.05%<br />
Indicator 09: Disproportionality - Eligibility<br />
Disproportionate representation of racial<br />
and ethnic groups in special education and<br />
related services that is a result of<br />
inappropriate identification (e.g.<br />
monitoring data, review of policies,<br />
practices, and procedures under 618(d),<br />
etc.).<br />
State<br />
Rate<br />
State<br />
Target<br />
88.00%<br />
96.00%<br />
State<br />
Target<br />
0.00% 0.00%<br />
LEA<br />
Rate<br />
— —<br />
91.67%<br />
Indicator 10: Disproportionality-Child with a Disability<br />
Disproportionate representation of racial<br />
and ethnic groups in specific disability<br />
categories that is a result of inappropriate<br />
identification (e.g. monitoring data, review<br />
of policies, practices, and procedures under<br />
618(d), etc.).<br />
Indicator 11: Child Find<br />
Percent of children with<br />
parental consent to evaluate<br />
who are evaluated within<br />
the State established timeline<br />
of 60 days.<br />
Overall<br />
(3-21)<br />
Early Childhood<br />
(3-5)<br />
School Age<br />
(5-21)<br />
State<br />
Rate<br />
0.00%<br />
Indicator 12: Early Childhood Transition<br />
Percent of children referred by Part C prior to<br />
age 3, who are found eligible for Part B, and<br />
who have an IEP developed and implemented<br />
by their third birthday.<br />
Note: - - denotes not applicable<br />
State<br />
Rate<br />
99.41%<br />
99.70%<br />
98.97%<br />
State<br />
Rate<br />
State<br />
Target<br />
0.00%<br />
State<br />
Target<br />
100.00%<br />
100.00%<br />
100.00%<br />
State<br />
Target<br />
Target Met by<br />
LEA (Y/N)<br />
Y<br />
Target Met by<br />
LEA (Y/N)<br />
Y<br />
LEA<br />
Rate<br />
100.00%<br />
— —<br />
100.00%<br />
LEA<br />
Rate<br />
Target Met by<br />
LEA (Y/N)<br />
N/A<br />
N<br />
Note: The target for Indicator 09 is to have zero percent<br />
(0%) of districts identified as having disproportionate<br />
representation as a result of inappropriate<br />
identification in eligibility.<br />
Note: The target for Indicator 10 is to have zero<br />
percent (0%) of districts identified as having<br />
disproportionate representation as a result of<br />
inappropriate identification in a disability<br />
category.<br />
Target Met by<br />
LEA (Y/N)<br />
N/A<br />
Y<br />
Target Met<br />
by LEA<br />
(Y/N)<br />
99.21% 100.00% - - N/A<br />
Y<br />
Note: * Indicates a zero reponse rate for the<br />
district.<br />
Page 4 of 5
LEA: 1503 - NEMO VISTA SCHOOL <strong>DISTRICT</strong><br />
Indicator 13: Secondary Transition<br />
Percent of youth with disabilities aged 16 and<br />
up with an IEP that includes coordinated,<br />
measurable, annual IEP goals and transition<br />
services that will reasonably enable the student<br />
to meet the post-secondary goals.<br />
Indicator 14: Post-School Outcomes<br />
A. Percent of youth enrolled in higher<br />
education within one year of leaving high<br />
school.<br />
State<br />
Rate<br />
State<br />
Target<br />
Note: Data for this Indicator is from the on-site monitoring of LEAs for the given year.<br />
B. Percent of youth enrolled in higher<br />
education or competitively employed<br />
within one year of leaving high school.<br />
C. Percent of youth enrolled in higher<br />
education or in some other postsecondary<br />
education or training program; or<br />
competitively employed or in some other<br />
employment within one year of leaving<br />
high school.<br />
State<br />
Rate<br />
Indicator 20: Reported Data-Timely and Accurate*<br />
District submitted<br />
required data elements<br />
on or before due dates;<br />
made revisions within<br />
the alloted reveiw<br />
periods.<br />
Accurate and Timely<br />
Data Submission<br />
Overall (3-21)<br />
Early Childhood (3-5)<br />
School Age (5-21)<br />
State<br />
Target<br />
100.00%<br />
100.00%<br />
100.00%<br />
State<br />
Target<br />
LEA<br />
Rate<br />
LEA<br />
Rate<br />
Target Met by<br />
LEA (Y/N)<br />
Target Met<br />
by LEA<br />
(Y/N)<br />
Target Met<br />
by LEA<br />
(Y/N)<br />
*Data reviewed for timely and accurate submissions included all APSCN cycle data except for personnel<br />
Note: - - denotes not applicable<br />
96.19 100.00 — — N/A<br />
14.53<br />
State<br />
Rate<br />
49.42<br />
State<br />
Rate<br />
54.07<br />
13.00<br />
State<br />
Target<br />
49.00<br />
State<br />
Target<br />
60.00<br />
Y<br />
N/A<br />
Y<br />
— —<br />
LEA<br />
Rate<br />
— —<br />
LEA<br />
Rate<br />
— —<br />
N/A<br />
Target Met<br />
by LEA<br />
(Y/N)<br />
N/A<br />
Target Met<br />
by LEA<br />
(Y/N)<br />
N/A<br />
Page 5 of 5
<strong>ARKANSAS</strong> <strong>SPECIAL</strong> <strong>EDUCATION</strong><br />
<strong>DISTRICT</strong> <strong>ANNUAL</strong> PERFORMANCE REPORT<br />
2010/11 School Year<br />
Publication Date: March 2012<br />
Each State must have in place a State Performance Plan (SPP) to evaluate the State's efforts to meet the requirements and<br />
purposes of the implementation of the Individuals with Disabilities Education Act (IDEA). The SPP is a six-year plan, which<br />
describes Arkansas's performance on 20 indicators. The Office of Special Education Programs in the U. S. Department of<br />
Education requires that States report annually to the public on the performance of each local education agency (LEA) on 14 of<br />
20 indicators as compared with targets established by the State in the SPP. Arkansas will report indicators 1 through 14 and<br />
20 for each LEA serving children with disabilities (CWD). Any LEA not meeting targets on compliance indicators (0% for<br />
Indicators 4B, 09 & 10 and 100% for Indicators 11, 12, 13, and 20) are non-compliant with IDEA.<br />
There are no report changes for the 2010/11 school year profile; However, it is important to recognize that: .<br />
1. Indicator 01 (Graduation) is reported a year in arrear (2009/10 graduates) and is based on a four-year cohort. This<br />
means the rate is a measure of students who entered in ninth grade and graduate in four years. The calculation is a<br />
requirement under Title I of the Elementary and Secondary Education Act (ESEA).<br />
2. Indicator 02 (Drop out) is reported a year in arrear. This means the rate is a measure of students who dropped out in<br />
the 2009/10 school year. The Indicator 02 data are aligned with the Common Core of Data (CCD) requirements for<br />
grades 7-12.<br />
3. Indicator 04A and 4B (Suspension/Expulsion) is reported a year in arrear. This means the rate is a measure of<br />
students who had out-of-school suspensions and/or expulsions totaling more than 10 days.<br />
For a complete description of all the Indicators, please visit the special education website at<br />
http://arksped.k12.ar.us/sections/policy.html<br />
LEA: 1505 - WONDERVIEW SCHOOL <strong>DISTRICT</strong><br />
Indicator 01: Graduation Rates (2009/10 school year) Indicator 02: Dropout Rates (2009/10 school year)<br />
Percent of youth<br />
with IEPs<br />
graduating from<br />
high school with a<br />
regular diploma<br />
State<br />
Rate<br />
State<br />
Target<br />
75.76% 85.00%<br />
LEA<br />
Rate<br />
75.00%<br />
Target Met<br />
by LEA<br />
(Y/N)<br />
N<br />
Percent of<br />
youth with<br />
IEPs dropping<br />
out of high<br />
school<br />
State<br />
Rate<br />
Indicator 03: Assessment on Statewide Benchmark Exam (grades 3-8, 11)<br />
A) Adequate Yearly Progress<br />
n=40<br />
Literacy<br />
Mathematics<br />
Met Disability Subgroup "n"<br />
for Reporting Purposes (Y/N)<br />
State Target for % of Districts Meeting<br />
AYP for Disability Subgroup<br />
State<br />
Target<br />
3.06% 4.20%<br />
LEA<br />
Rate<br />
3.57%<br />
% of Districts Meeting AYP<br />
for Disability Subgroup<br />
Target Met by<br />
LEA (Y/N)<br />
Y<br />
Target Met by<br />
LEA(Y/N)<br />
Overall N 17.15% 6.25%<br />
NA<br />
N<br />
N<br />
Note: For a district to qualify as having a disability subgroup it must have a minimum of 40 (n=40) students with disabilities in a school building.<br />
B) Participation<br />
Participation Rate: # of<br />
CWD Tested ÷ # of CWD<br />
Enrolled in grades tested.<br />
Participation Rate: Literacy<br />
Participation Rate: Math<br />
Note: - - denotes not applicable<br />
State<br />
Rate<br />
98.78%<br />
State<br />
Target<br />
95.00%<br />
LEA<br />
Rate<br />
100.00%<br />
Target Met<br />
by LEA (Y/N)<br />
98.61% 95.00% 100.00% Y<br />
Y<br />
C) Performance Proficiency<br />
Percent of CWD Scoring<br />
Proficient or Above<br />
Proficiency Rate: Literacy<br />
Proficiency Rate:<br />
Mathematics<br />
16.00%<br />
16.00%<br />
State<br />
Rate<br />
31.49%<br />
44.86%<br />
State<br />
Target<br />
45.22%<br />
51.14%<br />
LEA<br />
Rate<br />
14.29%<br />
10.71%<br />
NA<br />
NA<br />
Target<br />
Met by<br />
LEA (Y/N)<br />
N<br />
N<br />
Page 1 of 5
LEA: 1505 - WONDERVIEW SCHOOL <strong>DISTRICT</strong><br />
Indicator 04: Out-of-School Suspensions and Expulsions (2009/10 school year)<br />
A) Suspension/Expulsion<br />
Percent difference of CWD with out-of- school suspensions and<br />
expulsions totaling greater than 10 days in a school year as<br />
compared to the same data for general education students in<br />
the district.<br />
B) Suspension/Expulsion by Race and Ethnicity<br />
Percent of districts that have: (a) a significant discrepancy, by race or<br />
ethnicity, in the rate of suspensions and expulsions of greater than 10<br />
days in a school year for children with IEPs; and (b) policies,<br />
procedures or practices that contribute to the significant discrepancy<br />
and do not comply with requirements relating to the development<br />
and implementation of IEPs, the use of positive behavioral<br />
interventions and supports, and procedural safeguards.<br />
Indicator 05: School Age (5-21) Least Restrictive Environment<br />
A) In the Regular Class 80% or more of the day<br />
Percent of CWD with<br />
IEPs receiving instruction<br />
in the regular class 80%<br />
or more of the day.<br />
State<br />
Rate<br />
State<br />
Target<br />
LEA<br />
Rate<br />
B) In the Regular Class less than 40% of the day<br />
Percent of CWD with<br />
IEPs receiving instruction<br />
in the regular class less<br />
than 60% of the day.<br />
53.87% 59.77%<br />
State<br />
Rate<br />
State<br />
Target<br />
12.42% 12.51%<br />
40.00%<br />
LEA<br />
Rate<br />
4.62%<br />
C) Other Settings outside the regular class<br />
Percent of CWD with IEPs served in<br />
public or private separate schools,<br />
residential placements, or<br />
homebound/hospital placements.<br />
State<br />
Rate<br />
State<br />
Target<br />
2.80% 2.56%<br />
Target Met<br />
by LEA (Y/N)<br />
N<br />
Target Met<br />
by LEA (Y/N)<br />
Y<br />
LEA<br />
Rate<br />
0.00%<br />
Target Met<br />
by LEA(Y/N)<br />
Indicator 06: Early Childhood (3-5) Least Restrictive Environment<br />
A) Regular Early Childhood Program<br />
Percent of children (aged 3 through 5) with IEPs attending a regular<br />
early childhood program and receiving the majority of special<br />
education and related services in the regular early childhood program<br />
Allowable<br />
Difference<br />
LEA: 1505 - WONDERVIEW SCHOOL <strong>DISTRICT</strong><br />
Indicator 07: Preschool (3-5) Outcomes<br />
a) Percent of preschool CWD<br />
children who did not<br />
improve functioning.<br />
b) Percent of preschool CWD<br />
who improved but whose<br />
functioning remained below<br />
same age peers.<br />
c) Percent of preschool CWD<br />
who improved at a level<br />
nearer to same aged peers.<br />
d) Percent of preschool CWD<br />
who improved functioning to<br />
reach a level comparable to<br />
same age peers.<br />
e) Percent of preschool CWD<br />
children who maintain<br />
functioning at a level<br />
comparable to same aged<br />
peers.<br />
Summary<br />
Statements<br />
1) Of those preschool<br />
children who entered<br />
the preschool program<br />
below age expectations<br />
in each Outcome, the<br />
percent who<br />
substantially increased<br />
their rate of growth by<br />
the time they turned 6<br />
years of age or exited<br />
the program.<br />
2) The percent of<br />
preschool children who<br />
were functioning<br />
within age expectations<br />
in each Outcome by the<br />
time they turned 6<br />
years of age or exited<br />
A) Positive Social -Emotional<br />
Skills*<br />
State<br />
Rate<br />
A) Positive Social -<br />
Emotional Skills<br />
(Including social<br />
relationships)<br />
State<br />
Rate<br />
2.14%<br />
5.31%<br />
25.97%<br />
38.22%<br />
28.36%<br />
State<br />
Target<br />
LEA<br />
Rate<br />
LEA<br />
Rate<br />
— —<br />
— —<br />
— —<br />
— —<br />
— —<br />
Target<br />
Met by<br />
LEA(Y/N)<br />
B) Acquisition and Use of<br />
Knowledge and Skills<br />
(Including early language/<br />
communication and early literacy)<br />
B) Acquisition and Use of<br />
Knowledge and Skills **<br />
State<br />
Rate<br />
1.75%<br />
6.59%<br />
34.23%<br />
43.51%<br />
13.92%<br />
State<br />
Target<br />
LEA<br />
Rate<br />
Target<br />
Met by<br />
LEA(Y/N)<br />
C) Use of Appropriate Behaviors<br />
to Meet Their Needs<br />
State<br />
Rate<br />
State<br />
Target<br />
LEA<br />
Rate<br />
Target<br />
Met by<br />
LEA(Y/N)<br />
89.61% 90.50% — — N/A 90.31% 90.50% — — N/A 90.82% 92.50% — — N/A<br />
66.58% 69.50% — — N/A 57.43% 60.50% — — N/A 76.69% 78.50% — — N/A<br />
NOTE: * Including social relationships ** Including early language/ communication and early literacy<br />
Note: - - denotes not applicable<br />
State<br />
Rate<br />
LEA<br />
Rate<br />
— —<br />
— —<br />
— —<br />
— —<br />
— —<br />
C) Use of<br />
Appropriate<br />
Behaviors to<br />
Meet Their Needs<br />
State<br />
Rate<br />
4.51%<br />
17.34%<br />
41.72%<br />
34.97%<br />
LEA<br />
Rate<br />
1.46% — —<br />
— —<br />
— —<br />
— —<br />
— —<br />
Page 3 of 5
LEA: 1505 - WONDERVIEW SCHOOL <strong>DISTRICT</strong><br />
Indicator 08: Parent Involvement<br />
Percent of surveyed<br />
parents who reported<br />
school facilitated parent<br />
involvement as a means<br />
of improving services<br />
and results for children<br />
with disabilities.<br />
Early Childhood<br />
(3-5)<br />
School Age<br />
(5-21)<br />
State<br />
Rate<br />
90.47%<br />
95.05%<br />
Indicator 09: Disproportionality - Eligibility<br />
Disproportionate representation of racial<br />
and ethnic groups in special education and<br />
related services that is a result of<br />
inappropriate identification (e.g.<br />
monitoring data, review of policies,<br />
practices, and procedures under 618(d),<br />
etc.).<br />
State<br />
Rate<br />
State<br />
Target<br />
88.00%<br />
96.00%<br />
State<br />
Target<br />
0.00% 0.00%<br />
LEA<br />
Rate<br />
— —<br />
90.91%<br />
Indicator 10: Disproportionality-Child with a Disability<br />
Disproportionate representation of racial<br />
and ethnic groups in specific disability<br />
categories that is a result of inappropriate<br />
identification (e.g. monitoring data, review<br />
of policies, practices, and procedures under<br />
618(d), etc.).<br />
Indicator 11: Child Find<br />
Percent of children with<br />
parental consent to evaluate<br />
who are evaluated within<br />
the State established timeline<br />
of 60 days.<br />
Overall<br />
(3-21)<br />
Early Childhood<br />
(3-5)<br />
School Age<br />
(5-21)<br />
State<br />
Rate<br />
0.00%<br />
Indicator 12: Early Childhood Transition<br />
Percent of children referred by Part C prior to<br />
age 3, who are found eligible for Part B, and<br />
who have an IEP developed and implemented<br />
by their third birthday.<br />
Note: - - denotes not applicable<br />
State<br />
Rate<br />
99.41%<br />
99.70%<br />
98.97%<br />
State<br />
Rate<br />
State<br />
Target<br />
0.00%<br />
State<br />
Target<br />
100.00%<br />
100.00%<br />
100.00%<br />
State<br />
Target<br />
Target Met by<br />
LEA (Y/N)<br />
Y<br />
Target Met by<br />
LEA (Y/N)<br />
Y<br />
LEA<br />
Rate<br />
100.00%<br />
— —<br />
100.00%<br />
LEA<br />
Rate<br />
Target Met by<br />
LEA (Y/N)<br />
N/A<br />
N<br />
Note: The target for Indicator 09 is to have zero percent<br />
(0%) of districts identified as having disproportionate<br />
representation as a result of inappropriate<br />
identification in eligibility.<br />
Note: The target for Indicator 10 is to have zero<br />
percent (0%) of districts identified as having<br />
disproportionate representation as a result of<br />
inappropriate identification in a disability<br />
category.<br />
Target Met by<br />
LEA (Y/N)<br />
N/A<br />
Y<br />
Target Met<br />
by LEA<br />
(Y/N)<br />
99.21% 100.00% - - N/A<br />
Y<br />
Note: * Indicates a zero reponse rate for the<br />
district.<br />
Page 4 of 5
LEA: 1505 - WONDERVIEW SCHOOL <strong>DISTRICT</strong><br />
Indicator 13: Secondary Transition<br />
Percent of youth with disabilities aged 16 and<br />
up with an IEP that includes coordinated,<br />
measurable, annual IEP goals and transition<br />
services that will reasonably enable the student<br />
to meet the post-secondary goals.<br />
Indicator 14: Post-School Outcomes<br />
A. Percent of youth enrolled in higher<br />
education within one year of leaving high<br />
school.<br />
State<br />
Rate<br />
State<br />
Target<br />
Note: Data for this Indicator is from the on-site monitoring of LEAs for the given year.<br />
B. Percent of youth enrolled in higher<br />
education or competitively employed<br />
within one year of leaving high school.<br />
C. Percent of youth enrolled in higher<br />
education or in some other postsecondary<br />
education or training program; or<br />
competitively employed or in some other<br />
employment within one year of leaving<br />
high school.<br />
State<br />
Rate<br />
Indicator 20: Reported Data-Timely and Accurate*<br />
District submitted<br />
required data elements<br />
on or before due dates;<br />
made revisions within<br />
the alloted reveiw<br />
periods.<br />
Accurate and Timely<br />
Data Submission<br />
Overall (3-21)<br />
Early Childhood (3-5)<br />
School Age (5-21)<br />
State<br />
Target<br />
100.00%<br />
100.00%<br />
100.00%<br />
State<br />
Target<br />
LEA<br />
Rate<br />
LEA<br />
Rate<br />
Target Met by<br />
LEA (Y/N)<br />
Target Met<br />
by LEA<br />
(Y/N)<br />
Target Met<br />
by LEA<br />
(Y/N)<br />
*Data reviewed for timely and accurate submissions included all APSCN cycle data except for personnel<br />
Note: - - denotes not applicable<br />
96.19 100.00 — — N/A<br />
14.53<br />
State<br />
Rate<br />
49.42<br />
State<br />
Rate<br />
54.07<br />
13.00<br />
State<br />
Target<br />
49.00<br />
State<br />
Target<br />
60.00<br />
Y<br />
N/A<br />
Y<br />
— —<br />
LEA<br />
Rate<br />
— —<br />
LEA<br />
Rate<br />
— —<br />
N/A<br />
Target Met<br />
by LEA<br />
(Y/N)<br />
N/A<br />
Target Met<br />
by LEA<br />
(Y/N)<br />
N/A<br />
Page 5 of 5
<strong>ARKANSAS</strong> <strong>SPECIAL</strong> <strong>EDUCATION</strong><br />
<strong>DISTRICT</strong> <strong>ANNUAL</strong> PERFORMANCE REPORT<br />
2010/11 School Year<br />
Publication Date: March 2012<br />
Each State must have in place a State Performance Plan (SPP) to evaluate the State's efforts to meet the requirements and<br />
purposes of the implementation of the Individuals with Disabilities Education Act (IDEA). The SPP is a six-year plan, which<br />
describes Arkansas's performance on 20 indicators. The Office of Special Education Programs in the U. S. Department of<br />
Education requires that States report annually to the public on the performance of each local education agency (LEA) on 14 of<br />
20 indicators as compared with targets established by the State in the SPP. Arkansas will report indicators 1 through 14 and<br />
20 for each LEA serving children with disabilities (CWD). Any LEA not meeting targets on compliance indicators (0% for<br />
Indicators 4B, 09 & 10 and 100% for Indicators 11, 12, 13, and 20) are non-compliant with IDEA.<br />
There are no report changes for the 2010/11 school year profile; However, it is important to recognize that: .<br />
1. Indicator 01 (Graduation) is reported a year in arrear (2009/10 graduates) and is based on a four-year cohort. This<br />
means the rate is a measure of students who entered in ninth grade and graduate in four years. The calculation is a<br />
requirement under Title I of the Elementary and Secondary Education Act (ESEA).<br />
2. Indicator 02 (Drop out) is reported a year in arrear. This means the rate is a measure of students who dropped out in<br />
the 2009/10 school year. The Indicator 02 data are aligned with the Common Core of Data (CCD) requirements for<br />
grades 7-12.<br />
3. Indicator 04A and 4B (Suspension/Expulsion) is reported a year in arrear. This means the rate is a measure of<br />
students who had out-of-school suspensions and/or expulsions totaling more than 10 days.<br />
For a complete description of all the Indicators, please visit the special education website at<br />
http://arksped.k12.ar.us/sections/policy.html<br />
LEA: 1507 - SO. CONWAY CO. SCHOOL <strong>DISTRICT</strong><br />
Indicator 01: Graduation Rates (2009/10 school year) Indicator 02: Dropout Rates (2009/10 school year)<br />
Percent of youth<br />
with IEPs<br />
graduating from<br />
high school with a<br />
regular diploma<br />
State<br />
Rate<br />
State<br />
Target<br />
75.76% 85.00%<br />
LEA<br />
Rate<br />
73.91%<br />
Target Met<br />
by LEA<br />
(Y/N)<br />
N<br />
Percent of<br />
youth with<br />
IEPs dropping<br />
out of high<br />
school<br />
State<br />
Rate<br />
Indicator 03: Assessment on Statewide Benchmark Exam (grades 3-8, 11)<br />
A) Adequate Yearly Progress<br />
n=40<br />
Literacy<br />
Mathematics<br />
Met Disability Subgroup "n"<br />
for Reporting Purposes (Y/N)<br />
State Target for % of Districts Meeting<br />
AYP for Disability Subgroup<br />
State<br />
Target<br />
3.06% 4.20%<br />
LEA<br />
Rate<br />
0.95%<br />
% of Districts Meeting AYP<br />
for Disability Subgroup<br />
Target Met by<br />
LEA (Y/N)<br />
Y<br />
Target Met by<br />
LEA(Y/N)<br />
Overall N 17.15% 6.25%<br />
NA<br />
N<br />
N<br />
Note: For a district to qualify as having a disability subgroup it must have a minimum of 40 (n=40) students with disabilities in a school building.<br />
B) Participation<br />
Participation Rate: # of<br />
CWD Tested ÷ # of CWD<br />
Enrolled in grades tested.<br />
Participation Rate: Literacy<br />
Participation Rate: Math<br />
Note: - - denotes not applicable<br />
State<br />
Rate<br />
98.78%<br />
State<br />
Target<br />
95.00%<br />
LEA<br />
Rate<br />
100.00%<br />
Target Met<br />
by LEA (Y/N)<br />
98.61% 95.00% 99.05% Y<br />
Y<br />
C) Performance Proficiency<br />
Percent of CWD Scoring<br />
Proficient or Above<br />
Proficiency Rate: Literacy<br />
Proficiency Rate:<br />
Mathematics<br />
16.00%<br />
16.00%<br />
State<br />
Rate<br />
31.49%<br />
44.86%<br />
State<br />
Target<br />
45.22%<br />
51.14%<br />
LEA<br />
Rate<br />
25.71%<br />
46.67%<br />
NA<br />
NA<br />
Target<br />
Met by<br />
LEA (Y/N)<br />
N<br />
N<br />
Page 1 of 5
LEA: 1507 - SO. CONWAY CO. SCHOOL <strong>DISTRICT</strong><br />
Indicator 04: Out-of-School Suspensions and Expulsions (2009/10 school year)<br />
A) Suspension/Expulsion<br />
Percent difference of CWD with out-of- school suspensions and<br />
expulsions totaling greater than 10 days in a school year as<br />
compared to the same data for general education students in<br />
the district.<br />
B) Suspension/Expulsion by Race and Ethnicity<br />
Percent of districts that have: (a) a significant discrepancy, by race or<br />
ethnicity, in the rate of suspensions and expulsions of greater than 10<br />
days in a school year for children with IEPs; and (b) policies,<br />
procedures or practices that contribute to the significant discrepancy<br />
and do not comply with requirements relating to the development<br />
and implementation of IEPs, the use of positive behavioral<br />
interventions and supports, and procedural safeguards.<br />
Indicator 05: School Age (5-21) Least Restrictive Environment<br />
A) In the Regular Class 80% or more of the day<br />
Percent of CWD with<br />
IEPs receiving instruction<br />
in the regular class 80%<br />
or more of the day.<br />
State<br />
Rate<br />
State<br />
Target<br />
LEA<br />
Rate<br />
B) In the Regular Class less than 40% of the day<br />
Percent of CWD with<br />
IEPs receiving instruction<br />
in the regular class less<br />
than 60% of the day.<br />
53.87% 59.77%<br />
State<br />
Rate<br />
State<br />
Target<br />
12.42% 12.51%<br />
53.48%<br />
LEA<br />
Rate<br />
10.43%<br />
C) Other Settings outside the regular class<br />
Percent of CWD with IEPs served in<br />
public or private separate schools,<br />
residential placements, or<br />
homebound/hospital placements.<br />
State<br />
Rate<br />
State<br />
Target<br />
2.80% 2.56%<br />
Target Met<br />
by LEA (Y/N)<br />
N<br />
Target Met<br />
by LEA (Y/N)<br />
Y<br />
LEA<br />
Rate<br />
0.43%<br />
Target Met<br />
by LEA(Y/N)<br />
Indicator 06: Early Childhood (3-5) Least Restrictive Environment<br />
A) Regular Early Childhood Program<br />
Percent of children (aged 3 through 5) with IEPs attending a regular<br />
early childhood program and receiving the majority of special<br />
education and related services in the regular early childhood program<br />
Allowable<br />
Difference<br />
LEA: 1507 - SO. CONWAY CO. SCHOOL <strong>DISTRICT</strong><br />
Indicator 07: Preschool (3-5) Outcomes<br />
a) Percent of preschool CWD<br />
children who did not<br />
improve functioning.<br />
b) Percent of preschool CWD<br />
who improved but whose<br />
functioning remained below<br />
same age peers.<br />
c) Percent of preschool CWD<br />
who improved at a level<br />
nearer to same aged peers.<br />
d) Percent of preschool CWD<br />
who improved functioning to<br />
reach a level comparable to<br />
same age peers.<br />
e) Percent of preschool CWD<br />
children who maintain<br />
functioning at a level<br />
comparable to same aged<br />
peers.<br />
Summary<br />
Statements<br />
1) Of those preschool<br />
children who entered<br />
the preschool program<br />
below age expectations<br />
in each Outcome, the<br />
percent who<br />
substantially increased<br />
their rate of growth by<br />
the time they turned 6<br />
years of age or exited<br />
the program.<br />
2) The percent of<br />
preschool children who<br />
were functioning<br />
within age expectations<br />
in each Outcome by the<br />
time they turned 6<br />
years of age or exited<br />
A) Positive Social -Emotional<br />
Skills*<br />
State<br />
Rate<br />
A) Positive Social -<br />
Emotional Skills<br />
(Including social<br />
relationships)<br />
State<br />
Rate<br />
2.14%<br />
5.31%<br />
25.97%<br />
38.22%<br />
28.36%<br />
State<br />
Target<br />
LEA<br />
Rate<br />
LEA<br />
Rate<br />
— —<br />
— —<br />
— —<br />
— —<br />
— —<br />
Target<br />
Met by<br />
LEA(Y/N)<br />
B) Acquisition and Use of<br />
Knowledge and Skills<br />
(Including early language/<br />
communication and early literacy)<br />
B) Acquisition and Use of<br />
Knowledge and Skills **<br />
State<br />
Rate<br />
1.75%<br />
6.59%<br />
34.23%<br />
43.51%<br />
13.92%<br />
State<br />
Target<br />
LEA<br />
Rate<br />
Target<br />
Met by<br />
LEA(Y/N)<br />
C) Use of Appropriate Behaviors<br />
to Meet Their Needs<br />
State<br />
Rate<br />
State<br />
Target<br />
LEA<br />
Rate<br />
Target<br />
Met by<br />
LEA(Y/N)<br />
89.61% 90.50% — — N/A 90.31% 90.50% — — N/A 90.82% 92.50% — — N/A<br />
66.58% 69.50% — — N/A 57.43% 60.50% — — N/A 76.69% 78.50% — — N/A<br />
NOTE: * Including social relationships ** Including early language/ communication and early literacy<br />
Note: - - denotes not applicable<br />
State<br />
Rate<br />
LEA<br />
Rate<br />
— —<br />
— —<br />
— —<br />
— —<br />
— —<br />
C) Use of<br />
Appropriate<br />
Behaviors to<br />
Meet Their Needs<br />
State<br />
Rate<br />
4.51%<br />
17.34%<br />
41.72%<br />
34.97%<br />
LEA<br />
Rate<br />
1.46% — —<br />
— —<br />
— —<br />
— —<br />
— —<br />
Page 3 of 5
LEA: 1507 - SO. CONWAY CO. SCHOOL <strong>DISTRICT</strong><br />
Indicator 08: Parent Involvement<br />
Percent of surveyed<br />
parents who reported<br />
school facilitated parent<br />
involvement as a means<br />
of improving services<br />
and results for children<br />
with disabilities.<br />
Early Childhood<br />
(3-5)<br />
School Age<br />
(5-21)<br />
State<br />
Rate<br />
90.47%<br />
95.05%<br />
Indicator 09: Disproportionality - Eligibility<br />
Disproportionate representation of racial<br />
and ethnic groups in special education and<br />
related services that is a result of<br />
inappropriate identification (e.g.<br />
monitoring data, review of policies,<br />
practices, and procedures under 618(d),<br />
etc.).<br />
State<br />
Rate<br />
State<br />
Target<br />
88.00%<br />
96.00%<br />
State<br />
Target<br />
0.00% 0.00%<br />
LEA<br />
Rate<br />
— —<br />
96.77%<br />
Indicator 10: Disproportionality-Child with a Disability<br />
Disproportionate representation of racial<br />
and ethnic groups in specific disability<br />
categories that is a result of inappropriate<br />
identification (e.g. monitoring data, review<br />
of policies, practices, and procedures under<br />
618(d), etc.).<br />
Indicator 11: Child Find<br />
Percent of children with<br />
parental consent to evaluate<br />
who are evaluated within<br />
the State established timeline<br />
of 60 days.<br />
Overall<br />
(3-21)<br />
Early Childhood<br />
(3-5)<br />
School Age<br />
(5-21)<br />
State<br />
Rate<br />
0.00%<br />
Indicator 12: Early Childhood Transition<br />
Percent of children referred by Part C prior to<br />
age 3, who are found eligible for Part B, and<br />
who have an IEP developed and implemented<br />
by their third birthday.<br />
Note: - - denotes not applicable<br />
State<br />
Rate<br />
99.41%<br />
99.70%<br />
98.97%<br />
State<br />
Rate<br />
State<br />
Target<br />
0.00%<br />
State<br />
Target<br />
100.00%<br />
100.00%<br />
100.00%<br />
State<br />
Target<br />
Target Met by<br />
LEA (Y/N)<br />
Y<br />
Target Met by<br />
LEA (Y/N)<br />
Y<br />
LEA<br />
Rate<br />
100.00%<br />
— —<br />
100.00%<br />
LEA<br />
Rate<br />
Target Met by<br />
LEA (Y/N)<br />
N/A<br />
Y<br />
Note: The target for Indicator 09 is to have zero percent<br />
(0%) of districts identified as having disproportionate<br />
representation as a result of inappropriate<br />
identification in eligibility.<br />
Note: The target for Indicator 10 is to have zero<br />
percent (0%) of districts identified as having<br />
disproportionate representation as a result of<br />
inappropriate identification in a disability<br />
category.<br />
Target Met by<br />
LEA (Y/N)<br />
N/A<br />
Y<br />
Target Met<br />
by LEA<br />
(Y/N)<br />
99.21% 100.00% - - N/A<br />
Y<br />
Note: * Indicates a zero reponse rate for the<br />
district.<br />
Page 4 of 5
LEA: 1507 - SO. CONWAY CO. SCHOOL <strong>DISTRICT</strong><br />
Indicator 13: Secondary Transition<br />
Percent of youth with disabilities aged 16 and<br />
up with an IEP that includes coordinated,<br />
measurable, annual IEP goals and transition<br />
services that will reasonably enable the student<br />
to meet the post-secondary goals.<br />
Indicator 14: Post-School Outcomes<br />
A. Percent of youth enrolled in higher<br />
education within one year of leaving high<br />
school.<br />
State<br />
Rate<br />
State<br />
Target<br />
Note: Data for this Indicator is from the on-site monitoring of LEAs for the given year.<br />
B. Percent of youth enrolled in higher<br />
education or competitively employed<br />
within one year of leaving high school.<br />
C. Percent of youth enrolled in higher<br />
education or in some other postsecondary<br />
education or training program; or<br />
competitively employed or in some other<br />
employment within one year of leaving<br />
high school.<br />
State<br />
Rate<br />
Indicator 20: Reported Data-Timely and Accurate*<br />
District submitted<br />
required data elements<br />
on or before due dates;<br />
made revisions within<br />
the alloted reveiw<br />
periods.<br />
Accurate and Timely<br />
Data Submission<br />
Overall (3-21)<br />
Early Childhood (3-5)<br />
School Age (5-21)<br />
State<br />
Target<br />
100.00%<br />
100.00%<br />
100.00%<br />
State<br />
Target<br />
LEA<br />
Rate<br />
LEA<br />
Rate<br />
Target Met by<br />
LEA (Y/N)<br />
Target Met<br />
by LEA<br />
(Y/N)<br />
Target Met<br />
by LEA<br />
(Y/N)<br />
*Data reviewed for timely and accurate submissions included all APSCN cycle data except for personnel<br />
Note: - - denotes not applicable<br />
96.19 100.00 — — N/A<br />
14.53<br />
State<br />
Rate<br />
49.42<br />
State<br />
Rate<br />
54.07<br />
13.00<br />
State<br />
Target<br />
49.00<br />
State<br />
Target<br />
60.00<br />
Y<br />
N/A<br />
Y<br />
— —<br />
LEA<br />
Rate<br />
— —<br />
LEA<br />
Rate<br />
— —<br />
N/A<br />
Target Met<br />
by LEA<br />
(Y/N)<br />
N/A<br />
Target Met<br />
by LEA<br />
(Y/N)<br />
N/A<br />
Page 5 of 5
<strong>ARKANSAS</strong> <strong>SPECIAL</strong> <strong>EDUCATION</strong><br />
<strong>DISTRICT</strong> <strong>ANNUAL</strong> PERFORMANCE REPORT<br />
2010/11 School Year<br />
Publication Date: March 2012<br />
Each State must have in place a State Performance Plan (SPP) to evaluate the State's efforts to meet the requirements and<br />
purposes of the implementation of the Individuals with Disabilities Education Act (IDEA). The SPP is a six-year plan, which<br />
describes Arkansas's performance on 20 indicators. The Office of Special Education Programs in the U. S. Department of<br />
Education requires that States report annually to the public on the performance of each local education agency (LEA) on 14 of<br />
20 indicators as compared with targets established by the State in the SPP. Arkansas will report indicators 1 through 14 and<br />
20 for each LEA serving children with disabilities (CWD). Any LEA not meeting targets on compliance indicators (0% for<br />
Indicators 4B, 09 & 10 and 100% for Indicators 11, 12, 13, and 20) are non-compliant with IDEA.<br />
There are no report changes for the 2010/11 school year profile; However, it is important to recognize that: .<br />
1. Indicator 01 (Graduation) is reported a year in arrear (2009/10 graduates) and is based on a four-year cohort. This<br />
means the rate is a measure of students who entered in ninth grade and graduate in four years. The calculation is a<br />
requirement under Title I of the Elementary and Secondary Education Act (ESEA).<br />
2. Indicator 02 (Drop out) is reported a year in arrear. This means the rate is a measure of students who dropped out in<br />
the 2009/10 school year. The Indicator 02 data are aligned with the Common Core of Data (CCD) requirements for<br />
grades 7-12.<br />
3. Indicator 04A and 4B (Suspension/Expulsion) is reported a year in arrear. This means the rate is a measure of<br />
students who had out-of-school suspensions and/or expulsions totaling more than 10 days.<br />
For a complete description of all the Indicators, please visit the special education website at<br />
http://arksped.k12.ar.us/sections/policy.html<br />
LEA: 1520 - ARCH FORD <strong>EDUCATION</strong> SERVICE CO-OP<br />
Indicator 01: Graduation Rates (2009/10 school year) Indicator 02: Dropout Rates (2009/10 school year)<br />
Percent of youth<br />
with IEPs<br />
graduating from<br />
high school with a<br />
regular diploma<br />
State<br />
Rate<br />
State<br />
Target<br />
75.76% 85.00%<br />
LEA<br />
Rate<br />
— —<br />
Target Met<br />
by LEA<br />
(Y/N)<br />
NA<br />
Percent of<br />
youth with<br />
IEPs dropping<br />
out of high<br />
school<br />
State<br />
Rate<br />
Indicator 03: Assessment on Statewide Benchmark Exam (grades 3-8, 11)<br />
A) Adequate Yearly Progress<br />
n=40<br />
Literacy<br />
Mathematics<br />
Met Disability Subgroup "n"<br />
for Reporting Purposes (Y/N)<br />
State Target for % of Districts Meeting<br />
AYP for Disability Subgroup<br />
State<br />
Target<br />
3.06% 4.20%<br />
LEA<br />
Rate<br />
— —<br />
% of Districts Meeting AYP<br />
for Disability Subgroup<br />
Target Met by<br />
LEA (Y/N)<br />
N/A<br />
Target Met by<br />
LEA(Y/N)<br />
Overall N/A 17.15% 6.25%<br />
N/A<br />
N/A<br />
N/A<br />
Note: For a district to qualify as having a disability subgroup it must have a minimum of 40 (n=40) students with disabilities in a school building.<br />
B) Participation<br />
Participation Rate: # of<br />
CWD Tested ÷ # of CWD<br />
Enrolled in grades tested.<br />
Participation Rate: Literacy<br />
Participation Rate: Math<br />
Note: - - denotes not applicable<br />
State<br />
Rate<br />
98.78%<br />
State<br />
Target<br />
95.00%<br />
LEA<br />
Rate<br />
— —<br />
Target Met<br />
by LEA (Y/N)<br />
N/A<br />
98.61% 95.00% — — N/A<br />
C) Performance Proficiency<br />
Percent of CWD Scoring<br />
Proficient or Above<br />
Proficiency Rate: Literacy<br />
Proficiency Rate:<br />
Mathematics<br />
16.00%<br />
16.00%<br />
State<br />
Rate<br />
31.49%<br />
44.86%<br />
State<br />
Target<br />
45.22%<br />
51.14%<br />
LEA<br />
Rate<br />
— —<br />
— —<br />
N/A<br />
N/A<br />
Target<br />
Met by<br />
LEA (Y/N)<br />
N/A<br />
N/A<br />
Page 1 of 5
LEA: 1520 - ARCH FORD <strong>EDUCATION</strong> SERVICE CO-OP<br />
Indicator 04: Out-of-School Suspensions and Expulsions (2009/10 school year)<br />
A) Suspension/Expulsion<br />
Percent difference of CWD with out-of- school suspensions and<br />
expulsions totaling greater than 10 days in a school year as<br />
compared to the same data for general education students in<br />
the district.<br />
B) Suspension/Expulsion by Race and Ethnicity<br />
Percent of districts that have: (a) a significant discrepancy, by race or<br />
ethnicity, in the rate of suspensions and expulsions of greater than 10<br />
days in a school year for children with IEPs; and (b) policies,<br />
procedures or practices that contribute to the significant discrepancy<br />
and do not comply with requirements relating to the development<br />
and implementation of IEPs, the use of positive behavioral<br />
interventions and supports, and procedural safeguards.<br />
Indicator 05: School Age (5-21) Least Restrictive Environment<br />
A) In the Regular Class 80% or more of the day<br />
Percent of CWD with<br />
IEPs receiving instruction<br />
in the regular class 80%<br />
or more of the day.<br />
State<br />
Rate<br />
State<br />
Target<br />
LEA<br />
Rate<br />
B) In the Regular Class less than 40% of the day<br />
Percent of CWD with<br />
IEPs receiving instruction<br />
in the regular class less<br />
than 60% of the day.<br />
53.87% 59.77%<br />
State<br />
Rate<br />
State<br />
Target<br />
12.42% 12.51%<br />
— —<br />
LEA<br />
Rate<br />
— —<br />
C) Other Settings outside the regular class<br />
Percent of CWD with IEPs served in<br />
public or private separate schools,<br />
residential placements, or<br />
homebound/hospital placements.<br />
State<br />
Rate<br />
State<br />
Target<br />
2.80% 2.56%<br />
Target Met<br />
by LEA (Y/N)<br />
N/A<br />
Target Met<br />
by LEA (Y/N)<br />
N/A<br />
LEA<br />
Rate<br />
— —<br />
Target Met<br />
by LEA(Y/N)<br />
N/A<br />
Indicator 06: Early Childhood (3-5) Least Restrictive Environment<br />
A) Regular Early Childhood Program<br />
Percent of children (aged 3 through 5) with IEPs attending a regular<br />
early childhood program and receiving the majority of special<br />
education and related services in the regular early childhood program<br />
Allowable<br />
Difference<br />
LEA: 1520 - ARCH FORD <strong>EDUCATION</strong> SERVICE CO-OP<br />
Indicator 07: Preschool (3-5) Outcomes<br />
a) Percent of preschool CWD<br />
children who did not<br />
improve functioning.<br />
b) Percent of preschool CWD<br />
who improved but whose<br />
functioning remained below<br />
same age peers.<br />
c) Percent of preschool CWD<br />
who improved at a level<br />
nearer to same aged peers.<br />
d) Percent of preschool CWD<br />
who improved functioning to<br />
reach a level comparable to<br />
same age peers.<br />
e) Percent of preschool CWD<br />
children who maintain<br />
functioning at a level<br />
comparable to same aged<br />
peers.<br />
Summary<br />
Statements<br />
1) Of those preschool<br />
children who entered<br />
the preschool program<br />
below age expectations<br />
in each Outcome, the<br />
percent who<br />
substantially increased<br />
their rate of growth by<br />
the time they turned 6<br />
years of age or exited<br />
the program.<br />
2) The percent of<br />
preschool children who<br />
were functioning<br />
within age expectations<br />
in each Outcome by the<br />
time they turned 6<br />
years of age or exited<br />
A) Positive Social -Emotional<br />
Skills*<br />
State<br />
Rate<br />
A) Positive Social -<br />
Emotional Skills<br />
(Including social<br />
relationships)<br />
State<br />
Rate<br />
2.14%<br />
5.31%<br />
25.97%<br />
38.22%<br />
28.36%<br />
State<br />
Target<br />
LEA<br />
Rate<br />
LEA<br />
Rate<br />
— —<br />
1.49%<br />
3.96%<br />
16.34%<br />
78.22%<br />
Target<br />
Met by<br />
LEA(Y/N)<br />
B) Acquisition and Use of<br />
Knowledge and Skills<br />
(Including early language/<br />
communication and early literacy)<br />
B) Acquisition and Use of<br />
Knowledge and Skills **<br />
State<br />
Rate<br />
1.75%<br />
6.59%<br />
34.23%<br />
43.51%<br />
13.92%<br />
State<br />
Target<br />
LEA<br />
Rate<br />
Target<br />
Met by<br />
LEA(Y/N)<br />
C) Use of Appropriate Behaviors<br />
to Meet Their Needs<br />
State<br />
Rate<br />
State<br />
Target<br />
LEA<br />
Rate<br />
Target<br />
Met by<br />
LEA(Y/N)<br />
89.61% 90.50% 93.18% Y 90.31% 90.50% 86.69% N 90.82% 92.50% 87.50% N<br />
66.58% 69.50% 94.55% Y 57.43% 60.50% 79.70% Y 76.69% 78.50% 95.30% Y<br />
NOTE: * Including social relationships ** Including early language/ communication and early literacy<br />
Note: - - denotes not applicable<br />
State<br />
Rate<br />
LEA<br />
Rate<br />
— —<br />
9.16%<br />
11.14%<br />
48.51%<br />
31.19%<br />
C) Use of<br />
Appropriate<br />
Behaviors to<br />
Meet Their Needs<br />
State<br />
Rate<br />
4.51%<br />
17.34%<br />
41.72%<br />
34.97%<br />
LEA<br />
Rate<br />
1.46% — —<br />
2.48%<br />
2.23%<br />
15.10%<br />
80.20%<br />
Page 3 of 5
LEA: 1520 - ARCH FORD <strong>EDUCATION</strong> SERVICE CO-OP<br />
Indicator 08: Parent Involvement<br />
Percent of surveyed<br />
parents who reported<br />
school facilitated parent<br />
involvement as a means<br />
of improving services<br />
and results for children<br />
with disabilities.<br />
Early Childhood<br />
(3-5)<br />
School Age<br />
(5-21)<br />
State<br />
Rate<br />
90.47%<br />
95.05%<br />
Indicator 09: Disproportionality - Eligibility<br />
Disproportionate representation of racial<br />
and ethnic groups in special education and<br />
related services that is a result of<br />
inappropriate identification (e.g.<br />
monitoring data, review of policies,<br />
practices, and procedures under 618(d),<br />
etc.).<br />
State<br />
Rate<br />
State<br />
Target<br />
88.00%<br />
96.00%<br />
State<br />
Target<br />
0.00% 0.00%<br />
LEA<br />
Rate<br />
98.99%<br />
— —<br />
Indicator 10: Disproportionality-Child with a Disability<br />
Disproportionate representation of racial<br />
and ethnic groups in specific disability<br />
categories that is a result of inappropriate<br />
identification (e.g. monitoring data, review<br />
of policies, practices, and procedures under<br />
618(d), etc.).<br />
Indicator 11: Child Find<br />
Percent of children with<br />
parental consent to evaluate<br />
who are evaluated within<br />
the State established timeline<br />
of 60 days.<br />
Overall<br />
(3-21)<br />
Early Childhood<br />
(3-5)<br />
School Age<br />
(5-21)<br />
State<br />
Rate<br />
0.00%<br />
Indicator 12: Early Childhood Transition<br />
Percent of children referred by Part C prior to<br />
age 3, who are found eligible for Part B, and<br />
who have an IEP developed and implemented<br />
by their third birthday.<br />
Note: - - denotes not applicable<br />
State<br />
Rate<br />
99.41%<br />
99.70%<br />
98.97%<br />
State<br />
Rate<br />
State<br />
Target<br />
0.00%<br />
State<br />
Target<br />
100.00%<br />
100.00%<br />
100.00%<br />
State<br />
Target<br />
Target Met by<br />
LEA (Y/N)<br />
N/A<br />
Target Met by<br />
LEA (Y/N)<br />
N/A<br />
LEA<br />
Rate<br />
100.00%<br />
100.00%<br />
— —<br />
LEA<br />
Rate<br />
Target Met by<br />
LEA (Y/N)<br />
Y<br />
N/A<br />
Note: The target for Indicator 09 is to have zero percent<br />
(0%) of districts identified as having disproportionate<br />
representation as a result of inappropriate<br />
identification in eligibility.<br />
Note: The target for Indicator 10 is to have zero<br />
percent (0%) of districts identified as having<br />
disproportionate representation as a result of<br />
inappropriate identification in a disability<br />
category.<br />
Target Met by<br />
LEA (Y/N)<br />
Y<br />
N/A<br />
Target Met<br />
by LEA<br />
(Y/N)<br />
99.21% 100.00% 100.00% Y<br />
Y<br />
Note: * Indicates a zero reponse rate for the<br />
district.<br />
Page 4 of 5
LEA: 1520 - ARCH FORD <strong>EDUCATION</strong> SERVICE CO-OP<br />
Indicator 13: Secondary Transition<br />
Percent of youth with disabilities aged 16 and<br />
up with an IEP that includes coordinated,<br />
measurable, annual IEP goals and transition<br />
services that will reasonably enable the student<br />
to meet the post-secondary goals.<br />
Indicator 14: Post-School Outcomes<br />
A. Percent of youth enrolled in higher<br />
education within one year of leaving high<br />
school.<br />
State<br />
Rate<br />
State<br />
Target<br />
Note: Data for this Indicator is from the on-site monitoring of LEAs for the given year.<br />
B. Percent of youth enrolled in higher<br />
education or competitively employed<br />
within one year of leaving high school.<br />
C. Percent of youth enrolled in higher<br />
education or in some other postsecondary<br />
education or training program; or<br />
competitively employed or in some other<br />
employment within one year of leaving<br />
high school.<br />
State<br />
Rate<br />
Indicator 20: Reported Data-Timely and Accurate*<br />
District submitted<br />
required data elements<br />
on or before due dates;<br />
made revisions within<br />
the alloted reveiw<br />
periods.<br />
Accurate and Timely<br />
Data Submission<br />
Overall (3-21)<br />
Early Childhood (3-5)<br />
School Age (5-21)<br />
State<br />
Target<br />
100.00%<br />
100.00%<br />
100.00%<br />
State<br />
Target<br />
LEA<br />
Rate<br />
LEA<br />
Rate<br />
Target Met by<br />
LEA (Y/N)<br />
Target Met<br />
by LEA<br />
(Y/N)<br />
Target Met<br />
by LEA<br />
(Y/N)<br />
*Data reviewed for timely and accurate submissions included all APSCN cycle data except for personnel<br />
Note: - - denotes not applicable<br />
96.19 100.00 — — N/A<br />
14.53<br />
State<br />
Rate<br />
49.42<br />
State<br />
Rate<br />
54.07<br />
13.00<br />
State<br />
Target<br />
49.00<br />
State<br />
Target<br />
60.00<br />
Y<br />
Y<br />
N/A<br />
— —<br />
LEA<br />
Rate<br />
— —<br />
LEA<br />
Rate<br />
— —<br />
N/A<br />
Target Met<br />
by LEA<br />
(Y/N)<br />
N/A<br />
Target Met<br />
by LEA<br />
(Y/N)<br />
N/A<br />
Page 5 of 5
LEA: 1601 - BAY SCHOOL <strong>DISTRICT</strong><br />
<strong>ARKANSAS</strong> <strong>SPECIAL</strong> <strong>EDUCATION</strong><br />
<strong>DISTRICT</strong> <strong>ANNUAL</strong> PERFORMANCE REPORT<br />
2010/11 School Year<br />
Publication Date: March 2012<br />
Each State must have in place a State Performance Plan (SPP) to evaluate the State's efforts to meet the requirements and<br />
purposes of the implementation of the Individuals with Disabilities Education Act (IDEA). The SPP is a six-year plan, which<br />
describes Arkansas's performance on 20 indicators. The Office of Special Education Programs in the U. S. Department of<br />
Education requires that States report annually to the public on the performance of each local education agency (LEA) on 14 of<br />
20 indicators as compared with targets established by the State in the SPP. Arkansas will report indicators 1 through 14 and<br />
20 for each LEA serving children with disabilities (CWD). Any LEA not meeting targets on compliance indicators (0% for<br />
Indicators 4B, 09 & 10 and 100% for Indicators 11, 12, 13, and 20) are non-compliant with IDEA.<br />
There are no report changes for the 2010/11 school year profile; However, it is important to recognize that: .<br />
1. Indicator 01 (Graduation) is reported a year in arrear (2009/10 graduates) and is based on a four-year cohort. This<br />
means the rate is a measure of students who entered in ninth grade and graduate in four years. The calculation is a<br />
requirement under Title I of the Elementary and Secondary Education Act (ESEA).<br />
2. Indicator 02 (Drop out) is reported a year in arrear. This means the rate is a measure of students who dropped out in<br />
the 2009/10 school year. The Indicator 02 data are aligned with the Common Core of Data (CCD) requirements for<br />
grades 7-12.<br />
3. Indicator 04A and 4B (Suspension/Expulsion) is reported a year in arrear. This means the rate is a measure of<br />
students who had out-of-school suspensions and/or expulsions totaling more than 10 days.<br />
Percent of youth<br />
with IEPs<br />
graduating from<br />
high school with a<br />
regular diploma<br />
For a complete description of all the Indicators, please visit the special education website at<br />
http://arksped.k12.ar.us/sections/policy.html<br />
Indicator 01: Graduation Rates (2009/10 school year) Indicator 02: Dropout Rates (2009/10 school year)<br />
State<br />
Rate<br />
State<br />
Target<br />
75.76% 85.00%<br />
LEA<br />
Rate<br />
85.71%<br />
Target Met<br />
by LEA<br />
(Y/N)<br />
Y<br />
Percent of<br />
youth with<br />
IEPs dropping<br />
out of high<br />
school<br />
State<br />
Rate<br />
Indicator 03: Assessment on Statewide Benchmark Exam (grades 3-8, 11)<br />
A) Adequate Yearly Progress<br />
n=40<br />
Literacy<br />
Mathematics<br />
Met Disability Subgroup "n"<br />
for Reporting Purposes (Y/N)<br />
State Target for % of Districts Meeting<br />
AYP for Disability Subgroup<br />
State<br />
Target<br />
3.06% 4.20%<br />
LEA<br />
Rate<br />
0.00%<br />
% of Districts Meeting AYP<br />
for Disability Subgroup<br />
Target Met by<br />
LEA (Y/N)<br />
Y<br />
Target Met by<br />
LEA(Y/N)<br />
Overall N 17.15% 6.25%<br />
NA<br />
N<br />
N<br />
Note: For a district to qualify as having a disability subgroup it must have a minimum of 40 (n=40) students with disabilities in a school building.<br />
B) Participation<br />
Participation Rate: # of<br />
CWD Tested ÷ # of CWD<br />
Enrolled in grades tested.<br />
Participation Rate: Literacy<br />
Participation Rate: Math<br />
Note: - - denotes not applicable<br />
State<br />
Rate<br />
98.78%<br />
State<br />
Target<br />
95.00%<br />
LEA<br />
Rate<br />
100.00%<br />
Target Met<br />
by LEA (Y/N)<br />
98.61% 95.00% 100.00% Y<br />
Y<br />
C) Performance Proficiency<br />
Percent of CWD Scoring<br />
Proficient or Above<br />
Proficiency Rate: Literacy<br />
Proficiency Rate:<br />
Mathematics<br />
16.00%<br />
16.00%<br />
State<br />
Rate<br />
31.49%<br />
44.86%<br />
State<br />
Target<br />
45.22%<br />
51.14%<br />
LEA<br />
Rate<br />
14.58%<br />
38.00%<br />
NA<br />
NA<br />
Target<br />
Met by<br />
LEA (Y/N)<br />
N<br />
N<br />
Page 1 of 5
LEA: 1601 - BAY SCHOOL <strong>DISTRICT</strong><br />
Indicator 04: Out-of-School Suspensions and Expulsions (2009/10 school year)<br />
A) Suspension/Expulsion<br />
Percent difference of CWD with out-of- school suspensions and<br />
expulsions totaling greater than 10 days in a school year as<br />
compared to the same data for general education students in<br />
the district.<br />
B) Suspension/Expulsion by Race and Ethnicity<br />
Percent of districts that have: (a) a significant discrepancy, by race or<br />
ethnicity, in the rate of suspensions and expulsions of greater than 10<br />
days in a school year for children with IEPs; and (b) policies,<br />
procedures or practices that contribute to the significant discrepancy<br />
and do not comply with requirements relating to the development<br />
and implementation of IEPs, the use of positive behavioral<br />
interventions and supports, and procedural safeguards.<br />
Indicator 05: School Age (5-21) Least Restrictive Environment<br />
A) In the Regular Class 80% or more of the day<br />
Percent of CWD with<br />
IEPs receiving instruction<br />
in the regular class 80%<br />
or more of the day.<br />
State<br />
Rate<br />
State<br />
Target<br />
LEA<br />
Rate<br />
B) In the Regular Class less than 40% of the day<br />
Percent of CWD with<br />
IEPs receiving instruction<br />
in the regular class less<br />
than 60% of the day.<br />
53.87% 59.77%<br />
State<br />
Rate<br />
State<br />
Target<br />
12.42% 12.51%<br />
44.05%<br />
LEA<br />
Rate<br />
16.67%<br />
C) Other Settings outside the regular class<br />
Percent of CWD with IEPs served in<br />
public or private separate schools,<br />
residential placements, or<br />
homebound/hospital placements.<br />
State<br />
Rate<br />
State<br />
Target<br />
2.80% 2.56%<br />
Target Met<br />
by LEA (Y/N)<br />
N<br />
Target Met<br />
by LEA (Y/N)<br />
N<br />
LEA<br />
Rate<br />
0.00%<br />
Target Met<br />
by LEA(Y/N)<br />
Indicator 06: Early Childhood (3-5) Least Restrictive Environment<br />
A) Regular Early Childhood Program<br />
Percent of children (aged 3 through 5) with IEPs attending a regular<br />
early childhood program and receiving the majority of special<br />
education and related services in the regular early childhood program<br />
Allowable<br />
Difference<br />
LEA: 1601 - BAY SCHOOL <strong>DISTRICT</strong><br />
Indicator 07: Preschool (3-5) Outcomes<br />
a) Percent of preschool CWD<br />
children who did not<br />
improve functioning.<br />
b) Percent of preschool CWD<br />
who improved but whose<br />
functioning remained below<br />
same age peers.<br />
c) Percent of preschool CWD<br />
who improved at a level<br />
nearer to same aged peers.<br />
d) Percent of preschool CWD<br />
who improved functioning to<br />
reach a level comparable to<br />
same age peers.<br />
e) Percent of preschool CWD<br />
children who maintain<br />
functioning at a level<br />
comparable to same aged<br />
peers.<br />
Summary<br />
Statements<br />
1) Of those preschool<br />
children who entered<br />
the preschool program<br />
below age expectations<br />
in each Outcome, the<br />
percent who<br />
substantially increased<br />
their rate of growth by<br />
the time they turned 6<br />
years of age or exited<br />
the program.<br />
2) The percent of<br />
preschool children who<br />
were functioning<br />
within age expectations<br />
in each Outcome by the<br />
time they turned 6<br />
years of age or exited<br />
A) Positive Social -Emotional<br />
Skills*<br />
State<br />
Rate<br />
A) Positive Social -<br />
Emotional Skills<br />
(Including social<br />
relationships)<br />
State<br />
Rate<br />
2.14%<br />
5.31%<br />
25.97%<br />
38.22%<br />
28.36%<br />
State<br />
Target<br />
LEA<br />
Rate<br />
LEA<br />
Rate<br />
— —<br />
— —<br />
— —<br />
— —<br />
— —<br />
Target<br />
Met by<br />
LEA(Y/N)<br />
B) Acquisition and Use of<br />
Knowledge and Skills<br />
(Including early language/<br />
communication and early literacy)<br />
B) Acquisition and Use of<br />
Knowledge and Skills **<br />
State<br />
Rate<br />
1.75%<br />
6.59%<br />
34.23%<br />
43.51%<br />
13.92%<br />
State<br />
Target<br />
LEA<br />
Rate<br />
Target<br />
Met by<br />
LEA(Y/N)<br />
C) Use of Appropriate Behaviors<br />
to Meet Their Needs<br />
State<br />
Rate<br />
State<br />
Target<br />
LEA<br />
Rate<br />
Target<br />
Met by<br />
LEA(Y/N)<br />
89.61% 90.50% — — N/A 90.31% 90.50% — — N/A 90.82% 92.50% — — N/A<br />
66.58% 69.50% — — N/A 57.43% 60.50% — — N/A 76.69% 78.50% — — N/A<br />
NOTE: * Including social relationships ** Including early language/ communication and early literacy<br />
Note: - - denotes not applicable<br />
State<br />
Rate<br />
LEA<br />
Rate<br />
— —<br />
— —<br />
— —<br />
— —<br />
— —<br />
C) Use of<br />
Appropriate<br />
Behaviors to<br />
Meet Their Needs<br />
State<br />
Rate<br />
4.51%<br />
17.34%<br />
41.72%<br />
34.97%<br />
LEA<br />
Rate<br />
1.46% — —<br />
— —<br />
— —<br />
— —<br />
— —<br />
Page 3 of 5
LEA: 1601 - BAY SCHOOL <strong>DISTRICT</strong><br />
Indicator 08: Parent Involvement<br />
Percent of surveyed<br />
parents who reported<br />
school facilitated parent<br />
involvement as a means<br />
of improving services<br />
and results for children<br />
with disabilities.<br />
Early Childhood<br />
(3-5)<br />
School Age<br />
(5-21)<br />
State<br />
Rate<br />
90.47%<br />
95.05%<br />
Indicator 09: Disproportionality - Eligibility<br />
Disproportionate representation of racial<br />
and ethnic groups in special education and<br />
related services that is a result of<br />
inappropriate identification (e.g.<br />
monitoring data, review of policies,<br />
practices, and procedures under 618(d),<br />
etc.).<br />
State<br />
Rate<br />
State<br />
Target<br />
88.00%<br />
96.00%<br />
State<br />
Target<br />
0.00% 0.00%<br />
LEA<br />
Rate<br />
— —<br />
78.57%<br />
Indicator 10: Disproportionality-Child with a Disability<br />
Disproportionate representation of racial<br />
and ethnic groups in specific disability<br />
categories that is a result of inappropriate<br />
identification (e.g. monitoring data, review<br />
of policies, practices, and procedures under<br />
618(d), etc.).<br />
Indicator 11: Child Find<br />
Percent of children with<br />
parental consent to evaluate<br />
who are evaluated within<br />
the State established timeline<br />
of 60 days.<br />
Overall<br />
(3-21)<br />
Early Childhood<br />
(3-5)<br />
School Age<br />
(5-21)<br />
State<br />
Rate<br />
0.00%<br />
Indicator 12: Early Childhood Transition<br />
Percent of children referred by Part C prior to<br />
age 3, who are found eligible for Part B, and<br />
who have an IEP developed and implemented<br />
by their third birthday.<br />
Note: - - denotes not applicable<br />
State<br />
Rate<br />
99.41%<br />
99.70%<br />
98.97%<br />
State<br />
Rate<br />
State<br />
Target<br />
0.00%<br />
State<br />
Target<br />
100.00%<br />
100.00%<br />
100.00%<br />
State<br />
Target<br />
Target Met by<br />
LEA (Y/N)<br />
Y<br />
Target Met by<br />
LEA (Y/N)<br />
Y<br />
LEA<br />
Rate<br />
100.00%<br />
— —<br />
100.00%<br />
LEA<br />
Rate<br />
Target Met by<br />
LEA (Y/N)<br />
N/A<br />
N<br />
Note: The target for Indicator 09 is to have zero percent<br />
(0%) of districts identified as having disproportionate<br />
representation as a result of inappropriate<br />
identification in eligibility.<br />
Note: The target for Indicator 10 is to have zero<br />
percent (0%) of districts identified as having<br />
disproportionate representation as a result of<br />
inappropriate identification in a disability<br />
category.<br />
Target Met by<br />
LEA (Y/N)<br />
N/A<br />
Y<br />
Target Met<br />
by LEA<br />
(Y/N)<br />
99.21% 100.00% - - N/A<br />
Y<br />
Note: * Indicates a zero reponse rate for the<br />
district.<br />
Page 4 of 5
LEA: 1601 - BAY SCHOOL <strong>DISTRICT</strong><br />
Indicator 13: Secondary Transition<br />
Percent of youth with disabilities aged 16 and<br />
up with an IEP that includes coordinated,<br />
measurable, annual IEP goals and transition<br />
services that will reasonably enable the student<br />
to meet the post-secondary goals.<br />
Indicator 14: Post-School Outcomes<br />
A. Percent of youth enrolled in higher<br />
education within one year of leaving high<br />
school.<br />
State<br />
Rate<br />
State<br />
Target<br />
Note: Data for this Indicator is from the on-site monitoring of LEAs for the given year.<br />
B. Percent of youth enrolled in higher<br />
education or competitively employed<br />
within one year of leaving high school.<br />
C. Percent of youth enrolled in higher<br />
education or in some other postsecondary<br />
education or training program; or<br />
competitively employed or in some other<br />
employment within one year of leaving<br />
high school.<br />
State<br />
Rate<br />
Indicator 20: Reported Data-Timely and Accurate*<br />
District submitted<br />
required data elements<br />
on or before due dates;<br />
made revisions within<br />
the alloted reveiw<br />
periods.<br />
Accurate and Timely<br />
Data Submission<br />
Overall (3-21)<br />
Early Childhood (3-5)<br />
School Age (5-21)<br />
State<br />
Target<br />
100.00%<br />
100.00%<br />
100.00%<br />
State<br />
Target<br />
LEA<br />
Rate<br />
LEA<br />
Rate<br />
Target Met by<br />
LEA (Y/N)<br />
Target Met<br />
by LEA<br />
(Y/N)<br />
Target Met<br />
by LEA<br />
(Y/N)<br />
*Data reviewed for timely and accurate submissions included all APSCN cycle data except for personnel<br />
Note: - - denotes not applicable<br />
96.19 100.00 100.00% Y<br />
14.53<br />
State<br />
Rate<br />
49.42<br />
State<br />
Rate<br />
54.07<br />
13.00<br />
State<br />
Target<br />
49.00<br />
State<br />
Target<br />
60.00<br />
Y<br />
N/A<br />
Y<br />
— —<br />
LEA<br />
Rate<br />
— —<br />
LEA<br />
Rate<br />
— —<br />
N/A<br />
Target Met<br />
by LEA<br />
(Y/N)<br />
N/A<br />
Target Met<br />
by LEA<br />
(Y/N)<br />
N/A<br />
Page 5 of 5
<strong>ARKANSAS</strong> <strong>SPECIAL</strong> <strong>EDUCATION</strong><br />
<strong>DISTRICT</strong> <strong>ANNUAL</strong> PERFORMANCE REPORT<br />
2010/11 School Year<br />
Publication Date: March 2012<br />
Each State must have in place a State Performance Plan (SPP) to evaluate the State's efforts to meet the requirements and<br />
purposes of the implementation of the Individuals with Disabilities Education Act (IDEA). The SPP is a six-year plan, which<br />
describes Arkansas's performance on 20 indicators. The Office of Special Education Programs in the U. S. Department of<br />
Education requires that States report annually to the public on the performance of each local education agency (LEA) on 14 of<br />
20 indicators as compared with targets established by the State in the SPP. Arkansas will report indicators 1 through 14 and<br />
20 for each LEA serving children with disabilities (CWD). Any LEA not meeting targets on compliance indicators (0% for<br />
Indicators 4B, 09 & 10 and 100% for Indicators 11, 12, 13, and 20) are non-compliant with IDEA.<br />
There are no report changes for the 2010/11 school year profile; However, it is important to recognize that: .<br />
1. Indicator 01 (Graduation) is reported a year in arrear (2009/10 graduates) and is based on a four-year cohort. This<br />
means the rate is a measure of students who entered in ninth grade and graduate in four years. The calculation is a<br />
requirement under Title I of the Elementary and Secondary Education Act (ESEA).<br />
2. Indicator 02 (Drop out) is reported a year in arrear. This means the rate is a measure of students who dropped out in<br />
the 2009/10 school year. The Indicator 02 data are aligned with the Common Core of Data (CCD) requirements for<br />
grades 7-12.<br />
3. Indicator 04A and 4B (Suspension/Expulsion) is reported a year in arrear. This means the rate is a measure of<br />
students who had out-of-school suspensions and/or expulsions totaling more than 10 days.<br />
For a complete description of all the Indicators, please visit the special education website at<br />
http://arksped.k12.ar.us/sections/policy.html<br />
LEA: 1602 - WESTSIDE CONS. SCHOOL <strong>DISTRICT</strong><br />
Indicator 01: Graduation Rates (2009/10 school year) Indicator 02: Dropout Rates (2009/10 school year)<br />
Percent of youth<br />
with IEPs<br />
graduating from<br />
high school with a<br />
regular diploma<br />
State<br />
Rate<br />
State<br />
Target<br />
75.76% 85.00%<br />
LEA<br />
Rate<br />
78.95%<br />
Target Met<br />
by LEA<br />
(Y/N)<br />
N<br />
Percent of<br />
youth with<br />
IEPs dropping<br />
out of high<br />
school<br />
State<br />
Rate<br />
Indicator 03: Assessment on Statewide Benchmark Exam (grades 3-8, 11)<br />
A) Adequate Yearly Progress<br />
n=40<br />
Literacy<br />
Mathematics<br />
Met Disability Subgroup "n"<br />
for Reporting Purposes (Y/N)<br />
State Target for % of Districts Meeting<br />
AYP for Disability Subgroup<br />
State<br />
Target<br />
3.06% 4.20%<br />
LEA<br />
Rate<br />
4.17%<br />
% of Districts Meeting AYP<br />
for Disability Subgroup<br />
Target Met by<br />
LEA (Y/N)<br />
Y<br />
Target Met by<br />
LEA(Y/N)<br />
Overall N 17.15% 6.25%<br />
NA<br />
N<br />
N<br />
Note: For a district to qualify as having a disability subgroup it must have a minimum of 40 (n=40) students with disabilities in a school building.<br />
B) Participation<br />
Participation Rate: # of<br />
CWD Tested ÷ # of CWD<br />
Enrolled in grades tested.<br />
Participation Rate: Literacy<br />
Participation Rate: Math<br />
Note: - - denotes not applicable<br />
State<br />
Rate<br />
98.78%<br />
State<br />
Target<br />
95.00%<br />
LEA<br />
Rate<br />
98.98%<br />
Target Met<br />
by LEA (Y/N)<br />
98.61% 95.00% 100.00% Y<br />
Y<br />
C) Performance Proficiency<br />
Percent of CWD Scoring<br />
Proficient or Above<br />
Proficiency Rate: Literacy<br />
Proficiency Rate:<br />
Mathematics<br />
16.00%<br />
16.00%<br />
State<br />
Rate<br />
31.49%<br />
44.86%<br />
State<br />
Target<br />
45.22%<br />
51.14%<br />
LEA<br />
Rate<br />
27.27%<br />
39.80%<br />
NA<br />
NA<br />
Target<br />
Met by<br />
LEA (Y/N)<br />
N<br />
N<br />
Page 1 of 5
LEA: 1602 - WESTSIDE CONS. SCHOOL <strong>DISTRICT</strong><br />
Indicator 04: Out-of-School Suspensions and Expulsions (2009/10 school year)<br />
A) Suspension/Expulsion<br />
Percent difference of CWD with out-of- school suspensions and<br />
expulsions totaling greater than 10 days in a school year as<br />
compared to the same data for general education students in<br />
the district.<br />
B) Suspension/Expulsion by Race and Ethnicity<br />
Percent of districts that have: (a) a significant discrepancy, by race or<br />
ethnicity, in the rate of suspensions and expulsions of greater than 10<br />
days in a school year for children with IEPs; and (b) policies,<br />
procedures or practices that contribute to the significant discrepancy<br />
and do not comply with requirements relating to the development<br />
and implementation of IEPs, the use of positive behavioral<br />
interventions and supports, and procedural safeguards.<br />
Indicator 05: School Age (5-21) Least Restrictive Environment<br />
A) In the Regular Class 80% or more of the day<br />
Percent of CWD with<br />
IEPs receiving instruction<br />
in the regular class 80%<br />
or more of the day.<br />
State<br />
Rate<br />
State<br />
Target<br />
LEA<br />
Rate<br />
B) In the Regular Class less than 40% of the day<br />
Percent of CWD with<br />
IEPs receiving instruction<br />
in the regular class less<br />
than 60% of the day.<br />
53.87% 59.77%<br />
State<br />
Rate<br />
State<br />
Target<br />
12.42% 12.51%<br />
53.16%<br />
LEA<br />
Rate<br />
13.16%<br />
C) Other Settings outside the regular class<br />
Percent of CWD with IEPs served in<br />
public or private separate schools,<br />
residential placements, or<br />
homebound/hospital placements.<br />
State<br />
Rate<br />
State<br />
Target<br />
2.80% 2.56%<br />
Target Met<br />
by LEA (Y/N)<br />
N<br />
Target Met<br />
by LEA (Y/N)<br />
N<br />
LEA<br />
Rate<br />
5.26%<br />
Target Met<br />
by LEA(Y/N)<br />
Indicator 06: Early Childhood (3-5) Least Restrictive Environment<br />
A) Regular Early Childhood Program<br />
Percent of children (aged 3 through 5) with IEPs attending a regular<br />
early childhood program and receiving the majority of special<br />
education and related services in the regular early childhood program<br />
Allowable<br />
Difference<br />
LEA: 1602 - WESTSIDE CONS. SCHOOL <strong>DISTRICT</strong><br />
Indicator 07: Preschool (3-5) Outcomes<br />
a) Percent of preschool CWD<br />
children who did not<br />
improve functioning.<br />
b) Percent of preschool CWD<br />
who improved but whose<br />
functioning remained below<br />
same age peers.<br />
c) Percent of preschool CWD<br />
who improved at a level<br />
nearer to same aged peers.<br />
d) Percent of preschool CWD<br />
who improved functioning to<br />
reach a level comparable to<br />
same age peers.<br />
e) Percent of preschool CWD<br />
children who maintain<br />
functioning at a level<br />
comparable to same aged<br />
peers.<br />
Summary<br />
Statements<br />
1) Of those preschool<br />
children who entered<br />
the preschool program<br />
below age expectations<br />
in each Outcome, the<br />
percent who<br />
substantially increased<br />
their rate of growth by<br />
the time they turned 6<br />
years of age or exited<br />
the program.<br />
2) The percent of<br />
preschool children who<br />
were functioning<br />
within age expectations<br />
in each Outcome by the<br />
time they turned 6<br />
years of age or exited<br />
A) Positive Social -Emotional<br />
Skills*<br />
State<br />
Rate<br />
A) Positive Social -<br />
Emotional Skills<br />
(Including social<br />
relationships)<br />
State<br />
Rate<br />
2.14%<br />
5.31%<br />
25.97%<br />
38.22%<br />
28.36%<br />
State<br />
Target<br />
LEA<br />
Rate<br />
LEA<br />
Rate<br />
— —<br />
— —<br />
— —<br />
— —<br />
— —<br />
Target<br />
Met by<br />
LEA(Y/N)<br />
B) Acquisition and Use of<br />
Knowledge and Skills<br />
(Including early language/<br />
communication and early literacy)<br />
B) Acquisition and Use of<br />
Knowledge and Skills **<br />
State<br />
Rate<br />
1.75%<br />
6.59%<br />
34.23%<br />
43.51%<br />
13.92%<br />
State<br />
Target<br />
LEA<br />
Rate<br />
Target<br />
Met by<br />
LEA(Y/N)<br />
C) Use of Appropriate Behaviors<br />
to Meet Their Needs<br />
State<br />
Rate<br />
State<br />
Target<br />
LEA<br />
Rate<br />
Target<br />
Met by<br />
LEA(Y/N)<br />
89.61% 90.50% — — N/A 90.31% 90.50% — — N/A 90.82% 92.50% — — N/A<br />
66.58% 69.50% — — N/A 57.43% 60.50% — — N/A 76.69% 78.50% — — N/A<br />
NOTE: * Including social relationships ** Including early language/ communication and early literacy<br />
Note: - - denotes not applicable<br />
State<br />
Rate<br />
LEA<br />
Rate<br />
— —<br />
— —<br />
— —<br />
— —<br />
— —<br />
C) Use of<br />
Appropriate<br />
Behaviors to<br />
Meet Their Needs<br />
State<br />
Rate<br />
4.51%<br />
17.34%<br />
41.72%<br />
34.97%<br />
LEA<br />
Rate<br />
1.46% — —<br />
— —<br />
— —<br />
— —<br />
— —<br />
Page 3 of 5
LEA: 1602 - WESTSIDE CONS. SCHOOL <strong>DISTRICT</strong><br />
Indicator 08: Parent Involvement<br />
Percent of surveyed<br />
parents who reported<br />
school facilitated parent<br />
involvement as a means<br />
of improving services<br />
and results for children<br />
with disabilities.<br />
Early Childhood<br />
(3-5)<br />
School Age<br />
(5-21)<br />
State<br />
Rate<br />
90.47%<br />
95.05%<br />
Indicator 09: Disproportionality - Eligibility<br />
Disproportionate representation of racial<br />
and ethnic groups in special education and<br />
related services that is a result of<br />
inappropriate identification (e.g.<br />
monitoring data, review of policies,<br />
practices, and procedures under 618(d),<br />
etc.).<br />
State<br />
Rate<br />
State<br />
Target<br />
88.00%<br />
96.00%<br />
State<br />
Target<br />
0.00% 0.00%<br />
LEA<br />
Rate<br />
— —<br />
90.15%<br />
Indicator 10: Disproportionality-Child with a Disability<br />
Disproportionate representation of racial<br />
and ethnic groups in specific disability<br />
categories that is a result of inappropriate<br />
identification (e.g. monitoring data, review<br />
of policies, practices, and procedures under<br />
618(d), etc.).<br />
Indicator 11: Child Find<br />
Percent of children with<br />
parental consent to evaluate<br />
who are evaluated within<br />
the State established timeline<br />
of 60 days.<br />
Overall<br />
(3-21)<br />
Early Childhood<br />
(3-5)<br />
School Age<br />
(5-21)<br />
State<br />
Rate<br />
0.00%<br />
Indicator 12: Early Childhood Transition<br />
Percent of children referred by Part C prior to<br />
age 3, who are found eligible for Part B, and<br />
who have an IEP developed and implemented<br />
by their third birthday.<br />
Note: - - denotes not applicable<br />
State<br />
Rate<br />
99.41%<br />
99.70%<br />
98.97%<br />
State<br />
Rate<br />
State<br />
Target<br />
0.00%<br />
State<br />
Target<br />
100.00%<br />
100.00%<br />
100.00%<br />
State<br />
Target<br />
Target Met by<br />
LEA (Y/N)<br />
Y<br />
Target Met by<br />
LEA (Y/N)<br />
Y<br />
LEA<br />
Rate<br />
100.00%<br />
— —<br />
100.00%<br />
LEA<br />
Rate<br />
Target Met by<br />
LEA (Y/N)<br />
N/A<br />
N<br />
Note: The target for Indicator 09 is to have zero percent<br />
(0%) of districts identified as having disproportionate<br />
representation as a result of inappropriate<br />
identification in eligibility.<br />
Note: The target for Indicator 10 is to have zero<br />
percent (0%) of districts identified as having<br />
disproportionate representation as a result of<br />
inappropriate identification in a disability<br />
category.<br />
Target Met by<br />
LEA (Y/N)<br />
N/A<br />
Y<br />
Target Met<br />
by LEA<br />
(Y/N)<br />
99.21% 100.00% - - N/A<br />
Y<br />
Note: * Indicates a zero reponse rate for the<br />
district.<br />
Page 4 of 5
LEA: 1602 - WESTSIDE CONS. SCHOOL <strong>DISTRICT</strong><br />
Indicator 13: Secondary Transition<br />
Percent of youth with disabilities aged 16 and<br />
up with an IEP that includes coordinated,<br />
measurable, annual IEP goals and transition<br />
services that will reasonably enable the student<br />
to meet the post-secondary goals.<br />
Indicator 14: Post-School Outcomes<br />
A. Percent of youth enrolled in higher<br />
education within one year of leaving high<br />
school.<br />
State<br />
Rate<br />
State<br />
Target<br />
Note: Data for this Indicator is from the on-site monitoring of LEAs for the given year.<br />
B. Percent of youth enrolled in higher<br />
education or competitively employed<br />
within one year of leaving high school.<br />
C. Percent of youth enrolled in higher<br />
education or in some other postsecondary<br />
education or training program; or<br />
competitively employed or in some other<br />
employment within one year of leaving<br />
high school.<br />
State<br />
Rate<br />
Indicator 20: Reported Data-Timely and Accurate*<br />
District submitted<br />
required data elements<br />
on or before due dates;<br />
made revisions within<br />
the alloted reveiw<br />
periods.<br />
Accurate and Timely<br />
Data Submission<br />
Overall (3-21)<br />
Early Childhood (3-5)<br />
School Age (5-21)<br />
State<br />
Target<br />
100.00%<br />
100.00%<br />
100.00%<br />
State<br />
Target<br />
LEA<br />
Rate<br />
LEA<br />
Rate<br />
Target Met by<br />
LEA (Y/N)<br />
Target Met<br />
by LEA<br />
(Y/N)<br />
Target Met<br />
by LEA<br />
(Y/N)<br />
*Data reviewed for timely and accurate submissions included all APSCN cycle data except for personnel<br />
Note: - - denotes not applicable<br />
96.19 100.00 — — N/A<br />
14.53<br />
State<br />
Rate<br />
49.42<br />
State<br />
Rate<br />
54.07<br />
13.00<br />
State<br />
Target<br />
49.00<br />
State<br />
Target<br />
60.00<br />
Y<br />
N/A<br />
Y<br />
— —<br />
LEA<br />
Rate<br />
— —<br />
LEA<br />
Rate<br />
— —<br />
N/A<br />
Target Met<br />
by LEA<br />
(Y/N)<br />
N/A<br />
Target Met<br />
by LEA<br />
(Y/N)<br />
N/A<br />
Page 5 of 5
<strong>ARKANSAS</strong> <strong>SPECIAL</strong> <strong>EDUCATION</strong><br />
<strong>DISTRICT</strong> <strong>ANNUAL</strong> PERFORMANCE REPORT<br />
2010/11 School Year<br />
Publication Date: March 2012<br />
Each State must have in place a State Performance Plan (SPP) to evaluate the State's efforts to meet the requirements and<br />
purposes of the implementation of the Individuals with Disabilities Education Act (IDEA). The SPP is a six-year plan, which<br />
describes Arkansas's performance on 20 indicators. The Office of Special Education Programs in the U. S. Department of<br />
Education requires that States report annually to the public on the performance of each local education agency (LEA) on 14 of<br />
20 indicators as compared with targets established by the State in the SPP. Arkansas will report indicators 1 through 14 and<br />
20 for each LEA serving children with disabilities (CWD). Any LEA not meeting targets on compliance indicators (0% for<br />
Indicators 4B, 09 & 10 and 100% for Indicators 11, 12, 13, and 20) are non-compliant with IDEA.<br />
There are no report changes for the 2010/11 school year profile; However, it is important to recognize that: .<br />
1. Indicator 01 (Graduation) is reported a year in arrear (2009/10 graduates) and is based on a four-year cohort. This<br />
means the rate is a measure of students who entered in ninth grade and graduate in four years. The calculation is a<br />
requirement under Title I of the Elementary and Secondary Education Act (ESEA).<br />
2. Indicator 02 (Drop out) is reported a year in arrear. This means the rate is a measure of students who dropped out in<br />
the 2009/10 school year. The Indicator 02 data are aligned with the Common Core of Data (CCD) requirements for<br />
grades 7-12.<br />
3. Indicator 04A and 4B (Suspension/Expulsion) is reported a year in arrear. This means the rate is a measure of<br />
students who had out-of-school suspensions and/or expulsions totaling more than 10 days.<br />
For a complete description of all the Indicators, please visit the special education website at<br />
http://arksped.k12.ar.us/sections/policy.html<br />
LEA: 1603 - BROOKLAND SCHOOL <strong>DISTRICT</strong><br />
Indicator 01: Graduation Rates (2009/10 school year) Indicator 02: Dropout Rates (2009/10 school year)<br />
Percent of youth<br />
with IEPs<br />
graduating from<br />
high school with a<br />
regular diploma<br />
State<br />
Rate<br />
State<br />
Target<br />
75.76% 85.00%<br />
LEA<br />
Rate<br />
94.74%<br />
Target Met<br />
by LEA<br />
(Y/N)<br />
Y<br />
Percent of<br />
youth with<br />
IEPs dropping<br />
out of high<br />
school<br />
State<br />
Rate<br />
Indicator 03: Assessment on Statewide Benchmark Exam (grades 3-8, 11)<br />
A) Adequate Yearly Progress<br />
n=40<br />
Literacy<br />
Mathematics<br />
Met Disability Subgroup "n"<br />
for Reporting Purposes (Y/N)<br />
State Target for % of Districts Meeting<br />
AYP for Disability Subgroup<br />
State<br />
Target<br />
3.06% 4.20%<br />
LEA<br />
Rate<br />
0.00%<br />
% of Districts Meeting AYP<br />
for Disability Subgroup<br />
Target Met by<br />
LEA (Y/N)<br />
Y<br />
Target Met by<br />
LEA(Y/N)<br />
Overall N 17.15% 6.25%<br />
NA<br />
N<br />
N<br />
Note: For a district to qualify as having a disability subgroup it must have a minimum of 40 (n=40) students with disabilities in a school building.<br />
B) Participation<br />
Participation Rate: # of<br />
CWD Tested ÷ # of CWD<br />
Enrolled in grades tested.<br />
Participation Rate: Literacy<br />
Participation Rate: Math<br />
Note: - - denotes not applicable<br />
State<br />
Rate<br />
98.78%<br />
State<br />
Target<br />
95.00%<br />
LEA<br />
Rate<br />
98.78%<br />
Target Met<br />
by LEA (Y/N)<br />
98.61% 95.00% 98.90% Y<br />
Y<br />
C) Performance Proficiency<br />
Percent of CWD Scoring<br />
Proficient or Above<br />
Proficiency Rate: Literacy<br />
Proficiency Rate:<br />
Mathematics<br />
16.00%<br />
16.00%<br />
State<br />
Rate<br />
31.49%<br />
44.86%<br />
State<br />
Target<br />
45.22%<br />
51.14%<br />
LEA<br />
Rate<br />
43.75%<br />
51.16%<br />
NA<br />
NA<br />
Target<br />
Met by<br />
LEA (Y/N)<br />
N<br />
Y<br />
Page 1 of 5
LEA: 1603 - BROOKLAND SCHOOL <strong>DISTRICT</strong><br />
Indicator 04: Out-of-School Suspensions and Expulsions (2009/10 school year)<br />
A) Suspension/Expulsion<br />
Percent difference of CWD with out-of- school suspensions and<br />
expulsions totaling greater than 10 days in a school year as<br />
compared to the same data for general education students in<br />
the district.<br />
B) Suspension/Expulsion by Race and Ethnicity<br />
Percent of districts that have: (a) a significant discrepancy, by race or<br />
ethnicity, in the rate of suspensions and expulsions of greater than 10<br />
days in a school year for children with IEPs; and (b) policies,<br />
procedures or practices that contribute to the significant discrepancy<br />
and do not comply with requirements relating to the development<br />
and implementation of IEPs, the use of positive behavioral<br />
interventions and supports, and procedural safeguards.<br />
Indicator 05: School Age (5-21) Least Restrictive Environment<br />
A) In the Regular Class 80% or more of the day<br />
Percent of CWD with<br />
IEPs receiving instruction<br />
in the regular class 80%<br />
or more of the day.<br />
State<br />
Rate<br />
State<br />
Target<br />
LEA<br />
Rate<br />
B) In the Regular Class less than 40% of the day<br />
Percent of CWD with<br />
IEPs receiving instruction<br />
in the regular class less<br />
than 60% of the day.<br />
53.87% 59.77%<br />
State<br />
Rate<br />
State<br />
Target<br />
12.42% 12.51%<br />
53.37%<br />
LEA<br />
Rate<br />
10.43%<br />
C) Other Settings outside the regular class<br />
Percent of CWD with IEPs served in<br />
public or private separate schools,<br />
residential placements, or<br />
homebound/hospital placements.<br />
State<br />
Rate<br />
State<br />
Target<br />
2.80% 2.56%<br />
Target Met<br />
by LEA (Y/N)<br />
N<br />
Target Met<br />
by LEA (Y/N)<br />
Y<br />
LEA<br />
Rate<br />
0.61%<br />
Target Met<br />
by LEA(Y/N)<br />
Indicator 06: Early Childhood (3-5) Least Restrictive Environment<br />
A) Regular Early Childhood Program<br />
Percent of children (aged 3 through 5) with IEPs attending a regular<br />
early childhood program and receiving the majority of special<br />
education and related services in the regular early childhood program<br />
Allowable<br />
Difference<br />
LEA: 1603 - BROOKLAND SCHOOL <strong>DISTRICT</strong><br />
Indicator 07: Preschool (3-5) Outcomes<br />
a) Percent of preschool CWD<br />
children who did not<br />
improve functioning.<br />
b) Percent of preschool CWD<br />
who improved but whose<br />
functioning remained below<br />
same age peers.<br />
c) Percent of preschool CWD<br />
who improved at a level<br />
nearer to same aged peers.<br />
d) Percent of preschool CWD<br />
who improved functioning to<br />
reach a level comparable to<br />
same age peers.<br />
e) Percent of preschool CWD<br />
children who maintain<br />
functioning at a level<br />
comparable to same aged<br />
peers.<br />
Summary<br />
Statements<br />
1) Of those preschool<br />
children who entered<br />
the preschool program<br />
below age expectations<br />
in each Outcome, the<br />
percent who<br />
substantially increased<br />
their rate of growth by<br />
the time they turned 6<br />
years of age or exited<br />
the program.<br />
2) The percent of<br />
preschool children who<br />
were functioning<br />
within age expectations<br />
in each Outcome by the<br />
time they turned 6<br />
years of age or exited<br />
A) Positive Social -Emotional<br />
Skills*<br />
State<br />
Rate<br />
A) Positive Social -<br />
Emotional Skills<br />
(Including social<br />
relationships)<br />
State<br />
Rate<br />
2.14%<br />
5.31%<br />
25.97%<br />
38.22%<br />
28.36%<br />
State<br />
Target<br />
LEA<br />
Rate<br />
LEA<br />
Rate<br />
— —<br />
— —<br />
— —<br />
— —<br />
— —<br />
Target<br />
Met by<br />
LEA(Y/N)<br />
B) Acquisition and Use of<br />
Knowledge and Skills<br />
(Including early language/<br />
communication and early literacy)<br />
B) Acquisition and Use of<br />
Knowledge and Skills **<br />
State<br />
Rate<br />
1.75%<br />
6.59%<br />
34.23%<br />
43.51%<br />
13.92%<br />
State<br />
Target<br />
LEA<br />
Rate<br />
Target<br />
Met by<br />
LEA(Y/N)<br />
C) Use of Appropriate Behaviors<br />
to Meet Their Needs<br />
State<br />
Rate<br />
State<br />
Target<br />
LEA<br />
Rate<br />
Target<br />
Met by<br />
LEA(Y/N)<br />
89.61% 90.50% — — N/A 90.31% 90.50% — — N/A 90.82% 92.50% — — N/A<br />
66.58% 69.50% — — N/A 57.43% 60.50% — — N/A 76.69% 78.50% — — N/A<br />
NOTE: * Including social relationships ** Including early language/ communication and early literacy<br />
Note: - - denotes not applicable<br />
State<br />
Rate<br />
LEA<br />
Rate<br />
— —<br />
— —<br />
— —<br />
— —<br />
— —<br />
C) Use of<br />
Appropriate<br />
Behaviors to<br />
Meet Their Needs<br />
State<br />
Rate<br />
4.51%<br />
17.34%<br />
41.72%<br />
34.97%<br />
LEA<br />
Rate<br />
1.46% — —<br />
— —<br />
— —<br />
— —<br />
— —<br />
Page 3 of 5
LEA: 1603 - BROOKLAND SCHOOL <strong>DISTRICT</strong><br />
Indicator 08: Parent Involvement<br />
Percent of surveyed<br />
parents who reported<br />
school facilitated parent<br />
involvement as a means<br />
of improving services<br />
and results for children<br />
with disabilities.<br />
Early Childhood<br />
(3-5)<br />
School Age<br />
(5-21)<br />
State<br />
Rate<br />
90.47%<br />
95.05%<br />
Indicator 09: Disproportionality - Eligibility<br />
Disproportionate representation of racial<br />
and ethnic groups in special education and<br />
related services that is a result of<br />
inappropriate identification (e.g.<br />
monitoring data, review of policies,<br />
practices, and procedures under 618(d),<br />
etc.).<br />
State<br />
Rate<br />
State<br />
Target<br />
88.00%<br />
96.00%<br />
State<br />
Target<br />
0.00% 0.00%<br />
LEA<br />
Rate<br />
— —<br />
95.05%<br />
Indicator 10: Disproportionality-Child with a Disability<br />
Disproportionate representation of racial<br />
and ethnic groups in specific disability<br />
categories that is a result of inappropriate<br />
identification (e.g. monitoring data, review<br />
of policies, practices, and procedures under<br />
618(d), etc.).<br />
Indicator 11: Child Find<br />
Percent of children with<br />
parental consent to evaluate<br />
who are evaluated within<br />
the State established timeline<br />
of 60 days.<br />
Overall<br />
(3-21)<br />
Early Childhood<br />
(3-5)<br />
School Age<br />
(5-21)<br />
State<br />
Rate<br />
0.00%<br />
Indicator 12: Early Childhood Transition<br />
Percent of children referred by Part C prior to<br />
age 3, who are found eligible for Part B, and<br />
who have an IEP developed and implemented<br />
by their third birthday.<br />
Note: - - denotes not applicable<br />
State<br />
Rate<br />
99.41%<br />
99.70%<br />
98.97%<br />
State<br />
Rate<br />
State<br />
Target<br />
0.00%<br />
State<br />
Target<br />
100.00%<br />
100.00%<br />
100.00%<br />
State<br />
Target<br />
Target Met by<br />
LEA (Y/N)<br />
Y<br />
Target Met by<br />
LEA (Y/N)<br />
Y<br />
LEA<br />
Rate<br />
100.00%<br />
— —<br />
100.00%<br />
LEA<br />
Rate<br />
Target Met by<br />
LEA (Y/N)<br />
N/A<br />
N<br />
Note: The target for Indicator 09 is to have zero percent<br />
(0%) of districts identified as having disproportionate<br />
representation as a result of inappropriate<br />
identification in eligibility.<br />
Note: The target for Indicator 10 is to have zero<br />
percent (0%) of districts identified as having<br />
disproportionate representation as a result of<br />
inappropriate identification in a disability<br />
category.<br />
Target Met by<br />
LEA (Y/N)<br />
N/A<br />
Y<br />
Target Met<br />
by LEA<br />
(Y/N)<br />
99.21% 100.00% - - N/A<br />
Y<br />
Note: * Indicates a zero reponse rate for the<br />
district.<br />
Page 4 of 5
LEA: 1603 - BROOKLAND SCHOOL <strong>DISTRICT</strong><br />
Indicator 13: Secondary Transition<br />
Percent of youth with disabilities aged 16 and<br />
up with an IEP that includes coordinated,<br />
measurable, annual IEP goals and transition<br />
services that will reasonably enable the student<br />
to meet the post-secondary goals.<br />
Indicator 14: Post-School Outcomes<br />
A. Percent of youth enrolled in higher<br />
education within one year of leaving high<br />
school.<br />
State<br />
Rate<br />
State<br />
Target<br />
Note: Data for this Indicator is from the on-site monitoring of LEAs for the given year.<br />
B. Percent of youth enrolled in higher<br />
education or competitively employed<br />
within one year of leaving high school.<br />
C. Percent of youth enrolled in higher<br />
education or in some other postsecondary<br />
education or training program; or<br />
competitively employed or in some other<br />
employment within one year of leaving<br />
high school.<br />
State<br />
Rate<br />
Indicator 20: Reported Data-Timely and Accurate*<br />
District submitted<br />
required data elements<br />
on or before due dates;<br />
made revisions within<br />
the alloted reveiw<br />
periods.<br />
Accurate and Timely<br />
Data Submission<br />
Overall (3-21)<br />
Early Childhood (3-5)<br />
School Age (5-21)<br />
State<br />
Target<br />
100.00%<br />
100.00%<br />
100.00%<br />
State<br />
Target<br />
LEA<br />
Rate<br />
LEA<br />
Rate<br />
Target Met by<br />
LEA (Y/N)<br />
Target Met<br />
by LEA<br />
(Y/N)<br />
Target Met<br />
by LEA<br />
(Y/N)<br />
*Data reviewed for timely and accurate submissions included all APSCN cycle data except for personnel<br />
Note: - - denotes not applicable<br />
96.19 100.00 — — N/A<br />
14.53<br />
State<br />
Rate<br />
49.42<br />
State<br />
Rate<br />
54.07<br />
13.00<br />
State<br />
Target<br />
49.00<br />
State<br />
Target<br />
60.00<br />
Y<br />
N/A<br />
Y<br />
— —<br />
LEA<br />
Rate<br />
— —<br />
LEA<br />
Rate<br />
— —<br />
N/A<br />
Target Met<br />
by LEA<br />
(Y/N)<br />
N/A<br />
Target Met<br />
by LEA<br />
(Y/N)<br />
N/A<br />
Page 5 of 5
<strong>ARKANSAS</strong> <strong>SPECIAL</strong> <strong>EDUCATION</strong><br />
<strong>DISTRICT</strong> <strong>ANNUAL</strong> PERFORMANCE REPORT<br />
2010/11 School Year<br />
Publication Date: March 2012<br />
Each State must have in place a State Performance Plan (SPP) to evaluate the State's efforts to meet the requirements and<br />
purposes of the implementation of the Individuals with Disabilities Education Act (IDEA). The SPP is a six-year plan, which<br />
describes Arkansas's performance on 20 indicators. The Office of Special Education Programs in the U. S. Department of<br />
Education requires that States report annually to the public on the performance of each local education agency (LEA) on 14 of<br />
20 indicators as compared with targets established by the State in the SPP. Arkansas will report indicators 1 through 14 and<br />
20 for each LEA serving children with disabilities (CWD). Any LEA not meeting targets on compliance indicators (0% for<br />
Indicators 4B, 09 & 10 and 100% for Indicators 11, 12, 13, and 20) are non-compliant with IDEA.<br />
There are no report changes for the 2010/11 school year profile; However, it is important to recognize that: .<br />
1. Indicator 01 (Graduation) is reported a year in arrear (2009/10 graduates) and is based on a four-year cohort. This<br />
means the rate is a measure of students who entered in ninth grade and graduate in four years. The calculation is a<br />
requirement under Title I of the Elementary and Secondary Education Act (ESEA).<br />
2. Indicator 02 (Drop out) is reported a year in arrear. This means the rate is a measure of students who dropped out in<br />
the 2009/10 school year. The Indicator 02 data are aligned with the Common Core of Data (CCD) requirements for<br />
grades 7-12.<br />
3. Indicator 04A and 4B (Suspension/Expulsion) is reported a year in arrear. This means the rate is a measure of<br />
students who had out-of-school suspensions and/or expulsions totaling more than 10 days.<br />
For a complete description of all the Indicators, please visit the special education website at<br />
http://arksped.k12.ar.us/sections/policy.html<br />
LEA: 1605 - BUFFALO IS. CENTRAL SCH. <strong>DISTRICT</strong><br />
Indicator 01: Graduation Rates (2009/10 school year) Indicator 02: Dropout Rates (2009/10 school year)<br />
Percent of youth<br />
with IEPs<br />
graduating from<br />
high school with a<br />
regular diploma<br />
State<br />
Rate<br />
State<br />
Target<br />
75.76% 85.00%<br />
LEA<br />
Rate<br />
88.89%<br />
Target Met<br />
by LEA<br />
(Y/N)<br />
Y<br />
Percent of<br />
youth with<br />
IEPs dropping<br />
out of high<br />
school<br />
State<br />
Rate<br />
Indicator 03: Assessment on Statewide Benchmark Exam (grades 3-8, 11)<br />
A) Adequate Yearly Progress<br />
n=40<br />
Literacy<br />
Mathematics<br />
Met Disability Subgroup "n"<br />
for Reporting Purposes (Y/N)<br />
State Target for % of Districts Meeting<br />
AYP for Disability Subgroup<br />
State<br />
Target<br />
3.06% 4.20%<br />
LEA<br />
Rate<br />
0.00%<br />
% of Districts Meeting AYP<br />
for Disability Subgroup<br />
Target Met by<br />
LEA (Y/N)<br />
Y<br />
Target Met by<br />
LEA(Y/N)<br />
Overall N 17.15% 6.25%<br />
NA<br />
N<br />
N<br />
Note: For a district to qualify as having a disability subgroup it must have a minimum of 40 (n=40) students with disabilities in a school building.<br />
B) Participation<br />
Participation Rate: # of<br />
CWD Tested ÷ # of CWD<br />
Enrolled in grades tested.<br />
Participation Rate: Literacy<br />
Participation Rate: Math<br />
Note: - - denotes not applicable<br />
State<br />
Rate<br />
98.78%<br />
State<br />
Target<br />
95.00%<br />
LEA<br />
Rate<br />
100.00%<br />
Target Met<br />
by LEA (Y/N)<br />
98.61% 95.00% 100.00% Y<br />
Y<br />
C) Performance Proficiency<br />
Percent of CWD Scoring<br />
Proficient or Above<br />
Proficiency Rate: Literacy<br />
Proficiency Rate:<br />
Mathematics<br />
16.00%<br />
16.00%<br />
State<br />
Rate<br />
31.49%<br />
44.86%<br />
State<br />
Target<br />
45.22%<br />
51.14%<br />
LEA<br />
Rate<br />
24.59%<br />
47.76%<br />
NA<br />
NA<br />
Target<br />
Met by<br />
LEA (Y/N)<br />
N<br />
N<br />
Page 1 of 5
LEA: 1605 - BUFFALO IS. CENTRAL SCH. <strong>DISTRICT</strong><br />
Indicator 04: Out-of-School Suspensions and Expulsions (2009/10 school year)<br />
A) Suspension/Expulsion<br />
Percent difference of CWD with out-of- school suspensions and<br />
expulsions totaling greater than 10 days in a school year as<br />
compared to the same data for general education students in<br />
the district.<br />
B) Suspension/Expulsion by Race and Ethnicity<br />
Percent of districts that have: (a) a significant discrepancy, by race or<br />
ethnicity, in the rate of suspensions and expulsions of greater than 10<br />
days in a school year for children with IEPs; and (b) policies,<br />
procedures or practices that contribute to the significant discrepancy<br />
and do not comply with requirements relating to the development<br />
and implementation of IEPs, the use of positive behavioral<br />
interventions and supports, and procedural safeguards.<br />
Indicator 05: School Age (5-21) Least Restrictive Environment<br />
A) In the Regular Class 80% or more of the day<br />
Percent of CWD with<br />
IEPs receiving instruction<br />
in the regular class 80%<br />
or more of the day.<br />
State<br />
Rate<br />
State<br />
Target<br />
LEA<br />
Rate<br />
B) In the Regular Class less than 40% of the day<br />
Percent of CWD with<br />
IEPs receiving instruction<br />
in the regular class less<br />
than 60% of the day.<br />
53.87% 59.77%<br />
State<br />
Rate<br />
State<br />
Target<br />
12.42% 12.51%<br />
38.40%<br />
LEA<br />
Rate<br />
2.40%<br />
C) Other Settings outside the regular class<br />
Percent of CWD with IEPs served in<br />
public or private separate schools,<br />
residential placements, or<br />
homebound/hospital placements.<br />
State<br />
Rate<br />
State<br />
Target<br />
2.80% 2.56%<br />
Target Met<br />
by LEA (Y/N)<br />
N<br />
Target Met<br />
by LEA (Y/N)<br />
Y<br />
LEA<br />
Rate<br />
0.00%<br />
Target Met<br />
by LEA(Y/N)<br />
Indicator 06: Early Childhood (3-5) Least Restrictive Environment<br />
A) Regular Early Childhood Program<br />
Percent of children (aged 3 through 5) with IEPs attending a regular<br />
early childhood program and receiving the majority of special<br />
education and related services in the regular early childhood program<br />
Allowable<br />
Difference<br />
LEA: 1605 - BUFFALO IS. CENTRAL SCH. <strong>DISTRICT</strong><br />
Indicator 07: Preschool (3-5) Outcomes<br />
a) Percent of preschool CWD<br />
children who did not<br />
improve functioning.<br />
b) Percent of preschool CWD<br />
who improved but whose<br />
functioning remained below<br />
same age peers.<br />
c) Percent of preschool CWD<br />
who improved at a level<br />
nearer to same aged peers.<br />
d) Percent of preschool CWD<br />
who improved functioning to<br />
reach a level comparable to<br />
same age peers.<br />
e) Percent of preschool CWD<br />
children who maintain<br />
functioning at a level<br />
comparable to same aged<br />
peers.<br />
Summary<br />
Statements<br />
1) Of those preschool<br />
children who entered<br />
the preschool program<br />
below age expectations<br />
in each Outcome, the<br />
percent who<br />
substantially increased<br />
their rate of growth by<br />
the time they turned 6<br />
years of age or exited<br />
the program.<br />
2) The percent of<br />
preschool children who<br />
were functioning<br />
within age expectations<br />
in each Outcome by the<br />
time they turned 6<br />
years of age or exited<br />
A) Positive Social -Emotional<br />
Skills*<br />
State<br />
Rate<br />
A) Positive Social -<br />
Emotional Skills<br />
(Including social<br />
relationships)<br />
State<br />
Rate<br />
2.14%<br />
5.31%<br />
25.97%<br />
38.22%<br />
28.36%<br />
State<br />
Target<br />
LEA<br />
Rate<br />
LEA<br />
Rate<br />
— —<br />
— —<br />
— —<br />
— —<br />
— —<br />
Target<br />
Met by<br />
LEA(Y/N)<br />
B) Acquisition and Use of<br />
Knowledge and Skills<br />
(Including early language/<br />
communication and early literacy)<br />
B) Acquisition and Use of<br />
Knowledge and Skills **<br />
State<br />
Rate<br />
1.75%<br />
6.59%<br />
34.23%<br />
43.51%<br />
13.92%<br />
State<br />
Target<br />
LEA<br />
Rate<br />
Target<br />
Met by<br />
LEA(Y/N)<br />
C) Use of Appropriate Behaviors<br />
to Meet Their Needs<br />
State<br />
Rate<br />
State<br />
Target<br />
LEA<br />
Rate<br />
Target<br />
Met by<br />
LEA(Y/N)<br />
89.61% 90.50% — — N/A 90.31% 90.50% — — N/A 90.82% 92.50% — — N/A<br />
66.58% 69.50% — — N/A 57.43% 60.50% — — N/A 76.69% 78.50% — — N/A<br />
NOTE: * Including social relationships ** Including early language/ communication and early literacy<br />
Note: - - denotes not applicable<br />
State<br />
Rate<br />
LEA<br />
Rate<br />
— —<br />
— —<br />
— —<br />
— —<br />
— —<br />
C) Use of<br />
Appropriate<br />
Behaviors to<br />
Meet Their Needs<br />
State<br />
Rate<br />
4.51%<br />
17.34%<br />
41.72%<br />
34.97%<br />
LEA<br />
Rate<br />
1.46% — —<br />
— —<br />
— —<br />
— —<br />
— —<br />
Page 3 of 5
LEA: 1605 - BUFFALO IS. CENTRAL SCH. <strong>DISTRICT</strong><br />
Indicator 08: Parent Involvement<br />
Percent of surveyed<br />
parents who reported<br />
school facilitated parent<br />
involvement as a means<br />
of improving services<br />
and results for children<br />
with disabilities.<br />
Early Childhood<br />
(3-5)<br />
School Age<br />
(5-21)<br />
State<br />
Rate<br />
90.47%<br />
95.05%<br />
Indicator 09: Disproportionality - Eligibility<br />
Disproportionate representation of racial<br />
and ethnic groups in special education and<br />
related services that is a result of<br />
inappropriate identification (e.g.<br />
monitoring data, review of policies,<br />
practices, and procedures under 618(d),<br />
etc.).<br />
State<br />
Rate<br />
State<br />
Target<br />
88.00%<br />
96.00%<br />
State<br />
Target<br />
0.00% 0.00%<br />
LEA<br />
Rate<br />
— —<br />
97.40%<br />
Indicator 10: Disproportionality-Child with a Disability<br />
Disproportionate representation of racial<br />
and ethnic groups in specific disability<br />
categories that is a result of inappropriate<br />
identification (e.g. monitoring data, review<br />
of policies, practices, and procedures under<br />
618(d), etc.).<br />
Indicator 11: Child Find<br />
Percent of children with<br />
parental consent to evaluate<br />
who are evaluated within<br />
the State established timeline<br />
of 60 days.<br />
Overall<br />
(3-21)<br />
Early Childhood<br />
(3-5)<br />
School Age<br />
(5-21)<br />
State<br />
Rate<br />
0.00%<br />
Indicator 12: Early Childhood Transition<br />
Percent of children referred by Part C prior to<br />
age 3, who are found eligible for Part B, and<br />
who have an IEP developed and implemented<br />
by their third birthday.<br />
Note: - - denotes not applicable<br />
State<br />
Rate<br />
99.41%<br />
99.70%<br />
98.97%<br />
State<br />
Rate<br />
State<br />
Target<br />
0.00%<br />
State<br />
Target<br />
100.00%<br />
100.00%<br />
100.00%<br />
State<br />
Target<br />
Target Met by<br />
LEA (Y/N)<br />
Y<br />
Target Met by<br />
LEA (Y/N)<br />
Y<br />
LEA<br />
Rate<br />
100.00%<br />
— —<br />
100.00%<br />
LEA<br />
Rate<br />
Target Met by<br />
LEA (Y/N)<br />
N/A<br />
Y<br />
Note: The target for Indicator 09 is to have zero percent<br />
(0%) of districts identified as having disproportionate<br />
representation as a result of inappropriate<br />
identification in eligibility.<br />
Note: The target for Indicator 10 is to have zero<br />
percent (0%) of districts identified as having<br />
disproportionate representation as a result of<br />
inappropriate identification in a disability<br />
category.<br />
Target Met by<br />
LEA (Y/N)<br />
N/A<br />
Y<br />
Target Met<br />
by LEA<br />
(Y/N)<br />
99.21% 100.00% - - N/A<br />
Y<br />
Note: * Indicates a zero reponse rate for the<br />
district.<br />
Page 4 of 5
LEA: 1605 - BUFFALO IS. CENTRAL SCH. <strong>DISTRICT</strong><br />
Indicator 13: Secondary Transition<br />
Percent of youth with disabilities aged 16 and<br />
up with an IEP that includes coordinated,<br />
measurable, annual IEP goals and transition<br />
services that will reasonably enable the student<br />
to meet the post-secondary goals.<br />
Indicator 14: Post-School Outcomes<br />
A. Percent of youth enrolled in higher<br />
education within one year of leaving high<br />
school.<br />
State<br />
Rate<br />
State<br />
Target<br />
Note: Data for this Indicator is from the on-site monitoring of LEAs for the given year.<br />
B. Percent of youth enrolled in higher<br />
education or competitively employed<br />
within one year of leaving high school.<br />
C. Percent of youth enrolled in higher<br />
education or in some other postsecondary<br />
education or training program; or<br />
competitively employed or in some other<br />
employment within one year of leaving<br />
high school.<br />
State<br />
Rate<br />
Indicator 20: Reported Data-Timely and Accurate*<br />
District submitted<br />
required data elements<br />
on or before due dates;<br />
made revisions within<br />
the alloted reveiw<br />
periods.<br />
Accurate and Timely<br />
Data Submission<br />
Overall (3-21)<br />
Early Childhood (3-5)<br />
School Age (5-21)<br />
State<br />
Target<br />
100.00%<br />
100.00%<br />
100.00%<br />
State<br />
Target<br />
LEA<br />
Rate<br />
LEA<br />
Rate<br />
Target Met by<br />
LEA (Y/N)<br />
Target Met<br />
by LEA<br />
(Y/N)<br />
Target Met<br />
by LEA<br />
(Y/N)<br />
*Data reviewed for timely and accurate submissions included all APSCN cycle data except for personnel<br />
Note: - - denotes not applicable<br />
96.19 100.00 100.00% Y<br />
14.53<br />
State<br />
Rate<br />
49.42<br />
State<br />
Rate<br />
54.07<br />
13.00<br />
State<br />
Target<br />
49.00<br />
State<br />
Target<br />
60.00<br />
Y<br />
N/A<br />
Y<br />
— —<br />
LEA<br />
Rate<br />
— —<br />
LEA<br />
Rate<br />
— —<br />
N/A<br />
Target Met<br />
by LEA<br />
(Y/N)<br />
N/A<br />
Target Met<br />
by LEA<br />
(Y/N)<br />
N/A<br />
Page 5 of 5
LEA: 1608 - JONESBORO SCHOOL <strong>DISTRICT</strong><br />
<strong>ARKANSAS</strong> <strong>SPECIAL</strong> <strong>EDUCATION</strong><br />
<strong>DISTRICT</strong> <strong>ANNUAL</strong> PERFORMANCE REPORT<br />
2010/11 School Year<br />
Publication Date: March 2012<br />
Each State must have in place a State Performance Plan (SPP) to evaluate the State's efforts to meet the requirements and<br />
purposes of the implementation of the Individuals with Disabilities Education Act (IDEA). The SPP is a six-year plan, which<br />
describes Arkansas's performance on 20 indicators. The Office of Special Education Programs in the U. S. Department of<br />
Education requires that States report annually to the public on the performance of each local education agency (LEA) on 14 of<br />
20 indicators as compared with targets established by the State in the SPP. Arkansas will report indicators 1 through 14 and<br />
20 for each LEA serving children with disabilities (CWD). Any LEA not meeting targets on compliance indicators (0% for<br />
Indicators 4B, 09 & 10 and 100% for Indicators 11, 12, 13, and 20) are non-compliant with IDEA.<br />
There are no report changes for the 2010/11 school year profile; However, it is important to recognize that: .<br />
1. Indicator 01 (Graduation) is reported a year in arrear (2009/10 graduates) and is based on a four-year cohort. This<br />
means the rate is a measure of students who entered in ninth grade and graduate in four years. The calculation is a<br />
requirement under Title I of the Elementary and Secondary Education Act (ESEA).<br />
2. Indicator 02 (Drop out) is reported a year in arrear. This means the rate is a measure of students who dropped out in<br />
the 2009/10 school year. The Indicator 02 data are aligned with the Common Core of Data (CCD) requirements for<br />
grades 7-12.<br />
3. Indicator 04A and 4B (Suspension/Expulsion) is reported a year in arrear. This means the rate is a measure of<br />
students who had out-of-school suspensions and/or expulsions totaling more than 10 days.<br />
Percent of youth<br />
with IEPs<br />
graduating from<br />
high school with a<br />
regular diploma<br />
For a complete description of all the Indicators, please visit the special education website at<br />
http://arksped.k12.ar.us/sections/policy.html<br />
Indicator 01: Graduation Rates (2009/10 school year) Indicator 02: Dropout Rates (2009/10 school year)<br />
State<br />
Rate<br />
State<br />
Target<br />
75.76% 85.00%<br />
LEA<br />
Rate<br />
82.05%<br />
Target Met<br />
by LEA<br />
(Y/N)<br />
N<br />
Percent of<br />
youth with<br />
IEPs dropping<br />
out of high<br />
school<br />
State<br />
Rate<br />
Indicator 03: Assessment on Statewide Benchmark Exam (grades 3-8, 11)<br />
A) Adequate Yearly Progress<br />
n=40<br />
Literacy<br />
Mathematics<br />
Met Disability Subgroup "n"<br />
for Reporting Purposes (Y/N)<br />
State Target for % of Districts Meeting<br />
AYP for Disability Subgroup<br />
State<br />
Target<br />
3.06% 4.20%<br />
LEA<br />
Rate<br />
3.89%<br />
% of Districts Meeting AYP<br />
for Disability Subgroup<br />
Target Met by<br />
LEA (Y/N)<br />
Y<br />
Target Met by<br />
LEA(Y/N)<br />
Overall Y 17.15% 6.25%<br />
N<br />
Y<br />
Y<br />
Note: For a district to qualify as having a disability subgroup it must have a minimum of 40 (n=40) students with disabilities in a school building.<br />
B) Participation<br />
Participation Rate: # of<br />
CWD Tested ÷ # of CWD<br />
Enrolled in grades tested.<br />
Participation Rate: Literacy<br />
Participation Rate: Math<br />
Note: - - denotes not applicable<br />
State<br />
Rate<br />
98.78%<br />
State<br />
Target<br />
95.00%<br />
LEA<br />
Rate<br />
99.00%<br />
Target Met<br />
by LEA (Y/N)<br />
98.61% 95.00% 99.51% Y<br />
Y<br />
C) Performance Proficiency<br />
Percent of CWD Scoring<br />
Proficient or Above<br />
Proficiency Rate: Literacy<br />
Proficiency Rate:<br />
Mathematics<br />
16.00%<br />
16.00%<br />
State<br />
Rate<br />
31.49%<br />
44.86%<br />
State<br />
Target<br />
45.22%<br />
51.14%<br />
LEA<br />
Rate<br />
31.07%<br />
37.29%<br />
Y<br />
N<br />
Target<br />
Met by<br />
LEA (Y/N)<br />
N<br />
N<br />
Page 1 of 5
LEA: 1608 - JONESBORO SCHOOL <strong>DISTRICT</strong><br />
Indicator 04: Out-of-School Suspensions and Expulsions (2009/10 school year)<br />
A) Suspension/Expulsion<br />
Percent difference of CWD with out-of- school suspensions and<br />
expulsions totaling greater than 10 days in a school year as<br />
compared to the same data for general education students in<br />
the district.<br />
B) Suspension/Expulsion by Race and Ethnicity<br />
Percent of districts that have: (a) a significant discrepancy, by race or<br />
ethnicity, in the rate of suspensions and expulsions of greater than 10<br />
days in a school year for children with IEPs; and (b) policies,<br />
procedures or practices that contribute to the significant discrepancy<br />
and do not comply with requirements relating to the development<br />
and implementation of IEPs, the use of positive behavioral<br />
interventions and supports, and procedural safeguards.<br />
Indicator 05: School Age (5-21) Least Restrictive Environment<br />
A) In the Regular Class 80% or more of the day<br />
Percent of CWD with<br />
IEPs receiving instruction<br />
in the regular class 80%<br />
or more of the day.<br />
State<br />
Rate<br />
State<br />
Target<br />
LEA<br />
Rate<br />
B) In the Regular Class less than 40% of the day<br />
Percent of CWD with<br />
IEPs receiving instruction<br />
in the regular class less<br />
than 60% of the day.<br />
53.87% 59.77%<br />
State<br />
Rate<br />
State<br />
Target<br />
12.42% 12.51%<br />
40.33%<br />
LEA<br />
Rate<br />
11.76%<br />
C) Other Settings outside the regular class<br />
Percent of CWD with IEPs served in<br />
public or private separate schools,<br />
residential placements, or<br />
homebound/hospital placements.<br />
State<br />
Rate<br />
State<br />
Target<br />
2.80% 2.56%<br />
Target Met<br />
by LEA (Y/N)<br />
N<br />
Target Met<br />
by LEA (Y/N)<br />
Y<br />
LEA<br />
Rate<br />
0.60%<br />
Target Met<br />
by LEA(Y/N)<br />
Indicator 06: Early Childhood (3-5) Least Restrictive Environment<br />
A) Regular Early Childhood Program<br />
Percent of children (aged 3 through 5) with IEPs attending a regular<br />
early childhood program and receiving the majority of special<br />
education and related services in the regular early childhood program<br />
Allowable<br />
Difference<br />
LEA: 1608 - JONESBORO SCHOOL <strong>DISTRICT</strong><br />
Indicator 07: Preschool (3-5) Outcomes<br />
a) Percent of preschool CWD<br />
children who did not<br />
improve functioning.<br />
b) Percent of preschool CWD<br />
who improved but whose<br />
functioning remained below<br />
same age peers.<br />
c) Percent of preschool CWD<br />
who improved at a level<br />
nearer to same aged peers.<br />
d) Percent of preschool CWD<br />
who improved functioning to<br />
reach a level comparable to<br />
same age peers.<br />
e) Percent of preschool CWD<br />
children who maintain<br />
functioning at a level<br />
comparable to same aged<br />
peers.<br />
Summary<br />
Statements<br />
1) Of those preschool<br />
children who entered<br />
the preschool program<br />
below age expectations<br />
in each Outcome, the<br />
percent who<br />
substantially increased<br />
their rate of growth by<br />
the time they turned 6<br />
years of age or exited<br />
the program.<br />
2) The percent of<br />
preschool children who<br />
were functioning<br />
within age expectations<br />
in each Outcome by the<br />
time they turned 6<br />
years of age or exited<br />
A) Positive Social -Emotional<br />
Skills*<br />
State<br />
Rate<br />
A) Positive Social -<br />
Emotional Skills<br />
(Including social<br />
relationships)<br />
State<br />
Rate<br />
2.14%<br />
5.31%<br />
25.97%<br />
38.22%<br />
28.36%<br />
State<br />
Target<br />
LEA<br />
Rate<br />
LEA<br />
Rate<br />
— —<br />
— —<br />
— —<br />
— —<br />
— —<br />
Target<br />
Met by<br />
LEA(Y/N)<br />
B) Acquisition and Use of<br />
Knowledge and Skills<br />
(Including early language/<br />
communication and early literacy)<br />
B) Acquisition and Use of<br />
Knowledge and Skills **<br />
State<br />
Rate<br />
1.75%<br />
6.59%<br />
34.23%<br />
43.51%<br />
13.92%<br />
State<br />
Target<br />
LEA<br />
Rate<br />
Target<br />
Met by<br />
LEA(Y/N)<br />
C) Use of Appropriate Behaviors<br />
to Meet Their Needs<br />
State<br />
Rate<br />
State<br />
Target<br />
LEA<br />
Rate<br />
Target<br />
Met by<br />
LEA(Y/N)<br />
89.61% 90.50% — — N/A 90.31% 90.50% — — N/A 90.82% 92.50% — — N/A<br />
66.58% 69.50% — — N/A 57.43% 60.50% — — N/A 76.69% 78.50% — — N/A<br />
NOTE: * Including social relationships ** Including early language/ communication and early literacy<br />
Note: - - denotes not applicable<br />
State<br />
Rate<br />
LEA<br />
Rate<br />
— —<br />
— —<br />
— —<br />
— —<br />
— —<br />
C) Use of<br />
Appropriate<br />
Behaviors to<br />
Meet Their Needs<br />
State<br />
Rate<br />
4.51%<br />
17.34%<br />
41.72%<br />
34.97%<br />
LEA<br />
Rate<br />
1.46% — —<br />
— —<br />
— —<br />
— —<br />
— —<br />
Page 3 of 5
LEA: 1608 - JONESBORO SCHOOL <strong>DISTRICT</strong><br />
Indicator 08: Parent Involvement<br />
Percent of surveyed<br />
parents who reported<br />
school facilitated parent<br />
involvement as a means<br />
of improving services<br />
and results for children<br />
with disabilities.<br />
Early Childhood<br />
(3-5)<br />
School Age<br />
(5-21)<br />
State<br />
Rate<br />
90.47%<br />
95.05%<br />
Indicator 09: Disproportionality - Eligibility<br />
Disproportionate representation of racial<br />
and ethnic groups in special education and<br />
related services that is a result of<br />
inappropriate identification (e.g.<br />
monitoring data, review of policies,<br />
practices, and procedures under 618(d),<br />
etc.).<br />
State<br />
Rate<br />
State<br />
Target<br />
88.00%<br />
96.00%<br />
State<br />
Target<br />
0.00% 0.00%<br />
LEA<br />
Rate<br />
— —<br />
89.77%<br />
Indicator 10: Disproportionality-Child with a Disability<br />
Disproportionate representation of racial<br />
and ethnic groups in specific disability<br />
categories that is a result of inappropriate<br />
identification (e.g. monitoring data, review<br />
of policies, practices, and procedures under<br />
618(d), etc.).<br />
Indicator 11: Child Find<br />
Percent of children with<br />
parental consent to evaluate<br />
who are evaluated within<br />
the State established timeline<br />
of 60 days.<br />
Overall<br />
(3-21)<br />
Early Childhood<br />
(3-5)<br />
School Age<br />
(5-21)<br />
State<br />
Rate<br />
0.00%<br />
Indicator 12: Early Childhood Transition<br />
Percent of children referred by Part C prior to<br />
age 3, who are found eligible for Part B, and<br />
who have an IEP developed and implemented<br />
by their third birthday.<br />
Note: - - denotes not applicable<br />
State<br />
Rate<br />
99.41%<br />
99.70%<br />
98.97%<br />
State<br />
Rate<br />
State<br />
Target<br />
0.00%<br />
State<br />
Target<br />
100.00%<br />
100.00%<br />
100.00%<br />
State<br />
Target<br />
Target Met by<br />
LEA (Y/N)<br />
Y<br />
Target Met by<br />
LEA (Y/N)<br />
Y<br />
LEA<br />
Rate<br />
100.00%<br />
— —<br />
100.00%<br />
LEA<br />
Rate<br />
Target Met by<br />
LEA (Y/N)<br />
N/A<br />
N<br />
Note: The target for Indicator 09 is to have zero percent<br />
(0%) of districts identified as having disproportionate<br />
representation as a result of inappropriate<br />
identification in eligibility.<br />
Note: The target for Indicator 10 is to have zero<br />
percent (0%) of districts identified as having<br />
disproportionate representation as a result of<br />
inappropriate identification in a disability<br />
category.<br />
Target Met by<br />
LEA (Y/N)<br />
N/A<br />
Y<br />
Target Met<br />
by LEA<br />
(Y/N)<br />
99.21% 100.00% - - N/A<br />
Y<br />
Note: * Indicates a zero reponse rate for the<br />
district.<br />
Page 4 of 5
LEA: 1608 - JONESBORO SCHOOL <strong>DISTRICT</strong><br />
Indicator 13: Secondary Transition<br />
Percent of youth with disabilities aged 16 and<br />
up with an IEP that includes coordinated,<br />
measurable, annual IEP goals and transition<br />
services that will reasonably enable the student<br />
to meet the post-secondary goals.<br />
Indicator 14: Post-School Outcomes<br />
A. Percent of youth enrolled in higher<br />
education within one year of leaving high<br />
school.<br />
State<br />
Rate<br />
State<br />
Target<br />
Note: Data for this Indicator is from the on-site monitoring of LEAs for the given year.<br />
B. Percent of youth enrolled in higher<br />
education or competitively employed<br />
within one year of leaving high school.<br />
C. Percent of youth enrolled in higher<br />
education or in some other postsecondary<br />
education or training program; or<br />
competitively employed or in some other<br />
employment within one year of leaving<br />
high school.<br />
State<br />
Rate<br />
Indicator 20: Reported Data-Timely and Accurate*<br />
District submitted<br />
required data elements<br />
on or before due dates;<br />
made revisions within<br />
the alloted reveiw<br />
periods.<br />
Accurate and Timely<br />
Data Submission<br />
Overall (3-21)<br />
Early Childhood (3-5)<br />
School Age (5-21)<br />
State<br />
Target<br />
100.00%<br />
100.00%<br />
100.00%<br />
State<br />
Target<br />
LEA<br />
Rate<br />
LEA<br />
Rate<br />
Target Met by<br />
LEA (Y/N)<br />
Target Met<br />
by LEA<br />
(Y/N)<br />
Target Met<br />
by LEA<br />
(Y/N)<br />
*Data reviewed for timely and accurate submissions included all APSCN cycle data except for personnel<br />
Note: - - denotes not applicable<br />
96.19 100.00 — — N/A<br />
14.53<br />
State<br />
Rate<br />
49.42<br />
State<br />
Rate<br />
54.07<br />
13.00<br />
State<br />
Target<br />
49.00<br />
State<br />
Target<br />
60.00<br />
Y<br />
N/A<br />
Y<br />
0.00%<br />
LEA<br />
Rate<br />
27.27%<br />
LEA<br />
Rate<br />
27.27%<br />
N<br />
Target Met<br />
by LEA<br />
(Y/N)<br />
N<br />
Target Met<br />
by LEA<br />
(Y/N)<br />
N<br />
Page 5 of 5
LEA: 1611 - NETTLETON SCHOOL <strong>DISTRICT</strong><br />
<strong>ARKANSAS</strong> <strong>SPECIAL</strong> <strong>EDUCATION</strong><br />
<strong>DISTRICT</strong> <strong>ANNUAL</strong> PERFORMANCE REPORT<br />
2010/11 School Year<br />
Publication Date: March 2012<br />
Each State must have in place a State Performance Plan (SPP) to evaluate the State's efforts to meet the requirements and<br />
purposes of the implementation of the Individuals with Disabilities Education Act (IDEA). The SPP is a six-year plan, which<br />
describes Arkansas's performance on 20 indicators. The Office of Special Education Programs in the U. S. Department of<br />
Education requires that States report annually to the public on the performance of each local education agency (LEA) on 14 of<br />
20 indicators as compared with targets established by the State in the SPP. Arkansas will report indicators 1 through 14 and<br />
20 for each LEA serving children with disabilities (CWD). Any LEA not meeting targets on compliance indicators (0% for<br />
Indicators 4B, 09 & 10 and 100% for Indicators 11, 12, 13, and 20) are non-compliant with IDEA.<br />
There are no report changes for the 2010/11 school year profile; However, it is important to recognize that: .<br />
1. Indicator 01 (Graduation) is reported a year in arrear (2009/10 graduates) and is based on a four-year cohort. This<br />
means the rate is a measure of students who entered in ninth grade and graduate in four years. The calculation is a<br />
requirement under Title I of the Elementary and Secondary Education Act (ESEA).<br />
2. Indicator 02 (Drop out) is reported a year in arrear. This means the rate is a measure of students who dropped out in<br />
the 2009/10 school year. The Indicator 02 data are aligned with the Common Core of Data (CCD) requirements for<br />
grades 7-12.<br />
3. Indicator 04A and 4B (Suspension/Expulsion) is reported a year in arrear. This means the rate is a measure of<br />
students who had out-of-school suspensions and/or expulsions totaling more than 10 days.<br />
Percent of youth<br />
with IEPs<br />
graduating from<br />
high school with a<br />
regular diploma<br />
For a complete description of all the Indicators, please visit the special education website at<br />
http://arksped.k12.ar.us/sections/policy.html<br />
Indicator 01: Graduation Rates (2009/10 school year) Indicator 02: Dropout Rates (2009/10 school year)<br />
State<br />
Rate<br />
State<br />
Target<br />
75.76% 85.00%<br />
LEA<br />
Rate<br />
82.61%<br />
Target Met<br />
by LEA<br />
(Y/N)<br />
N<br />
Percent of<br />
youth with<br />
IEPs dropping<br />
out of high<br />
school<br />
State<br />
Rate<br />
Indicator 03: Assessment on Statewide Benchmark Exam (grades 3-8, 11)<br />
A) Adequate Yearly Progress<br />
n=40<br />
Literacy<br />
Mathematics<br />
Met Disability Subgroup "n"<br />
for Reporting Purposes (Y/N)<br />
State Target for % of Districts Meeting<br />
AYP for Disability Subgroup<br />
State<br />
Target<br />
3.06% 4.20%<br />
LEA<br />
Rate<br />
2.20%<br />
% of Districts Meeting AYP<br />
for Disability Subgroup<br />
Target Met by<br />
LEA (Y/N)<br />
Y<br />
Target Met by<br />
LEA(Y/N)<br />
Overall N 17.15% 6.25%<br />
NA<br />
N<br />
N<br />
Note: For a district to qualify as having a disability subgroup it must have a minimum of 40 (n=40) students with disabilities in a school building.<br />
B) Participation<br />
Participation Rate: # of<br />
CWD Tested ÷ # of CWD<br />
Enrolled in grades tested.<br />
Participation Rate: Literacy<br />
Participation Rate: Math<br />
Note: - - denotes not applicable<br />
State<br />
Rate<br />
98.78%<br />
State<br />
Target<br />
95.00%<br />
LEA<br />
Rate<br />
100.00%<br />
Target Met<br />
by LEA (Y/N)<br />
98.61% 95.00% 100.00% Y<br />
Y<br />
C) Performance Proficiency<br />
Percent of CWD Scoring<br />
Proficient or Above<br />
Proficiency Rate: Literacy<br />
Proficiency Rate:<br />
Mathematics<br />
16.00%<br />
16.00%<br />
State<br />
Rate<br />
31.49%<br />
44.86%<br />
State<br />
Target<br />
45.22%<br />
51.14%<br />
LEA<br />
Rate<br />
30.53%<br />
49.49%<br />
NA<br />
NA<br />
Target<br />
Met by<br />
LEA (Y/N)<br />
N<br />
N<br />
Page 1 of 5
LEA: 1611 - NETTLETON SCHOOL <strong>DISTRICT</strong><br />
Indicator 04: Out-of-School Suspensions and Expulsions (2009/10 school year)<br />
A) Suspension/Expulsion<br />
Percent difference of CWD with out-of- school suspensions and<br />
expulsions totaling greater than 10 days in a school year as<br />
compared to the same data for general education students in<br />
the district.<br />
B) Suspension/Expulsion by Race and Ethnicity<br />
Percent of districts that have: (a) a significant discrepancy, by race or<br />
ethnicity, in the rate of suspensions and expulsions of greater than 10<br />
days in a school year for children with IEPs; and (b) policies,<br />
procedures or practices that contribute to the significant discrepancy<br />
and do not comply with requirements relating to the development<br />
and implementation of IEPs, the use of positive behavioral<br />
interventions and supports, and procedural safeguards.<br />
Indicator 05: School Age (5-21) Least Restrictive Environment<br />
A) In the Regular Class 80% or more of the day<br />
Percent of CWD with<br />
IEPs receiving instruction<br />
in the regular class 80%<br />
or more of the day.<br />
State<br />
Rate<br />
State<br />
Target<br />
LEA<br />
Rate<br />
B) In the Regular Class less than 40% of the day<br />
Percent of CWD with<br />
IEPs receiving instruction<br />
in the regular class less<br />
than 60% of the day.<br />
53.87% 59.77%<br />
State<br />
Rate<br />
State<br />
Target<br />
12.42% 12.51%<br />
36.36%<br />
LEA<br />
Rate<br />
18.44%<br />
C) Other Settings outside the regular class<br />
Percent of CWD with IEPs served in<br />
public or private separate schools,<br />
residential placements, or<br />
homebound/hospital placements.<br />
State<br />
Rate<br />
State<br />
Target<br />
2.80% 2.56%<br />
Target Met<br />
by LEA (Y/N)<br />
N<br />
Target Met<br />
by LEA (Y/N)<br />
N<br />
LEA<br />
Rate<br />
0.26%<br />
Target Met<br />
by LEA(Y/N)<br />
Indicator 06: Early Childhood (3-5) Least Restrictive Environment<br />
A) Regular Early Childhood Program<br />
Percent of children (aged 3 through 5) with IEPs attending a regular<br />
early childhood program and receiving the majority of special<br />
education and related services in the regular early childhood program<br />
Allowable<br />
Difference<br />
LEA: 1611 - NETTLETON SCHOOL <strong>DISTRICT</strong><br />
Indicator 07: Preschool (3-5) Outcomes<br />
a) Percent of preschool CWD<br />
children who did not<br />
improve functioning.<br />
b) Percent of preschool CWD<br />
who improved but whose<br />
functioning remained below<br />
same age peers.<br />
c) Percent of preschool CWD<br />
who improved at a level<br />
nearer to same aged peers.<br />
d) Percent of preschool CWD<br />
who improved functioning to<br />
reach a level comparable to<br />
same age peers.<br />
e) Percent of preschool CWD<br />
children who maintain<br />
functioning at a level<br />
comparable to same aged<br />
peers.<br />
Summary<br />
Statements<br />
1) Of those preschool<br />
children who entered<br />
the preschool program<br />
below age expectations<br />
in each Outcome, the<br />
percent who<br />
substantially increased<br />
their rate of growth by<br />
the time they turned 6<br />
years of age or exited<br />
the program.<br />
2) The percent of<br />
preschool children who<br />
were functioning<br />
within age expectations<br />
in each Outcome by the<br />
time they turned 6<br />
years of age or exited<br />
A) Positive Social -Emotional<br />
Skills*<br />
State<br />
Rate<br />
A) Positive Social -<br />
Emotional Skills<br />
(Including social<br />
relationships)<br />
State<br />
Rate<br />
2.14%<br />
5.31%<br />
25.97%<br />
38.22%<br />
28.36%<br />
State<br />
Target<br />
LEA<br />
Rate<br />
LEA<br />
Rate<br />
— —<br />
— —<br />
— —<br />
— —<br />
— —<br />
Target<br />
Met by<br />
LEA(Y/N)<br />
B) Acquisition and Use of<br />
Knowledge and Skills<br />
(Including early language/<br />
communication and early literacy)<br />
B) Acquisition and Use of<br />
Knowledge and Skills **<br />
State<br />
Rate<br />
1.75%<br />
6.59%<br />
34.23%<br />
43.51%<br />
13.92%<br />
State<br />
Target<br />
LEA<br />
Rate<br />
Target<br />
Met by<br />
LEA(Y/N)<br />
C) Use of Appropriate Behaviors<br />
to Meet Their Needs<br />
State<br />
Rate<br />
State<br />
Target<br />
LEA<br />
Rate<br />
Target<br />
Met by<br />
LEA(Y/N)<br />
89.61% 90.50% — — N/A 90.31% 90.50% — — N/A 90.82% 92.50% — — N/A<br />
66.58% 69.50% — — N/A 57.43% 60.50% — — N/A 76.69% 78.50% — — N/A<br />
NOTE: * Including social relationships ** Including early language/ communication and early literacy<br />
Note: - - denotes not applicable<br />
State<br />
Rate<br />
LEA<br />
Rate<br />
— —<br />
— —<br />
— —<br />
— —<br />
— —<br />
C) Use of<br />
Appropriate<br />
Behaviors to<br />
Meet Their Needs<br />
State<br />
Rate<br />
4.51%<br />
17.34%<br />
41.72%<br />
34.97%<br />
LEA<br />
Rate<br />
1.46% — —<br />
— —<br />
— —<br />
— —<br />
— —<br />
Page 3 of 5
LEA: 1611 - NETTLETON SCHOOL <strong>DISTRICT</strong><br />
Indicator 08: Parent Involvement<br />
Percent of surveyed<br />
parents who reported<br />
school facilitated parent<br />
involvement as a means<br />
of improving services<br />
and results for children<br />
with disabilities.<br />
Early Childhood<br />
(3-5)<br />
School Age<br />
(5-21)<br />
State<br />
Rate<br />
90.47%<br />
95.05%<br />
Indicator 09: Disproportionality - Eligibility<br />
Disproportionate representation of racial<br />
and ethnic groups in special education and<br />
related services that is a result of<br />
inappropriate identification (e.g.<br />
monitoring data, review of policies,<br />
practices, and procedures under 618(d),<br />
etc.).<br />
State<br />
Rate<br />
State<br />
Target<br />
88.00%<br />
96.00%<br />
State<br />
Target<br />
0.00% 0.00%<br />
LEA<br />
Rate<br />
— —<br />
95.71%<br />
Indicator 10: Disproportionality-Child with a Disability<br />
Disproportionate representation of racial<br />
and ethnic groups in specific disability<br />
categories that is a result of inappropriate<br />
identification (e.g. monitoring data, review<br />
of policies, practices, and procedures under<br />
618(d), etc.).<br />
Indicator 11: Child Find<br />
Percent of children with<br />
parental consent to evaluate<br />
who are evaluated within<br />
the State established timeline<br />
of 60 days.<br />
Overall<br />
(3-21)<br />
Early Childhood<br />
(3-5)<br />
School Age<br />
(5-21)<br />
State<br />
Rate<br />
0.00%<br />
Indicator 12: Early Childhood Transition<br />
Percent of children referred by Part C prior to<br />
age 3, who are found eligible for Part B, and<br />
who have an IEP developed and implemented<br />
by their third birthday.<br />
Note: - - denotes not applicable<br />
State<br />
Rate<br />
99.41%<br />
99.70%<br />
98.97%<br />
State<br />
Rate<br />
State<br />
Target<br />
0.00%<br />
State<br />
Target<br />
100.00%<br />
100.00%<br />
100.00%<br />
State<br />
Target<br />
Target Met by<br />
LEA (Y/N)<br />
Y<br />
Target Met by<br />
LEA (Y/N)<br />
Y<br />
LEA<br />
Rate<br />
100.00%<br />
— —<br />
100.00%<br />
LEA<br />
Rate<br />
Target Met by<br />
LEA (Y/N)<br />
N/A<br />
N<br />
Note: The target for Indicator 09 is to have zero percent<br />
(0%) of districts identified as having disproportionate<br />
representation as a result of inappropriate<br />
identification in eligibility.<br />
Note: The target for Indicator 10 is to have zero<br />
percent (0%) of districts identified as having<br />
disproportionate representation as a result of<br />
inappropriate identification in a disability<br />
category.<br />
Target Met by<br />
LEA (Y/N)<br />
N/A<br />
Y<br />
Target Met<br />
by LEA<br />
(Y/N)<br />
99.21% 100.00% - - N/A<br />
Y<br />
Note: * Indicates a zero reponse rate for the<br />
district.<br />
Page 4 of 5
LEA: 1611 - NETTLETON SCHOOL <strong>DISTRICT</strong><br />
Indicator 13: Secondary Transition<br />
Percent of youth with disabilities aged 16 and<br />
up with an IEP that includes coordinated,<br />
measurable, annual IEP goals and transition<br />
services that will reasonably enable the student<br />
to meet the post-secondary goals.<br />
Indicator 14: Post-School Outcomes<br />
A. Percent of youth enrolled in higher<br />
education within one year of leaving high<br />
school.<br />
State<br />
Rate<br />
State<br />
Target<br />
Note: Data for this Indicator is from the on-site monitoring of LEAs for the given year.<br />
B. Percent of youth enrolled in higher<br />
education or competitively employed<br />
within one year of leaving high school.<br />
C. Percent of youth enrolled in higher<br />
education or in some other postsecondary<br />
education or training program; or<br />
competitively employed or in some other<br />
employment within one year of leaving<br />
high school.<br />
State<br />
Rate<br />
Indicator 20: Reported Data-Timely and Accurate*<br />
District submitted<br />
required data elements<br />
on or before due dates;<br />
made revisions within<br />
the alloted reveiw<br />
periods.<br />
Accurate and Timely<br />
Data Submission<br />
Overall (3-21)<br />
Early Childhood (3-5)<br />
School Age (5-21)<br />
State<br />
Target<br />
100.00%<br />
100.00%<br />
100.00%<br />
State<br />
Target<br />
LEA<br />
Rate<br />
LEA<br />
Rate<br />
Target Met by<br />
LEA (Y/N)<br />
Target Met<br />
by LEA<br />
(Y/N)<br />
Target Met<br />
by LEA<br />
(Y/N)<br />
*Data reviewed for timely and accurate submissions included all APSCN cycle data except for personnel<br />
Note: - - denotes not applicable<br />
96.19 100.00 — — N/A<br />
14.53<br />
State<br />
Rate<br />
49.42<br />
State<br />
Rate<br />
54.07<br />
13.00<br />
State<br />
Target<br />
49.00<br />
State<br />
Target<br />
60.00<br />
Y<br />
N/A<br />
Y<br />
— —<br />
LEA<br />
Rate<br />
— —<br />
LEA<br />
Rate<br />
— —<br />
N/A<br />
Target Met<br />
by LEA<br />
(Y/N)<br />
N/A<br />
Target Met<br />
by LEA<br />
(Y/N)<br />
N/A<br />
Page 5 of 5
<strong>ARKANSAS</strong> <strong>SPECIAL</strong> <strong>EDUCATION</strong><br />
<strong>DISTRICT</strong> <strong>ANNUAL</strong> PERFORMANCE REPORT<br />
2010/11 School Year<br />
Publication Date: March 2012<br />
Each State must have in place a State Performance Plan (SPP) to evaluate the State's efforts to meet the requirements and<br />
purposes of the implementation of the Individuals with Disabilities Education Act (IDEA). The SPP is a six-year plan, which<br />
describes Arkansas's performance on 20 indicators. The Office of Special Education Programs in the U. S. Department of<br />
Education requires that States report annually to the public on the performance of each local education agency (LEA) on 14 of<br />
20 indicators as compared with targets established by the State in the SPP. Arkansas will report indicators 1 through 14 and<br />
20 for each LEA serving children with disabilities (CWD). Any LEA not meeting targets on compliance indicators (0% for<br />
Indicators 4B, 09 & 10 and 100% for Indicators 11, 12, 13, and 20) are non-compliant with IDEA.<br />
There are no report changes for the 2010/11 school year profile; However, it is important to recognize that: .<br />
1. Indicator 01 (Graduation) is reported a year in arrear (2009/10 graduates) and is based on a four-year cohort. This<br />
means the rate is a measure of students who entered in ninth grade and graduate in four years. The calculation is a<br />
requirement under Title I of the Elementary and Secondary Education Act (ESEA).<br />
2. Indicator 02 (Drop out) is reported a year in arrear. This means the rate is a measure of students who dropped out in<br />
the 2009/10 school year. The Indicator 02 data are aligned with the Common Core of Data (CCD) requirements for<br />
grades 7-12.<br />
3. Indicator 04A and 4B (Suspension/Expulsion) is reported a year in arrear. This means the rate is a measure of<br />
students who had out-of-school suspensions and/or expulsions totaling more than 10 days.<br />
For a complete description of all the Indicators, please visit the special education website at<br />
http://arksped.k12.ar.us/sections/policy.html<br />
LEA: 1612 - VALLEY VIEW SCHOOL <strong>DISTRICT</strong><br />
Indicator 01: Graduation Rates (2009/10 school year) Indicator 02: Dropout Rates (2009/10 school year)<br />
Percent of youth<br />
with IEPs<br />
graduating from<br />
high school with a<br />
regular diploma<br />
State<br />
Rate<br />
State<br />
Target<br />
75.76% 85.00%<br />
LEA<br />
Rate<br />
80.00%<br />
Target Met<br />
by LEA<br />
(Y/N)<br />
N<br />
Percent of<br />
youth with<br />
IEPs dropping<br />
out of high<br />
school<br />
State<br />
Rate<br />
Indicator 03: Assessment on Statewide Benchmark Exam (grades 3-8, 11)<br />
A) Adequate Yearly Progress<br />
n=40<br />
Literacy<br />
Mathematics<br />
Met Disability Subgroup "n"<br />
for Reporting Purposes (Y/N)<br />
State Target for % of Districts Meeting<br />
AYP for Disability Subgroup<br />
State<br />
Target<br />
3.06% 4.20%<br />
LEA<br />
Rate<br />
0.00%<br />
% of Districts Meeting AYP<br />
for Disability Subgroup<br />
Target Met by<br />
LEA (Y/N)<br />
Y<br />
Target Met by<br />
LEA(Y/N)<br />
Overall N 17.15% 6.25%<br />
NA<br />
N<br />
N<br />
Note: For a district to qualify as having a disability subgroup it must have a minimum of 40 (n=40) students with disabilities in a school building.<br />
B) Participation<br />
Participation Rate: # of<br />
CWD Tested ÷ # of CWD<br />
Enrolled in grades tested.<br />
Participation Rate: Literacy<br />
Participation Rate: Math<br />
Note: - - denotes not applicable<br />
State<br />
Rate<br />
98.78%<br />
State<br />
Target<br />
95.00%<br />
LEA<br />
Rate<br />
99.07%<br />
Target Met<br />
by LEA (Y/N)<br />
98.61% 95.00% 99.08% Y<br />
Y<br />
C) Performance Proficiency<br />
Percent of CWD Scoring<br />
Proficient or Above<br />
Proficiency Rate: Literacy<br />
Proficiency Rate:<br />
Mathematics<br />
16.00%<br />
16.00%<br />
State<br />
Rate<br />
31.49%<br />
44.86%<br />
State<br />
Target<br />
45.22%<br />
51.14%<br />
LEA<br />
Rate<br />
43.27%<br />
48.57%<br />
NA<br />
NA<br />
Target<br />
Met by<br />
LEA (Y/N)<br />
N<br />
N<br />
Page 1 of 5
LEA: 1612 - VALLEY VIEW SCHOOL <strong>DISTRICT</strong><br />
Indicator 04: Out-of-School Suspensions and Expulsions (2009/10 school year)<br />
A) Suspension/Expulsion<br />
Percent difference of CWD with out-of- school suspensions and<br />
expulsions totaling greater than 10 days in a school year as<br />
compared to the same data for general education students in<br />
the district.<br />
B) Suspension/Expulsion by Race and Ethnicity<br />
Percent of districts that have: (a) a significant discrepancy, by race or<br />
ethnicity, in the rate of suspensions and expulsions of greater than 10<br />
days in a school year for children with IEPs; and (b) policies,<br />
procedures or practices that contribute to the significant discrepancy<br />
and do not comply with requirements relating to the development<br />
and implementation of IEPs, the use of positive behavioral<br />
interventions and supports, and procedural safeguards.<br />
Indicator 05: School Age (5-21) Least Restrictive Environment<br />
A) In the Regular Class 80% or more of the day<br />
Percent of CWD with<br />
IEPs receiving instruction<br />
in the regular class 80%<br />
or more of the day.<br />
State<br />
Rate<br />
State<br />
Target<br />
LEA<br />
Rate<br />
B) In the Regular Class less than 40% of the day<br />
Percent of CWD with<br />
IEPs receiving instruction<br />
in the regular class less<br />
than 60% of the day.<br />
53.87% 59.77%<br />
State<br />
Rate<br />
State<br />
Target<br />
12.42% 12.51%<br />
61.46%<br />
LEA<br />
Rate<br />
12.20%<br />
C) Other Settings outside the regular class<br />
Percent of CWD with IEPs served in<br />
public or private separate schools,<br />
residential placements, or<br />
homebound/hospital placements.<br />
State<br />
Rate<br />
State<br />
Target<br />
2.80% 2.56%<br />
Target Met<br />
by LEA (Y/N)<br />
Y<br />
Target Met<br />
by LEA (Y/N)<br />
Y<br />
LEA<br />
Rate<br />
0.00%<br />
Target Met<br />
by LEA(Y/N)<br />
Indicator 06: Early Childhood (3-5) Least Restrictive Environment<br />
A) Regular Early Childhood Program<br />
Percent of children (aged 3 through 5) with IEPs attending a regular<br />
early childhood program and receiving the majority of special<br />
education and related services in the regular early childhood program<br />
Allowable<br />
Difference<br />
LEA: 1612 - VALLEY VIEW SCHOOL <strong>DISTRICT</strong><br />
Indicator 07: Preschool (3-5) Outcomes<br />
a) Percent of preschool CWD<br />
children who did not<br />
improve functioning.<br />
b) Percent of preschool CWD<br />
who improved but whose<br />
functioning remained below<br />
same age peers.<br />
c) Percent of preschool CWD<br />
who improved at a level<br />
nearer to same aged peers.<br />
d) Percent of preschool CWD<br />
who improved functioning to<br />
reach a level comparable to<br />
same age peers.<br />
e) Percent of preschool CWD<br />
children who maintain<br />
functioning at a level<br />
comparable to same aged<br />
peers.<br />
Summary<br />
Statements<br />
1) Of those preschool<br />
children who entered<br />
the preschool program<br />
below age expectations<br />
in each Outcome, the<br />
percent who<br />
substantially increased<br />
their rate of growth by<br />
the time they turned 6<br />
years of age or exited<br />
the program.<br />
2) The percent of<br />
preschool children who<br />
were functioning<br />
within age expectations<br />
in each Outcome by the<br />
time they turned 6<br />
years of age or exited<br />
A) Positive Social -Emotional<br />
Skills*<br />
State<br />
Rate<br />
A) Positive Social -<br />
Emotional Skills<br />
(Including social<br />
relationships)<br />
State<br />
Rate<br />
2.14%<br />
5.31%<br />
25.97%<br />
38.22%<br />
28.36%<br />
State<br />
Target<br />
LEA<br />
Rate<br />
LEA<br />
Rate<br />
— —<br />
— —<br />
— —<br />
— —<br />
— —<br />
Target<br />
Met by<br />
LEA(Y/N)<br />
B) Acquisition and Use of<br />
Knowledge and Skills<br />
(Including early language/<br />
communication and early literacy)<br />
B) Acquisition and Use of<br />
Knowledge and Skills **<br />
State<br />
Rate<br />
1.75%<br />
6.59%<br />
34.23%<br />
43.51%<br />
13.92%<br />
State<br />
Target<br />
LEA<br />
Rate<br />
Target<br />
Met by<br />
LEA(Y/N)<br />
C) Use of Appropriate Behaviors<br />
to Meet Their Needs<br />
State<br />
Rate<br />
State<br />
Target<br />
LEA<br />
Rate<br />
Target<br />
Met by<br />
LEA(Y/N)<br />
89.61% 90.50% — — N/A 90.31% 90.50% — — N/A 90.82% 92.50% — — N/A<br />
66.58% 69.50% — — N/A 57.43% 60.50% — — N/A 76.69% 78.50% — — N/A<br />
NOTE: * Including social relationships ** Including early language/ communication and early literacy<br />
Note: - - denotes not applicable<br />
State<br />
Rate<br />
LEA<br />
Rate<br />
— —<br />
— —<br />
— —<br />
— —<br />
— —<br />
C) Use of<br />
Appropriate<br />
Behaviors to<br />
Meet Their Needs<br />
State<br />
Rate<br />
4.51%<br />
17.34%<br />
41.72%<br />
34.97%<br />
LEA<br />
Rate<br />
1.46% — —<br />
— —<br />
— —<br />
— —<br />
— —<br />
Page 3 of 5
LEA: 1612 - VALLEY VIEW SCHOOL <strong>DISTRICT</strong><br />
Indicator 08: Parent Involvement<br />
Percent of surveyed<br />
parents who reported<br />
school facilitated parent<br />
involvement as a means<br />
of improving services<br />
and results for children<br />
with disabilities.<br />
Early Childhood<br />
(3-5)<br />
School Age<br />
(5-21)<br />
State<br />
Rate<br />
90.47%<br />
95.05%<br />
Indicator 09: Disproportionality - Eligibility<br />
Disproportionate representation of racial<br />
and ethnic groups in special education and<br />
related services that is a result of<br />
inappropriate identification (e.g.<br />
monitoring data, review of policies,<br />
practices, and procedures under 618(d),<br />
etc.).<br />
State<br />
Rate<br />
State<br />
Target<br />
88.00%<br />
96.00%<br />
State<br />
Target<br />
0.00% 0.00%<br />
LEA<br />
Rate<br />
— —<br />
99.12%<br />
Indicator 10: Disproportionality-Child with a Disability<br />
Disproportionate representation of racial<br />
and ethnic groups in specific disability<br />
categories that is a result of inappropriate<br />
identification (e.g. monitoring data, review<br />
of policies, practices, and procedures under<br />
618(d), etc.).<br />
Indicator 11: Child Find<br />
Percent of children with<br />
parental consent to evaluate<br />
who are evaluated within<br />
the State established timeline<br />
of 60 days.<br />
Overall<br />
(3-21)<br />
Early Childhood<br />
(3-5)<br />
School Age<br />
(5-21)<br />
State<br />
Rate<br />
0.00%<br />
Indicator 12: Early Childhood Transition<br />
Percent of children referred by Part C prior to<br />
age 3, who are found eligible for Part B, and<br />
who have an IEP developed and implemented<br />
by their third birthday.<br />
Note: - - denotes not applicable<br />
State<br />
Rate<br />
99.41%<br />
99.70%<br />
98.97%<br />
State<br />
Rate<br />
State<br />
Target<br />
0.00%<br />
State<br />
Target<br />
100.00%<br />
100.00%<br />
100.00%<br />
State<br />
Target<br />
Target Met by<br />
LEA (Y/N)<br />
Y<br />
Target Met by<br />
LEA (Y/N)<br />
Y<br />
LEA<br />
Rate<br />
100.00%<br />
— —<br />
100.00%<br />
LEA<br />
Rate<br />
Target Met by<br />
LEA (Y/N)<br />
N/A<br />
Y<br />
Note: The target for Indicator 09 is to have zero percent<br />
(0%) of districts identified as having disproportionate<br />
representation as a result of inappropriate<br />
identification in eligibility.<br />
Note: The target for Indicator 10 is to have zero<br />
percent (0%) of districts identified as having<br />
disproportionate representation as a result of<br />
inappropriate identification in a disability<br />
category.<br />
Target Met by<br />
LEA (Y/N)<br />
N/A<br />
Y<br />
Target Met<br />
by LEA<br />
(Y/N)<br />
99.21% 100.00% - - N/A<br />
Y<br />
Note: * Indicates a zero reponse rate for the<br />
district.<br />
Page 4 of 5
LEA: 1612 - VALLEY VIEW SCHOOL <strong>DISTRICT</strong><br />
Indicator 13: Secondary Transition<br />
Percent of youth with disabilities aged 16 and<br />
up with an IEP that includes coordinated,<br />
measurable, annual IEP goals and transition<br />
services that will reasonably enable the student<br />
to meet the post-secondary goals.<br />
Indicator 14: Post-School Outcomes<br />
A. Percent of youth enrolled in higher<br />
education within one year of leaving high<br />
school.<br />
State<br />
Rate<br />
State<br />
Target<br />
Note: Data for this Indicator is from the on-site monitoring of LEAs for the given year.<br />
B. Percent of youth enrolled in higher<br />
education or competitively employed<br />
within one year of leaving high school.<br />
C. Percent of youth enrolled in higher<br />
education or in some other postsecondary<br />
education or training program; or<br />
competitively employed or in some other<br />
employment within one year of leaving<br />
high school.<br />
State<br />
Rate<br />
Indicator 20: Reported Data-Timely and Accurate*<br />
District submitted<br />
required data elements<br />
on or before due dates;<br />
made revisions within<br />
the alloted reveiw<br />
periods.<br />
Accurate and Timely<br />
Data Submission<br />
Overall (3-21)<br />
Early Childhood (3-5)<br />
School Age (5-21)<br />
State<br />
Target<br />
100.00%<br />
100.00%<br />
100.00%<br />
State<br />
Target<br />
LEA<br />
Rate<br />
LEA<br />
Rate<br />
Target Met by<br />
LEA (Y/N)<br />
Target Met<br />
by LEA<br />
(Y/N)<br />
Target Met<br />
by LEA<br />
(Y/N)<br />
*Data reviewed for timely and accurate submissions included all APSCN cycle data except for personnel<br />
Note: - - denotes not applicable<br />
96.19 100.00 — — N/A<br />
14.53<br />
State<br />
Rate<br />
49.42<br />
State<br />
Rate<br />
54.07<br />
13.00<br />
State<br />
Target<br />
49.00<br />
State<br />
Target<br />
60.00<br />
Y<br />
N/A<br />
Y<br />
— —<br />
LEA<br />
Rate<br />
— —<br />
LEA<br />
Rate<br />
— —<br />
N/A<br />
Target Met<br />
by LEA<br />
(Y/N)<br />
N/A<br />
Target Met<br />
by LEA<br />
(Y/N)<br />
N/A<br />
Page 5 of 5
LEA: 1613 - RIVERSIDE SCHOOL <strong>DISTRICT</strong><br />
<strong>ARKANSAS</strong> <strong>SPECIAL</strong> <strong>EDUCATION</strong><br />
<strong>DISTRICT</strong> <strong>ANNUAL</strong> PERFORMANCE REPORT<br />
2010/11 School Year<br />
Publication Date: March 2012<br />
Each State must have in place a State Performance Plan (SPP) to evaluate the State's efforts to meet the requirements and<br />
purposes of the implementation of the Individuals with Disabilities Education Act (IDEA). The SPP is a six-year plan, which<br />
describes Arkansas's performance on 20 indicators. The Office of Special Education Programs in the U. S. Department of<br />
Education requires that States report annually to the public on the performance of each local education agency (LEA) on 14 of<br />
20 indicators as compared with targets established by the State in the SPP. Arkansas will report indicators 1 through 14 and<br />
20 for each LEA serving children with disabilities (CWD). Any LEA not meeting targets on compliance indicators (0% for<br />
Indicators 4B, 09 & 10 and 100% for Indicators 11, 12, 13, and 20) are non-compliant with IDEA.<br />
There are no report changes for the 2010/11 school year profile; However, it is important to recognize that: .<br />
1. Indicator 01 (Graduation) is reported a year in arrear (2009/10 graduates) and is based on a four-year cohort. This<br />
means the rate is a measure of students who entered in ninth grade and graduate in four years. The calculation is a<br />
requirement under Title I of the Elementary and Secondary Education Act (ESEA).<br />
2. Indicator 02 (Drop out) is reported a year in arrear. This means the rate is a measure of students who dropped out in<br />
the 2009/10 school year. The Indicator 02 data are aligned with the Common Core of Data (CCD) requirements for<br />
grades 7-12.<br />
3. Indicator 04A and 4B (Suspension/Expulsion) is reported a year in arrear. This means the rate is a measure of<br />
students who had out-of-school suspensions and/or expulsions totaling more than 10 days.<br />
Percent of youth<br />
with IEPs<br />
graduating from<br />
high school with a<br />
regular diploma<br />
For a complete description of all the Indicators, please visit the special education website at<br />
http://arksped.k12.ar.us/sections/policy.html<br />
Indicator 01: Graduation Rates (2009/10 school year) Indicator 02: Dropout Rates (2009/10 school year)<br />
State<br />
Rate<br />
State<br />
Target<br />
75.76% 85.00%<br />
LEA<br />
Rate<br />
88.89%<br />
Target Met<br />
by LEA<br />
(Y/N)<br />
Y<br />
Percent of<br />
youth with<br />
IEPs dropping<br />
out of high<br />
school<br />
State<br />
Rate<br />
Indicator 03: Assessment on Statewide Benchmark Exam (grades 3-8, 11)<br />
A) Adequate Yearly Progress<br />
n=40<br />
Literacy<br />
Mathematics<br />
Met Disability Subgroup "n"<br />
for Reporting Purposes (Y/N)<br />
State Target for % of Districts Meeting<br />
AYP for Disability Subgroup<br />
State<br />
Target<br />
3.06% 4.20%<br />
LEA<br />
Rate<br />
0.00%<br />
% of Districts Meeting AYP<br />
for Disability Subgroup<br />
Target Met by<br />
LEA (Y/N)<br />
Y<br />
Target Met by<br />
LEA(Y/N)<br />
Overall N 17.15% 6.25%<br />
NA<br />
N<br />
N<br />
Note: For a district to qualify as having a disability subgroup it must have a minimum of 40 (n=40) students with disabilities in a school building.<br />
B) Participation<br />
Participation Rate: # of<br />
CWD Tested ÷ # of CWD<br />
Enrolled in grades tested.<br />
Participation Rate: Literacy<br />
Participation Rate: Math<br />
Note: - - denotes not applicable<br />
State<br />
Rate<br />
98.78%<br />
State<br />
Target<br />
95.00%<br />
LEA<br />
Rate<br />
98.59%<br />
Target Met<br />
by LEA (Y/N)<br />
98.61% 95.00% 98.68% Y<br />
Y<br />
C) Performance Proficiency<br />
Percent of CWD Scoring<br />
Proficient or Above<br />
Proficiency Rate: Literacy<br />
Proficiency Rate:<br />
Mathematics<br />
16.00%<br />
16.00%<br />
State<br />
Rate<br />
31.49%<br />
44.86%<br />
State<br />
Target<br />
45.22%<br />
51.14%<br />
LEA<br />
Rate<br />
26.23%<br />
35.82%<br />
NA<br />
NA<br />
Target<br />
Met by<br />
LEA (Y/N)<br />
N<br />
N<br />
Page 1 of 5
LEA: 1613 - RIVERSIDE SCHOOL <strong>DISTRICT</strong><br />
Indicator 04: Out-of-School Suspensions and Expulsions (2009/10 school year)<br />
A) Suspension/Expulsion<br />
Percent difference of CWD with out-of- school suspensions and<br />
expulsions totaling greater than 10 days in a school year as<br />
compared to the same data for general education students in<br />
the district.<br />
B) Suspension/Expulsion by Race and Ethnicity<br />
Percent of districts that have: (a) a significant discrepancy, by race or<br />
ethnicity, in the rate of suspensions and expulsions of greater than 10<br />
days in a school year for children with IEPs; and (b) policies,<br />
procedures or practices that contribute to the significant discrepancy<br />
and do not comply with requirements relating to the development<br />
and implementation of IEPs, the use of positive behavioral<br />
interventions and supports, and procedural safeguards.<br />
Indicator 05: School Age (5-21) Least Restrictive Environment<br />
A) In the Regular Class 80% or more of the day<br />
Percent of CWD with<br />
IEPs receiving instruction<br />
in the regular class 80%<br />
or more of the day.<br />
State<br />
Rate<br />
State<br />
Target<br />
LEA<br />
Rate<br />
B) In the Regular Class less than 40% of the day<br />
Percent of CWD with<br />
IEPs receiving instruction<br />
in the regular class less<br />
than 60% of the day.<br />
53.87% 59.77%<br />
State<br />
Rate<br />
State<br />
Target<br />
12.42% 12.51%<br />
42.54%<br />
LEA<br />
Rate<br />
6.72%<br />
C) Other Settings outside the regular class<br />
Percent of CWD with IEPs served in<br />
public or private separate schools,<br />
residential placements, or<br />
homebound/hospital placements.<br />
State<br />
Rate<br />
State<br />
Target<br />
2.80% 2.56%<br />
Target Met<br />
by LEA (Y/N)<br />
N<br />
Target Met<br />
by LEA (Y/N)<br />
Y<br />
LEA<br />
Rate<br />
0.75%<br />
Target Met<br />
by LEA(Y/N)<br />
Indicator 06: Early Childhood (3-5) Least Restrictive Environment<br />
A) Regular Early Childhood Program<br />
Percent of children (aged 3 through 5) with IEPs attending a regular<br />
early childhood program and receiving the majority of special<br />
education and related services in the regular early childhood program<br />
Allowable<br />
Difference<br />
LEA: 1613 - RIVERSIDE SCHOOL <strong>DISTRICT</strong><br />
Indicator 07: Preschool (3-5) Outcomes<br />
a) Percent of preschool CWD<br />
children who did not<br />
improve functioning.<br />
b) Percent of preschool CWD<br />
who improved but whose<br />
functioning remained below<br />
same age peers.<br />
c) Percent of preschool CWD<br />
who improved at a level<br />
nearer to same aged peers.<br />
d) Percent of preschool CWD<br />
who improved functioning to<br />
reach a level comparable to<br />
same age peers.<br />
e) Percent of preschool CWD<br />
children who maintain<br />
functioning at a level<br />
comparable to same aged<br />
peers.<br />
Summary<br />
Statements<br />
1) Of those preschool<br />
children who entered<br />
the preschool program<br />
below age expectations<br />
in each Outcome, the<br />
percent who<br />
substantially increased<br />
their rate of growth by<br />
the time they turned 6<br />
years of age or exited<br />
the program.<br />
2) The percent of<br />
preschool children who<br />
were functioning<br />
within age expectations<br />
in each Outcome by the<br />
time they turned 6<br />
years of age or exited<br />
A) Positive Social -Emotional<br />
Skills*<br />
State<br />
Rate<br />
A) Positive Social -<br />
Emotional Skills<br />
(Including social<br />
relationships)<br />
State<br />
Rate<br />
2.14%<br />
5.31%<br />
25.97%<br />
38.22%<br />
28.36%<br />
State<br />
Target<br />
LEA<br />
Rate<br />
LEA<br />
Rate<br />
— —<br />
— —<br />
— —<br />
— —<br />
— —<br />
Target<br />
Met by<br />
LEA(Y/N)<br />
B) Acquisition and Use of<br />
Knowledge and Skills<br />
(Including early language/<br />
communication and early literacy)<br />
B) Acquisition and Use of<br />
Knowledge and Skills **<br />
State<br />
Rate<br />
1.75%<br />
6.59%<br />
34.23%<br />
43.51%<br />
13.92%<br />
State<br />
Target<br />
LEA<br />
Rate<br />
Target<br />
Met by<br />
LEA(Y/N)<br />
C) Use of Appropriate Behaviors<br />
to Meet Their Needs<br />
State<br />
Rate<br />
State<br />
Target<br />
LEA<br />
Rate<br />
Target<br />
Met by<br />
LEA(Y/N)<br />
89.61% 90.50% — — N/A 90.31% 90.50% — — N/A 90.82% 92.50% — — N/A<br />
66.58% 69.50% — — N/A 57.43% 60.50% — — N/A 76.69% 78.50% — — N/A<br />
NOTE: * Including social relationships ** Including early language/ communication and early literacy<br />
Note: - - denotes not applicable<br />
State<br />
Rate<br />
LEA<br />
Rate<br />
— —<br />
— —<br />
— —<br />
— —<br />
— —<br />
C) Use of<br />
Appropriate<br />
Behaviors to<br />
Meet Their Needs<br />
State<br />
Rate<br />
4.51%<br />
17.34%<br />
41.72%<br />
34.97%<br />
LEA<br />
Rate<br />
1.46% — —<br />
— —<br />
— —<br />
— —<br />
— —<br />
Page 3 of 5
LEA: 1613 - RIVERSIDE SCHOOL <strong>DISTRICT</strong><br />
Indicator 08: Parent Involvement<br />
Percent of surveyed<br />
parents who reported<br />
school facilitated parent<br />
involvement as a means<br />
of improving services<br />
and results for children<br />
with disabilities.<br />
Early Childhood<br />
(3-5)<br />
School Age<br />
(5-21)<br />
State<br />
Rate<br />
90.47%<br />
95.05%<br />
Indicator 09: Disproportionality - Eligibility<br />
Disproportionate representation of racial<br />
and ethnic groups in special education and<br />
related services that is a result of<br />
inappropriate identification (e.g.<br />
monitoring data, review of policies,<br />
practices, and procedures under 618(d),<br />
etc.).<br />
State<br />
Rate<br />
State<br />
Target<br />
88.00%<br />
96.00%<br />
State<br />
Target<br />
0.00% 0.00%<br />
LEA<br />
Rate<br />
— —<br />
92.86%<br />
Indicator 10: Disproportionality-Child with a Disability<br />
Disproportionate representation of racial<br />
and ethnic groups in specific disability<br />
categories that is a result of inappropriate<br />
identification (e.g. monitoring data, review<br />
of policies, practices, and procedures under<br />
618(d), etc.).<br />
Indicator 11: Child Find<br />
Percent of children with<br />
parental consent to evaluate<br />
who are evaluated within<br />
the State established timeline<br />
of 60 days.<br />
Overall<br />
(3-21)<br />
Early Childhood<br />
(3-5)<br />
School Age<br />
(5-21)<br />
State<br />
Rate<br />
0.00%<br />
Indicator 12: Early Childhood Transition<br />
Percent of children referred by Part C prior to<br />
age 3, who are found eligible for Part B, and<br />
who have an IEP developed and implemented<br />
by their third birthday.<br />
Note: - - denotes not applicable<br />
State<br />
Rate<br />
99.41%<br />
99.70%<br />
98.97%<br />
State<br />
Rate<br />
State<br />
Target<br />
0.00%<br />
State<br />
Target<br />
100.00%<br />
100.00%<br />
100.00%<br />
State<br />
Target<br />
Target Met by<br />
LEA (Y/N)<br />
Y<br />
Target Met by<br />
LEA (Y/N)<br />
Y<br />
LEA<br />
Rate<br />
100.00%<br />
— —<br />
100.00%<br />
LEA<br />
Rate<br />
Target Met by<br />
LEA (Y/N)<br />
N/A<br />
N<br />
Note: The target for Indicator 09 is to have zero percent<br />
(0%) of districts identified as having disproportionate<br />
representation as a result of inappropriate<br />
identification in eligibility.<br />
Note: The target for Indicator 10 is to have zero<br />
percent (0%) of districts identified as having<br />
disproportionate representation as a result of<br />
inappropriate identification in a disability<br />
category.<br />
Target Met by<br />
LEA (Y/N)<br />
N/A<br />
Y<br />
Target Met<br />
by LEA<br />
(Y/N)<br />
99.21% 100.00% - - N/A<br />
Y<br />
Note: * Indicates a zero reponse rate for the<br />
district.<br />
Page 4 of 5
LEA: 1613 - RIVERSIDE SCHOOL <strong>DISTRICT</strong><br />
Indicator 13: Secondary Transition<br />
Percent of youth with disabilities aged 16 and<br />
up with an IEP that includes coordinated,<br />
measurable, annual IEP goals and transition<br />
services that will reasonably enable the student<br />
to meet the post-secondary goals.<br />
Indicator 14: Post-School Outcomes<br />
A. Percent of youth enrolled in higher<br />
education within one year of leaving high<br />
school.<br />
State<br />
Rate<br />
State<br />
Target<br />
Note: Data for this Indicator is from the on-site monitoring of LEAs for the given year.<br />
B. Percent of youth enrolled in higher<br />
education or competitively employed<br />
within one year of leaving high school.<br />
C. Percent of youth enrolled in higher<br />
education or in some other postsecondary<br />
education or training program; or<br />
competitively employed or in some other<br />
employment within one year of leaving<br />
high school.<br />
State<br />
Rate<br />
Indicator 20: Reported Data-Timely and Accurate*<br />
District submitted<br />
required data elements<br />
on or before due dates;<br />
made revisions within<br />
the alloted reveiw<br />
periods.<br />
Accurate and Timely<br />
Data Submission<br />
Overall (3-21)<br />
Early Childhood (3-5)<br />
School Age (5-21)<br />
State<br />
Target<br />
100.00%<br />
100.00%<br />
100.00%<br />
State<br />
Target<br />
LEA<br />
Rate<br />
LEA<br />
Rate<br />
Target Met by<br />
LEA (Y/N)<br />
Target Met<br />
by LEA<br />
(Y/N)<br />
Target Met<br />
by LEA<br />
(Y/N)<br />
*Data reviewed for timely and accurate submissions included all APSCN cycle data except for personnel<br />
Note: - - denotes not applicable<br />
96.19 100.00 — — N/A<br />
14.53<br />
State<br />
Rate<br />
49.42<br />
State<br />
Rate<br />
54.07<br />
13.00<br />
State<br />
Target<br />
49.00<br />
State<br />
Target<br />
60.00<br />
Y<br />
N/A<br />
Y<br />
— —<br />
LEA<br />
Rate<br />
— —<br />
LEA<br />
Rate<br />
— —<br />
N/A<br />
Target Met<br />
by LEA<br />
(Y/N)<br />
N/A<br />
Target Met<br />
by LEA<br />
(Y/N)<br />
N/A<br />
Page 5 of 5
LEA: 1701 - ALMA SCHOOL <strong>DISTRICT</strong><br />
<strong>ARKANSAS</strong> <strong>SPECIAL</strong> <strong>EDUCATION</strong><br />
<strong>DISTRICT</strong> <strong>ANNUAL</strong> PERFORMANCE REPORT<br />
2010/11 School Year<br />
Publication Date: March 2012<br />
Each State must have in place a State Performance Plan (SPP) to evaluate the State's efforts to meet the requirements and<br />
purposes of the implementation of the Individuals with Disabilities Education Act (IDEA). The SPP is a six-year plan, which<br />
describes Arkansas's performance on 20 indicators. The Office of Special Education Programs in the U. S. Department of<br />
Education requires that States report annually to the public on the performance of each local education agency (LEA) on 14 of<br />
20 indicators as compared with targets established by the State in the SPP. Arkansas will report indicators 1 through 14 and<br />
20 for each LEA serving children with disabilities (CWD). Any LEA not meeting targets on compliance indicators (0% for<br />
Indicators 4B, 09 & 10 and 100% for Indicators 11, 12, 13, and 20) are non-compliant with IDEA.<br />
There are no report changes for the 2010/11 school year profile; However, it is important to recognize that: .<br />
1. Indicator 01 (Graduation) is reported a year in arrear (2009/10 graduates) and is based on a four-year cohort. This<br />
means the rate is a measure of students who entered in ninth grade and graduate in four years. The calculation is a<br />
requirement under Title I of the Elementary and Secondary Education Act (ESEA).<br />
2. Indicator 02 (Drop out) is reported a year in arrear. This means the rate is a measure of students who dropped out in<br />
the 2009/10 school year. The Indicator 02 data are aligned with the Common Core of Data (CCD) requirements for<br />
grades 7-12.<br />
3. Indicator 04A and 4B (Suspension/Expulsion) is reported a year in arrear. This means the rate is a measure of<br />
students who had out-of-school suspensions and/or expulsions totaling more than 10 days.<br />
Percent of youth<br />
with IEPs<br />
graduating from<br />
high school with a<br />
regular diploma<br />
For a complete description of all the Indicators, please visit the special education website at<br />
http://arksped.k12.ar.us/sections/policy.html<br />
Indicator 01: Graduation Rates (2009/10 school year) Indicator 02: Dropout Rates (2009/10 school year)<br />
State<br />
Rate<br />
State<br />
Target<br />
75.76% 85.00%<br />
LEA<br />
Rate<br />
87.10%<br />
Target Met<br />
by LEA<br />
(Y/N)<br />
Y<br />
Percent of<br />
youth with<br />
IEPs dropping<br />
out of high<br />
school<br />
State<br />
Rate<br />
Indicator 03: Assessment on Statewide Benchmark Exam (grades 3-8, 11)<br />
A) Adequate Yearly Progress<br />
n=40<br />
Literacy<br />
Mathematics<br />
Met Disability Subgroup "n"<br />
for Reporting Purposes (Y/N)<br />
State Target for % of Districts Meeting<br />
AYP for Disability Subgroup<br />
State<br />
Target<br />
3.06% 4.20%<br />
LEA<br />
Rate<br />
0.00%<br />
% of Districts Meeting AYP<br />
for Disability Subgroup<br />
Target Met by<br />
LEA (Y/N)<br />
Y<br />
Target Met by<br />
LEA(Y/N)<br />
Overall N 17.15% 6.25%<br />
NA<br />
N<br />
N<br />
Note: For a district to qualify as having a disability subgroup it must have a minimum of 40 (n=40) students with disabilities in a school building.<br />
B) Participation<br />
Participation Rate: # of<br />
CWD Tested ÷ # of CWD<br />
Enrolled in grades tested.<br />
Participation Rate: Literacy<br />
Participation Rate: Math<br />
Note: - - denotes not applicable<br />
State<br />
Rate<br />
98.78%<br />
State<br />
Target<br />
95.00%<br />
LEA<br />
Rate<br />
98.57%<br />
Target Met<br />
by LEA (Y/N)<br />
98.61% 95.00% 99.58% Y<br />
Y<br />
C) Performance Proficiency<br />
Percent of CWD Scoring<br />
Proficient or Above<br />
Proficiency Rate: Literacy<br />
Proficiency Rate:<br />
Mathematics<br />
16.00%<br />
16.00%<br />
State<br />
Rate<br />
31.49%<br />
44.86%<br />
State<br />
Target<br />
45.22%<br />
51.14%<br />
LEA<br />
Rate<br />
38.07%<br />
56.25%<br />
NA<br />
NA<br />
Target<br />
Met by<br />
LEA (Y/N)<br />
N<br />
Y<br />
Page 1 of 5
LEA: 1701 - ALMA SCHOOL <strong>DISTRICT</strong><br />
Indicator 04: Out-of-School Suspensions and Expulsions (2009/10 school year)<br />
A) Suspension/Expulsion<br />
Percent difference of CWD with out-of- school suspensions and<br />
expulsions totaling greater than 10 days in a school year as<br />
compared to the same data for general education students in<br />
the district.<br />
B) Suspension/Expulsion by Race and Ethnicity<br />
Percent of districts that have: (a) a significant discrepancy, by race or<br />
ethnicity, in the rate of suspensions and expulsions of greater than 10<br />
days in a school year for children with IEPs; and (b) policies,<br />
procedures or practices that contribute to the significant discrepancy<br />
and do not comply with requirements relating to the development<br />
and implementation of IEPs, the use of positive behavioral<br />
interventions and supports, and procedural safeguards.<br />
Indicator 05: School Age (5-21) Least Restrictive Environment<br />
A) In the Regular Class 80% or more of the day<br />
Percent of CWD with<br />
IEPs receiving instruction<br />
in the regular class 80%<br />
or more of the day.<br />
State<br />
Rate<br />
State<br />
Target<br />
LEA<br />
Rate<br />
B) In the Regular Class less than 40% of the day<br />
Percent of CWD with<br />
IEPs receiving instruction<br />
in the regular class less<br />
than 60% of the day.<br />
53.87% 59.77%<br />
State<br />
Rate<br />
State<br />
Target<br />
12.42% 12.51%<br />
71.76%<br />
LEA<br />
Rate<br />
12.47%<br />
C) Other Settings outside the regular class<br />
Percent of CWD with IEPs served in<br />
public or private separate schools,<br />
residential placements, or<br />
homebound/hospital placements.<br />
State<br />
Rate<br />
State<br />
Target<br />
2.80% 2.56%<br />
Target Met<br />
by LEA (Y/N)<br />
Y<br />
Target Met<br />
by LEA (Y/N)<br />
Y<br />
LEA<br />
Rate<br />
0.00%<br />
Target Met<br />
by LEA(Y/N)<br />
Indicator 06: Early Childhood (3-5) Least Restrictive Environment<br />
A) Regular Early Childhood Program<br />
Percent of children (aged 3 through 5) with IEPs attending a regular<br />
early childhood program and receiving the majority of special<br />
education and related services in the regular early childhood program<br />
Allowable<br />
Difference<br />
LEA: 1701 - ALMA SCHOOL <strong>DISTRICT</strong><br />
Indicator 07: Preschool (3-5) Outcomes<br />
a) Percent of preschool CWD<br />
children who did not<br />
improve functioning.<br />
b) Percent of preschool CWD<br />
who improved but whose<br />
functioning remained below<br />
same age peers.<br />
c) Percent of preschool CWD<br />
who improved at a level<br />
nearer to same aged peers.<br />
d) Percent of preschool CWD<br />
who improved functioning to<br />
reach a level comparable to<br />
same age peers.<br />
e) Percent of preschool CWD<br />
children who maintain<br />
functioning at a level<br />
comparable to same aged<br />
peers.<br />
Summary<br />
Statements<br />
1) Of those preschool<br />
children who entered<br />
the preschool program<br />
below age expectations<br />
in each Outcome, the<br />
percent who<br />
substantially increased<br />
their rate of growth by<br />
the time they turned 6<br />
years of age or exited<br />
the program.<br />
2) The percent of<br />
preschool children who<br />
were functioning<br />
within age expectations<br />
in each Outcome by the<br />
time they turned 6<br />
years of age or exited<br />
A) Positive Social -Emotional<br />
Skills*<br />
State<br />
Rate<br />
A) Positive Social -<br />
Emotional Skills<br />
(Including social<br />
relationships)<br />
State<br />
Rate<br />
2.14%<br />
5.31%<br />
25.97%<br />
38.22%<br />
28.36%<br />
State<br />
Target<br />
LEA<br />
Rate<br />
LEA<br />
Rate<br />
— —<br />
— —<br />
— —<br />
— —<br />
— —<br />
Target<br />
Met by<br />
LEA(Y/N)<br />
B) Acquisition and Use of<br />
Knowledge and Skills<br />
(Including early language/<br />
communication and early literacy)<br />
B) Acquisition and Use of<br />
Knowledge and Skills **<br />
State<br />
Rate<br />
1.75%<br />
6.59%<br />
34.23%<br />
43.51%<br />
13.92%<br />
State<br />
Target<br />
LEA<br />
Rate<br />
Target<br />
Met by<br />
LEA(Y/N)<br />
C) Use of Appropriate Behaviors<br />
to Meet Their Needs<br />
State<br />
Rate<br />
State<br />
Target<br />
LEA<br />
Rate<br />
Target<br />
Met by<br />
LEA(Y/N)<br />
89.61% 90.50% — — N/A 90.31% 90.50% — — N/A 90.82% 92.50% — — N/A<br />
66.58% 69.50% — — N/A 57.43% 60.50% — — N/A 76.69% 78.50% — — N/A<br />
NOTE: * Including social relationships ** Including early language/ communication and early literacy<br />
Note: - - denotes not applicable<br />
State<br />
Rate<br />
LEA<br />
Rate<br />
— —<br />
— —<br />
— —<br />
— —<br />
— —<br />
C) Use of<br />
Appropriate<br />
Behaviors to<br />
Meet Their Needs<br />
State<br />
Rate<br />
4.51%<br />
17.34%<br />
41.72%<br />
34.97%<br />
LEA<br />
Rate<br />
1.46% — —<br />
— —<br />
— —<br />
— —<br />
— —<br />
Page 3 of 5
LEA: 1701 - ALMA SCHOOL <strong>DISTRICT</strong><br />
Indicator 08: Parent Involvement<br />
Percent of surveyed<br />
parents who reported<br />
school facilitated parent<br />
involvement as a means<br />
of improving services<br />
and results for children<br />
with disabilities.<br />
Early Childhood<br />
(3-5)<br />
School Age<br />
(5-21)<br />
State<br />
Rate<br />
90.47%<br />
95.05%<br />
Indicator 09: Disproportionality - Eligibility<br />
Disproportionate representation of racial<br />
and ethnic groups in special education and<br />
related services that is a result of<br />
inappropriate identification (e.g.<br />
monitoring data, review of policies,<br />
practices, and procedures under 618(d),<br />
etc.).<br />
State<br />
Rate<br />
State<br />
Target<br />
88.00%<br />
96.00%<br />
State<br />
Target<br />
0.00% 0.00%<br />
LEA<br />
Rate<br />
— —<br />
94.18%<br />
Indicator 10: Disproportionality-Child with a Disability<br />
Disproportionate representation of racial<br />
and ethnic groups in specific disability<br />
categories that is a result of inappropriate<br />
identification (e.g. monitoring data, review<br />
of policies, practices, and procedures under<br />
618(d), etc.).<br />
Indicator 11: Child Find<br />
Percent of children with<br />
parental consent to evaluate<br />
who are evaluated within<br />
the State established timeline<br />
of 60 days.<br />
Overall<br />
(3-21)<br />
Early Childhood<br />
(3-5)<br />
School Age<br />
(5-21)<br />
State<br />
Rate<br />
0.00%<br />
Indicator 12: Early Childhood Transition<br />
Percent of children referred by Part C prior to<br />
age 3, who are found eligible for Part B, and<br />
who have an IEP developed and implemented<br />
by their third birthday.<br />
Note: - - denotes not applicable<br />
State<br />
Rate<br />
99.41%<br />
99.70%<br />
98.97%<br />
State<br />
Rate<br />
State<br />
Target<br />
0.00%<br />
State<br />
Target<br />
100.00%<br />
100.00%<br />
100.00%<br />
State<br />
Target<br />
Target Met by<br />
LEA (Y/N)<br />
Y<br />
Target Met by<br />
LEA (Y/N)<br />
Y<br />
LEA<br />
Rate<br />
100.00%<br />
— —<br />
100.00%<br />
LEA<br />
Rate<br />
Target Met by<br />
LEA (Y/N)<br />
N/A<br />
N<br />
Note: The target for Indicator 09 is to have zero percent<br />
(0%) of districts identified as having disproportionate<br />
representation as a result of inappropriate<br />
identification in eligibility.<br />
Note: The target for Indicator 10 is to have zero<br />
percent (0%) of districts identified as having<br />
disproportionate representation as a result of<br />
inappropriate identification in a disability<br />
category.<br />
Target Met by<br />
LEA (Y/N)<br />
N/A<br />
Y<br />
Target Met<br />
by LEA<br />
(Y/N)<br />
99.21% 100.00% - - N/A<br />
Y<br />
Note: * Indicates a zero reponse rate for the<br />
district.<br />
Page 4 of 5
LEA: 1701 - ALMA SCHOOL <strong>DISTRICT</strong><br />
Indicator 13: Secondary Transition<br />
Percent of youth with disabilities aged 16 and<br />
up with an IEP that includes coordinated,<br />
measurable, annual IEP goals and transition<br />
services that will reasonably enable the student<br />
to meet the post-secondary goals.<br />
Indicator 14: Post-School Outcomes<br />
A. Percent of youth enrolled in higher<br />
education within one year of leaving high<br />
school.<br />
State<br />
Rate<br />
State<br />
Target<br />
Note: Data for this Indicator is from the on-site monitoring of LEAs for the given year.<br />
B. Percent of youth enrolled in higher<br />
education or competitively employed<br />
within one year of leaving high school.<br />
C. Percent of youth enrolled in higher<br />
education or in some other postsecondary<br />
education or training program; or<br />
competitively employed or in some other<br />
employment within one year of leaving<br />
high school.<br />
State<br />
Rate<br />
Indicator 20: Reported Data-Timely and Accurate*<br />
District submitted<br />
required data elements<br />
on or before due dates;<br />
made revisions within<br />
the alloted reveiw<br />
periods.<br />
Accurate and Timely<br />
Data Submission<br />
Overall (3-21)<br />
Early Childhood (3-5)<br />
School Age (5-21)<br />
State<br />
Target<br />
100.00%<br />
100.00%<br />
100.00%<br />
State<br />
Target<br />
LEA<br />
Rate<br />
LEA<br />
Rate<br />
Target Met by<br />
LEA (Y/N)<br />
Target Met<br />
by LEA<br />
(Y/N)<br />
Target Met<br />
by LEA<br />
(Y/N)<br />
*Data reviewed for timely and accurate submissions included all APSCN cycle data except for personnel<br />
Note: - - denotes not applicable<br />
96.19 100.00 — — N/A<br />
14.53<br />
State<br />
Rate<br />
49.42<br />
State<br />
Rate<br />
54.07<br />
13.00<br />
State<br />
Target<br />
49.00<br />
State<br />
Target<br />
60.00<br />
Y<br />
N/A<br />
Y<br />
— —<br />
LEA<br />
Rate<br />
— —<br />
LEA<br />
Rate<br />
— —<br />
N/A<br />
Target Met<br />
by LEA<br />
(Y/N)<br />
N/A<br />
Target Met<br />
by LEA<br />
(Y/N)<br />
N/A<br />
Page 5 of 5
<strong>ARKANSAS</strong> <strong>SPECIAL</strong> <strong>EDUCATION</strong><br />
<strong>DISTRICT</strong> <strong>ANNUAL</strong> PERFORMANCE REPORT<br />
2010/11 School Year<br />
Publication Date: March 2012<br />
Each State must have in place a State Performance Plan (SPP) to evaluate the State's efforts to meet the requirements and<br />
purposes of the implementation of the Individuals with Disabilities Education Act (IDEA). The SPP is a six-year plan, which<br />
describes Arkansas's performance on 20 indicators. The Office of Special Education Programs in the U. S. Department of<br />
Education requires that States report annually to the public on the performance of each local education agency (LEA) on 14 of<br />
20 indicators as compared with targets established by the State in the SPP. Arkansas will report indicators 1 through 14 and<br />
20 for each LEA serving children with disabilities (CWD). Any LEA not meeting targets on compliance indicators (0% for<br />
Indicators 4B, 09 & 10 and 100% for Indicators 11, 12, 13, and 20) are non-compliant with IDEA.<br />
There are no report changes for the 2010/11 school year profile; However, it is important to recognize that: .<br />
1. Indicator 01 (Graduation) is reported a year in arrear (2009/10 graduates) and is based on a four-year cohort. This<br />
means the rate is a measure of students who entered in ninth grade and graduate in four years. The calculation is a<br />
requirement under Title I of the Elementary and Secondary Education Act (ESEA).<br />
2. Indicator 02 (Drop out) is reported a year in arrear. This means the rate is a measure of students who dropped out in<br />
the 2009/10 school year. The Indicator 02 data are aligned with the Common Core of Data (CCD) requirements for<br />
grades 7-12.<br />
3. Indicator 04A and 4B (Suspension/Expulsion) is reported a year in arrear. This means the rate is a measure of<br />
students who had out-of-school suspensions and/or expulsions totaling more than 10 days.<br />
For a complete description of all the Indicators, please visit the special education website at<br />
http://arksped.k12.ar.us/sections/policy.html<br />
LEA: 1702 - CEDARVILLE SCHOOL <strong>DISTRICT</strong><br />
Indicator 01: Graduation Rates (2009/10 school year) Indicator 02: Dropout Rates (2009/10 school year)<br />
Percent of youth<br />
with IEPs<br />
graduating from<br />
high school with a<br />
regular diploma<br />
State<br />
Rate<br />
State<br />
Target<br />
75.76% 85.00%<br />
LEA<br />
Rate<br />
83.33%<br />
Target Met<br />
by LEA<br />
(Y/N)<br />
N<br />
Percent of<br />
youth with<br />
IEPs dropping<br />
out of high<br />
school<br />
State<br />
Rate<br />
Indicator 03: Assessment on Statewide Benchmark Exam (grades 3-8, 11)<br />
A) Adequate Yearly Progress<br />
n=40<br />
Literacy<br />
Mathematics<br />
Met Disability Subgroup "n"<br />
for Reporting Purposes (Y/N)<br />
State Target for % of Districts Meeting<br />
AYP for Disability Subgroup<br />
State<br />
Target<br />
3.06% 4.20%<br />
LEA<br />
Rate<br />
2.63%<br />
% of Districts Meeting AYP<br />
for Disability Subgroup<br />
Target Met by<br />
LEA (Y/N)<br />
Y<br />
Target Met by<br />
LEA(Y/N)<br />
Overall N 17.15% 6.25%<br />
NA<br />
N<br />
N<br />
Note: For a district to qualify as having a disability subgroup it must have a minimum of 40 (n=40) students with disabilities in a school building.<br />
B) Participation<br />
Participation Rate: # of<br />
CWD Tested ÷ # of CWD<br />
Enrolled in grades tested.<br />
Participation Rate: Literacy<br />
Participation Rate: Math<br />
Note: - - denotes not applicable<br />
State<br />
Rate<br />
98.78%<br />
State<br />
Target<br />
95.00%<br />
LEA<br />
Rate<br />
100.00%<br />
Target Met<br />
by LEA (Y/N)<br />
98.61% 95.00% 100.00% Y<br />
Y<br />
C) Performance Proficiency<br />
Percent of CWD Scoring<br />
Proficient or Above<br />
Proficiency Rate: Literacy<br />
Proficiency Rate:<br />
Mathematics<br />
16.00%<br />
16.00%<br />
State<br />
Rate<br />
31.49%<br />
44.86%<br />
State<br />
Target<br />
45.22%<br />
51.14%<br />
LEA<br />
Rate<br />
7.69%<br />
24.14%<br />
NA<br />
NA<br />
Target<br />
Met by<br />
LEA (Y/N)<br />
N<br />
N<br />
Page 1 of 5
LEA: 1702 - CEDARVILLE SCHOOL <strong>DISTRICT</strong><br />
Indicator 04: Out-of-School Suspensions and Expulsions (2009/10 school year)<br />
A) Suspension/Expulsion<br />
Percent difference of CWD with out-of- school suspensions and<br />
expulsions totaling greater than 10 days in a school year as<br />
compared to the same data for general education students in<br />
the district.<br />
B) Suspension/Expulsion by Race and Ethnicity<br />
Percent of districts that have: (a) a significant discrepancy, by race or<br />
ethnicity, in the rate of suspensions and expulsions of greater than 10<br />
days in a school year for children with IEPs; and (b) policies,<br />
procedures or practices that contribute to the significant discrepancy<br />
and do not comply with requirements relating to the development<br />
and implementation of IEPs, the use of positive behavioral<br />
interventions and supports, and procedural safeguards.<br />
Indicator 05: School Age (5-21) Least Restrictive Environment<br />
A) In the Regular Class 80% or more of the day<br />
Percent of CWD with<br />
IEPs receiving instruction<br />
in the regular class 80%<br />
or more of the day.<br />
State<br />
Rate<br />
State<br />
Target<br />
LEA<br />
Rate<br />
B) In the Regular Class less than 40% of the day<br />
Percent of CWD with<br />
IEPs receiving instruction<br />
in the regular class less<br />
than 60% of the day.<br />
53.87% 59.77%<br />
State<br />
Rate<br />
State<br />
Target<br />
12.42% 12.51%<br />
62.92%<br />
LEA<br />
Rate<br />
12.36%<br />
C) Other Settings outside the regular class<br />
Percent of CWD with IEPs served in<br />
public or private separate schools,<br />
residential placements, or<br />
homebound/hospital placements.<br />
State<br />
Rate<br />
State<br />
Target<br />
2.80% 2.56%<br />
Target Met<br />
by LEA (Y/N)<br />
Y<br />
Target Met<br />
by LEA (Y/N)<br />
Y<br />
LEA<br />
Rate<br />
0.00%<br />
Target Met<br />
by LEA(Y/N)<br />
Indicator 06: Early Childhood (3-5) Least Restrictive Environment<br />
A) Regular Early Childhood Program<br />
Percent of children (aged 3 through 5) with IEPs attending a regular<br />
early childhood program and receiving the majority of special<br />
education and related services in the regular early childhood program<br />
Allowable<br />
Difference<br />
LEA: 1702 - CEDARVILLE SCHOOL <strong>DISTRICT</strong><br />
Indicator 07: Preschool (3-5) Outcomes<br />
a) Percent of preschool CWD<br />
children who did not<br />
improve functioning.<br />
b) Percent of preschool CWD<br />
who improved but whose<br />
functioning remained below<br />
same age peers.<br />
c) Percent of preschool CWD<br />
who improved at a level<br />
nearer to same aged peers.<br />
d) Percent of preschool CWD<br />
who improved functioning to<br />
reach a level comparable to<br />
same age peers.<br />
e) Percent of preschool CWD<br />
children who maintain<br />
functioning at a level<br />
comparable to same aged<br />
peers.<br />
Summary<br />
Statements<br />
1) Of those preschool<br />
children who entered<br />
the preschool program<br />
below age expectations<br />
in each Outcome, the<br />
percent who<br />
substantially increased<br />
their rate of growth by<br />
the time they turned 6<br />
years of age or exited<br />
the program.<br />
2) The percent of<br />
preschool children who<br />
were functioning<br />
within age expectations<br />
in each Outcome by the<br />
time they turned 6<br />
years of age or exited<br />
A) Positive Social -Emotional<br />
Skills*<br />
State<br />
Rate<br />
A) Positive Social -<br />
Emotional Skills<br />
(Including social<br />
relationships)<br />
State<br />
Rate<br />
2.14%<br />
5.31%<br />
25.97%<br />
38.22%<br />
28.36%<br />
State<br />
Target<br />
LEA<br />
Rate<br />
LEA<br />
Rate<br />
— —<br />
— —<br />
— —<br />
— —<br />
— —<br />
Target<br />
Met by<br />
LEA(Y/N)<br />
B) Acquisition and Use of<br />
Knowledge and Skills<br />
(Including early language/<br />
communication and early literacy)<br />
B) Acquisition and Use of<br />
Knowledge and Skills **<br />
State<br />
Rate<br />
1.75%<br />
6.59%<br />
34.23%<br />
43.51%<br />
13.92%<br />
State<br />
Target<br />
LEA<br />
Rate<br />
Target<br />
Met by<br />
LEA(Y/N)<br />
C) Use of Appropriate Behaviors<br />
to Meet Their Needs<br />
State<br />
Rate<br />
State<br />
Target<br />
LEA<br />
Rate<br />
Target<br />
Met by<br />
LEA(Y/N)<br />
89.61% 90.50% — — N/A 90.31% 90.50% — — N/A 90.82% 92.50% — — N/A<br />
66.58% 69.50% — — N/A 57.43% 60.50% — — N/A 76.69% 78.50% — — N/A<br />
NOTE: * Including social relationships ** Including early language/ communication and early literacy<br />
Note: - - denotes not applicable<br />
State<br />
Rate<br />
LEA<br />
Rate<br />
— —<br />
— —<br />
— —<br />
— —<br />
— —<br />
C) Use of<br />
Appropriate<br />
Behaviors to<br />
Meet Their Needs<br />
State<br />
Rate<br />
4.51%<br />
17.34%<br />
41.72%<br />
34.97%<br />
LEA<br />
Rate<br />
1.46% — —<br />
— —<br />
— —<br />
— —<br />
— —<br />
Page 3 of 5
LEA: 1702 - CEDARVILLE SCHOOL <strong>DISTRICT</strong><br />
Indicator 08: Parent Involvement<br />
Percent of surveyed<br />
parents who reported<br />
school facilitated parent<br />
involvement as a means<br />
of improving services<br />
and results for children<br />
with disabilities.<br />
Early Childhood<br />
(3-5)<br />
School Age<br />
(5-21)<br />
State<br />
Rate<br />
90.47%<br />
95.05%<br />
Indicator 09: Disproportionality - Eligibility<br />
Disproportionate representation of racial<br />
and ethnic groups in special education and<br />
related services that is a result of<br />
inappropriate identification (e.g.<br />
monitoring data, review of policies,<br />
practices, and procedures under 618(d),<br />
etc.).<br />
State<br />
Rate<br />
State<br />
Target<br />
88.00%<br />
96.00%<br />
State<br />
Target<br />
0.00% 0.00%<br />
LEA<br />
Rate<br />
— —<br />
96.36%<br />
Indicator 10: Disproportionality-Child with a Disability<br />
Disproportionate representation of racial<br />
and ethnic groups in specific disability<br />
categories that is a result of inappropriate<br />
identification (e.g. monitoring data, review<br />
of policies, practices, and procedures under<br />
618(d), etc.).<br />
Indicator 11: Child Find<br />
Percent of children with<br />
parental consent to evaluate<br />
who are evaluated within<br />
the State established timeline<br />
of 60 days.<br />
Overall<br />
(3-21)<br />
Early Childhood<br />
(3-5)<br />
School Age<br />
(5-21)<br />
State<br />
Rate<br />
0.00%<br />
Indicator 12: Early Childhood Transition<br />
Percent of children referred by Part C prior to<br />
age 3, who are found eligible for Part B, and<br />
who have an IEP developed and implemented<br />
by their third birthday.<br />
Note: - - denotes not applicable<br />
State<br />
Rate<br />
99.41%<br />
99.70%<br />
98.97%<br />
State<br />
Rate<br />
State<br />
Target<br />
0.00%<br />
State<br />
Target<br />
100.00%<br />
100.00%<br />
100.00%<br />
State<br />
Target<br />
Target Met by<br />
LEA (Y/N)<br />
Y<br />
Target Met by<br />
LEA (Y/N)<br />
Y<br />
LEA<br />
Rate<br />
100.00%<br />
— —<br />
100.00%<br />
LEA<br />
Rate<br />
Target Met by<br />
LEA (Y/N)<br />
N/A<br />
Y<br />
Note: The target for Indicator 09 is to have zero percent<br />
(0%) of districts identified as having disproportionate<br />
representation as a result of inappropriate<br />
identification in eligibility.<br />
Note: The target for Indicator 10 is to have zero<br />
percent (0%) of districts identified as having<br />
disproportionate representation as a result of<br />
inappropriate identification in a disability<br />
category.<br />
Target Met by<br />
LEA (Y/N)<br />
N/A<br />
Y<br />
Target Met<br />
by LEA<br />
(Y/N)<br />
99.21% 100.00% - - N/A<br />
Y<br />
Note: * Indicates a zero reponse rate for the<br />
district.<br />
Page 4 of 5
LEA: 1702 - CEDARVILLE SCHOOL <strong>DISTRICT</strong><br />
Indicator 13: Secondary Transition<br />
Percent of youth with disabilities aged 16 and<br />
up with an IEP that includes coordinated,<br />
measurable, annual IEP goals and transition<br />
services that will reasonably enable the student<br />
to meet the post-secondary goals.<br />
Indicator 14: Post-School Outcomes<br />
A. Percent of youth enrolled in higher<br />
education within one year of leaving high<br />
school.<br />
State<br />
Rate<br />
State<br />
Target<br />
Note: Data for this Indicator is from the on-site monitoring of LEAs for the given year.<br />
B. Percent of youth enrolled in higher<br />
education or competitively employed<br />
within one year of leaving high school.<br />
C. Percent of youth enrolled in higher<br />
education or in some other postsecondary<br />
education or training program; or<br />
competitively employed or in some other<br />
employment within one year of leaving<br />
high school.<br />
State<br />
Rate<br />
Indicator 20: Reported Data-Timely and Accurate*<br />
District submitted<br />
required data elements<br />
on or before due dates;<br />
made revisions within<br />
the alloted reveiw<br />
periods.<br />
Accurate and Timely<br />
Data Submission<br />
Overall (3-21)<br />
Early Childhood (3-5)<br />
School Age (5-21)<br />
State<br />
Target<br />
100.00%<br />
100.00%<br />
100.00%<br />
State<br />
Target<br />
LEA<br />
Rate<br />
LEA<br />
Rate<br />
Target Met by<br />
LEA (Y/N)<br />
Target Met<br />
by LEA<br />
(Y/N)<br />
Target Met<br />
by LEA<br />
(Y/N)<br />
*Data reviewed for timely and accurate submissions included all APSCN cycle data except for personnel<br />
Note: - - denotes not applicable<br />
96.19 100.00 — — N/A<br />
14.53<br />
State<br />
Rate<br />
49.42<br />
State<br />
Rate<br />
54.07<br />
13.00<br />
State<br />
Target<br />
49.00<br />
State<br />
Target<br />
60.00<br />
Y<br />
N/A<br />
Y<br />
— —<br />
LEA<br />
Rate<br />
— —<br />
LEA<br />
Rate<br />
— —<br />
N/A<br />
Target Met<br />
by LEA<br />
(Y/N)<br />
N/A<br />
Target Met<br />
by LEA<br />
(Y/N)<br />
N/A<br />
Page 5 of 5
<strong>ARKANSAS</strong> <strong>SPECIAL</strong> <strong>EDUCATION</strong><br />
<strong>DISTRICT</strong> <strong>ANNUAL</strong> PERFORMANCE REPORT<br />
2010/11 School Year<br />
Publication Date: March 2012<br />
Each State must have in place a State Performance Plan (SPP) to evaluate the State's efforts to meet the requirements and<br />
purposes of the implementation of the Individuals with Disabilities Education Act (IDEA). The SPP is a six-year plan, which<br />
describes Arkansas's performance on 20 indicators. The Office of Special Education Programs in the U. S. Department of<br />
Education requires that States report annually to the public on the performance of each local education agency (LEA) on 14 of<br />
20 indicators as compared with targets established by the State in the SPP. Arkansas will report indicators 1 through 14 and<br />
20 for each LEA serving children with disabilities (CWD). Any LEA not meeting targets on compliance indicators (0% for<br />
Indicators 4B, 09 & 10 and 100% for Indicators 11, 12, 13, and 20) are non-compliant with IDEA.<br />
There are no report changes for the 2010/11 school year profile; However, it is important to recognize that: .<br />
1. Indicator 01 (Graduation) is reported a year in arrear (2009/10 graduates) and is based on a four-year cohort. This<br />
means the rate is a measure of students who entered in ninth grade and graduate in four years. The calculation is a<br />
requirement under Title I of the Elementary and Secondary Education Act (ESEA).<br />
2. Indicator 02 (Drop out) is reported a year in arrear. This means the rate is a measure of students who dropped out in<br />
the 2009/10 school year. The Indicator 02 data are aligned with the Common Core of Data (CCD) requirements for<br />
grades 7-12.<br />
3. Indicator 04A and 4B (Suspension/Expulsion) is reported a year in arrear. This means the rate is a measure of<br />
students who had out-of-school suspensions and/or expulsions totaling more than 10 days.<br />
For a complete description of all the Indicators, please visit the special education website at<br />
http://arksped.k12.ar.us/sections/policy.html<br />
LEA: 1703 - MOUNTAINBURG SCHOOL <strong>DISTRICT</strong><br />
Indicator 01: Graduation Rates (2009/10 school year) Indicator 02: Dropout Rates (2009/10 school year)<br />
Percent of youth<br />
with IEPs<br />
graduating from<br />
high school with a<br />
regular diploma<br />
State<br />
Rate<br />
State<br />
Target<br />
75.76% 85.00%<br />
LEA<br />
Rate<br />
83.33%<br />
Target Met<br />
by LEA<br />
(Y/N)<br />
N<br />
Percent of<br />
youth with<br />
IEPs dropping<br />
out of high<br />
school<br />
State<br />
Rate<br />
Indicator 03: Assessment on Statewide Benchmark Exam (grades 3-8, 11)<br />
A) Adequate Yearly Progress<br />
n=40<br />
Literacy<br />
Mathematics<br />
Met Disability Subgroup "n"<br />
for Reporting Purposes (Y/N)<br />
State Target for % of Districts Meeting<br />
AYP for Disability Subgroup<br />
State<br />
Target<br />
3.06% 4.20%<br />
LEA<br />
Rate<br />
0.00%<br />
% of Districts Meeting AYP<br />
for Disability Subgroup<br />
Target Met by<br />
LEA (Y/N)<br />
Y<br />
Target Met by<br />
LEA(Y/N)<br />
Overall N 17.15% 6.25%<br />
NA<br />
N<br />
N<br />
Note: For a district to qualify as having a disability subgroup it must have a minimum of 40 (n=40) students with disabilities in a school building.<br />
B) Participation<br />
Participation Rate: # of<br />
CWD Tested ÷ # of CWD<br />
Enrolled in grades tested.<br />
Participation Rate: Literacy<br />
Participation Rate: Math<br />
Note: - - denotes not applicable<br />
State<br />
Rate<br />
98.78%<br />
State<br />
Target<br />
95.00%<br />
LEA<br />
Rate<br />
100.00%<br />
Target Met<br />
by LEA (Y/N)<br />
98.61% 95.00% 100.00% Y<br />
Y<br />
C) Performance Proficiency<br />
Percent of CWD Scoring<br />
Proficient or Above<br />
Proficiency Rate: Literacy<br />
Proficiency Rate:<br />
Mathematics<br />
16.00%<br />
16.00%<br />
State<br />
Rate<br />
31.49%<br />
44.86%<br />
State<br />
Target<br />
45.22%<br />
51.14%<br />
LEA<br />
Rate<br />
21.28%<br />
38.18%<br />
NA<br />
NA<br />
Target<br />
Met by<br />
LEA (Y/N)<br />
N<br />
N<br />
Page 1 of 5
LEA: 1703 - MOUNTAINBURG SCHOOL <strong>DISTRICT</strong><br />
Indicator 04: Out-of-School Suspensions and Expulsions (2009/10 school year)<br />
A) Suspension/Expulsion<br />
Percent difference of CWD with out-of- school suspensions and<br />
expulsions totaling greater than 10 days in a school year as<br />
compared to the same data for general education students in<br />
the district.<br />
B) Suspension/Expulsion by Race and Ethnicity<br />
Percent of districts that have: (a) a significant discrepancy, by race or<br />
ethnicity, in the rate of suspensions and expulsions of greater than 10<br />
days in a school year for children with IEPs; and (b) policies,<br />
procedures or practices that contribute to the significant discrepancy<br />
and do not comply with requirements relating to the development<br />
and implementation of IEPs, the use of positive behavioral<br />
interventions and supports, and procedural safeguards.<br />
Indicator 05: School Age (5-21) Least Restrictive Environment<br />
A) In the Regular Class 80% or more of the day<br />
Percent of CWD with<br />
IEPs receiving instruction<br />
in the regular class 80%<br />
or more of the day.<br />
State<br />
Rate<br />
State<br />
Target<br />
LEA<br />
Rate<br />
B) In the Regular Class less than 40% of the day<br />
Percent of CWD with<br />
IEPs receiving instruction<br />
in the regular class less<br />
than 60% of the day.<br />
53.87% 59.77%<br />
State<br />
Rate<br />
State<br />
Target<br />
12.42% 12.51%<br />
55.67%<br />
LEA<br />
Rate<br />
8.25%<br />
C) Other Settings outside the regular class<br />
Percent of CWD with IEPs served in<br />
public or private separate schools,<br />
residential placements, or<br />
homebound/hospital placements.<br />
State<br />
Rate<br />
State<br />
Target<br />
2.80% 2.56%<br />
Target Met<br />
by LEA (Y/N)<br />
N<br />
Target Met<br />
by LEA (Y/N)<br />
Y<br />
LEA<br />
Rate<br />
1.03%<br />
Target Met<br />
by LEA(Y/N)<br />
Indicator 06: Early Childhood (3-5) Least Restrictive Environment<br />
A) Regular Early Childhood Program<br />
Percent of children (aged 3 through 5) with IEPs attending a regular<br />
early childhood program and receiving the majority of special<br />
education and related services in the regular early childhood program<br />
Allowable<br />
Difference<br />
LEA: 1703 - MOUNTAINBURG SCHOOL <strong>DISTRICT</strong><br />
Indicator 07: Preschool (3-5) Outcomes<br />
a) Percent of preschool CWD<br />
children who did not<br />
improve functioning.<br />
b) Percent of preschool CWD<br />
who improved but whose<br />
functioning remained below<br />
same age peers.<br />
c) Percent of preschool CWD<br />
who improved at a level<br />
nearer to same aged peers.<br />
d) Percent of preschool CWD<br />
who improved functioning to<br />
reach a level comparable to<br />
same age peers.<br />
e) Percent of preschool CWD<br />
children who maintain<br />
functioning at a level<br />
comparable to same aged<br />
peers.<br />
Summary<br />
Statements<br />
1) Of those preschool<br />
children who entered<br />
the preschool program<br />
below age expectations<br />
in each Outcome, the<br />
percent who<br />
substantially increased<br />
their rate of growth by<br />
the time they turned 6<br />
years of age or exited<br />
the program.<br />
2) The percent of<br />
preschool children who<br />
were functioning<br />
within age expectations<br />
in each Outcome by the<br />
time they turned 6<br />
years of age or exited<br />
A) Positive Social -Emotional<br />
Skills*<br />
State<br />
Rate<br />
A) Positive Social -<br />
Emotional Skills<br />
(Including social<br />
relationships)<br />
State<br />
Rate<br />
2.14%<br />
5.31%<br />
25.97%<br />
38.22%<br />
28.36%<br />
State<br />
Target<br />
LEA<br />
Rate<br />
LEA<br />
Rate<br />
— —<br />
— —<br />
— —<br />
— —<br />
— —<br />
Target<br />
Met by<br />
LEA(Y/N)<br />
B) Acquisition and Use of<br />
Knowledge and Skills<br />
(Including early language/<br />
communication and early literacy)<br />
B) Acquisition and Use of<br />
Knowledge and Skills **<br />
State<br />
Rate<br />
1.75%<br />
6.59%<br />
34.23%<br />
43.51%<br />
13.92%<br />
State<br />
Target<br />
LEA<br />
Rate<br />
Target<br />
Met by<br />
LEA(Y/N)<br />
C) Use of Appropriate Behaviors<br />
to Meet Their Needs<br />
State<br />
Rate<br />
State<br />
Target<br />
LEA<br />
Rate<br />
Target<br />
Met by<br />
LEA(Y/N)<br />
89.61% 90.50% — — N/A 90.31% 90.50% — — N/A 90.82% 92.50% — — N/A<br />
66.58% 69.50% — — N/A 57.43% 60.50% — — N/A 76.69% 78.50% — — N/A<br />
NOTE: * Including social relationships ** Including early language/ communication and early literacy<br />
Note: - - denotes not applicable<br />
State<br />
Rate<br />
LEA<br />
Rate<br />
— —<br />
— —<br />
— —<br />
— —<br />
— —<br />
C) Use of<br />
Appropriate<br />
Behaviors to<br />
Meet Their Needs<br />
State<br />
Rate<br />
4.51%<br />
17.34%<br />
41.72%<br />
34.97%<br />
LEA<br />
Rate<br />
1.46% — —<br />
— —<br />
— —<br />
— —<br />
— —<br />
Page 3 of 5
LEA: 1703 - MOUNTAINBURG SCHOOL <strong>DISTRICT</strong><br />
Indicator 08: Parent Involvement<br />
Percent of surveyed<br />
parents who reported<br />
school facilitated parent<br />
involvement as a means<br />
of improving services<br />
and results for children<br />
with disabilities.<br />
Early Childhood<br />
(3-5)<br />
School Age<br />
(5-21)<br />
State<br />
Rate<br />
90.47%<br />
95.05%<br />
Indicator 09: Disproportionality - Eligibility<br />
Disproportionate representation of racial<br />
and ethnic groups in special education and<br />
related services that is a result of<br />
inappropriate identification (e.g.<br />
monitoring data, review of policies,<br />
practices, and procedures under 618(d),<br />
etc.).<br />
State<br />
Rate<br />
State<br />
Target<br />
88.00%<br />
96.00%<br />
State<br />
Target<br />
0.00% 0.00%<br />
LEA<br />
Rate<br />
— —<br />
100.00%<br />
Indicator 10: Disproportionality-Child with a Disability<br />
Disproportionate representation of racial<br />
and ethnic groups in specific disability<br />
categories that is a result of inappropriate<br />
identification (e.g. monitoring data, review<br />
of policies, practices, and procedures under<br />
618(d), etc.).<br />
Indicator 11: Child Find<br />
Percent of children with<br />
parental consent to evaluate<br />
who are evaluated within<br />
the State established timeline<br />
of 60 days.<br />
Overall<br />
(3-21)<br />
Early Childhood<br />
(3-5)<br />
School Age<br />
(5-21)<br />
State<br />
Rate<br />
0.00%<br />
Indicator 12: Early Childhood Transition<br />
Percent of children referred by Part C prior to<br />
age 3, who are found eligible for Part B, and<br />
who have an IEP developed and implemented<br />
by their third birthday.<br />
Note: - - denotes not applicable<br />
State<br />
Rate<br />
99.41%<br />
99.70%<br />
98.97%<br />
State<br />
Rate<br />
State<br />
Target<br />
0.00%<br />
State<br />
Target<br />
100.00%<br />
100.00%<br />
100.00%<br />
State<br />
Target<br />
Target Met by<br />
LEA (Y/N)<br />
Y<br />
Target Met by<br />
LEA (Y/N)<br />
Y<br />
LEA<br />
Rate<br />
100.00%<br />
— —<br />
100.00%<br />
LEA<br />
Rate<br />
Target Met by<br />
LEA (Y/N)<br />
N/A<br />
Y<br />
Note: The target for Indicator 09 is to have zero percent<br />
(0%) of districts identified as having disproportionate<br />
representation as a result of inappropriate<br />
identification in eligibility.<br />
Note: The target for Indicator 10 is to have zero<br />
percent (0%) of districts identified as having<br />
disproportionate representation as a result of<br />
inappropriate identification in a disability<br />
category.<br />
Target Met by<br />
LEA (Y/N)<br />
N/A<br />
Y<br />
Target Met<br />
by LEA<br />
(Y/N)<br />
99.21% 100.00% - - N/A<br />
Y<br />
Note: * Indicates a zero reponse rate for the<br />
district.<br />
Page 4 of 5
LEA: 1703 - MOUNTAINBURG SCHOOL <strong>DISTRICT</strong><br />
Indicator 13: Secondary Transition<br />
Percent of youth with disabilities aged 16 and<br />
up with an IEP that includes coordinated,<br />
measurable, annual IEP goals and transition<br />
services that will reasonably enable the student<br />
to meet the post-secondary goals.<br />
Indicator 14: Post-School Outcomes<br />
A. Percent of youth enrolled in higher<br />
education within one year of leaving high<br />
school.<br />
State<br />
Rate<br />
State<br />
Target<br />
Note: Data for this Indicator is from the on-site monitoring of LEAs for the given year.<br />
B. Percent of youth enrolled in higher<br />
education or competitively employed<br />
within one year of leaving high school.<br />
C. Percent of youth enrolled in higher<br />
education or in some other postsecondary<br />
education or training program; or<br />
competitively employed or in some other<br />
employment within one year of leaving<br />
high school.<br />
State<br />
Rate<br />
Indicator 20: Reported Data-Timely and Accurate*<br />
District submitted<br />
required data elements<br />
on or before due dates;<br />
made revisions within<br />
the alloted reveiw<br />
periods.<br />
Accurate and Timely<br />
Data Submission<br />
Overall (3-21)<br />
Early Childhood (3-5)<br />
School Age (5-21)<br />
State<br />
Target<br />
100.00%<br />
100.00%<br />
100.00%<br />
State<br />
Target<br />
LEA<br />
Rate<br />
LEA<br />
Rate<br />
Target Met by<br />
LEA (Y/N)<br />
Target Met<br />
by LEA<br />
(Y/N)<br />
Target Met<br />
by LEA<br />
(Y/N)<br />
*Data reviewed for timely and accurate submissions included all APSCN cycle data except for personnel<br />
Note: - - denotes not applicable<br />
96.19 100.00 — — N/A<br />
14.53<br />
State<br />
Rate<br />
49.42<br />
State<br />
Rate<br />
54.07<br />
13.00<br />
State<br />
Target<br />
49.00<br />
State<br />
Target<br />
60.00<br />
Y<br />
N/A<br />
Y<br />
— —<br />
LEA<br />
Rate<br />
— —<br />
LEA<br />
Rate<br />
— —<br />
N/A<br />
Target Met<br />
by LEA<br />
(Y/N)<br />
N/A<br />
Target Met<br />
by LEA<br />
(Y/N)<br />
N/A<br />
Page 5 of 5
LEA: 1704 - MULBERRY SCHOOL <strong>DISTRICT</strong><br />
<strong>ARKANSAS</strong> <strong>SPECIAL</strong> <strong>EDUCATION</strong><br />
<strong>DISTRICT</strong> <strong>ANNUAL</strong> PERFORMANCE REPORT<br />
2010/11 School Year<br />
Publication Date: March 2012<br />
Each State must have in place a State Performance Plan (SPP) to evaluate the State's efforts to meet the requirements and<br />
purposes of the implementation of the Individuals with Disabilities Education Act (IDEA). The SPP is a six-year plan, which<br />
describes Arkansas's performance on 20 indicators. The Office of Special Education Programs in the U. S. Department of<br />
Education requires that States report annually to the public on the performance of each local education agency (LEA) on 14 of<br />
20 indicators as compared with targets established by the State in the SPP. Arkansas will report indicators 1 through 14 and<br />
20 for each LEA serving children with disabilities (CWD). Any LEA not meeting targets on compliance indicators (0% for<br />
Indicators 4B, 09 & 10 and 100% for Indicators 11, 12, 13, and 20) are non-compliant with IDEA.<br />
There are no report changes for the 2010/11 school year profile; However, it is important to recognize that: .<br />
1. Indicator 01 (Graduation) is reported a year in arrear (2009/10 graduates) and is based on a four-year cohort. This<br />
means the rate is a measure of students who entered in ninth grade and graduate in four years. The calculation is a<br />
requirement under Title I of the Elementary and Secondary Education Act (ESEA).<br />
2. Indicator 02 (Drop out) is reported a year in arrear. This means the rate is a measure of students who dropped out in<br />
the 2009/10 school year. The Indicator 02 data are aligned with the Common Core of Data (CCD) requirements for<br />
grades 7-12.<br />
3. Indicator 04A and 4B (Suspension/Expulsion) is reported a year in arrear. This means the rate is a measure of<br />
students who had out-of-school suspensions and/or expulsions totaling more than 10 days.<br />
Percent of youth<br />
with IEPs<br />
graduating from<br />
high school with a<br />
regular diploma<br />
For a complete description of all the Indicators, please visit the special education website at<br />
http://arksped.k12.ar.us/sections/policy.html<br />
Indicator 01: Graduation Rates (2009/10 school year) Indicator 02: Dropout Rates (2009/10 school year)<br />
State<br />
Rate<br />
State<br />
Target<br />
75.76% 85.00%<br />
LEA<br />
Rate<br />
66.67%<br />
Target Met<br />
by LEA<br />
(Y/N)<br />
N<br />
Percent of<br />
youth with<br />
IEPs dropping<br />
out of high<br />
school<br />
State<br />
Rate<br />
Indicator 03: Assessment on Statewide Benchmark Exam (grades 3-8, 11)<br />
A) Adequate Yearly Progress<br />
n=40<br />
Literacy<br />
Mathematics<br />
Met Disability Subgroup "n"<br />
for Reporting Purposes (Y/N)<br />
State Target for % of Districts Meeting<br />
AYP for Disability Subgroup<br />
State<br />
Target<br />
3.06% 4.20%<br />
LEA<br />
Rate<br />
5.56%<br />
% of Districts Meeting AYP<br />
for Disability Subgroup<br />
Target Met by<br />
LEA (Y/N)<br />
N<br />
Target Met by<br />
LEA(Y/N)<br />
Overall N 17.15% 6.25%<br />
NA<br />
N<br />
N<br />
Note: For a district to qualify as having a disability subgroup it must have a minimum of 40 (n=40) students with disabilities in a school building.<br />
B) Participation<br />
Participation Rate: # of<br />
CWD Tested ÷ # of CWD<br />
Enrolled in grades tested.<br />
Participation Rate: Literacy<br />
Participation Rate: Math<br />
Note: - - denotes not applicable<br />
State<br />
Rate<br />
98.78%<br />
State<br />
Target<br />
95.00%<br />
LEA<br />
Rate<br />
93.02%<br />
Target Met<br />
by LEA (Y/N)<br />
N<br />
98.61% 95.00% 93.18% N<br />
C) Performance Proficiency<br />
Percent of CWD Scoring<br />
Proficient or Above<br />
Proficiency Rate: Literacy<br />
Proficiency Rate:<br />
Mathematics<br />
16.00%<br />
16.00%<br />
State<br />
Rate<br />
31.49%<br />
44.86%<br />
State<br />
Target<br />
45.22%<br />
51.14%<br />
LEA<br />
Rate<br />
12.50%<br />
25.00%<br />
NA<br />
NA<br />
Target<br />
Met by<br />
LEA (Y/N)<br />
N<br />
N<br />
Page 1 of 5
LEA: 1704 - MULBERRY SCHOOL <strong>DISTRICT</strong><br />
Indicator 04: Out-of-School Suspensions and Expulsions (2009/10 school year)<br />
A) Suspension/Expulsion<br />
Percent difference of CWD with out-of- school suspensions and<br />
expulsions totaling greater than 10 days in a school year as<br />
compared to the same data for general education students in<br />
the district.<br />
B) Suspension/Expulsion by Race and Ethnicity<br />
Percent of districts that have: (a) a significant discrepancy, by race or<br />
ethnicity, in the rate of suspensions and expulsions of greater than 10<br />
days in a school year for children with IEPs; and (b) policies,<br />
procedures or practices that contribute to the significant discrepancy<br />
and do not comply with requirements relating to the development<br />
and implementation of IEPs, the use of positive behavioral<br />
interventions and supports, and procedural safeguards.<br />
Indicator 05: School Age (5-21) Least Restrictive Environment<br />
A) In the Regular Class 80% or more of the day<br />
Percent of CWD with<br />
IEPs receiving instruction<br />
in the regular class 80%<br />
or more of the day.<br />
State<br />
Rate<br />
State<br />
Target<br />
LEA<br />
Rate<br />
B) In the Regular Class less than 40% of the day<br />
Percent of CWD with<br />
IEPs receiving instruction<br />
in the regular class less<br />
than 60% of the day.<br />
53.87% 59.77%<br />
State<br />
Rate<br />
State<br />
Target<br />
12.42% 12.51%<br />
44.29%<br />
LEA<br />
Rate<br />
12.86%<br />
C) Other Settings outside the regular class<br />
Percent of CWD with IEPs served in<br />
public or private separate schools,<br />
residential placements, or<br />
homebound/hospital placements.<br />
State<br />
Rate<br />
State<br />
Target<br />
2.80% 2.56%<br />
Target Met<br />
by LEA (Y/N)<br />
N<br />
Target Met<br />
by LEA (Y/N)<br />
N<br />
LEA<br />
Rate<br />
11.43%<br />
Target Met<br />
by LEA(Y/N)<br />
Indicator 06: Early Childhood (3-5) Least Restrictive Environment<br />
A) Regular Early Childhood Program<br />
Percent of children (aged 3 through 5) with IEPs attending a regular<br />
early childhood program and receiving the majority of special<br />
education and related services in the regular early childhood program<br />
Allowable<br />
Difference<br />
LEA: 1704 - MULBERRY SCHOOL <strong>DISTRICT</strong><br />
Indicator 07: Preschool (3-5) Outcomes<br />
a) Percent of preschool CWD<br />
children who did not<br />
improve functioning.<br />
b) Percent of preschool CWD<br />
who improved but whose<br />
functioning remained below<br />
same age peers.<br />
c) Percent of preschool CWD<br />
who improved at a level<br />
nearer to same aged peers.<br />
d) Percent of preschool CWD<br />
who improved functioning to<br />
reach a level comparable to<br />
same age peers.<br />
e) Percent of preschool CWD<br />
children who maintain<br />
functioning at a level<br />
comparable to same aged<br />
peers.<br />
Summary<br />
Statements<br />
1) Of those preschool<br />
children who entered<br />
the preschool program<br />
below age expectations<br />
in each Outcome, the<br />
percent who<br />
substantially increased<br />
their rate of growth by<br />
the time they turned 6<br />
years of age or exited<br />
the program.<br />
2) The percent of<br />
preschool children who<br />
were functioning<br />
within age expectations<br />
in each Outcome by the<br />
time they turned 6<br />
years of age or exited<br />
A) Positive Social -Emotional<br />
Skills*<br />
State<br />
Rate<br />
A) Positive Social -<br />
Emotional Skills<br />
(Including social<br />
relationships)<br />
State<br />
Rate<br />
2.14%<br />
5.31%<br />
25.97%<br />
38.22%<br />
28.36%<br />
State<br />
Target<br />
LEA<br />
Rate<br />
LEA<br />
Rate<br />
— —<br />
— —<br />
— —<br />
— —<br />
— —<br />
Target<br />
Met by<br />
LEA(Y/N)<br />
B) Acquisition and Use of<br />
Knowledge and Skills<br />
(Including early language/<br />
communication and early literacy)<br />
B) Acquisition and Use of<br />
Knowledge and Skills **<br />
State<br />
Rate<br />
1.75%<br />
6.59%<br />
34.23%<br />
43.51%<br />
13.92%<br />
State<br />
Target<br />
LEA<br />
Rate<br />
Target<br />
Met by<br />
LEA(Y/N)<br />
C) Use of Appropriate Behaviors<br />
to Meet Their Needs<br />
State<br />
Rate<br />
State<br />
Target<br />
LEA<br />
Rate<br />
Target<br />
Met by<br />
LEA(Y/N)<br />
89.61% 90.50% — — N/A 90.31% 90.50% — — N/A 90.82% 92.50% — — N/A<br />
66.58% 69.50% — — N/A 57.43% 60.50% — — N/A 76.69% 78.50% — — N/A<br />
NOTE: * Including social relationships ** Including early language/ communication and early literacy<br />
Note: - - denotes not applicable<br />
State<br />
Rate<br />
LEA<br />
Rate<br />
— —<br />
— —<br />
— —<br />
— —<br />
— —<br />
C) Use of<br />
Appropriate<br />
Behaviors to<br />
Meet Their Needs<br />
State<br />
Rate<br />
4.51%<br />
17.34%<br />
41.72%<br />
34.97%<br />
LEA<br />
Rate<br />
1.46% — —<br />
— —<br />
— —<br />
— —<br />
— —<br />
Page 3 of 5
LEA: 1704 - MULBERRY SCHOOL <strong>DISTRICT</strong><br />
Indicator 08: Parent Involvement<br />
Percent of surveyed<br />
parents who reported<br />
school facilitated parent<br />
involvement as a means<br />
of improving services<br />
and results for children<br />
with disabilities.<br />
Early Childhood<br />
(3-5)<br />
School Age<br />
(5-21)<br />
State<br />
Rate<br />
90.47%<br />
95.05%<br />
Indicator 09: Disproportionality - Eligibility<br />
Disproportionate representation of racial<br />
and ethnic groups in special education and<br />
related services that is a result of<br />
inappropriate identification (e.g.<br />
monitoring data, review of policies,<br />
practices, and procedures under 618(d),<br />
etc.).<br />
State<br />
Rate<br />
State<br />
Target<br />
88.00%<br />
96.00%<br />
State<br />
Target<br />
0.00% 0.00%<br />
LEA<br />
Rate<br />
— —<br />
96.77%<br />
Indicator 10: Disproportionality-Child with a Disability<br />
Disproportionate representation of racial<br />
and ethnic groups in specific disability<br />
categories that is a result of inappropriate<br />
identification (e.g. monitoring data, review<br />
of policies, practices, and procedures under<br />
618(d), etc.).<br />
Indicator 11: Child Find<br />
Percent of children with<br />
parental consent to evaluate<br />
who are evaluated within<br />
the State established timeline<br />
of 60 days.<br />
Overall<br />
(3-21)<br />
Early Childhood<br />
(3-5)<br />
School Age<br />
(5-21)<br />
State<br />
Rate<br />
0.00%<br />
Indicator 12: Early Childhood Transition<br />
Percent of children referred by Part C prior to<br />
age 3, who are found eligible for Part B, and<br />
who have an IEP developed and implemented<br />
by their third birthday.<br />
Note: - - denotes not applicable<br />
State<br />
Rate<br />
99.41%<br />
99.70%<br />
98.97%<br />
State<br />
Rate<br />
State<br />
Target<br />
0.00%<br />
State<br />
Target<br />
100.00%<br />
100.00%<br />
100.00%<br />
State<br />
Target<br />
Target Met by<br />
LEA (Y/N)<br />
Y<br />
Target Met by<br />
LEA (Y/N)<br />
Y<br />
LEA<br />
Rate<br />
100.00%<br />
— —<br />
100.00%<br />
LEA<br />
Rate<br />
Target Met by<br />
LEA (Y/N)<br />
N/A<br />
Y<br />
Note: The target for Indicator 09 is to have zero percent<br />
(0%) of districts identified as having disproportionate<br />
representation as a result of inappropriate<br />
identification in eligibility.<br />
Note: The target for Indicator 10 is to have zero<br />
percent (0%) of districts identified as having<br />
disproportionate representation as a result of<br />
inappropriate identification in a disability<br />
category.<br />
Target Met by<br />
LEA (Y/N)<br />
N/A<br />
Y<br />
Target Met<br />
by LEA<br />
(Y/N)<br />
99.21% 100.00% - - N/A<br />
Y<br />
Note: * Indicates a zero reponse rate for the<br />
district.<br />
Page 4 of 5
LEA: 1704 - MULBERRY SCHOOL <strong>DISTRICT</strong><br />
Indicator 13: Secondary Transition<br />
Percent of youth with disabilities aged 16 and<br />
up with an IEP that includes coordinated,<br />
measurable, annual IEP goals and transition<br />
services that will reasonably enable the student<br />
to meet the post-secondary goals.<br />
Indicator 14: Post-School Outcomes<br />
A. Percent of youth enrolled in higher<br />
education within one year of leaving high<br />
school.<br />
State<br />
Rate<br />
State<br />
Target<br />
Note: Data for this Indicator is from the on-site monitoring of LEAs for the given year.<br />
B. Percent of youth enrolled in higher<br />
education or competitively employed<br />
within one year of leaving high school.<br />
C. Percent of youth enrolled in higher<br />
education or in some other postsecondary<br />
education or training program; or<br />
competitively employed or in some other<br />
employment within one year of leaving<br />
high school.<br />
State<br />
Rate<br />
Indicator 20: Reported Data-Timely and Accurate*<br />
District submitted<br />
required data elements<br />
on or before due dates;<br />
made revisions within<br />
the alloted reveiw<br />
periods.<br />
Accurate and Timely<br />
Data Submission<br />
Overall (3-21)<br />
Early Childhood (3-5)<br />
School Age (5-21)<br />
State<br />
Target<br />
100.00%<br />
100.00%<br />
100.00%<br />
State<br />
Target<br />
LEA<br />
Rate<br />
LEA<br />
Rate<br />
Target Met by<br />
LEA (Y/N)<br />
Target Met<br />
by LEA<br />
(Y/N)<br />
Target Met<br />
by LEA<br />
(Y/N)<br />
*Data reviewed for timely and accurate submissions included all APSCN cycle data except for personnel<br />
Note: - - denotes not applicable<br />
96.19 100.00 100.00% Y<br />
14.53<br />
State<br />
Rate<br />
49.42<br />
State<br />
Rate<br />
54.07<br />
13.00<br />
State<br />
Target<br />
49.00<br />
State<br />
Target<br />
60.00<br />
Y<br />
N/A<br />
Y<br />
— —<br />
LEA<br />
Rate<br />
— —<br />
LEA<br />
Rate<br />
— —<br />
N/A<br />
Target Met<br />
by LEA<br />
(Y/N)<br />
N/A<br />
Target Met<br />
by LEA<br />
(Y/N)<br />
N/A<br />
Page 5 of 5
LEA: 1705 - VAN BUREN SCHOOL <strong>DISTRICT</strong><br />
<strong>ARKANSAS</strong> <strong>SPECIAL</strong> <strong>EDUCATION</strong><br />
<strong>DISTRICT</strong> <strong>ANNUAL</strong> PERFORMANCE REPORT<br />
2010/11 School Year<br />
Publication Date: March 2012<br />
Each State must have in place a State Performance Plan (SPP) to evaluate the State's efforts to meet the requirements and<br />
purposes of the implementation of the Individuals with Disabilities Education Act (IDEA). The SPP is a six-year plan, which<br />
describes Arkansas's performance on 20 indicators. The Office of Special Education Programs in the U. S. Department of<br />
Education requires that States report annually to the public on the performance of each local education agency (LEA) on 14 of<br />
20 indicators as compared with targets established by the State in the SPP. Arkansas will report indicators 1 through 14 and<br />
20 for each LEA serving children with disabilities (CWD). Any LEA not meeting targets on compliance indicators (0% for<br />
Indicators 4B, 09 & 10 and 100% for Indicators 11, 12, 13, and 20) are non-compliant with IDEA.<br />
There are no report changes for the 2010/11 school year profile; However, it is important to recognize that: .<br />
1. Indicator 01 (Graduation) is reported a year in arrear (2009/10 graduates) and is based on a four-year cohort. This<br />
means the rate is a measure of students who entered in ninth grade and graduate in four years. The calculation is a<br />
requirement under Title I of the Elementary and Secondary Education Act (ESEA).<br />
2. Indicator 02 (Drop out) is reported a year in arrear. This means the rate is a measure of students who dropped out in<br />
the 2009/10 school year. The Indicator 02 data are aligned with the Common Core of Data (CCD) requirements for<br />
grades 7-12.<br />
3. Indicator 04A and 4B (Suspension/Expulsion) is reported a year in arrear. This means the rate is a measure of<br />
students who had out-of-school suspensions and/or expulsions totaling more than 10 days.<br />
Percent of youth<br />
with IEPs<br />
graduating from<br />
high school with a<br />
regular diploma<br />
For a complete description of all the Indicators, please visit the special education website at<br />
http://arksped.k12.ar.us/sections/policy.html<br />
Indicator 01: Graduation Rates (2009/10 school year) Indicator 02: Dropout Rates (2009/10 school year)<br />
State<br />
Rate<br />
State<br />
Target<br />
75.76% 85.00%<br />
LEA<br />
Rate<br />
83.33%<br />
Target Met<br />
by LEA<br />
(Y/N)<br />
N<br />
Percent of<br />
youth with<br />
IEPs dropping<br />
out of high<br />
school<br />
State<br />
Rate<br />
Indicator 03: Assessment on Statewide Benchmark Exam (grades 3-8, 11)<br />
A) Adequate Yearly Progress<br />
n=40<br />
Literacy<br />
Mathematics<br />
Met Disability Subgroup "n"<br />
for Reporting Purposes (Y/N)<br />
State Target for % of Districts Meeting<br />
AYP for Disability Subgroup<br />
State<br />
Target<br />
3.06% 4.20%<br />
LEA<br />
Rate<br />
1.90%<br />
% of Districts Meeting AYP<br />
for Disability Subgroup<br />
Target Met by<br />
LEA (Y/N)<br />
Y<br />
Target Met by<br />
LEA(Y/N)<br />
Overall N 17.15% 6.25%<br />
NA<br />
N<br />
N<br />
Note: For a district to qualify as having a disability subgroup it must have a minimum of 40 (n=40) students with disabilities in a school building.<br />
B) Participation<br />
Participation Rate: # of<br />
CWD Tested ÷ # of CWD<br />
Enrolled in grades tested.<br />
Participation Rate: Literacy<br />
Participation Rate: Math<br />
Note: - - denotes not applicable<br />
State<br />
Rate<br />
98.78%<br />
State<br />
Target<br />
95.00%<br />
LEA<br />
Rate<br />
97.63%<br />
Target Met<br />
by LEA (Y/N)<br />
98.61% 95.00% 98.01% Y<br />
Y<br />
C) Performance Proficiency<br />
Percent of CWD Scoring<br />
Proficient or Above<br />
Proficiency Rate: Literacy<br />
Proficiency Rate:<br />
Mathematics<br />
16.00%<br />
16.00%<br />
State<br />
Rate<br />
31.49%<br />
44.86%<br />
State<br />
Target<br />
45.22%<br />
51.14%<br />
LEA<br />
Rate<br />
28.43%<br />
42.27%<br />
NA<br />
NA<br />
Target<br />
Met by<br />
LEA (Y/N)<br />
N<br />
N<br />
Page 1 of 5
LEA: 1705 - VAN BUREN SCHOOL <strong>DISTRICT</strong><br />
Indicator 04: Out-of-School Suspensions and Expulsions (2009/10 school year)<br />
A) Suspension/Expulsion<br />
Percent difference of CWD with out-of- school suspensions and<br />
expulsions totaling greater than 10 days in a school year as<br />
compared to the same data for general education students in<br />
the district.<br />
B) Suspension/Expulsion by Race and Ethnicity<br />
Percent of districts that have: (a) a significant discrepancy, by race or<br />
ethnicity, in the rate of suspensions and expulsions of greater than 10<br />
days in a school year for children with IEPs; and (b) policies,<br />
procedures or practices that contribute to the significant discrepancy<br />
and do not comply with requirements relating to the development<br />
and implementation of IEPs, the use of positive behavioral<br />
interventions and supports, and procedural safeguards.<br />
Indicator 05: School Age (5-21) Least Restrictive Environment<br />
A) In the Regular Class 80% or more of the day<br />
Percent of CWD with<br />
IEPs receiving instruction<br />
in the regular class 80%<br />
or more of the day.<br />
State<br />
Rate<br />
State<br />
Target<br />
LEA<br />
Rate<br />
B) In the Regular Class less than 40% of the day<br />
Percent of CWD with<br />
IEPs receiving instruction<br />
in the regular class less<br />
than 60% of the day.<br />
53.87% 59.77%<br />
State<br />
Rate<br />
State<br />
Target<br />
12.42% 12.51%<br />
66.84%<br />
LEA<br />
Rate<br />
12.50%<br />
C) Other Settings outside the regular class<br />
Percent of CWD with IEPs served in<br />
public or private separate schools,<br />
residential placements, or<br />
homebound/hospital placements.<br />
State<br />
Rate<br />
State<br />
Target<br />
2.80% 2.56%<br />
Target Met<br />
by LEA (Y/N)<br />
Y<br />
Target Met<br />
by LEA (Y/N)<br />
Y<br />
LEA<br />
Rate<br />
0.69%<br />
Target Met<br />
by LEA(Y/N)<br />
Indicator 06: Early Childhood (3-5) Least Restrictive Environment<br />
A) Regular Early Childhood Program<br />
Percent of children (aged 3 through 5) with IEPs attending a regular<br />
early childhood program and receiving the majority of special<br />
education and related services in the regular early childhood program<br />
Allowable<br />
Difference<br />
LEA: 1705 - VAN BUREN SCHOOL <strong>DISTRICT</strong><br />
Indicator 07: Preschool (3-5) Outcomes<br />
a) Percent of preschool CWD<br />
children who did not<br />
improve functioning.<br />
b) Percent of preschool CWD<br />
who improved but whose<br />
functioning remained below<br />
same age peers.<br />
c) Percent of preschool CWD<br />
who improved at a level<br />
nearer to same aged peers.<br />
d) Percent of preschool CWD<br />
who improved functioning to<br />
reach a level comparable to<br />
same age peers.<br />
e) Percent of preschool CWD<br />
children who maintain<br />
functioning at a level<br />
comparable to same aged<br />
peers.<br />
Summary<br />
Statements<br />
1) Of those preschool<br />
children who entered<br />
the preschool program<br />
below age expectations<br />
in each Outcome, the<br />
percent who<br />
substantially increased<br />
their rate of growth by<br />
the time they turned 6<br />
years of age or exited<br />
the program.<br />
2) The percent of<br />
preschool children who<br />
were functioning<br />
within age expectations<br />
in each Outcome by the<br />
time they turned 6<br />
years of age or exited<br />
A) Positive Social -Emotional<br />
Skills*<br />
State<br />
Rate<br />
A) Positive Social -<br />
Emotional Skills<br />
(Including social<br />
relationships)<br />
State<br />
Rate<br />
2.14%<br />
5.31%<br />
25.97%<br />
38.22%<br />
28.36%<br />
State<br />
Target<br />
LEA<br />
Rate<br />
LEA<br />
Rate<br />
3.03%<br />
— —<br />
9.09%<br />
18.18%<br />
69.70%<br />
Target<br />
Met by<br />
LEA(Y/N)<br />
B) Acquisition and Use of<br />
Knowledge and Skills<br />
(Including early language/<br />
communication and early literacy)<br />
B) Acquisition and Use of<br />
Knowledge and Skills **<br />
State<br />
Rate<br />
1.75%<br />
6.59%<br />
34.23%<br />
43.51%<br />
13.92%<br />
State<br />
Target<br />
LEA<br />
Rate<br />
Target<br />
Met by<br />
LEA(Y/N)<br />
C) Use of Appropriate Behaviors<br />
to Meet Their Needs<br />
State<br />
Rate<br />
State<br />
Target<br />
LEA<br />
Rate<br />
Target<br />
Met by<br />
LEA(Y/N)<br />
89.61% 90.50% 90.00% N 90.31% 90.50% 100.00% Y 90.82% 92.50% 100.00% Y<br />
66.58% 69.50% 87.88% Y 57.43% 60.50% 90.91% Y 76.69% 78.50% 90.91% Y<br />
NOTE: * Including social relationships ** Including early language/ communication and early literacy<br />
Note: - - denotes not applicable<br />
State<br />
Rate<br />
LEA<br />
Rate<br />
— —<br />
— —<br />
9.09%<br />
27.27%<br />
63.64%<br />
C) Use of<br />
Appropriate<br />
Behaviors to<br />
Meet Their Needs<br />
State<br />
Rate<br />
4.51%<br />
17.34%<br />
41.72%<br />
34.97%<br />
LEA<br />
Rate<br />
1.46% — —<br />
— —<br />
9.09%<br />
21.21%<br />
69.70%<br />
Page 3 of 5
LEA: 1705 - VAN BUREN SCHOOL <strong>DISTRICT</strong><br />
Indicator 08: Parent Involvement<br />
Percent of surveyed<br />
parents who reported<br />
school facilitated parent<br />
involvement as a means<br />
of improving services<br />
and results for children<br />
with disabilities.<br />
Early Childhood<br />
(3-5)<br />
School Age<br />
(5-21)<br />
State<br />
Rate<br />
90.47%<br />
95.05%<br />
Indicator 09: Disproportionality - Eligibility<br />
Disproportionate representation of racial<br />
and ethnic groups in special education and<br />
related services that is a result of<br />
inappropriate identification (e.g.<br />
monitoring data, review of policies,<br />
practices, and procedures under 618(d),<br />
etc.).<br />
State<br />
Rate<br />
State<br />
Target<br />
88.00%<br />
96.00%<br />
State<br />
Target<br />
0.00% 0.00%<br />
LEA<br />
Rate<br />
100.00%<br />
98.75%<br />
Indicator 10: Disproportionality-Child with a Disability<br />
Disproportionate representation of racial<br />
and ethnic groups in specific disability<br />
categories that is a result of inappropriate<br />
identification (e.g. monitoring data, review<br />
of policies, practices, and procedures under<br />
618(d), etc.).<br />
Indicator 11: Child Find<br />
Percent of children with<br />
parental consent to evaluate<br />
who are evaluated within<br />
the State established timeline<br />
of 60 days.<br />
Overall<br />
(3-21)<br />
Early Childhood<br />
(3-5)<br />
School Age<br />
(5-21)<br />
State<br />
Rate<br />
0.00%<br />
Indicator 12: Early Childhood Transition<br />
Percent of children referred by Part C prior to<br />
age 3, who are found eligible for Part B, and<br />
who have an IEP developed and implemented<br />
by their third birthday.<br />
Note: - - denotes not applicable<br />
State<br />
Rate<br />
99.41%<br />
99.70%<br />
98.97%<br />
State<br />
Rate<br />
State<br />
Target<br />
0.00%<br />
State<br />
Target<br />
100.00%<br />
100.00%<br />
100.00%<br />
State<br />
Target<br />
Target Met by<br />
LEA (Y/N)<br />
Y<br />
Target Met by<br />
LEA (Y/N)<br />
Y<br />
LEA<br />
Rate<br />
100.00%<br />
100.00%<br />
100.00%<br />
LEA<br />
Rate<br />
Target Met by<br />
LEA (Y/N)<br />
Y<br />
Y<br />
Note: The target for Indicator 09 is to have zero percent<br />
(0%) of districts identified as having disproportionate<br />
representation as a result of inappropriate<br />
identification in eligibility.<br />
Note: The target for Indicator 10 is to have zero<br />
percent (0%) of districts identified as having<br />
disproportionate representation as a result of<br />
inappropriate identification in a disability<br />
category.<br />
Target Met by<br />
LEA (Y/N)<br />
Y<br />
Y<br />
Target Met<br />
by LEA<br />
(Y/N)<br />
99.21% 100.00% - - N/A<br />
Y<br />
Note: * Indicates a zero reponse rate for the<br />
district.<br />
Page 4 of 5
LEA: 1705 - VAN BUREN SCHOOL <strong>DISTRICT</strong><br />
Indicator 13: Secondary Transition<br />
Percent of youth with disabilities aged 16 and<br />
up with an IEP that includes coordinated,<br />
measurable, annual IEP goals and transition<br />
services that will reasonably enable the student<br />
to meet the post-secondary goals.<br />
Indicator 14: Post-School Outcomes<br />
A. Percent of youth enrolled in higher<br />
education within one year of leaving high<br />
school.<br />
State<br />
Rate<br />
State<br />
Target<br />
Note: Data for this Indicator is from the on-site monitoring of LEAs for the given year.<br />
B. Percent of youth enrolled in higher<br />
education or competitively employed<br />
within one year of leaving high school.<br />
C. Percent of youth enrolled in higher<br />
education or in some other postsecondary<br />
education or training program; or<br />
competitively employed or in some other<br />
employment within one year of leaving<br />
high school.<br />
State<br />
Rate<br />
Indicator 20: Reported Data-Timely and Accurate*<br />
District submitted<br />
required data elements<br />
on or before due dates;<br />
made revisions within<br />
the alloted reveiw<br />
periods.<br />
Accurate and Timely<br />
Data Submission<br />
Overall (3-21)<br />
Early Childhood (3-5)<br />
School Age (5-21)<br />
State<br />
Target<br />
100.00%<br />
100.00%<br />
100.00%<br />
State<br />
Target<br />
LEA<br />
Rate<br />
LEA<br />
Rate<br />
Target Met by<br />
LEA (Y/N)<br />
Target Met<br />
by LEA<br />
(Y/N)<br />
Target Met<br />
by LEA<br />
(Y/N)<br />
*Data reviewed for timely and accurate submissions included all APSCN cycle data except for personnel<br />
Note: - - denotes not applicable<br />
96.19 100.00 72.73% N<br />
14.53<br />
State<br />
Rate<br />
49.42<br />
State<br />
Rate<br />
54.07<br />
13.00<br />
State<br />
Target<br />
49.00<br />
State<br />
Target<br />
60.00<br />
Y<br />
Y<br />
Y<br />
— —<br />
LEA<br />
Rate<br />
— —<br />
LEA<br />
Rate<br />
— —<br />
N/A<br />
Target Met<br />
by LEA<br />
(Y/N)<br />
N/A<br />
Target Met<br />
by LEA<br />
(Y/N)<br />
N/A<br />
Page 5 of 5
LEA: 1802 - EARLE SCHOOL <strong>DISTRICT</strong><br />
<strong>ARKANSAS</strong> <strong>SPECIAL</strong> <strong>EDUCATION</strong><br />
<strong>DISTRICT</strong> <strong>ANNUAL</strong> PERFORMANCE REPORT<br />
2010/11 School Year<br />
Publication Date: March 2012<br />
Each State must have in place a State Performance Plan (SPP) to evaluate the State's efforts to meet the requirements and<br />
purposes of the implementation of the Individuals with Disabilities Education Act (IDEA). The SPP is a six-year plan, which<br />
describes Arkansas's performance on 20 indicators. The Office of Special Education Programs in the U. S. Department of<br />
Education requires that States report annually to the public on the performance of each local education agency (LEA) on 14 of<br />
20 indicators as compared with targets established by the State in the SPP. Arkansas will report indicators 1 through 14 and<br />
20 for each LEA serving children with disabilities (CWD). Any LEA not meeting targets on compliance indicators (0% for<br />
Indicators 4B, 09 & 10 and 100% for Indicators 11, 12, 13, and 20) are non-compliant with IDEA.<br />
There are no report changes for the 2010/11 school year profile; However, it is important to recognize that: .<br />
1. Indicator 01 (Graduation) is reported a year in arrear (2009/10 graduates) and is based on a four-year cohort. This<br />
means the rate is a measure of students who entered in ninth grade and graduate in four years. The calculation is a<br />
requirement under Title I of the Elementary and Secondary Education Act (ESEA).<br />
2. Indicator 02 (Drop out) is reported a year in arrear. This means the rate is a measure of students who dropped out in<br />
the 2009/10 school year. The Indicator 02 data are aligned with the Common Core of Data (CCD) requirements for<br />
grades 7-12.<br />
3. Indicator 04A and 4B (Suspension/Expulsion) is reported a year in arrear. This means the rate is a measure of<br />
students who had out-of-school suspensions and/or expulsions totaling more than 10 days.<br />
Percent of youth<br />
with IEPs<br />
graduating from<br />
high school with a<br />
regular diploma<br />
For a complete description of all the Indicators, please visit the special education website at<br />
http://arksped.k12.ar.us/sections/policy.html<br />
Indicator 01: Graduation Rates (2009/10 school year) Indicator 02: Dropout Rates (2009/10 school year)<br />
State<br />
Rate<br />
State<br />
Target<br />
75.76% 85.00%<br />
LEA<br />
Rate<br />
62.50%<br />
Target Met<br />
by LEA<br />
(Y/N)<br />
N<br />
Percent of<br />
youth with<br />
IEPs dropping<br />
out of high<br />
school<br />
State<br />
Rate<br />
Indicator 03: Assessment on Statewide Benchmark Exam (grades 3-8, 11)<br />
A) Adequate Yearly Progress<br />
n=40<br />
Literacy<br />
Mathematics<br />
Met Disability Subgroup "n"<br />
for Reporting Purposes (Y/N)<br />
State Target for % of Districts Meeting<br />
AYP for Disability Subgroup<br />
State<br />
Target<br />
3.06% 4.20%<br />
LEA<br />
Rate<br />
9.68%<br />
% of Districts Meeting AYP<br />
for Disability Subgroup<br />
Target Met by<br />
LEA (Y/N)<br />
N<br />
Target Met by<br />
LEA(Y/N)<br />
Overall N 17.15% 6.25%<br />
NA<br />
N<br />
N<br />
Note: For a district to qualify as having a disability subgroup it must have a minimum of 40 (n=40) students with disabilities in a school building.<br />
B) Participation<br />
Participation Rate: # of<br />
CWD Tested ÷ # of CWD<br />
Enrolled in grades tested.<br />
Participation Rate: Literacy<br />
Participation Rate: Math<br />
Note: - - denotes not applicable<br />
State<br />
Rate<br />
98.78%<br />
State<br />
Target<br />
95.00%<br />
LEA<br />
Rate<br />
97.96%<br />
Target Met<br />
by LEA (Y/N)<br />
98.61% 95.00% 97.62% Y<br />
Y<br />
C) Performance Proficiency<br />
Percent of CWD Scoring<br />
Proficient or Above<br />
Proficiency Rate: Literacy<br />
Proficiency Rate:<br />
Mathematics<br />
16.00%<br />
16.00%<br />
State<br />
Rate<br />
31.49%<br />
44.86%<br />
State<br />
Target<br />
45.22%<br />
51.14%<br />
LEA<br />
Rate<br />
13.64%<br />
10.26%<br />
NA<br />
NA<br />
Target<br />
Met by<br />
LEA (Y/N)<br />
N<br />
N<br />
Page 1 of 5
LEA: 1802 - EARLE SCHOOL <strong>DISTRICT</strong><br />
Indicator 04: Out-of-School Suspensions and Expulsions (2009/10 school year)<br />
A) Suspension/Expulsion<br />
Percent difference of CWD with out-of- school suspensions and<br />
expulsions totaling greater than 10 days in a school year as<br />
compared to the same data for general education students in<br />
the district.<br />
B) Suspension/Expulsion by Race and Ethnicity<br />
Percent of districts that have: (a) a significant discrepancy, by race or<br />
ethnicity, in the rate of suspensions and expulsions of greater than 10<br />
days in a school year for children with IEPs; and (b) policies,<br />
procedures or practices that contribute to the significant discrepancy<br />
and do not comply with requirements relating to the development<br />
and implementation of IEPs, the use of positive behavioral<br />
interventions and supports, and procedural safeguards.<br />
Indicator 05: School Age (5-21) Least Restrictive Environment<br />
A) In the Regular Class 80% or more of the day<br />
Percent of CWD with<br />
IEPs receiving instruction<br />
in the regular class 80%<br />
or more of the day.<br />
State<br />
Rate<br />
State<br />
Target<br />
LEA<br />
Rate<br />
B) In the Regular Class less than 40% of the day<br />
Percent of CWD with<br />
IEPs receiving instruction<br />
in the regular class less<br />
than 60% of the day.<br />
53.87% 59.77%<br />
State<br />
Rate<br />
State<br />
Target<br />
12.42% 12.51%<br />
24.71%<br />
LEA<br />
Rate<br />
5.88%<br />
C) Other Settings outside the regular class<br />
Percent of CWD with IEPs served in<br />
public or private separate schools,<br />
residential placements, or<br />
homebound/hospital placements.<br />
State<br />
Rate<br />
State<br />
Target<br />
2.80% 2.56%<br />
Target Met<br />
by LEA (Y/N)<br />
N<br />
Target Met<br />
by LEA (Y/N)<br />
Y<br />
LEA<br />
Rate<br />
0.00%<br />
Target Met<br />
by LEA(Y/N)<br />
Indicator 06: Early Childhood (3-5) Least Restrictive Environment<br />
A) Regular Early Childhood Program<br />
Percent of children (aged 3 through 5) with IEPs attending a regular<br />
early childhood program and receiving the majority of special<br />
education and related services in the regular early childhood program<br />
Allowable<br />
Difference<br />
LEA: 1802 - EARLE SCHOOL <strong>DISTRICT</strong><br />
Indicator 07: Preschool (3-5) Outcomes<br />
a) Percent of preschool CWD<br />
children who did not<br />
improve functioning.<br />
b) Percent of preschool CWD<br />
who improved but whose<br />
functioning remained below<br />
same age peers.<br />
c) Percent of preschool CWD<br />
who improved at a level<br />
nearer to same aged peers.<br />
d) Percent of preschool CWD<br />
who improved functioning to<br />
reach a level comparable to<br />
same age peers.<br />
e) Percent of preschool CWD<br />
children who maintain<br />
functioning at a level<br />
comparable to same aged<br />
peers.<br />
Summary<br />
Statements<br />
1) Of those preschool<br />
children who entered<br />
the preschool program<br />
below age expectations<br />
in each Outcome, the<br />
percent who<br />
substantially increased<br />
their rate of growth by<br />
the time they turned 6<br />
years of age or exited<br />
the program.<br />
2) The percent of<br />
preschool children who<br />
were functioning<br />
within age expectations<br />
in each Outcome by the<br />
time they turned 6<br />
years of age or exited<br />
A) Positive Social -Emotional<br />
Skills*<br />
State<br />
Rate<br />
A) Positive Social -<br />
Emotional Skills<br />
(Including social<br />
relationships)<br />
State<br />
Rate<br />
2.14%<br />
5.31%<br />
25.97%<br />
38.22%<br />
28.36%<br />
State<br />
Target<br />
LEA<br />
Rate<br />
LEA<br />
Rate<br />
— —<br />
— —<br />
— —<br />
— —<br />
— —<br />
Target<br />
Met by<br />
LEA(Y/N)<br />
B) Acquisition and Use of<br />
Knowledge and Skills<br />
(Including early language/<br />
communication and early literacy)<br />
B) Acquisition and Use of<br />
Knowledge and Skills **<br />
State<br />
Rate<br />
1.75%<br />
6.59%<br />
34.23%<br />
43.51%<br />
13.92%<br />
State<br />
Target<br />
LEA<br />
Rate<br />
Target<br />
Met by<br />
LEA(Y/N)<br />
C) Use of Appropriate Behaviors<br />
to Meet Their Needs<br />
State<br />
Rate<br />
State<br />
Target<br />
LEA<br />
Rate<br />
Target<br />
Met by<br />
LEA(Y/N)<br />
89.61% 90.50% — — N/A 90.31% 90.50% — — N/A 90.82% 92.50% — — N/A<br />
66.58% 69.50% — — N/A 57.43% 60.50% — — N/A 76.69% 78.50% — — N/A<br />
NOTE: * Including social relationships ** Including early language/ communication and early literacy<br />
Note: - - denotes not applicable<br />
State<br />
Rate<br />
LEA<br />
Rate<br />
— —<br />
— —<br />
— —<br />
— —<br />
— —<br />
C) Use of<br />
Appropriate<br />
Behaviors to<br />
Meet Their Needs<br />
State<br />
Rate<br />
4.51%<br />
17.34%<br />
41.72%<br />
34.97%<br />
LEA<br />
Rate<br />
1.46% — —<br />
— —<br />
— —<br />
— —<br />
— —<br />
Page 3 of 5
LEA: 1802 - EARLE SCHOOL <strong>DISTRICT</strong><br />
Indicator 08: Parent Involvement<br />
Percent of surveyed<br />
parents who reported<br />
school facilitated parent<br />
involvement as a means<br />
of improving services<br />
and results for children<br />
with disabilities.<br />
Early Childhood<br />
(3-5)<br />
School Age<br />
(5-21)<br />
State<br />
Rate<br />
90.47%<br />
95.05%<br />
Indicator 09: Disproportionality - Eligibility<br />
Disproportionate representation of racial<br />
and ethnic groups in special education and<br />
related services that is a result of<br />
inappropriate identification (e.g.<br />
monitoring data, review of policies,<br />
practices, and procedures under 618(d),<br />
etc.).<br />
State<br />
Rate<br />
State<br />
Target<br />
88.00%<br />
96.00%<br />
State<br />
Target<br />
0.00% 0.00%<br />
LEA<br />
Rate<br />
— —<br />
— —<br />
Indicator 10: Disproportionality-Child with a Disability<br />
Disproportionate representation of racial<br />
and ethnic groups in specific disability<br />
categories that is a result of inappropriate<br />
identification (e.g. monitoring data, review<br />
of policies, practices, and procedures under<br />
618(d), etc.).<br />
Indicator 11: Child Find<br />
Percent of children with<br />
parental consent to evaluate<br />
who are evaluated within<br />
the State established timeline<br />
of 60 days.<br />
Overall<br />
(3-21)<br />
Early Childhood<br />
(3-5)<br />
School Age<br />
(5-21)<br />
State<br />
Rate<br />
0.00%<br />
Indicator 12: Early Childhood Transition<br />
Percent of children referred by Part C prior to<br />
age 3, who are found eligible for Part B, and<br />
who have an IEP developed and implemented<br />
by their third birthday.<br />
Note: - - denotes not applicable<br />
State<br />
Rate<br />
99.41%<br />
99.70%<br />
98.97%<br />
State<br />
Rate<br />
State<br />
Target<br />
0.00%<br />
State<br />
Target<br />
100.00%<br />
100.00%<br />
100.00%<br />
State<br />
Target<br />
Target Met by<br />
LEA (Y/N)<br />
Y<br />
Target Met by<br />
LEA (Y/N)<br />
Y<br />
LEA<br />
Rate<br />
100.00%<br />
— —<br />
100.00%<br />
LEA<br />
Rate<br />
Target Met by<br />
LEA (Y/N)<br />
N/A<br />
N<br />
Note: The target for Indicator 09 is to have zero percent<br />
(0%) of districts identified as having disproportionate<br />
representation as a result of inappropriate<br />
identification in eligibility.<br />
Note: The target for Indicator 10 is to have zero<br />
percent (0%) of districts identified as having<br />
disproportionate representation as a result of<br />
inappropriate identification in a disability<br />
category.<br />
Target Met by<br />
LEA (Y/N)<br />
N/A<br />
Y<br />
Target Met<br />
by LEA<br />
(Y/N)<br />
99.21% 100.00% - - N/A<br />
Y<br />
Note: * Indicates a zero reponse rate for the<br />
district.<br />
Page 4 of 5
LEA: 1802 - EARLE SCHOOL <strong>DISTRICT</strong><br />
Indicator 13: Secondary Transition<br />
Percent of youth with disabilities aged 16 and<br />
up with an IEP that includes coordinated,<br />
measurable, annual IEP goals and transition<br />
services that will reasonably enable the student<br />
to meet the post-secondary goals.<br />
Indicator 14: Post-School Outcomes<br />
A. Percent of youth enrolled in higher<br />
education within one year of leaving high<br />
school.<br />
State<br />
Rate<br />
State<br />
Target<br />
Note: Data for this Indicator is from the on-site monitoring of LEAs for the given year.<br />
B. Percent of youth enrolled in higher<br />
education or competitively employed<br />
within one year of leaving high school.<br />
C. Percent of youth enrolled in higher<br />
education or in some other postsecondary<br />
education or training program; or<br />
competitively employed or in some other<br />
employment within one year of leaving<br />
high school.<br />
State<br />
Rate<br />
Indicator 20: Reported Data-Timely and Accurate*<br />
District submitted<br />
required data elements<br />
on or before due dates;<br />
made revisions within<br />
the alloted reveiw<br />
periods.<br />
Accurate and Timely<br />
Data Submission<br />
Overall (3-21)<br />
Early Childhood (3-5)<br />
School Age (5-21)<br />
State<br />
Target<br />
100.00%<br />
100.00%<br />
100.00%<br />
State<br />
Target<br />
LEA<br />
Rate<br />
LEA<br />
Rate<br />
Target Met by<br />
LEA (Y/N)<br />
Target Met<br />
by LEA<br />
(Y/N)<br />
Target Met<br />
by LEA<br />
(Y/N)<br />
*Data reviewed for timely and accurate submissions included all APSCN cycle data except for personnel<br />
Note: - - denotes not applicable<br />
96.19 100.00 — — N/A<br />
14.53<br />
State<br />
Rate<br />
49.42<br />
State<br />
Rate<br />
54.07<br />
13.00<br />
State<br />
Target<br />
49.00<br />
State<br />
Target<br />
60.00<br />
Y<br />
N/A<br />
Y<br />
— —<br />
LEA<br />
Rate<br />
— —<br />
LEA<br />
Rate<br />
— —<br />
N/A<br />
Target Met<br />
by LEA<br />
(Y/N)<br />
N/A<br />
Target Met<br />
by LEA<br />
(Y/N)<br />
N/A<br />
Page 5 of 5
<strong>ARKANSAS</strong> <strong>SPECIAL</strong> <strong>EDUCATION</strong><br />
<strong>DISTRICT</strong> <strong>ANNUAL</strong> PERFORMANCE REPORT<br />
2010/11 School Year<br />
Publication Date: March 2012<br />
Each State must have in place a State Performance Plan (SPP) to evaluate the State's efforts to meet the requirements and<br />
purposes of the implementation of the Individuals with Disabilities Education Act (IDEA). The SPP is a six-year plan, which<br />
describes Arkansas's performance on 20 indicators. The Office of Special Education Programs in the U. S. Department of<br />
Education requires that States report annually to the public on the performance of each local education agency (LEA) on 14 of<br />
20 indicators as compared with targets established by the State in the SPP. Arkansas will report indicators 1 through 14 and<br />
20 for each LEA serving children with disabilities (CWD). Any LEA not meeting targets on compliance indicators (0% for<br />
Indicators 4B, 09 & 10 and 100% for Indicators 11, 12, 13, and 20) are non-compliant with IDEA.<br />
There are no report changes for the 2010/11 school year profile; However, it is important to recognize that: .<br />
1. Indicator 01 (Graduation) is reported a year in arrear (2009/10 graduates) and is based on a four-year cohort. This<br />
means the rate is a measure of students who entered in ninth grade and graduate in four years. The calculation is a<br />
requirement under Title I of the Elementary and Secondary Education Act (ESEA).<br />
2. Indicator 02 (Drop out) is reported a year in arrear. This means the rate is a measure of students who dropped out in<br />
the 2009/10 school year. The Indicator 02 data are aligned with the Common Core of Data (CCD) requirements for<br />
grades 7-12.<br />
3. Indicator 04A and 4B (Suspension/Expulsion) is reported a year in arrear. This means the rate is a measure of<br />
students who had out-of-school suspensions and/or expulsions totaling more than 10 days.<br />
For a complete description of all the Indicators, please visit the special education website at<br />
http://arksped.k12.ar.us/sections/policy.html<br />
LEA: 1803 - WEST MEMPHIS SCHOOL <strong>DISTRICT</strong><br />
Indicator 01: Graduation Rates (2009/10 school year) Indicator 02: Dropout Rates (2009/10 school year)<br />
Percent of youth<br />
with IEPs<br />
graduating from<br />
high school with a<br />
regular diploma<br />
State<br />
Rate<br />
State<br />
Target<br />
75.76% 85.00%<br />
LEA<br />
Rate<br />
56.94%<br />
Target Met<br />
by LEA<br />
(Y/N)<br />
N<br />
Percent of<br />
youth with<br />
IEPs dropping<br />
out of high<br />
school<br />
State<br />
Rate<br />
Indicator 03: Assessment on Statewide Benchmark Exam (grades 3-8, 11)<br />
A) Adequate Yearly Progress<br />
n=40<br />
Literacy<br />
Mathematics<br />
Met Disability Subgroup "n"<br />
for Reporting Purposes (Y/N)<br />
State Target for % of Districts Meeting<br />
AYP for Disability Subgroup<br />
State<br />
Target<br />
3.06% 4.20%<br />
LEA<br />
Rate<br />
7.56%<br />
% of Districts Meeting AYP<br />
for Disability Subgroup<br />
Target Met by<br />
LEA (Y/N)<br />
N<br />
Target Met by<br />
LEA(Y/N)<br />
Overall N 17.15% 6.25%<br />
NA<br />
N<br />
N<br />
Note: For a district to qualify as having a disability subgroup it must have a minimum of 40 (n=40) students with disabilities in a school building.<br />
B) Participation<br />
Participation Rate: # of<br />
CWD Tested ÷ # of CWD<br />
Enrolled in grades tested.<br />
Participation Rate: Literacy<br />
Participation Rate: Math<br />
Note: - - denotes not applicable<br />
State<br />
Rate<br />
98.78%<br />
State<br />
Target<br />
95.00%<br />
LEA<br />
Rate<br />
96.11%<br />
Target Met<br />
by LEA (Y/N)<br />
98.61% 95.00% 95.80% Y<br />
Y<br />
C) Performance Proficiency<br />
Percent of CWD Scoring<br />
Proficient or Above<br />
Proficiency Rate: Literacy<br />
Proficiency Rate:<br />
Mathematics<br />
16.00%<br />
16.00%<br />
State<br />
Rate<br />
31.49%<br />
44.86%<br />
State<br />
Target<br />
45.22%<br />
51.14%<br />
LEA<br />
Rate<br />
35.33%<br />
41.18%<br />
NA<br />
NA<br />
Target<br />
Met by<br />
LEA (Y/N)<br />
N<br />
N<br />
Page 1 of 5
LEA: 1803 - WEST MEMPHIS SCHOOL <strong>DISTRICT</strong><br />
Indicator 04: Out-of-School Suspensions and Expulsions (2009/10 school year)<br />
A) Suspension/Expulsion<br />
Percent difference of CWD with out-of- school suspensions and<br />
expulsions totaling greater than 10 days in a school year as<br />
compared to the same data for general education students in<br />
the district.<br />
B) Suspension/Expulsion by Race and Ethnicity<br />
Percent of districts that have: (a) a significant discrepancy, by race or<br />
ethnicity, in the rate of suspensions and expulsions of greater than 10<br />
days in a school year for children with IEPs; and (b) policies,<br />
procedures or practices that contribute to the significant discrepancy<br />
and do not comply with requirements relating to the development<br />
and implementation of IEPs, the use of positive behavioral<br />
interventions and supports, and procedural safeguards.<br />
Indicator 05: School Age (5-21) Least Restrictive Environment<br />
A) In the Regular Class 80% or more of the day<br />
Percent of CWD with<br />
IEPs receiving instruction<br />
in the regular class 80%<br />
or more of the day.<br />
State<br />
Rate<br />
State<br />
Target<br />
LEA<br />
Rate<br />
B) In the Regular Class less than 40% of the day<br />
Percent of CWD with<br />
IEPs receiving instruction<br />
in the regular class less<br />
than 60% of the day.<br />
53.87% 59.77%<br />
State<br />
Rate<br />
State<br />
Target<br />
12.42% 12.51%<br />
42.96%<br />
LEA<br />
Rate<br />
15.57%<br />
C) Other Settings outside the regular class<br />
Percent of CWD with IEPs served in<br />
public or private separate schools,<br />
residential placements, or<br />
homebound/hospital placements.<br />
State<br />
Rate<br />
State<br />
Target<br />
2.80% 2.56%<br />
Target Met<br />
by LEA (Y/N)<br />
N<br />
Target Met<br />
by LEA (Y/N)<br />
N<br />
LEA<br />
Rate<br />
0.15%<br />
Target Met<br />
by LEA(Y/N)<br />
Indicator 06: Early Childhood (3-5) Least Restrictive Environment<br />
A) Regular Early Childhood Program<br />
Percent of children (aged 3 through 5) with IEPs attending a regular<br />
early childhood program and receiving the majority of special<br />
education and related services in the regular early childhood program<br />
Allowable<br />
Difference<br />
LEA: 1803 - WEST MEMPHIS SCHOOL <strong>DISTRICT</strong><br />
Indicator 07: Preschool (3-5) Outcomes<br />
a) Percent of preschool CWD<br />
children who did not<br />
improve functioning.<br />
b) Percent of preschool CWD<br />
who improved but whose<br />
functioning remained below<br />
same age peers.<br />
c) Percent of preschool CWD<br />
who improved at a level<br />
nearer to same aged peers.<br />
d) Percent of preschool CWD<br />
who improved functioning to<br />
reach a level comparable to<br />
same age peers.<br />
e) Percent of preschool CWD<br />
children who maintain<br />
functioning at a level<br />
comparable to same aged<br />
peers.<br />
Summary<br />
Statements<br />
1) Of those preschool<br />
children who entered<br />
the preschool program<br />
below age expectations<br />
in each Outcome, the<br />
percent who<br />
substantially increased<br />
their rate of growth by<br />
the time they turned 6<br />
years of age or exited<br />
the program.<br />
2) The percent of<br />
preschool children who<br />
were functioning<br />
within age expectations<br />
in each Outcome by the<br />
time they turned 6<br />
years of age or exited<br />
A) Positive Social -Emotional<br />
Skills*<br />
State<br />
Rate<br />
A) Positive Social -<br />
Emotional Skills<br />
(Including social<br />
relationships)<br />
State<br />
Rate<br />
2.14%<br />
5.31%<br />
25.97%<br />
38.22%<br />
28.36%<br />
State<br />
Target<br />
LEA<br />
Rate<br />
LEA<br />
Rate<br />
— —<br />
— —<br />
— —<br />
— —<br />
— —<br />
Target<br />
Met by<br />
LEA(Y/N)<br />
B) Acquisition and Use of<br />
Knowledge and Skills<br />
(Including early language/<br />
communication and early literacy)<br />
B) Acquisition and Use of<br />
Knowledge and Skills **<br />
State<br />
Rate<br />
1.75%<br />
6.59%<br />
34.23%<br />
43.51%<br />
13.92%<br />
State<br />
Target<br />
LEA<br />
Rate<br />
Target<br />
Met by<br />
LEA(Y/N)<br />
C) Use of Appropriate Behaviors<br />
to Meet Their Needs<br />
State<br />
Rate<br />
State<br />
Target<br />
LEA<br />
Rate<br />
Target<br />
Met by<br />
LEA(Y/N)<br />
89.61% 90.50% — — N/A 90.31% 90.50% — — N/A 90.82% 92.50% — — N/A<br />
66.58% 69.50% — — N/A 57.43% 60.50% — — N/A 76.69% 78.50% — — N/A<br />
NOTE: * Including social relationships ** Including early language/ communication and early literacy<br />
Note: - - denotes not applicable<br />
State<br />
Rate<br />
LEA<br />
Rate<br />
— —<br />
— —<br />
— —<br />
— —<br />
— —<br />
C) Use of<br />
Appropriate<br />
Behaviors to<br />
Meet Their Needs<br />
State<br />
Rate<br />
4.51%<br />
17.34%<br />
41.72%<br />
34.97%<br />
LEA<br />
Rate<br />
1.46% — —<br />
— —<br />
— —<br />
— —<br />
— —<br />
Page 3 of 5
LEA: 1803 - WEST MEMPHIS SCHOOL <strong>DISTRICT</strong><br />
Indicator 08: Parent Involvement<br />
Percent of surveyed<br />
parents who reported<br />
school facilitated parent<br />
involvement as a means<br />
of improving services<br />
and results for children<br />
with disabilities.<br />
Early Childhood<br />
(3-5)<br />
School Age<br />
(5-21)<br />
State<br />
Rate<br />
90.47%<br />
95.05%<br />
Indicator 09: Disproportionality - Eligibility<br />
Disproportionate representation of racial<br />
and ethnic groups in special education and<br />
related services that is a result of<br />
inappropriate identification (e.g.<br />
monitoring data, review of policies,<br />
practices, and procedures under 618(d),<br />
etc.).<br />
State<br />
Rate<br />
State<br />
Target<br />
88.00%<br />
96.00%<br />
State<br />
Target<br />
0.00% 0.00%<br />
LEA<br />
Rate<br />
— —<br />
95.89%<br />
Indicator 10: Disproportionality-Child with a Disability<br />
Disproportionate representation of racial<br />
and ethnic groups in specific disability<br />
categories that is a result of inappropriate<br />
identification (e.g. monitoring data, review<br />
of policies, practices, and procedures under<br />
618(d), etc.).<br />
Indicator 11: Child Find<br />
Percent of children with<br />
parental consent to evaluate<br />
who are evaluated within<br />
the State established timeline<br />
of 60 days.<br />
Overall<br />
(3-21)<br />
Early Childhood<br />
(3-5)<br />
School Age<br />
(5-21)<br />
State<br />
Rate<br />
0.00%<br />
Indicator 12: Early Childhood Transition<br />
Percent of children referred by Part C prior to<br />
age 3, who are found eligible for Part B, and<br />
who have an IEP developed and implemented<br />
by their third birthday.<br />
Note: - - denotes not applicable<br />
State<br />
Rate<br />
99.41%<br />
99.70%<br />
98.97%<br />
State<br />
Rate<br />
State<br />
Target<br />
0.00%<br />
State<br />
Target<br />
100.00%<br />
100.00%<br />
100.00%<br />
State<br />
Target<br />
Target Met by<br />
LEA (Y/N)<br />
Y<br />
Target Met by<br />
LEA (Y/N)<br />
Y<br />
LEA<br />
Rate<br />
61.90%<br />
— —<br />
61.90%<br />
LEA<br />
Rate<br />
Target Met by<br />
LEA (Y/N)<br />
N/A<br />
N<br />
Note: The target for Indicator 09 is to have zero percent<br />
(0%) of districts identified as having disproportionate<br />
representation as a result of inappropriate<br />
identification in eligibility.<br />
Note: The target for Indicator 10 is to have zero<br />
percent (0%) of districts identified as having<br />
disproportionate representation as a result of<br />
inappropriate identification in a disability<br />
category.<br />
Target Met by<br />
LEA (Y/N)<br />
N/A<br />
N<br />
Target Met<br />
by LEA<br />
(Y/N)<br />
99.21% 100.00% - - N/A<br />
N<br />
Note: * Indicates a zero reponse rate for the<br />
district.<br />
Page 4 of 5
LEA: 1803 - WEST MEMPHIS SCHOOL <strong>DISTRICT</strong><br />
Indicator 13: Secondary Transition<br />
Percent of youth with disabilities aged 16 and<br />
up with an IEP that includes coordinated,<br />
measurable, annual IEP goals and transition<br />
services that will reasonably enable the student<br />
to meet the post-secondary goals.<br />
Indicator 14: Post-School Outcomes<br />
A. Percent of youth enrolled in higher<br />
education within one year of leaving high<br />
school.<br />
State<br />
Rate<br />
State<br />
Target<br />
Note: Data for this Indicator is from the on-site monitoring of LEAs for the given year.<br />
B. Percent of youth enrolled in higher<br />
education or competitively employed<br />
within one year of leaving high school.<br />
C. Percent of youth enrolled in higher<br />
education or in some other postsecondary<br />
education or training program; or<br />
competitively employed or in some other<br />
employment within one year of leaving<br />
high school.<br />
State<br />
Rate<br />
Indicator 20: Reported Data-Timely and Accurate*<br />
District submitted<br />
required data elements<br />
on or before due dates;<br />
made revisions within<br />
the alloted reveiw<br />
periods.<br />
Accurate and Timely<br />
Data Submission<br />
Overall (3-21)<br />
Early Childhood (3-5)<br />
School Age (5-21)<br />
State<br />
Target<br />
100.00%<br />
100.00%<br />
100.00%<br />
State<br />
Target<br />
LEA<br />
Rate<br />
LEA<br />
Rate<br />
Target Met by<br />
LEA (Y/N)<br />
Target Met<br />
by LEA<br />
(Y/N)<br />
Target Met<br />
by LEA<br />
(Y/N)<br />
*Data reviewed for timely and accurate submissions included all APSCN cycle data except for personnel<br />
Note: - - denotes not applicable<br />
96.19 100.00 100.00% Y<br />
14.53<br />
State<br />
Rate<br />
49.42<br />
State<br />
Rate<br />
54.07<br />
13.00<br />
State<br />
Target<br />
49.00<br />
State<br />
Target<br />
60.00<br />
Y<br />
N/A<br />
Y<br />
— —<br />
LEA<br />
Rate<br />
— —<br />
LEA<br />
Rate<br />
— —<br />
N/A<br />
Target Met<br />
by LEA<br />
(Y/N)<br />
N/A<br />
Target Met<br />
by LEA<br />
(Y/N)<br />
N/A<br />
Page 5 of 5
LEA: 1804 - MARION SCHOOL <strong>DISTRICT</strong><br />
<strong>ARKANSAS</strong> <strong>SPECIAL</strong> <strong>EDUCATION</strong><br />
<strong>DISTRICT</strong> <strong>ANNUAL</strong> PERFORMANCE REPORT<br />
2010/11 School Year<br />
Publication Date: March 2012<br />
Each State must have in place a State Performance Plan (SPP) to evaluate the State's efforts to meet the requirements and<br />
purposes of the implementation of the Individuals with Disabilities Education Act (IDEA). The SPP is a six-year plan, which<br />
describes Arkansas's performance on 20 indicators. The Office of Special Education Programs in the U. S. Department of<br />
Education requires that States report annually to the public on the performance of each local education agency (LEA) on 14 of<br />
20 indicators as compared with targets established by the State in the SPP. Arkansas will report indicators 1 through 14 and<br />
20 for each LEA serving children with disabilities (CWD). Any LEA not meeting targets on compliance indicators (0% for<br />
Indicators 4B, 09 & 10 and 100% for Indicators 11, 12, 13, and 20) are non-compliant with IDEA.<br />
There are no report changes for the 2010/11 school year profile; However, it is important to recognize that: .<br />
1. Indicator 01 (Graduation) is reported a year in arrear (2009/10 graduates) and is based on a four-year cohort. This<br />
means the rate is a measure of students who entered in ninth grade and graduate in four years. The calculation is a<br />
requirement under Title I of the Elementary and Secondary Education Act (ESEA).<br />
2. Indicator 02 (Drop out) is reported a year in arrear. This means the rate is a measure of students who dropped out in<br />
the 2009/10 school year. The Indicator 02 data are aligned with the Common Core of Data (CCD) requirements for<br />
grades 7-12.<br />
3. Indicator 04A and 4B (Suspension/Expulsion) is reported a year in arrear. This means the rate is a measure of<br />
students who had out-of-school suspensions and/or expulsions totaling more than 10 days.<br />
Percent of youth<br />
with IEPs<br />
graduating from<br />
high school with a<br />
regular diploma<br />
For a complete description of all the Indicators, please visit the special education website at<br />
http://arksped.k12.ar.us/sections/policy.html<br />
Indicator 01: Graduation Rates (2009/10 school year) Indicator 02: Dropout Rates (2009/10 school year)<br />
State<br />
Rate<br />
State<br />
Target<br />
75.76% 85.00%<br />
LEA<br />
Rate<br />
65.71%<br />
Target Met<br />
by LEA<br />
(Y/N)<br />
N<br />
Percent of<br />
youth with<br />
IEPs dropping<br />
out of high<br />
school<br />
State<br />
Rate<br />
Indicator 03: Assessment on Statewide Benchmark Exam (grades 3-8, 11)<br />
A) Adequate Yearly Progress<br />
n=40<br />
Literacy<br />
Mathematics<br />
Met Disability Subgroup "n"<br />
for Reporting Purposes (Y/N)<br />
State Target for % of Districts Meeting<br />
AYP for Disability Subgroup<br />
State<br />
Target<br />
3.06% 4.20%<br />
LEA<br />
Rate<br />
0.97%<br />
% of Districts Meeting AYP<br />
for Disability Subgroup<br />
Target Met by<br />
LEA (Y/N)<br />
Y<br />
Target Met by<br />
LEA(Y/N)<br />
Overall N 17.15% 6.25%<br />
NA<br />
N<br />
N<br />
Note: For a district to qualify as having a disability subgroup it must have a minimum of 40 (n=40) students with disabilities in a school building.<br />
B) Participation<br />
Participation Rate: # of<br />
CWD Tested ÷ # of CWD<br />
Enrolled in grades tested.<br />
Participation Rate: Literacy<br />
Participation Rate: Math<br />
Note: - - denotes not applicable<br />
State<br />
Rate<br />
98.78%<br />
State<br />
Target<br />
95.00%<br />
LEA<br />
Rate<br />
96.23%<br />
Target Met<br />
by LEA (Y/N)<br />
98.61% 95.00% 95.88% Y<br />
Y<br />
C) Performance Proficiency<br />
Percent of CWD Scoring<br />
Proficient or Above<br />
Proficiency Rate: Literacy<br />
Proficiency Rate:<br />
Mathematics<br />
16.00%<br />
16.00%<br />
State<br />
Rate<br />
31.49%<br />
44.86%<br />
State<br />
Target<br />
45.22%<br />
51.14%<br />
LEA<br />
Rate<br />
28.03%<br />
40.42%<br />
NA<br />
NA<br />
Target<br />
Met by<br />
LEA (Y/N)<br />
N<br />
N<br />
Page 1 of 5
LEA: 1804 - MARION SCHOOL <strong>DISTRICT</strong><br />
Indicator 04: Out-of-School Suspensions and Expulsions (2009/10 school year)<br />
A) Suspension/Expulsion<br />
Percent difference of CWD with out-of- school suspensions and<br />
expulsions totaling greater than 10 days in a school year as<br />
compared to the same data for general education students in<br />
the district.<br />
B) Suspension/Expulsion by Race and Ethnicity<br />
Percent of districts that have: (a) a significant discrepancy, by race or<br />
ethnicity, in the rate of suspensions and expulsions of greater than 10<br />
days in a school year for children with IEPs; and (b) policies,<br />
procedures or practices that contribute to the significant discrepancy<br />
and do not comply with requirements relating to the development<br />
and implementation of IEPs, the use of positive behavioral<br />
interventions and supports, and procedural safeguards.<br />
Indicator 05: School Age (5-21) Least Restrictive Environment<br />
A) In the Regular Class 80% or more of the day<br />
Percent of CWD with<br />
IEPs receiving instruction<br />
in the regular class 80%<br />
or more of the day.<br />
State<br />
Rate<br />
State<br />
Target<br />
LEA<br />
Rate<br />
B) In the Regular Class less than 40% of the day<br />
Percent of CWD with<br />
IEPs receiving instruction<br />
in the regular class less<br />
than 60% of the day.<br />
53.87% 59.77%<br />
State<br />
Rate<br />
State<br />
Target<br />
12.42% 12.51%<br />
36.38%<br />
LEA<br />
Rate<br />
25.25%<br />
C) Other Settings outside the regular class<br />
Percent of CWD with IEPs served in<br />
public or private separate schools,<br />
residential placements, or<br />
homebound/hospital placements.<br />
State<br />
Rate<br />
State<br />
Target<br />
2.80% 2.56%<br />
Target Met<br />
by LEA (Y/N)<br />
N<br />
Target Met<br />
by LEA (Y/N)<br />
N<br />
LEA<br />
Rate<br />
0.80%<br />
Target Met<br />
by LEA(Y/N)<br />
Indicator 06: Early Childhood (3-5) Least Restrictive Environment<br />
A) Regular Early Childhood Program<br />
Percent of children (aged 3 through 5) with IEPs attending a regular<br />
early childhood program and receiving the majority of special<br />
education and related services in the regular early childhood program<br />
Allowable<br />
Difference<br />
LEA: 1804 - MARION SCHOOL <strong>DISTRICT</strong><br />
Indicator 07: Preschool (3-5) Outcomes<br />
a) Percent of preschool CWD<br />
children who did not<br />
improve functioning.<br />
b) Percent of preschool CWD<br />
who improved but whose<br />
functioning remained below<br />
same age peers.<br />
c) Percent of preschool CWD<br />
who improved at a level<br />
nearer to same aged peers.<br />
d) Percent of preschool CWD<br />
who improved functioning to<br />
reach a level comparable to<br />
same age peers.<br />
e) Percent of preschool CWD<br />
children who maintain<br />
functioning at a level<br />
comparable to same aged<br />
peers.<br />
Summary<br />
Statements<br />
1) Of those preschool<br />
children who entered<br />
the preschool program<br />
below age expectations<br />
in each Outcome, the<br />
percent who<br />
substantially increased<br />
their rate of growth by<br />
the time they turned 6<br />
years of age or exited<br />
the program.<br />
2) The percent of<br />
preschool children who<br />
were functioning<br />
within age expectations<br />
in each Outcome by the<br />
time they turned 6<br />
years of age or exited<br />
A) Positive Social -Emotional<br />
Skills*<br />
State<br />
Rate<br />
A) Positive Social -<br />
Emotional Skills<br />
(Including social<br />
relationships)<br />
State<br />
Rate<br />
2.14%<br />
5.31%<br />
25.97%<br />
38.22%<br />
28.36%<br />
State<br />
Target<br />
LEA<br />
Rate<br />
LEA<br />
Rate<br />
— —<br />
— —<br />
— —<br />
— —<br />
— —<br />
Target<br />
Met by<br />
LEA(Y/N)<br />
B) Acquisition and Use of<br />
Knowledge and Skills<br />
(Including early language/<br />
communication and early literacy)<br />
B) Acquisition and Use of<br />
Knowledge and Skills **<br />
State<br />
Rate<br />
1.75%<br />
6.59%<br />
34.23%<br />
43.51%<br />
13.92%<br />
State<br />
Target<br />
LEA<br />
Rate<br />
Target<br />
Met by<br />
LEA(Y/N)<br />
C) Use of Appropriate Behaviors<br />
to Meet Their Needs<br />
State<br />
Rate<br />
State<br />
Target<br />
LEA<br />
Rate<br />
Target<br />
Met by<br />
LEA(Y/N)<br />
89.61% 90.50% — — N/A 90.31% 90.50% — — N/A 90.82% 92.50% — — N/A<br />
66.58% 69.50% — — N/A 57.43% 60.50% — — N/A 76.69% 78.50% — — N/A<br />
NOTE: * Including social relationships ** Including early language/ communication and early literacy<br />
Note: - - denotes not applicable<br />
State<br />
Rate<br />
LEA<br />
Rate<br />
— —<br />
— —<br />
— —<br />
— —<br />
— —<br />
C) Use of<br />
Appropriate<br />
Behaviors to<br />
Meet Their Needs<br />
State<br />
Rate<br />
4.51%<br />
17.34%<br />
41.72%<br />
34.97%<br />
LEA<br />
Rate<br />
1.46% — —<br />
— —<br />
— —<br />
— —<br />
— —<br />
Page 3 of 5
LEA: 1804 - MARION SCHOOL <strong>DISTRICT</strong><br />
Indicator 08: Parent Involvement<br />
Percent of surveyed<br />
parents who reported<br />
school facilitated parent<br />
involvement as a means<br />
of improving services<br />
and results for children<br />
with disabilities.<br />
Early Childhood<br />
(3-5)<br />
School Age<br />
(5-21)<br />
State<br />
Rate<br />
90.47%<br />
95.05%<br />
Indicator 09: Disproportionality - Eligibility<br />
Disproportionate representation of racial<br />
and ethnic groups in special education and<br />
related services that is a result of<br />
inappropriate identification (e.g.<br />
monitoring data, review of policies,<br />
practices, and procedures under 618(d),<br />
etc.).<br />
State<br />
Rate<br />
State<br />
Target<br />
88.00%<br />
96.00%<br />
State<br />
Target<br />
0.00% 0.00%<br />
LEA<br />
Rate<br />
— —<br />
92.98%<br />
Indicator 10: Disproportionality-Child with a Disability<br />
Disproportionate representation of racial<br />
and ethnic groups in specific disability<br />
categories that is a result of inappropriate<br />
identification (e.g. monitoring data, review<br />
of policies, practices, and procedures under<br />
618(d), etc.).<br />
Indicator 11: Child Find<br />
Percent of children with<br />
parental consent to evaluate<br />
who are evaluated within<br />
the State established timeline<br />
of 60 days.<br />
Overall<br />
(3-21)<br />
Early Childhood<br />
(3-5)<br />
School Age<br />
(5-21)<br />
State<br />
Rate<br />
0.00%<br />
Indicator 12: Early Childhood Transition<br />
Percent of children referred by Part C prior to<br />
age 3, who are found eligible for Part B, and<br />
who have an IEP developed and implemented<br />
by their third birthday.<br />
Note: - - denotes not applicable<br />
State<br />
Rate<br />
99.41%<br />
99.70%<br />
98.97%<br />
State<br />
Rate<br />
State<br />
Target<br />
0.00%<br />
State<br />
Target<br />
100.00%<br />
100.00%<br />
100.00%<br />
State<br />
Target<br />
Target Met by<br />
LEA (Y/N)<br />
Y<br />
Target Met by<br />
LEA (Y/N)<br />
Y<br />
LEA<br />
Rate<br />
91.78%<br />
— —<br />
91.78%<br />
LEA<br />
Rate<br />
Target Met by<br />
LEA (Y/N)<br />
N/A<br />
N<br />
Note: The target for Indicator 09 is to have zero percent<br />
(0%) of districts identified as having disproportionate<br />
representation as a result of inappropriate<br />
identification in eligibility.<br />
Note: The target for Indicator 10 is to have zero<br />
percent (0%) of districts identified as having<br />
disproportionate representation as a result of<br />
inappropriate identification in a disability<br />
category.<br />
Target Met by<br />
LEA (Y/N)<br />
N/A<br />
N<br />
Target Met<br />
by LEA<br />
(Y/N)<br />
99.21% 100.00% - - N/A<br />
N<br />
Note: * Indicates a zero reponse rate for the<br />
district.<br />
Page 4 of 5
LEA: 1804 - MARION SCHOOL <strong>DISTRICT</strong><br />
Indicator 13: Secondary Transition<br />
Percent of youth with disabilities aged 16 and<br />
up with an IEP that includes coordinated,<br />
measurable, annual IEP goals and transition<br />
services that will reasonably enable the student<br />
to meet the post-secondary goals.<br />
Indicator 14: Post-School Outcomes<br />
A. Percent of youth enrolled in higher<br />
education within one year of leaving high<br />
school.<br />
State<br />
Rate<br />
State<br />
Target<br />
Note: Data for this Indicator is from the on-site monitoring of LEAs for the given year.<br />
B. Percent of youth enrolled in higher<br />
education or competitively employed<br />
within one year of leaving high school.<br />
C. Percent of youth enrolled in higher<br />
education or in some other postsecondary<br />
education or training program; or<br />
competitively employed or in some other<br />
employment within one year of leaving<br />
high school.<br />
State<br />
Rate<br />
Indicator 20: Reported Data-Timely and Accurate*<br />
District submitted<br />
required data elements<br />
on or before due dates;<br />
made revisions within<br />
the alloted reveiw<br />
periods.<br />
Accurate and Timely<br />
Data Submission<br />
Overall (3-21)<br />
Early Childhood (3-5)<br />
School Age (5-21)<br />
State<br />
Target<br />
100.00%<br />
100.00%<br />
100.00%<br />
State<br />
Target<br />
LEA<br />
Rate<br />
LEA<br />
Rate<br />
Target Met by<br />
LEA (Y/N)<br />
Target Met<br />
by LEA<br />
(Y/N)<br />
Target Met<br />
by LEA<br />
(Y/N)<br />
*Data reviewed for timely and accurate submissions included all APSCN cycle data except for personnel<br />
Note: - - denotes not applicable<br />
96.19 100.00 — — N/A<br />
14.53<br />
State<br />
Rate<br />
49.42<br />
State<br />
Rate<br />
54.07<br />
13.00<br />
State<br />
Target<br />
49.00<br />
State<br />
Target<br />
60.00<br />
Y<br />
N/A<br />
Y<br />
— —<br />
LEA<br />
Rate<br />
— —<br />
LEA<br />
Rate<br />
— —<br />
N/A<br />
Target Met<br />
by LEA<br />
(Y/N)<br />
N/A<br />
Target Met<br />
by LEA<br />
(Y/N)<br />
N/A<br />
Page 5 of 5
<strong>ARKANSAS</strong> <strong>SPECIAL</strong> <strong>EDUCATION</strong><br />
<strong>DISTRICT</strong> <strong>ANNUAL</strong> PERFORMANCE REPORT<br />
2010/11 School Year<br />
Publication Date: March 2012<br />
Each State must have in place a State Performance Plan (SPP) to evaluate the State's efforts to meet the requirements and<br />
purposes of the implementation of the Individuals with Disabilities Education Act (IDEA). The SPP is a six-year plan, which<br />
describes Arkansas's performance on 20 indicators. The Office of Special Education Programs in the U. S. Department of<br />
Education requires that States report annually to the public on the performance of each local education agency (LEA) on 14 of<br />
20 indicators as compared with targets established by the State in the SPP. Arkansas will report indicators 1 through 14 and<br />
20 for each LEA serving children with disabilities (CWD). Any LEA not meeting targets on compliance indicators (0% for<br />
Indicators 4B, 09 & 10 and 100% for Indicators 11, 12, 13, and 20) are non-compliant with IDEA.<br />
There are no report changes for the 2010/11 school year profile; However, it is important to recognize that: .<br />
1. Indicator 01 (Graduation) is reported a year in arrear (2009/10 graduates) and is based on a four-year cohort. This<br />
means the rate is a measure of students who entered in ninth grade and graduate in four years. The calculation is a<br />
requirement under Title I of the Elementary and Secondary Education Act (ESEA).<br />
2. Indicator 02 (Drop out) is reported a year in arrear. This means the rate is a measure of students who dropped out in<br />
the 2009/10 school year. The Indicator 02 data are aligned with the Common Core of Data (CCD) requirements for<br />
grades 7-12.<br />
3. Indicator 04A and 4B (Suspension/Expulsion) is reported a year in arrear. This means the rate is a measure of<br />
students who had out-of-school suspensions and/or expulsions totaling more than 10 days.<br />
For a complete description of all the Indicators, please visit the special education website at<br />
http://arksped.k12.ar.us/sections/policy.html<br />
LEA: 1901 - CROSS COUNTY SCHOOL <strong>DISTRICT</strong><br />
Indicator 01: Graduation Rates (2009/10 school year) Indicator 02: Dropout Rates (2009/10 school year)<br />
Percent of youth<br />
with IEPs<br />
graduating from<br />
high school with a<br />
regular diploma<br />
State<br />
Rate<br />
State<br />
Target<br />
75.76% 85.00%<br />
LEA<br />
Rate<br />
50.00%<br />
Target Met<br />
by LEA<br />
(Y/N)<br />
N<br />
Percent of<br />
youth with<br />
IEPs dropping<br />
out of high<br />
school<br />
State<br />
Rate<br />
Indicator 03: Assessment on Statewide Benchmark Exam (grades 3-8, 11)<br />
A) Adequate Yearly Progress<br />
n=40<br />
Literacy<br />
Mathematics<br />
Met Disability Subgroup "n"<br />
for Reporting Purposes (Y/N)<br />
State Target for % of Districts Meeting<br />
AYP for Disability Subgroup<br />
State<br />
Target<br />
3.06% 4.20%<br />
LEA<br />
Rate<br />
0.00%<br />
% of Districts Meeting AYP<br />
for Disability Subgroup<br />
Target Met by<br />
LEA (Y/N)<br />
Y<br />
Target Met by<br />
LEA(Y/N)<br />
Overall N 17.15% 6.25%<br />
NA<br />
N<br />
N<br />
Note: For a district to qualify as having a disability subgroup it must have a minimum of 40 (n=40) students with disabilities in a school building.<br />
B) Participation<br />
Participation Rate: # of<br />
CWD Tested ÷ # of CWD<br />
Enrolled in grades tested.<br />
Participation Rate: Literacy<br />
Participation Rate: Math<br />
Note: - - denotes not applicable<br />
State<br />
Rate<br />
98.78%<br />
State<br />
Target<br />
95.00%<br />
LEA<br />
Rate<br />
100.00%<br />
Target Met<br />
by LEA (Y/N)<br />
98.61% 95.00% 97.92% Y<br />
Y<br />
C) Performance Proficiency<br />
Percent of CWD Scoring<br />
Proficient or Above<br />
Proficiency Rate: Literacy<br />
Proficiency Rate:<br />
Mathematics<br />
16.00%<br />
16.00%<br />
State<br />
Rate<br />
31.49%<br />
44.86%<br />
State<br />
Target<br />
45.22%<br />
51.14%<br />
LEA<br />
Rate<br />
35.56%<br />
48.94%<br />
NA<br />
NA<br />
Target<br />
Met by<br />
LEA (Y/N)<br />
N<br />
N<br />
Page 1 of 5
LEA: 1901 - CROSS COUNTY SCHOOL <strong>DISTRICT</strong><br />
Indicator 04: Out-of-School Suspensions and Expulsions (2009/10 school year)<br />
A) Suspension/Expulsion<br />
Percent difference of CWD with out-of- school suspensions and<br />
expulsions totaling greater than 10 days in a school year as<br />
compared to the same data for general education students in<br />
the district.<br />
B) Suspension/Expulsion by Race and Ethnicity<br />
Percent of districts that have: (a) a significant discrepancy, by race or<br />
ethnicity, in the rate of suspensions and expulsions of greater than 10<br />
days in a school year for children with IEPs; and (b) policies,<br />
procedures or practices that contribute to the significant discrepancy<br />
and do not comply with requirements relating to the development<br />
and implementation of IEPs, the use of positive behavioral<br />
interventions and supports, and procedural safeguards.<br />
Indicator 05: School Age (5-21) Least Restrictive Environment<br />
A) In the Regular Class 80% or more of the day<br />
Percent of CWD with<br />
IEPs receiving instruction<br />
in the regular class 80%<br />
or more of the day.<br />
State<br />
Rate<br />
State<br />
Target<br />
LEA<br />
Rate<br />
B) In the Regular Class less than 40% of the day<br />
Percent of CWD with<br />
IEPs receiving instruction<br />
in the regular class less<br />
than 60% of the day.<br />
53.87% 59.77%<br />
State<br />
Rate<br />
State<br />
Target<br />
12.42% 12.51%<br />
65.22%<br />
LEA<br />
Rate<br />
9.78%<br />
C) Other Settings outside the regular class<br />
Percent of CWD with IEPs served in<br />
public or private separate schools,<br />
residential placements, or<br />
homebound/hospital placements.<br />
State<br />
Rate<br />
State<br />
Target<br />
2.80% 2.56%<br />
Target Met<br />
by LEA (Y/N)<br />
Y<br />
Target Met<br />
by LEA (Y/N)<br />
Y<br />
LEA<br />
Rate<br />
0.00%<br />
Target Met<br />
by LEA(Y/N)<br />
Indicator 06: Early Childhood (3-5) Least Restrictive Environment<br />
A) Regular Early Childhood Program<br />
Percent of children (aged 3 through 5) with IEPs attending a regular<br />
early childhood program and receiving the majority of special<br />
education and related services in the regular early childhood program<br />
Allowable<br />
Difference<br />
LEA: 1901 - CROSS COUNTY SCHOOL <strong>DISTRICT</strong><br />
Indicator 07: Preschool (3-5) Outcomes<br />
a) Percent of preschool CWD<br />
children who did not<br />
improve functioning.<br />
b) Percent of preschool CWD<br />
who improved but whose<br />
functioning remained below<br />
same age peers.<br />
c) Percent of preschool CWD<br />
who improved at a level<br />
nearer to same aged peers.<br />
d) Percent of preschool CWD<br />
who improved functioning to<br />
reach a level comparable to<br />
same age peers.<br />
e) Percent of preschool CWD<br />
children who maintain<br />
functioning at a level<br />
comparable to same aged<br />
peers.<br />
Summary<br />
Statements<br />
1) Of those preschool<br />
children who entered<br />
the preschool program<br />
below age expectations<br />
in each Outcome, the<br />
percent who<br />
substantially increased<br />
their rate of growth by<br />
the time they turned 6<br />
years of age or exited<br />
the program.<br />
2) The percent of<br />
preschool children who<br />
were functioning<br />
within age expectations<br />
in each Outcome by the<br />
time they turned 6<br />
years of age or exited<br />
A) Positive Social -Emotional<br />
Skills*<br />
State<br />
Rate<br />
A) Positive Social -<br />
Emotional Skills<br />
(Including social<br />
relationships)<br />
State<br />
Rate<br />
2.14%<br />
5.31%<br />
25.97%<br />
38.22%<br />
28.36%<br />
State<br />
Target<br />
LEA<br />
Rate<br />
LEA<br />
Rate<br />
— —<br />
— —<br />
— —<br />
— —<br />
— —<br />
Target<br />
Met by<br />
LEA(Y/N)<br />
B) Acquisition and Use of<br />
Knowledge and Skills<br />
(Including early language/<br />
communication and early literacy)<br />
B) Acquisition and Use of<br />
Knowledge and Skills **<br />
State<br />
Rate<br />
1.75%<br />
6.59%<br />
34.23%<br />
43.51%<br />
13.92%<br />
State<br />
Target<br />
LEA<br />
Rate<br />
Target<br />
Met by<br />
LEA(Y/N)<br />
C) Use of Appropriate Behaviors<br />
to Meet Their Needs<br />
State<br />
Rate<br />
State<br />
Target<br />
LEA<br />
Rate<br />
Target<br />
Met by<br />
LEA(Y/N)<br />
89.61% 90.50% — — N/A 90.31% 90.50% — — N/A 90.82% 92.50% — — N/A<br />
66.58% 69.50% — — N/A 57.43% 60.50% — — N/A 76.69% 78.50% — — N/A<br />
NOTE: * Including social relationships ** Including early language/ communication and early literacy<br />
Note: - - denotes not applicable<br />
State<br />
Rate<br />
LEA<br />
Rate<br />
— —<br />
— —<br />
— —<br />
— —<br />
— —<br />
C) Use of<br />
Appropriate<br />
Behaviors to<br />
Meet Their Needs<br />
State<br />
Rate<br />
4.51%<br />
17.34%<br />
41.72%<br />
34.97%<br />
LEA<br />
Rate<br />
1.46% — —<br />
— —<br />
— —<br />
— —<br />
— —<br />
Page 3 of 5
LEA: 1901 - CROSS COUNTY SCHOOL <strong>DISTRICT</strong><br />
Indicator 08: Parent Involvement<br />
Percent of surveyed<br />
parents who reported<br />
school facilitated parent<br />
involvement as a means<br />
of improving services<br />
and results for children<br />
with disabilities.<br />
Early Childhood<br />
(3-5)<br />
School Age<br />
(5-21)<br />
State<br />
Rate<br />
90.47%<br />
95.05%<br />
Indicator 09: Disproportionality - Eligibility<br />
Disproportionate representation of racial<br />
and ethnic groups in special education and<br />
related services that is a result of<br />
inappropriate identification (e.g.<br />
monitoring data, review of policies,<br />
practices, and procedures under 618(d),<br />
etc.).<br />
State<br />
Rate<br />
State<br />
Target<br />
88.00%<br />
96.00%<br />
State<br />
Target<br />
0.00% 0.00%<br />
LEA<br />
Rate<br />
— —<br />
95.24%<br />
Indicator 10: Disproportionality-Child with a Disability<br />
Disproportionate representation of racial<br />
and ethnic groups in specific disability<br />
categories that is a result of inappropriate<br />
identification (e.g. monitoring data, review<br />
of policies, practices, and procedures under<br />
618(d), etc.).<br />
Indicator 11: Child Find<br />
Percent of children with<br />
parental consent to evaluate<br />
who are evaluated within<br />
the State established timeline<br />
of 60 days.<br />
Overall<br />
(3-21)<br />
Early Childhood<br />
(3-5)<br />
School Age<br />
(5-21)<br />
State<br />
Rate<br />
0.00%<br />
Indicator 12: Early Childhood Transition<br />
Percent of children referred by Part C prior to<br />
age 3, who are found eligible for Part B, and<br />
who have an IEP developed and implemented<br />
by their third birthday.<br />
Note: - - denotes not applicable<br />
State<br />
Rate<br />
99.41%<br />
99.70%<br />
98.97%<br />
State<br />
Rate<br />
State<br />
Target<br />
0.00%<br />
State<br />
Target<br />
100.00%<br />
100.00%<br />
100.00%<br />
State<br />
Target<br />
Target Met by<br />
LEA (Y/N)<br />
Y<br />
Target Met by<br />
LEA (Y/N)<br />
Y<br />
LEA<br />
Rate<br />
100.00%<br />
— —<br />
100.00%<br />
LEA<br />
Rate<br />
Target Met by<br />
LEA (Y/N)<br />
N/A<br />
N<br />
Note: The target for Indicator 09 is to have zero percent<br />
(0%) of districts identified as having disproportionate<br />
representation as a result of inappropriate<br />
identification in eligibility.<br />
Note: The target for Indicator 10 is to have zero<br />
percent (0%) of districts identified as having<br />
disproportionate representation as a result of<br />
inappropriate identification in a disability<br />
category.<br />
Target Met by<br />
LEA (Y/N)<br />
N/A<br />
Y<br />
Target Met<br />
by LEA<br />
(Y/N)<br />
99.21% 100.00% - - N/A<br />
Y<br />
Note: * Indicates a zero reponse rate for the<br />
district.<br />
Page 4 of 5
LEA: 1901 - CROSS COUNTY SCHOOL <strong>DISTRICT</strong><br />
Indicator 13: Secondary Transition<br />
Percent of youth with disabilities aged 16 and<br />
up with an IEP that includes coordinated,<br />
measurable, annual IEP goals and transition<br />
services that will reasonably enable the student<br />
to meet the post-secondary goals.<br />
Indicator 14: Post-School Outcomes<br />
A. Percent of youth enrolled in higher<br />
education within one year of leaving high<br />
school.<br />
State<br />
Rate<br />
State<br />
Target<br />
Note: Data for this Indicator is from the on-site monitoring of LEAs for the given year.<br />
B. Percent of youth enrolled in higher<br />
education or competitively employed<br />
within one year of leaving high school.<br />
C. Percent of youth enrolled in higher<br />
education or in some other postsecondary<br />
education or training program; or<br />
competitively employed or in some other<br />
employment within one year of leaving<br />
high school.<br />
State<br />
Rate<br />
Indicator 20: Reported Data-Timely and Accurate*<br />
District submitted<br />
required data elements<br />
on or before due dates;<br />
made revisions within<br />
the alloted reveiw<br />
periods.<br />
Accurate and Timely<br />
Data Submission<br />
Overall (3-21)<br />
Early Childhood (3-5)<br />
School Age (5-21)<br />
State<br />
Target<br />
100.00%<br />
100.00%<br />
100.00%<br />
State<br />
Target<br />
LEA<br />
Rate<br />
LEA<br />
Rate<br />
Target Met by<br />
LEA (Y/N)<br />
Target Met<br />
by LEA<br />
(Y/N)<br />
Target Met<br />
by LEA<br />
(Y/N)<br />
*Data reviewed for timely and accurate submissions included all APSCN cycle data except for personnel<br />
Note: - - denotes not applicable<br />
96.19 100.00 — — N/A<br />
14.53<br />
State<br />
Rate<br />
49.42<br />
State<br />
Rate<br />
54.07<br />
13.00<br />
State<br />
Target<br />
49.00<br />
State<br />
Target<br />
60.00<br />
Y<br />
N/A<br />
Y<br />
— —<br />
LEA<br />
Rate<br />
— —<br />
LEA<br />
Rate<br />
— —<br />
N/A<br />
Target Met<br />
by LEA<br />
(Y/N)<br />
N/A<br />
Target Met<br />
by LEA<br />
(Y/N)<br />
N/A<br />
Page 5 of 5
LEA: 1905 - WYNNE SCHOOL <strong>DISTRICT</strong><br />
<strong>ARKANSAS</strong> <strong>SPECIAL</strong> <strong>EDUCATION</strong><br />
<strong>DISTRICT</strong> <strong>ANNUAL</strong> PERFORMANCE REPORT<br />
2010/11 School Year<br />
Publication Date: March 2012<br />
Each State must have in place a State Performance Plan (SPP) to evaluate the State's efforts to meet the requirements and<br />
purposes of the implementation of the Individuals with Disabilities Education Act (IDEA). The SPP is a six-year plan, which<br />
describes Arkansas's performance on 20 indicators. The Office of Special Education Programs in the U. S. Department of<br />
Education requires that States report annually to the public on the performance of each local education agency (LEA) on 14 of<br />
20 indicators as compared with targets established by the State in the SPP. Arkansas will report indicators 1 through 14 and<br />
20 for each LEA serving children with disabilities (CWD). Any LEA not meeting targets on compliance indicators (0% for<br />
Indicators 4B, 09 & 10 and 100% for Indicators 11, 12, 13, and 20) are non-compliant with IDEA.<br />
There are no report changes for the 2010/11 school year profile; However, it is important to recognize that: .<br />
1. Indicator 01 (Graduation) is reported a year in arrear (2009/10 graduates) and is based on a four-year cohort. This<br />
means the rate is a measure of students who entered in ninth grade and graduate in four years. The calculation is a<br />
requirement under Title I of the Elementary and Secondary Education Act (ESEA).<br />
2. Indicator 02 (Drop out) is reported a year in arrear. This means the rate is a measure of students who dropped out in<br />
the 2009/10 school year. The Indicator 02 data are aligned with the Common Core of Data (CCD) requirements for<br />
grades 7-12.<br />
3. Indicator 04A and 4B (Suspension/Expulsion) is reported a year in arrear. This means the rate is a measure of<br />
students who had out-of-school suspensions and/or expulsions totaling more than 10 days.<br />
Percent of youth<br />
with IEPs<br />
graduating from<br />
high school with a<br />
regular diploma<br />
For a complete description of all the Indicators, please visit the special education website at<br />
http://arksped.k12.ar.us/sections/policy.html<br />
Indicator 01: Graduation Rates (2009/10 school year) Indicator 02: Dropout Rates (2009/10 school year)<br />
State<br />
Rate<br />
State<br />
Target<br />
75.76% 85.00%<br />
LEA<br />
Rate<br />
72.22%<br />
Target Met<br />
by LEA<br />
(Y/N)<br />
N<br />
Percent of<br />
youth with<br />
IEPs dropping<br />
out of high<br />
school<br />
State<br />
Rate<br />
Indicator 03: Assessment on Statewide Benchmark Exam (grades 3-8, 11)<br />
A) Adequate Yearly Progress<br />
n=40<br />
Literacy<br />
Mathematics<br />
Met Disability Subgroup "n"<br />
for Reporting Purposes (Y/N)<br />
State Target for % of Districts Meeting<br />
AYP for Disability Subgroup<br />
State<br />
Target<br />
3.06% 4.20%<br />
LEA<br />
Rate<br />
5.53%<br />
% of Districts Meeting AYP<br />
for Disability Subgroup<br />
Target Met by<br />
LEA (Y/N)<br />
N<br />
Target Met by<br />
LEA(Y/N)<br />
Overall N 17.15% 6.25%<br />
NA<br />
N<br />
N<br />
Note: For a district to qualify as having a disability subgroup it must have a minimum of 40 (n=40) students with disabilities in a school building.<br />
B) Participation<br />
Participation Rate: # of<br />
CWD Tested ÷ # of CWD<br />
Enrolled in grades tested.<br />
Participation Rate: Literacy<br />
Participation Rate: Math<br />
Note: - - denotes not applicable<br />
State<br />
Rate<br />
98.78%<br />
State<br />
Target<br />
95.00%<br />
LEA<br />
Rate<br />
99.00%<br />
Target Met<br />
by LEA (Y/N)<br />
98.61% 95.00% 98.56% Y<br />
Y<br />
C) Performance Proficiency<br />
Percent of CWD Scoring<br />
Proficient or Above<br />
Proficiency Rate: Literacy<br />
Proficiency Rate:<br />
Mathematics<br />
16.00%<br />
16.00%<br />
State<br />
Rate<br />
31.49%<br />
44.86%<br />
State<br />
Target<br />
45.22%<br />
51.14%<br />
LEA<br />
Rate<br />
26.20%<br />
47.15%<br />
NA<br />
NA<br />
Target<br />
Met by<br />
LEA (Y/N)<br />
N<br />
N<br />
Page 1 of 5
LEA: 1905 - WYNNE SCHOOL <strong>DISTRICT</strong><br />
Indicator 04: Out-of-School Suspensions and Expulsions (2009/10 school year)<br />
A) Suspension/Expulsion<br />
Percent difference of CWD with out-of- school suspensions and<br />
expulsions totaling greater than 10 days in a school year as<br />
compared to the same data for general education students in<br />
the district.<br />
B) Suspension/Expulsion by Race and Ethnicity<br />
Percent of districts that have: (a) a significant discrepancy, by race or<br />
ethnicity, in the rate of suspensions and expulsions of greater than 10<br />
days in a school year for children with IEPs; and (b) policies,<br />
procedures or practices that contribute to the significant discrepancy<br />
and do not comply with requirements relating to the development<br />
and implementation of IEPs, the use of positive behavioral<br />
interventions and supports, and procedural safeguards.<br />
Indicator 05: School Age (5-21) Least Restrictive Environment<br />
A) In the Regular Class 80% or more of the day<br />
Percent of CWD with<br />
IEPs receiving instruction<br />
in the regular class 80%<br />
or more of the day.<br />
State<br />
Rate<br />
State<br />
Target<br />
LEA<br />
Rate<br />
B) In the Regular Class less than 40% of the day<br />
Percent of CWD with<br />
IEPs receiving instruction<br />
in the regular class less<br />
than 60% of the day.<br />
53.87% 59.77%<br />
State<br />
Rate<br />
State<br />
Target<br />
12.42% 12.51%<br />
33.13%<br />
LEA<br />
Rate<br />
26.01%<br />
C) Other Settings outside the regular class<br />
Percent of CWD with IEPs served in<br />
public or private separate schools,<br />
residential placements, or<br />
homebound/hospital placements.<br />
State<br />
Rate<br />
State<br />
Target<br />
2.80% 2.56%<br />
Target Met<br />
by LEA (Y/N)<br />
N<br />
Target Met<br />
by LEA (Y/N)<br />
N<br />
LEA<br />
Rate<br />
0.62%<br />
Target Met<br />
by LEA(Y/N)<br />
Indicator 06: Early Childhood (3-5) Least Restrictive Environment<br />
A) Regular Early Childhood Program<br />
Percent of children (aged 3 through 5) with IEPs attending a regular<br />
early childhood program and receiving the majority of special<br />
education and related services in the regular early childhood program<br />
Allowable<br />
Difference<br />
LEA: 1905 - WYNNE SCHOOL <strong>DISTRICT</strong><br />
Indicator 07: Preschool (3-5) Outcomes<br />
a) Percent of preschool CWD<br />
children who did not<br />
improve functioning.<br />
b) Percent of preschool CWD<br />
who improved but whose<br />
functioning remained below<br />
same age peers.<br />
c) Percent of preschool CWD<br />
who improved at a level<br />
nearer to same aged peers.<br />
d) Percent of preschool CWD<br />
who improved functioning to<br />
reach a level comparable to<br />
same age peers.<br />
e) Percent of preschool CWD<br />
children who maintain<br />
functioning at a level<br />
comparable to same aged<br />
peers.<br />
Summary<br />
Statements<br />
1) Of those preschool<br />
children who entered<br />
the preschool program<br />
below age expectations<br />
in each Outcome, the<br />
percent who<br />
substantially increased<br />
their rate of growth by<br />
the time they turned 6<br />
years of age or exited<br />
the program.<br />
2) The percent of<br />
preschool children who<br />
were functioning<br />
within age expectations<br />
in each Outcome by the<br />
time they turned 6<br />
years of age or exited<br />
A) Positive Social -Emotional<br />
Skills*<br />
State<br />
Rate<br />
A) Positive Social -<br />
Emotional Skills<br />
(Including social<br />
relationships)<br />
State<br />
Rate<br />
2.14%<br />
5.31%<br />
25.97%<br />
38.22%<br />
28.36%<br />
State<br />
Target<br />
LEA<br />
Rate<br />
LEA<br />
Rate<br />
— —<br />
— —<br />
— —<br />
— —<br />
— —<br />
Target<br />
Met by<br />
LEA(Y/N)<br />
B) Acquisition and Use of<br />
Knowledge and Skills<br />
(Including early language/<br />
communication and early literacy)<br />
B) Acquisition and Use of<br />
Knowledge and Skills **<br />
State<br />
Rate<br />
1.75%<br />
6.59%<br />
34.23%<br />
43.51%<br />
13.92%<br />
State<br />
Target<br />
LEA<br />
Rate<br />
Target<br />
Met by<br />
LEA(Y/N)<br />
C) Use of Appropriate Behaviors<br />
to Meet Their Needs<br />
State<br />
Rate<br />
State<br />
Target<br />
LEA<br />
Rate<br />
Target<br />
Met by<br />
LEA(Y/N)<br />
89.61% 90.50% — — N/A 90.31% 90.50% — — N/A 90.82% 92.50% — — N/A<br />
66.58% 69.50% — — N/A 57.43% 60.50% — — N/A 76.69% 78.50% — — N/A<br />
NOTE: * Including social relationships ** Including early language/ communication and early literacy<br />
Note: - - denotes not applicable<br />
State<br />
Rate<br />
LEA<br />
Rate<br />
— —<br />
— —<br />
— —<br />
— —<br />
— —<br />
C) Use of<br />
Appropriate<br />
Behaviors to<br />
Meet Their Needs<br />
State<br />
Rate<br />
4.51%<br />
17.34%<br />
41.72%<br />
34.97%<br />
LEA<br />
Rate<br />
1.46% — —<br />
— —<br />
— —<br />
— —<br />
— —<br />
Page 3 of 5
LEA: 1905 - WYNNE SCHOOL <strong>DISTRICT</strong><br />
Indicator 08: Parent Involvement<br />
Percent of surveyed<br />
parents who reported<br />
school facilitated parent<br />
involvement as a means<br />
of improving services<br />
and results for children<br />
with disabilities.<br />
Early Childhood<br />
(3-5)<br />
School Age<br />
(5-21)<br />
State<br />
Rate<br />
90.47%<br />
95.05%<br />
Indicator 09: Disproportionality - Eligibility<br />
Disproportionate representation of racial<br />
and ethnic groups in special education and<br />
related services that is a result of<br />
inappropriate identification (e.g.<br />
monitoring data, review of policies,<br />
practices, and procedures under 618(d),<br />
etc.).<br />
State<br />
Rate<br />
State<br />
Target<br />
88.00%<br />
96.00%<br />
State<br />
Target<br />
0.00% 0.00%<br />
LEA<br />
Rate<br />
— —<br />
95.71%<br />
Indicator 10: Disproportionality-Child with a Disability<br />
Disproportionate representation of racial<br />
and ethnic groups in specific disability<br />
categories that is a result of inappropriate<br />
identification (e.g. monitoring data, review<br />
of policies, practices, and procedures under<br />
618(d), etc.).<br />
Indicator 11: Child Find<br />
Percent of children with<br />
parental consent to evaluate<br />
who are evaluated within<br />
the State established timeline<br />
of 60 days.<br />
Overall<br />
(3-21)<br />
Early Childhood<br />
(3-5)<br />
School Age<br />
(5-21)<br />
State<br />
Rate<br />
0.00%<br />
Indicator 12: Early Childhood Transition<br />
Percent of children referred by Part C prior to<br />
age 3, who are found eligible for Part B, and<br />
who have an IEP developed and implemented<br />
by their third birthday.<br />
Note: - - denotes not applicable<br />
State<br />
Rate<br />
99.41%<br />
99.70%<br />
98.97%<br />
State<br />
Rate<br />
State<br />
Target<br />
0.00%<br />
State<br />
Target<br />
100.00%<br />
100.00%<br />
100.00%<br />
State<br />
Target<br />
Target Met by<br />
LEA (Y/N)<br />
Y<br />
Target Met by<br />
LEA (Y/N)<br />
Y<br />
LEA<br />
Rate<br />
100.00%<br />
— —<br />
100.00%<br />
LEA<br />
Rate<br />
Target Met by<br />
LEA (Y/N)<br />
N/A<br />
N<br />
Note: The target for Indicator 09 is to have zero percent<br />
(0%) of districts identified as having disproportionate<br />
representation as a result of inappropriate<br />
identification in eligibility.<br />
Note: The target for Indicator 10 is to have zero<br />
percent (0%) of districts identified as having<br />
disproportionate representation as a result of<br />
inappropriate identification in a disability<br />
category.<br />
Target Met by<br />
LEA (Y/N)<br />
N/A<br />
Y<br />
Target Met<br />
by LEA<br />
(Y/N)<br />
99.21% 100.00% - - N/A<br />
Y<br />
Note: * Indicates a zero reponse rate for the<br />
district.<br />
Page 4 of 5
LEA: 1905 - WYNNE SCHOOL <strong>DISTRICT</strong><br />
Indicator 13: Secondary Transition<br />
Percent of youth with disabilities aged 16 and<br />
up with an IEP that includes coordinated,<br />
measurable, annual IEP goals and transition<br />
services that will reasonably enable the student<br />
to meet the post-secondary goals.<br />
Indicator 14: Post-School Outcomes<br />
A. Percent of youth enrolled in higher<br />
education within one year of leaving high<br />
school.<br />
State<br />
Rate<br />
State<br />
Target<br />
Note: Data for this Indicator is from the on-site monitoring of LEAs for the given year.<br />
B. Percent of youth enrolled in higher<br />
education or competitively employed<br />
within one year of leaving high school.<br />
C. Percent of youth enrolled in higher<br />
education or in some other postsecondary<br />
education or training program; or<br />
competitively employed or in some other<br />
employment within one year of leaving<br />
high school.<br />
State<br />
Rate<br />
Indicator 20: Reported Data-Timely and Accurate*<br />
District submitted<br />
required data elements<br />
on or before due dates;<br />
made revisions within<br />
the alloted reveiw<br />
periods.<br />
Accurate and Timely<br />
Data Submission<br />
Overall (3-21)<br />
Early Childhood (3-5)<br />
School Age (5-21)<br />
State<br />
Target<br />
100.00%<br />
100.00%<br />
100.00%<br />
State<br />
Target<br />
LEA<br />
Rate<br />
LEA<br />
Rate<br />
Target Met by<br />
LEA (Y/N)<br />
Target Met<br />
by LEA<br />
(Y/N)<br />
Target Met<br />
by LEA<br />
(Y/N)<br />
*Data reviewed for timely and accurate submissions included all APSCN cycle data except for personnel<br />
Note: - - denotes not applicable<br />
96.19 100.00 — — N/A<br />
14.53<br />
State<br />
Rate<br />
49.42<br />
State<br />
Rate<br />
54.07<br />
13.00<br />
State<br />
Target<br />
49.00<br />
State<br />
Target<br />
60.00<br />
Y<br />
N/A<br />
Y<br />
— —<br />
LEA<br />
Rate<br />
— —<br />
LEA<br />
Rate<br />
— —<br />
N/A<br />
Target Met<br />
by LEA<br />
(Y/N)<br />
N/A<br />
Target Met<br />
by LEA<br />
(Y/N)<br />
N/A<br />
Page 5 of 5
LEA: 2002 - FORDYCE SCHOOL <strong>DISTRICT</strong><br />
<strong>ARKANSAS</strong> <strong>SPECIAL</strong> <strong>EDUCATION</strong><br />
<strong>DISTRICT</strong> <strong>ANNUAL</strong> PERFORMANCE REPORT<br />
2010/11 School Year<br />
Publication Date: March 2012<br />
Each State must have in place a State Performance Plan (SPP) to evaluate the State's efforts to meet the requirements and<br />
purposes of the implementation of the Individuals with Disabilities Education Act (IDEA). The SPP is a six-year plan, which<br />
describes Arkansas's performance on 20 indicators. The Office of Special Education Programs in the U. S. Department of<br />
Education requires that States report annually to the public on the performance of each local education agency (LEA) on 14 of<br />
20 indicators as compared with targets established by the State in the SPP. Arkansas will report indicators 1 through 14 and<br />
20 for each LEA serving children with disabilities (CWD). Any LEA not meeting targets on compliance indicators (0% for<br />
Indicators 4B, 09 & 10 and 100% for Indicators 11, 12, 13, and 20) are non-compliant with IDEA.<br />
There are no report changes for the 2010/11 school year profile; However, it is important to recognize that: .<br />
1. Indicator 01 (Graduation) is reported a year in arrear (2009/10 graduates) and is based on a four-year cohort. This<br />
means the rate is a measure of students who entered in ninth grade and graduate in four years. The calculation is a<br />
requirement under Title I of the Elementary and Secondary Education Act (ESEA).<br />
2. Indicator 02 (Drop out) is reported a year in arrear. This means the rate is a measure of students who dropped out in<br />
the 2009/10 school year. The Indicator 02 data are aligned with the Common Core of Data (CCD) requirements for<br />
grades 7-12.<br />
3. Indicator 04A and 4B (Suspension/Expulsion) is reported a year in arrear. This means the rate is a measure of<br />
students who had out-of-school suspensions and/or expulsions totaling more than 10 days.<br />
Percent of youth<br />
with IEPs<br />
graduating from<br />
high school with a<br />
regular diploma<br />
For a complete description of all the Indicators, please visit the special education website at<br />
http://arksped.k12.ar.us/sections/policy.html<br />
Indicator 01: Graduation Rates (2009/10 school year) Indicator 02: Dropout Rates (2009/10 school year)<br />
State<br />
Rate<br />
State<br />
Target<br />
75.76% 85.00%<br />
LEA<br />
Rate<br />
84.62%<br />
Target Met<br />
by LEA<br />
(Y/N)<br />
N<br />
Percent of<br />
youth with<br />
IEPs dropping<br />
out of high<br />
school<br />
State<br />
Rate<br />
Indicator 03: Assessment on Statewide Benchmark Exam (grades 3-8, 11)<br />
A) Adequate Yearly Progress<br />
n=40<br />
Literacy<br />
Mathematics<br />
Met Disability Subgroup "n"<br />
for Reporting Purposes (Y/N)<br />
State Target for % of Districts Meeting<br />
AYP for Disability Subgroup<br />
State<br />
Target<br />
3.06% 4.20%<br />
LEA<br />
Rate<br />
0.00%<br />
% of Districts Meeting AYP<br />
for Disability Subgroup<br />
Target Met by<br />
LEA (Y/N)<br />
Y<br />
Target Met by<br />
LEA(Y/N)<br />
Overall N 17.15% 6.25%<br />
NA<br />
N<br />
N<br />
Note: For a district to qualify as having a disability subgroup it must have a minimum of 40 (n=40) students with disabilities in a school building.<br />
B) Participation<br />
Participation Rate: # of<br />
CWD Tested ÷ # of CWD<br />
Enrolled in grades tested.<br />
Participation Rate: Literacy<br />
Participation Rate: Math<br />
Note: - - denotes not applicable<br />
State<br />
Rate<br />
98.78%<br />
State<br />
Target<br />
95.00%<br />
LEA<br />
Rate<br />
100.00%<br />
Target Met<br />
by LEA (Y/N)<br />
98.61% 95.00% 98.36% Y<br />
Y<br />
C) Performance Proficiency<br />
Percent of CWD Scoring<br />
Proficient or Above<br />
Proficiency Rate: Literacy<br />
Proficiency Rate:<br />
Mathematics<br />
16.00%<br />
16.00%<br />
State<br />
Rate<br />
31.49%<br />
44.86%<br />
State<br />
Target<br />
45.22%<br />
51.14%<br />
LEA<br />
Rate<br />
8.89%<br />
11.67%<br />
NA<br />
NA<br />
Target<br />
Met by<br />
LEA (Y/N)<br />
N<br />
N<br />
Page 1 of 5
LEA: 2002 - FORDYCE SCHOOL <strong>DISTRICT</strong><br />
Indicator 04: Out-of-School Suspensions and Expulsions (2009/10 school year)<br />
A) Suspension/Expulsion<br />
Percent difference of CWD with out-of- school suspensions and<br />
expulsions totaling greater than 10 days in a school year as<br />
compared to the same data for general education students in<br />
the district.<br />
B) Suspension/Expulsion by Race and Ethnicity<br />
Percent of districts that have: (a) a significant discrepancy, by race or<br />
ethnicity, in the rate of suspensions and expulsions of greater than 10<br />
days in a school year for children with IEPs; and (b) policies,<br />
procedures or practices that contribute to the significant discrepancy<br />
and do not comply with requirements relating to the development<br />
and implementation of IEPs, the use of positive behavioral<br />
interventions and supports, and procedural safeguards.<br />
Indicator 05: School Age (5-21) Least Restrictive Environment<br />
A) In the Regular Class 80% or more of the day<br />
Percent of CWD with<br />
IEPs receiving instruction<br />
in the regular class 80%<br />
or more of the day.<br />
State<br />
Rate<br />
State<br />
Target<br />
LEA<br />
Rate<br />
B) In the Regular Class less than 40% of the day<br />
Percent of CWD with<br />
IEPs receiving instruction<br />
in the regular class less<br />
than 60% of the day.<br />
53.87% 59.77%<br />
State<br />
Rate<br />
State<br />
Target<br />
12.42% 12.51%<br />
25.26%<br />
LEA<br />
Rate<br />
6.32%<br />
C) Other Settings outside the regular class<br />
Percent of CWD with IEPs served in<br />
public or private separate schools,<br />
residential placements, or<br />
homebound/hospital placements.<br />
State<br />
Rate<br />
State<br />
Target<br />
2.80% 2.56%<br />
Target Met<br />
by LEA (Y/N)<br />
N<br />
Target Met<br />
by LEA (Y/N)<br />
Y<br />
LEA<br />
Rate<br />
57.37%<br />
Target Met<br />
by LEA(Y/N)<br />
Indicator 06: Early Childhood (3-5) Least Restrictive Environment<br />
A) Regular Early Childhood Program<br />
Percent of children (aged 3 through 5) with IEPs attending a regular<br />
early childhood program and receiving the majority of special<br />
education and related services in the regular early childhood program<br />
Allowable<br />
Difference<br />
LEA: 2002 - FORDYCE SCHOOL <strong>DISTRICT</strong><br />
Indicator 07: Preschool (3-5) Outcomes<br />
a) Percent of preschool CWD<br />
children who did not<br />
improve functioning.<br />
b) Percent of preschool CWD<br />
who improved but whose<br />
functioning remained below<br />
same age peers.<br />
c) Percent of preschool CWD<br />
who improved at a level<br />
nearer to same aged peers.<br />
d) Percent of preschool CWD<br />
who improved functioning to<br />
reach a level comparable to<br />
same age peers.<br />
e) Percent of preschool CWD<br />
children who maintain<br />
functioning at a level<br />
comparable to same aged<br />
peers.<br />
Summary<br />
Statements<br />
1) Of those preschool<br />
children who entered<br />
the preschool program<br />
below age expectations<br />
in each Outcome, the<br />
percent who<br />
substantially increased<br />
their rate of growth by<br />
the time they turned 6<br />
years of age or exited<br />
the program.<br />
2) The percent of<br />
preschool children who<br />
were functioning<br />
within age expectations<br />
in each Outcome by the<br />
time they turned 6<br />
years of age or exited<br />
A) Positive Social -Emotional<br />
Skills*<br />
State<br />
Rate<br />
A) Positive Social -<br />
Emotional Skills<br />
(Including social<br />
relationships)<br />
State<br />
Rate<br />
2.14%<br />
5.31%<br />
25.97%<br />
38.22%<br />
28.36%<br />
State<br />
Target<br />
LEA<br />
Rate<br />
LEA<br />
Rate<br />
— —<br />
— —<br />
— —<br />
— —<br />
— —<br />
Target<br />
Met by<br />
LEA(Y/N)<br />
B) Acquisition and Use of<br />
Knowledge and Skills<br />
(Including early language/<br />
communication and early literacy)<br />
B) Acquisition and Use of<br />
Knowledge and Skills **<br />
State<br />
Rate<br />
1.75%<br />
6.59%<br />
34.23%<br />
43.51%<br />
13.92%<br />
State<br />
Target<br />
LEA<br />
Rate<br />
Target<br />
Met by<br />
LEA(Y/N)<br />
C) Use of Appropriate Behaviors<br />
to Meet Their Needs<br />
State<br />
Rate<br />
State<br />
Target<br />
LEA<br />
Rate<br />
Target<br />
Met by<br />
LEA(Y/N)<br />
89.61% 90.50% — — N/A 90.31% 90.50% — — N/A 90.82% 92.50% — — N/A<br />
66.58% 69.50% — — N/A 57.43% 60.50% — — N/A 76.69% 78.50% — — N/A<br />
NOTE: * Including social relationships ** Including early language/ communication and early literacy<br />
Note: - - denotes not applicable<br />
State<br />
Rate<br />
LEA<br />
Rate<br />
— —<br />
— —<br />
— —<br />
— —<br />
— —<br />
C) Use of<br />
Appropriate<br />
Behaviors to<br />
Meet Their Needs<br />
State<br />
Rate<br />
4.51%<br />
17.34%<br />
41.72%<br />
34.97%<br />
LEA<br />
Rate<br />
1.46% — —<br />
— —<br />
— —<br />
— —<br />
— —<br />
Page 3 of 5
LEA: 2002 - FORDYCE SCHOOL <strong>DISTRICT</strong><br />
Indicator 08: Parent Involvement<br />
Percent of surveyed<br />
parents who reported<br />
school facilitated parent<br />
involvement as a means<br />
of improving services<br />
and results for children<br />
with disabilities.<br />
Early Childhood<br />
(3-5)<br />
School Age<br />
(5-21)<br />
State<br />
Rate<br />
90.47%<br />
95.05%<br />
Indicator 09: Disproportionality - Eligibility<br />
Disproportionate representation of racial<br />
and ethnic groups in special education and<br />
related services that is a result of<br />
inappropriate identification (e.g.<br />
monitoring data, review of policies,<br />
practices, and procedures under 618(d),<br />
etc.).<br />
State<br />
Rate<br />
State<br />
Target<br />
88.00%<br />
96.00%<br />
State<br />
Target<br />
0.00% 0.00%<br />
LEA<br />
Rate<br />
— —<br />
83.87%<br />
Indicator 10: Disproportionality-Child with a Disability<br />
Disproportionate representation of racial<br />
and ethnic groups in specific disability<br />
categories that is a result of inappropriate<br />
identification (e.g. monitoring data, review<br />
of policies, practices, and procedures under<br />
618(d), etc.).<br />
Indicator 11: Child Find<br />
Percent of children with<br />
parental consent to evaluate<br />
who are evaluated within<br />
the State established timeline<br />
of 60 days.<br />
Overall<br />
(3-21)<br />
Early Childhood<br />
(3-5)<br />
School Age<br />
(5-21)<br />
State<br />
Rate<br />
0.00%<br />
Indicator 12: Early Childhood Transition<br />
Percent of children referred by Part C prior to<br />
age 3, who are found eligible for Part B, and<br />
who have an IEP developed and implemented<br />
by their third birthday.<br />
Note: - - denotes not applicable<br />
State<br />
Rate<br />
99.41%<br />
99.70%<br />
98.97%<br />
State<br />
Rate<br />
State<br />
Target<br />
0.00%<br />
State<br />
Target<br />
100.00%<br />
100.00%<br />
100.00%<br />
State<br />
Target<br />
Target Met by<br />
LEA (Y/N)<br />
Y<br />
Target Met by<br />
LEA (Y/N)<br />
Y<br />
LEA<br />
Rate<br />
100.00%<br />
— —<br />
100.00%<br />
LEA<br />
Rate<br />
Target Met by<br />
LEA (Y/N)<br />
N/A<br />
N<br />
Note: The target for Indicator 09 is to have zero percent<br />
(0%) of districts identified as having disproportionate<br />
representation as a result of inappropriate<br />
identification in eligibility.<br />
Note: The target for Indicator 10 is to have zero<br />
percent (0%) of districts identified as having<br />
disproportionate representation as a result of<br />
inappropriate identification in a disability<br />
category.<br />
Target Met by<br />
LEA (Y/N)<br />
N/A<br />
Y<br />
Target Met<br />
by LEA<br />
(Y/N)<br />
99.21% 100.00% - - N/A<br />
Y<br />
Note: * Indicates a zero reponse rate for the<br />
district.<br />
Page 4 of 5
LEA: 2002 - FORDYCE SCHOOL <strong>DISTRICT</strong><br />
Indicator 13: Secondary Transition<br />
Percent of youth with disabilities aged 16 and<br />
up with an IEP that includes coordinated,<br />
measurable, annual IEP goals and transition<br />
services that will reasonably enable the student<br />
to meet the post-secondary goals.<br />
Indicator 14: Post-School Outcomes<br />
A. Percent of youth enrolled in higher<br />
education within one year of leaving high<br />
school.<br />
State<br />
Rate<br />
State<br />
Target<br />
Note: Data for this Indicator is from the on-site monitoring of LEAs for the given year.<br />
B. Percent of youth enrolled in higher<br />
education or competitively employed<br />
within one year of leaving high school.<br />
C. Percent of youth enrolled in higher<br />
education or in some other postsecondary<br />
education or training program; or<br />
competitively employed or in some other<br />
employment within one year of leaving<br />
high school.<br />
State<br />
Rate<br />
Indicator 20: Reported Data-Timely and Accurate*<br />
District submitted<br />
required data elements<br />
on or before due dates;<br />
made revisions within<br />
the alloted reveiw<br />
periods.<br />
Accurate and Timely<br />
Data Submission<br />
Overall (3-21)<br />
Early Childhood (3-5)<br />
School Age (5-21)<br />
State<br />
Target<br />
100.00%<br />
100.00%<br />
100.00%<br />
State<br />
Target<br />
LEA<br />
Rate<br />
LEA<br />
Rate<br />
Target Met by<br />
LEA (Y/N)<br />
Target Met<br />
by LEA<br />
(Y/N)<br />
Target Met<br />
by LEA<br />
(Y/N)<br />
*Data reviewed for timely and accurate submissions included all APSCN cycle data except for personnel<br />
Note: - - denotes not applicable<br />
96.19 100.00 100.00% Y<br />
14.53<br />
State<br />
Rate<br />
49.42<br />
State<br />
Rate<br />
54.07<br />
13.00<br />
State<br />
Target<br />
49.00<br />
State<br />
Target<br />
60.00<br />
Y<br />
N/A<br />
Y<br />
— —<br />
LEA<br />
Rate<br />
— —<br />
LEA<br />
Rate<br />
— —<br />
N/A<br />
Target Met<br />
by LEA<br />
(Y/N)<br />
N/A<br />
Target Met<br />
by LEA<br />
(Y/N)<br />
N/A<br />
Page 5 of 5
LEA: 2104 - DUMAS SCHOOL <strong>DISTRICT</strong><br />
<strong>ARKANSAS</strong> <strong>SPECIAL</strong> <strong>EDUCATION</strong><br />
<strong>DISTRICT</strong> <strong>ANNUAL</strong> PERFORMANCE REPORT<br />
2010/11 School Year<br />
Publication Date: March 2012<br />
Each State must have in place a State Performance Plan (SPP) to evaluate the State's efforts to meet the requirements and<br />
purposes of the implementation of the Individuals with Disabilities Education Act (IDEA). The SPP is a six-year plan, which<br />
describes Arkansas's performance on 20 indicators. The Office of Special Education Programs in the U. S. Department of<br />
Education requires that States report annually to the public on the performance of each local education agency (LEA) on 14 of<br />
20 indicators as compared with targets established by the State in the SPP. Arkansas will report indicators 1 through 14 and<br />
20 for each LEA serving children with disabilities (CWD). Any LEA not meeting targets on compliance indicators (0% for<br />
Indicators 4B, 09 & 10 and 100% for Indicators 11, 12, 13, and 20) are non-compliant with IDEA.<br />
There are no report changes for the 2010/11 school year profile; However, it is important to recognize that: .<br />
1. Indicator 01 (Graduation) is reported a year in arrear (2009/10 graduates) and is based on a four-year cohort. This<br />
means the rate is a measure of students who entered in ninth grade and graduate in four years. The calculation is a<br />
requirement under Title I of the Elementary and Secondary Education Act (ESEA).<br />
2. Indicator 02 (Drop out) is reported a year in arrear. This means the rate is a measure of students who dropped out in<br />
the 2009/10 school year. The Indicator 02 data are aligned with the Common Core of Data (CCD) requirements for<br />
grades 7-12.<br />
3. Indicator 04A and 4B (Suspension/Expulsion) is reported a year in arrear. This means the rate is a measure of<br />
students who had out-of-school suspensions and/or expulsions totaling more than 10 days.<br />
Percent of youth<br />
with IEPs<br />
graduating from<br />
high school with a<br />
regular diploma<br />
For a complete description of all the Indicators, please visit the special education website at<br />
http://arksped.k12.ar.us/sections/policy.html<br />
Indicator 01: Graduation Rates (2009/10 school year) Indicator 02: Dropout Rates (2009/10 school year)<br />
State<br />
Rate<br />
State<br />
Target<br />
75.76% 85.00%<br />
LEA<br />
Rate<br />
88.89%<br />
Target Met<br />
by LEA<br />
(Y/N)<br />
Y<br />
Percent of<br />
youth with<br />
IEPs dropping<br />
out of high<br />
school<br />
State<br />
Rate<br />
Indicator 03: Assessment on Statewide Benchmark Exam (grades 3-8, 11)<br />
A) Adequate Yearly Progress<br />
n=40<br />
Literacy<br />
Mathematics<br />
Met Disability Subgroup "n"<br />
for Reporting Purposes (Y/N)<br />
State Target for % of Districts Meeting<br />
AYP for Disability Subgroup<br />
State<br />
Target<br />
3.06% 4.20%<br />
LEA<br />
Rate<br />
5.63%<br />
% of Districts Meeting AYP<br />
for Disability Subgroup<br />
Target Met by<br />
LEA (Y/N)<br />
N<br />
Target Met by<br />
LEA(Y/N)<br />
Overall N 17.15% 6.25%<br />
NA<br />
N<br />
N<br />
Note: For a district to qualify as having a disability subgroup it must have a minimum of 40 (n=40) students with disabilities in a school building.<br />
B) Participation<br />
Participation Rate: # of<br />
CWD Tested ÷ # of CWD<br />
Enrolled in grades tested.<br />
Participation Rate: Literacy<br />
Participation Rate: Math<br />
Note: - - denotes not applicable<br />
State<br />
Rate<br />
98.78%<br />
State<br />
Target<br />
95.00%<br />
LEA<br />
Rate<br />
100.00%<br />
Target Met<br />
by LEA (Y/N)<br />
98.61% 95.00% 100.00% Y<br />
Y<br />
C) Performance Proficiency<br />
Percent of CWD Scoring<br />
Proficient or Above<br />
Proficiency Rate: Literacy<br />
Proficiency Rate:<br />
Mathematics<br />
16.00%<br />
16.00%<br />
State<br />
Rate<br />
31.49%<br />
44.86%<br />
State<br />
Target<br />
45.22%<br />
51.14%<br />
LEA<br />
Rate<br />
20.00%<br />
35.79%<br />
NA<br />
NA<br />
Target<br />
Met by<br />
LEA (Y/N)<br />
N<br />
N<br />
Page 1 of 5
LEA: 2104 - DUMAS SCHOOL <strong>DISTRICT</strong><br />
Indicator 04: Out-of-School Suspensions and Expulsions (2009/10 school year)<br />
A) Suspension/Expulsion<br />
Percent difference of CWD with out-of- school suspensions and<br />
expulsions totaling greater than 10 days in a school year as<br />
compared to the same data for general education students in<br />
the district.<br />
B) Suspension/Expulsion by Race and Ethnicity<br />
Percent of districts that have: (a) a significant discrepancy, by race or<br />
ethnicity, in the rate of suspensions and expulsions of greater than 10<br />
days in a school year for children with IEPs; and (b) policies,<br />
procedures or practices that contribute to the significant discrepancy<br />
and do not comply with requirements relating to the development<br />
and implementation of IEPs, the use of positive behavioral<br />
interventions and supports, and procedural safeguards.<br />
Indicator 05: School Age (5-21) Least Restrictive Environment<br />
A) In the Regular Class 80% or more of the day<br />
Percent of CWD with<br />
IEPs receiving instruction<br />
in the regular class 80%<br />
or more of the day.<br />
State<br />
Rate<br />
State<br />
Target<br />
LEA<br />
Rate<br />
B) In the Regular Class less than 40% of the day<br />
Percent of CWD with<br />
IEPs receiving instruction<br />
in the regular class less<br />
than 60% of the day.<br />
53.87% 59.77%<br />
State<br />
Rate<br />
State<br />
Target<br />
12.42% 12.51%<br />
37.74%<br />
LEA<br />
Rate<br />
16.35%<br />
C) Other Settings outside the regular class<br />
Percent of CWD with IEPs served in<br />
public or private separate schools,<br />
residential placements, or<br />
homebound/hospital placements.<br />
State<br />
Rate<br />
State<br />
Target<br />
2.80% 2.56%<br />
Target Met<br />
by LEA (Y/N)<br />
N<br />
Target Met<br />
by LEA (Y/N)<br />
N<br />
LEA<br />
Rate<br />
0.00%<br />
Target Met<br />
by LEA(Y/N)<br />
Indicator 06: Early Childhood (3-5) Least Restrictive Environment<br />
A) Regular Early Childhood Program<br />
Percent of children (aged 3 through 5) with IEPs attending a regular<br />
early childhood program and receiving the majority of special<br />
education and related services in the regular early childhood program<br />
Allowable<br />
Difference<br />
LEA: 2104 - DUMAS SCHOOL <strong>DISTRICT</strong><br />
Indicator 07: Preschool (3-5) Outcomes<br />
a) Percent of preschool CWD<br />
children who did not<br />
improve functioning.<br />
b) Percent of preschool CWD<br />
who improved but whose<br />
functioning remained below<br />
same age peers.<br />
c) Percent of preschool CWD<br />
who improved at a level<br />
nearer to same aged peers.<br />
d) Percent of preschool CWD<br />
who improved functioning to<br />
reach a level comparable to<br />
same age peers.<br />
e) Percent of preschool CWD<br />
children who maintain<br />
functioning at a level<br />
comparable to same aged<br />
peers.<br />
Summary<br />
Statements<br />
1) Of those preschool<br />
children who entered<br />
the preschool program<br />
below age expectations<br />
in each Outcome, the<br />
percent who<br />
substantially increased<br />
their rate of growth by<br />
the time they turned 6<br />
years of age or exited<br />
the program.<br />
2) The percent of<br />
preschool children who<br />
were functioning<br />
within age expectations<br />
in each Outcome by the<br />
time they turned 6<br />
years of age or exited<br />
A) Positive Social -Emotional<br />
Skills*<br />
State<br />
Rate<br />
A) Positive Social -<br />
Emotional Skills<br />
(Including social<br />
relationships)<br />
State<br />
Rate<br />
2.14%<br />
5.31%<br />
25.97%<br />
38.22%<br />
28.36%<br />
State<br />
Target<br />
LEA<br />
Rate<br />
LEA<br />
Rate<br />
— —<br />
— —<br />
— —<br />
— —<br />
— —<br />
Target<br />
Met by<br />
LEA(Y/N)<br />
B) Acquisition and Use of<br />
Knowledge and Skills<br />
(Including early language/<br />
communication and early literacy)<br />
B) Acquisition and Use of<br />
Knowledge and Skills **<br />
State<br />
Rate<br />
1.75%<br />
6.59%<br />
34.23%<br />
43.51%<br />
13.92%<br />
State<br />
Target<br />
LEA<br />
Rate<br />
Target<br />
Met by<br />
LEA(Y/N)<br />
C) Use of Appropriate Behaviors<br />
to Meet Their Needs<br />
State<br />
Rate<br />
State<br />
Target<br />
LEA<br />
Rate<br />
Target<br />
Met by<br />
LEA(Y/N)<br />
89.61% 90.50% — — N/A 90.31% 90.50% — — N/A 90.82% 92.50% — — N/A<br />
66.58% 69.50% — — N/A 57.43% 60.50% — — N/A 76.69% 78.50% — — N/A<br />
NOTE: * Including social relationships ** Including early language/ communication and early literacy<br />
Note: - - denotes not applicable<br />
State<br />
Rate<br />
LEA<br />
Rate<br />
— —<br />
— —<br />
— —<br />
— —<br />
— —<br />
C) Use of<br />
Appropriate<br />
Behaviors to<br />
Meet Their Needs<br />
State<br />
Rate<br />
4.51%<br />
17.34%<br />
41.72%<br />
34.97%<br />
LEA<br />
Rate<br />
1.46% — —<br />
— —<br />
— —<br />
— —<br />
— —<br />
Page 3 of 5
LEA: 2104 - DUMAS SCHOOL <strong>DISTRICT</strong><br />
Indicator 08: Parent Involvement<br />
Percent of surveyed<br />
parents who reported<br />
school facilitated parent<br />
involvement as a means<br />
of improving services<br />
and results for children<br />
with disabilities.<br />
Early Childhood<br />
(3-5)<br />
School Age<br />
(5-21)<br />
State<br />
Rate<br />
90.47%<br />
95.05%<br />
Indicator 09: Disproportionality - Eligibility<br />
Disproportionate representation of racial<br />
and ethnic groups in special education and<br />
related services that is a result of<br />
inappropriate identification (e.g.<br />
monitoring data, review of policies,<br />
practices, and procedures under 618(d),<br />
etc.).<br />
State<br />
Rate<br />
State<br />
Target<br />
88.00%<br />
96.00%<br />
State<br />
Target<br />
0.00% 0.00%<br />
LEA<br />
Rate<br />
— —<br />
90.74%<br />
Indicator 10: Disproportionality-Child with a Disability<br />
Disproportionate representation of racial<br />
and ethnic groups in specific disability<br />
categories that is a result of inappropriate<br />
identification (e.g. monitoring data, review<br />
of policies, practices, and procedures under<br />
618(d), etc.).<br />
Indicator 11: Child Find<br />
Percent of children with<br />
parental consent to evaluate<br />
who are evaluated within<br />
the State established timeline<br />
of 60 days.<br />
Overall<br />
(3-21)<br />
Early Childhood<br />
(3-5)<br />
School Age<br />
(5-21)<br />
State<br />
Rate<br />
0.00%<br />
Indicator 12: Early Childhood Transition<br />
Percent of children referred by Part C prior to<br />
age 3, who are found eligible for Part B, and<br />
who have an IEP developed and implemented<br />
by their third birthday.<br />
Note: - - denotes not applicable<br />
State<br />
Rate<br />
99.41%<br />
99.70%<br />
98.97%<br />
State<br />
Rate<br />
State<br />
Target<br />
0.00%<br />
State<br />
Target<br />
100.00%<br />
100.00%<br />
100.00%<br />
State<br />
Target<br />
Target Met by<br />
LEA (Y/N)<br />
Y<br />
Target Met by<br />
LEA (Y/N)<br />
Y<br />
LEA<br />
Rate<br />
100.00%<br />
— —<br />
100.00%<br />
LEA<br />
Rate<br />
Target Met by<br />
LEA (Y/N)<br />
N/A<br />
N<br />
Note: The target for Indicator 09 is to have zero percent<br />
(0%) of districts identified as having disproportionate<br />
representation as a result of inappropriate<br />
identification in eligibility.<br />
Note: The target for Indicator 10 is to have zero<br />
percent (0%) of districts identified as having<br />
disproportionate representation as a result of<br />
inappropriate identification in a disability<br />
category.<br />
Target Met by<br />
LEA (Y/N)<br />
N/A<br />
Y<br />
Target Met<br />
by LEA<br />
(Y/N)<br />
99.21% 100.00% - - N/A<br />
Y<br />
Note: * Indicates a zero reponse rate for the<br />
district.<br />
Page 4 of 5
LEA: 2104 - DUMAS SCHOOL <strong>DISTRICT</strong><br />
Indicator 13: Secondary Transition<br />
Percent of youth with disabilities aged 16 and<br />
up with an IEP that includes coordinated,<br />
measurable, annual IEP goals and transition<br />
services that will reasonably enable the student<br />
to meet the post-secondary goals.<br />
Indicator 14: Post-School Outcomes<br />
A. Percent of youth enrolled in higher<br />
education within one year of leaving high<br />
school.<br />
State<br />
Rate<br />
State<br />
Target<br />
Note: Data for this Indicator is from the on-site monitoring of LEAs for the given year.<br />
B. Percent of youth enrolled in higher<br />
education or competitively employed<br />
within one year of leaving high school.<br />
C. Percent of youth enrolled in higher<br />
education or in some other postsecondary<br />
education or training program; or<br />
competitively employed or in some other<br />
employment within one year of leaving<br />
high school.<br />
State<br />
Rate<br />
Indicator 20: Reported Data-Timely and Accurate*<br />
District submitted<br />
required data elements<br />
on or before due dates;<br />
made revisions within<br />
the alloted reveiw<br />
periods.<br />
Accurate and Timely<br />
Data Submission<br />
Overall (3-21)<br />
Early Childhood (3-5)<br />
School Age (5-21)<br />
State<br />
Target<br />
100.00%<br />
100.00%<br />
100.00%<br />
State<br />
Target<br />
LEA<br />
Rate<br />
LEA<br />
Rate<br />
Target Met by<br />
LEA (Y/N)<br />
Target Met<br />
by LEA<br />
(Y/N)<br />
Target Met<br />
by LEA<br />
(Y/N)<br />
*Data reviewed for timely and accurate submissions included all APSCN cycle data except for personnel<br />
Note: - - denotes not applicable<br />
96.19 100.00 — — N/A<br />
14.53<br />
State<br />
Rate<br />
49.42<br />
State<br />
Rate<br />
54.07<br />
13.00<br />
State<br />
Target<br />
49.00<br />
State<br />
Target<br />
60.00<br />
Y<br />
N/A<br />
Y<br />
— —<br />
LEA<br />
Rate<br />
— —<br />
LEA<br />
Rate<br />
— —<br />
N/A<br />
Target Met<br />
by LEA<br />
(Y/N)<br />
N/A<br />
Target Met<br />
by LEA<br />
(Y/N)<br />
N/A<br />
Page 5 of 5
LEA: 2105 - MCGEHEE SCHOOL <strong>DISTRICT</strong><br />
<strong>ARKANSAS</strong> <strong>SPECIAL</strong> <strong>EDUCATION</strong><br />
<strong>DISTRICT</strong> <strong>ANNUAL</strong> PERFORMANCE REPORT<br />
2010/11 School Year<br />
Publication Date: March 2012<br />
Each State must have in place a State Performance Plan (SPP) to evaluate the State's efforts to meet the requirements and<br />
purposes of the implementation of the Individuals with Disabilities Education Act (IDEA). The SPP is a six-year plan, which<br />
describes Arkansas's performance on 20 indicators. The Office of Special Education Programs in the U. S. Department of<br />
Education requires that States report annually to the public on the performance of each local education agency (LEA) on 14 of<br />
20 indicators as compared with targets established by the State in the SPP. Arkansas will report indicators 1 through 14 and<br />
20 for each LEA serving children with disabilities (CWD). Any LEA not meeting targets on compliance indicators (0% for<br />
Indicators 4B, 09 & 10 and 100% for Indicators 11, 12, 13, and 20) are non-compliant with IDEA.<br />
There are no report changes for the 2010/11 school year profile; However, it is important to recognize that: .<br />
1. Indicator 01 (Graduation) is reported a year in arrear (2009/10 graduates) and is based on a four-year cohort. This<br />
means the rate is a measure of students who entered in ninth grade and graduate in four years. The calculation is a<br />
requirement under Title I of the Elementary and Secondary Education Act (ESEA).<br />
2. Indicator 02 (Drop out) is reported a year in arrear. This means the rate is a measure of students who dropped out in<br />
the 2009/10 school year. The Indicator 02 data are aligned with the Common Core of Data (CCD) requirements for<br />
grades 7-12.<br />
3. Indicator 04A and 4B (Suspension/Expulsion) is reported a year in arrear. This means the rate is a measure of<br />
students who had out-of-school suspensions and/or expulsions totaling more than 10 days.<br />
Percent of youth<br />
with IEPs<br />
graduating from<br />
high school with a<br />
regular diploma<br />
For a complete description of all the Indicators, please visit the special education website at<br />
http://arksped.k12.ar.us/sections/policy.html<br />
Indicator 01: Graduation Rates (2009/10 school year) Indicator 02: Dropout Rates (2009/10 school year)<br />
State<br />
Rate<br />
State<br />
Target<br />
75.76% 85.00%<br />
LEA<br />
Rate<br />
84.62%<br />
Target Met<br />
by LEA<br />
(Y/N)<br />
N<br />
Percent of<br />
youth with<br />
IEPs dropping<br />
out of high<br />
school<br />
State<br />
Rate<br />
Indicator 03: Assessment on Statewide Benchmark Exam (grades 3-8, 11)<br />
A) Adequate Yearly Progress<br />
n=40<br />
Literacy<br />
Mathematics<br />
Met Disability Subgroup "n"<br />
for Reporting Purposes (Y/N)<br />
State Target for % of Districts Meeting<br />
AYP for Disability Subgroup<br />
State<br />
Target<br />
3.06% 4.20%<br />
LEA<br />
Rate<br />
0.00%<br />
% of Districts Meeting AYP<br />
for Disability Subgroup<br />
Target Met by<br />
LEA (Y/N)<br />
Y<br />
Target Met by<br />
LEA(Y/N)<br />
Overall N 17.15% 6.25%<br />
NA<br />
N<br />
N<br />
Note: For a district to qualify as having a disability subgroup it must have a minimum of 40 (n=40) students with disabilities in a school building.<br />
B) Participation<br />
Participation Rate: # of<br />
CWD Tested ÷ # of CWD<br />
Enrolled in grades tested.<br />
Participation Rate: Literacy<br />
Participation Rate: Math<br />
Note: - - denotes not applicable<br />
State<br />
Rate<br />
98.78%<br />
State<br />
Target<br />
95.00%<br />
LEA<br />
Rate<br />
100.00%<br />
Target Met<br />
by LEA (Y/N)<br />
98.61% 95.00% 100.00% Y<br />
Y<br />
C) Performance Proficiency<br />
Percent of CWD Scoring<br />
Proficient or Above<br />
Proficiency Rate: Literacy<br />
Proficiency Rate:<br />
Mathematics<br />
16.00%<br />
16.00%<br />
State<br />
Rate<br />
31.49%<br />
44.86%<br />
State<br />
Target<br />
45.22%<br />
51.14%<br />
LEA<br />
Rate<br />
14.08%<br />
32.35%<br />
NA<br />
NA<br />
Target<br />
Met by<br />
LEA (Y/N)<br />
N<br />
N<br />
Page 1 of 5
LEA: 2105 - MCGEHEE SCHOOL <strong>DISTRICT</strong><br />
Indicator 04: Out-of-School Suspensions and Expulsions (2009/10 school year)<br />
A) Suspension/Expulsion<br />
Percent difference of CWD with out-of- school suspensions and<br />
expulsions totaling greater than 10 days in a school year as<br />
compared to the same data for general education students in<br />
the district.<br />
B) Suspension/Expulsion by Race and Ethnicity<br />
Percent of districts that have: (a) a significant discrepancy, by race or<br />
ethnicity, in the rate of suspensions and expulsions of greater than 10<br />
days in a school year for children with IEPs; and (b) policies,<br />
procedures or practices that contribute to the significant discrepancy<br />
and do not comply with requirements relating to the development<br />
and implementation of IEPs, the use of positive behavioral<br />
interventions and supports, and procedural safeguards.<br />
Indicator 05: School Age (5-21) Least Restrictive Environment<br />
A) In the Regular Class 80% or more of the day<br />
Percent of CWD with<br />
IEPs receiving instruction<br />
in the regular class 80%<br />
or more of the day.<br />
State<br />
Rate<br />
State<br />
Target<br />
LEA<br />
Rate<br />
B) In the Regular Class less than 40% of the day<br />
Percent of CWD with<br />
IEPs receiving instruction<br />
in the regular class less<br />
than 60% of the day.<br />
53.87% 59.77%<br />
State<br />
Rate<br />
State<br />
Target<br />
12.42% 12.51%<br />
73.75%<br />
LEA<br />
Rate<br />
5.00%<br />
C) Other Settings outside the regular class<br />
Percent of CWD with IEPs served in<br />
public or private separate schools,<br />
residential placements, or<br />
homebound/hospital placements.<br />
State<br />
Rate<br />
State<br />
Target<br />
2.80% 2.56%<br />
Target Met<br />
by LEA (Y/N)<br />
Y<br />
Target Met<br />
by LEA (Y/N)<br />
Y<br />
LEA<br />
Rate<br />
0.00%<br />
Target Met<br />
by LEA(Y/N)<br />
Indicator 06: Early Childhood (3-5) Least Restrictive Environment<br />
A) Regular Early Childhood Program<br />
Percent of children (aged 3 through 5) with IEPs attending a regular<br />
early childhood program and receiving the majority of special<br />
education and related services in the regular early childhood program<br />
Allowable<br />
Difference<br />
LEA: 2105 - MCGEHEE SCHOOL <strong>DISTRICT</strong><br />
Indicator 07: Preschool (3-5) Outcomes<br />
a) Percent of preschool CWD<br />
children who did not<br />
improve functioning.<br />
b) Percent of preschool CWD<br />
who improved but whose<br />
functioning remained below<br />
same age peers.<br />
c) Percent of preschool CWD<br />
who improved at a level<br />
nearer to same aged peers.<br />
d) Percent of preschool CWD<br />
who improved functioning to<br />
reach a level comparable to<br />
same age peers.<br />
e) Percent of preschool CWD<br />
children who maintain<br />
functioning at a level<br />
comparable to same aged<br />
peers.<br />
Summary<br />
Statements<br />
1) Of those preschool<br />
children who entered<br />
the preschool program<br />
below age expectations<br />
in each Outcome, the<br />
percent who<br />
substantially increased<br />
their rate of growth by<br />
the time they turned 6<br />
years of age or exited<br />
the program.<br />
2) The percent of<br />
preschool children who<br />
were functioning<br />
within age expectations<br />
in each Outcome by the<br />
time they turned 6<br />
years of age or exited<br />
A) Positive Social -Emotional<br />
Skills*<br />
State<br />
Rate<br />
A) Positive Social -<br />
Emotional Skills<br />
(Including social<br />
relationships)<br />
State<br />
Rate<br />
2.14%<br />
5.31%<br />
25.97%<br />
38.22%<br />
28.36%<br />
State<br />
Target<br />
LEA<br />
Rate<br />
LEA<br />
Rate<br />
— —<br />
— —<br />
— —<br />
— —<br />
— —<br />
Target<br />
Met by<br />
LEA(Y/N)<br />
B) Acquisition and Use of<br />
Knowledge and Skills<br />
(Including early language/<br />
communication and early literacy)<br />
B) Acquisition and Use of<br />
Knowledge and Skills **<br />
State<br />
Rate<br />
1.75%<br />
6.59%<br />
34.23%<br />
43.51%<br />
13.92%<br />
State<br />
Target<br />
LEA<br />
Rate<br />
Target<br />
Met by<br />
LEA(Y/N)<br />
C) Use of Appropriate Behaviors<br />
to Meet Their Needs<br />
State<br />
Rate<br />
State<br />
Target<br />
LEA<br />
Rate<br />
Target<br />
Met by<br />
LEA(Y/N)<br />
89.61% 90.50% — — N/A 90.31% 90.50% — — N/A 90.82% 92.50% — — N/A<br />
66.58% 69.50% — — N/A 57.43% 60.50% — — N/A 76.69% 78.50% — — N/A<br />
NOTE: * Including social relationships ** Including early language/ communication and early literacy<br />
Note: - - denotes not applicable<br />
State<br />
Rate<br />
LEA<br />
Rate<br />
— —<br />
— —<br />
— —<br />
— —<br />
— —<br />
C) Use of<br />
Appropriate<br />
Behaviors to<br />
Meet Their Needs<br />
State<br />
Rate<br />
4.51%<br />
17.34%<br />
41.72%<br />
34.97%<br />
LEA<br />
Rate<br />
1.46% — —<br />
— —<br />
— —<br />
— —<br />
— —<br />
Page 3 of 5
LEA: 2105 - MCGEHEE SCHOOL <strong>DISTRICT</strong><br />
Indicator 08: Parent Involvement<br />
Percent of surveyed<br />
parents who reported<br />
school facilitated parent<br />
involvement as a means<br />
of improving services<br />
and results for children<br />
with disabilities.<br />
Early Childhood<br />
(3-5)<br />
School Age<br />
(5-21)<br />
State<br />
Rate<br />
90.47%<br />
95.05%<br />
Indicator 09: Disproportionality - Eligibility<br />
Disproportionate representation of racial<br />
and ethnic groups in special education and<br />
related services that is a result of<br />
inappropriate identification (e.g.<br />
monitoring data, review of policies,<br />
practices, and procedures under 618(d),<br />
etc.).<br />
State<br />
Rate<br />
State<br />
Target<br />
88.00%<br />
96.00%<br />
State<br />
Target<br />
0.00% 0.00%<br />
LEA<br />
Rate<br />
— —<br />
80.00%<br />
Indicator 10: Disproportionality-Child with a Disability<br />
Disproportionate representation of racial<br />
and ethnic groups in specific disability<br />
categories that is a result of inappropriate<br />
identification (e.g. monitoring data, review<br />
of policies, practices, and procedures under<br />
618(d), etc.).<br />
Indicator 11: Child Find<br />
Percent of children with<br />
parental consent to evaluate<br />
who are evaluated within<br />
the State established timeline<br />
of 60 days.<br />
Overall<br />
(3-21)<br />
Early Childhood<br />
(3-5)<br />
School Age<br />
(5-21)<br />
State<br />
Rate<br />
0.00%<br />
Indicator 12: Early Childhood Transition<br />
Percent of children referred by Part C prior to<br />
age 3, who are found eligible for Part B, and<br />
who have an IEP developed and implemented<br />
by their third birthday.<br />
Note: - - denotes not applicable<br />
State<br />
Rate<br />
99.41%<br />
99.70%<br />
98.97%<br />
State<br />
Rate<br />
State<br />
Target<br />
0.00%<br />
State<br />
Target<br />
100.00%<br />
100.00%<br />
100.00%<br />
State<br />
Target<br />
Target Met by<br />
LEA (Y/N)<br />
Y<br />
Target Met by<br />
LEA (Y/N)<br />
Y<br />
LEA<br />
Rate<br />
100.00%<br />
— —<br />
100.00%<br />
LEA<br />
Rate<br />
Target Met by<br />
LEA (Y/N)<br />
N/A<br />
N<br />
Note: The target for Indicator 09 is to have zero percent<br />
(0%) of districts identified as having disproportionate<br />
representation as a result of inappropriate<br />
identification in eligibility.<br />
Note: The target for Indicator 10 is to have zero<br />
percent (0%) of districts identified as having<br />
disproportionate representation as a result of<br />
inappropriate identification in a disability<br />
category.<br />
Target Met by<br />
LEA (Y/N)<br />
N/A<br />
Y<br />
Target Met<br />
by LEA<br />
(Y/N)<br />
99.21% 100.00% - - N/A<br />
Y<br />
Note: * Indicates a zero reponse rate for the<br />
district.<br />
Page 4 of 5
LEA: 2105 - MCGEHEE SCHOOL <strong>DISTRICT</strong><br />
Indicator 13: Secondary Transition<br />
Percent of youth with disabilities aged 16 and<br />
up with an IEP that includes coordinated,<br />
measurable, annual IEP goals and transition<br />
services that will reasonably enable the student<br />
to meet the post-secondary goals.<br />
Indicator 14: Post-School Outcomes<br />
A. Percent of youth enrolled in higher<br />
education within one year of leaving high<br />
school.<br />
State<br />
Rate<br />
State<br />
Target<br />
Note: Data for this Indicator is from the on-site monitoring of LEAs for the given year.<br />
B. Percent of youth enrolled in higher<br />
education or competitively employed<br />
within one year of leaving high school.<br />
C. Percent of youth enrolled in higher<br />
education or in some other postsecondary<br />
education or training program; or<br />
competitively employed or in some other<br />
employment within one year of leaving<br />
high school.<br />
State<br />
Rate<br />
Indicator 20: Reported Data-Timely and Accurate*<br />
District submitted<br />
required data elements<br />
on or before due dates;<br />
made revisions within<br />
the alloted reveiw<br />
periods.<br />
Accurate and Timely<br />
Data Submission<br />
Overall (3-21)<br />
Early Childhood (3-5)<br />
School Age (5-21)<br />
State<br />
Target<br />
100.00%<br />
100.00%<br />
100.00%<br />
State<br />
Target<br />
LEA<br />
Rate<br />
LEA<br />
Rate<br />
Target Met by<br />
LEA (Y/N)<br />
Target Met<br />
by LEA<br />
(Y/N)<br />
Target Met<br />
by LEA<br />
(Y/N)<br />
*Data reviewed for timely and accurate submissions included all APSCN cycle data except for personnel<br />
Note: - - denotes not applicable<br />
96.19 100.00 100.00% Y<br />
14.53<br />
State<br />
Rate<br />
49.42<br />
State<br />
Rate<br />
54.07<br />
13.00<br />
State<br />
Target<br />
49.00<br />
State<br />
Target<br />
60.00<br />
Y<br />
N/A<br />
Y<br />
— —<br />
LEA<br />
Rate<br />
— —<br />
LEA<br />
Rate<br />
— —<br />
N/A<br />
Target Met<br />
by LEA<br />
(Y/N)<br />
N/A<br />
Target Met<br />
by LEA<br />
(Y/N)<br />
N/A<br />
Page 5 of 5
<strong>ARKANSAS</strong> <strong>SPECIAL</strong> <strong>EDUCATION</strong><br />
<strong>DISTRICT</strong> <strong>ANNUAL</strong> PERFORMANCE REPORT<br />
2010/11 School Year<br />
Publication Date: March 2012<br />
Each State must have in place a State Performance Plan (SPP) to evaluate the State's efforts to meet the requirements and<br />
purposes of the implementation of the Individuals with Disabilities Education Act (IDEA). The SPP is a six-year plan, which<br />
describes Arkansas's performance on 20 indicators. The Office of Special Education Programs in the U. S. Department of<br />
Education requires that States report annually to the public on the performance of each local education agency (LEA) on 14 of<br />
20 indicators as compared with targets established by the State in the SPP. Arkansas will report indicators 1 through 14 and<br />
20 for each LEA serving children with disabilities (CWD). Any LEA not meeting targets on compliance indicators (0% for<br />
Indicators 4B, 09 & 10 and 100% for Indicators 11, 12, 13, and 20) are non-compliant with IDEA.<br />
There are no report changes for the 2010/11 school year profile; However, it is important to recognize that: .<br />
1. Indicator 01 (Graduation) is reported a year in arrear (2009/10 graduates) and is based on a four-year cohort. This<br />
means the rate is a measure of students who entered in ninth grade and graduate in four years. The calculation is a<br />
requirement under Title I of the Elementary and Secondary Education Act (ESEA).<br />
2. Indicator 02 (Drop out) is reported a year in arrear. This means the rate is a measure of students who dropped out in<br />
the 2009/10 school year. The Indicator 02 data are aligned with the Common Core of Data (CCD) requirements for<br />
grades 7-12.<br />
3. Indicator 04A and 4B (Suspension/Expulsion) is reported a year in arrear. This means the rate is a measure of<br />
students who had out-of-school suspensions and/or expulsions totaling more than 10 days.<br />
For a complete description of all the Indicators, please visit the special education website at<br />
http://arksped.k12.ar.us/sections/policy.html<br />
LEA: 2202 - DREW CENTRAL SCHOOL <strong>DISTRICT</strong><br />
Indicator 01: Graduation Rates (2009/10 school year) Indicator 02: Dropout Rates (2009/10 school year)<br />
Percent of youth<br />
with IEPs<br />
graduating from<br />
high school with a<br />
regular diploma<br />
State<br />
Rate<br />
State<br />
Target<br />
75.76% 85.00%<br />
LEA<br />
Rate<br />
100.00%<br />
Target Met<br />
by LEA<br />
(Y/N)<br />
Y<br />
Percent of<br />
youth with<br />
IEPs dropping<br />
out of high<br />
school<br />
State<br />
Rate<br />
Indicator 03: Assessment on Statewide Benchmark Exam (grades 3-8, 11)<br />
A) Adequate Yearly Progress<br />
n=40<br />
Literacy<br />
Mathematics<br />
Met Disability Subgroup "n"<br />
for Reporting Purposes (Y/N)<br />
State Target for % of Districts Meeting<br />
AYP for Disability Subgroup<br />
State<br />
Target<br />
3.06% 4.20%<br />
LEA<br />
Rate<br />
4.88%<br />
% of Districts Meeting AYP<br />
for Disability Subgroup<br />
Target Met by<br />
LEA (Y/N)<br />
N<br />
Target Met by<br />
LEA(Y/N)<br />
Overall N 17.15% 6.25%<br />
NA<br />
N<br />
N<br />
Note: For a district to qualify as having a disability subgroup it must have a minimum of 40 (n=40) students with disabilities in a school building.<br />
B) Participation<br />
Participation Rate: # of<br />
CWD Tested ÷ # of CWD<br />
Enrolled in grades tested.<br />
Participation Rate: Literacy<br />
Participation Rate: Math<br />
Note: - - denotes not applicable<br />
State<br />
Rate<br />
98.78%<br />
State<br />
Target<br />
95.00%<br />
LEA<br />
Rate<br />
100.00%<br />
Target Met<br />
by LEA (Y/N)<br />
98.61% 95.00% 100.00% Y<br />
Y<br />
C) Performance Proficiency<br />
Percent of CWD Scoring<br />
Proficient or Above<br />
Proficiency Rate: Literacy<br />
Proficiency Rate:<br />
Mathematics<br />
16.00%<br />
16.00%<br />
State<br />
Rate<br />
31.49%<br />
44.86%<br />
State<br />
Target<br />
45.22%<br />
51.14%<br />
LEA<br />
Rate<br />
33.33%<br />
60.61%<br />
NA<br />
NA<br />
Target<br />
Met by<br />
LEA (Y/N)<br />
N<br />
Y<br />
Page 1 of 5
LEA: 2202 - DREW CENTRAL SCHOOL <strong>DISTRICT</strong><br />
Indicator 04: Out-of-School Suspensions and Expulsions (2009/10 school year)<br />
A) Suspension/Expulsion<br />
Percent difference of CWD with out-of- school suspensions and<br />
expulsions totaling greater than 10 days in a school year as<br />
compared to the same data for general education students in<br />
the district.<br />
B) Suspension/Expulsion by Race and Ethnicity<br />
Percent of districts that have: (a) a significant discrepancy, by race or<br />
ethnicity, in the rate of suspensions and expulsions of greater than 10<br />
days in a school year for children with IEPs; and (b) policies,<br />
procedures or practices that contribute to the significant discrepancy<br />
and do not comply with requirements relating to the development<br />
and implementation of IEPs, the use of positive behavioral<br />
interventions and supports, and procedural safeguards.<br />
Indicator 05: School Age (5-21) Least Restrictive Environment<br />
A) In the Regular Class 80% or more of the day<br />
Percent of CWD with<br />
IEPs receiving instruction<br />
in the regular class 80%<br />
or more of the day.<br />
State<br />
Rate<br />
State<br />
Target<br />
LEA<br />
Rate<br />
B) In the Regular Class less than 40% of the day<br />
Percent of CWD with<br />
IEPs receiving instruction<br />
in the regular class less<br />
than 60% of the day.<br />
53.87% 59.77%<br />
State<br />
Rate<br />
State<br />
Target<br />
12.42% 12.51%<br />
70.19%<br />
LEA<br />
Rate<br />
10.58%<br />
C) Other Settings outside the regular class<br />
Percent of CWD with IEPs served in<br />
public or private separate schools,<br />
residential placements, or<br />
homebound/hospital placements.<br />
State<br />
Rate<br />
State<br />
Target<br />
2.80% 2.56%<br />
Target Met<br />
by LEA (Y/N)<br />
Y<br />
Target Met<br />
by LEA (Y/N)<br />
Y<br />
LEA<br />
Rate<br />
0.00%<br />
Target Met<br />
by LEA(Y/N)<br />
Indicator 06: Early Childhood (3-5) Least Restrictive Environment<br />
A) Regular Early Childhood Program<br />
Percent of children (aged 3 through 5) with IEPs attending a regular<br />
early childhood program and receiving the majority of special<br />
education and related services in the regular early childhood program<br />
Allowable<br />
Difference<br />
LEA: 2202 - DREW CENTRAL SCHOOL <strong>DISTRICT</strong><br />
Indicator 07: Preschool (3-5) Outcomes<br />
a) Percent of preschool CWD<br />
children who did not<br />
improve functioning.<br />
b) Percent of preschool CWD<br />
who improved but whose<br />
functioning remained below<br />
same age peers.<br />
c) Percent of preschool CWD<br />
who improved at a level<br />
nearer to same aged peers.<br />
d) Percent of preschool CWD<br />
who improved functioning to<br />
reach a level comparable to<br />
same age peers.<br />
e) Percent of preschool CWD<br />
children who maintain<br />
functioning at a level<br />
comparable to same aged<br />
peers.<br />
Summary<br />
Statements<br />
1) Of those preschool<br />
children who entered<br />
the preschool program<br />
below age expectations<br />
in each Outcome, the<br />
percent who<br />
substantially increased<br />
their rate of growth by<br />
the time they turned 6<br />
years of age or exited<br />
the program.<br />
2) The percent of<br />
preschool children who<br />
were functioning<br />
within age expectations<br />
in each Outcome by the<br />
time they turned 6<br />
years of age or exited<br />
A) Positive Social -Emotional<br />
Skills*<br />
State<br />
Rate<br />
A) Positive Social -<br />
Emotional Skills<br />
(Including social<br />
relationships)<br />
State<br />
Rate<br />
2.14%<br />
5.31%<br />
25.97%<br />
38.22%<br />
28.36%<br />
State<br />
Target<br />
LEA<br />
Rate<br />
LEA<br />
Rate<br />
— —<br />
— —<br />
— —<br />
— —<br />
— —<br />
Target<br />
Met by<br />
LEA(Y/N)<br />
B) Acquisition and Use of<br />
Knowledge and Skills<br />
(Including early language/<br />
communication and early literacy)<br />
B) Acquisition and Use of<br />
Knowledge and Skills **<br />
State<br />
Rate<br />
1.75%<br />
6.59%<br />
34.23%<br />
43.51%<br />
13.92%<br />
State<br />
Target<br />
LEA<br />
Rate<br />
Target<br />
Met by<br />
LEA(Y/N)<br />
C) Use of Appropriate Behaviors<br />
to Meet Their Needs<br />
State<br />
Rate<br />
State<br />
Target<br />
LEA<br />
Rate<br />
Target<br />
Met by<br />
LEA(Y/N)<br />
89.61% 90.50% — — N/A 90.31% 90.50% — — N/A 90.82% 92.50% — — N/A<br />
66.58% 69.50% — — N/A 57.43% 60.50% — — N/A 76.69% 78.50% — — N/A<br />
NOTE: * Including social relationships ** Including early language/ communication and early literacy<br />
Note: - - denotes not applicable<br />
State<br />
Rate<br />
LEA<br />
Rate<br />
— —<br />
— —<br />
— —<br />
— —<br />
— —<br />
C) Use of<br />
Appropriate<br />
Behaviors to<br />
Meet Their Needs<br />
State<br />
Rate<br />
4.51%<br />
17.34%<br />
41.72%<br />
34.97%<br />
LEA<br />
Rate<br />
1.46% — —<br />
— —<br />
— —<br />
— —<br />
— —<br />
Page 3 of 5
LEA: 2202 - DREW CENTRAL SCHOOL <strong>DISTRICT</strong><br />
Indicator 08: Parent Involvement<br />
Percent of surveyed<br />
parents who reported<br />
school facilitated parent<br />
involvement as a means<br />
of improving services<br />
and results for children<br />
with disabilities.<br />
Early Childhood<br />
(3-5)<br />
School Age<br />
(5-21)<br />
State<br />
Rate<br />
90.47%<br />
95.05%<br />
Indicator 09: Disproportionality - Eligibility<br />
Disproportionate representation of racial<br />
and ethnic groups in special education and<br />
related services that is a result of<br />
inappropriate identification (e.g.<br />
monitoring data, review of policies,<br />
practices, and procedures under 618(d),<br />
etc.).<br />
State<br />
Rate<br />
State<br />
Target<br />
88.00%<br />
96.00%<br />
State<br />
Target<br />
0.00% 0.00%<br />
LEA<br />
Rate<br />
— —<br />
95.45%<br />
Indicator 10: Disproportionality-Child with a Disability<br />
Disproportionate representation of racial<br />
and ethnic groups in specific disability<br />
categories that is a result of inappropriate<br />
identification (e.g. monitoring data, review<br />
of policies, practices, and procedures under<br />
618(d), etc.).<br />
Indicator 11: Child Find<br />
Percent of children with<br />
parental consent to evaluate<br />
who are evaluated within<br />
the State established timeline<br />
of 60 days.<br />
Overall<br />
(3-21)<br />
Early Childhood<br />
(3-5)<br />
School Age<br />
(5-21)<br />
State<br />
Rate<br />
0.00%<br />
Indicator 12: Early Childhood Transition<br />
Percent of children referred by Part C prior to<br />
age 3, who are found eligible for Part B, and<br />
who have an IEP developed and implemented<br />
by their third birthday.<br />
Note: - - denotes not applicable<br />
State<br />
Rate<br />
99.41%<br />
99.70%<br />
98.97%<br />
State<br />
Rate<br />
State<br />
Target<br />
0.00%<br />
State<br />
Target<br />
100.00%<br />
100.00%<br />
100.00%<br />
State<br />
Target<br />
Target Met by<br />
LEA (Y/N)<br />
Y<br />
Target Met by<br />
LEA (Y/N)<br />
Y<br />
LEA<br />
Rate<br />
100.00%<br />
— —<br />
100.00%<br />
LEA<br />
Rate<br />
Target Met by<br />
LEA (Y/N)<br />
N/A<br />
N<br />
Note: The target for Indicator 09 is to have zero percent<br />
(0%) of districts identified as having disproportionate<br />
representation as a result of inappropriate<br />
identification in eligibility.<br />
Note: The target for Indicator 10 is to have zero<br />
percent (0%) of districts identified as having<br />
disproportionate representation as a result of<br />
inappropriate identification in a disability<br />
category.<br />
Target Met by<br />
LEA (Y/N)<br />
N/A<br />
Y<br />
Target Met<br />
by LEA<br />
(Y/N)<br />
99.21% 100.00% - - N/A<br />
Y<br />
Note: * Indicates a zero reponse rate for the<br />
district.<br />
Page 4 of 5
LEA: 2202 - DREW CENTRAL SCHOOL <strong>DISTRICT</strong><br />
Indicator 13: Secondary Transition<br />
Percent of youth with disabilities aged 16 and<br />
up with an IEP that includes coordinated,<br />
measurable, annual IEP goals and transition<br />
services that will reasonably enable the student<br />
to meet the post-secondary goals.<br />
Indicator 14: Post-School Outcomes<br />
A. Percent of youth enrolled in higher<br />
education within one year of leaving high<br />
school.<br />
State<br />
Rate<br />
State<br />
Target<br />
Note: Data for this Indicator is from the on-site monitoring of LEAs for the given year.<br />
B. Percent of youth enrolled in higher<br />
education or competitively employed<br />
within one year of leaving high school.<br />
C. Percent of youth enrolled in higher<br />
education or in some other postsecondary<br />
education or training program; or<br />
competitively employed or in some other<br />
employment within one year of leaving<br />
high school.<br />
State<br />
Rate<br />
Indicator 20: Reported Data-Timely and Accurate*<br />
District submitted<br />
required data elements<br />
on or before due dates;<br />
made revisions within<br />
the alloted reveiw<br />
periods.<br />
Accurate and Timely<br />
Data Submission<br />
Overall (3-21)<br />
Early Childhood (3-5)<br />
School Age (5-21)<br />
State<br />
Target<br />
100.00%<br />
100.00%<br />
100.00%<br />
State<br />
Target<br />
LEA<br />
Rate<br />
LEA<br />
Rate<br />
Target Met by<br />
LEA (Y/N)<br />
Target Met<br />
by LEA<br />
(Y/N)<br />
Target Met<br />
by LEA<br />
(Y/N)<br />
*Data reviewed for timely and accurate submissions included all APSCN cycle data except for personnel<br />
Note: - - denotes not applicable<br />
96.19 100.00 100.00% Y<br />
14.53<br />
State<br />
Rate<br />
49.42<br />
State<br />
Rate<br />
54.07<br />
13.00<br />
State<br />
Target<br />
49.00<br />
State<br />
Target<br />
60.00<br />
Y<br />
N/A<br />
Y<br />
— —<br />
LEA<br />
Rate<br />
— —<br />
LEA<br />
Rate<br />
— —<br />
N/A<br />
Target Met<br />
by LEA<br />
(Y/N)<br />
N/A<br />
Target Met<br />
by LEA<br />
(Y/N)<br />
N/A<br />
Page 5 of 5
<strong>ARKANSAS</strong> <strong>SPECIAL</strong> <strong>EDUCATION</strong><br />
<strong>DISTRICT</strong> <strong>ANNUAL</strong> PERFORMANCE REPORT<br />
2010/11 School Year<br />
Publication Date: March 2012<br />
Each State must have in place a State Performance Plan (SPP) to evaluate the State's efforts to meet the requirements and<br />
purposes of the implementation of the Individuals with Disabilities Education Act (IDEA). The SPP is a six-year plan, which<br />
describes Arkansas's performance on 20 indicators. The Office of Special Education Programs in the U. S. Department of<br />
Education requires that States report annually to the public on the performance of each local education agency (LEA) on 14 of<br />
20 indicators as compared with targets established by the State in the SPP. Arkansas will report indicators 1 through 14 and<br />
20 for each LEA serving children with disabilities (CWD). Any LEA not meeting targets on compliance indicators (0% for<br />
Indicators 4B, 09 & 10 and 100% for Indicators 11, 12, 13, and 20) are non-compliant with IDEA.<br />
There are no report changes for the 2010/11 school year profile; However, it is important to recognize that: .<br />
1. Indicator 01 (Graduation) is reported a year in arrear (2009/10 graduates) and is based on a four-year cohort. This<br />
means the rate is a measure of students who entered in ninth grade and graduate in four years. The calculation is a<br />
requirement under Title I of the Elementary and Secondary Education Act (ESEA).<br />
2. Indicator 02 (Drop out) is reported a year in arrear. This means the rate is a measure of students who dropped out in<br />
the 2009/10 school year. The Indicator 02 data are aligned with the Common Core of Data (CCD) requirements for<br />
grades 7-12.<br />
3. Indicator 04A and 4B (Suspension/Expulsion) is reported a year in arrear. This means the rate is a measure of<br />
students who had out-of-school suspensions and/or expulsions totaling more than 10 days.<br />
For a complete description of all the Indicators, please visit the special education website at<br />
http://arksped.k12.ar.us/sections/policy.html<br />
LEA: 2203 - MONTICELLO SCHOOL <strong>DISTRICT</strong><br />
Indicator 01: Graduation Rates (2009/10 school year) Indicator 02: Dropout Rates (2009/10 school year)<br />
Percent of youth<br />
with IEPs<br />
graduating from<br />
high school with a<br />
regular diploma<br />
State<br />
Rate<br />
State<br />
Target<br />
75.76% 85.00%<br />
LEA<br />
Rate<br />
82.35%<br />
Target Met<br />
by LEA<br />
(Y/N)<br />
N<br />
Percent of<br />
youth with<br />
IEPs dropping<br />
out of high<br />
school<br />
State<br />
Rate<br />
Indicator 03: Assessment on Statewide Benchmark Exam (grades 3-8, 11)<br />
A) Adequate Yearly Progress<br />
n=40<br />
Literacy<br />
Mathematics<br />
Met Disability Subgroup "n"<br />
for Reporting Purposes (Y/N)<br />
State Target for % of Districts Meeting<br />
AYP for Disability Subgroup<br />
State<br />
Target<br />
3.06% 4.20%<br />
LEA<br />
Rate<br />
0.00%<br />
% of Districts Meeting AYP<br />
for Disability Subgroup<br />
Target Met by<br />
LEA (Y/N)<br />
Y<br />
Target Met by<br />
LEA(Y/N)<br />
Overall N 17.15% 6.25%<br />
NA<br />
N<br />
N<br />
Note: For a district to qualify as having a disability subgroup it must have a minimum of 40 (n=40) students with disabilities in a school building.<br />
B) Participation<br />
Participation Rate: # of<br />
CWD Tested ÷ # of CWD<br />
Enrolled in grades tested.<br />
Participation Rate: Literacy<br />
Participation Rate: Math<br />
Note: - - denotes not applicable<br />
State<br />
Rate<br />
98.78%<br />
State<br />
Target<br />
95.00%<br />
LEA<br />
Rate<br />
100.00%<br />
Target Met<br />
by LEA (Y/N)<br />
98.61% 95.00% 100.00% Y<br />
Y<br />
C) Performance Proficiency<br />
Percent of CWD Scoring<br />
Proficient or Above<br />
Proficiency Rate: Literacy<br />
Proficiency Rate:<br />
Mathematics<br />
16.00%<br />
16.00%<br />
State<br />
Rate<br />
31.49%<br />
44.86%<br />
State<br />
Target<br />
45.22%<br />
51.14%<br />
LEA<br />
Rate<br />
24.24%<br />
35.38%<br />
NA<br />
NA<br />
Target<br />
Met by<br />
LEA (Y/N)<br />
N<br />
N<br />
Page 1 of 5
LEA: 2203 - MONTICELLO SCHOOL <strong>DISTRICT</strong><br />
Indicator 04: Out-of-School Suspensions and Expulsions (2009/10 school year)<br />
A) Suspension/Expulsion<br />
Percent difference of CWD with out-of- school suspensions and<br />
expulsions totaling greater than 10 days in a school year as<br />
compared to the same data for general education students in<br />
the district.<br />
B) Suspension/Expulsion by Race and Ethnicity<br />
Percent of districts that have: (a) a significant discrepancy, by race or<br />
ethnicity, in the rate of suspensions and expulsions of greater than 10<br />
days in a school year for children with IEPs; and (b) policies,<br />
procedures or practices that contribute to the significant discrepancy<br />
and do not comply with requirements relating to the development<br />
and implementation of IEPs, the use of positive behavioral<br />
interventions and supports, and procedural safeguards.<br />
Indicator 05: School Age (5-21) Least Restrictive Environment<br />
A) In the Regular Class 80% or more of the day<br />
Percent of CWD with<br />
IEPs receiving instruction<br />
in the regular class 80%<br />
or more of the day.<br />
State<br />
Rate<br />
State<br />
Target<br />
LEA<br />
Rate<br />
B) In the Regular Class less than 40% of the day<br />
Percent of CWD with<br />
IEPs receiving instruction<br />
in the regular class less<br />
than 60% of the day.<br />
53.87% 59.77%<br />
State<br />
Rate<br />
State<br />
Target<br />
12.42% 12.51%<br />
57.14%<br />
LEA<br />
Rate<br />
4.57%<br />
C) Other Settings outside the regular class<br />
Percent of CWD with IEPs served in<br />
public or private separate schools,<br />
residential placements, or<br />
homebound/hospital placements.<br />
State<br />
Rate<br />
State<br />
Target<br />
2.80% 2.56%<br />
Target Met<br />
by LEA (Y/N)<br />
N<br />
Target Met<br />
by LEA (Y/N)<br />
Y<br />
LEA<br />
Rate<br />
0.00%<br />
Target Met<br />
by LEA(Y/N)<br />
Indicator 06: Early Childhood (3-5) Least Restrictive Environment<br />
A) Regular Early Childhood Program<br />
Percent of children (aged 3 through 5) with IEPs attending a regular<br />
early childhood program and receiving the majority of special<br />
education and related services in the regular early childhood program<br />
Allowable<br />
Difference<br />
LEA: 2203 - MONTICELLO SCHOOL <strong>DISTRICT</strong><br />
Indicator 07: Preschool (3-5) Outcomes<br />
a) Percent of preschool CWD<br />
children who did not<br />
improve functioning.<br />
b) Percent of preschool CWD<br />
who improved but whose<br />
functioning remained below<br />
same age peers.<br />
c) Percent of preschool CWD<br />
who improved at a level<br />
nearer to same aged peers.<br />
d) Percent of preschool CWD<br />
who improved functioning to<br />
reach a level comparable to<br />
same age peers.<br />
e) Percent of preschool CWD<br />
children who maintain<br />
functioning at a level<br />
comparable to same aged<br />
peers.<br />
Summary<br />
Statements<br />
1) Of those preschool<br />
children who entered<br />
the preschool program<br />
below age expectations<br />
in each Outcome, the<br />
percent who<br />
substantially increased<br />
their rate of growth by<br />
the time they turned 6<br />
years of age or exited<br />
the program.<br />
2) The percent of<br />
preschool children who<br />
were functioning<br />
within age expectations<br />
in each Outcome by the<br />
time they turned 6<br />
years of age or exited<br />
A) Positive Social -Emotional<br />
Skills*<br />
State<br />
Rate<br />
A) Positive Social -<br />
Emotional Skills<br />
(Including social<br />
relationships)<br />
State<br />
Rate<br />
2.14%<br />
5.31%<br />
25.97%<br />
38.22%<br />
28.36%<br />
State<br />
Target<br />
LEA<br />
Rate<br />
LEA<br />
Rate<br />
— —<br />
— —<br />
— —<br />
— —<br />
— —<br />
Target<br />
Met by<br />
LEA(Y/N)<br />
B) Acquisition and Use of<br />
Knowledge and Skills<br />
(Including early language/<br />
communication and early literacy)<br />
B) Acquisition and Use of<br />
Knowledge and Skills **<br />
State<br />
Rate<br />
1.75%<br />
6.59%<br />
34.23%<br />
43.51%<br />
13.92%<br />
State<br />
Target<br />
LEA<br />
Rate<br />
Target<br />
Met by<br />
LEA(Y/N)<br />
C) Use of Appropriate Behaviors<br />
to Meet Their Needs<br />
State<br />
Rate<br />
State<br />
Target<br />
LEA<br />
Rate<br />
Target<br />
Met by<br />
LEA(Y/N)<br />
89.61% 90.50% — — N/A 90.31% 90.50% — — N/A 90.82% 92.50% — — N/A<br />
66.58% 69.50% — — N/A 57.43% 60.50% — — N/A 76.69% 78.50% — — N/A<br />
NOTE: * Including social relationships ** Including early language/ communication and early literacy<br />
Note: - - denotes not applicable<br />
State<br />
Rate<br />
LEA<br />
Rate<br />
— —<br />
— —<br />
— —<br />
— —<br />
— —<br />
C) Use of<br />
Appropriate<br />
Behaviors to<br />
Meet Their Needs<br />
State<br />
Rate<br />
4.51%<br />
17.34%<br />
41.72%<br />
34.97%<br />
LEA<br />
Rate<br />
1.46% — —<br />
— —<br />
— —<br />
— —<br />
— —<br />
Page 3 of 5
LEA: 2203 - MONTICELLO SCHOOL <strong>DISTRICT</strong><br />
Indicator 08: Parent Involvement<br />
Percent of surveyed<br />
parents who reported<br />
school facilitated parent<br />
involvement as a means<br />
of improving services<br />
and results for children<br />
with disabilities.<br />
Early Childhood<br />
(3-5)<br />
School Age<br />
(5-21)<br />
State<br />
Rate<br />
90.47%<br />
95.05%<br />
Indicator 09: Disproportionality - Eligibility<br />
Disproportionate representation of racial<br />
and ethnic groups in special education and<br />
related services that is a result of<br />
inappropriate identification (e.g.<br />
monitoring data, review of policies,<br />
practices, and procedures under 618(d),<br />
etc.).<br />
State<br />
Rate<br />
State<br />
Target<br />
88.00%<br />
96.00%<br />
State<br />
Target<br />
0.00% 0.00%<br />
LEA<br />
Rate<br />
— —<br />
85.00%<br />
Indicator 10: Disproportionality-Child with a Disability<br />
Disproportionate representation of racial<br />
and ethnic groups in specific disability<br />
categories that is a result of inappropriate<br />
identification (e.g. monitoring data, review<br />
of policies, practices, and procedures under<br />
618(d), etc.).<br />
Indicator 11: Child Find<br />
Percent of children with<br />
parental consent to evaluate<br />
who are evaluated within<br />
the State established timeline<br />
of 60 days.<br />
Overall<br />
(3-21)<br />
Early Childhood<br />
(3-5)<br />
School Age<br />
(5-21)<br />
State<br />
Rate<br />
0.00%<br />
Indicator 12: Early Childhood Transition<br />
Percent of children referred by Part C prior to<br />
age 3, who are found eligible for Part B, and<br />
who have an IEP developed and implemented<br />
by their third birthday.<br />
Note: - - denotes not applicable<br />
State<br />
Rate<br />
99.41%<br />
99.70%<br />
98.97%<br />
State<br />
Rate<br />
State<br />
Target<br />
0.00%<br />
State<br />
Target<br />
100.00%<br />
100.00%<br />
100.00%<br />
State<br />
Target<br />
Target Met by<br />
LEA (Y/N)<br />
Y<br />
Target Met by<br />
LEA (Y/N)<br />
Y<br />
LEA<br />
Rate<br />
100.00%<br />
— —<br />
100.00%<br />
LEA<br />
Rate<br />
Target Met by<br />
LEA (Y/N)<br />
N/A<br />
N<br />
Note: The target for Indicator 09 is to have zero percent<br />
(0%) of districts identified as having disproportionate<br />
representation as a result of inappropriate<br />
identification in eligibility.<br />
Note: The target for Indicator 10 is to have zero<br />
percent (0%) of districts identified as having<br />
disproportionate representation as a result of<br />
inappropriate identification in a disability<br />
category.<br />
Target Met by<br />
LEA (Y/N)<br />
N/A<br />
Y<br />
Target Met<br />
by LEA<br />
(Y/N)<br />
99.21% 100.00% - - N/A<br />
Y<br />
Note: * Indicates a zero reponse rate for the<br />
district.<br />
Page 4 of 5
LEA: 2203 - MONTICELLO SCHOOL <strong>DISTRICT</strong><br />
Indicator 13: Secondary Transition<br />
Percent of youth with disabilities aged 16 and<br />
up with an IEP that includes coordinated,<br />
measurable, annual IEP goals and transition<br />
services that will reasonably enable the student<br />
to meet the post-secondary goals.<br />
Indicator 14: Post-School Outcomes<br />
A. Percent of youth enrolled in higher<br />
education within one year of leaving high<br />
school.<br />
State<br />
Rate<br />
State<br />
Target<br />
Note: Data for this Indicator is from the on-site monitoring of LEAs for the given year.<br />
B. Percent of youth enrolled in higher<br />
education or competitively employed<br />
within one year of leaving high school.<br />
C. Percent of youth enrolled in higher<br />
education or in some other postsecondary<br />
education or training program; or<br />
competitively employed or in some other<br />
employment within one year of leaving<br />
high school.<br />
State<br />
Rate<br />
Indicator 20: Reported Data-Timely and Accurate*<br />
District submitted<br />
required data elements<br />
on or before due dates;<br />
made revisions within<br />
the alloted reveiw<br />
periods.<br />
Accurate and Timely<br />
Data Submission<br />
Overall (3-21)<br />
Early Childhood (3-5)<br />
School Age (5-21)<br />
State<br />
Target<br />
100.00%<br />
100.00%<br />
100.00%<br />
State<br />
Target<br />
LEA<br />
Rate<br />
LEA<br />
Rate<br />
Target Met by<br />
LEA (Y/N)<br />
Target Met<br />
by LEA<br />
(Y/N)<br />
Target Met<br />
by LEA<br />
(Y/N)<br />
*Data reviewed for timely and accurate submissions included all APSCN cycle data except for personnel<br />
Note: - - denotes not applicable<br />
96.19 100.00 100.00% Y<br />
14.53<br />
State<br />
Rate<br />
49.42<br />
State<br />
Rate<br />
54.07<br />
13.00<br />
State<br />
Target<br />
49.00<br />
State<br />
Target<br />
60.00<br />
Y<br />
N/A<br />
Y<br />
— —<br />
LEA<br />
Rate<br />
— —<br />
LEA<br />
Rate<br />
— —<br />
N/A<br />
Target Met<br />
by LEA<br />
(Y/N)<br />
N/A<br />
Target Met<br />
by LEA<br />
(Y/N)<br />
N/A<br />
Page 5 of 5
<strong>ARKANSAS</strong> <strong>SPECIAL</strong> <strong>EDUCATION</strong><br />
<strong>DISTRICT</strong> <strong>ANNUAL</strong> PERFORMANCE REPORT<br />
2010/11 School Year<br />
Publication Date: March 2012<br />
Each State must have in place a State Performance Plan (SPP) to evaluate the State's efforts to meet the requirements and<br />
purposes of the implementation of the Individuals with Disabilities Education Act (IDEA). The SPP is a six-year plan, which<br />
describes Arkansas's performance on 20 indicators. The Office of Special Education Programs in the U. S. Department of<br />
Education requires that States report annually to the public on the performance of each local education agency (LEA) on 14 of<br />
20 indicators as compared with targets established by the State in the SPP. Arkansas will report indicators 1 through 14 and<br />
20 for each LEA serving children with disabilities (CWD). Any LEA not meeting targets on compliance indicators (0% for<br />
Indicators 4B, 09 & 10 and 100% for Indicators 11, 12, 13, and 20) are non-compliant with IDEA.<br />
There are no report changes for the 2010/11 school year profile; However, it is important to recognize that: .<br />
1. Indicator 01 (Graduation) is reported a year in arrear (2009/10 graduates) and is based on a four-year cohort. This<br />
means the rate is a measure of students who entered in ninth grade and graduate in four years. The calculation is a<br />
requirement under Title I of the Elementary and Secondary Education Act (ESEA).<br />
2. Indicator 02 (Drop out) is reported a year in arrear. This means the rate is a measure of students who dropped out in<br />
the 2009/10 school year. The Indicator 02 data are aligned with the Common Core of Data (CCD) requirements for<br />
grades 7-12.<br />
3. Indicator 04A and 4B (Suspension/Expulsion) is reported a year in arrear. This means the rate is a measure of<br />
students who had out-of-school suspensions and/or expulsions totaling more than 10 days.<br />
For a complete description of all the Indicators, please visit the special education website at<br />
http://arksped.k12.ar.us/sections/policy.html<br />
LEA: 2220 - SOUTHEAST <strong>ARKANSAS</strong> <strong>EDUCATION</strong>AL SERVICE CO-OP<br />
Indicator 01: Graduation Rates (2009/10 school year) Indicator 02: Dropout Rates (2009/10 school year)<br />
Percent of youth<br />
with IEPs<br />
graduating from<br />
high school with a<br />
regular diploma<br />
State<br />
Rate<br />
State<br />
Target<br />
75.76% 85.00%<br />
LEA<br />
Rate<br />
— —<br />
Target Met<br />
by LEA<br />
(Y/N)<br />
NA<br />
Percent of<br />
youth with<br />
IEPs dropping<br />
out of high<br />
school<br />
State<br />
Rate<br />
Indicator 03: Assessment on Statewide Benchmark Exam (grades 3-8, 11)<br />
A) Adequate Yearly Progress<br />
n=40<br />
Literacy<br />
Mathematics<br />
Met Disability Subgroup "n"<br />
for Reporting Purposes (Y/N)<br />
State Target for % of Districts Meeting<br />
AYP for Disability Subgroup<br />
State<br />
Target<br />
3.06% 4.20%<br />
LEA<br />
Rate<br />
— —<br />
% of Districts Meeting AYP<br />
for Disability Subgroup<br />
Target Met by<br />
LEA (Y/N)<br />
N/A<br />
Target Met by<br />
LEA(Y/N)<br />
Overall N/A 17.15% 6.25%<br />
N/A<br />
N/A<br />
N/A<br />
Note: For a district to qualify as having a disability subgroup it must have a minimum of 40 (n=40) students with disabilities in a school building.<br />
B) Participation<br />
Participation Rate: # of<br />
CWD Tested ÷ # of CWD<br />
Enrolled in grades tested.<br />
Participation Rate: Literacy<br />
Participation Rate: Math<br />
Note: - - denotes not applicable<br />
State<br />
Rate<br />
98.78%<br />
State<br />
Target<br />
95.00%<br />
LEA<br />
Rate<br />
— —<br />
Target Met<br />
by LEA (Y/N)<br />
N/A<br />
98.61% 95.00% — — N/A<br />
C) Performance Proficiency<br />
Percent of CWD Scoring<br />
Proficient or Above<br />
Proficiency Rate: Literacy<br />
Proficiency Rate:<br />
Mathematics<br />
16.00%<br />
16.00%<br />
State<br />
Rate<br />
31.49%<br />
44.86%<br />
State<br />
Target<br />
45.22%<br />
51.14%<br />
LEA<br />
Rate<br />
— —<br />
— —<br />
N/A<br />
N/A<br />
Target<br />
Met by<br />
LEA (Y/N)<br />
N/A<br />
N/A<br />
Page 1 of 5
LEA: 2220 - SOUTHEAST <strong>ARKANSAS</strong> <strong>EDUCATION</strong>AL SERVICE CO-OP<br />
Indicator 04: Out-of-School Suspensions and Expulsions (2009/10 school year)<br />
A) Suspension/Expulsion<br />
Percent difference of CWD with out-of- school suspensions and<br />
expulsions totaling greater than 10 days in a school year as<br />
compared to the same data for general education students in<br />
the district.<br />
B) Suspension/Expulsion by Race and Ethnicity<br />
Percent of districts that have: (a) a significant discrepancy, by race or<br />
ethnicity, in the rate of suspensions and expulsions of greater than 10<br />
days in a school year for children with IEPs; and (b) policies,<br />
procedures or practices that contribute to the significant discrepancy<br />
and do not comply with requirements relating to the development<br />
and implementation of IEPs, the use of positive behavioral<br />
interventions and supports, and procedural safeguards.<br />
Indicator 05: School Age (5-21) Least Restrictive Environment<br />
A) In the Regular Class 80% or more of the day<br />
Percent of CWD with<br />
IEPs receiving instruction<br />
in the regular class 80%<br />
or more of the day.<br />
State<br />
Rate<br />
State<br />
Target<br />
LEA<br />
Rate<br />
B) In the Regular Class less than 40% of the day<br />
Percent of CWD with<br />
IEPs receiving instruction<br />
in the regular class less<br />
than 60% of the day.<br />
53.87% 59.77%<br />
State<br />
Rate<br />
State<br />
Target<br />
12.42% 12.51%<br />
— —<br />
LEA<br />
Rate<br />
— —<br />
C) Other Settings outside the regular class<br />
Percent of CWD with IEPs served in<br />
public or private separate schools,<br />
residential placements, or<br />
homebound/hospital placements.<br />
State<br />
Rate<br />
State<br />
Target<br />
2.80% 2.56%<br />
Target Met<br />
by LEA (Y/N)<br />
N/A<br />
Target Met<br />
by LEA (Y/N)<br />
N/A<br />
LEA<br />
Rate<br />
— —<br />
Target Met<br />
by LEA(Y/N)<br />
N/A<br />
Indicator 06: Early Childhood (3-5) Least Restrictive Environment<br />
A) Regular Early Childhood Program<br />
Percent of children (aged 3 through 5) with IEPs attending a regular<br />
early childhood program and receiving the majority of special<br />
education and related services in the regular early childhood program<br />
Allowable<br />
Difference<br />
LEA: 2220 - SOUTHEAST <strong>ARKANSAS</strong> <strong>EDUCATION</strong>AL SERVICE CO-OP<br />
Indicator 07: Preschool (3-5) Outcomes<br />
a) Percent of preschool CWD<br />
children who did not<br />
improve functioning.<br />
b) Percent of preschool CWD<br />
who improved but whose<br />
functioning remained below<br />
same age peers.<br />
c) Percent of preschool CWD<br />
who improved at a level<br />
nearer to same aged peers.<br />
d) Percent of preschool CWD<br />
who improved functioning to<br />
reach a level comparable to<br />
same age peers.<br />
e) Percent of preschool CWD<br />
children who maintain<br />
functioning at a level<br />
comparable to same aged<br />
peers.<br />
Summary<br />
Statements<br />
1) Of those preschool<br />
children who entered<br />
the preschool program<br />
below age expectations<br />
in each Outcome, the<br />
percent who<br />
substantially increased<br />
their rate of growth by<br />
the time they turned 6<br />
years of age or exited<br />
the program.<br />
2) The percent of<br />
preschool children who<br />
were functioning<br />
within age expectations<br />
in each Outcome by the<br />
time they turned 6<br />
years of age or exited<br />
A) Positive Social -Emotional<br />
Skills*<br />
State<br />
Rate<br />
A) Positive Social -<br />
Emotional Skills<br />
(Including social<br />
relationships)<br />
State<br />
Rate<br />
2.14%<br />
5.31%<br />
25.97%<br />
38.22%<br />
28.36%<br />
State<br />
Target<br />
LEA<br />
Rate<br />
LEA<br />
Rate<br />
3.20%<br />
— —<br />
4.27%<br />
52.31%<br />
40.21%<br />
Target<br />
Met by<br />
LEA(Y/N)<br />
B) Acquisition and Use of<br />
Knowledge and Skills<br />
(Including early language/<br />
communication and early literacy)<br />
B) Acquisition and Use of<br />
Knowledge and Skills **<br />
State<br />
Rate<br />
1.75%<br />
6.59%<br />
34.23%<br />
43.51%<br />
13.92%<br />
State<br />
Target<br />
LEA<br />
Rate<br />
Target<br />
Met by<br />
LEA(Y/N)<br />
C) Use of Appropriate Behaviors<br />
to Meet Their Needs<br />
State<br />
Rate<br />
State<br />
Target<br />
LEA<br />
Rate<br />
Target<br />
Met by<br />
LEA(Y/N)<br />
89.61% 90.50% 94.64% Y 90.31% 90.50% 98.80% Y 90.82% 92.50% 95.80% Y<br />
66.58% 69.50% 92.53% Y 57.43% 60.50% 86.48% Y 76.69% 78.50% 96.44% Y<br />
NOTE: * Including social relationships ** Including early language/ communication and early literacy<br />
Note: - - denotes not applicable<br />
State<br />
Rate<br />
LEA<br />
Rate<br />
0.71%<br />
0.36%<br />
12.46%<br />
75.09%<br />
11.39%<br />
C) Use of<br />
Appropriate<br />
Behaviors to<br />
Meet Their Needs<br />
State<br />
Rate<br />
4.51%<br />
17.34%<br />
41.72%<br />
34.97%<br />
LEA<br />
Rate<br />
1.46% 2.14%<br />
— —<br />
1.42%<br />
47.33%<br />
49.11%<br />
Page 3 of 5
LEA: 2220 - SOUTHEAST <strong>ARKANSAS</strong> <strong>EDUCATION</strong>AL SERVICE CO-OP<br />
Indicator 08: Parent Involvement<br />
Percent of surveyed<br />
parents who reported<br />
school facilitated parent<br />
involvement as a means<br />
of improving services<br />
and results for children<br />
with disabilities.<br />
Early Childhood<br />
(3-5)<br />
School Age<br />
(5-21)<br />
State<br />
Rate<br />
90.47%<br />
95.05%<br />
Indicator 09: Disproportionality - Eligibility<br />
Disproportionate representation of racial<br />
and ethnic groups in special education and<br />
related services that is a result of<br />
inappropriate identification (e.g.<br />
monitoring data, review of policies,<br />
practices, and procedures under 618(d),<br />
etc.).<br />
State<br />
Rate<br />
State<br />
Target<br />
88.00%<br />
96.00%<br />
State<br />
Target<br />
0.00% 0.00%<br />
LEA<br />
Rate<br />
92.49%<br />
— —<br />
Indicator 10: Disproportionality-Child with a Disability<br />
Disproportionate representation of racial<br />
and ethnic groups in specific disability<br />
categories that is a result of inappropriate<br />
identification (e.g. monitoring data, review<br />
of policies, practices, and procedures under<br />
618(d), etc.).<br />
Indicator 11: Child Find<br />
Percent of children with<br />
parental consent to evaluate<br />
who are evaluated within<br />
the State established timeline<br />
of 60 days.<br />
Overall<br />
(3-21)<br />
Early Childhood<br />
(3-5)<br />
School Age<br />
(5-21)<br />
State<br />
Rate<br />
0.00%<br />
Indicator 12: Early Childhood Transition<br />
Percent of children referred by Part C prior to<br />
age 3, who are found eligible for Part B, and<br />
who have an IEP developed and implemented<br />
by their third birthday.<br />
Note: - - denotes not applicable<br />
State<br />
Rate<br />
99.41%<br />
99.70%<br />
98.97%<br />
State<br />
Rate<br />
State<br />
Target<br />
0.00%<br />
State<br />
Target<br />
100.00%<br />
100.00%<br />
100.00%<br />
State<br />
Target<br />
Target Met by<br />
LEA (Y/N)<br />
N/A<br />
Target Met by<br />
LEA (Y/N)<br />
N/A<br />
LEA<br />
Rate<br />
100.00%<br />
100.00%<br />
— —<br />
LEA<br />
Rate<br />
Target Met by<br />
LEA (Y/N)<br />
Y<br />
N/A<br />
Note: The target for Indicator 09 is to have zero percent<br />
(0%) of districts identified as having disproportionate<br />
representation as a result of inappropriate<br />
identification in eligibility.<br />
Note: The target for Indicator 10 is to have zero<br />
percent (0%) of districts identified as having<br />
disproportionate representation as a result of<br />
inappropriate identification in a disability<br />
category.<br />
Target Met by<br />
LEA (Y/N)<br />
Y<br />
N/A<br />
Target Met<br />
by LEA<br />
(Y/N)<br />
99.21% 100.00% - - N/A<br />
Y<br />
Note: * Indicates a zero reponse rate for the<br />
district.<br />
Page 4 of 5
LEA: 2220 - SOUTHEAST <strong>ARKANSAS</strong> <strong>EDUCATION</strong>AL SERVICE CO-OP<br />
Indicator 13: Secondary Transition<br />
Percent of youth with disabilities aged 16 and<br />
up with an IEP that includes coordinated,<br />
measurable, annual IEP goals and transition<br />
services that will reasonably enable the student<br />
to meet the post-secondary goals.<br />
Indicator 14: Post-School Outcomes<br />
A. Percent of youth enrolled in higher<br />
education within one year of leaving high<br />
school.<br />
State<br />
Rate<br />
State<br />
Target<br />
Note: Data for this Indicator is from the on-site monitoring of LEAs for the given year.<br />
B. Percent of youth enrolled in higher<br />
education or competitively employed<br />
within one year of leaving high school.<br />
C. Percent of youth enrolled in higher<br />
education or in some other postsecondary<br />
education or training program; or<br />
competitively employed or in some other<br />
employment within one year of leaving<br />
high school.<br />
State<br />
Rate<br />
Indicator 20: Reported Data-Timely and Accurate*<br />
District submitted<br />
required data elements<br />
on or before due dates;<br />
made revisions within<br />
the alloted reveiw<br />
periods.<br />
Accurate and Timely<br />
Data Submission<br />
Overall (3-21)<br />
Early Childhood (3-5)<br />
School Age (5-21)<br />
State<br />
Target<br />
100.00%<br />
100.00%<br />
100.00%<br />
State<br />
Target<br />
LEA<br />
Rate<br />
LEA<br />
Rate<br />
Target Met by<br />
LEA (Y/N)<br />
Target Met<br />
by LEA<br />
(Y/N)<br />
Target Met<br />
by LEA<br />
(Y/N)<br />
*Data reviewed for timely and accurate submissions included all APSCN cycle data except for personnel<br />
Note: - - denotes not applicable<br />
96.19 100.00 — — N/A<br />
14.53<br />
State<br />
Rate<br />
49.42<br />
State<br />
Rate<br />
54.07<br />
13.00<br />
State<br />
Target<br />
49.00<br />
State<br />
Target<br />
60.00<br />
Y<br />
Y<br />
N/A<br />
— —<br />
LEA<br />
Rate<br />
— —<br />
LEA<br />
Rate<br />
— —<br />
N/A<br />
Target Met<br />
by LEA<br />
(Y/N)<br />
N/A<br />
Target Met<br />
by LEA<br />
(Y/N)<br />
N/A<br />
Page 5 of 5
LEA: 2301 - CONWAY SCHOOL <strong>DISTRICT</strong><br />
<strong>ARKANSAS</strong> <strong>SPECIAL</strong> <strong>EDUCATION</strong><br />
<strong>DISTRICT</strong> <strong>ANNUAL</strong> PERFORMANCE REPORT<br />
2010/11 School Year<br />
Publication Date: March 2012<br />
Each State must have in place a State Performance Plan (SPP) to evaluate the State's efforts to meet the requirements and<br />
purposes of the implementation of the Individuals with Disabilities Education Act (IDEA). The SPP is a six-year plan, which<br />
describes Arkansas's performance on 20 indicators. The Office of Special Education Programs in the U. S. Department of<br />
Education requires that States report annually to the public on the performance of each local education agency (LEA) on 14 of<br />
20 indicators as compared with targets established by the State in the SPP. Arkansas will report indicators 1 through 14 and<br />
20 for each LEA serving children with disabilities (CWD). Any LEA not meeting targets on compliance indicators (0% for<br />
Indicators 4B, 09 & 10 and 100% for Indicators 11, 12, 13, and 20) are non-compliant with IDEA.<br />
There are no report changes for the 2010/11 school year profile; However, it is important to recognize that: .<br />
1. Indicator 01 (Graduation) is reported a year in arrear (2009/10 graduates) and is based on a four-year cohort. This<br />
means the rate is a measure of students who entered in ninth grade and graduate in four years. The calculation is a<br />
requirement under Title I of the Elementary and Secondary Education Act (ESEA).<br />
2. Indicator 02 (Drop out) is reported a year in arrear. This means the rate is a measure of students who dropped out in<br />
the 2009/10 school year. The Indicator 02 data are aligned with the Common Core of Data (CCD) requirements for<br />
grades 7-12.<br />
3. Indicator 04A and 4B (Suspension/Expulsion) is reported a year in arrear. This means the rate is a measure of<br />
students who had out-of-school suspensions and/or expulsions totaling more than 10 days.<br />
Percent of youth<br />
with IEPs<br />
graduating from<br />
high school with a<br />
regular diploma<br />
For a complete description of all the Indicators, please visit the special education website at<br />
http://arksped.k12.ar.us/sections/policy.html<br />
Indicator 01: Graduation Rates (2009/10 school year) Indicator 02: Dropout Rates (2009/10 school year)<br />
State<br />
Rate<br />
State<br />
Target<br />
75.76% 85.00%<br />
LEA<br />
Rate<br />
72.92%<br />
Target Met<br />
by LEA<br />
(Y/N)<br />
N<br />
Percent of<br />
youth with<br />
IEPs dropping<br />
out of high<br />
school<br />
State<br />
Rate<br />
Indicator 03: Assessment on Statewide Benchmark Exam (grades 3-8, 11)<br />
A) Adequate Yearly Progress<br />
n=40<br />
Literacy<br />
Mathematics<br />
Met Disability Subgroup "n"<br />
for Reporting Purposes (Y/N)<br />
State Target for % of Districts Meeting<br />
AYP for Disability Subgroup<br />
State<br />
Target<br />
3.06% 4.20%<br />
LEA<br />
Rate<br />
6.78%<br />
% of Districts Meeting AYP<br />
for Disability Subgroup<br />
Target Met by<br />
LEA (Y/N)<br />
N<br />
Target Met by<br />
LEA(Y/N)<br />
Overall Y 17.15% 6.25%<br />
N<br />
Y<br />
Y<br />
Note: For a district to qualify as having a disability subgroup it must have a minimum of 40 (n=40) students with disabilities in a school building.<br />
B) Participation<br />
Participation Rate: # of<br />
CWD Tested ÷ # of CWD<br />
Enrolled in grades tested.<br />
Participation Rate: Literacy<br />
Participation Rate: Math<br />
Note: - - denotes not applicable<br />
State<br />
Rate<br />
98.78%<br />
State<br />
Target<br />
95.00%<br />
LEA<br />
Rate<br />
99.33%<br />
Target Met<br />
by LEA (Y/N)<br />
98.61% 95.00% 99.69% Y<br />
Y<br />
C) Performance Proficiency<br />
Percent of CWD Scoring<br />
Proficient or Above<br />
Proficiency Rate: Literacy<br />
Proficiency Rate:<br />
Mathematics<br />
16.00%<br />
16.00%<br />
State<br />
Rate<br />
31.49%<br />
44.86%<br />
State<br />
Target<br />
45.22%<br />
51.14%<br />
LEA<br />
Rate<br />
46.14%<br />
70.46%<br />
N<br />
N<br />
Target<br />
Met by<br />
LEA (Y/N)<br />
Y<br />
Y<br />
Page 1 of 5
LEA: 2301 - CONWAY SCHOOL <strong>DISTRICT</strong><br />
Indicator 04: Out-of-School Suspensions and Expulsions (2009/10 school year)<br />
A) Suspension/Expulsion<br />
Percent difference of CWD with out-of- school suspensions and<br />
expulsions totaling greater than 10 days in a school year as<br />
compared to the same data for general education students in<br />
the district.<br />
B) Suspension/Expulsion by Race and Ethnicity<br />
Percent of districts that have: (a) a significant discrepancy, by race or<br />
ethnicity, in the rate of suspensions and expulsions of greater than 10<br />
days in a school year for children with IEPs; and (b) policies,<br />
procedures or practices that contribute to the significant discrepancy<br />
and do not comply with requirements relating to the development<br />
and implementation of IEPs, the use of positive behavioral<br />
interventions and supports, and procedural safeguards.<br />
Indicator 05: School Age (5-21) Least Restrictive Environment<br />
A) In the Regular Class 80% or more of the day<br />
Percent of CWD with<br />
IEPs receiving instruction<br />
in the regular class 80%<br />
or more of the day.<br />
State<br />
Rate<br />
State<br />
Target<br />
LEA<br />
Rate<br />
B) In the Regular Class less than 40% of the day<br />
Percent of CWD with<br />
IEPs receiving instruction<br />
in the regular class less<br />
than 60% of the day.<br />
53.87% 59.77%<br />
State<br />
Rate<br />
State<br />
Target<br />
12.42% 12.51%<br />
59.36%<br />
LEA<br />
Rate<br />
17.21%<br />
C) Other Settings outside the regular class<br />
Percent of CWD with IEPs served in<br />
public or private separate schools,<br />
residential placements, or<br />
homebound/hospital placements.<br />
State<br />
Rate<br />
State<br />
Target<br />
2.80% 2.56%<br />
Target Met<br />
by LEA (Y/N)<br />
N<br />
Target Met<br />
by LEA (Y/N)<br />
N<br />
LEA<br />
Rate<br />
0.89%<br />
Target Met<br />
by LEA(Y/N)<br />
Indicator 06: Early Childhood (3-5) Least Restrictive Environment<br />
A) Regular Early Childhood Program<br />
Percent of children (aged 3 through 5) with IEPs attending a regular<br />
early childhood program and receiving the majority of special<br />
education and related services in the regular early childhood program<br />
Allowable<br />
Difference<br />
LEA: 2301 - CONWAY SCHOOL <strong>DISTRICT</strong><br />
Indicator 07: Preschool (3-5) Outcomes<br />
a) Percent of preschool CWD<br />
children who did not<br />
improve functioning.<br />
b) Percent of preschool CWD<br />
who improved but whose<br />
functioning remained below<br />
same age peers.<br />
c) Percent of preschool CWD<br />
who improved at a level<br />
nearer to same aged peers.<br />
d) Percent of preschool CWD<br />
who improved functioning to<br />
reach a level comparable to<br />
same age peers.<br />
e) Percent of preschool CWD<br />
children who maintain<br />
functioning at a level<br />
comparable to same aged<br />
peers.<br />
Summary<br />
Statements<br />
1) Of those preschool<br />
children who entered<br />
the preschool program<br />
below age expectations<br />
in each Outcome, the<br />
percent who<br />
substantially increased<br />
their rate of growth by<br />
the time they turned 6<br />
years of age or exited<br />
the program.<br />
2) The percent of<br />
preschool children who<br />
were functioning<br />
within age expectations<br />
in each Outcome by the<br />
time they turned 6<br />
years of age or exited<br />
A) Positive Social -Emotional<br />
Skills*<br />
State<br />
Rate<br />
A) Positive Social -<br />
Emotional Skills<br />
(Including social<br />
relationships)<br />
State<br />
Rate<br />
2.14%<br />
5.31%<br />
25.97%<br />
38.22%<br />
28.36%<br />
State<br />
Target<br />
LEA<br />
Rate<br />
LEA<br />
Rate<br />
— —<br />
— —<br />
— —<br />
— —<br />
— —<br />
Target<br />
Met by<br />
LEA(Y/N)<br />
B) Acquisition and Use of<br />
Knowledge and Skills<br />
(Including early language/<br />
communication and early literacy)<br />
B) Acquisition and Use of<br />
Knowledge and Skills **<br />
State<br />
Rate<br />
1.75%<br />
6.59%<br />
34.23%<br />
43.51%<br />
13.92%<br />
State<br />
Target<br />
LEA<br />
Rate<br />
Target<br />
Met by<br />
LEA(Y/N)<br />
C) Use of Appropriate Behaviors<br />
to Meet Their Needs<br />
State<br />
Rate<br />
State<br />
Target<br />
LEA<br />
Rate<br />
Target<br />
Met by<br />
LEA(Y/N)<br />
89.61% 90.50% — — N/A 90.31% 90.50% — — N/A 90.82% 92.50% — — N/A<br />
66.58% 69.50% — — N/A 57.43% 60.50% — — N/A 76.69% 78.50% — — N/A<br />
NOTE: * Including social relationships ** Including early language/ communication and early literacy<br />
Note: - - denotes not applicable<br />
State<br />
Rate<br />
LEA<br />
Rate<br />
— —<br />
— —<br />
— —<br />
— —<br />
— —<br />
C) Use of<br />
Appropriate<br />
Behaviors to<br />
Meet Their Needs<br />
State<br />
Rate<br />
4.51%<br />
17.34%<br />
41.72%<br />
34.97%<br />
LEA<br />
Rate<br />
1.46% — —<br />
— —<br />
— —<br />
— —<br />
— —<br />
Page 3 of 5
LEA: 2301 - CONWAY SCHOOL <strong>DISTRICT</strong><br />
Indicator 08: Parent Involvement<br />
Percent of surveyed<br />
parents who reported<br />
school facilitated parent<br />
involvement as a means<br />
of improving services<br />
and results for children<br />
with disabilities.<br />
Early Childhood<br />
(3-5)<br />
School Age<br />
(5-21)<br />
State<br />
Rate<br />
90.47%<br />
95.05%<br />
Indicator 09: Disproportionality - Eligibility<br />
Disproportionate representation of racial<br />
and ethnic groups in special education and<br />
related services that is a result of<br />
inappropriate identification (e.g.<br />
monitoring data, review of policies,<br />
practices, and procedures under 618(d),<br />
etc.).<br />
State<br />
Rate<br />
State<br />
Target<br />
88.00%<br />
96.00%<br />
State<br />
Target<br />
0.00% 0.00%<br />
LEA<br />
Rate<br />
— —<br />
92.94%<br />
Indicator 10: Disproportionality-Child with a Disability<br />
Disproportionate representation of racial<br />
and ethnic groups in specific disability<br />
categories that is a result of inappropriate<br />
identification (e.g. monitoring data, review<br />
of policies, practices, and procedures under<br />
618(d), etc.).<br />
Indicator 11: Child Find<br />
Percent of children with<br />
parental consent to evaluate<br />
who are evaluated within<br />
the State established timeline<br />
of 60 days.<br />
Overall<br />
(3-21)<br />
Early Childhood<br />
(3-5)<br />
School Age<br />
(5-21)<br />
State<br />
Rate<br />
0.00%<br />
Indicator 12: Early Childhood Transition<br />
Percent of children referred by Part C prior to<br />
age 3, who are found eligible for Part B, and<br />
who have an IEP developed and implemented<br />
by their third birthday.<br />
Note: - - denotes not applicable<br />
State<br />
Rate<br />
99.41%<br />
99.70%<br />
98.97%<br />
State<br />
Rate<br />
State<br />
Target<br />
0.00%<br />
State<br />
Target<br />
100.00%<br />
100.00%<br />
100.00%<br />
State<br />
Target<br />
Target Met by<br />
LEA (Y/N)<br />
Y<br />
Target Met by<br />
LEA (Y/N)<br />
Y<br />
LEA<br />
Rate<br />
100.00%<br />
— —<br />
100.00%<br />
LEA<br />
Rate<br />
Target Met by<br />
LEA (Y/N)<br />
N/A<br />
N<br />
Note: The target for Indicator 09 is to have zero percent<br />
(0%) of districts identified as having disproportionate<br />
representation as a result of inappropriate<br />
identification in eligibility.<br />
Note: The target for Indicator 10 is to have zero<br />
percent (0%) of districts identified as having<br />
disproportionate representation as a result of<br />
inappropriate identification in a disability<br />
category.<br />
Target Met by<br />
LEA (Y/N)<br />
N/A<br />
Y<br />
Target Met<br />
by LEA<br />
(Y/N)<br />
99.21% 100.00% - - N/A<br />
Y<br />
Note: * Indicates a zero reponse rate for the<br />
district.<br />
Page 4 of 5
LEA: 2301 - CONWAY SCHOOL <strong>DISTRICT</strong><br />
Indicator 13: Secondary Transition<br />
Percent of youth with disabilities aged 16 and<br />
up with an IEP that includes coordinated,<br />
measurable, annual IEP goals and transition<br />
services that will reasonably enable the student<br />
to meet the post-secondary goals.<br />
Indicator 14: Post-School Outcomes<br />
A. Percent of youth enrolled in higher<br />
education within one year of leaving high<br />
school.<br />
State<br />
Rate<br />
State<br />
Target<br />
Note: Data for this Indicator is from the on-site monitoring of LEAs for the given year.<br />
B. Percent of youth enrolled in higher<br />
education or competitively employed<br />
within one year of leaving high school.<br />
C. Percent of youth enrolled in higher<br />
education or in some other postsecondary<br />
education or training program; or<br />
competitively employed or in some other<br />
employment within one year of leaving<br />
high school.<br />
State<br />
Rate<br />
Indicator 20: Reported Data-Timely and Accurate*<br />
District submitted<br />
required data elements<br />
on or before due dates;<br />
made revisions within<br />
the alloted reveiw<br />
periods.<br />
Accurate and Timely<br />
Data Submission<br />
Overall (3-21)<br />
Early Childhood (3-5)<br />
School Age (5-21)<br />
State<br />
Target<br />
100.00%<br />
100.00%<br />
100.00%<br />
State<br />
Target<br />
LEA<br />
Rate<br />
LEA<br />
Rate<br />
Target Met by<br />
LEA (Y/N)<br />
Target Met<br />
by LEA<br />
(Y/N)<br />
Target Met<br />
by LEA<br />
(Y/N)<br />
*Data reviewed for timely and accurate submissions included all APSCN cycle data except for personnel<br />
Note: - - denotes not applicable<br />
96.19 100.00 — — N/A<br />
14.53<br />
State<br />
Rate<br />
49.42<br />
State<br />
Rate<br />
54.07<br />
13.00<br />
State<br />
Target<br />
49.00<br />
State<br />
Target<br />
60.00<br />
Y<br />
N/A<br />
Y<br />
— —<br />
LEA<br />
Rate<br />
— —<br />
LEA<br />
Rate<br />
— —<br />
N/A<br />
Target Met<br />
by LEA<br />
(Y/N)<br />
N/A<br />
Target Met<br />
by LEA<br />
(Y/N)<br />
N/A<br />
Page 5 of 5
<strong>ARKANSAS</strong> <strong>SPECIAL</strong> <strong>EDUCATION</strong><br />
<strong>DISTRICT</strong> <strong>ANNUAL</strong> PERFORMANCE REPORT<br />
2010/11 School Year<br />
Publication Date: March 2012<br />
Each State must have in place a State Performance Plan (SPP) to evaluate the State's efforts to meet the requirements and<br />
purposes of the implementation of the Individuals with Disabilities Education Act (IDEA). The SPP is a six-year plan, which<br />
describes Arkansas's performance on 20 indicators. The Office of Special Education Programs in the U. S. Department of<br />
Education requires that States report annually to the public on the performance of each local education agency (LEA) on 14 of<br />
20 indicators as compared with targets established by the State in the SPP. Arkansas will report indicators 1 through 14 and<br />
20 for each LEA serving children with disabilities (CWD). Any LEA not meeting targets on compliance indicators (0% for<br />
Indicators 4B, 09 & 10 and 100% for Indicators 11, 12, 13, and 20) are non-compliant with IDEA.<br />
There are no report changes for the 2010/11 school year profile; However, it is important to recognize that: .<br />
1. Indicator 01 (Graduation) is reported a year in arrear (2009/10 graduates) and is based on a four-year cohort. This<br />
means the rate is a measure of students who entered in ninth grade and graduate in four years. The calculation is a<br />
requirement under Title I of the Elementary and Secondary Education Act (ESEA).<br />
2. Indicator 02 (Drop out) is reported a year in arrear. This means the rate is a measure of students who dropped out in<br />
the 2009/10 school year. The Indicator 02 data are aligned with the Common Core of Data (CCD) requirements for<br />
grades 7-12.<br />
3. Indicator 04A and 4B (Suspension/Expulsion) is reported a year in arrear. This means the rate is a measure of<br />
students who had out-of-school suspensions and/or expulsions totaling more than 10 days.<br />
For a complete description of all the Indicators, please visit the special education website at<br />
http://arksped.k12.ar.us/sections/policy.html<br />
LEA: 2303 - GREENBRIER SCHOOL <strong>DISTRICT</strong><br />
Indicator 01: Graduation Rates (2009/10 school year) Indicator 02: Dropout Rates (2009/10 school year)<br />
Percent of youth<br />
with IEPs<br />
graduating from<br />
high school with a<br />
regular diploma<br />
State<br />
Rate<br />
State<br />
Target<br />
75.76% 85.00%<br />
LEA<br />
Rate<br />
92.31%<br />
Target Met<br />
by LEA<br />
(Y/N)<br />
Y<br />
Percent of<br />
youth with<br />
IEPs dropping<br />
out of high<br />
school<br />
State<br />
Rate<br />
Indicator 03: Assessment on Statewide Benchmark Exam (grades 3-8, 11)<br />
A) Adequate Yearly Progress<br />
n=40<br />
Literacy<br />
Mathematics<br />
Met Disability Subgroup "n"<br />
for Reporting Purposes (Y/N)<br />
State Target for % of Districts Meeting<br />
AYP for Disability Subgroup<br />
State<br />
Target<br />
3.06% 4.20%<br />
LEA<br />
Rate<br />
0.57%<br />
% of Districts Meeting AYP<br />
for Disability Subgroup<br />
Target Met by<br />
LEA (Y/N)<br />
Y<br />
Target Met by<br />
LEA(Y/N)<br />
Overall N 17.15% 6.25%<br />
NA<br />
N<br />
N<br />
Note: For a district to qualify as having a disability subgroup it must have a minimum of 40 (n=40) students with disabilities in a school building.<br />
B) Participation<br />
Participation Rate: # of<br />
CWD Tested ÷ # of CWD<br />
Enrolled in grades tested.<br />
Participation Rate: Literacy<br />
Participation Rate: Math<br />
Note: - - denotes not applicable<br />
State<br />
Rate<br />
98.78%<br />
State<br />
Target<br />
95.00%<br />
LEA<br />
Rate<br />
97.83%<br />
Target Met<br />
by LEA (Y/N)<br />
98.61% 95.00% 99.01% Y<br />
Y<br />
C) Performance Proficiency<br />
Percent of CWD Scoring<br />
Proficient or Above<br />
Proficiency Rate: Literacy<br />
Proficiency Rate:<br />
Mathematics<br />
16.00%<br />
16.00%<br />
State<br />
Rate<br />
31.49%<br />
44.86%<br />
State<br />
Target<br />
45.22%<br />
51.14%<br />
LEA<br />
Rate<br />
34.57%<br />
51.63%<br />
NA<br />
NA<br />
Target<br />
Met by<br />
LEA (Y/N)<br />
N<br />
Y<br />
Page 1 of 5
LEA: 2303 - GREENBRIER SCHOOL <strong>DISTRICT</strong><br />
Indicator 04: Out-of-School Suspensions and Expulsions (2009/10 school year)<br />
A) Suspension/Expulsion<br />
Percent difference of CWD with out-of- school suspensions and<br />
expulsions totaling greater than 10 days in a school year as<br />
compared to the same data for general education students in<br />
the district.<br />
B) Suspension/Expulsion by Race and Ethnicity<br />
Percent of districts that have: (a) a significant discrepancy, by race or<br />
ethnicity, in the rate of suspensions and expulsions of greater than 10<br />
days in a school year for children with IEPs; and (b) policies,<br />
procedures or practices that contribute to the significant discrepancy<br />
and do not comply with requirements relating to the development<br />
and implementation of IEPs, the use of positive behavioral<br />
interventions and supports, and procedural safeguards.<br />
Indicator 05: School Age (5-21) Least Restrictive Environment<br />
A) In the Regular Class 80% or more of the day<br />
Percent of CWD with<br />
IEPs receiving instruction<br />
in the regular class 80%<br />
or more of the day.<br />
State<br />
Rate<br />
State<br />
Target<br />
LEA<br />
Rate<br />
B) In the Regular Class less than 40% of the day<br />
Percent of CWD with<br />
IEPs receiving instruction<br />
in the regular class less<br />
than 60% of the day.<br />
53.87% 59.77%<br />
State<br />
Rate<br />
State<br />
Target<br />
12.42% 12.51%<br />
64.72%<br />
LEA<br />
Rate<br />
10.20%<br />
C) Other Settings outside the regular class<br />
Percent of CWD with IEPs served in<br />
public or private separate schools,<br />
residential placements, or<br />
homebound/hospital placements.<br />
State<br />
Rate<br />
State<br />
Target<br />
2.80% 2.56%<br />
Target Met<br />
by LEA (Y/N)<br />
Y<br />
Target Met<br />
by LEA (Y/N)<br />
Y<br />
LEA<br />
Rate<br />
0.87%<br />
Target Met<br />
by LEA(Y/N)<br />
Indicator 06: Early Childhood (3-5) Least Restrictive Environment<br />
A) Regular Early Childhood Program<br />
Percent of children (aged 3 through 5) with IEPs attending a regular<br />
early childhood program and receiving the majority of special<br />
education and related services in the regular early childhood program<br />
Allowable<br />
Difference<br />
LEA: 2303 - GREENBRIER SCHOOL <strong>DISTRICT</strong><br />
Indicator 07: Preschool (3-5) Outcomes<br />
a) Percent of preschool CWD<br />
children who did not<br />
improve functioning.<br />
b) Percent of preschool CWD<br />
who improved but whose<br />
functioning remained below<br />
same age peers.<br />
c) Percent of preschool CWD<br />
who improved at a level<br />
nearer to same aged peers.<br />
d) Percent of preschool CWD<br />
who improved functioning to<br />
reach a level comparable to<br />
same age peers.<br />
e) Percent of preschool CWD<br />
children who maintain<br />
functioning at a level<br />
comparable to same aged<br />
peers.<br />
Summary<br />
Statements<br />
1) Of those preschool<br />
children who entered<br />
the preschool program<br />
below age expectations<br />
in each Outcome, the<br />
percent who<br />
substantially increased<br />
their rate of growth by<br />
the time they turned 6<br />
years of age or exited<br />
the program.<br />
2) The percent of<br />
preschool children who<br />
were functioning<br />
within age expectations<br />
in each Outcome by the<br />
time they turned 6<br />
years of age or exited<br />
A) Positive Social -Emotional<br />
Skills*<br />
State<br />
Rate<br />
A) Positive Social -<br />
Emotional Skills<br />
(Including social<br />
relationships)<br />
State<br />
Rate<br />
2.14%<br />
5.31%<br />
25.97%<br />
38.22%<br />
28.36%<br />
State<br />
Target<br />
LEA<br />
Rate<br />
LEA<br />
Rate<br />
— —<br />
— —<br />
— —<br />
— —<br />
— —<br />
Target<br />
Met by<br />
LEA(Y/N)<br />
B) Acquisition and Use of<br />
Knowledge and Skills<br />
(Including early language/<br />
communication and early literacy)<br />
B) Acquisition and Use of<br />
Knowledge and Skills **<br />
State<br />
Rate<br />
1.75%<br />
6.59%<br />
34.23%<br />
43.51%<br />
13.92%<br />
State<br />
Target<br />
LEA<br />
Rate<br />
Target<br />
Met by<br />
LEA(Y/N)<br />
C) Use of Appropriate Behaviors<br />
to Meet Their Needs<br />
State<br />
Rate<br />
State<br />
Target<br />
LEA<br />
Rate<br />
Target<br />
Met by<br />
LEA(Y/N)<br />
89.61% 90.50% — — N/A 90.31% 90.50% — — N/A 90.82% 92.50% — — N/A<br />
66.58% 69.50% — — N/A 57.43% 60.50% — — N/A 76.69% 78.50% — — N/A<br />
NOTE: * Including social relationships ** Including early language/ communication and early literacy<br />
Note: - - denotes not applicable<br />
State<br />
Rate<br />
LEA<br />
Rate<br />
— —<br />
— —<br />
— —<br />
— —<br />
— —<br />
C) Use of<br />
Appropriate<br />
Behaviors to<br />
Meet Their Needs<br />
State<br />
Rate<br />
4.51%<br />
17.34%<br />
41.72%<br />
34.97%<br />
LEA<br />
Rate<br />
1.46% — —<br />
— —<br />
— —<br />
— —<br />
— —<br />
Page 3 of 5
LEA: 2303 - GREENBRIER SCHOOL <strong>DISTRICT</strong><br />
Indicator 08: Parent Involvement<br />
Percent of surveyed<br />
parents who reported<br />
school facilitated parent<br />
involvement as a means<br />
of improving services<br />
and results for children<br />
with disabilities.<br />
Early Childhood<br />
(3-5)<br />
School Age<br />
(5-21)<br />
State<br />
Rate<br />
90.47%<br />
95.05%<br />
Indicator 09: Disproportionality - Eligibility<br />
Disproportionate representation of racial<br />
and ethnic groups in special education and<br />
related services that is a result of<br />
inappropriate identification (e.g.<br />
monitoring data, review of policies,<br />
practices, and procedures under 618(d),<br />
etc.).<br />
State<br />
Rate<br />
State<br />
Target<br />
88.00%<br />
96.00%<br />
State<br />
Target<br />
0.00% 0.00%<br />
LEA<br />
Rate<br />
— —<br />
94.29%<br />
Indicator 10: Disproportionality-Child with a Disability<br />
Disproportionate representation of racial<br />
and ethnic groups in specific disability<br />
categories that is a result of inappropriate<br />
identification (e.g. monitoring data, review<br />
of policies, practices, and procedures under<br />
618(d), etc.).<br />
Indicator 11: Child Find<br />
Percent of children with<br />
parental consent to evaluate<br />
who are evaluated within<br />
the State established timeline<br />
of 60 days.<br />
Overall<br />
(3-21)<br />
Early Childhood<br />
(3-5)<br />
School Age<br />
(5-21)<br />
State<br />
Rate<br />
0.00%<br />
Indicator 12: Early Childhood Transition<br />
Percent of children referred by Part C prior to<br />
age 3, who are found eligible for Part B, and<br />
who have an IEP developed and implemented<br />
by their third birthday.<br />
Note: - - denotes not applicable<br />
State<br />
Rate<br />
99.41%<br />
99.70%<br />
98.97%<br />
State<br />
Rate<br />
State<br />
Target<br />
0.00%<br />
State<br />
Target<br />
100.00%<br />
100.00%<br />
100.00%<br />
State<br />
Target<br />
Target Met by<br />
LEA (Y/N)<br />
Y<br />
Target Met by<br />
LEA (Y/N)<br />
Y<br />
LEA<br />
Rate<br />
100.00%<br />
— —<br />
100.00%<br />
LEA<br />
Rate<br />
Target Met by<br />
LEA (Y/N)<br />
N/A<br />
N<br />
Note: The target for Indicator 09 is to have zero percent<br />
(0%) of districts identified as having disproportionate<br />
representation as a result of inappropriate<br />
identification in eligibility.<br />
Note: The target for Indicator 10 is to have zero<br />
percent (0%) of districts identified as having<br />
disproportionate representation as a result of<br />
inappropriate identification in a disability<br />
category.<br />
Target Met by<br />
LEA (Y/N)<br />
N/A<br />
Y<br />
Target Met<br />
by LEA<br />
(Y/N)<br />
99.21% 100.00% - - N/A<br />
Y<br />
Note: * Indicates a zero reponse rate for the<br />
district.<br />
Page 4 of 5
LEA: 2303 - GREENBRIER SCHOOL <strong>DISTRICT</strong><br />
Indicator 13: Secondary Transition<br />
Percent of youth with disabilities aged 16 and<br />
up with an IEP that includes coordinated,<br />
measurable, annual IEP goals and transition<br />
services that will reasonably enable the student<br />
to meet the post-secondary goals.<br />
Indicator 14: Post-School Outcomes<br />
A. Percent of youth enrolled in higher<br />
education within one year of leaving high<br />
school.<br />
State<br />
Rate<br />
State<br />
Target<br />
Note: Data for this Indicator is from the on-site monitoring of LEAs for the given year.<br />
B. Percent of youth enrolled in higher<br />
education or competitively employed<br />
within one year of leaving high school.<br />
C. Percent of youth enrolled in higher<br />
education or in some other postsecondary<br />
education or training program; or<br />
competitively employed or in some other<br />
employment within one year of leaving<br />
high school.<br />
State<br />
Rate<br />
Indicator 20: Reported Data-Timely and Accurate*<br />
District submitted<br />
required data elements<br />
on or before due dates;<br />
made revisions within<br />
the alloted reveiw<br />
periods.<br />
Accurate and Timely<br />
Data Submission<br />
Overall (3-21)<br />
Early Childhood (3-5)<br />
School Age (5-21)<br />
State<br />
Target<br />
100.00%<br />
100.00%<br />
100.00%<br />
State<br />
Target<br />
LEA<br />
Rate<br />
LEA<br />
Rate<br />
Target Met by<br />
LEA (Y/N)<br />
Target Met<br />
by LEA<br />
(Y/N)<br />
Target Met<br />
by LEA<br />
(Y/N)<br />
*Data reviewed for timely and accurate submissions included all APSCN cycle data except for personnel<br />
Note: - - denotes not applicable<br />
96.19 100.00 100.00% Y<br />
14.53<br />
State<br />
Rate<br />
49.42<br />
State<br />
Rate<br />
54.07<br />
13.00<br />
State<br />
Target<br />
49.00<br />
State<br />
Target<br />
60.00<br />
Y<br />
N/A<br />
Y<br />
— —<br />
LEA<br />
Rate<br />
— —<br />
LEA<br />
Rate<br />
— —<br />
N/A<br />
Target Met<br />
by LEA<br />
(Y/N)<br />
N/A<br />
Target Met<br />
by LEA<br />
(Y/N)<br />
N/A<br />
Page 5 of 5
<strong>ARKANSAS</strong> <strong>SPECIAL</strong> <strong>EDUCATION</strong><br />
<strong>DISTRICT</strong> <strong>ANNUAL</strong> PERFORMANCE REPORT<br />
2010/11 School Year<br />
Publication Date: March 2012<br />
Each State must have in place a State Performance Plan (SPP) to evaluate the State's efforts to meet the requirements and<br />
purposes of the implementation of the Individuals with Disabilities Education Act (IDEA). The SPP is a six-year plan, which<br />
describes Arkansas's performance on 20 indicators. The Office of Special Education Programs in the U. S. Department of<br />
Education requires that States report annually to the public on the performance of each local education agency (LEA) on 14 of<br />
20 indicators as compared with targets established by the State in the SPP. Arkansas will report indicators 1 through 14 and<br />
20 for each LEA serving children with disabilities (CWD). Any LEA not meeting targets on compliance indicators (0% for<br />
Indicators 4B, 09 & 10 and 100% for Indicators 11, 12, 13, and 20) are non-compliant with IDEA.<br />
There are no report changes for the 2010/11 school year profile; However, it is important to recognize that: .<br />
1. Indicator 01 (Graduation) is reported a year in arrear (2009/10 graduates) and is based on a four-year cohort. This<br />
means the rate is a measure of students who entered in ninth grade and graduate in four years. The calculation is a<br />
requirement under Title I of the Elementary and Secondary Education Act (ESEA).<br />
2. Indicator 02 (Drop out) is reported a year in arrear. This means the rate is a measure of students who dropped out in<br />
the 2009/10 school year. The Indicator 02 data are aligned with the Common Core of Data (CCD) requirements for<br />
grades 7-12.<br />
3. Indicator 04A and 4B (Suspension/Expulsion) is reported a year in arrear. This means the rate is a measure of<br />
students who had out-of-school suspensions and/or expulsions totaling more than 10 days.<br />
For a complete description of all the Indicators, please visit the special education website at<br />
http://arksped.k12.ar.us/sections/policy.html<br />
LEA: 2304 - GUY-PERKINS SCHOOL <strong>DISTRICT</strong><br />
Indicator 01: Graduation Rates (2009/10 school year) Indicator 02: Dropout Rates (2009/10 school year)<br />
Percent of youth<br />
with IEPs<br />
graduating from<br />
high school with a<br />
regular diploma<br />
State<br />
Rate<br />
State<br />
Target<br />
75.76% 85.00%<br />
LEA<br />
Rate<br />
100.00%<br />
Target Met<br />
by LEA<br />
(Y/N)<br />
Y<br />
Percent of<br />
youth with<br />
IEPs dropping<br />
out of high<br />
school<br />
State<br />
Rate<br />
Indicator 03: Assessment on Statewide Benchmark Exam (grades 3-8, 11)<br />
A) Adequate Yearly Progress<br />
n=40<br />
Literacy<br />
Mathematics<br />
Met Disability Subgroup "n"<br />
for Reporting Purposes (Y/N)<br />
State Target for % of Districts Meeting<br />
AYP for Disability Subgroup<br />
State<br />
Target<br />
3.06% 4.20%<br />
LEA<br />
Rate<br />
0.00%<br />
% of Districts Meeting AYP<br />
for Disability Subgroup<br />
Target Met by<br />
LEA (Y/N)<br />
Y<br />
Target Met by<br />
LEA(Y/N)<br />
Overall N 17.15% 6.25%<br />
NA<br />
N<br />
N<br />
Note: For a district to qualify as having a disability subgroup it must have a minimum of 40 (n=40) students with disabilities in a school building.<br />
B) Participation<br />
Participation Rate: # of<br />
CWD Tested ÷ # of CWD<br />
Enrolled in grades tested.<br />
Participation Rate: Literacy<br />
Participation Rate: Math<br />
Note: - - denotes not applicable<br />
State<br />
Rate<br />
98.78%<br />
State<br />
Target<br />
95.00%<br />
LEA<br />
Rate<br />
100.00%<br />
Target Met<br />
by LEA (Y/N)<br />
98.61% 95.00% 97.22% Y<br />
Y<br />
C) Performance Proficiency<br />
Percent of CWD Scoring<br />
Proficient or Above<br />
Proficiency Rate: Literacy<br />
Proficiency Rate:<br />
Mathematics<br />
16.00%<br />
16.00%<br />
State<br />
Rate<br />
31.49%<br />
44.86%<br />
State<br />
Target<br />
45.22%<br />
51.14%<br />
LEA<br />
Rate<br />
21.43%<br />
60.61%<br />
NA<br />
NA<br />
Target<br />
Met by<br />
LEA (Y/N)<br />
N<br />
Y<br />
Page 1 of 5
LEA: 2304 - GUY-PERKINS SCHOOL <strong>DISTRICT</strong><br />
Indicator 04: Out-of-School Suspensions and Expulsions (2009/10 school year)<br />
A) Suspension/Expulsion<br />
Percent difference of CWD with out-of- school suspensions and<br />
expulsions totaling greater than 10 days in a school year as<br />
compared to the same data for general education students in<br />
the district.<br />
B) Suspension/Expulsion by Race and Ethnicity<br />
Percent of districts that have: (a) a significant discrepancy, by race or<br />
ethnicity, in the rate of suspensions and expulsions of greater than 10<br />
days in a school year for children with IEPs; and (b) policies,<br />
procedures or practices that contribute to the significant discrepancy<br />
and do not comply with requirements relating to the development<br />
and implementation of IEPs, the use of positive behavioral<br />
interventions and supports, and procedural safeguards.<br />
Indicator 05: School Age (5-21) Least Restrictive Environment<br />
A) In the Regular Class 80% or more of the day<br />
Percent of CWD with<br />
IEPs receiving instruction<br />
in the regular class 80%<br />
or more of the day.<br />
State<br />
Rate<br />
State<br />
Target<br />
LEA<br />
Rate<br />
B) In the Regular Class less than 40% of the day<br />
Percent of CWD with<br />
IEPs receiving instruction<br />
in the regular class less<br />
than 60% of the day.<br />
53.87% 59.77%<br />
State<br />
Rate<br />
State<br />
Target<br />
12.42% 12.51%<br />
64.18%<br />
LEA<br />
Rate<br />
10.45%<br />
C) Other Settings outside the regular class<br />
Percent of CWD with IEPs served in<br />
public or private separate schools,<br />
residential placements, or<br />
homebound/hospital placements.<br />
State<br />
Rate<br />
State<br />
Target<br />
2.80% 2.56%<br />
Target Met<br />
by LEA (Y/N)<br />
Y<br />
Target Met<br />
by LEA (Y/N)<br />
Y<br />
LEA<br />
Rate<br />
1.49%<br />
Target Met<br />
by LEA(Y/N)<br />
Indicator 06: Early Childhood (3-5) Least Restrictive Environment<br />
A) Regular Early Childhood Program<br />
Percent of children (aged 3 through 5) with IEPs attending a regular<br />
early childhood program and receiving the majority of special<br />
education and related services in the regular early childhood program<br />
Allowable<br />
Difference<br />
LEA: 2304 - GUY-PERKINS SCHOOL <strong>DISTRICT</strong><br />
Indicator 07: Preschool (3-5) Outcomes<br />
a) Percent of preschool CWD<br />
children who did not<br />
improve functioning.<br />
b) Percent of preschool CWD<br />
who improved but whose<br />
functioning remained below<br />
same age peers.<br />
c) Percent of preschool CWD<br />
who improved at a level<br />
nearer to same aged peers.<br />
d) Percent of preschool CWD<br />
who improved functioning to<br />
reach a level comparable to<br />
same age peers.<br />
e) Percent of preschool CWD<br />
children who maintain<br />
functioning at a level<br />
comparable to same aged<br />
peers.<br />
Summary<br />
Statements<br />
1) Of those preschool<br />
children who entered<br />
the preschool program<br />
below age expectations<br />
in each Outcome, the<br />
percent who<br />
substantially increased<br />
their rate of growth by<br />
the time they turned 6<br />
years of age or exited<br />
the program.<br />
2) The percent of<br />
preschool children who<br />
were functioning<br />
within age expectations<br />
in each Outcome by the<br />
time they turned 6<br />
years of age or exited<br />
A) Positive Social -Emotional<br />
Skills*<br />
State<br />
Rate<br />
A) Positive Social -<br />
Emotional Skills<br />
(Including social<br />
relationships)<br />
State<br />
Rate<br />
2.14%<br />
5.31%<br />
25.97%<br />
38.22%<br />
28.36%<br />
State<br />
Target<br />
LEA<br />
Rate<br />
LEA<br />
Rate<br />
— —<br />
— —<br />
— —<br />
— —<br />
— —<br />
Target<br />
Met by<br />
LEA(Y/N)<br />
B) Acquisition and Use of<br />
Knowledge and Skills<br />
(Including early language/<br />
communication and early literacy)<br />
B) Acquisition and Use of<br />
Knowledge and Skills **<br />
State<br />
Rate<br />
1.75%<br />
6.59%<br />
34.23%<br />
43.51%<br />
13.92%<br />
State<br />
Target<br />
LEA<br />
Rate<br />
Target<br />
Met by<br />
LEA(Y/N)<br />
C) Use of Appropriate Behaviors<br />
to Meet Their Needs<br />
State<br />
Rate<br />
State<br />
Target<br />
LEA<br />
Rate<br />
Target<br />
Met by<br />
LEA(Y/N)<br />
89.61% 90.50% — — N/A 90.31% 90.50% — — N/A 90.82% 92.50% — — N/A<br />
66.58% 69.50% — — N/A 57.43% 60.50% — — N/A 76.69% 78.50% — — N/A<br />
NOTE: * Including social relationships ** Including early language/ communication and early literacy<br />
Note: - - denotes not applicable<br />
State<br />
Rate<br />
LEA<br />
Rate<br />
— —<br />
— —<br />
— —<br />
— —<br />
— —<br />
C) Use of<br />
Appropriate<br />
Behaviors to<br />
Meet Their Needs<br />
State<br />
Rate<br />
4.51%<br />
17.34%<br />
41.72%<br />
34.97%<br />
LEA<br />
Rate<br />
1.46% — —<br />
— —<br />
— —<br />
— —<br />
— —<br />
Page 3 of 5
LEA: 2304 - GUY-PERKINS SCHOOL <strong>DISTRICT</strong><br />
Indicator 08: Parent Involvement<br />
Percent of surveyed<br />
parents who reported<br />
school facilitated parent<br />
involvement as a means<br />
of improving services<br />
and results for children<br />
with disabilities.<br />
Early Childhood<br />
(3-5)<br />
School Age<br />
(5-21)<br />
State<br />
Rate<br />
90.47%<br />
95.05%<br />
Indicator 09: Disproportionality - Eligibility<br />
Disproportionate representation of racial<br />
and ethnic groups in special education and<br />
related services that is a result of<br />
inappropriate identification (e.g.<br />
monitoring data, review of policies,<br />
practices, and procedures under 618(d),<br />
etc.).<br />
State<br />
Rate<br />
State<br />
Target<br />
88.00%<br />
96.00%<br />
State<br />
Target<br />
0.00% 0.00%<br />
LEA<br />
Rate<br />
— —<br />
100.00%<br />
Indicator 10: Disproportionality-Child with a Disability<br />
Disproportionate representation of racial<br />
and ethnic groups in specific disability<br />
categories that is a result of inappropriate<br />
identification (e.g. monitoring data, review<br />
of policies, practices, and procedures under<br />
618(d), etc.).<br />
Indicator 11: Child Find<br />
Percent of children with<br />
parental consent to evaluate<br />
who are evaluated within<br />
the State established timeline<br />
of 60 days.<br />
Overall<br />
(3-21)<br />
Early Childhood<br />
(3-5)<br />
School Age<br />
(5-21)<br />
State<br />
Rate<br />
0.00%<br />
Indicator 12: Early Childhood Transition<br />
Percent of children referred by Part C prior to<br />
age 3, who are found eligible for Part B, and<br />
who have an IEP developed and implemented<br />
by their third birthday.<br />
Note: - - denotes not applicable<br />
State<br />
Rate<br />
99.41%<br />
99.70%<br />
98.97%<br />
State<br />
Rate<br />
State<br />
Target<br />
0.00%<br />
State<br />
Target<br />
100.00%<br />
100.00%<br />
100.00%<br />
State<br />
Target<br />
Target Met by<br />
LEA (Y/N)<br />
Y<br />
Target Met by<br />
LEA (Y/N)<br />
Y<br />
LEA<br />
Rate<br />
100.00%<br />
— —<br />
100.00%<br />
LEA<br />
Rate<br />
Target Met by<br />
LEA (Y/N)<br />
N/A<br />
Y<br />
Note: The target for Indicator 09 is to have zero percent<br />
(0%) of districts identified as having disproportionate<br />
representation as a result of inappropriate<br />
identification in eligibility.<br />
Note: The target for Indicator 10 is to have zero<br />
percent (0%) of districts identified as having<br />
disproportionate representation as a result of<br />
inappropriate identification in a disability<br />
category.<br />
Target Met by<br />
LEA (Y/N)<br />
N/A<br />
Y<br />
Target Met<br />
by LEA<br />
(Y/N)<br />
99.21% 100.00% - - N/A<br />
Y<br />
Note: * Indicates a zero reponse rate for the<br />
district.<br />
Page 4 of 5
LEA: 2304 - GUY-PERKINS SCHOOL <strong>DISTRICT</strong><br />
Indicator 13: Secondary Transition<br />
Percent of youth with disabilities aged 16 and<br />
up with an IEP that includes coordinated,<br />
measurable, annual IEP goals and transition<br />
services that will reasonably enable the student<br />
to meet the post-secondary goals.<br />
Indicator 14: Post-School Outcomes<br />
A. Percent of youth enrolled in higher<br />
education within one year of leaving high<br />
school.<br />
State<br />
Rate<br />
State<br />
Target<br />
Note: Data for this Indicator is from the on-site monitoring of LEAs for the given year.<br />
B. Percent of youth enrolled in higher<br />
education or competitively employed<br />
within one year of leaving high school.<br />
C. Percent of youth enrolled in higher<br />
education or in some other postsecondary<br />
education or training program; or<br />
competitively employed or in some other<br />
employment within one year of leaving<br />
high school.<br />
State<br />
Rate<br />
Indicator 20: Reported Data-Timely and Accurate*<br />
District submitted<br />
required data elements<br />
on or before due dates;<br />
made revisions within<br />
the alloted reveiw<br />
periods.<br />
Accurate and Timely<br />
Data Submission<br />
Overall (3-21)<br />
Early Childhood (3-5)<br />
School Age (5-21)<br />
State<br />
Target<br />
100.00%<br />
100.00%<br />
100.00%<br />
State<br />
Target<br />
LEA<br />
Rate<br />
LEA<br />
Rate<br />
Target Met by<br />
LEA (Y/N)<br />
Target Met<br />
by LEA<br />
(Y/N)<br />
Target Met<br />
by LEA<br />
(Y/N)<br />
*Data reviewed for timely and accurate submissions included all APSCN cycle data except for personnel<br />
Note: - - denotes not applicable<br />
96.19 100.00 — — N/A<br />
14.53<br />
State<br />
Rate<br />
49.42<br />
State<br />
Rate<br />
54.07<br />
13.00<br />
State<br />
Target<br />
49.00<br />
State<br />
Target<br />
60.00<br />
Y<br />
N/A<br />
Y<br />
— —<br />
LEA<br />
Rate<br />
— —<br />
LEA<br />
Rate<br />
— —<br />
N/A<br />
Target Met<br />
by LEA<br />
(Y/N)<br />
N/A<br />
Target Met<br />
by LEA<br />
(Y/N)<br />
N/A<br />
Page 5 of 5
<strong>ARKANSAS</strong> <strong>SPECIAL</strong> <strong>EDUCATION</strong><br />
<strong>DISTRICT</strong> <strong>ANNUAL</strong> PERFORMANCE REPORT<br />
2010/11 School Year<br />
Publication Date: March 2012<br />
Each State must have in place a State Performance Plan (SPP) to evaluate the State's efforts to meet the requirements and<br />
purposes of the implementation of the Individuals with Disabilities Education Act (IDEA). The SPP is a six-year plan, which<br />
describes Arkansas's performance on 20 indicators. The Office of Special Education Programs in the U. S. Department of<br />
Education requires that States report annually to the public on the performance of each local education agency (LEA) on 14 of<br />
20 indicators as compared with targets established by the State in the SPP. Arkansas will report indicators 1 through 14 and<br />
20 for each LEA serving children with disabilities (CWD). Any LEA not meeting targets on compliance indicators (0% for<br />
Indicators 4B, 09 & 10 and 100% for Indicators 11, 12, 13, and 20) are non-compliant with IDEA.<br />
There are no report changes for the 2010/11 school year profile; However, it is important to recognize that: .<br />
1. Indicator 01 (Graduation) is reported a year in arrear (2009/10 graduates) and is based on a four-year cohort. This<br />
means the rate is a measure of students who entered in ninth grade and graduate in four years. The calculation is a<br />
requirement under Title I of the Elementary and Secondary Education Act (ESEA).<br />
2. Indicator 02 (Drop out) is reported a year in arrear. This means the rate is a measure of students who dropped out in<br />
the 2009/10 school year. The Indicator 02 data are aligned with the Common Core of Data (CCD) requirements for<br />
grades 7-12.<br />
3. Indicator 04A and 4B (Suspension/Expulsion) is reported a year in arrear. This means the rate is a measure of<br />
students who had out-of-school suspensions and/or expulsions totaling more than 10 days.<br />
For a complete description of all the Indicators, please visit the special education website at<br />
http://arksped.k12.ar.us/sections/policy.html<br />
LEA: 2305 - MAYFLOWER SCHOOL <strong>DISTRICT</strong><br />
Indicator 01: Graduation Rates (2009/10 school year) Indicator 02: Dropout Rates (2009/10 school year)<br />
Percent of youth<br />
with IEPs<br />
graduating from<br />
high school with a<br />
regular diploma<br />
State<br />
Rate<br />
State<br />
Target<br />
75.76% 85.00%<br />
LEA<br />
Rate<br />
63.64%<br />
Target Met<br />
by LEA<br />
(Y/N)<br />
N<br />
Percent of<br />
youth with<br />
IEPs dropping<br />
out of high<br />
school<br />
State<br />
Rate<br />
Indicator 03: Assessment on Statewide Benchmark Exam (grades 3-8, 11)<br />
A) Adequate Yearly Progress<br />
n=40<br />
Literacy<br />
Mathematics<br />
Met Disability Subgroup "n"<br />
for Reporting Purposes (Y/N)<br />
State Target for % of Districts Meeting<br />
AYP for Disability Subgroup<br />
State<br />
Target<br />
3.06% 4.20%<br />
LEA<br />
Rate<br />
0.00%<br />
% of Districts Meeting AYP<br />
for Disability Subgroup<br />
Target Met by<br />
LEA (Y/N)<br />
Y<br />
Target Met by<br />
LEA(Y/N)<br />
Overall N 17.15% 6.25%<br />
NA<br />
N<br />
N<br />
Note: For a district to qualify as having a disability subgroup it must have a minimum of 40 (n=40) students with disabilities in a school building.<br />
B) Participation<br />
Participation Rate: # of<br />
CWD Tested ÷ # of CWD<br />
Enrolled in grades tested.<br />
Participation Rate: Literacy<br />
Participation Rate: Math<br />
Note: - - denotes not applicable<br />
State<br />
Rate<br />
98.78%<br />
State<br />
Target<br />
95.00%<br />
LEA<br />
Rate<br />
100.00%<br />
Target Met<br />
by LEA (Y/N)<br />
98.61% 95.00% 100.00% Y<br />
Y<br />
C) Performance Proficiency<br />
Percent of CWD Scoring<br />
Proficient or Above<br />
Proficiency Rate: Literacy<br />
Proficiency Rate:<br />
Mathematics<br />
16.00%<br />
16.00%<br />
State<br />
Rate<br />
31.49%<br />
44.86%<br />
State<br />
Target<br />
45.22%<br />
51.14%<br />
LEA<br />
Rate<br />
31.48%<br />
24.53%<br />
NA<br />
NA<br />
Target<br />
Met by<br />
LEA (Y/N)<br />
N<br />
N<br />
Page 1 of 5
LEA: 2305 - MAYFLOWER SCHOOL <strong>DISTRICT</strong><br />
Indicator 04: Out-of-School Suspensions and Expulsions (2009/10 school year)<br />
A) Suspension/Expulsion<br />
Percent difference of CWD with out-of- school suspensions and<br />
expulsions totaling greater than 10 days in a school year as<br />
compared to the same data for general education students in<br />
the district.<br />
B) Suspension/Expulsion by Race and Ethnicity<br />
Percent of districts that have: (a) a significant discrepancy, by race or<br />
ethnicity, in the rate of suspensions and expulsions of greater than 10<br />
days in a school year for children with IEPs; and (b) policies,<br />
procedures or practices that contribute to the significant discrepancy<br />
and do not comply with requirements relating to the development<br />
and implementation of IEPs, the use of positive behavioral<br />
interventions and supports, and procedural safeguards.<br />
Indicator 05: School Age (5-21) Least Restrictive Environment<br />
A) In the Regular Class 80% or more of the day<br />
Percent of CWD with<br />
IEPs receiving instruction<br />
in the regular class 80%<br />
or more of the day.<br />
State<br />
Rate<br />
State<br />
Target<br />
LEA<br />
Rate<br />
B) In the Regular Class less than 40% of the day<br />
Percent of CWD with<br />
IEPs receiving instruction<br />
in the regular class less<br />
than 60% of the day.<br />
53.87% 59.77%<br />
State<br />
Rate<br />
State<br />
Target<br />
12.42% 12.51%<br />
57.48%<br />
LEA<br />
Rate<br />
17.32%<br />
C) Other Settings outside the regular class<br />
Percent of CWD with IEPs served in<br />
public or private separate schools,<br />
residential placements, or<br />
homebound/hospital placements.<br />
State<br />
Rate<br />
State<br />
Target<br />
2.80% 2.56%<br />
Target Met<br />
by LEA (Y/N)<br />
N<br />
Target Met<br />
by LEA (Y/N)<br />
N<br />
LEA<br />
Rate<br />
0.79%<br />
Target Met<br />
by LEA(Y/N)<br />
Indicator 06: Early Childhood (3-5) Least Restrictive Environment<br />
A) Regular Early Childhood Program<br />
Percent of children (aged 3 through 5) with IEPs attending a regular<br />
early childhood program and receiving the majority of special<br />
education and related services in the regular early childhood program<br />
Allowable<br />
Difference<br />
LEA: 2305 - MAYFLOWER SCHOOL <strong>DISTRICT</strong><br />
Indicator 07: Preschool (3-5) Outcomes<br />
a) Percent of preschool CWD<br />
children who did not<br />
improve functioning.<br />
b) Percent of preschool CWD<br />
who improved but whose<br />
functioning remained below<br />
same age peers.<br />
c) Percent of preschool CWD<br />
who improved at a level<br />
nearer to same aged peers.<br />
d) Percent of preschool CWD<br />
who improved functioning to<br />
reach a level comparable to<br />
same age peers.<br />
e) Percent of preschool CWD<br />
children who maintain<br />
functioning at a level<br />
comparable to same aged<br />
peers.<br />
Summary<br />
Statements<br />
1) Of those preschool<br />
children who entered<br />
the preschool program<br />
below age expectations<br />
in each Outcome, the<br />
percent who<br />
substantially increased<br />
their rate of growth by<br />
the time they turned 6<br />
years of age or exited<br />
the program.<br />
2) The percent of<br />
preschool children who<br />
were functioning<br />
within age expectations<br />
in each Outcome by the<br />
time they turned 6<br />
years of age or exited<br />
A) Positive Social -Emotional<br />
Skills*<br />
State<br />
Rate<br />
A) Positive Social -<br />
Emotional Skills<br />
(Including social<br />
relationships)<br />
State<br />
Rate<br />
2.14%<br />
5.31%<br />
25.97%<br />
38.22%<br />
28.36%<br />
State<br />
Target<br />
LEA<br />
Rate<br />
LEA<br />
Rate<br />
— —<br />
— —<br />
— —<br />
— —<br />
— —<br />
Target<br />
Met by<br />
LEA(Y/N)<br />
B) Acquisition and Use of<br />
Knowledge and Skills<br />
(Including early language/<br />
communication and early literacy)<br />
B) Acquisition and Use of<br />
Knowledge and Skills **<br />
State<br />
Rate<br />
1.75%<br />
6.59%<br />
34.23%<br />
43.51%<br />
13.92%<br />
State<br />
Target<br />
LEA<br />
Rate<br />
Target<br />
Met by<br />
LEA(Y/N)<br />
C) Use of Appropriate Behaviors<br />
to Meet Their Needs<br />
State<br />
Rate<br />
State<br />
Target<br />
LEA<br />
Rate<br />
Target<br />
Met by<br />
LEA(Y/N)<br />
89.61% 90.50% — — N/A 90.31% 90.50% — — N/A 90.82% 92.50% — — N/A<br />
66.58% 69.50% — — N/A 57.43% 60.50% — — N/A 76.69% 78.50% — — N/A<br />
NOTE: * Including social relationships ** Including early language/ communication and early literacy<br />
Note: - - denotes not applicable<br />
State<br />
Rate<br />
LEA<br />
Rate<br />
— —<br />
— —<br />
— —<br />
— —<br />
— —<br />
C) Use of<br />
Appropriate<br />
Behaviors to<br />
Meet Their Needs<br />
State<br />
Rate<br />
4.51%<br />
17.34%<br />
41.72%<br />
34.97%<br />
LEA<br />
Rate<br />
1.46% — —<br />
— —<br />
— —<br />
— —<br />
— —<br />
Page 3 of 5
LEA: 2305 - MAYFLOWER SCHOOL <strong>DISTRICT</strong><br />
Indicator 08: Parent Involvement<br />
Percent of surveyed<br />
parents who reported<br />
school facilitated parent<br />
involvement as a means<br />
of improving services<br />
and results for children<br />
with disabilities.<br />
Early Childhood<br />
(3-5)<br />
School Age<br />
(5-21)<br />
State<br />
Rate<br />
90.47%<br />
95.05%<br />
Indicator 09: Disproportionality - Eligibility<br />
Disproportionate representation of racial<br />
and ethnic groups in special education and<br />
related services that is a result of<br />
inappropriate identification (e.g.<br />
monitoring data, review of policies,<br />
practices, and procedures under 618(d),<br />
etc.).<br />
State<br />
Rate<br />
State<br />
Target<br />
88.00%<br />
96.00%<br />
State<br />
Target<br />
0.00% 0.00%<br />
LEA<br />
Rate<br />
— —<br />
96.88%<br />
Indicator 10: Disproportionality-Child with a Disability<br />
Disproportionate representation of racial<br />
and ethnic groups in specific disability<br />
categories that is a result of inappropriate<br />
identification (e.g. monitoring data, review<br />
of policies, practices, and procedures under<br />
618(d), etc.).<br />
Indicator 11: Child Find<br />
Percent of children with<br />
parental consent to evaluate<br />
who are evaluated within<br />
the State established timeline<br />
of 60 days.<br />
Overall<br />
(3-21)<br />
Early Childhood<br />
(3-5)<br />
School Age<br />
(5-21)<br />
State<br />
Rate<br />
0.00%<br />
Indicator 12: Early Childhood Transition<br />
Percent of children referred by Part C prior to<br />
age 3, who are found eligible for Part B, and<br />
who have an IEP developed and implemented<br />
by their third birthday.<br />
Note: - - denotes not applicable<br />
State<br />
Rate<br />
99.41%<br />
99.70%<br />
98.97%<br />
State<br />
Rate<br />
State<br />
Target<br />
0.00%<br />
State<br />
Target<br />
100.00%<br />
100.00%<br />
100.00%<br />
State<br />
Target<br />
Target Met by<br />
LEA (Y/N)<br />
Y<br />
Target Met by<br />
LEA (Y/N)<br />
Y<br />
LEA<br />
Rate<br />
100.00%<br />
— —<br />
100.00%<br />
LEA<br />
Rate<br />
Target Met by<br />
LEA (Y/N)<br />
N/A<br />
Y<br />
Note: The target for Indicator 09 is to have zero percent<br />
(0%) of districts identified as having disproportionate<br />
representation as a result of inappropriate<br />
identification in eligibility.<br />
Note: The target for Indicator 10 is to have zero<br />
percent (0%) of districts identified as having<br />
disproportionate representation as a result of<br />
inappropriate identification in a disability<br />
category.<br />
Target Met by<br />
LEA (Y/N)<br />
N/A<br />
Y<br />
Target Met<br />
by LEA<br />
(Y/N)<br />
99.21% 100.00% - - N/A<br />
Y<br />
Note: * Indicates a zero reponse rate for the<br />
district.<br />
Page 4 of 5
LEA: 2305 - MAYFLOWER SCHOOL <strong>DISTRICT</strong><br />
Indicator 13: Secondary Transition<br />
Percent of youth with disabilities aged 16 and<br />
up with an IEP that includes coordinated,<br />
measurable, annual IEP goals and transition<br />
services that will reasonably enable the student<br />
to meet the post-secondary goals.<br />
Indicator 14: Post-School Outcomes<br />
A. Percent of youth enrolled in higher<br />
education within one year of leaving high<br />
school.<br />
State<br />
Rate<br />
State<br />
Target<br />
Note: Data for this Indicator is from the on-site monitoring of LEAs for the given year.<br />
B. Percent of youth enrolled in higher<br />
education or competitively employed<br />
within one year of leaving high school.<br />
C. Percent of youth enrolled in higher<br />
education or in some other postsecondary<br />
education or training program; or<br />
competitively employed or in some other<br />
employment within one year of leaving<br />
high school.<br />
State<br />
Rate<br />
Indicator 20: Reported Data-Timely and Accurate*<br />
District submitted<br />
required data elements<br />
on or before due dates;<br />
made revisions within<br />
the alloted reveiw<br />
periods.<br />
Accurate and Timely<br />
Data Submission<br />
Overall (3-21)<br />
Early Childhood (3-5)<br />
School Age (5-21)<br />
State<br />
Target<br />
100.00%<br />
100.00%<br />
100.00%<br />
State<br />
Target<br />
LEA<br />
Rate<br />
LEA<br />
Rate<br />
Target Met by<br />
LEA (Y/N)<br />
Target Met<br />
by LEA<br />
(Y/N)<br />
Target Met<br />
by LEA<br />
(Y/N)<br />
*Data reviewed for timely and accurate submissions included all APSCN cycle data except for personnel<br />
Note: - - denotes not applicable<br />
96.19 100.00 — — N/A<br />
14.53<br />
State<br />
Rate<br />
49.42<br />
State<br />
Rate<br />
54.07<br />
13.00<br />
State<br />
Target<br />
49.00<br />
State<br />
Target<br />
60.00<br />
Y<br />
N/A<br />
Y<br />
— —<br />
LEA<br />
Rate<br />
— —<br />
LEA<br />
Rate<br />
— —<br />
N/A<br />
Target Met<br />
by LEA<br />
(Y/N)<br />
N/A<br />
Target Met<br />
by LEA<br />
(Y/N)<br />
N/A<br />
Page 5 of 5
<strong>ARKANSAS</strong> <strong>SPECIAL</strong> <strong>EDUCATION</strong><br />
<strong>DISTRICT</strong> <strong>ANNUAL</strong> PERFORMANCE REPORT<br />
2010/11 School Year<br />
Publication Date: March 2012<br />
Each State must have in place a State Performance Plan (SPP) to evaluate the State's efforts to meet the requirements and<br />
purposes of the implementation of the Individuals with Disabilities Education Act (IDEA). The SPP is a six-year plan, which<br />
describes Arkansas's performance on 20 indicators. The Office of Special Education Programs in the U. S. Department of<br />
Education requires that States report annually to the public on the performance of each local education agency (LEA) on 14 of<br />
20 indicators as compared with targets established by the State in the SPP. Arkansas will report indicators 1 through 14 and<br />
20 for each LEA serving children with disabilities (CWD). Any LEA not meeting targets on compliance indicators (0% for<br />
Indicators 4B, 09 & 10 and 100% for Indicators 11, 12, 13, and 20) are non-compliant with IDEA.<br />
There are no report changes for the 2010/11 school year profile; However, it is important to recognize that: .<br />
1. Indicator 01 (Graduation) is reported a year in arrear (2009/10 graduates) and is based on a four-year cohort. This<br />
means the rate is a measure of students who entered in ninth grade and graduate in four years. The calculation is a<br />
requirement under Title I of the Elementary and Secondary Education Act (ESEA).<br />
2. Indicator 02 (Drop out) is reported a year in arrear. This means the rate is a measure of students who dropped out in<br />
the 2009/10 school year. The Indicator 02 data are aligned with the Common Core of Data (CCD) requirements for<br />
grades 7-12.<br />
3. Indicator 04A and 4B (Suspension/Expulsion) is reported a year in arrear. This means the rate is a measure of<br />
students who had out-of-school suspensions and/or expulsions totaling more than 10 days.<br />
For a complete description of all the Indicators, please visit the special education website at<br />
http://arksped.k12.ar.us/sections/policy.html<br />
LEA: 2306 - MT. VERNON/ENOLA SCHOOL <strong>DISTRICT</strong><br />
Indicator 01: Graduation Rates (2009/10 school year) Indicator 02: Dropout Rates (2009/10 school year)<br />
Percent of youth<br />
with IEPs<br />
graduating from<br />
high school with a<br />
regular diploma<br />
State<br />
Rate<br />
State<br />
Target<br />
75.76% 85.00%<br />
LEA<br />
Rate<br />
100.00%<br />
Target Met<br />
by LEA<br />
(Y/N)<br />
Y<br />
Percent of<br />
youth with<br />
IEPs dropping<br />
out of high<br />
school<br />
State<br />
Rate<br />
Indicator 03: Assessment on Statewide Benchmark Exam (grades 3-8, 11)<br />
A) Adequate Yearly Progress<br />
n=40<br />
Literacy<br />
Mathematics<br />
Met Disability Subgroup "n"<br />
for Reporting Purposes (Y/N)<br />
State Target for % of Districts Meeting<br />
AYP for Disability Subgroup<br />
State<br />
Target<br />
3.06% 4.20%<br />
LEA<br />
Rate<br />
3.70%<br />
% of Districts Meeting AYP<br />
for Disability Subgroup<br />
Target Met by<br />
LEA (Y/N)<br />
Y<br />
Target Met by<br />
LEA(Y/N)<br />
Overall N 17.15% 6.25%<br />
NA<br />
N<br />
N<br />
Note: For a district to qualify as having a disability subgroup it must have a minimum of 40 (n=40) students with disabilities in a school building.<br />
B) Participation<br />
Participation Rate: # of<br />
CWD Tested ÷ # of CWD<br />
Enrolled in grades tested.<br />
Participation Rate: Literacy<br />
Participation Rate: Math<br />
Note: - - denotes not applicable<br />
State<br />
Rate<br />
98.78%<br />
State<br />
Target<br />
95.00%<br />
LEA<br />
Rate<br />
100.00%<br />
Target Met<br />
by LEA (Y/N)<br />
98.61% 95.00% 95.65% Y<br />
Y<br />
C) Performance Proficiency<br />
Percent of CWD Scoring<br />
Proficient or Above<br />
Proficiency Rate: Literacy<br />
Proficiency Rate:<br />
Mathematics<br />
16.00%<br />
16.00%<br />
State<br />
Rate<br />
31.49%<br />
44.86%<br />
State<br />
Target<br />
45.22%<br />
51.14%<br />
LEA<br />
Rate<br />
16.67%<br />
44.44%<br />
NA<br />
NA<br />
Target<br />
Met by<br />
LEA (Y/N)<br />
N<br />
N<br />
Page 1 of 5
LEA: 2306 - MT. VERNON/ENOLA SCHOOL <strong>DISTRICT</strong><br />
Indicator 04: Out-of-School Suspensions and Expulsions (2009/10 school year)<br />
A) Suspension/Expulsion<br />
Percent difference of CWD with out-of- school suspensions and<br />
expulsions totaling greater than 10 days in a school year as<br />
compared to the same data for general education students in<br />
the district.<br />
B) Suspension/Expulsion by Race and Ethnicity<br />
Percent of districts that have: (a) a significant discrepancy, by race or<br />
ethnicity, in the rate of suspensions and expulsions of greater than 10<br />
days in a school year for children with IEPs; and (b) policies,<br />
procedures or practices that contribute to the significant discrepancy<br />
and do not comply with requirements relating to the development<br />
and implementation of IEPs, the use of positive behavioral<br />
interventions and supports, and procedural safeguards.<br />
Indicator 05: School Age (5-21) Least Restrictive Environment<br />
A) In the Regular Class 80% or more of the day<br />
Percent of CWD with<br />
IEPs receiving instruction<br />
in the regular class 80%<br />
or more of the day.<br />
State<br />
Rate<br />
State<br />
Target<br />
LEA<br />
Rate<br />
B) In the Regular Class less than 40% of the day<br />
Percent of CWD with<br />
IEPs receiving instruction<br />
in the regular class less<br />
than 60% of the day.<br />
53.87% 59.77%<br />
State<br />
Rate<br />
State<br />
Target<br />
12.42% 12.51%<br />
60.98%<br />
LEA<br />
Rate<br />
2.44%<br />
C) Other Settings outside the regular class<br />
Percent of CWD with IEPs served in<br />
public or private separate schools,<br />
residential placements, or<br />
homebound/hospital placements.<br />
State<br />
Rate<br />
State<br />
Target<br />
2.80% 2.56%<br />
Target Met<br />
by LEA (Y/N)<br />
Y<br />
Target Met<br />
by LEA (Y/N)<br />
Y<br />
LEA<br />
Rate<br />
0.00%<br />
Target Met<br />
by LEA(Y/N)<br />
Indicator 06: Early Childhood (3-5) Least Restrictive Environment<br />
A) Regular Early Childhood Program<br />
Percent of children (aged 3 through 5) with IEPs attending a regular<br />
early childhood program and receiving the majority of special<br />
education and related services in the regular early childhood program<br />
Allowable<br />
Difference<br />
LEA: 2306 - MT. VERNON/ENOLA SCHOOL <strong>DISTRICT</strong><br />
Indicator 07: Preschool (3-5) Outcomes<br />
a) Percent of preschool CWD<br />
children who did not<br />
improve functioning.<br />
b) Percent of preschool CWD<br />
who improved but whose<br />
functioning remained below<br />
same age peers.<br />
c) Percent of preschool CWD<br />
who improved at a level<br />
nearer to same aged peers.<br />
d) Percent of preschool CWD<br />
who improved functioning to<br />
reach a level comparable to<br />
same age peers.<br />
e) Percent of preschool CWD<br />
children who maintain<br />
functioning at a level<br />
comparable to same aged<br />
peers.<br />
Summary<br />
Statements<br />
1) Of those preschool<br />
children who entered<br />
the preschool program<br />
below age expectations<br />
in each Outcome, the<br />
percent who<br />
substantially increased<br />
their rate of growth by<br />
the time they turned 6<br />
years of age or exited<br />
the program.<br />
2) The percent of<br />
preschool children who<br />
were functioning<br />
within age expectations<br />
in each Outcome by the<br />
time they turned 6<br />
years of age or exited<br />
A) Positive Social -Emotional<br />
Skills*<br />
State<br />
Rate<br />
A) Positive Social -<br />
Emotional Skills<br />
(Including social<br />
relationships)<br />
State<br />
Rate<br />
2.14%<br />
5.31%<br />
25.97%<br />
38.22%<br />
28.36%<br />
State<br />
Target<br />
LEA<br />
Rate<br />
LEA<br />
Rate<br />
— —<br />
— —<br />
— —<br />
— —<br />
— —<br />
Target<br />
Met by<br />
LEA(Y/N)<br />
B) Acquisition and Use of<br />
Knowledge and Skills<br />
(Including early language/<br />
communication and early literacy)<br />
B) Acquisition and Use of<br />
Knowledge and Skills **<br />
State<br />
Rate<br />
1.75%<br />
6.59%<br />
34.23%<br />
43.51%<br />
13.92%<br />
State<br />
Target<br />
LEA<br />
Rate<br />
Target<br />
Met by<br />
LEA(Y/N)<br />
C) Use of Appropriate Behaviors<br />
to Meet Their Needs<br />
State<br />
Rate<br />
State<br />
Target<br />
LEA<br />
Rate<br />
Target<br />
Met by<br />
LEA(Y/N)<br />
89.61% 90.50% — — N/A 90.31% 90.50% — — N/A 90.82% 92.50% — — N/A<br />
66.58% 69.50% — — N/A 57.43% 60.50% — — N/A 76.69% 78.50% — — N/A<br />
NOTE: * Including social relationships ** Including early language/ communication and early literacy<br />
Note: - - denotes not applicable<br />
State<br />
Rate<br />
LEA<br />
Rate<br />
— —<br />
— —<br />
— —<br />
— —<br />
— —<br />
C) Use of<br />
Appropriate<br />
Behaviors to<br />
Meet Their Needs<br />
State<br />
Rate<br />
4.51%<br />
17.34%<br />
41.72%<br />
34.97%<br />
LEA<br />
Rate<br />
1.46% — —<br />
— —<br />
— —<br />
— —<br />
— —<br />
Page 3 of 5
LEA: 2306 - MT. VERNON/ENOLA SCHOOL <strong>DISTRICT</strong><br />
Indicator 08: Parent Involvement<br />
Percent of surveyed<br />
parents who reported<br />
school facilitated parent<br />
involvement as a means<br />
of improving services<br />
and results for children<br />
with disabilities.<br />
Early Childhood<br />
(3-5)<br />
School Age<br />
(5-21)<br />
State<br />
Rate<br />
90.47%<br />
95.05%<br />
Indicator 09: Disproportionality - Eligibility<br />
Disproportionate representation of racial<br />
and ethnic groups in special education and<br />
related services that is a result of<br />
inappropriate identification (e.g.<br />
monitoring data, review of policies,<br />
practices, and procedures under 618(d),<br />
etc.).<br />
State<br />
Rate<br />
State<br />
Target<br />
88.00%<br />
96.00%<br />
State<br />
Target<br />
0.00% 0.00%<br />
LEA<br />
Rate<br />
— —<br />
94.74%<br />
Indicator 10: Disproportionality-Child with a Disability<br />
Disproportionate representation of racial<br />
and ethnic groups in specific disability<br />
categories that is a result of inappropriate<br />
identification (e.g. monitoring data, review<br />
of policies, practices, and procedures under<br />
618(d), etc.).<br />
Indicator 11: Child Find<br />
Percent of children with<br />
parental consent to evaluate<br />
who are evaluated within<br />
the State established timeline<br />
of 60 days.<br />
Overall<br />
(3-21)<br />
Early Childhood<br />
(3-5)<br />
School Age<br />
(5-21)<br />
State<br />
Rate<br />
0.00%<br />
Indicator 12: Early Childhood Transition<br />
Percent of children referred by Part C prior to<br />
age 3, who are found eligible for Part B, and<br />
who have an IEP developed and implemented<br />
by their third birthday.<br />
Note: - - denotes not applicable<br />
State<br />
Rate<br />
99.41%<br />
99.70%<br />
98.97%<br />
State<br />
Rate<br />
State<br />
Target<br />
0.00%<br />
State<br />
Target<br />
100.00%<br />
100.00%<br />
100.00%<br />
State<br />
Target<br />
Target Met by<br />
LEA (Y/N)<br />
Y<br />
Target Met by<br />
LEA (Y/N)<br />
Y<br />
LEA<br />
Rate<br />
100.00%<br />
— —<br />
100.00%<br />
LEA<br />
Rate<br />
Target Met by<br />
LEA (Y/N)<br />
N/A<br />
N<br />
Note: The target for Indicator 09 is to have zero percent<br />
(0%) of districts identified as having disproportionate<br />
representation as a result of inappropriate<br />
identification in eligibility.<br />
Note: The target for Indicator 10 is to have zero<br />
percent (0%) of districts identified as having<br />
disproportionate representation as a result of<br />
inappropriate identification in a disability<br />
category.<br />
Target Met by<br />
LEA (Y/N)<br />
N/A<br />
Y<br />
Target Met<br />
by LEA<br />
(Y/N)<br />
99.21% 100.00% - - N/A<br />
Y<br />
Note: * Indicates a zero reponse rate for the<br />
district.<br />
Page 4 of 5
LEA: 2306 - MT. VERNON/ENOLA SCHOOL <strong>DISTRICT</strong><br />
Indicator 13: Secondary Transition<br />
Percent of youth with disabilities aged 16 and<br />
up with an IEP that includes coordinated,<br />
measurable, annual IEP goals and transition<br />
services that will reasonably enable the student<br />
to meet the post-secondary goals.<br />
Indicator 14: Post-School Outcomes<br />
A. Percent of youth enrolled in higher<br />
education within one year of leaving high<br />
school.<br />
State<br />
Rate<br />
State<br />
Target<br />
Note: Data for this Indicator is from the on-site monitoring of LEAs for the given year.<br />
B. Percent of youth enrolled in higher<br />
education or competitively employed<br />
within one year of leaving high school.<br />
C. Percent of youth enrolled in higher<br />
education or in some other postsecondary<br />
education or training program; or<br />
competitively employed or in some other<br />
employment within one year of leaving<br />
high school.<br />
State<br />
Rate<br />
Indicator 20: Reported Data-Timely and Accurate*<br />
District submitted<br />
required data elements<br />
on or before due dates;<br />
made revisions within<br />
the alloted reveiw<br />
periods.<br />
Accurate and Timely<br />
Data Submission<br />
Overall (3-21)<br />
Early Childhood (3-5)<br />
School Age (5-21)<br />
State<br />
Target<br />
100.00%<br />
100.00%<br />
100.00%<br />
State<br />
Target<br />
LEA<br />
Rate<br />
LEA<br />
Rate<br />
Target Met by<br />
LEA (Y/N)<br />
Target Met<br />
by LEA<br />
(Y/N)<br />
Target Met<br />
by LEA<br />
(Y/N)<br />
*Data reviewed for timely and accurate submissions included all APSCN cycle data except for personnel<br />
Note: - - denotes not applicable<br />
96.19 100.00 — — N/A<br />
14.53<br />
State<br />
Rate<br />
49.42<br />
State<br />
Rate<br />
54.07<br />
13.00<br />
State<br />
Target<br />
49.00<br />
State<br />
Target<br />
60.00<br />
Y<br />
N/A<br />
Y<br />
— —<br />
LEA<br />
Rate<br />
— —<br />
LEA<br />
Rate<br />
— —<br />
N/A<br />
Target Met<br />
by LEA<br />
(Y/N)<br />
N/A<br />
Target Met<br />
by LEA<br />
(Y/N)<br />
N/A<br />
Page 5 of 5
LEA: 2307 - VILONIA SCHOOL <strong>DISTRICT</strong><br />
<strong>ARKANSAS</strong> <strong>SPECIAL</strong> <strong>EDUCATION</strong><br />
<strong>DISTRICT</strong> <strong>ANNUAL</strong> PERFORMANCE REPORT<br />
2010/11 School Year<br />
Publication Date: March 2012<br />
Each State must have in place a State Performance Plan (SPP) to evaluate the State's efforts to meet the requirements and<br />
purposes of the implementation of the Individuals with Disabilities Education Act (IDEA). The SPP is a six-year plan, which<br />
describes Arkansas's performance on 20 indicators. The Office of Special Education Programs in the U. S. Department of<br />
Education requires that States report annually to the public on the performance of each local education agency (LEA) on 14 of<br />
20 indicators as compared with targets established by the State in the SPP. Arkansas will report indicators 1 through 14 and<br />
20 for each LEA serving children with disabilities (CWD). Any LEA not meeting targets on compliance indicators (0% for<br />
Indicators 4B, 09 & 10 and 100% for Indicators 11, 12, 13, and 20) are non-compliant with IDEA.<br />
There are no report changes for the 2010/11 school year profile; However, it is important to recognize that: .<br />
1. Indicator 01 (Graduation) is reported a year in arrear (2009/10 graduates) and is based on a four-year cohort. This<br />
means the rate is a measure of students who entered in ninth grade and graduate in four years. The calculation is a<br />
requirement under Title I of the Elementary and Secondary Education Act (ESEA).<br />
2. Indicator 02 (Drop out) is reported a year in arrear. This means the rate is a measure of students who dropped out in<br />
the 2009/10 school year. The Indicator 02 data are aligned with the Common Core of Data (CCD) requirements for<br />
grades 7-12.<br />
3. Indicator 04A and 4B (Suspension/Expulsion) is reported a year in arrear. This means the rate is a measure of<br />
students who had out-of-school suspensions and/or expulsions totaling more than 10 days.<br />
Percent of youth<br />
with IEPs<br />
graduating from<br />
high school with a<br />
regular diploma<br />
For a complete description of all the Indicators, please visit the special education website at<br />
http://arksped.k12.ar.us/sections/policy.html<br />
Indicator 01: Graduation Rates (2009/10 school year) Indicator 02: Dropout Rates (2009/10 school year)<br />
State<br />
Rate<br />
State<br />
Target<br />
75.76% 85.00%<br />
LEA<br />
Rate<br />
92.31%<br />
Target Met<br />
by LEA<br />
(Y/N)<br />
Y<br />
Percent of<br />
youth with<br />
IEPs dropping<br />
out of high<br />
school<br />
State<br />
Rate<br />
Indicator 03: Assessment on Statewide Benchmark Exam (grades 3-8, 11)<br />
A) Adequate Yearly Progress<br />
n=40<br />
Literacy<br />
Mathematics<br />
Met Disability Subgroup "n"<br />
for Reporting Purposes (Y/N)<br />
State Target for % of Districts Meeting<br />
AYP for Disability Subgroup<br />
State<br />
Target<br />
3.06% 4.20%<br />
LEA<br />
Rate<br />
1.54%<br />
% of Districts Meeting AYP<br />
for Disability Subgroup<br />
Target Met by<br />
LEA (Y/N)<br />
Y<br />
Target Met by<br />
LEA(Y/N)<br />
Overall N 17.15% 6.25%<br />
NA<br />
N<br />
N<br />
Note: For a district to qualify as having a disability subgroup it must have a minimum of 40 (n=40) students with disabilities in a school building.<br />
B) Participation<br />
Participation Rate: # of<br />
CWD Tested ÷ # of CWD<br />
Enrolled in grades tested.<br />
Participation Rate: Literacy<br />
Participation Rate: Math<br />
Note: - - denotes not applicable<br />
State<br />
Rate<br />
98.78%<br />
State<br />
Target<br />
95.00%<br />
LEA<br />
Rate<br />
100.00%<br />
Target Met<br />
by LEA (Y/N)<br />
98.61% 95.00% 100.00% Y<br />
Y<br />
C) Performance Proficiency<br />
Percent of CWD Scoring<br />
Proficient or Above<br />
Proficiency Rate: Literacy<br />
Proficiency Rate:<br />
Mathematics<br />
16.00%<br />
16.00%<br />
State<br />
Rate<br />
31.49%<br />
44.86%<br />
State<br />
Target<br />
45.22%<br />
51.14%<br />
LEA<br />
Rate<br />
47.72%<br />
62.16%<br />
NA<br />
NA<br />
Target<br />
Met by<br />
LEA (Y/N)<br />
Y<br />
Y<br />
Page 1 of 5
LEA: 2307 - VILONIA SCHOOL <strong>DISTRICT</strong><br />
Indicator 04: Out-of-School Suspensions and Expulsions (2009/10 school year)<br />
A) Suspension/Expulsion<br />
Percent difference of CWD with out-of- school suspensions and<br />
expulsions totaling greater than 10 days in a school year as<br />
compared to the same data for general education students in<br />
the district.<br />
B) Suspension/Expulsion by Race and Ethnicity<br />
Percent of districts that have: (a) a significant discrepancy, by race or<br />
ethnicity, in the rate of suspensions and expulsions of greater than 10<br />
days in a school year for children with IEPs; and (b) policies,<br />
procedures or practices that contribute to the significant discrepancy<br />
and do not comply with requirements relating to the development<br />
and implementation of IEPs, the use of positive behavioral<br />
interventions and supports, and procedural safeguards.<br />
Indicator 05: School Age (5-21) Least Restrictive Environment<br />
A) In the Regular Class 80% or more of the day<br />
Percent of CWD with<br />
IEPs receiving instruction<br />
in the regular class 80%<br />
or more of the day.<br />
State<br />
Rate<br />
State<br />
Target<br />
LEA<br />
Rate<br />
B) In the Regular Class less than 40% of the day<br />
Percent of CWD with<br />
IEPs receiving instruction<br />
in the regular class less<br />
than 60% of the day.<br />
53.87% 59.77%<br />
State<br />
Rate<br />
State<br />
Target<br />
12.42% 12.51%<br />
60.05%<br />
LEA<br />
Rate<br />
14.38%<br />
C) Other Settings outside the regular class<br />
Percent of CWD with IEPs served in<br />
public or private separate schools,<br />
residential placements, or<br />
homebound/hospital placements.<br />
State<br />
Rate<br />
State<br />
Target<br />
2.80% 2.56%<br />
Target Met<br />
by LEA (Y/N)<br />
Y<br />
Target Met<br />
by LEA (Y/N)<br />
N<br />
LEA<br />
Rate<br />
0.00%<br />
Target Met<br />
by LEA(Y/N)<br />
Indicator 06: Early Childhood (3-5) Least Restrictive Environment<br />
A) Regular Early Childhood Program<br />
Percent of children (aged 3 through 5) with IEPs attending a regular<br />
early childhood program and receiving the majority of special<br />
education and related services in the regular early childhood program<br />
Allowable<br />
Difference<br />
LEA: 2307 - VILONIA SCHOOL <strong>DISTRICT</strong><br />
Indicator 07: Preschool (3-5) Outcomes<br />
a) Percent of preschool CWD<br />
children who did not<br />
improve functioning.<br />
b) Percent of preschool CWD<br />
who improved but whose<br />
functioning remained below<br />
same age peers.<br />
c) Percent of preschool CWD<br />
who improved at a level<br />
nearer to same aged peers.<br />
d) Percent of preschool CWD<br />
who improved functioning to<br />
reach a level comparable to<br />
same age peers.<br />
e) Percent of preschool CWD<br />
children who maintain<br />
functioning at a level<br />
comparable to same aged<br />
peers.<br />
Summary<br />
Statements<br />
1) Of those preschool<br />
children who entered<br />
the preschool program<br />
below age expectations<br />
in each Outcome, the<br />
percent who<br />
substantially increased<br />
their rate of growth by<br />
the time they turned 6<br />
years of age or exited<br />
the program.<br />
2) The percent of<br />
preschool children who<br />
were functioning<br />
within age expectations<br />
in each Outcome by the<br />
time they turned 6<br />
years of age or exited<br />
A) Positive Social -Emotional<br />
Skills*<br />
State<br />
Rate<br />
A) Positive Social -<br />
Emotional Skills<br />
(Including social<br />
relationships)<br />
State<br />
Rate<br />
2.14%<br />
5.31%<br />
25.97%<br />
38.22%<br />
28.36%<br />
State<br />
Target<br />
LEA<br />
Rate<br />
LEA<br />
Rate<br />
— —<br />
— —<br />
— —<br />
— —<br />
— —<br />
Target<br />
Met by<br />
LEA(Y/N)<br />
B) Acquisition and Use of<br />
Knowledge and Skills<br />
(Including early language/<br />
communication and early literacy)<br />
B) Acquisition and Use of<br />
Knowledge and Skills **<br />
State<br />
Rate<br />
1.75%<br />
6.59%<br />
34.23%<br />
43.51%<br />
13.92%<br />
State<br />
Target<br />
LEA<br />
Rate<br />
Target<br />
Met by<br />
LEA(Y/N)<br />
C) Use of Appropriate Behaviors<br />
to Meet Their Needs<br />
State<br />
Rate<br />
State<br />
Target<br />
LEA<br />
Rate<br />
Target<br />
Met by<br />
LEA(Y/N)<br />
89.61% 90.50% — — N/A 90.31% 90.50% — — N/A 90.82% 92.50% — — N/A<br />
66.58% 69.50% — — N/A 57.43% 60.50% — — N/A 76.69% 78.50% — — N/A<br />
NOTE: * Including social relationships ** Including early language/ communication and early literacy<br />
Note: - - denotes not applicable<br />
State<br />
Rate<br />
LEA<br />
Rate<br />
— —<br />
— —<br />
— —<br />
— —<br />
— —<br />
C) Use of<br />
Appropriate<br />
Behaviors to<br />
Meet Their Needs<br />
State<br />
Rate<br />
4.51%<br />
17.34%<br />
41.72%<br />
34.97%<br />
LEA<br />
Rate<br />
1.46% — —<br />
— —<br />
— —<br />
— —<br />
— —<br />
Page 3 of 5
LEA: 2307 - VILONIA SCHOOL <strong>DISTRICT</strong><br />
Indicator 08: Parent Involvement<br />
Percent of surveyed<br />
parents who reported<br />
school facilitated parent<br />
involvement as a means<br />
of improving services<br />
and results for children<br />
with disabilities.<br />
Early Childhood<br />
(3-5)<br />
School Age<br />
(5-21)<br />
State<br />
Rate<br />
90.47%<br />
95.05%<br />
Indicator 09: Disproportionality - Eligibility<br />
Disproportionate representation of racial<br />
and ethnic groups in special education and<br />
related services that is a result of<br />
inappropriate identification (e.g.<br />
monitoring data, review of policies,<br />
practices, and procedures under 618(d),<br />
etc.).<br />
State<br />
Rate<br />
State<br />
Target<br />
88.00%<br />
96.00%<br />
State<br />
Target<br />
0.00% 0.00%<br />
LEA<br />
Rate<br />
— —<br />
95.35%<br />
Indicator 10: Disproportionality-Child with a Disability<br />
Disproportionate representation of racial<br />
and ethnic groups in specific disability<br />
categories that is a result of inappropriate<br />
identification (e.g. monitoring data, review<br />
of policies, practices, and procedures under<br />
618(d), etc.).<br />
Indicator 11: Child Find<br />
Percent of children with<br />
parental consent to evaluate<br />
who are evaluated within<br />
the State established timeline<br />
of 60 days.<br />
Overall<br />
(3-21)<br />
Early Childhood<br />
(3-5)<br />
School Age<br />
(5-21)<br />
State<br />
Rate<br />
0.00%<br />
Indicator 12: Early Childhood Transition<br />
Percent of children referred by Part C prior to<br />
age 3, who are found eligible for Part B, and<br />
who have an IEP developed and implemented<br />
by their third birthday.<br />
Note: - - denotes not applicable<br />
State<br />
Rate<br />
99.41%<br />
99.70%<br />
98.97%<br />
State<br />
Rate<br />
State<br />
Target<br />
0.00%<br />
State<br />
Target<br />
100.00%<br />
100.00%<br />
100.00%<br />
State<br />
Target<br />
Target Met by<br />
LEA (Y/N)<br />
Y<br />
Target Met by<br />
LEA (Y/N)<br />
Y<br />
LEA<br />
Rate<br />
100.00%<br />
— —<br />
100.00%<br />
LEA<br />
Rate<br />
Target Met by<br />
LEA (Y/N)<br />
N/A<br />
N<br />
Note: The target for Indicator 09 is to have zero percent<br />
(0%) of districts identified as having disproportionate<br />
representation as a result of inappropriate<br />
identification in eligibility.<br />
Note: The target for Indicator 10 is to have zero<br />
percent (0%) of districts identified as having<br />
disproportionate representation as a result of<br />
inappropriate identification in a disability<br />
category.<br />
Target Met by<br />
LEA (Y/N)<br />
N/A<br />
Y<br />
Target Met<br />
by LEA<br />
(Y/N)<br />
99.21% 100.00% - - N/A<br />
Y<br />
Note: * Indicates a zero reponse rate for the<br />
district.<br />
Page 4 of 5
LEA: 2307 - VILONIA SCHOOL <strong>DISTRICT</strong><br />
Indicator 13: Secondary Transition<br />
Percent of youth with disabilities aged 16 and<br />
up with an IEP that includes coordinated,<br />
measurable, annual IEP goals and transition<br />
services that will reasonably enable the student<br />
to meet the post-secondary goals.<br />
Indicator 14: Post-School Outcomes<br />
A. Percent of youth enrolled in higher<br />
education within one year of leaving high<br />
school.<br />
State<br />
Rate<br />
State<br />
Target<br />
Note: Data for this Indicator is from the on-site monitoring of LEAs for the given year.<br />
B. Percent of youth enrolled in higher<br />
education or competitively employed<br />
within one year of leaving high school.<br />
C. Percent of youth enrolled in higher<br />
education or in some other postsecondary<br />
education or training program; or<br />
competitively employed or in some other<br />
employment within one year of leaving<br />
high school.<br />
State<br />
Rate<br />
Indicator 20: Reported Data-Timely and Accurate*<br />
District submitted<br />
required data elements<br />
on or before due dates;<br />
made revisions within<br />
the alloted reveiw<br />
periods.<br />
Accurate and Timely<br />
Data Submission<br />
Overall (3-21)<br />
Early Childhood (3-5)<br />
School Age (5-21)<br />
State<br />
Target<br />
100.00%<br />
100.00%<br />
100.00%<br />
State<br />
Target<br />
LEA<br />
Rate<br />
LEA<br />
Rate<br />
Target Met by<br />
LEA (Y/N)<br />
Target Met<br />
by LEA<br />
(Y/N)<br />
Target Met<br />
by LEA<br />
(Y/N)<br />
*Data reviewed for timely and accurate submissions included all APSCN cycle data except for personnel<br />
Note: - - denotes not applicable<br />
96.19 100.00 — — N/A<br />
14.53<br />
State<br />
Rate<br />
49.42<br />
State<br />
Rate<br />
54.07<br />
13.00<br />
State<br />
Target<br />
49.00<br />
State<br />
Target<br />
60.00<br />
Y<br />
N/A<br />
Y<br />
— —<br />
LEA<br />
Rate<br />
— —<br />
LEA<br />
Rate<br />
— —<br />
N/A<br />
Target Met<br />
by LEA<br />
(Y/N)<br />
N/A<br />
Target Met<br />
by LEA<br />
(Y/N)<br />
N/A<br />
Page 5 of 5
<strong>ARKANSAS</strong> <strong>SPECIAL</strong> <strong>EDUCATION</strong><br />
<strong>DISTRICT</strong> <strong>ANNUAL</strong> PERFORMANCE REPORT<br />
2010/11 School Year<br />
Publication Date: March 2012<br />
Each State must have in place a State Performance Plan (SPP) to evaluate the State's efforts to meet the requirements and<br />
purposes of the implementation of the Individuals with Disabilities Education Act (IDEA). The SPP is a six-year plan, which<br />
describes Arkansas's performance on 20 indicators. The Office of Special Education Programs in the U. S. Department of<br />
Education requires that States report annually to the public on the performance of each local education agency (LEA) on 14 of<br />
20 indicators as compared with targets established by the State in the SPP. Arkansas will report indicators 1 through 14 and<br />
20 for each LEA serving children with disabilities (CWD). Any LEA not meeting targets on compliance indicators (0% for<br />
Indicators 4B, 09 & 10 and 100% for Indicators 11, 12, 13, and 20) are non-compliant with IDEA.<br />
There are no report changes for the 2010/11 school year profile; However, it is important to recognize that: .<br />
1. Indicator 01 (Graduation) is reported a year in arrear (2009/10 graduates) and is based on a four-year cohort. This<br />
means the rate is a measure of students who entered in ninth grade and graduate in four years. The calculation is a<br />
requirement under Title I of the Elementary and Secondary Education Act (ESEA).<br />
2. Indicator 02 (Drop out) is reported a year in arrear. This means the rate is a measure of students who dropped out in<br />
the 2009/10 school year. The Indicator 02 data are aligned with the Common Core of Data (CCD) requirements for<br />
grades 7-12.<br />
3. Indicator 04A and 4B (Suspension/Expulsion) is reported a year in arrear. This means the rate is a measure of<br />
students who had out-of-school suspensions and/or expulsions totaling more than 10 days.<br />
For a complete description of all the Indicators, please visit the special education website at<br />
http://arksped.k12.ar.us/sections/policy.html<br />
LEA: 2402 - CHARLESTON SCHOOL <strong>DISTRICT</strong><br />
Indicator 01: Graduation Rates (2009/10 school year) Indicator 02: Dropout Rates (2009/10 school year)<br />
Percent of youth<br />
with IEPs<br />
graduating from<br />
high school with a<br />
regular diploma<br />
State<br />
Rate<br />
State<br />
Target<br />
75.76% 85.00%<br />
LEA<br />
Rate<br />
85.71%<br />
Target Met<br />
by LEA<br />
(Y/N)<br />
Y<br />
Percent of<br />
youth with<br />
IEPs dropping<br />
out of high<br />
school<br />
State<br />
Rate<br />
Indicator 03: Assessment on Statewide Benchmark Exam (grades 3-8, 11)<br />
A) Adequate Yearly Progress<br />
n=40<br />
Literacy<br />
Mathematics<br />
Met Disability Subgroup "n"<br />
for Reporting Purposes (Y/N)<br />
State Target for % of Districts Meeting<br />
AYP for Disability Subgroup<br />
State<br />
Target<br />
3.06% 4.20%<br />
LEA<br />
Rate<br />
0.00%<br />
% of Districts Meeting AYP<br />
for Disability Subgroup<br />
Target Met by<br />
LEA (Y/N)<br />
Y<br />
Target Met by<br />
LEA(Y/N)<br />
Overall N 17.15% 6.25%<br />
NA<br />
N<br />
N<br />
Note: For a district to qualify as having a disability subgroup it must have a minimum of 40 (n=40) students with disabilities in a school building.<br />
B) Participation<br />
Participation Rate: # of<br />
CWD Tested ÷ # of CWD<br />
Enrolled in grades tested.<br />
Participation Rate: Literacy<br />
Participation Rate: Math<br />
Note: - - denotes not applicable<br />
State<br />
Rate<br />
98.78%<br />
State<br />
Target<br />
95.00%<br />
LEA<br />
Rate<br />
100.00%<br />
Target Met<br />
by LEA (Y/N)<br />
98.61% 95.00% 100.00% Y<br />
Y<br />
C) Performance Proficiency<br />
Percent of CWD Scoring<br />
Proficient or Above<br />
Proficiency Rate: Literacy<br />
Proficiency Rate:<br />
Mathematics<br />
16.00%<br />
16.00%<br />
State<br />
Rate<br />
31.49%<br />
44.86%<br />
State<br />
Target<br />
45.22%<br />
51.14%<br />
LEA<br />
Rate<br />
20.45%<br />
42.86%<br />
NA<br />
NA<br />
Target<br />
Met by<br />
LEA (Y/N)<br />
N<br />
N<br />
Page 1 of 5
LEA: 2402 - CHARLESTON SCHOOL <strong>DISTRICT</strong><br />
Indicator 04: Out-of-School Suspensions and Expulsions (2009/10 school year)<br />
A) Suspension/Expulsion<br />
Percent difference of CWD with out-of- school suspensions and<br />
expulsions totaling greater than 10 days in a school year as<br />
compared to the same data for general education students in<br />
the district.<br />
B) Suspension/Expulsion by Race and Ethnicity<br />
Percent of districts that have: (a) a significant discrepancy, by race or<br />
ethnicity, in the rate of suspensions and expulsions of greater than 10<br />
days in a school year for children with IEPs; and (b) policies,<br />
procedures or practices that contribute to the significant discrepancy<br />
and do not comply with requirements relating to the development<br />
and implementation of IEPs, the use of positive behavioral<br />
interventions and supports, and procedural safeguards.<br />
Indicator 05: School Age (5-21) Least Restrictive Environment<br />
A) In the Regular Class 80% or more of the day<br />
Percent of CWD with<br />
IEPs receiving instruction<br />
in the regular class 80%<br />
or more of the day.<br />
State<br />
Rate<br />
State<br />
Target<br />
LEA<br />
Rate<br />
B) In the Regular Class less than 40% of the day<br />
Percent of CWD with<br />
IEPs receiving instruction<br />
in the regular class less<br />
than 60% of the day.<br />
53.87% 59.77%<br />
State<br />
Rate<br />
State<br />
Target<br />
12.42% 12.51%<br />
61.73%<br />
LEA<br />
Rate<br />
1.23%<br />
C) Other Settings outside the regular class<br />
Percent of CWD with IEPs served in<br />
public or private separate schools,<br />
residential placements, or<br />
homebound/hospital placements.<br />
State<br />
Rate<br />
State<br />
Target<br />
2.80% 2.56%<br />
Target Met<br />
by LEA (Y/N)<br />
Y<br />
Target Met<br />
by LEA (Y/N)<br />
Y<br />
LEA<br />
Rate<br />
4.94%<br />
Target Met<br />
by LEA(Y/N)<br />
Indicator 06: Early Childhood (3-5) Least Restrictive Environment<br />
A) Regular Early Childhood Program<br />
Percent of children (aged 3 through 5) with IEPs attending a regular<br />
early childhood program and receiving the majority of special<br />
education and related services in the regular early childhood program<br />
Allowable<br />
Difference<br />
LEA: 2402 - CHARLESTON SCHOOL <strong>DISTRICT</strong><br />
Indicator 07: Preschool (3-5) Outcomes<br />
a) Percent of preschool CWD<br />
children who did not<br />
improve functioning.<br />
b) Percent of preschool CWD<br />
who improved but whose<br />
functioning remained below<br />
same age peers.<br />
c) Percent of preschool CWD<br />
who improved at a level<br />
nearer to same aged peers.<br />
d) Percent of preschool CWD<br />
who improved functioning to<br />
reach a level comparable to<br />
same age peers.<br />
e) Percent of preschool CWD<br />
children who maintain<br />
functioning at a level<br />
comparable to same aged<br />
peers.<br />
Summary<br />
Statements<br />
1) Of those preschool<br />
children who entered<br />
the preschool program<br />
below age expectations<br />
in each Outcome, the<br />
percent who<br />
substantially increased<br />
their rate of growth by<br />
the time they turned 6<br />
years of age or exited<br />
the program.<br />
2) The percent of<br />
preschool children who<br />
were functioning<br />
within age expectations<br />
in each Outcome by the<br />
time they turned 6<br />
years of age or exited<br />
A) Positive Social -Emotional<br />
Skills*<br />
State<br />
Rate<br />
A) Positive Social -<br />
Emotional Skills<br />
(Including social<br />
relationships)<br />
State<br />
Rate<br />
2.14%<br />
5.31%<br />
25.97%<br />
38.22%<br />
28.36%<br />
State<br />
Target<br />
LEA<br />
Rate<br />
LEA<br />
Rate<br />
— —<br />
— —<br />
— —<br />
— —<br />
— —<br />
Target<br />
Met by<br />
LEA(Y/N)<br />
B) Acquisition and Use of<br />
Knowledge and Skills<br />
(Including early language/<br />
communication and early literacy)<br />
B) Acquisition and Use of<br />
Knowledge and Skills **<br />
State<br />
Rate<br />
1.75%<br />
6.59%<br />
34.23%<br />
43.51%<br />
13.92%<br />
State<br />
Target<br />
LEA<br />
Rate<br />
Target<br />
Met by<br />
LEA(Y/N)<br />
C) Use of Appropriate Behaviors<br />
to Meet Their Needs<br />
State<br />
Rate<br />
State<br />
Target<br />
LEA<br />
Rate<br />
Target<br />
Met by<br />
LEA(Y/N)<br />
89.61% 90.50% — — N/A 90.31% 90.50% — — N/A 90.82% 92.50% — — N/A<br />
66.58% 69.50% — — N/A 57.43% 60.50% — — N/A 76.69% 78.50% — — N/A<br />
NOTE: * Including social relationships ** Including early language/ communication and early literacy<br />
Note: - - denotes not applicable<br />
State<br />
Rate<br />
LEA<br />
Rate<br />
— —<br />
— —<br />
— —<br />
— —<br />
— —<br />
C) Use of<br />
Appropriate<br />
Behaviors to<br />
Meet Their Needs<br />
State<br />
Rate<br />
4.51%<br />
17.34%<br />
41.72%<br />
34.97%<br />
LEA<br />
Rate<br />
1.46% — —<br />
— —<br />
— —<br />
— —<br />
— —<br />
Page 3 of 5
LEA: 2402 - CHARLESTON SCHOOL <strong>DISTRICT</strong><br />
Indicator 08: Parent Involvement<br />
Percent of surveyed<br />
parents who reported<br />
school facilitated parent<br />
involvement as a means<br />
of improving services<br />
and results for children<br />
with disabilities.<br />
Early Childhood<br />
(3-5)<br />
School Age<br />
(5-21)<br />
State<br />
Rate<br />
90.47%<br />
95.05%<br />
Indicator 09: Disproportionality - Eligibility<br />
Disproportionate representation of racial<br />
and ethnic groups in special education and<br />
related services that is a result of<br />
inappropriate identification (e.g.<br />
monitoring data, review of policies,<br />
practices, and procedures under 618(d),<br />
etc.).<br />
State<br />
Rate<br />
State<br />
Target<br />
88.00%<br />
96.00%<br />
State<br />
Target<br />
0.00% 0.00%<br />
LEA<br />
Rate<br />
— —<br />
96.67%<br />
Indicator 10: Disproportionality-Child with a Disability<br />
Disproportionate representation of racial<br />
and ethnic groups in specific disability<br />
categories that is a result of inappropriate<br />
identification (e.g. monitoring data, review<br />
of policies, practices, and procedures under<br />
618(d), etc.).<br />
Indicator 11: Child Find<br />
Percent of children with<br />
parental consent to evaluate<br />
who are evaluated within<br />
the State established timeline<br />
of 60 days.<br />
Overall<br />
(3-21)<br />
Early Childhood<br />
(3-5)<br />
School Age<br />
(5-21)<br />
State<br />
Rate<br />
0.00%<br />
Indicator 12: Early Childhood Transition<br />
Percent of children referred by Part C prior to<br />
age 3, who are found eligible for Part B, and<br />
who have an IEP developed and implemented<br />
by their third birthday.<br />
Note: - - denotes not applicable<br />
State<br />
Rate<br />
99.41%<br />
99.70%<br />
98.97%<br />
State<br />
Rate<br />
State<br />
Target<br />
0.00%<br />
State<br />
Target<br />
100.00%<br />
100.00%<br />
100.00%<br />
State<br />
Target<br />
Target Met by<br />
LEA (Y/N)<br />
Y<br />
Target Met by<br />
LEA (Y/N)<br />
Y<br />
LEA<br />
Rate<br />
100.00%<br />
— —<br />
100.00%<br />
LEA<br />
Rate<br />
Target Met by<br />
LEA (Y/N)<br />
N/A<br />
Y<br />
Note: The target for Indicator 09 is to have zero percent<br />
(0%) of districts identified as having disproportionate<br />
representation as a result of inappropriate<br />
identification in eligibility.<br />
Note: The target for Indicator 10 is to have zero<br />
percent (0%) of districts identified as having<br />
disproportionate representation as a result of<br />
inappropriate identification in a disability<br />
category.<br />
Target Met by<br />
LEA (Y/N)<br />
N/A<br />
Y<br />
Target Met<br />
by LEA<br />
(Y/N)<br />
99.21% 100.00% - - N/A<br />
Y<br />
Note: * Indicates a zero reponse rate for the<br />
district.<br />
Page 4 of 5
LEA: 2402 - CHARLESTON SCHOOL <strong>DISTRICT</strong><br />
Indicator 13: Secondary Transition<br />
Percent of youth with disabilities aged 16 and<br />
up with an IEP that includes coordinated,<br />
measurable, annual IEP goals and transition<br />
services that will reasonably enable the student<br />
to meet the post-secondary goals.<br />
Indicator 14: Post-School Outcomes<br />
A. Percent of youth enrolled in higher<br />
education within one year of leaving high<br />
school.<br />
State<br />
Rate<br />
State<br />
Target<br />
Note: Data for this Indicator is from the on-site monitoring of LEAs for the given year.<br />
B. Percent of youth enrolled in higher<br />
education or competitively employed<br />
within one year of leaving high school.<br />
C. Percent of youth enrolled in higher<br />
education or in some other postsecondary<br />
education or training program; or<br />
competitively employed or in some other<br />
employment within one year of leaving<br />
high school.<br />
State<br />
Rate<br />
Indicator 20: Reported Data-Timely and Accurate*<br />
District submitted<br />
required data elements<br />
on or before due dates;<br />
made revisions within<br />
the alloted reveiw<br />
periods.<br />
Accurate and Timely<br />
Data Submission<br />
Overall (3-21)<br />
Early Childhood (3-5)<br />
School Age (5-21)<br />
State<br />
Target<br />
100.00%<br />
100.00%<br />
100.00%<br />
State<br />
Target<br />
LEA<br />
Rate<br />
LEA<br />
Rate<br />
Target Met by<br />
LEA (Y/N)<br />
Target Met<br />
by LEA<br />
(Y/N)<br />
Target Met<br />
by LEA<br />
(Y/N)<br />
*Data reviewed for timely and accurate submissions included all APSCN cycle data except for personnel<br />
Note: - - denotes not applicable<br />
96.19 100.00 100.00% Y<br />
14.53<br />
State<br />
Rate<br />
49.42<br />
State<br />
Rate<br />
54.07<br />
13.00<br />
State<br />
Target<br />
49.00<br />
State<br />
Target<br />
60.00<br />
Y<br />
N/A<br />
Y<br />
— —<br />
LEA<br />
Rate<br />
— —<br />
LEA<br />
Rate<br />
— —<br />
N/A<br />
Target Met<br />
by LEA<br />
(Y/N)<br />
N/A<br />
Target Met<br />
by LEA<br />
(Y/N)<br />
N/A<br />
Page 5 of 5
<strong>ARKANSAS</strong> <strong>SPECIAL</strong> <strong>EDUCATION</strong><br />
<strong>DISTRICT</strong> <strong>ANNUAL</strong> PERFORMANCE REPORT<br />
2010/11 School Year<br />
Publication Date: March 2012<br />
Each State must have in place a State Performance Plan (SPP) to evaluate the State's efforts to meet the requirements and<br />
purposes of the implementation of the Individuals with Disabilities Education Act (IDEA). The SPP is a six-year plan, which<br />
describes Arkansas's performance on 20 indicators. The Office of Special Education Programs in the U. S. Department of<br />
Education requires that States report annually to the public on the performance of each local education agency (LEA) on 14 of<br />
20 indicators as compared with targets established by the State in the SPP. Arkansas will report indicators 1 through 14 and<br />
20 for each LEA serving children with disabilities (CWD). Any LEA not meeting targets on compliance indicators (0% for<br />
Indicators 4B, 09 & 10 and 100% for Indicators 11, 12, 13, and 20) are non-compliant with IDEA.<br />
There are no report changes for the 2010/11 school year profile; However, it is important to recognize that: .<br />
1. Indicator 01 (Graduation) is reported a year in arrear (2009/10 graduates) and is based on a four-year cohort. This<br />
means the rate is a measure of students who entered in ninth grade and graduate in four years. The calculation is a<br />
requirement under Title I of the Elementary and Secondary Education Act (ESEA).<br />
2. Indicator 02 (Drop out) is reported a year in arrear. This means the rate is a measure of students who dropped out in<br />
the 2009/10 school year. The Indicator 02 data are aligned with the Common Core of Data (CCD) requirements for<br />
grades 7-12.<br />
3. Indicator 04A and 4B (Suspension/Expulsion) is reported a year in arrear. This means the rate is a measure of<br />
students who had out-of-school suspensions and/or expulsions totaling more than 10 days.<br />
For a complete description of all the Indicators, please visit the special education website at<br />
http://arksped.k12.ar.us/sections/policy.html<br />
LEA: 2403 - COUNTY LINE SCHOOL <strong>DISTRICT</strong><br />
Indicator 01: Graduation Rates (2009/10 school year) Indicator 02: Dropout Rates (2009/10 school year)<br />
Percent of youth<br />
with IEPs<br />
graduating from<br />
high school with a<br />
regular diploma<br />
State<br />
Rate<br />
State<br />
Target<br />
75.76% 85.00%<br />
LEA<br />
Rate<br />
75.00%<br />
Target Met<br />
by LEA<br />
(Y/N)<br />
N<br />
Percent of<br />
youth with<br />
IEPs dropping<br />
out of high<br />
school<br />
State<br />
Rate<br />
Indicator 03: Assessment on Statewide Benchmark Exam (grades 3-8, 11)<br />
A) Adequate Yearly Progress<br />
n=40<br />
Literacy<br />
Mathematics<br />
Met Disability Subgroup "n"<br />
for Reporting Purposes (Y/N)<br />
State Target for % of Districts Meeting<br />
AYP for Disability Subgroup<br />
State<br />
Target<br />
3.06% 4.20%<br />
LEA<br />
Rate<br />
0.00%<br />
% of Districts Meeting AYP<br />
for Disability Subgroup<br />
Target Met by<br />
LEA (Y/N)<br />
Y<br />
Target Met by<br />
LEA(Y/N)<br />
Overall N 17.15% 6.25%<br />
NA<br />
N<br />
N<br />
Note: For a district to qualify as having a disability subgroup it must have a minimum of 40 (n=40) students with disabilities in a school building.<br />
B) Participation<br />
Participation Rate: # of<br />
CWD Tested ÷ # of CWD<br />
Enrolled in grades tested.<br />
Participation Rate: Literacy<br />
Participation Rate: Math<br />
Note: - - denotes not applicable<br />
State<br />
Rate<br />
98.78%<br />
State<br />
Target<br />
95.00%<br />
LEA<br />
Rate<br />
100.00%<br />
Target Met<br />
by LEA (Y/N)<br />
98.61% 95.00% 97.50% Y<br />
Y<br />
C) Performance Proficiency<br />
Percent of CWD Scoring<br />
Proficient or Above<br />
Proficiency Rate: Literacy<br />
Proficiency Rate:<br />
Mathematics<br />
16.00%<br />
16.00%<br />
State<br />
Rate<br />
31.49%<br />
44.86%<br />
State<br />
Target<br />
45.22%<br />
51.14%<br />
LEA<br />
Rate<br />
33.33%<br />
55.26%<br />
NA<br />
NA<br />
Target<br />
Met by<br />
LEA (Y/N)<br />
N<br />
Y<br />
Page 1 of 5
LEA: 2403 - COUNTY LINE SCHOOL <strong>DISTRICT</strong><br />
Indicator 04: Out-of-School Suspensions and Expulsions (2009/10 school year)<br />
A) Suspension/Expulsion<br />
Percent difference of CWD with out-of- school suspensions and<br />
expulsions totaling greater than 10 days in a school year as<br />
compared to the same data for general education students in<br />
the district.<br />
B) Suspension/Expulsion by Race and Ethnicity<br />
Percent of districts that have: (a) a significant discrepancy, by race or<br />
ethnicity, in the rate of suspensions and expulsions of greater than 10<br />
days in a school year for children with IEPs; and (b) policies,<br />
procedures or practices that contribute to the significant discrepancy<br />
and do not comply with requirements relating to the development<br />
and implementation of IEPs, the use of positive behavioral<br />
interventions and supports, and procedural safeguards.<br />
Indicator 05: School Age (5-21) Least Restrictive Environment<br />
A) In the Regular Class 80% or more of the day<br />
Percent of CWD with<br />
IEPs receiving instruction<br />
in the regular class 80%<br />
or more of the day.<br />
State<br />
Rate<br />
State<br />
Target<br />
LEA<br />
Rate<br />
B) In the Regular Class less than 40% of the day<br />
Percent of CWD with<br />
IEPs receiving instruction<br />
in the regular class less<br />
than 60% of the day.<br />
53.87% 59.77%<br />
State<br />
Rate<br />
State<br />
Target<br />
12.42% 12.51%<br />
66.67%<br />
LEA<br />
Rate<br />
1.28%<br />
C) Other Settings outside the regular class<br />
Percent of CWD with IEPs served in<br />
public or private separate schools,<br />
residential placements, or<br />
homebound/hospital placements.<br />
State<br />
Rate<br />
State<br />
Target<br />
2.80% 2.56%<br />
Target Met<br />
by LEA (Y/N)<br />
Y<br />
Target Met<br />
by LEA (Y/N)<br />
Y<br />
LEA<br />
Rate<br />
3.85%<br />
Target Met<br />
by LEA(Y/N)<br />
Indicator 06: Early Childhood (3-5) Least Restrictive Environment<br />
A) Regular Early Childhood Program<br />
Percent of children (aged 3 through 5) with IEPs attending a regular<br />
early childhood program and receiving the majority of special<br />
education and related services in the regular early childhood program<br />
Allowable<br />
Difference<br />
LEA: 2403 - COUNTY LINE SCHOOL <strong>DISTRICT</strong><br />
Indicator 07: Preschool (3-5) Outcomes<br />
a) Percent of preschool CWD<br />
children who did not<br />
improve functioning.<br />
b) Percent of preschool CWD<br />
who improved but whose<br />
functioning remained below<br />
same age peers.<br />
c) Percent of preschool CWD<br />
who improved at a level<br />
nearer to same aged peers.<br />
d) Percent of preschool CWD<br />
who improved functioning to<br />
reach a level comparable to<br />
same age peers.<br />
e) Percent of preschool CWD<br />
children who maintain<br />
functioning at a level<br />
comparable to same aged<br />
peers.<br />
Summary<br />
Statements<br />
1) Of those preschool<br />
children who entered<br />
the preschool program<br />
below age expectations<br />
in each Outcome, the<br />
percent who<br />
substantially increased<br />
their rate of growth by<br />
the time they turned 6<br />
years of age or exited<br />
the program.<br />
2) The percent of<br />
preschool children who<br />
were functioning<br />
within age expectations<br />
in each Outcome by the<br />
time they turned 6<br />
years of age or exited<br />
A) Positive Social -Emotional<br />
Skills*<br />
State<br />
Rate<br />
A) Positive Social -<br />
Emotional Skills<br />
(Including social<br />
relationships)<br />
State<br />
Rate<br />
2.14%<br />
5.31%<br />
25.97%<br />
38.22%<br />
28.36%<br />
State<br />
Target<br />
LEA<br />
Rate<br />
LEA<br />
Rate<br />
— —<br />
— —<br />
— —<br />
— —<br />
— —<br />
Target<br />
Met by<br />
LEA(Y/N)<br />
B) Acquisition and Use of<br />
Knowledge and Skills<br />
(Including early language/<br />
communication and early literacy)<br />
B) Acquisition and Use of<br />
Knowledge and Skills **<br />
State<br />
Rate<br />
1.75%<br />
6.59%<br />
34.23%<br />
43.51%<br />
13.92%<br />
State<br />
Target<br />
LEA<br />
Rate<br />
Target<br />
Met by<br />
LEA(Y/N)<br />
C) Use of Appropriate Behaviors<br />
to Meet Their Needs<br />
State<br />
Rate<br />
State<br />
Target<br />
LEA<br />
Rate<br />
Target<br />
Met by<br />
LEA(Y/N)<br />
89.61% 90.50% — — N/A 90.31% 90.50% — — N/A 90.82% 92.50% — — N/A<br />
66.58% 69.50% — — N/A 57.43% 60.50% — — N/A 76.69% 78.50% — — N/A<br />
NOTE: * Including social relationships ** Including early language/ communication and early literacy<br />
Note: - - denotes not applicable<br />
State<br />
Rate<br />
LEA<br />
Rate<br />
— —<br />
— —<br />
— —<br />
— —<br />
— —<br />
C) Use of<br />
Appropriate<br />
Behaviors to<br />
Meet Their Needs<br />
State<br />
Rate<br />
4.51%<br />
17.34%<br />
41.72%<br />
34.97%<br />
LEA<br />
Rate<br />
1.46% — —<br />
— —<br />
— —<br />
— —<br />
— —<br />
Page 3 of 5
LEA: 2403 - COUNTY LINE SCHOOL <strong>DISTRICT</strong><br />
Indicator 08: Parent Involvement<br />
Percent of surveyed<br />
parents who reported<br />
school facilitated parent<br />
involvement as a means<br />
of improving services<br />
and results for children<br />
with disabilities.<br />
Early Childhood<br />
(3-5)<br />
School Age<br />
(5-21)<br />
State<br />
Rate<br />
90.47%<br />
95.05%<br />
Indicator 09: Disproportionality - Eligibility<br />
Disproportionate representation of racial<br />
and ethnic groups in special education and<br />
related services that is a result of<br />
inappropriate identification (e.g.<br />
monitoring data, review of policies,<br />
practices, and procedures under 618(d),<br />
etc.).<br />
State<br />
Rate<br />
State<br />
Target<br />
88.00%<br />
96.00%<br />
State<br />
Target<br />
0.00% 0.00%<br />
LEA<br />
Rate<br />
— —<br />
96.30%<br />
Indicator 10: Disproportionality-Child with a Disability<br />
Disproportionate representation of racial<br />
and ethnic groups in specific disability<br />
categories that is a result of inappropriate<br />
identification (e.g. monitoring data, review<br />
of policies, practices, and procedures under<br />
618(d), etc.).<br />
Indicator 11: Child Find<br />
Percent of children with<br />
parental consent to evaluate<br />
who are evaluated within<br />
the State established timeline<br />
of 60 days.<br />
Overall<br />
(3-21)<br />
Early Childhood<br />
(3-5)<br />
School Age<br />
(5-21)<br />
State<br />
Rate<br />
0.00%<br />
Indicator 12: Early Childhood Transition<br />
Percent of children referred by Part C prior to<br />
age 3, who are found eligible for Part B, and<br />
who have an IEP developed and implemented<br />
by their third birthday.<br />
Note: - - denotes not applicable<br />
State<br />
Rate<br />
99.41%<br />
99.70%<br />
98.97%<br />
State<br />
Rate<br />
State<br />
Target<br />
0.00%<br />
State<br />
Target<br />
100.00%<br />
100.00%<br />
100.00%<br />
State<br />
Target<br />
Target Met by<br />
LEA (Y/N)<br />
Y<br />
Target Met by<br />
LEA (Y/N)<br />
Y<br />
LEA<br />
Rate<br />
100.00%<br />
— —<br />
100.00%<br />
LEA<br />
Rate<br />
Target Met by<br />
LEA (Y/N)<br />
N/A<br />
Y<br />
Note: The target for Indicator 09 is to have zero percent<br />
(0%) of districts identified as having disproportionate<br />
representation as a result of inappropriate<br />
identification in eligibility.<br />
Note: The target for Indicator 10 is to have zero<br />
percent (0%) of districts identified as having<br />
disproportionate representation as a result of<br />
inappropriate identification in a disability<br />
category.<br />
Target Met by<br />
LEA (Y/N)<br />
N/A<br />
Y<br />
Target Met<br />
by LEA<br />
(Y/N)<br />
99.21% 100.00% - - N/A<br />
Y<br />
Note: * Indicates a zero reponse rate for the<br />
district.<br />
Page 4 of 5
LEA: 2403 - COUNTY LINE SCHOOL <strong>DISTRICT</strong><br />
Indicator 13: Secondary Transition<br />
Percent of youth with disabilities aged 16 and<br />
up with an IEP that includes coordinated,<br />
measurable, annual IEP goals and transition<br />
services that will reasonably enable the student<br />
to meet the post-secondary goals.<br />
Indicator 14: Post-School Outcomes<br />
A. Percent of youth enrolled in higher<br />
education within one year of leaving high<br />
school.<br />
State<br />
Rate<br />
State<br />
Target<br />
Note: Data for this Indicator is from the on-site monitoring of LEAs for the given year.<br />
B. Percent of youth enrolled in higher<br />
education or competitively employed<br />
within one year of leaving high school.<br />
C. Percent of youth enrolled in higher<br />
education or in some other postsecondary<br />
education or training program; or<br />
competitively employed or in some other<br />
employment within one year of leaving<br />
high school.<br />
State<br />
Rate<br />
Indicator 20: Reported Data-Timely and Accurate*<br />
District submitted<br />
required data elements<br />
on or before due dates;<br />
made revisions within<br />
the alloted reveiw<br />
periods.<br />
Accurate and Timely<br />
Data Submission<br />
Overall (3-21)<br />
Early Childhood (3-5)<br />
School Age (5-21)<br />
State<br />
Target<br />
100.00%<br />
100.00%<br />
100.00%<br />
State<br />
Target<br />
LEA<br />
Rate<br />
LEA<br />
Rate<br />
Target Met by<br />
LEA (Y/N)<br />
Target Met<br />
by LEA<br />
(Y/N)<br />
Target Met<br />
by LEA<br />
(Y/N)<br />
*Data reviewed for timely and accurate submissions included all APSCN cycle data except for personnel<br />
Note: - - denotes not applicable<br />
96.19 100.00 100.00% Y<br />
14.53<br />
State<br />
Rate<br />
49.42<br />
State<br />
Rate<br />
54.07<br />
13.00<br />
State<br />
Target<br />
49.00<br />
State<br />
Target<br />
60.00<br />
Y<br />
N/A<br />
Y<br />
— —<br />
LEA<br />
Rate<br />
— —<br />
LEA<br />
Rate<br />
— —<br />
N/A<br />
Target Met<br />
by LEA<br />
(Y/N)<br />
N/A<br />
Target Met<br />
by LEA<br />
(Y/N)<br />
N/A<br />
Page 5 of 5
LEA: 2404 - OZARK SCHOOL <strong>DISTRICT</strong><br />
<strong>ARKANSAS</strong> <strong>SPECIAL</strong> <strong>EDUCATION</strong><br />
<strong>DISTRICT</strong> <strong>ANNUAL</strong> PERFORMANCE REPORT<br />
2010/11 School Year<br />
Publication Date: March 2012<br />
Each State must have in place a State Performance Plan (SPP) to evaluate the State's efforts to meet the requirements and<br />
purposes of the implementation of the Individuals with Disabilities Education Act (IDEA). The SPP is a six-year plan, which<br />
describes Arkansas's performance on 20 indicators. The Office of Special Education Programs in the U. S. Department of<br />
Education requires that States report annually to the public on the performance of each local education agency (LEA) on 14 of<br />
20 indicators as compared with targets established by the State in the SPP. Arkansas will report indicators 1 through 14 and<br />
20 for each LEA serving children with disabilities (CWD). Any LEA not meeting targets on compliance indicators (0% for<br />
Indicators 4B, 09 & 10 and 100% for Indicators 11, 12, 13, and 20) are non-compliant with IDEA.<br />
There are no report changes for the 2010/11 school year profile; However, it is important to recognize that: .<br />
1. Indicator 01 (Graduation) is reported a year in arrear (2009/10 graduates) and is based on a four-year cohort. This<br />
means the rate is a measure of students who entered in ninth grade and graduate in four years. The calculation is a<br />
requirement under Title I of the Elementary and Secondary Education Act (ESEA).<br />
2. Indicator 02 (Drop out) is reported a year in arrear. This means the rate is a measure of students who dropped out in<br />
the 2009/10 school year. The Indicator 02 data are aligned with the Common Core of Data (CCD) requirements for<br />
grades 7-12.<br />
3. Indicator 04A and 4B (Suspension/Expulsion) is reported a year in arrear. This means the rate is a measure of<br />
students who had out-of-school suspensions and/or expulsions totaling more than 10 days.<br />
Percent of youth<br />
with IEPs<br />
graduating from<br />
high school with a<br />
regular diploma<br />
For a complete description of all the Indicators, please visit the special education website at<br />
http://arksped.k12.ar.us/sections/policy.html<br />
Indicator 01: Graduation Rates (2009/10 school year) Indicator 02: Dropout Rates (2009/10 school year)<br />
State<br />
Rate<br />
State<br />
Target<br />
75.76% 85.00%<br />
LEA<br />
Rate<br />
70.00%<br />
Target Met<br />
by LEA<br />
(Y/N)<br />
N<br />
Percent of<br />
youth with<br />
IEPs dropping<br />
out of high<br />
school<br />
State<br />
Rate<br />
Indicator 03: Assessment on Statewide Benchmark Exam (grades 3-8, 11)<br />
A) Adequate Yearly Progress<br />
n=40<br />
Literacy<br />
Mathematics<br />
Met Disability Subgroup "n"<br />
for Reporting Purposes (Y/N)<br />
State Target for % of Districts Meeting<br />
AYP for Disability Subgroup<br />
State<br />
Target<br />
3.06% 4.20%<br />
LEA<br />
Rate<br />
4.00%<br />
% of Districts Meeting AYP<br />
for Disability Subgroup<br />
Target Met by<br />
LEA (Y/N)<br />
Y<br />
Target Met by<br />
LEA(Y/N)<br />
Overall N 17.15% 6.25%<br />
NA<br />
N<br />
N<br />
Note: For a district to qualify as having a disability subgroup it must have a minimum of 40 (n=40) students with disabilities in a school building.<br />
B) Participation<br />
Participation Rate: # of<br />
CWD Tested ÷ # of CWD<br />
Enrolled in grades tested.<br />
Participation Rate: Literacy<br />
Participation Rate: Math<br />
Note: - - denotes not applicable<br />
State<br />
Rate<br />
98.78%<br />
State<br />
Target<br />
95.00%<br />
LEA<br />
Rate<br />
97.50%<br />
Target Met<br />
by LEA (Y/N)<br />
98.61% 95.00% 96.70% Y<br />
Y<br />
C) Performance Proficiency<br />
Percent of CWD Scoring<br />
Proficient or Above<br />
Proficiency Rate: Literacy<br />
Proficiency Rate:<br />
Mathematics<br />
16.00%<br />
16.00%<br />
State<br />
Rate<br />
31.49%<br />
44.86%<br />
State<br />
Target<br />
45.22%<br />
51.14%<br />
LEA<br />
Rate<br />
42.67%<br />
51.76%<br />
NA<br />
NA<br />
Target<br />
Met by<br />
LEA (Y/N)<br />
N<br />
Y<br />
Page 1 of 5
LEA: 2404 - OZARK SCHOOL <strong>DISTRICT</strong><br />
Indicator 04: Out-of-School Suspensions and Expulsions (2009/10 school year)<br />
A) Suspension/Expulsion<br />
Percent difference of CWD with out-of- school suspensions and<br />
expulsions totaling greater than 10 days in a school year as<br />
compared to the same data for general education students in<br />
the district.<br />
B) Suspension/Expulsion by Race and Ethnicity<br />
Percent of districts that have: (a) a significant discrepancy, by race or<br />
ethnicity, in the rate of suspensions and expulsions of greater than 10<br />
days in a school year for children with IEPs; and (b) policies,<br />
procedures or practices that contribute to the significant discrepancy<br />
and do not comply with requirements relating to the development<br />
and implementation of IEPs, the use of positive behavioral<br />
interventions and supports, and procedural safeguards.<br />
Indicator 05: School Age (5-21) Least Restrictive Environment<br />
A) In the Regular Class 80% or more of the day<br />
Percent of CWD with<br />
IEPs receiving instruction<br />
in the regular class 80%<br />
or more of the day.<br />
State<br />
Rate<br />
State<br />
Target<br />
LEA<br />
Rate<br />
B) In the Regular Class less than 40% of the day<br />
Percent of CWD with<br />
IEPs receiving instruction<br />
in the regular class less<br />
than 60% of the day.<br />
53.87% 59.77%<br />
State<br />
Rate<br />
State<br />
Target<br />
12.42% 12.51%<br />
70.06%<br />
LEA<br />
Rate<br />
5.73%<br />
C) Other Settings outside the regular class<br />
Percent of CWD with IEPs served in<br />
public or private separate schools,<br />
residential placements, or<br />
homebound/hospital placements.<br />
State<br />
Rate<br />
State<br />
Target<br />
2.80% 2.56%<br />
Target Met<br />
by LEA (Y/N)<br />
Y<br />
Target Met<br />
by LEA (Y/N)<br />
Y<br />
LEA<br />
Rate<br />
7.64%<br />
Target Met<br />
by LEA(Y/N)<br />
Indicator 06: Early Childhood (3-5) Least Restrictive Environment<br />
A) Regular Early Childhood Program<br />
Percent of children (aged 3 through 5) with IEPs attending a regular<br />
early childhood program and receiving the majority of special<br />
education and related services in the regular early childhood program<br />
Allowable<br />
Difference<br />
LEA: 2404 - OZARK SCHOOL <strong>DISTRICT</strong><br />
Indicator 07: Preschool (3-5) Outcomes<br />
a) Percent of preschool CWD<br />
children who did not<br />
improve functioning.<br />
b) Percent of preschool CWD<br />
who improved but whose<br />
functioning remained below<br />
same age peers.<br />
c) Percent of preschool CWD<br />
who improved at a level<br />
nearer to same aged peers.<br />
d) Percent of preschool CWD<br />
who improved functioning to<br />
reach a level comparable to<br />
same age peers.<br />
e) Percent of preschool CWD<br />
children who maintain<br />
functioning at a level<br />
comparable to same aged<br />
peers.<br />
Summary<br />
Statements<br />
1) Of those preschool<br />
children who entered<br />
the preschool program<br />
below age expectations<br />
in each Outcome, the<br />
percent who<br />
substantially increased<br />
their rate of growth by<br />
the time they turned 6<br />
years of age or exited<br />
the program.<br />
2) The percent of<br />
preschool children who<br />
were functioning<br />
within age expectations<br />
in each Outcome by the<br />
time they turned 6<br />
years of age or exited<br />
A) Positive Social -Emotional<br />
Skills*<br />
State<br />
Rate<br />
A) Positive Social -<br />
Emotional Skills<br />
(Including social<br />
relationships)<br />
State<br />
Rate<br />
2.14%<br />
5.31%<br />
25.97%<br />
38.22%<br />
28.36%<br />
State<br />
Target<br />
LEA<br />
Rate<br />
LEA<br />
Rate<br />
— —<br />
— —<br />
— —<br />
— —<br />
— —<br />
Target<br />
Met by<br />
LEA(Y/N)<br />
B) Acquisition and Use of<br />
Knowledge and Skills<br />
(Including early language/<br />
communication and early literacy)<br />
B) Acquisition and Use of<br />
Knowledge and Skills **<br />
State<br />
Rate<br />
1.75%<br />
6.59%<br />
34.23%<br />
43.51%<br />
13.92%<br />
State<br />
Target<br />
LEA<br />
Rate<br />
Target<br />
Met by<br />
LEA(Y/N)<br />
C) Use of Appropriate Behaviors<br />
to Meet Their Needs<br />
State<br />
Rate<br />
State<br />
Target<br />
LEA<br />
Rate<br />
Target<br />
Met by<br />
LEA(Y/N)<br />
89.61% 90.50% — — N/A 90.31% 90.50% — — N/A 90.82% 92.50% — — N/A<br />
66.58% 69.50% — — N/A 57.43% 60.50% — — N/A 76.69% 78.50% — — N/A<br />
NOTE: * Including social relationships ** Including early language/ communication and early literacy<br />
Note: - - denotes not applicable<br />
State<br />
Rate<br />
LEA<br />
Rate<br />
— —<br />
— —<br />
— —<br />
— —<br />
— —<br />
C) Use of<br />
Appropriate<br />
Behaviors to<br />
Meet Their Needs<br />
State<br />
Rate<br />
4.51%<br />
17.34%<br />
41.72%<br />
34.97%<br />
LEA<br />
Rate<br />
1.46% — —<br />
— —<br />
— —<br />
— —<br />
— —<br />
Page 3 of 5
LEA: 2404 - OZARK SCHOOL <strong>DISTRICT</strong><br />
Indicator 08: Parent Involvement<br />
Percent of surveyed<br />
parents who reported<br />
school facilitated parent<br />
involvement as a means<br />
of improving services<br />
and results for children<br />
with disabilities.<br />
Early Childhood<br />
(3-5)<br />
School Age<br />
(5-21)<br />
State<br />
Rate<br />
90.47%<br />
95.05%<br />
Indicator 09: Disproportionality - Eligibility<br />
Disproportionate representation of racial<br />
and ethnic groups in special education and<br />
related services that is a result of<br />
inappropriate identification (e.g.<br />
monitoring data, review of policies,<br />
practices, and procedures under 618(d),<br />
etc.).<br />
State<br />
Rate<br />
State<br />
Target<br />
88.00%<br />
96.00%<br />
State<br />
Target<br />
0.00% 0.00%<br />
LEA<br />
Rate<br />
— —<br />
94.87%<br />
Indicator 10: Disproportionality-Child with a Disability<br />
Disproportionate representation of racial<br />
and ethnic groups in specific disability<br />
categories that is a result of inappropriate<br />
identification (e.g. monitoring data, review<br />
of policies, practices, and procedures under<br />
618(d), etc.).<br />
Indicator 11: Child Find<br />
Percent of children with<br />
parental consent to evaluate<br />
who are evaluated within<br />
the State established timeline<br />
of 60 days.<br />
Overall<br />
(3-21)<br />
Early Childhood<br />
(3-5)<br />
School Age<br />
(5-21)<br />
State<br />
Rate<br />
0.00%<br />
Indicator 12: Early Childhood Transition<br />
Percent of children referred by Part C prior to<br />
age 3, who are found eligible for Part B, and<br />
who have an IEP developed and implemented<br />
by their third birthday.<br />
Note: - - denotes not applicable<br />
State<br />
Rate<br />
99.41%<br />
99.70%<br />
98.97%<br />
State<br />
Rate<br />
State<br />
Target<br />
0.00%<br />
State<br />
Target<br />
100.00%<br />
100.00%<br />
100.00%<br />
State<br />
Target<br />
Target Met by<br />
LEA (Y/N)<br />
Y<br />
Target Met by<br />
LEA (Y/N)<br />
Y<br />
LEA<br />
Rate<br />
100.00%<br />
— —<br />
100.00%<br />
LEA<br />
Rate<br />
Target Met by<br />
LEA (Y/N)<br />
N/A<br />
N<br />
Note: The target for Indicator 09 is to have zero percent<br />
(0%) of districts identified as having disproportionate<br />
representation as a result of inappropriate<br />
identification in eligibility.<br />
Note: The target for Indicator 10 is to have zero<br />
percent (0%) of districts identified as having<br />
disproportionate representation as a result of<br />
inappropriate identification in a disability<br />
category.<br />
Target Met by<br />
LEA (Y/N)<br />
N/A<br />
Y<br />
Target Met<br />
by LEA<br />
(Y/N)<br />
99.21% 100.00% - - N/A<br />
Y<br />
Note: * Indicates a zero reponse rate for the<br />
district.<br />
Page 4 of 5
LEA: 2404 - OZARK SCHOOL <strong>DISTRICT</strong><br />
Indicator 13: Secondary Transition<br />
Percent of youth with disabilities aged 16 and<br />
up with an IEP that includes coordinated,<br />
measurable, annual IEP goals and transition<br />
services that will reasonably enable the student<br />
to meet the post-secondary goals.<br />
Indicator 14: Post-School Outcomes<br />
A. Percent of youth enrolled in higher<br />
education within one year of leaving high<br />
school.<br />
State<br />
Rate<br />
State<br />
Target<br />
Note: Data for this Indicator is from the on-site monitoring of LEAs for the given year.<br />
B. Percent of youth enrolled in higher<br />
education or competitively employed<br />
within one year of leaving high school.<br />
C. Percent of youth enrolled in higher<br />
education or in some other postsecondary<br />
education or training program; or<br />
competitively employed or in some other<br />
employment within one year of leaving<br />
high school.<br />
State<br />
Rate<br />
Indicator 20: Reported Data-Timely and Accurate*<br />
District submitted<br />
required data elements<br />
on or before due dates;<br />
made revisions within<br />
the alloted reveiw<br />
periods.<br />
Accurate and Timely<br />
Data Submission<br />
Overall (3-21)<br />
Early Childhood (3-5)<br />
School Age (5-21)<br />
State<br />
Target<br />
100.00%<br />
100.00%<br />
100.00%<br />
State<br />
Target<br />
LEA<br />
Rate<br />
LEA<br />
Rate<br />
Target Met by<br />
LEA (Y/N)<br />
Target Met<br />
by LEA<br />
(Y/N)<br />
Target Met<br />
by LEA<br />
(Y/N)<br />
*Data reviewed for timely and accurate submissions included all APSCN cycle data except for personnel<br />
Note: - - denotes not applicable<br />
96.19 100.00 100.00% Y<br />
14.53<br />
State<br />
Rate<br />
49.42<br />
State<br />
Rate<br />
54.07<br />
13.00<br />
State<br />
Target<br />
49.00<br />
State<br />
Target<br />
60.00<br />
Y<br />
N/A<br />
Y<br />
— —<br />
LEA<br />
Rate<br />
— —<br />
LEA<br />
Rate<br />
— —<br />
N/A<br />
Target Met<br />
by LEA<br />
(Y/N)<br />
N/A<br />
Target Met<br />
by LEA<br />
(Y/N)<br />
N/A<br />
Page 5 of 5
LEA: 2420 - WESTERN <strong>ARKANSAS</strong> CO-OP<br />
<strong>ARKANSAS</strong> <strong>SPECIAL</strong> <strong>EDUCATION</strong><br />
<strong>DISTRICT</strong> <strong>ANNUAL</strong> PERFORMANCE REPORT<br />
2010/11 School Year<br />
Publication Date: March 2012<br />
Each State must have in place a State Performance Plan (SPP) to evaluate the State's efforts to meet the requirements and<br />
purposes of the implementation of the Individuals with Disabilities Education Act (IDEA). The SPP is a six-year plan, which<br />
describes Arkansas's performance on 20 indicators. The Office of Special Education Programs in the U. S. Department of<br />
Education requires that States report annually to the public on the performance of each local education agency (LEA) on 14 of<br />
20 indicators as compared with targets established by the State in the SPP. Arkansas will report indicators 1 through 14 and<br />
20 for each LEA serving children with disabilities (CWD). Any LEA not meeting targets on compliance indicators (0% for<br />
Indicators 4B, 09 & 10 and 100% for Indicators 11, 12, 13, and 20) are non-compliant with IDEA.<br />
There are no report changes for the 2010/11 school year profile; However, it is important to recognize that: .<br />
1. Indicator 01 (Graduation) is reported a year in arrear (2009/10 graduates) and is based on a four-year cohort. This<br />
means the rate is a measure of students who entered in ninth grade and graduate in four years. The calculation is a<br />
requirement under Title I of the Elementary and Secondary Education Act (ESEA).<br />
2. Indicator 02 (Drop out) is reported a year in arrear. This means the rate is a measure of students who dropped out in<br />
the 2009/10 school year. The Indicator 02 data are aligned with the Common Core of Data (CCD) requirements for<br />
grades 7-12.<br />
3. Indicator 04A and 4B (Suspension/Expulsion) is reported a year in arrear. This means the rate is a measure of<br />
students who had out-of-school suspensions and/or expulsions totaling more than 10 days.<br />
Percent of youth<br />
with IEPs<br />
graduating from<br />
high school with a<br />
regular diploma<br />
For a complete description of all the Indicators, please visit the special education website at<br />
http://arksped.k12.ar.us/sections/policy.html<br />
Indicator 01: Graduation Rates (2009/10 school year) Indicator 02: Dropout Rates (2009/10 school year)<br />
State<br />
Rate<br />
State<br />
Target<br />
75.76% 85.00%<br />
LEA<br />
Rate<br />
— —<br />
Target Met<br />
by LEA<br />
(Y/N)<br />
NA<br />
Percent of<br />
youth with<br />
IEPs dropping<br />
out of high<br />
school<br />
State<br />
Rate<br />
Indicator 03: Assessment on Statewide Benchmark Exam (grades 3-8, 11)<br />
A) Adequate Yearly Progress<br />
n=40<br />
Literacy<br />
Mathematics<br />
Met Disability Subgroup "n"<br />
for Reporting Purposes (Y/N)<br />
State Target for % of Districts Meeting<br />
AYP for Disability Subgroup<br />
State<br />
Target<br />
3.06% 4.20%<br />
LEA<br />
Rate<br />
— —<br />
% of Districts Meeting AYP<br />
for Disability Subgroup<br />
Target Met by<br />
LEA (Y/N)<br />
N/A<br />
Target Met by<br />
LEA(Y/N)<br />
Overall N/A 17.15% 6.25%<br />
N/A<br />
N/A<br />
N/A<br />
Note: For a district to qualify as having a disability subgroup it must have a minimum of 40 (n=40) students with disabilities in a school building.<br />
B) Participation<br />
Participation Rate: # of<br />
CWD Tested ÷ # of CWD<br />
Enrolled in grades tested.<br />
Participation Rate: Literacy<br />
Participation Rate: Math<br />
Note: - - denotes not applicable<br />
State<br />
Rate<br />
98.78%<br />
State<br />
Target<br />
95.00%<br />
LEA<br />
Rate<br />
— —<br />
Target Met<br />
by LEA (Y/N)<br />
N/A<br />
98.61% 95.00% — — N/A<br />
C) Performance Proficiency<br />
Percent of CWD Scoring<br />
Proficient or Above<br />
Proficiency Rate: Literacy<br />
Proficiency Rate:<br />
Mathematics<br />
16.00%<br />
16.00%<br />
State<br />
Rate<br />
31.49%<br />
44.86%<br />
State<br />
Target<br />
45.22%<br />
51.14%<br />
LEA<br />
Rate<br />
— —<br />
— —<br />
N/A<br />
N/A<br />
Target<br />
Met by<br />
LEA (Y/N)<br />
N/A<br />
N/A<br />
Page 1 of 5
LEA: 2420 - WESTERN <strong>ARKANSAS</strong> CO-OP<br />
Indicator 04: Out-of-School Suspensions and Expulsions (2009/10 school year)<br />
A) Suspension/Expulsion<br />
Percent difference of CWD with out-of- school suspensions and<br />
expulsions totaling greater than 10 days in a school year as<br />
compared to the same data for general education students in<br />
the district.<br />
B) Suspension/Expulsion by Race and Ethnicity<br />
Percent of districts that have: (a) a significant discrepancy, by race or<br />
ethnicity, in the rate of suspensions and expulsions of greater than 10<br />
days in a school year for children with IEPs; and (b) policies,<br />
procedures or practices that contribute to the significant discrepancy<br />
and do not comply with requirements relating to the development<br />
and implementation of IEPs, the use of positive behavioral<br />
interventions and supports, and procedural safeguards.<br />
Indicator 05: School Age (5-21) Least Restrictive Environment<br />
A) In the Regular Class 80% or more of the day<br />
Percent of CWD with<br />
IEPs receiving instruction<br />
in the regular class 80%<br />
or more of the day.<br />
State<br />
Rate<br />
State<br />
Target<br />
LEA<br />
Rate<br />
B) In the Regular Class less than 40% of the day<br />
Percent of CWD with<br />
IEPs receiving instruction<br />
in the regular class less<br />
than 60% of the day.<br />
53.87% 59.77%<br />
State<br />
Rate<br />
State<br />
Target<br />
12.42% 12.51%<br />
— —<br />
LEA<br />
Rate<br />
— —<br />
C) Other Settings outside the regular class<br />
Percent of CWD with IEPs served in<br />
public or private separate schools,<br />
residential placements, or<br />
homebound/hospital placements.<br />
State<br />
Rate<br />
State<br />
Target<br />
2.80% 2.56%<br />
Target Met<br />
by LEA (Y/N)<br />
N/A<br />
Target Met<br />
by LEA (Y/N)<br />
N/A<br />
LEA<br />
Rate<br />
— —<br />
Target Met<br />
by LEA(Y/N)<br />
N/A<br />
Indicator 06: Early Childhood (3-5) Least Restrictive Environment<br />
A) Regular Early Childhood Program<br />
Percent of children (aged 3 through 5) with IEPs attending a regular<br />
early childhood program and receiving the majority of special<br />
education and related services in the regular early childhood program<br />
Allowable<br />
Difference<br />
LEA: 2420 - WESTERN <strong>ARKANSAS</strong> CO-OP<br />
Indicator 07: Preschool (3-5) Outcomes<br />
a) Percent of preschool CWD<br />
children who did not<br />
improve functioning.<br />
b) Percent of preschool CWD<br />
who improved but whose<br />
functioning remained below<br />
same age peers.<br />
c) Percent of preschool CWD<br />
who improved at a level<br />
nearer to same aged peers.<br />
d) Percent of preschool CWD<br />
who improved functioning to<br />
reach a level comparable to<br />
same age peers.<br />
e) Percent of preschool CWD<br />
children who maintain<br />
functioning at a level<br />
comparable to same aged<br />
peers.<br />
Summary<br />
Statements<br />
1) Of those preschool<br />
children who entered<br />
the preschool program<br />
below age expectations<br />
in each Outcome, the<br />
percent who<br />
substantially increased<br />
their rate of growth by<br />
the time they turned 6<br />
years of age or exited<br />
the program.<br />
2) The percent of<br />
preschool children who<br />
were functioning<br />
within age expectations<br />
in each Outcome by the<br />
time they turned 6<br />
years of age or exited<br />
A) Positive Social -Emotional<br />
Skills*<br />
State<br />
Rate<br />
A) Positive Social -<br />
Emotional Skills<br />
(Including social<br />
relationships)<br />
State<br />
Rate<br />
2.14%<br />
5.31%<br />
25.97%<br />
38.22%<br />
28.36%<br />
State<br />
Target<br />
LEA<br />
Rate<br />
LEA<br />
Rate<br />
4.38%<br />
4.38%<br />
40.15%<br />
27.01%<br />
24.09%<br />
Target<br />
Met by<br />
LEA(Y/N)<br />
B) Acquisition and Use of<br />
Knowledge and Skills<br />
(Including early language/<br />
communication and early literacy)<br />
B) Acquisition and Use of<br />
Knowledge and Skills **<br />
State<br />
Rate<br />
1.75%<br />
6.59%<br />
34.23%<br />
43.51%<br />
13.92%<br />
State<br />
Target<br />
LEA<br />
Rate<br />
Target<br />
Met by<br />
LEA(Y/N)<br />
C) Use of Appropriate Behaviors<br />
to Meet Their Needs<br />
State<br />
Rate<br />
State<br />
Target<br />
LEA<br />
Rate<br />
Target<br />
Met by<br />
LEA(Y/N)<br />
89.61% 90.50% 88.46% N 90.31% 90.50% 86.36% N 90.82% 92.50% 79.35% N<br />
66.58% 69.50% 51.09% N 57.43% 60.50% 50.36% N 76.69% 78.50% 62.04% N<br />
NOTE: * Including social relationships ** Including early language/ communication and early literacy<br />
Note: - - denotes not applicable<br />
State<br />
Rate<br />
LEA<br />
Rate<br />
2.19%<br />
8.76%<br />
38.69%<br />
30.66%<br />
19.71%<br />
C) Use of<br />
Appropriate<br />
Behaviors to<br />
Meet Their Needs<br />
State<br />
Rate<br />
4.51%<br />
17.34%<br />
41.72%<br />
34.97%<br />
LEA<br />
Rate<br />
1.46% 2.92%<br />
10.95%<br />
24.09%<br />
29.20%<br />
32.85%<br />
Page 3 of 5
LEA: 2420 - WESTERN <strong>ARKANSAS</strong> CO-OP<br />
Indicator 08: Parent Involvement<br />
Percent of surveyed<br />
parents who reported<br />
school facilitated parent<br />
involvement as a means<br />
of improving services<br />
and results for children<br />
with disabilities.<br />
Early Childhood<br />
(3-5)<br />
School Age<br />
(5-21)<br />
State<br />
Rate<br />
90.47%<br />
95.05%<br />
Indicator 09: Disproportionality - Eligibility<br />
Disproportionate representation of racial<br />
and ethnic groups in special education and<br />
related services that is a result of<br />
inappropriate identification (e.g.<br />
monitoring data, review of policies,<br />
practices, and procedures under 618(d),<br />
etc.).<br />
State<br />
Rate<br />
State<br />
Target<br />
88.00%<br />
96.00%<br />
State<br />
Target<br />
0.00% 0.00%<br />
LEA<br />
Rate<br />
92.50%<br />
— —<br />
Indicator 10: Disproportionality-Child with a Disability<br />
Disproportionate representation of racial<br />
and ethnic groups in specific disability<br />
categories that is a result of inappropriate<br />
identification (e.g. monitoring data, review<br />
of policies, practices, and procedures under<br />
618(d), etc.).<br />
Indicator 11: Child Find<br />
Percent of children with<br />
parental consent to evaluate<br />
who are evaluated within<br />
the State established timeline<br />
of 60 days.<br />
Overall<br />
(3-21)<br />
Early Childhood<br />
(3-5)<br />
School Age<br />
(5-21)<br />
State<br />
Rate<br />
0.00%<br />
Indicator 12: Early Childhood Transition<br />
Percent of children referred by Part C prior to<br />
age 3, who are found eligible for Part B, and<br />
who have an IEP developed and implemented<br />
by their third birthday.<br />
Note: - - denotes not applicable<br />
State<br />
Rate<br />
99.41%<br />
99.70%<br />
98.97%<br />
State<br />
Rate<br />
State<br />
Target<br />
0.00%<br />
State<br />
Target<br />
100.00%<br />
100.00%<br />
100.00%<br />
State<br />
Target<br />
Target Met by<br />
LEA (Y/N)<br />
N/A<br />
Target Met by<br />
LEA (Y/N)<br />
N/A<br />
LEA<br />
Rate<br />
99.32%<br />
99.32%<br />
— —<br />
LEA<br />
Rate<br />
Target Met by<br />
LEA (Y/N)<br />
Y<br />
N/A<br />
Note: The target for Indicator 09 is to have zero percent<br />
(0%) of districts identified as having disproportionate<br />
representation as a result of inappropriate<br />
identification in eligibility.<br />
Note: The target for Indicator 10 is to have zero<br />
percent (0%) of districts identified as having<br />
disproportionate representation as a result of<br />
inappropriate identification in a disability<br />
category.<br />
Target Met by<br />
LEA (Y/N)<br />
N<br />
N/A<br />
Target Met<br />
by LEA<br />
(Y/N)<br />
99.21% 100.00% 100.00% Y<br />
N<br />
Note: * Indicates a zero reponse rate for the<br />
district.<br />
Page 4 of 5
LEA: 2420 - WESTERN <strong>ARKANSAS</strong> CO-OP<br />
Indicator 13: Secondary Transition<br />
Percent of youth with disabilities aged 16 and<br />
up with an IEP that includes coordinated,<br />
measurable, annual IEP goals and transition<br />
services that will reasonably enable the student<br />
to meet the post-secondary goals.<br />
Indicator 14: Post-School Outcomes<br />
A. Percent of youth enrolled in higher<br />
education within one year of leaving high<br />
school.<br />
State<br />
Rate<br />
State<br />
Target<br />
Note: Data for this Indicator is from the on-site monitoring of LEAs for the given year.<br />
B. Percent of youth enrolled in higher<br />
education or competitively employed<br />
within one year of leaving high school.<br />
C. Percent of youth enrolled in higher<br />
education or in some other postsecondary<br />
education or training program; or<br />
competitively employed or in some other<br />
employment within one year of leaving<br />
high school.<br />
State<br />
Rate<br />
Indicator 20: Reported Data-Timely and Accurate*<br />
District submitted<br />
required data elements<br />
on or before due dates;<br />
made revisions within<br />
the alloted reveiw<br />
periods.<br />
Accurate and Timely<br />
Data Submission<br />
Overall (3-21)<br />
Early Childhood (3-5)<br />
School Age (5-21)<br />
State<br />
Target<br />
100.00%<br />
100.00%<br />
100.00%<br />
State<br />
Target<br />
LEA<br />
Rate<br />
LEA<br />
Rate<br />
Target Met by<br />
LEA (Y/N)<br />
Target Met<br />
by LEA<br />
(Y/N)<br />
Target Met<br />
by LEA<br />
(Y/N)<br />
*Data reviewed for timely and accurate submissions included all APSCN cycle data except for personnel<br />
Note: - - denotes not applicable<br />
96.19 100.00 — — N/A<br />
14.53<br />
State<br />
Rate<br />
49.42<br />
State<br />
Rate<br />
54.07<br />
13.00<br />
State<br />
Target<br />
49.00<br />
State<br />
Target<br />
60.00<br />
Y<br />
Y<br />
N/A<br />
— —<br />
LEA<br />
Rate<br />
— —<br />
LEA<br />
Rate<br />
— —<br />
N/A<br />
Target Met<br />
by LEA<br />
(Y/N)<br />
N/A<br />
Target Met<br />
by LEA<br />
(Y/N)<br />
N/A<br />
Page 5 of 5
<strong>ARKANSAS</strong> <strong>SPECIAL</strong> <strong>EDUCATION</strong><br />
<strong>DISTRICT</strong> <strong>ANNUAL</strong> PERFORMANCE REPORT<br />
2010/11 School Year<br />
Publication Date: March 2012<br />
Each State must have in place a State Performance Plan (SPP) to evaluate the State's efforts to meet the requirements and<br />
purposes of the implementation of the Individuals with Disabilities Education Act (IDEA). The SPP is a six-year plan, which<br />
describes Arkansas's performance on 20 indicators. The Office of Special Education Programs in the U. S. Department of<br />
Education requires that States report annually to the public on the performance of each local education agency (LEA) on 14 of<br />
20 indicators as compared with targets established by the State in the SPP. Arkansas will report indicators 1 through 14 and<br />
20 for each LEA serving children with disabilities (CWD). Any LEA not meeting targets on compliance indicators (0% for<br />
Indicators 4B, 09 & 10 and 100% for Indicators 11, 12, 13, and 20) are non-compliant with IDEA.<br />
There are no report changes for the 2010/11 school year profile; However, it is important to recognize that: .<br />
1. Indicator 01 (Graduation) is reported a year in arrear (2009/10 graduates) and is based on a four-year cohort. This<br />
means the rate is a measure of students who entered in ninth grade and graduate in four years. The calculation is a<br />
requirement under Title I of the Elementary and Secondary Education Act (ESEA).<br />
2. Indicator 02 (Drop out) is reported a year in arrear. This means the rate is a measure of students who dropped out in<br />
the 2009/10 school year. The Indicator 02 data are aligned with the Common Core of Data (CCD) requirements for<br />
grades 7-12.<br />
3. Indicator 04A and 4B (Suspension/Expulsion) is reported a year in arrear. This means the rate is a measure of<br />
students who had out-of-school suspensions and/or expulsions totaling more than 10 days.<br />
For a complete description of all the Indicators, please visit the special education website at<br />
http://arksped.k12.ar.us/sections/policy.html<br />
LEA: 2501 - MAMMOTH SPRING SCHOOL <strong>DISTRICT</strong><br />
Indicator 01: Graduation Rates (2009/10 school year) Indicator 02: Dropout Rates (2009/10 school year)<br />
Percent of youth<br />
with IEPs<br />
graduating from<br />
high school with a<br />
regular diploma<br />
State<br />
Rate<br />
State<br />
Target<br />
75.76% 85.00%<br />
LEA<br />
Rate<br />
66.67%<br />
Target Met<br />
by LEA<br />
(Y/N)<br />
N<br />
Percent of<br />
youth with<br />
IEPs dropping<br />
out of high<br />
school<br />
State<br />
Rate<br />
Indicator 03: Assessment on Statewide Benchmark Exam (grades 3-8, 11)<br />
A) Adequate Yearly Progress<br />
n=40<br />
Literacy<br />
Mathematics<br />
Met Disability Subgroup "n"<br />
for Reporting Purposes (Y/N)<br />
State Target for % of Districts Meeting<br />
AYP for Disability Subgroup<br />
State<br />
Target<br />
3.06% 4.20%<br />
LEA<br />
Rate<br />
0.00%<br />
% of Districts Meeting AYP<br />
for Disability Subgroup<br />
Target Met by<br />
LEA (Y/N)<br />
Y<br />
Target Met by<br />
LEA(Y/N)<br />
Overall N 17.15% 6.25%<br />
NA<br />
N<br />
N<br />
Note: For a district to qualify as having a disability subgroup it must have a minimum of 40 (n=40) students with disabilities in a school building.<br />
B) Participation<br />
Participation Rate: # of<br />
CWD Tested ÷ # of CWD<br />
Enrolled in grades tested.<br />
Participation Rate: Literacy<br />
Participation Rate: Math<br />
Note: - - denotes not applicable<br />
State<br />
Rate<br />
98.78%<br />
State<br />
Target<br />
95.00%<br />
LEA<br />
Rate<br />
100.00%<br />
Target Met<br />
by LEA (Y/N)<br />
98.61% 95.00% 100.00% Y<br />
Y<br />
C) Performance Proficiency<br />
Percent of CWD Scoring<br />
Proficient or Above<br />
Proficiency Rate: Literacy<br />
Proficiency Rate:<br />
Mathematics<br />
16.00%<br />
16.00%<br />
State<br />
Rate<br />
31.49%<br />
44.86%<br />
State<br />
Target<br />
45.22%<br />
51.14%<br />
LEA<br />
Rate<br />
41.38%<br />
62.50%<br />
NA<br />
NA<br />
Target<br />
Met by<br />
LEA (Y/N)<br />
N<br />
Y<br />
Page 1 of 5
LEA: 2501 - MAMMOTH SPRING SCHOOL <strong>DISTRICT</strong><br />
Indicator 04: Out-of-School Suspensions and Expulsions (2009/10 school year)<br />
A) Suspension/Expulsion<br />
Percent difference of CWD with out-of- school suspensions and<br />
expulsions totaling greater than 10 days in a school year as<br />
compared to the same data for general education students in<br />
the district.<br />
B) Suspension/Expulsion by Race and Ethnicity<br />
Percent of districts that have: (a) a significant discrepancy, by race or<br />
ethnicity, in the rate of suspensions and expulsions of greater than 10<br />
days in a school year for children with IEPs; and (b) policies,<br />
procedures or practices that contribute to the significant discrepancy<br />
and do not comply with requirements relating to the development<br />
and implementation of IEPs, the use of positive behavioral<br />
interventions and supports, and procedural safeguards.<br />
Indicator 05: School Age (5-21) Least Restrictive Environment<br />
A) In the Regular Class 80% or more of the day<br />
Percent of CWD with<br />
IEPs receiving instruction<br />
in the regular class 80%<br />
or more of the day.<br />
State<br />
Rate<br />
State<br />
Target<br />
LEA<br />
Rate<br />
B) In the Regular Class less than 40% of the day<br />
Percent of CWD with<br />
IEPs receiving instruction<br />
in the regular class less<br />
than 60% of the day.<br />
53.87% 59.77%<br />
State<br />
Rate<br />
State<br />
Target<br />
12.42% 12.51%<br />
45.95%<br />
LEA<br />
Rate<br />
5.41%<br />
C) Other Settings outside the regular class<br />
Percent of CWD with IEPs served in<br />
public or private separate schools,<br />
residential placements, or<br />
homebound/hospital placements.<br />
State<br />
Rate<br />
State<br />
Target<br />
2.80% 2.56%<br />
Target Met<br />
by LEA (Y/N)<br />
N<br />
Target Met<br />
by LEA (Y/N)<br />
Y<br />
LEA<br />
Rate<br />
1.35%<br />
Target Met<br />
by LEA(Y/N)<br />
Indicator 06: Early Childhood (3-5) Least Restrictive Environment<br />
A) Regular Early Childhood Program<br />
Percent of children (aged 3 through 5) with IEPs attending a regular<br />
early childhood program and receiving the majority of special<br />
education and related services in the regular early childhood program<br />
Allowable<br />
Difference<br />
LEA: 2501 - MAMMOTH SPRING SCHOOL <strong>DISTRICT</strong><br />
Indicator 07: Preschool (3-5) Outcomes<br />
a) Percent of preschool CWD<br />
children who did not<br />
improve functioning.<br />
b) Percent of preschool CWD<br />
who improved but whose<br />
functioning remained below<br />
same age peers.<br />
c) Percent of preschool CWD<br />
who improved at a level<br />
nearer to same aged peers.<br />
d) Percent of preschool CWD<br />
who improved functioning to<br />
reach a level comparable to<br />
same age peers.<br />
e) Percent of preschool CWD<br />
children who maintain<br />
functioning at a level<br />
comparable to same aged<br />
peers.<br />
Summary<br />
Statements<br />
1) Of those preschool<br />
children who entered<br />
the preschool program<br />
below age expectations<br />
in each Outcome, the<br />
percent who<br />
substantially increased<br />
their rate of growth by<br />
the time they turned 6<br />
years of age or exited<br />
the program.<br />
2) The percent of<br />
preschool children who<br />
were functioning<br />
within age expectations<br />
in each Outcome by the<br />
time they turned 6<br />
years of age or exited<br />
A) Positive Social -Emotional<br />
Skills*<br />
State<br />
Rate<br />
A) Positive Social -<br />
Emotional Skills<br />
(Including social<br />
relationships)<br />
State<br />
Rate<br />
2.14%<br />
5.31%<br />
25.97%<br />
38.22%<br />
28.36%<br />
State<br />
Target<br />
LEA<br />
Rate<br />
LEA<br />
Rate<br />
— —<br />
14.29%<br />
71.43%<br />
14.29%<br />
— —<br />
Target<br />
Met by<br />
LEA(Y/N)<br />
B) Acquisition and Use of<br />
Knowledge and Skills<br />
(Including early language/<br />
communication and early literacy)<br />
B) Acquisition and Use of<br />
Knowledge and Skills **<br />
State<br />
Rate<br />
1.75%<br />
6.59%<br />
34.23%<br />
43.51%<br />
13.92%<br />
State<br />
Target<br />
LEA<br />
Rate<br />
Target<br />
Met by<br />
LEA(Y/N)<br />
C) Use of Appropriate Behaviors<br />
to Meet Their Needs<br />
State<br />
Rate<br />
State<br />
Target<br />
LEA<br />
Rate<br />
Target<br />
Met by<br />
LEA(Y/N)<br />
89.61% 90.50% 85.71% N 90.31% 90.50% 100.00% Y 90.82% 92.50% 100.00% Y<br />
66.58% 69.50% 14.29% N 57.43% 60.50% 28.57% N 76.69% 78.50% 42.86% N<br />
NOTE: * Including social relationships ** Including early language/ communication and early literacy<br />
Note: - - denotes not applicable<br />
State<br />
Rate<br />
LEA<br />
Rate<br />
— —<br />
— —<br />
71.43%<br />
28.57%<br />
— —<br />
C) Use of<br />
Appropriate<br />
Behaviors to<br />
Meet Their Needs<br />
State<br />
Rate<br />
4.51%<br />
17.34%<br />
41.72%<br />
34.97%<br />
LEA<br />
Rate<br />
1.46% — —<br />
— —<br />
57.14%<br />
42.86%<br />
— —<br />
Page 3 of 5
LEA: 2501 - MAMMOTH SPRING SCHOOL <strong>DISTRICT</strong><br />
Indicator 08: Parent Involvement<br />
Percent of surveyed<br />
parents who reported<br />
school facilitated parent<br />
involvement as a means<br />
of improving services<br />
and results for children<br />
with disabilities.<br />
Early Childhood<br />
(3-5)<br />
School Age<br />
(5-21)<br />
State<br />
Rate<br />
90.47%<br />
95.05%<br />
Indicator 09: Disproportionality - Eligibility<br />
Disproportionate representation of racial<br />
and ethnic groups in special education and<br />
related services that is a result of<br />
inappropriate identification (e.g.<br />
monitoring data, review of policies,<br />
practices, and procedures under 618(d),<br />
etc.).<br />
State<br />
Rate<br />
State<br />
Target<br />
88.00%<br />
96.00%<br />
State<br />
Target<br />
0.00% 0.00%<br />
LEA<br />
Rate<br />
90.00%<br />
97.87%<br />
Indicator 10: Disproportionality-Child with a Disability<br />
Disproportionate representation of racial<br />
and ethnic groups in specific disability<br />
categories that is a result of inappropriate<br />
identification (e.g. monitoring data, review<br />
of policies, practices, and procedures under<br />
618(d), etc.).<br />
Indicator 11: Child Find<br />
Percent of children with<br />
parental consent to evaluate<br />
who are evaluated within<br />
the State established timeline<br />
of 60 days.<br />
Overall<br />
(3-21)<br />
Early Childhood<br />
(3-5)<br />
School Age<br />
(5-21)<br />
State<br />
Rate<br />
0.00%<br />
Indicator 12: Early Childhood Transition<br />
Percent of children referred by Part C prior to<br />
age 3, who are found eligible for Part B, and<br />
who have an IEP developed and implemented<br />
by their third birthday.<br />
Note: - - denotes not applicable<br />
State<br />
Rate<br />
99.41%<br />
99.70%<br />
98.97%<br />
State<br />
Rate<br />
State<br />
Target<br />
0.00%<br />
State<br />
Target<br />
100.00%<br />
100.00%<br />
100.00%<br />
State<br />
Target<br />
Target Met by<br />
LEA (Y/N)<br />
Y<br />
Target Met by<br />
LEA (Y/N)<br />
Y<br />
LEA<br />
Rate<br />
100.00%<br />
100.00%<br />
100.00%<br />
LEA<br />
Rate<br />
Target Met by<br />
LEA (Y/N)<br />
Y<br />
Y<br />
Note: The target for Indicator 09 is to have zero percent<br />
(0%) of districts identified as having disproportionate<br />
representation as a result of inappropriate<br />
identification in eligibility.<br />
Note: The target for Indicator 10 is to have zero<br />
percent (0%) of districts identified as having<br />
disproportionate representation as a result of<br />
inappropriate identification in a disability<br />
category.<br />
Target Met by<br />
LEA (Y/N)<br />
Y<br />
Y<br />
Target Met<br />
by LEA<br />
(Y/N)<br />
99.21% 100.00% - - N/A<br />
Y<br />
Note: * Indicates a zero reponse rate for the<br />
district.<br />
Page 4 of 5
LEA: 2501 - MAMMOTH SPRING SCHOOL <strong>DISTRICT</strong><br />
Indicator 13: Secondary Transition<br />
Percent of youth with disabilities aged 16 and<br />
up with an IEP that includes coordinated,<br />
measurable, annual IEP goals and transition<br />
services that will reasonably enable the student<br />
to meet the post-secondary goals.<br />
Indicator 14: Post-School Outcomes<br />
A. Percent of youth enrolled in higher<br />
education within one year of leaving high<br />
school.<br />
State<br />
Rate<br />
State<br />
Target<br />
Note: Data for this Indicator is from the on-site monitoring of LEAs for the given year.<br />
B. Percent of youth enrolled in higher<br />
education or competitively employed<br />
within one year of leaving high school.<br />
C. Percent of youth enrolled in higher<br />
education or in some other postsecondary<br />
education or training program; or<br />
competitively employed or in some other<br />
employment within one year of leaving<br />
high school.<br />
State<br />
Rate<br />
Indicator 20: Reported Data-Timely and Accurate*<br />
District submitted<br />
required data elements<br />
on or before due dates;<br />
made revisions within<br />
the alloted reveiw<br />
periods.<br />
Accurate and Timely<br />
Data Submission<br />
Overall (3-21)<br />
Early Childhood (3-5)<br />
School Age (5-21)<br />
State<br />
Target<br />
100.00%<br />
100.00%<br />
100.00%<br />
State<br />
Target<br />
LEA<br />
Rate<br />
LEA<br />
Rate<br />
Target Met by<br />
LEA (Y/N)<br />
Target Met<br />
by LEA<br />
(Y/N)<br />
Target Met<br />
by LEA<br />
(Y/N)<br />
*Data reviewed for timely and accurate submissions included all APSCN cycle data except for personnel<br />
Note: - - denotes not applicable<br />
96.19 100.00 — — N/A<br />
14.53<br />
State<br />
Rate<br />
49.42<br />
State<br />
Rate<br />
54.07<br />
13.00<br />
State<br />
Target<br />
49.00<br />
State<br />
Target<br />
60.00<br />
Y<br />
Y<br />
Y<br />
— —<br />
LEA<br />
Rate<br />
— —<br />
LEA<br />
Rate<br />
— —<br />
N/A<br />
Target Met<br />
by LEA<br />
(Y/N)<br />
N/A<br />
Target Met<br />
by LEA<br />
(Y/N)<br />
N/A<br />
Page 5 of 5
LEA: 2502 - SALEM SCHOOL <strong>DISTRICT</strong><br />
<strong>ARKANSAS</strong> <strong>SPECIAL</strong> <strong>EDUCATION</strong><br />
<strong>DISTRICT</strong> <strong>ANNUAL</strong> PERFORMANCE REPORT<br />
2010/11 School Year<br />
Publication Date: March 2012<br />
Each State must have in place a State Performance Plan (SPP) to evaluate the State's efforts to meet the requirements and<br />
purposes of the implementation of the Individuals with Disabilities Education Act (IDEA). The SPP is a six-year plan, which<br />
describes Arkansas's performance on 20 indicators. The Office of Special Education Programs in the U. S. Department of<br />
Education requires that States report annually to the public on the performance of each local education agency (LEA) on 14 of<br />
20 indicators as compared with targets established by the State in the SPP. Arkansas will report indicators 1 through 14 and<br />
20 for each LEA serving children with disabilities (CWD). Any LEA not meeting targets on compliance indicators (0% for<br />
Indicators 4B, 09 & 10 and 100% for Indicators 11, 12, 13, and 20) are non-compliant with IDEA.<br />
There are no report changes for the 2010/11 school year profile; However, it is important to recognize that: .<br />
1. Indicator 01 (Graduation) is reported a year in arrear (2009/10 graduates) and is based on a four-year cohort. This<br />
means the rate is a measure of students who entered in ninth grade and graduate in four years. The calculation is a<br />
requirement under Title I of the Elementary and Secondary Education Act (ESEA).<br />
2. Indicator 02 (Drop out) is reported a year in arrear. This means the rate is a measure of students who dropped out in<br />
the 2009/10 school year. The Indicator 02 data are aligned with the Common Core of Data (CCD) requirements for<br />
grades 7-12.<br />
3. Indicator 04A and 4B (Suspension/Expulsion) is reported a year in arrear. This means the rate is a measure of<br />
students who had out-of-school suspensions and/or expulsions totaling more than 10 days.<br />
Percent of youth<br />
with IEPs<br />
graduating from<br />
high school with a<br />
regular diploma<br />
For a complete description of all the Indicators, please visit the special education website at<br />
http://arksped.k12.ar.us/sections/policy.html<br />
Indicator 01: Graduation Rates (2009/10 school year) Indicator 02: Dropout Rates (2009/10 school year)<br />
State<br />
Rate<br />
State<br />
Target<br />
75.76% 85.00%<br />
LEA<br />
Rate<br />
80.00%<br />
Target Met<br />
by LEA<br />
(Y/N)<br />
N<br />
Percent of<br />
youth with<br />
IEPs dropping<br />
out of high<br />
school<br />
State<br />
Rate<br />
Indicator 03: Assessment on Statewide Benchmark Exam (grades 3-8, 11)<br />
A) Adequate Yearly Progress<br />
n=40<br />
Literacy<br />
Mathematics<br />
Met Disability Subgroup "n"<br />
for Reporting Purposes (Y/N)<br />
State Target for % of Districts Meeting<br />
AYP for Disability Subgroup<br />
State<br />
Target<br />
3.06% 4.20%<br />
LEA<br />
Rate<br />
0.00%<br />
% of Districts Meeting AYP<br />
for Disability Subgroup<br />
Target Met by<br />
LEA (Y/N)<br />
Y<br />
Target Met by<br />
LEA(Y/N)<br />
Overall N 17.15% 6.25%<br />
NA<br />
N<br />
N<br />
Note: For a district to qualify as having a disability subgroup it must have a minimum of 40 (n=40) students with disabilities in a school building.<br />
B) Participation<br />
Participation Rate: # of<br />
CWD Tested ÷ # of CWD<br />
Enrolled in grades tested.<br />
Participation Rate: Literacy<br />
Participation Rate: Math<br />
Note: - - denotes not applicable<br />
State<br />
Rate<br />
98.78%<br />
State<br />
Target<br />
95.00%<br />
LEA<br />
Rate<br />
100.00%<br />
Target Met<br />
by LEA (Y/N)<br />
98.61% 95.00% 100.00% Y<br />
Y<br />
C) Performance Proficiency<br />
Percent of CWD Scoring<br />
Proficient or Above<br />
Proficiency Rate: Literacy<br />
Proficiency Rate:<br />
Mathematics<br />
16.00%<br />
16.00%<br />
State<br />
Rate<br />
31.49%<br />
44.86%<br />
State<br />
Target<br />
45.22%<br />
51.14%<br />
LEA<br />
Rate<br />
31.71%<br />
51.28%<br />
NA<br />
NA<br />
Target<br />
Met by<br />
LEA (Y/N)<br />
N<br />
Y<br />
Page 1 of 5
LEA: 2502 - SALEM SCHOOL <strong>DISTRICT</strong><br />
Indicator 04: Out-of-School Suspensions and Expulsions (2009/10 school year)<br />
A) Suspension/Expulsion<br />
Percent difference of CWD with out-of- school suspensions and<br />
expulsions totaling greater than 10 days in a school year as<br />
compared to the same data for general education students in<br />
the district.<br />
B) Suspension/Expulsion by Race and Ethnicity<br />
Percent of districts that have: (a) a significant discrepancy, by race or<br />
ethnicity, in the rate of suspensions and expulsions of greater than 10<br />
days in a school year for children with IEPs; and (b) policies,<br />
procedures or practices that contribute to the significant discrepancy<br />
and do not comply with requirements relating to the development<br />
and implementation of IEPs, the use of positive behavioral<br />
interventions and supports, and procedural safeguards.<br />
Indicator 05: School Age (5-21) Least Restrictive Environment<br />
A) In the Regular Class 80% or more of the day<br />
Percent of CWD with<br />
IEPs receiving instruction<br />
in the regular class 80%<br />
or more of the day.<br />
State<br />
Rate<br />
State<br />
Target<br />
LEA<br />
Rate<br />
B) In the Regular Class less than 40% of the day<br />
Percent of CWD with<br />
IEPs receiving instruction<br />
in the regular class less<br />
than 60% of the day.<br />
53.87% 59.77%<br />
State<br />
Rate<br />
State<br />
Target<br />
12.42% 12.51%<br />
69.90%<br />
LEA<br />
Rate<br />
0.00%<br />
C) Other Settings outside the regular class<br />
Percent of CWD with IEPs served in<br />
public or private separate schools,<br />
residential placements, or<br />
homebound/hospital placements.<br />
State<br />
Rate<br />
State<br />
Target<br />
2.80% 2.56%<br />
Target Met<br />
by LEA (Y/N)<br />
Y<br />
Target Met<br />
by LEA (Y/N)<br />
Y<br />
LEA<br />
Rate<br />
1.94%<br />
Target Met<br />
by LEA(Y/N)<br />
Indicator 06: Early Childhood (3-5) Least Restrictive Environment<br />
A) Regular Early Childhood Program<br />
Percent of children (aged 3 through 5) with IEPs attending a regular<br />
early childhood program and receiving the majority of special<br />
education and related services in the regular early childhood program<br />
Allowable<br />
Difference<br />
LEA: 2502 - SALEM SCHOOL <strong>DISTRICT</strong><br />
Indicator 07: Preschool (3-5) Outcomes<br />
a) Percent of preschool CWD<br />
children who did not<br />
improve functioning.<br />
b) Percent of preschool CWD<br />
who improved but whose<br />
functioning remained below<br />
same age peers.<br />
c) Percent of preschool CWD<br />
who improved at a level<br />
nearer to same aged peers.<br />
d) Percent of preschool CWD<br />
who improved functioning to<br />
reach a level comparable to<br />
same age peers.<br />
e) Percent of preschool CWD<br />
children who maintain<br />
functioning at a level<br />
comparable to same aged<br />
peers.<br />
Summary<br />
Statements<br />
1) Of those preschool<br />
children who entered<br />
the preschool program<br />
below age expectations<br />
in each Outcome, the<br />
percent who<br />
substantially increased<br />
their rate of growth by<br />
the time they turned 6<br />
years of age or exited<br />
the program.<br />
2) The percent of<br />
preschool children who<br />
were functioning<br />
within age expectations<br />
in each Outcome by the<br />
time they turned 6<br />
years of age or exited<br />
A) Positive Social -Emotional<br />
Skills*<br />
State<br />
Rate<br />
A) Positive Social -<br />
Emotional Skills<br />
(Including social<br />
relationships)<br />
State<br />
Rate<br />
2.14%<br />
5.31%<br />
25.97%<br />
38.22%<br />
28.36%<br />
State<br />
Target<br />
LEA<br />
Rate<br />
LEA<br />
Rate<br />
— —<br />
— —<br />
— —<br />
— —<br />
— —<br />
Target<br />
Met by<br />
LEA(Y/N)<br />
B) Acquisition and Use of<br />
Knowledge and Skills<br />
(Including early language/<br />
communication and early literacy)<br />
B) Acquisition and Use of<br />
Knowledge and Skills **<br />
State<br />
Rate<br />
1.75%<br />
6.59%<br />
34.23%<br />
43.51%<br />
13.92%<br />
State<br />
Target<br />
LEA<br />
Rate<br />
Target<br />
Met by<br />
LEA(Y/N)<br />
C) Use of Appropriate Behaviors<br />
to Meet Their Needs<br />
State<br />
Rate<br />
State<br />
Target<br />
LEA<br />
Rate<br />
Target<br />
Met by<br />
LEA(Y/N)<br />
89.61% 90.50% — — N/A 90.31% 90.50% — — N/A 90.82% 92.50% — — N/A<br />
66.58% 69.50% — — N/A 57.43% 60.50% — — N/A 76.69% 78.50% — — N/A<br />
NOTE: * Including social relationships ** Including early language/ communication and early literacy<br />
Note: - - denotes not applicable<br />
State<br />
Rate<br />
LEA<br />
Rate<br />
— —<br />
— —<br />
— —<br />
— —<br />
— —<br />
C) Use of<br />
Appropriate<br />
Behaviors to<br />
Meet Their Needs<br />
State<br />
Rate<br />
4.51%<br />
17.34%<br />
41.72%<br />
34.97%<br />
LEA<br />
Rate<br />
1.46% — —<br />
— —<br />
— —<br />
— —<br />
— —<br />
Page 3 of 5
LEA: 2502 - SALEM SCHOOL <strong>DISTRICT</strong><br />
Indicator 08: Parent Involvement<br />
Percent of surveyed<br />
parents who reported<br />
school facilitated parent<br />
involvement as a means<br />
of improving services<br />
and results for children<br />
with disabilities.<br />
Early Childhood<br />
(3-5)<br />
School Age<br />
(5-21)<br />
State<br />
Rate<br />
90.47%<br />
95.05%<br />
Indicator 09: Disproportionality - Eligibility<br />
Disproportionate representation of racial<br />
and ethnic groups in special education and<br />
related services that is a result of<br />
inappropriate identification (e.g.<br />
monitoring data, review of policies,<br />
practices, and procedures under 618(d),<br />
etc.).<br />
State<br />
Rate<br />
State<br />
Target<br />
88.00%<br />
96.00%<br />
State<br />
Target<br />
0.00% 0.00%<br />
LEA<br />
Rate<br />
— —<br />
96.15%<br />
Indicator 10: Disproportionality-Child with a Disability<br />
Disproportionate representation of racial<br />
and ethnic groups in specific disability<br />
categories that is a result of inappropriate<br />
identification (e.g. monitoring data, review<br />
of policies, practices, and procedures under<br />
618(d), etc.).<br />
Indicator 11: Child Find<br />
Percent of children with<br />
parental consent to evaluate<br />
who are evaluated within<br />
the State established timeline<br />
of 60 days.<br />
Overall<br />
(3-21)<br />
Early Childhood<br />
(3-5)<br />
School Age<br />
(5-21)<br />
State<br />
Rate<br />
0.00%<br />
Indicator 12: Early Childhood Transition<br />
Percent of children referred by Part C prior to<br />
age 3, who are found eligible for Part B, and<br />
who have an IEP developed and implemented<br />
by their third birthday.<br />
Note: - - denotes not applicable<br />
State<br />
Rate<br />
99.41%<br />
99.70%<br />
98.97%<br />
State<br />
Rate<br />
State<br />
Target<br />
0.00%<br />
State<br />
Target<br />
100.00%<br />
100.00%<br />
100.00%<br />
State<br />
Target<br />
Target Met by<br />
LEA (Y/N)<br />
Y<br />
Target Met by<br />
LEA (Y/N)<br />
Y<br />
LEA<br />
Rate<br />
100.00%<br />
— —<br />
100.00%<br />
LEA<br />
Rate<br />
Target Met by<br />
LEA (Y/N)<br />
N/A<br />
Y<br />
Note: The target for Indicator 09 is to have zero percent<br />
(0%) of districts identified as having disproportionate<br />
representation as a result of inappropriate<br />
identification in eligibility.<br />
Note: The target for Indicator 10 is to have zero<br />
percent (0%) of districts identified as having<br />
disproportionate representation as a result of<br />
inappropriate identification in a disability<br />
category.<br />
Target Met by<br />
LEA (Y/N)<br />
N/A<br />
Y<br />
Target Met<br />
by LEA<br />
(Y/N)<br />
99.21% 100.00% - - N/A<br />
Y<br />
Note: * Indicates a zero reponse rate for the<br />
district.<br />
Page 4 of 5
LEA: 2502 - SALEM SCHOOL <strong>DISTRICT</strong><br />
Indicator 13: Secondary Transition<br />
Percent of youth with disabilities aged 16 and<br />
up with an IEP that includes coordinated,<br />
measurable, annual IEP goals and transition<br />
services that will reasonably enable the student<br />
to meet the post-secondary goals.<br />
Indicator 14: Post-School Outcomes<br />
A. Percent of youth enrolled in higher<br />
education within one year of leaving high<br />
school.<br />
State<br />
Rate<br />
State<br />
Target<br />
Note: Data for this Indicator is from the on-site monitoring of LEAs for the given year.<br />
B. Percent of youth enrolled in higher<br />
education or competitively employed<br />
within one year of leaving high school.<br />
C. Percent of youth enrolled in higher<br />
education or in some other postsecondary<br />
education or training program; or<br />
competitively employed or in some other<br />
employment within one year of leaving<br />
high school.<br />
State<br />
Rate<br />
Indicator 20: Reported Data-Timely and Accurate*<br />
District submitted<br />
required data elements<br />
on or before due dates;<br />
made revisions within<br />
the alloted reveiw<br />
periods.<br />
Accurate and Timely<br />
Data Submission<br />
Overall (3-21)<br />
Early Childhood (3-5)<br />
School Age (5-21)<br />
State<br />
Target<br />
100.00%<br />
100.00%<br />
100.00%<br />
State<br />
Target<br />
LEA<br />
Rate<br />
LEA<br />
Rate<br />
Target Met by<br />
LEA (Y/N)<br />
Target Met<br />
by LEA<br />
(Y/N)<br />
Target Met<br />
by LEA<br />
(Y/N)<br />
*Data reviewed for timely and accurate submissions included all APSCN cycle data except for personnel<br />
Note: - - denotes not applicable<br />
96.19 100.00 — — N/A<br />
14.53<br />
State<br />
Rate<br />
49.42<br />
State<br />
Rate<br />
54.07<br />
13.00<br />
State<br />
Target<br />
49.00<br />
State<br />
Target<br />
60.00<br />
Y<br />
N/A<br />
Y<br />
— —<br />
LEA<br />
Rate<br />
— —<br />
LEA<br />
Rate<br />
— —<br />
N/A<br />
Target Met<br />
by LEA<br />
(Y/N)<br />
N/A<br />
Target Met<br />
by LEA<br />
(Y/N)<br />
N/A<br />
Page 5 of 5
LEA: 2503 - VIOLA SCHOOL <strong>DISTRICT</strong><br />
<strong>ARKANSAS</strong> <strong>SPECIAL</strong> <strong>EDUCATION</strong><br />
<strong>DISTRICT</strong> <strong>ANNUAL</strong> PERFORMANCE REPORT<br />
2010/11 School Year<br />
Publication Date: March 2012<br />
Each State must have in place a State Performance Plan (SPP) to evaluate the State's efforts to meet the requirements and<br />
purposes of the implementation of the Individuals with Disabilities Education Act (IDEA). The SPP is a six-year plan, which<br />
describes Arkansas's performance on 20 indicators. The Office of Special Education Programs in the U. S. Department of<br />
Education requires that States report annually to the public on the performance of each local education agency (LEA) on 14 of<br />
20 indicators as compared with targets established by the State in the SPP. Arkansas will report indicators 1 through 14 and<br />
20 for each LEA serving children with disabilities (CWD). Any LEA not meeting targets on compliance indicators (0% for<br />
Indicators 4B, 09 & 10 and 100% for Indicators 11, 12, 13, and 20) are non-compliant with IDEA.<br />
There are no report changes for the 2010/11 school year profile; However, it is important to recognize that: .<br />
1. Indicator 01 (Graduation) is reported a year in arrear (2009/10 graduates) and is based on a four-year cohort. This<br />
means the rate is a measure of students who entered in ninth grade and graduate in four years. The calculation is a<br />
requirement under Title I of the Elementary and Secondary Education Act (ESEA).<br />
2. Indicator 02 (Drop out) is reported a year in arrear. This means the rate is a measure of students who dropped out in<br />
the 2009/10 school year. The Indicator 02 data are aligned with the Common Core of Data (CCD) requirements for<br />
grades 7-12.<br />
3. Indicator 04A and 4B (Suspension/Expulsion) is reported a year in arrear. This means the rate is a measure of<br />
students who had out-of-school suspensions and/or expulsions totaling more than 10 days.<br />
Percent of youth<br />
with IEPs<br />
graduating from<br />
high school with a<br />
regular diploma<br />
For a complete description of all the Indicators, please visit the special education website at<br />
http://arksped.k12.ar.us/sections/policy.html<br />
Indicator 01: Graduation Rates (2009/10 school year) Indicator 02: Dropout Rates (2009/10 school year)<br />
State<br />
Rate<br />
State<br />
Target<br />
75.76% 85.00%<br />
LEA<br />
Rate<br />
100.00%<br />
Target Met<br />
by LEA<br />
(Y/N)<br />
Y<br />
Percent of<br />
youth with<br />
IEPs dropping<br />
out of high<br />
school<br />
State<br />
Rate<br />
Indicator 03: Assessment on Statewide Benchmark Exam (grades 3-8, 11)<br />
A) Adequate Yearly Progress<br />
n=40<br />
Literacy<br />
Mathematics<br />
Met Disability Subgroup "n"<br />
for Reporting Purposes (Y/N)<br />
State Target for % of Districts Meeting<br />
AYP for Disability Subgroup<br />
State<br />
Target<br />
3.06% 4.20%<br />
LEA<br />
Rate<br />
0.00%<br />
% of Districts Meeting AYP<br />
for Disability Subgroup<br />
Target Met by<br />
LEA (Y/N)<br />
Y<br />
Target Met by<br />
LEA(Y/N)<br />
Overall N 17.15% 6.25%<br />
NA<br />
N<br />
N<br />
Note: For a district to qualify as having a disability subgroup it must have a minimum of 40 (n=40) students with disabilities in a school building.<br />
B) Participation<br />
Participation Rate: # of<br />
CWD Tested ÷ # of CWD<br />
Enrolled in grades tested.<br />
Participation Rate: Literacy<br />
Participation Rate: Math<br />
Note: - - denotes not applicable<br />
State<br />
Rate<br />
98.78%<br />
State<br />
Target<br />
95.00%<br />
LEA<br />
Rate<br />
100.00%<br />
Target Met<br />
by LEA (Y/N)<br />
98.61% 95.00% 100.00% Y<br />
Y<br />
C) Performance Proficiency<br />
Percent of CWD Scoring<br />
Proficient or Above<br />
Proficiency Rate: Literacy<br />
Proficiency Rate:<br />
Mathematics<br />
16.00%<br />
16.00%<br />
State<br />
Rate<br />
31.49%<br />
44.86%<br />
State<br />
Target<br />
45.22%<br />
51.14%<br />
LEA<br />
Rate<br />
52.00%<br />
57.69%<br />
NA<br />
NA<br />
Target<br />
Met by<br />
LEA (Y/N)<br />
Y<br />
Y<br />
Page 1 of 5
LEA: 2503 - VIOLA SCHOOL <strong>DISTRICT</strong><br />
Indicator 04: Out-of-School Suspensions and Expulsions (2009/10 school year)<br />
A) Suspension/Expulsion<br />
Percent difference of CWD with out-of- school suspensions and<br />
expulsions totaling greater than 10 days in a school year as<br />
compared to the same data for general education students in<br />
the district.<br />
B) Suspension/Expulsion by Race and Ethnicity<br />
Percent of districts that have: (a) a significant discrepancy, by race or<br />
ethnicity, in the rate of suspensions and expulsions of greater than 10<br />
days in a school year for children with IEPs; and (b) policies,<br />
procedures or practices that contribute to the significant discrepancy<br />
and do not comply with requirements relating to the development<br />
and implementation of IEPs, the use of positive behavioral<br />
interventions and supports, and procedural safeguards.<br />
Indicator 05: School Age (5-21) Least Restrictive Environment<br />
A) In the Regular Class 80% or more of the day<br />
Percent of CWD with<br />
IEPs receiving instruction<br />
in the regular class 80%<br />
or more of the day.<br />
State<br />
Rate<br />
State<br />
Target<br />
LEA<br />
Rate<br />
B) In the Regular Class less than 40% of the day<br />
Percent of CWD with<br />
IEPs receiving instruction<br />
in the regular class less<br />
than 60% of the day.<br />
53.87% 59.77%<br />
State<br />
Rate<br />
State<br />
Target<br />
12.42% 12.51%<br />
64.29%<br />
LEA<br />
Rate<br />
2.86%<br />
C) Other Settings outside the regular class<br />
Percent of CWD with IEPs served in<br />
public or private separate schools,<br />
residential placements, or<br />
homebound/hospital placements.<br />
State<br />
Rate<br />
State<br />
Target<br />
2.80% 2.56%<br />
Target Met<br />
by LEA (Y/N)<br />
Y<br />
Target Met<br />
by LEA (Y/N)<br />
Y<br />
LEA<br />
Rate<br />
1.43%<br />
Target Met<br />
by LEA(Y/N)<br />
Indicator 06: Early Childhood (3-5) Least Restrictive Environment<br />
A) Regular Early Childhood Program<br />
Percent of children (aged 3 through 5) with IEPs attending a regular<br />
early childhood program and receiving the majority of special<br />
education and related services in the regular early childhood program<br />
Allowable<br />
Difference<br />
LEA: 2503 - VIOLA SCHOOL <strong>DISTRICT</strong><br />
Indicator 07: Preschool (3-5) Outcomes<br />
a) Percent of preschool CWD<br />
children who did not<br />
improve functioning.<br />
b) Percent of preschool CWD<br />
who improved but whose<br />
functioning remained below<br />
same age peers.<br />
c) Percent of preschool CWD<br />
who improved at a level<br />
nearer to same aged peers.<br />
d) Percent of preschool CWD<br />
who improved functioning to<br />
reach a level comparable to<br />
same age peers.<br />
e) Percent of preschool CWD<br />
children who maintain<br />
functioning at a level<br />
comparable to same aged<br />
peers.<br />
Summary<br />
Statements<br />
1) Of those preschool<br />
children who entered<br />
the preschool program<br />
below age expectations<br />
in each Outcome, the<br />
percent who<br />
substantially increased<br />
their rate of growth by<br />
the time they turned 6<br />
years of age or exited<br />
the program.<br />
2) The percent of<br />
preschool children who<br />
were functioning<br />
within age expectations<br />
in each Outcome by the<br />
time they turned 6<br />
years of age or exited<br />
A) Positive Social -Emotional<br />
Skills*<br />
State<br />
Rate<br />
A) Positive Social -<br />
Emotional Skills<br />
(Including social<br />
relationships)<br />
State<br />
Rate<br />
2.14%<br />
5.31%<br />
25.97%<br />
38.22%<br />
28.36%<br />
State<br />
Target<br />
LEA<br />
Rate<br />
LEA<br />
Rate<br />
— —<br />
— —<br />
— —<br />
— —<br />
— —<br />
Target<br />
Met by<br />
LEA(Y/N)<br />
B) Acquisition and Use of<br />
Knowledge and Skills<br />
(Including early language/<br />
communication and early literacy)<br />
B) Acquisition and Use of<br />
Knowledge and Skills **<br />
State<br />
Rate<br />
1.75%<br />
6.59%<br />
34.23%<br />
43.51%<br />
13.92%<br />
State<br />
Target<br />
LEA<br />
Rate<br />
Target<br />
Met by<br />
LEA(Y/N)<br />
C) Use of Appropriate Behaviors<br />
to Meet Their Needs<br />
State<br />
Rate<br />
State<br />
Target<br />
LEA<br />
Rate<br />
Target<br />
Met by<br />
LEA(Y/N)<br />
89.61% 90.50% — — N/A 90.31% 90.50% — — N/A 90.82% 92.50% — — N/A<br />
66.58% 69.50% — — N/A 57.43% 60.50% — — N/A 76.69% 78.50% — — N/A<br />
NOTE: * Including social relationships ** Including early language/ communication and early literacy<br />
Note: - - denotes not applicable<br />
State<br />
Rate<br />
LEA<br />
Rate<br />
— —<br />
— —<br />
— —<br />
— —<br />
— —<br />
C) Use of<br />
Appropriate<br />
Behaviors to<br />
Meet Their Needs<br />
State<br />
Rate<br />
4.51%<br />
17.34%<br />
41.72%<br />
34.97%<br />
LEA<br />
Rate<br />
1.46% — —<br />
— —<br />
— —<br />
— —<br />
— —<br />
Page 3 of 5
LEA: 2503 - VIOLA SCHOOL <strong>DISTRICT</strong><br />
Indicator 08: Parent Involvement<br />
Percent of surveyed<br />
parents who reported<br />
school facilitated parent<br />
involvement as a means<br />
of improving services<br />
and results for children<br />
with disabilities.<br />
Early Childhood<br />
(3-5)<br />
School Age<br />
(5-21)<br />
State<br />
Rate<br />
90.47%<br />
95.05%<br />
Indicator 09: Disproportionality - Eligibility<br />
Disproportionate representation of racial<br />
and ethnic groups in special education and<br />
related services that is a result of<br />
inappropriate identification (e.g.<br />
monitoring data, review of policies,<br />
practices, and procedures under 618(d),<br />
etc.).<br />
State<br />
Rate<br />
State<br />
Target<br />
88.00%<br />
96.00%<br />
State<br />
Target<br />
0.00% 0.00%<br />
LEA<br />
Rate<br />
— —<br />
98.33%<br />
Indicator 10: Disproportionality-Child with a Disability<br />
Disproportionate representation of racial<br />
and ethnic groups in specific disability<br />
categories that is a result of inappropriate<br />
identification (e.g. monitoring data, review<br />
of policies, practices, and procedures under<br />
618(d), etc.).<br />
Indicator 11: Child Find<br />
Percent of children with<br />
parental consent to evaluate<br />
who are evaluated within<br />
the State established timeline<br />
of 60 days.<br />
Overall<br />
(3-21)<br />
Early Childhood<br />
(3-5)<br />
School Age<br />
(5-21)<br />
State<br />
Rate<br />
0.00%<br />
Indicator 12: Early Childhood Transition<br />
Percent of children referred by Part C prior to<br />
age 3, who are found eligible for Part B, and<br />
who have an IEP developed and implemented<br />
by their third birthday.<br />
Note: - - denotes not applicable<br />
State<br />
Rate<br />
99.41%<br />
99.70%<br />
98.97%<br />
State<br />
Rate<br />
State<br />
Target<br />
0.00%<br />
State<br />
Target<br />
100.00%<br />
100.00%<br />
100.00%<br />
State<br />
Target<br />
Target Met by<br />
LEA (Y/N)<br />
Y<br />
Target Met by<br />
LEA (Y/N)<br />
Y<br />
LEA<br />
Rate<br />
100.00%<br />
— —<br />
100.00%<br />
LEA<br />
Rate<br />
Target Met by<br />
LEA (Y/N)<br />
N/A<br />
Y<br />
Note: The target for Indicator 09 is to have zero percent<br />
(0%) of districts identified as having disproportionate<br />
representation as a result of inappropriate<br />
identification in eligibility.<br />
Note: The target for Indicator 10 is to have zero<br />
percent (0%) of districts identified as having<br />
disproportionate representation as a result of<br />
inappropriate identification in a disability<br />
category.<br />
Target Met by<br />
LEA (Y/N)<br />
N/A<br />
Y<br />
Target Met<br />
by LEA<br />
(Y/N)<br />
99.21% 100.00% - - N/A<br />
Y<br />
Note: * Indicates a zero reponse rate for the<br />
district.<br />
Page 4 of 5
LEA: 2503 - VIOLA SCHOOL <strong>DISTRICT</strong><br />
Indicator 13: Secondary Transition<br />
Percent of youth with disabilities aged 16 and<br />
up with an IEP that includes coordinated,<br />
measurable, annual IEP goals and transition<br />
services that will reasonably enable the student<br />
to meet the post-secondary goals.<br />
Indicator 14: Post-School Outcomes<br />
A. Percent of youth enrolled in higher<br />
education within one year of leaving high<br />
school.<br />
State<br />
Rate<br />
State<br />
Target<br />
Note: Data for this Indicator is from the on-site monitoring of LEAs for the given year.<br />
B. Percent of youth enrolled in higher<br />
education or competitively employed<br />
within one year of leaving high school.<br />
C. Percent of youth enrolled in higher<br />
education or in some other postsecondary<br />
education or training program; or<br />
competitively employed or in some other<br />
employment within one year of leaving<br />
high school.<br />
State<br />
Rate<br />
Indicator 20: Reported Data-Timely and Accurate*<br />
District submitted<br />
required data elements<br />
on or before due dates;<br />
made revisions within<br />
the alloted reveiw<br />
periods.<br />
Accurate and Timely<br />
Data Submission<br />
Overall (3-21)<br />
Early Childhood (3-5)<br />
School Age (5-21)<br />
State<br />
Target<br />
100.00%<br />
100.00%<br />
100.00%<br />
State<br />
Target<br />
LEA<br />
Rate<br />
LEA<br />
Rate<br />
Target Met by<br />
LEA (Y/N)<br />
Target Met<br />
by LEA<br />
(Y/N)<br />
Target Met<br />
by LEA<br />
(Y/N)<br />
*Data reviewed for timely and accurate submissions included all APSCN cycle data except for personnel<br />
Note: - - denotes not applicable<br />
96.19 100.00 — — N/A<br />
14.53<br />
State<br />
Rate<br />
49.42<br />
State<br />
Rate<br />
54.07<br />
13.00<br />
State<br />
Target<br />
49.00<br />
State<br />
Target<br />
60.00<br />
Y<br />
N/A<br />
Y<br />
— —<br />
LEA<br />
Rate<br />
— —<br />
LEA<br />
Rate<br />
— —<br />
N/A<br />
Target Met<br />
by LEA<br />
(Y/N)<br />
N/A<br />
Target Met<br />
by LEA<br />
(Y/N)<br />
N/A<br />
Page 5 of 5
<strong>ARKANSAS</strong> <strong>SPECIAL</strong> <strong>EDUCATION</strong><br />
<strong>DISTRICT</strong> <strong>ANNUAL</strong> PERFORMANCE REPORT<br />
2010/11 School Year<br />
Publication Date: March 2012<br />
Each State must have in place a State Performance Plan (SPP) to evaluate the State's efforts to meet the requirements and<br />
purposes of the implementation of the Individuals with Disabilities Education Act (IDEA). The SPP is a six-year plan, which<br />
describes Arkansas's performance on 20 indicators. The Office of Special Education Programs in the U. S. Department of<br />
Education requires that States report annually to the public on the performance of each local education agency (LEA) on 14 of<br />
20 indicators as compared with targets established by the State in the SPP. Arkansas will report indicators 1 through 14 and<br />
20 for each LEA serving children with disabilities (CWD). Any LEA not meeting targets on compliance indicators (0% for<br />
Indicators 4B, 09 & 10 and 100% for Indicators 11, 12, 13, and 20) are non-compliant with IDEA.<br />
There are no report changes for the 2010/11 school year profile; However, it is important to recognize that: .<br />
1. Indicator 01 (Graduation) is reported a year in arrear (2009/10 graduates) and is based on a four-year cohort. This<br />
means the rate is a measure of students who entered in ninth grade and graduate in four years. The calculation is a<br />
requirement under Title I of the Elementary and Secondary Education Act (ESEA).<br />
2. Indicator 02 (Drop out) is reported a year in arrear. This means the rate is a measure of students who dropped out in<br />
the 2009/10 school year. The Indicator 02 data are aligned with the Common Core of Data (CCD) requirements for<br />
grades 7-12.<br />
3. Indicator 04A and 4B (Suspension/Expulsion) is reported a year in arrear. This means the rate is a measure of<br />
students who had out-of-school suspensions and/or expulsions totaling more than 10 days.<br />
For a complete description of all the Indicators, please visit the special education website at<br />
http://arksped.k12.ar.us/sections/policy.html<br />
LEA: 2601 - CUTTER-MORNING STAR SCHOOL <strong>DISTRICT</strong><br />
Indicator 01: Graduation Rates (2009/10 school year) Indicator 02: Dropout Rates (2009/10 school year)<br />
Percent of youth<br />
with IEPs<br />
graduating from<br />
high school with a<br />
regular diploma<br />
State<br />
Rate<br />
State<br />
Target<br />
75.76% 85.00%<br />
LEA<br />
Rate<br />
0.00%<br />
Target Met<br />
by LEA<br />
(Y/N)<br />
N<br />
Percent of<br />
youth with<br />
IEPs dropping<br />
out of high<br />
school<br />
State<br />
Rate<br />
Indicator 03: Assessment on Statewide Benchmark Exam (grades 3-8, 11)<br />
A) Adequate Yearly Progress<br />
n=40<br />
Literacy<br />
Mathematics<br />
Met Disability Subgroup "n"<br />
for Reporting Purposes (Y/N)<br />
State Target for % of Districts Meeting<br />
AYP for Disability Subgroup<br />
State<br />
Target<br />
3.06% 4.20%<br />
LEA<br />
Rate<br />
0.00%<br />
% of Districts Meeting AYP<br />
for Disability Subgroup<br />
Target Met by<br />
LEA (Y/N)<br />
Y<br />
Target Met by<br />
LEA(Y/N)<br />
Overall N 17.15% 6.25%<br />
NA<br />
N<br />
N<br />
Note: For a district to qualify as having a disability subgroup it must have a minimum of 40 (n=40) students with disabilities in a school building.<br />
B) Participation<br />
Participation Rate: # of<br />
CWD Tested ÷ # of CWD<br />
Enrolled in grades tested.<br />
Participation Rate: Literacy<br />
Participation Rate: Math<br />
Note: - - denotes not applicable<br />
State<br />
Rate<br />
98.78%<br />
State<br />
Target<br />
95.00%<br />
LEA<br />
Rate<br />
92.68%<br />
Target Met<br />
by LEA (Y/N)<br />
N<br />
98.61% 95.00% 95.65% Y<br />
C) Performance Proficiency<br />
Percent of CWD Scoring<br />
Proficient or Above<br />
Proficiency Rate: Literacy<br />
Proficiency Rate:<br />
Mathematics<br />
16.00%<br />
16.00%<br />
State<br />
Rate<br />
31.49%<br />
44.86%<br />
State<br />
Target<br />
45.22%<br />
51.14%<br />
LEA<br />
Rate<br />
42.86%<br />
56.10%<br />
NA<br />
NA<br />
Target<br />
Met by<br />
LEA (Y/N)<br />
N<br />
Y<br />
Page 1 of 5
LEA: 2601 - CUTTER-MORNING STAR SCHOOL <strong>DISTRICT</strong><br />
Indicator 04: Out-of-School Suspensions and Expulsions (2009/10 school year)<br />
A) Suspension/Expulsion<br />
Percent difference of CWD with out-of- school suspensions and<br />
expulsions totaling greater than 10 days in a school year as<br />
compared to the same data for general education students in<br />
the district.<br />
B) Suspension/Expulsion by Race and Ethnicity<br />
Percent of districts that have: (a) a significant discrepancy, by race or<br />
ethnicity, in the rate of suspensions and expulsions of greater than 10<br />
days in a school year for children with IEPs; and (b) policies,<br />
procedures or practices that contribute to the significant discrepancy<br />
and do not comply with requirements relating to the development<br />
and implementation of IEPs, the use of positive behavioral<br />
interventions and supports, and procedural safeguards.<br />
Indicator 05: School Age (5-21) Least Restrictive Environment<br />
A) In the Regular Class 80% or more of the day<br />
Percent of CWD with<br />
IEPs receiving instruction<br />
in the regular class 80%<br />
or more of the day.<br />
State<br />
Rate<br />
State<br />
Target<br />
LEA<br />
Rate<br />
B) In the Regular Class less than 40% of the day<br />
Percent of CWD with<br />
IEPs receiving instruction<br />
in the regular class less<br />
than 60% of the day.<br />
53.87% 59.77%<br />
State<br />
Rate<br />
State<br />
Target<br />
12.42% 12.51%<br />
52.94%<br />
LEA<br />
Rate<br />
0.00%<br />
C) Other Settings outside the regular class<br />
Percent of CWD with IEPs served in<br />
public or private separate schools,<br />
residential placements, or<br />
homebound/hospital placements.<br />
State<br />
Rate<br />
State<br />
Target<br />
2.80% 2.56%<br />
Target Met<br />
by LEA (Y/N)<br />
N<br />
Target Met<br />
by LEA (Y/N)<br />
Y<br />
LEA<br />
Rate<br />
3.53%<br />
Target Met<br />
by LEA(Y/N)<br />
Indicator 06: Early Childhood (3-5) Least Restrictive Environment<br />
A) Regular Early Childhood Program<br />
Percent of children (aged 3 through 5) with IEPs attending a regular<br />
early childhood program and receiving the majority of special<br />
education and related services in the regular early childhood program<br />
Allowable<br />
Difference<br />
LEA: 2601 - CUTTER-MORNING STAR SCHOOL <strong>DISTRICT</strong><br />
Indicator 07: Preschool (3-5) Outcomes<br />
a) Percent of preschool CWD<br />
children who did not<br />
improve functioning.<br />
b) Percent of preschool CWD<br />
who improved but whose<br />
functioning remained below<br />
same age peers.<br />
c) Percent of preschool CWD<br />
who improved at a level<br />
nearer to same aged peers.<br />
d) Percent of preschool CWD<br />
who improved functioning to<br />
reach a level comparable to<br />
same age peers.<br />
e) Percent of preschool CWD<br />
children who maintain<br />
functioning at a level<br />
comparable to same aged<br />
peers.<br />
Summary<br />
Statements<br />
1) Of those preschool<br />
children who entered<br />
the preschool program<br />
below age expectations<br />
in each Outcome, the<br />
percent who<br />
substantially increased<br />
their rate of growth by<br />
the time they turned 6<br />
years of age or exited<br />
the program.<br />
2) The percent of<br />
preschool children who<br />
were functioning<br />
within age expectations<br />
in each Outcome by the<br />
time they turned 6<br />
years of age or exited<br />
A) Positive Social -Emotional<br />
Skills*<br />
State<br />
Rate<br />
A) Positive Social -<br />
Emotional Skills<br />
(Including social<br />
relationships)<br />
State<br />
Rate<br />
2.14%<br />
5.31%<br />
25.97%<br />
38.22%<br />
28.36%<br />
State<br />
Target<br />
LEA<br />
Rate<br />
LEA<br />
Rate<br />
— —<br />
— —<br />
— —<br />
— —<br />
— —<br />
Target<br />
Met by<br />
LEA(Y/N)<br />
B) Acquisition and Use of<br />
Knowledge and Skills<br />
(Including early language/<br />
communication and early literacy)<br />
B) Acquisition and Use of<br />
Knowledge and Skills **<br />
State<br />
Rate<br />
1.75%<br />
6.59%<br />
34.23%<br />
43.51%<br />
13.92%<br />
State<br />
Target<br />
LEA<br />
Rate<br />
Target<br />
Met by<br />
LEA(Y/N)<br />
C) Use of Appropriate Behaviors<br />
to Meet Their Needs<br />
State<br />
Rate<br />
State<br />
Target<br />
LEA<br />
Rate<br />
Target<br />
Met by<br />
LEA(Y/N)<br />
89.61% 90.50% — — N/A 90.31% 90.50% — — N/A 90.82% 92.50% — — N/A<br />
66.58% 69.50% — — N/A 57.43% 60.50% — — N/A 76.69% 78.50% — — N/A<br />
NOTE: * Including social relationships ** Including early language/ communication and early literacy<br />
Note: - - denotes not applicable<br />
State<br />
Rate<br />
LEA<br />
Rate<br />
— —<br />
— —<br />
— —<br />
— —<br />
— —<br />
C) Use of<br />
Appropriate<br />
Behaviors to<br />
Meet Their Needs<br />
State<br />
Rate<br />
4.51%<br />
17.34%<br />
41.72%<br />
34.97%<br />
LEA<br />
Rate<br />
1.46% — —<br />
— —<br />
— —<br />
— —<br />
— —<br />
Page 3 of 5
LEA: 2601 - CUTTER-MORNING STAR SCHOOL <strong>DISTRICT</strong><br />
Indicator 08: Parent Involvement<br />
Percent of surveyed<br />
parents who reported<br />
school facilitated parent<br />
involvement as a means<br />
of improving services<br />
and results for children<br />
with disabilities.<br />
Early Childhood<br />
(3-5)<br />
School Age<br />
(5-21)<br />
State<br />
Rate<br />
90.47%<br />
95.05%<br />
Indicator 09: Disproportionality - Eligibility<br />
Disproportionate representation of racial<br />
and ethnic groups in special education and<br />
related services that is a result of<br />
inappropriate identification (e.g.<br />
monitoring data, review of policies,<br />
practices, and procedures under 618(d),<br />
etc.).<br />
State<br />
Rate<br />
State<br />
Target<br />
88.00%<br />
96.00%<br />
State<br />
Target<br />
0.00% 0.00%<br />
LEA<br />
Rate<br />
— —<br />
— —<br />
Indicator 10: Disproportionality-Child with a Disability<br />
Disproportionate representation of racial<br />
and ethnic groups in specific disability<br />
categories that is a result of inappropriate<br />
identification (e.g. monitoring data, review<br />
of policies, practices, and procedures under<br />
618(d), etc.).<br />
Indicator 11: Child Find<br />
Percent of children with<br />
parental consent to evaluate<br />
who are evaluated within<br />
the State established timeline<br />
of 60 days.<br />
Overall<br />
(3-21)<br />
Early Childhood<br />
(3-5)<br />
School Age<br />
(5-21)<br />
State<br />
Rate<br />
0.00%<br />
Indicator 12: Early Childhood Transition<br />
Percent of children referred by Part C prior to<br />
age 3, who are found eligible for Part B, and<br />
who have an IEP developed and implemented<br />
by their third birthday.<br />
Note: - - denotes not applicable<br />
State<br />
Rate<br />
99.41%<br />
99.70%<br />
98.97%<br />
State<br />
Rate<br />
State<br />
Target<br />
0.00%<br />
State<br />
Target<br />
100.00%<br />
100.00%<br />
100.00%<br />
State<br />
Target<br />
Target Met by<br />
LEA (Y/N)<br />
Y<br />
Target Met by<br />
LEA (Y/N)<br />
Y<br />
LEA<br />
Rate<br />
100.00%<br />
— —<br />
100.00%<br />
LEA<br />
Rate<br />
Target Met by<br />
LEA (Y/N)<br />
N/A<br />
N<br />
Note: The target for Indicator 09 is to have zero percent<br />
(0%) of districts identified as having disproportionate<br />
representation as a result of inappropriate<br />
identification in eligibility.<br />
Note: The target for Indicator 10 is to have zero<br />
percent (0%) of districts identified as having<br />
disproportionate representation as a result of<br />
inappropriate identification in a disability<br />
category.<br />
Target Met by<br />
LEA (Y/N)<br />
N/A<br />
Y<br />
Target Met<br />
by LEA<br />
(Y/N)<br />
99.21% 100.00% - - N/A<br />
Y<br />
Note: * Indicates a zero reponse rate for the<br />
district.<br />
Page 4 of 5
LEA: 2601 - CUTTER-MORNING STAR SCHOOL <strong>DISTRICT</strong><br />
Indicator 13: Secondary Transition<br />
Percent of youth with disabilities aged 16 and<br />
up with an IEP that includes coordinated,<br />
measurable, annual IEP goals and transition<br />
services that will reasonably enable the student<br />
to meet the post-secondary goals.<br />
Indicator 14: Post-School Outcomes<br />
A. Percent of youth enrolled in higher<br />
education within one year of leaving high<br />
school.<br />
State<br />
Rate<br />
State<br />
Target<br />
Note: Data for this Indicator is from the on-site monitoring of LEAs for the given year.<br />
B. Percent of youth enrolled in higher<br />
education or competitively employed<br />
within one year of leaving high school.<br />
C. Percent of youth enrolled in higher<br />
education or in some other postsecondary<br />
education or training program; or<br />
competitively employed or in some other<br />
employment within one year of leaving<br />
high school.<br />
State<br />
Rate<br />
Indicator 20: Reported Data-Timely and Accurate*<br />
District submitted<br />
required data elements<br />
on or before due dates;<br />
made revisions within<br />
the alloted reveiw<br />
periods.<br />
Accurate and Timely<br />
Data Submission<br />
Overall (3-21)<br />
Early Childhood (3-5)<br />
School Age (5-21)<br />
State<br />
Target<br />
100.00%<br />
100.00%<br />
100.00%<br />
State<br />
Target<br />
LEA<br />
Rate<br />
LEA<br />
Rate<br />
Target Met by<br />
LEA (Y/N)<br />
Target Met<br />
by LEA<br />
(Y/N)<br />
Target Met<br />
by LEA<br />
(Y/N)<br />
*Data reviewed for timely and accurate submissions included all APSCN cycle data except for personnel<br />
Note: - - denotes not applicable<br />
96.19 100.00 — — N/A<br />
14.53<br />
State<br />
Rate<br />
49.42<br />
State<br />
Rate<br />
54.07<br />
13.00<br />
State<br />
Target<br />
49.00<br />
State<br />
Target<br />
60.00<br />
Y<br />
N/A<br />
Y<br />
— —<br />
LEA<br />
Rate<br />
— —<br />
LEA<br />
Rate<br />
— —<br />
N/A<br />
Target Met<br />
by LEA<br />
(Y/N)<br />
N/A<br />
Target Met<br />
by LEA<br />
(Y/N)<br />
N/A<br />
Page 5 of 5
<strong>ARKANSAS</strong> <strong>SPECIAL</strong> <strong>EDUCATION</strong><br />
<strong>DISTRICT</strong> <strong>ANNUAL</strong> PERFORMANCE REPORT<br />
2010/11 School Year<br />
Publication Date: March 2012<br />
Each State must have in place a State Performance Plan (SPP) to evaluate the State's efforts to meet the requirements and<br />
purposes of the implementation of the Individuals with Disabilities Education Act (IDEA). The SPP is a six-year plan, which<br />
describes Arkansas's performance on 20 indicators. The Office of Special Education Programs in the U. S. Department of<br />
Education requires that States report annually to the public on the performance of each local education agency (LEA) on 14 of<br />
20 indicators as compared with targets established by the State in the SPP. Arkansas will report indicators 1 through 14 and<br />
20 for each LEA serving children with disabilities (CWD). Any LEA not meeting targets on compliance indicators (0% for<br />
Indicators 4B, 09 & 10 and 100% for Indicators 11, 12, 13, and 20) are non-compliant with IDEA.<br />
There are no report changes for the 2010/11 school year profile; However, it is important to recognize that: .<br />
1. Indicator 01 (Graduation) is reported a year in arrear (2009/10 graduates) and is based on a four-year cohort. This<br />
means the rate is a measure of students who entered in ninth grade and graduate in four years. The calculation is a<br />
requirement under Title I of the Elementary and Secondary Education Act (ESEA).<br />
2. Indicator 02 (Drop out) is reported a year in arrear. This means the rate is a measure of students who dropped out in<br />
the 2009/10 school year. The Indicator 02 data are aligned with the Common Core of Data (CCD) requirements for<br />
grades 7-12.<br />
3. Indicator 04A and 4B (Suspension/Expulsion) is reported a year in arrear. This means the rate is a measure of<br />
students who had out-of-school suspensions and/or expulsions totaling more than 10 days.<br />
For a complete description of all the Indicators, please visit the special education website at<br />
http://arksped.k12.ar.us/sections/policy.html<br />
LEA: 2602 - FOUNTAIN LAKE SCHOOL <strong>DISTRICT</strong><br />
Indicator 01: Graduation Rates (2009/10 school year) Indicator 02: Dropout Rates (2009/10 school year)<br />
Percent of youth<br />
with IEPs<br />
graduating from<br />
high school with a<br />
regular diploma<br />
State<br />
Rate<br />
State<br />
Target<br />
75.76% 85.00%<br />
LEA<br />
Rate<br />
68.75%<br />
Target Met<br />
by LEA<br />
(Y/N)<br />
N<br />
Percent of<br />
youth with<br />
IEPs dropping<br />
out of high<br />
school<br />
State<br />
Rate<br />
Indicator 03: Assessment on Statewide Benchmark Exam (grades 3-8, 11)<br />
A) Adequate Yearly Progress<br />
n=40<br />
Literacy<br />
Mathematics<br />
Met Disability Subgroup "n"<br />
for Reporting Purposes (Y/N)<br />
State Target for % of Districts Meeting<br />
AYP for Disability Subgroup<br />
State<br />
Target<br />
3.06% 4.20%<br />
LEA<br />
Rate<br />
1.96%<br />
% of Districts Meeting AYP<br />
for Disability Subgroup<br />
Target Met by<br />
LEA (Y/N)<br />
Y<br />
Target Met by<br />
LEA(Y/N)<br />
Overall Y 17.15% 6.25%<br />
N<br />
Y<br />
Y<br />
Note: For a district to qualify as having a disability subgroup it must have a minimum of 40 (n=40) students with disabilities in a school building.<br />
B) Participation<br />
Participation Rate: # of<br />
CWD Tested ÷ # of CWD<br />
Enrolled in grades tested.<br />
Participation Rate: Literacy<br />
Participation Rate: Math<br />
Note: - - denotes not applicable<br />
State<br />
Rate<br />
98.78%<br />
State<br />
Target<br />
95.00%<br />
LEA<br />
Rate<br />
98.96%<br />
Target Met<br />
by LEA (Y/N)<br />
98.61% 95.00% 100.00% Y<br />
Y<br />
C) Performance Proficiency<br />
Percent of CWD Scoring<br />
Proficient or Above<br />
Proficiency Rate: Literacy<br />
Proficiency Rate:<br />
Mathematics<br />
16.00%<br />
16.00%<br />
State<br />
Rate<br />
31.49%<br />
44.86%<br />
State<br />
Target<br />
45.22%<br />
51.14%<br />
LEA<br />
Rate<br />
39.13%<br />
51.40%<br />
N<br />
N<br />
Target<br />
Met by<br />
LEA (Y/N)<br />
N<br />
Y<br />
Page 1 of 5
LEA: 2602 - FOUNTAIN LAKE SCHOOL <strong>DISTRICT</strong><br />
Indicator 04: Out-of-School Suspensions and Expulsions (2009/10 school year)<br />
A) Suspension/Expulsion<br />
Percent difference of CWD with out-of- school suspensions and<br />
expulsions totaling greater than 10 days in a school year as<br />
compared to the same data for general education students in<br />
the district.<br />
B) Suspension/Expulsion by Race and Ethnicity<br />
Percent of districts that have: (a) a significant discrepancy, by race or<br />
ethnicity, in the rate of suspensions and expulsions of greater than 10<br />
days in a school year for children with IEPs; and (b) policies,<br />
procedures or practices that contribute to the significant discrepancy<br />
and do not comply with requirements relating to the development<br />
and implementation of IEPs, the use of positive behavioral<br />
interventions and supports, and procedural safeguards.<br />
Indicator 05: School Age (5-21) Least Restrictive Environment<br />
A) In the Regular Class 80% or more of the day<br />
Percent of CWD with<br />
IEPs receiving instruction<br />
in the regular class 80%<br />
or more of the day.<br />
State<br />
Rate<br />
State<br />
Target<br />
LEA<br />
Rate<br />
B) In the Regular Class less than 40% of the day<br />
Percent of CWD with<br />
IEPs receiving instruction<br />
in the regular class less<br />
than 60% of the day.<br />
53.87% 59.77%<br />
State<br />
Rate<br />
State<br />
Target<br />
12.42% 12.51%<br />
58.17%<br />
LEA<br />
Rate<br />
7.19%<br />
C) Other Settings outside the regular class<br />
Percent of CWD with IEPs served in<br />
public or private separate schools,<br />
residential placements, or<br />
homebound/hospital placements.<br />
State<br />
Rate<br />
State<br />
Target<br />
2.80% 2.56%<br />
Target Met<br />
by LEA (Y/N)<br />
N<br />
Target Met<br />
by LEA (Y/N)<br />
Y<br />
LEA<br />
Rate<br />
1.96%<br />
Target Met<br />
by LEA(Y/N)<br />
Indicator 06: Early Childhood (3-5) Least Restrictive Environment<br />
A) Regular Early Childhood Program<br />
Percent of children (aged 3 through 5) with IEPs attending a regular<br />
early childhood program and receiving the majority of special<br />
education and related services in the regular early childhood program<br />
Allowable<br />
Difference<br />
LEA: 2602 - FOUNTAIN LAKE SCHOOL <strong>DISTRICT</strong><br />
Indicator 07: Preschool (3-5) Outcomes<br />
a) Percent of preschool CWD<br />
children who did not<br />
improve functioning.<br />
b) Percent of preschool CWD<br />
who improved but whose<br />
functioning remained below<br />
same age peers.<br />
c) Percent of preschool CWD<br />
who improved at a level<br />
nearer to same aged peers.<br />
d) Percent of preschool CWD<br />
who improved functioning to<br />
reach a level comparable to<br />
same age peers.<br />
e) Percent of preschool CWD<br />
children who maintain<br />
functioning at a level<br />
comparable to same aged<br />
peers.<br />
Summary<br />
Statements<br />
1) Of those preschool<br />
children who entered<br />
the preschool program<br />
below age expectations<br />
in each Outcome, the<br />
percent who<br />
substantially increased<br />
their rate of growth by<br />
the time they turned 6<br />
years of age or exited<br />
the program.<br />
2) The percent of<br />
preschool children who<br />
were functioning<br />
within age expectations<br />
in each Outcome by the<br />
time they turned 6<br />
years of age or exited<br />
A) Positive Social -Emotional<br />
Skills*<br />
State<br />
Rate<br />
A) Positive Social -<br />
Emotional Skills<br />
(Including social<br />
relationships)<br />
State<br />
Rate<br />
2.14%<br />
5.31%<br />
25.97%<br />
38.22%<br />
28.36%<br />
State<br />
Target<br />
LEA<br />
Rate<br />
LEA<br />
Rate<br />
— —<br />
— —<br />
— —<br />
— —<br />
— —<br />
Target<br />
Met by<br />
LEA(Y/N)<br />
B) Acquisition and Use of<br />
Knowledge and Skills<br />
(Including early language/<br />
communication and early literacy)<br />
B) Acquisition and Use of<br />
Knowledge and Skills **<br />
State<br />
Rate<br />
1.75%<br />
6.59%<br />
34.23%<br />
43.51%<br />
13.92%<br />
State<br />
Target<br />
LEA<br />
Rate<br />
Target<br />
Met by<br />
LEA(Y/N)<br />
C) Use of Appropriate Behaviors<br />
to Meet Their Needs<br />
State<br />
Rate<br />
State<br />
Target<br />
LEA<br />
Rate<br />
Target<br />
Met by<br />
LEA(Y/N)<br />
89.61% 90.50% — — N/A 90.31% 90.50% — — N/A 90.82% 92.50% — — N/A<br />
66.58% 69.50% — — N/A 57.43% 60.50% — — N/A 76.69% 78.50% — — N/A<br />
NOTE: * Including social relationships ** Including early language/ communication and early literacy<br />
Note: - - denotes not applicable<br />
State<br />
Rate<br />
LEA<br />
Rate<br />
— —<br />
— —<br />
— —<br />
— —<br />
— —<br />
C) Use of<br />
Appropriate<br />
Behaviors to<br />
Meet Their Needs<br />
State<br />
Rate<br />
4.51%<br />
17.34%<br />
41.72%<br />
34.97%<br />
LEA<br />
Rate<br />
1.46% — —<br />
— —<br />
— —<br />
— —<br />
— —<br />
Page 3 of 5
LEA: 2602 - FOUNTAIN LAKE SCHOOL <strong>DISTRICT</strong><br />
Indicator 08: Parent Involvement<br />
Percent of surveyed<br />
parents who reported<br />
school facilitated parent<br />
involvement as a means<br />
of improving services<br />
and results for children<br />
with disabilities.<br />
Early Childhood<br />
(3-5)<br />
School Age<br />
(5-21)<br />
State<br />
Rate<br />
90.47%<br />
95.05%<br />
Indicator 09: Disproportionality - Eligibility<br />
Disproportionate representation of racial<br />
and ethnic groups in special education and<br />
related services that is a result of<br />
inappropriate identification (e.g.<br />
monitoring data, review of policies,<br />
practices, and procedures under 618(d),<br />
etc.).<br />
State<br />
Rate<br />
State<br />
Target<br />
88.00%<br />
96.00%<br />
State<br />
Target<br />
0.00% 0.00%<br />
LEA<br />
Rate<br />
— —<br />
95.45%<br />
Indicator 10: Disproportionality-Child with a Disability<br />
Disproportionate representation of racial<br />
and ethnic groups in specific disability<br />
categories that is a result of inappropriate<br />
identification (e.g. monitoring data, review<br />
of policies, practices, and procedures under<br />
618(d), etc.).<br />
Indicator 11: Child Find<br />
Percent of children with<br />
parental consent to evaluate<br />
who are evaluated within<br />
the State established timeline<br />
of 60 days.<br />
Overall<br />
(3-21)<br />
Early Childhood<br />
(3-5)<br />
School Age<br />
(5-21)<br />
State<br />
Rate<br />
0.00%<br />
Indicator 12: Early Childhood Transition<br />
Percent of children referred by Part C prior to<br />
age 3, who are found eligible for Part B, and<br />
who have an IEP developed and implemented<br />
by their third birthday.<br />
Note: - - denotes not applicable<br />
State<br />
Rate<br />
99.41%<br />
99.70%<br />
98.97%<br />
State<br />
Rate<br />
State<br />
Target<br />
0.00%<br />
State<br />
Target<br />
100.00%<br />
100.00%<br />
100.00%<br />
State<br />
Target<br />
Target Met by<br />
LEA (Y/N)<br />
Y<br />
Target Met by<br />
LEA (Y/N)<br />
Y<br />
LEA<br />
Rate<br />
100.00%<br />
— —<br />
100.00%<br />
LEA<br />
Rate<br />
Target Met by<br />
LEA (Y/N)<br />
N/A<br />
N<br />
Note: The target for Indicator 09 is to have zero percent<br />
(0%) of districts identified as having disproportionate<br />
representation as a result of inappropriate<br />
identification in eligibility.<br />
Note: The target for Indicator 10 is to have zero<br />
percent (0%) of districts identified as having<br />
disproportionate representation as a result of<br />
inappropriate identification in a disability<br />
category.<br />
Target Met by<br />
LEA (Y/N)<br />
N/A<br />
Y<br />
Target Met<br />
by LEA<br />
(Y/N)<br />
99.21% 100.00% - - N/A<br />
Y<br />
Note: * Indicates a zero reponse rate for the<br />
district.<br />
Page 4 of 5
LEA: 2602 - FOUNTAIN LAKE SCHOOL <strong>DISTRICT</strong><br />
Indicator 13: Secondary Transition<br />
Percent of youth with disabilities aged 16 and<br />
up with an IEP that includes coordinated,<br />
measurable, annual IEP goals and transition<br />
services that will reasonably enable the student<br />
to meet the post-secondary goals.<br />
Indicator 14: Post-School Outcomes<br />
A. Percent of youth enrolled in higher<br />
education within one year of leaving high<br />
school.<br />
State<br />
Rate<br />
State<br />
Target<br />
Note: Data for this Indicator is from the on-site monitoring of LEAs for the given year.<br />
B. Percent of youth enrolled in higher<br />
education or competitively employed<br />
within one year of leaving high school.<br />
C. Percent of youth enrolled in higher<br />
education or in some other postsecondary<br />
education or training program; or<br />
competitively employed or in some other<br />
employment within one year of leaving<br />
high school.<br />
State<br />
Rate<br />
Indicator 20: Reported Data-Timely and Accurate*<br />
District submitted<br />
required data elements<br />
on or before due dates;<br />
made revisions within<br />
the alloted reveiw<br />
periods.<br />
Accurate and Timely<br />
Data Submission<br />
Overall (3-21)<br />
Early Childhood (3-5)<br />
School Age (5-21)<br />
State<br />
Target<br />
100.00%<br />
100.00%<br />
100.00%<br />
State<br />
Target<br />
LEA<br />
Rate<br />
LEA<br />
Rate<br />
Target Met by<br />
LEA (Y/N)<br />
Target Met<br />
by LEA<br />
(Y/N)<br />
Target Met<br />
by LEA<br />
(Y/N)<br />
*Data reviewed for timely and accurate submissions included all APSCN cycle data except for personnel<br />
Note: - - denotes not applicable<br />
96.19 100.00 100.00% Y<br />
14.53<br />
State<br />
Rate<br />
49.42<br />
State<br />
Rate<br />
54.07<br />
13.00<br />
State<br />
Target<br />
49.00<br />
State<br />
Target<br />
60.00<br />
Y<br />
N/A<br />
Y<br />
— —<br />
LEA<br />
Rate<br />
— —<br />
LEA<br />
Rate<br />
— —<br />
N/A<br />
Target Met<br />
by LEA<br />
(Y/N)<br />
N/A<br />
Target Met<br />
by LEA<br />
(Y/N)<br />
N/A<br />
Page 5 of 5
<strong>ARKANSAS</strong> <strong>SPECIAL</strong> <strong>EDUCATION</strong><br />
<strong>DISTRICT</strong> <strong>ANNUAL</strong> PERFORMANCE REPORT<br />
2010/11 School Year<br />
Publication Date: March 2012<br />
Each State must have in place a State Performance Plan (SPP) to evaluate the State's efforts to meet the requirements and<br />
purposes of the implementation of the Individuals with Disabilities Education Act (IDEA). The SPP is a six-year plan, which<br />
describes Arkansas's performance on 20 indicators. The Office of Special Education Programs in the U. S. Department of<br />
Education requires that States report annually to the public on the performance of each local education agency (LEA) on 14 of<br />
20 indicators as compared with targets established by the State in the SPP. Arkansas will report indicators 1 through 14 and<br />
20 for each LEA serving children with disabilities (CWD). Any LEA not meeting targets on compliance indicators (0% for<br />
Indicators 4B, 09 & 10 and 100% for Indicators 11, 12, 13, and 20) are non-compliant with IDEA.<br />
There are no report changes for the 2010/11 school year profile; However, it is important to recognize that: .<br />
1. Indicator 01 (Graduation) is reported a year in arrear (2009/10 graduates) and is based on a four-year cohort. This<br />
means the rate is a measure of students who entered in ninth grade and graduate in four years. The calculation is a<br />
requirement under Title I of the Elementary and Secondary Education Act (ESEA).<br />
2. Indicator 02 (Drop out) is reported a year in arrear. This means the rate is a measure of students who dropped out in<br />
the 2009/10 school year. The Indicator 02 data are aligned with the Common Core of Data (CCD) requirements for<br />
grades 7-12.<br />
3. Indicator 04A and 4B (Suspension/Expulsion) is reported a year in arrear. This means the rate is a measure of<br />
students who had out-of-school suspensions and/or expulsions totaling more than 10 days.<br />
For a complete description of all the Indicators, please visit the special education website at<br />
http://arksped.k12.ar.us/sections/policy.html<br />
LEA: 2603 - HOT SPRINGS SCHOOL <strong>DISTRICT</strong><br />
Indicator 01: Graduation Rates (2009/10 school year) Indicator 02: Dropout Rates (2009/10 school year)<br />
Percent of youth<br />
with IEPs<br />
graduating from<br />
high school with a<br />
regular diploma<br />
State<br />
Rate<br />
State<br />
Target<br />
75.76% 85.00%<br />
LEA<br />
Rate<br />
64.00%<br />
Target Met<br />
by LEA<br />
(Y/N)<br />
N<br />
Percent of<br />
youth with<br />
IEPs dropping<br />
out of high<br />
school<br />
State<br />
Rate<br />
Indicator 03: Assessment on Statewide Benchmark Exam (grades 3-8, 11)<br />
A) Adequate Yearly Progress<br />
n=40<br />
Literacy<br />
Mathematics<br />
Met Disability Subgroup "n"<br />
for Reporting Purposes (Y/N)<br />
State Target for % of Districts Meeting<br />
AYP for Disability Subgroup<br />
State<br />
Target<br />
3.06% 4.20%<br />
LEA<br />
Rate<br />
8.15%<br />
% of Districts Meeting AYP<br />
for Disability Subgroup<br />
Target Met by<br />
LEA (Y/N)<br />
N<br />
Target Met by<br />
LEA(Y/N)<br />
Overall N 17.15% 6.25%<br />
NA<br />
N<br />
N<br />
Note: For a district to qualify as having a disability subgroup it must have a minimum of 40 (n=40) students with disabilities in a school building.<br />
B) Participation<br />
Participation Rate: # of<br />
CWD Tested ÷ # of CWD<br />
Enrolled in grades tested.<br />
Participation Rate: Literacy<br />
Participation Rate: Math<br />
Note: - - denotes not applicable<br />
State<br />
Rate<br />
98.78%<br />
State<br />
Target<br />
95.00%<br />
LEA<br />
Rate<br />
98.68%<br />
Target Met<br />
by LEA (Y/N)<br />
98.61% 95.00% 97.82% Y<br />
Y<br />
C) Performance Proficiency<br />
Percent of CWD Scoring<br />
Proficient or Above<br />
Proficiency Rate: Literacy<br />
Proficiency Rate:<br />
Mathematics<br />
16.00%<br />
16.00%<br />
State<br />
Rate<br />
31.49%<br />
44.86%<br />
State<br />
Target<br />
45.22%<br />
51.14%<br />
LEA<br />
Rate<br />
29.72%<br />
39.77%<br />
NA<br />
NA<br />
Target<br />
Met by<br />
LEA (Y/N)<br />
N<br />
N<br />
Page 1 of 5
LEA: 2603 - HOT SPRINGS SCHOOL <strong>DISTRICT</strong><br />
Indicator 04: Out-of-School Suspensions and Expulsions (2009/10 school year)<br />
A) Suspension/Expulsion<br />
Percent difference of CWD with out-of- school suspensions and<br />
expulsions totaling greater than 10 days in a school year as<br />
compared to the same data for general education students in<br />
the district.<br />
B) Suspension/Expulsion by Race and Ethnicity<br />
Percent of districts that have: (a) a significant discrepancy, by race or<br />
ethnicity, in the rate of suspensions and expulsions of greater than 10<br />
days in a school year for children with IEPs; and (b) policies,<br />
procedures or practices that contribute to the significant discrepancy<br />
and do not comply with requirements relating to the development<br />
and implementation of IEPs, the use of positive behavioral<br />
interventions and supports, and procedural safeguards.<br />
Indicator 05: School Age (5-21) Least Restrictive Environment<br />
A) In the Regular Class 80% or more of the day<br />
Percent of CWD with<br />
IEPs receiving instruction<br />
in the regular class 80%<br />
or more of the day.<br />
State<br />
Rate<br />
State<br />
Target<br />
LEA<br />
Rate<br />
B) In the Regular Class less than 40% of the day<br />
Percent of CWD with<br />
IEPs receiving instruction<br />
in the regular class less<br />
than 60% of the day.<br />
53.87% 59.77%<br />
State<br />
Rate<br />
State<br />
Target<br />
12.42% 12.51%<br />
37.48%<br />
LEA<br />
Rate<br />
9.37%<br />
C) Other Settings outside the regular class<br />
Percent of CWD with IEPs served in<br />
public or private separate schools,<br />
residential placements, or<br />
homebound/hospital placements.<br />
State<br />
Rate<br />
State<br />
Target<br />
2.80% 2.56%<br />
Target Met<br />
by LEA (Y/N)<br />
N<br />
Target Met<br />
by LEA (Y/N)<br />
Y<br />
LEA<br />
Rate<br />
1.62%<br />
Target Met<br />
by LEA(Y/N)<br />
Indicator 06: Early Childhood (3-5) Least Restrictive Environment<br />
A) Regular Early Childhood Program<br />
Percent of children (aged 3 through 5) with IEPs attending a regular<br />
early childhood program and receiving the majority of special<br />
education and related services in the regular early childhood program<br />
Allowable<br />
Difference<br />
LEA: 2603 - HOT SPRINGS SCHOOL <strong>DISTRICT</strong><br />
Indicator 07: Preschool (3-5) Outcomes<br />
a) Percent of preschool CWD<br />
children who did not<br />
improve functioning.<br />
b) Percent of preschool CWD<br />
who improved but whose<br />
functioning remained below<br />
same age peers.<br />
c) Percent of preschool CWD<br />
who improved at a level<br />
nearer to same aged peers.<br />
d) Percent of preschool CWD<br />
who improved functioning to<br />
reach a level comparable to<br />
same age peers.<br />
e) Percent of preschool CWD<br />
children who maintain<br />
functioning at a level<br />
comparable to same aged<br />
peers.<br />
Summary<br />
Statements<br />
1) Of those preschool<br />
children who entered<br />
the preschool program<br />
below age expectations<br />
in each Outcome, the<br />
percent who<br />
substantially increased<br />
their rate of growth by<br />
the time they turned 6<br />
years of age or exited<br />
the program.<br />
2) The percent of<br />
preschool children who<br />
were functioning<br />
within age expectations<br />
in each Outcome by the<br />
time they turned 6<br />
years of age or exited<br />
A) Positive Social -Emotional<br />
Skills*<br />
State<br />
Rate<br />
A) Positive Social -<br />
Emotional Skills<br />
(Including social<br />
relationships)<br />
State<br />
Rate<br />
2.14%<br />
5.31%<br />
25.97%<br />
38.22%<br />
28.36%<br />
State<br />
Target<br />
LEA<br />
Rate<br />
LEA<br />
Rate<br />
— —<br />
— —<br />
— —<br />
— —<br />
— —<br />
Target<br />
Met by<br />
LEA(Y/N)<br />
B) Acquisition and Use of<br />
Knowledge and Skills<br />
(Including early language/<br />
communication and early literacy)<br />
B) Acquisition and Use of<br />
Knowledge and Skills **<br />
State<br />
Rate<br />
1.75%<br />
6.59%<br />
34.23%<br />
43.51%<br />
13.92%<br />
State<br />
Target<br />
LEA<br />
Rate<br />
Target<br />
Met by<br />
LEA(Y/N)<br />
C) Use of Appropriate Behaviors<br />
to Meet Their Needs<br />
State<br />
Rate<br />
State<br />
Target<br />
LEA<br />
Rate<br />
Target<br />
Met by<br />
LEA(Y/N)<br />
89.61% 90.50% — — N/A 90.31% 90.50% — — N/A 90.82% 92.50% — — N/A<br />
66.58% 69.50% — — N/A 57.43% 60.50% — — N/A 76.69% 78.50% — — N/A<br />
NOTE: * Including social relationships ** Including early language/ communication and early literacy<br />
Note: - - denotes not applicable<br />
State<br />
Rate<br />
LEA<br />
Rate<br />
— —<br />
— —<br />
— —<br />
— —<br />
— —<br />
C) Use of<br />
Appropriate<br />
Behaviors to<br />
Meet Their Needs<br />
State<br />
Rate<br />
4.51%<br />
17.34%<br />
41.72%<br />
34.97%<br />
LEA<br />
Rate<br />
1.46% — —<br />
— —<br />
— —<br />
— —<br />
— —<br />
Page 3 of 5
LEA: 2603 - HOT SPRINGS SCHOOL <strong>DISTRICT</strong><br />
Indicator 08: Parent Involvement<br />
Percent of surveyed<br />
parents who reported<br />
school facilitated parent<br />
involvement as a means<br />
of improving services<br />
and results for children<br />
with disabilities.<br />
Early Childhood<br />
(3-5)<br />
School Age<br />
(5-21)<br />
State<br />
Rate<br />
90.47%<br />
95.05%<br />
Indicator 09: Disproportionality - Eligibility<br />
Disproportionate representation of racial<br />
and ethnic groups in special education and<br />
related services that is a result of<br />
inappropriate identification (e.g.<br />
monitoring data, review of policies,<br />
practices, and procedures under 618(d),<br />
etc.).<br />
State<br />
Rate<br />
State<br />
Target<br />
88.00%<br />
96.00%<br />
State<br />
Target<br />
0.00% 0.00%<br />
LEA<br />
Rate<br />
— —<br />
94.19%<br />
Indicator 10: Disproportionality-Child with a Disability<br />
Disproportionate representation of racial<br />
and ethnic groups in specific disability<br />
categories that is a result of inappropriate<br />
identification (e.g. monitoring data, review<br />
of policies, practices, and procedures under<br />
618(d), etc.).<br />
Indicator 11: Child Find<br />
Percent of children with<br />
parental consent to evaluate<br />
who are evaluated within<br />
the State established timeline<br />
of 60 days.<br />
Overall<br />
(3-21)<br />
Early Childhood<br />
(3-5)<br />
School Age<br />
(5-21)<br />
State<br />
Rate<br />
0.00%<br />
Indicator 12: Early Childhood Transition<br />
Percent of children referred by Part C prior to<br />
age 3, who are found eligible for Part B, and<br />
who have an IEP developed and implemented<br />
by their third birthday.<br />
Note: - - denotes not applicable<br />
State<br />
Rate<br />
99.41%<br />
99.70%<br />
98.97%<br />
State<br />
Rate<br />
State<br />
Target<br />
0.00%<br />
State<br />
Target<br />
100.00%<br />
100.00%<br />
100.00%<br />
State<br />
Target<br />
Target Met by<br />
LEA (Y/N)<br />
Y<br />
Target Met by<br />
LEA (Y/N)<br />
Y<br />
LEA<br />
Rate<br />
100.00%<br />
— —<br />
100.00%<br />
LEA<br />
Rate<br />
Target Met by<br />
LEA (Y/N)<br />
N/A<br />
N<br />
Note: The target for Indicator 09 is to have zero percent<br />
(0%) of districts identified as having disproportionate<br />
representation as a result of inappropriate<br />
identification in eligibility.<br />
Note: The target for Indicator 10 is to have zero<br />
percent (0%) of districts identified as having<br />
disproportionate representation as a result of<br />
inappropriate identification in a disability<br />
category.<br />
Target Met by<br />
LEA (Y/N)<br />
N/A<br />
Y<br />
Target Met<br />
by LEA<br />
(Y/N)<br />
99.21% 100.00% - - N/A<br />
Y<br />
Note: * Indicates a zero reponse rate for the<br />
district.<br />
Page 4 of 5
LEA: 2603 - HOT SPRINGS SCHOOL <strong>DISTRICT</strong><br />
Indicator 13: Secondary Transition<br />
Percent of youth with disabilities aged 16 and<br />
up with an IEP that includes coordinated,<br />
measurable, annual IEP goals and transition<br />
services that will reasonably enable the student<br />
to meet the post-secondary goals.<br />
Indicator 14: Post-School Outcomes<br />
A. Percent of youth enrolled in higher<br />
education within one year of leaving high<br />
school.<br />
State<br />
Rate<br />
State<br />
Target<br />
Note: Data for this Indicator is from the on-site monitoring of LEAs for the given year.<br />
B. Percent of youth enrolled in higher<br />
education or competitively employed<br />
within one year of leaving high school.<br />
C. Percent of youth enrolled in higher<br />
education or in some other postsecondary<br />
education or training program; or<br />
competitively employed or in some other<br />
employment within one year of leaving<br />
high school.<br />
State<br />
Rate<br />
Indicator 20: Reported Data-Timely and Accurate*<br />
District submitted<br />
required data elements<br />
on or before due dates;<br />
made revisions within<br />
the alloted reveiw<br />
periods.<br />
Accurate and Timely<br />
Data Submission<br />
Overall (3-21)<br />
Early Childhood (3-5)<br />
School Age (5-21)<br />
State<br />
Target<br />
100.00%<br />
100.00%<br />
100.00%<br />
State<br />
Target<br />
LEA<br />
Rate<br />
LEA<br />
Rate<br />
Target Met by<br />
LEA (Y/N)<br />
Target Met<br />
by LEA<br />
(Y/N)<br />
Target Met<br />
by LEA<br />
(Y/N)<br />
*Data reviewed for timely and accurate submissions included all APSCN cycle data except for personnel<br />
Note: - - denotes not applicable<br />
96.19 100.00 — — N/A<br />
14.53<br />
State<br />
Rate<br />
49.42<br />
State<br />
Rate<br />
54.07<br />
13.00<br />
State<br />
Target<br />
49.00<br />
State<br />
Target<br />
60.00<br />
Y<br />
N/A<br />
Y<br />
— —<br />
LEA<br />
Rate<br />
— —<br />
LEA<br />
Rate<br />
— —<br />
N/A<br />
Target Met<br />
by LEA<br />
(Y/N)<br />
N/A<br />
Target Met<br />
by LEA<br />
(Y/N)<br />
N/A<br />
Page 5 of 5
LEA: 2604 - JESSIEVILLE SCHOOL <strong>DISTRICT</strong><br />
<strong>ARKANSAS</strong> <strong>SPECIAL</strong> <strong>EDUCATION</strong><br />
<strong>DISTRICT</strong> <strong>ANNUAL</strong> PERFORMANCE REPORT<br />
2010/11 School Year<br />
Publication Date: March 2012<br />
Each State must have in place a State Performance Plan (SPP) to evaluate the State's efforts to meet the requirements and<br />
purposes of the implementation of the Individuals with Disabilities Education Act (IDEA). The SPP is a six-year plan, which<br />
describes Arkansas's performance on 20 indicators. The Office of Special Education Programs in the U. S. Department of<br />
Education requires that States report annually to the public on the performance of each local education agency (LEA) on 14 of<br />
20 indicators as compared with targets established by the State in the SPP. Arkansas will report indicators 1 through 14 and<br />
20 for each LEA serving children with disabilities (CWD). Any LEA not meeting targets on compliance indicators (0% for<br />
Indicators 4B, 09 & 10 and 100% for Indicators 11, 12, 13, and 20) are non-compliant with IDEA.<br />
There are no report changes for the 2010/11 school year profile; However, it is important to recognize that: .<br />
1. Indicator 01 (Graduation) is reported a year in arrear (2009/10 graduates) and is based on a four-year cohort. This<br />
means the rate is a measure of students who entered in ninth grade and graduate in four years. The calculation is a<br />
requirement under Title I of the Elementary and Secondary Education Act (ESEA).<br />
2. Indicator 02 (Drop out) is reported a year in arrear. This means the rate is a measure of students who dropped out in<br />
the 2009/10 school year. The Indicator 02 data are aligned with the Common Core of Data (CCD) requirements for<br />
grades 7-12.<br />
3. Indicator 04A and 4B (Suspension/Expulsion) is reported a year in arrear. This means the rate is a measure of<br />
students who had out-of-school suspensions and/or expulsions totaling more than 10 days.<br />
Percent of youth<br />
with IEPs<br />
graduating from<br />
high school with a<br />
regular diploma<br />
For a complete description of all the Indicators, please visit the special education website at<br />
http://arksped.k12.ar.us/sections/policy.html<br />
Indicator 01: Graduation Rates (2009/10 school year) Indicator 02: Dropout Rates (2009/10 school year)<br />
State<br />
Rate<br />
State<br />
Target<br />
75.76% 85.00%<br />
LEA<br />
Rate<br />
83.33%<br />
Target Met<br />
by LEA<br />
(Y/N)<br />
N<br />
Percent of<br />
youth with<br />
IEPs dropping<br />
out of high<br />
school<br />
State<br />
Rate<br />
Indicator 03: Assessment on Statewide Benchmark Exam (grades 3-8, 11)<br />
A) Adequate Yearly Progress<br />
n=40<br />
Literacy<br />
Mathematics<br />
Met Disability Subgroup "n"<br />
for Reporting Purposes (Y/N)<br />
State Target for % of Districts Meeting<br />
AYP for Disability Subgroup<br />
State<br />
Target<br />
3.06% 4.20%<br />
LEA<br />
Rate<br />
2.27%<br />
% of Districts Meeting AYP<br />
for Disability Subgroup<br />
Target Met by<br />
LEA (Y/N)<br />
Y<br />
Target Met by<br />
LEA(Y/N)<br />
Overall N 17.15% 6.25%<br />
NA<br />
N<br />
N<br />
Note: For a district to qualify as having a disability subgroup it must have a minimum of 40 (n=40) students with disabilities in a school building.<br />
B) Participation<br />
Participation Rate: # of<br />
CWD Tested ÷ # of CWD<br />
Enrolled in grades tested.<br />
Participation Rate: Literacy<br />
Participation Rate: Math<br />
Note: - - denotes not applicable<br />
State<br />
Rate<br />
98.78%<br />
State<br />
Target<br />
95.00%<br />
LEA<br />
Rate<br />
98.21%<br />
Target Met<br />
by LEA (Y/N)<br />
98.61% 95.00% 98.31% Y<br />
Y<br />
C) Performance Proficiency<br />
Percent of CWD Scoring<br />
Proficient or Above<br />
Proficiency Rate: Literacy<br />
Proficiency Rate:<br />
Mathematics<br />
16.00%<br />
16.00%<br />
State<br />
Rate<br />
31.49%<br />
44.86%<br />
State<br />
Target<br />
45.22%<br />
51.14%<br />
LEA<br />
Rate<br />
43.40%<br />
54.72%<br />
NA<br />
NA<br />
Target<br />
Met by<br />
LEA (Y/N)<br />
N<br />
Y<br />
Page 1 of 5
LEA: 2604 - JESSIEVILLE SCHOOL <strong>DISTRICT</strong><br />
Indicator 04: Out-of-School Suspensions and Expulsions (2009/10 school year)<br />
A) Suspension/Expulsion<br />
Percent difference of CWD with out-of- school suspensions and<br />
expulsions totaling greater than 10 days in a school year as<br />
compared to the same data for general education students in<br />
the district.<br />
B) Suspension/Expulsion by Race and Ethnicity<br />
Percent of districts that have: (a) a significant discrepancy, by race or<br />
ethnicity, in the rate of suspensions and expulsions of greater than 10<br />
days in a school year for children with IEPs; and (b) policies,<br />
procedures or practices that contribute to the significant discrepancy<br />
and do not comply with requirements relating to the development<br />
and implementation of IEPs, the use of positive behavioral<br />
interventions and supports, and procedural safeguards.<br />
Indicator 05: School Age (5-21) Least Restrictive Environment<br />
A) In the Regular Class 80% or more of the day<br />
Percent of CWD with<br />
IEPs receiving instruction<br />
in the regular class 80%<br />
or more of the day.<br />
State<br />
Rate<br />
State<br />
Target<br />
LEA<br />
Rate<br />
B) In the Regular Class less than 40% of the day<br />
Percent of CWD with<br />
IEPs receiving instruction<br />
in the regular class less<br />
than 60% of the day.<br />
53.87% 59.77%<br />
State<br />
Rate<br />
State<br />
Target<br />
12.42% 12.51%<br />
42.28%<br />
LEA<br />
Rate<br />
4.88%<br />
C) Other Settings outside the regular class<br />
Percent of CWD with IEPs served in<br />
public or private separate schools,<br />
residential placements, or<br />
homebound/hospital placements.<br />
State<br />
Rate<br />
State<br />
Target<br />
2.80% 2.56%<br />
Target Met<br />
by LEA (Y/N)<br />
N<br />
Target Met<br />
by LEA (Y/N)<br />
Y<br />
LEA<br />
Rate<br />
4.07%<br />
Target Met<br />
by LEA(Y/N)<br />
Indicator 06: Early Childhood (3-5) Least Restrictive Environment<br />
A) Regular Early Childhood Program<br />
Percent of children (aged 3 through 5) with IEPs attending a regular<br />
early childhood program and receiving the majority of special<br />
education and related services in the regular early childhood program<br />
Allowable<br />
Difference<br />
LEA: 2604 - JESSIEVILLE SCHOOL <strong>DISTRICT</strong><br />
Indicator 07: Preschool (3-5) Outcomes<br />
a) Percent of preschool CWD<br />
children who did not<br />
improve functioning.<br />
b) Percent of preschool CWD<br />
who improved but whose<br />
functioning remained below<br />
same age peers.<br />
c) Percent of preschool CWD<br />
who improved at a level<br />
nearer to same aged peers.<br />
d) Percent of preschool CWD<br />
who improved functioning to<br />
reach a level comparable to<br />
same age peers.<br />
e) Percent of preschool CWD<br />
children who maintain<br />
functioning at a level<br />
comparable to same aged<br />
peers.<br />
Summary<br />
Statements<br />
1) Of those preschool<br />
children who entered<br />
the preschool program<br />
below age expectations<br />
in each Outcome, the<br />
percent who<br />
substantially increased<br />
their rate of growth by<br />
the time they turned 6<br />
years of age or exited<br />
the program.<br />
2) The percent of<br />
preschool children who<br />
were functioning<br />
within age expectations<br />
in each Outcome by the<br />
time they turned 6<br />
years of age or exited<br />
A) Positive Social -Emotional<br />
Skills*<br />
State<br />
Rate<br />
A) Positive Social -<br />
Emotional Skills<br />
(Including social<br />
relationships)<br />
State<br />
Rate<br />
2.14%<br />
5.31%<br />
25.97%<br />
38.22%<br />
28.36%<br />
State<br />
Target<br />
LEA<br />
Rate<br />
LEA<br />
Rate<br />
— —<br />
— —<br />
— —<br />
— —<br />
— —<br />
Target<br />
Met by<br />
LEA(Y/N)<br />
B) Acquisition and Use of<br />
Knowledge and Skills<br />
(Including early language/<br />
communication and early literacy)<br />
B) Acquisition and Use of<br />
Knowledge and Skills **<br />
State<br />
Rate<br />
1.75%<br />
6.59%<br />
34.23%<br />
43.51%<br />
13.92%<br />
State<br />
Target<br />
LEA<br />
Rate<br />
Target<br />
Met by<br />
LEA(Y/N)<br />
C) Use of Appropriate Behaviors<br />
to Meet Their Needs<br />
State<br />
Rate<br />
State<br />
Target<br />
LEA<br />
Rate<br />
Target<br />
Met by<br />
LEA(Y/N)<br />
89.61% 90.50% — — N/A 90.31% 90.50% — — N/A 90.82% 92.50% — — N/A<br />
66.58% 69.50% — — N/A 57.43% 60.50% — — N/A 76.69% 78.50% — — N/A<br />
NOTE: * Including social relationships ** Including early language/ communication and early literacy<br />
Note: - - denotes not applicable<br />
State<br />
Rate<br />
LEA<br />
Rate<br />
— —<br />
— —<br />
— —<br />
— —<br />
— —<br />
C) Use of<br />
Appropriate<br />
Behaviors to<br />
Meet Their Needs<br />
State<br />
Rate<br />
4.51%<br />
17.34%<br />
41.72%<br />
34.97%<br />
LEA<br />
Rate<br />
1.46% — —<br />
— —<br />
— —<br />
— —<br />
— —<br />
Page 3 of 5
LEA: 2604 - JESSIEVILLE SCHOOL <strong>DISTRICT</strong><br />
Indicator 08: Parent Involvement<br />
Percent of surveyed<br />
parents who reported<br />
school facilitated parent<br />
involvement as a means<br />
of improving services<br />
and results for children<br />
with disabilities.<br />
Early Childhood<br />
(3-5)<br />
School Age<br />
(5-21)<br />
State<br />
Rate<br />
90.47%<br />
95.05%<br />
Indicator 09: Disproportionality - Eligibility<br />
Disproportionate representation of racial<br />
and ethnic groups in special education and<br />
related services that is a result of<br />
inappropriate identification (e.g.<br />
monitoring data, review of policies,<br />
practices, and procedures under 618(d),<br />
etc.).<br />
State<br />
Rate<br />
State<br />
Target<br />
88.00%<br />
96.00%<br />
State<br />
Target<br />
0.00% 0.00%<br />
LEA<br />
Rate<br />
— —<br />
— —<br />
Indicator 10: Disproportionality-Child with a Disability<br />
Disproportionate representation of racial<br />
and ethnic groups in specific disability<br />
categories that is a result of inappropriate<br />
identification (e.g. monitoring data, review<br />
of policies, practices, and procedures under<br />
618(d), etc.).<br />
Indicator 11: Child Find<br />
Percent of children with<br />
parental consent to evaluate<br />
who are evaluated within<br />
the State established timeline<br />
of 60 days.<br />
Overall<br />
(3-21)<br />
Early Childhood<br />
(3-5)<br />
School Age<br />
(5-21)<br />
State<br />
Rate<br />
0.00%<br />
Indicator 12: Early Childhood Transition<br />
Percent of children referred by Part C prior to<br />
age 3, who are found eligible for Part B, and<br />
who have an IEP developed and implemented<br />
by their third birthday.<br />
Note: - - denotes not applicable<br />
State<br />
Rate<br />
99.41%<br />
99.70%<br />
98.97%<br />
State<br />
Rate<br />
State<br />
Target<br />
0.00%<br />
State<br />
Target<br />
100.00%<br />
100.00%<br />
100.00%<br />
State<br />
Target<br />
Target Met by<br />
LEA (Y/N)<br />
Y<br />
Target Met by<br />
LEA (Y/N)<br />
Y<br />
LEA<br />
Rate<br />
100.00%<br />
— —<br />
100.00%<br />
LEA<br />
Rate<br />
Target Met by<br />
LEA (Y/N)<br />
N/A<br />
N<br />
Note: The target for Indicator 09 is to have zero percent<br />
(0%) of districts identified as having disproportionate<br />
representation as a result of inappropriate<br />
identification in eligibility.<br />
Note: The target for Indicator 10 is to have zero<br />
percent (0%) of districts identified as having<br />
disproportionate representation as a result of<br />
inappropriate identification in a disability<br />
category.<br />
Target Met by<br />
LEA (Y/N)<br />
N/A<br />
Y<br />
Target Met<br />
by LEA<br />
(Y/N)<br />
99.21% 100.00% - - N/A<br />
Y<br />
Note: * Indicates a zero reponse rate for the<br />
district.<br />
Page 4 of 5
LEA: 2604 - JESSIEVILLE SCHOOL <strong>DISTRICT</strong><br />
Indicator 13: Secondary Transition<br />
Percent of youth with disabilities aged 16 and<br />
up with an IEP that includes coordinated,<br />
measurable, annual IEP goals and transition<br />
services that will reasonably enable the student<br />
to meet the post-secondary goals.<br />
Indicator 14: Post-School Outcomes<br />
A. Percent of youth enrolled in higher<br />
education within one year of leaving high<br />
school.<br />
State<br />
Rate<br />
State<br />
Target<br />
Note: Data for this Indicator is from the on-site monitoring of LEAs for the given year.<br />
B. Percent of youth enrolled in higher<br />
education or competitively employed<br />
within one year of leaving high school.<br />
C. Percent of youth enrolled in higher<br />
education or in some other postsecondary<br />
education or training program; or<br />
competitively employed or in some other<br />
employment within one year of leaving<br />
high school.<br />
State<br />
Rate<br />
Indicator 20: Reported Data-Timely and Accurate*<br />
District submitted<br />
required data elements<br />
on or before due dates;<br />
made revisions within<br />
the alloted reveiw<br />
periods.<br />
Accurate and Timely<br />
Data Submission<br />
Overall (3-21)<br />
Early Childhood (3-5)<br />
School Age (5-21)<br />
State<br />
Target<br />
100.00%<br />
100.00%<br />
100.00%<br />
State<br />
Target<br />
LEA<br />
Rate<br />
LEA<br />
Rate<br />
Target Met by<br />
LEA (Y/N)<br />
Target Met<br />
by LEA<br />
(Y/N)<br />
Target Met<br />
by LEA<br />
(Y/N)<br />
*Data reviewed for timely and accurate submissions included all APSCN cycle data except for personnel<br />
Note: - - denotes not applicable<br />
96.19 100.00 — — N/A<br />
14.53<br />
State<br />
Rate<br />
49.42<br />
State<br />
Rate<br />
54.07<br />
13.00<br />
State<br />
Target<br />
49.00<br />
State<br />
Target<br />
60.00<br />
Y<br />
N/A<br />
Y<br />
— —<br />
LEA<br />
Rate<br />
— —<br />
LEA<br />
Rate<br />
— —<br />
N/A<br />
Target Met<br />
by LEA<br />
(Y/N)<br />
N/A<br />
Target Met<br />
by LEA<br />
(Y/N)<br />
N/A<br />
Page 5 of 5
<strong>ARKANSAS</strong> <strong>SPECIAL</strong> <strong>EDUCATION</strong><br />
<strong>DISTRICT</strong> <strong>ANNUAL</strong> PERFORMANCE REPORT<br />
2010/11 School Year<br />
Publication Date: March 2012<br />
Each State must have in place a State Performance Plan (SPP) to evaluate the State's efforts to meet the requirements and<br />
purposes of the implementation of the Individuals with Disabilities Education Act (IDEA). The SPP is a six-year plan, which<br />
describes Arkansas's performance on 20 indicators. The Office of Special Education Programs in the U. S. Department of<br />
Education requires that States report annually to the public on the performance of each local education agency (LEA) on 14 of<br />
20 indicators as compared with targets established by the State in the SPP. Arkansas will report indicators 1 through 14 and<br />
20 for each LEA serving children with disabilities (CWD). Any LEA not meeting targets on compliance indicators (0% for<br />
Indicators 4B, 09 & 10 and 100% for Indicators 11, 12, 13, and 20) are non-compliant with IDEA.<br />
There are no report changes for the 2010/11 school year profile; However, it is important to recognize that: .<br />
1. Indicator 01 (Graduation) is reported a year in arrear (2009/10 graduates) and is based on a four-year cohort. This<br />
means the rate is a measure of students who entered in ninth grade and graduate in four years. The calculation is a<br />
requirement under Title I of the Elementary and Secondary Education Act (ESEA).<br />
2. Indicator 02 (Drop out) is reported a year in arrear. This means the rate is a measure of students who dropped out in<br />
the 2009/10 school year. The Indicator 02 data are aligned with the Common Core of Data (CCD) requirements for<br />
grades 7-12.<br />
3. Indicator 04A and 4B (Suspension/Expulsion) is reported a year in arrear. This means the rate is a measure of<br />
students who had out-of-school suspensions and/or expulsions totaling more than 10 days.<br />
For a complete description of all the Indicators, please visit the special education website at<br />
http://arksped.k12.ar.us/sections/policy.html<br />
LEA: 2605 - LAKE HAMILTON SCHOOL <strong>DISTRICT</strong><br />
Indicator 01: Graduation Rates (2009/10 school year) Indicator 02: Dropout Rates (2009/10 school year)<br />
Percent of youth<br />
with IEPs<br />
graduating from<br />
high school with a<br />
regular diploma<br />
State<br />
Rate<br />
State<br />
Target<br />
75.76% 85.00%<br />
LEA<br />
Rate<br />
87.88%<br />
Target Met<br />
by LEA<br />
(Y/N)<br />
Y<br />
Percent of<br />
youth with<br />
IEPs dropping<br />
out of high<br />
school<br />
State<br />
Rate<br />
Indicator 03: Assessment on Statewide Benchmark Exam (grades 3-8, 11)<br />
A) Adequate Yearly Progress<br />
n=40<br />
Literacy<br />
Mathematics<br />
Met Disability Subgroup "n"<br />
for Reporting Purposes (Y/N)<br />
State Target for % of Districts Meeting<br />
AYP for Disability Subgroup<br />
State<br />
Target<br />
3.06% 4.20%<br />
LEA<br />
Rate<br />
4.49%<br />
% of Districts Meeting AYP<br />
for Disability Subgroup<br />
Target Met by<br />
LEA (Y/N)<br />
N<br />
Target Met by<br />
LEA(Y/N)<br />
Overall N 17.15% 6.25%<br />
NA<br />
N<br />
N<br />
Note: For a district to qualify as having a disability subgroup it must have a minimum of 40 (n=40) students with disabilities in a school building.<br />
B) Participation<br />
Participation Rate: # of<br />
CWD Tested ÷ # of CWD<br />
Enrolled in grades tested.<br />
Participation Rate: Literacy<br />
Participation Rate: Math<br />
Note: - - denotes not applicable<br />
State<br />
Rate<br />
98.78%<br />
State<br />
Target<br />
95.00%<br />
LEA<br />
Rate<br />
99.58%<br />
Target Met<br />
by LEA (Y/N)<br />
98.61% 95.00% 99.26% Y<br />
Y<br />
C) Performance Proficiency<br />
Percent of CWD Scoring<br />
Proficient or Above<br />
Proficiency Rate: Literacy<br />
Proficiency Rate:<br />
Mathematics<br />
16.00%<br />
16.00%<br />
State<br />
Rate<br />
31.49%<br />
44.86%<br />
State<br />
Target<br />
45.22%<br />
51.14%<br />
LEA<br />
Rate<br />
40.27%<br />
58.94%<br />
NA<br />
NA<br />
Target<br />
Met by<br />
LEA (Y/N)<br />
N<br />
Y<br />
Page 1 of 5
LEA: 2605 - LAKE HAMILTON SCHOOL <strong>DISTRICT</strong><br />
Indicator 04: Out-of-School Suspensions and Expulsions (2009/10 school year)<br />
A) Suspension/Expulsion<br />
Percent difference of CWD with out-of- school suspensions and<br />
expulsions totaling greater than 10 days in a school year as<br />
compared to the same data for general education students in<br />
the district.<br />
B) Suspension/Expulsion by Race and Ethnicity<br />
Percent of districts that have: (a) a significant discrepancy, by race or<br />
ethnicity, in the rate of suspensions and expulsions of greater than 10<br />
days in a school year for children with IEPs; and (b) policies,<br />
procedures or practices that contribute to the significant discrepancy<br />
and do not comply with requirements relating to the development<br />
and implementation of IEPs, the use of positive behavioral<br />
interventions and supports, and procedural safeguards.<br />
Indicator 05: School Age (5-21) Least Restrictive Environment<br />
A) In the Regular Class 80% or more of the day<br />
Percent of CWD with<br />
IEPs receiving instruction<br />
in the regular class 80%<br />
or more of the day.<br />
State<br />
Rate<br />
State<br />
Target<br />
LEA<br />
Rate<br />
B) In the Regular Class less than 40% of the day<br />
Percent of CWD with<br />
IEPs receiving instruction<br />
in the regular class less<br />
than 60% of the day.<br />
53.87% 59.77%<br />
State<br />
Rate<br />
State<br />
Target<br />
12.42% 12.51%<br />
52.03%<br />
LEA<br />
Rate<br />
16.44%<br />
C) Other Settings outside the regular class<br />
Percent of CWD with IEPs served in<br />
public or private separate schools,<br />
residential placements, or<br />
homebound/hospital placements.<br />
State<br />
Rate<br />
State<br />
Target<br />
2.80% 2.56%<br />
Target Met<br />
by LEA (Y/N)<br />
N<br />
Target Met<br />
by LEA (Y/N)<br />
N<br />
LEA<br />
Rate<br />
2.03%<br />
Target Met<br />
by LEA(Y/N)<br />
Indicator 06: Early Childhood (3-5) Least Restrictive Environment<br />
A) Regular Early Childhood Program<br />
Percent of children (aged 3 through 5) with IEPs attending a regular<br />
early childhood program and receiving the majority of special<br />
education and related services in the regular early childhood program<br />
Allowable<br />
Difference<br />
LEA: 2605 - LAKE HAMILTON SCHOOL <strong>DISTRICT</strong><br />
Indicator 07: Preschool (3-5) Outcomes<br />
a) Percent of preschool CWD<br />
children who did not<br />
improve functioning.<br />
b) Percent of preschool CWD<br />
who improved but whose<br />
functioning remained below<br />
same age peers.<br />
c) Percent of preschool CWD<br />
who improved at a level<br />
nearer to same aged peers.<br />
d) Percent of preschool CWD<br />
who improved functioning to<br />
reach a level comparable to<br />
same age peers.<br />
e) Percent of preschool CWD<br />
children who maintain<br />
functioning at a level<br />
comparable to same aged<br />
peers.<br />
Summary<br />
Statements<br />
1) Of those preschool<br />
children who entered<br />
the preschool program<br />
below age expectations<br />
in each Outcome, the<br />
percent who<br />
substantially increased<br />
their rate of growth by<br />
the time they turned 6<br />
years of age or exited<br />
the program.<br />
2) The percent of<br />
preschool children who<br />
were functioning<br />
within age expectations<br />
in each Outcome by the<br />
time they turned 6<br />
years of age or exited<br />
A) Positive Social -Emotional<br />
Skills*<br />
State<br />
Rate<br />
A) Positive Social -<br />
Emotional Skills<br />
(Including social<br />
relationships)<br />
State<br />
Rate<br />
2.14%<br />
5.31%<br />
25.97%<br />
38.22%<br />
28.36%<br />
State<br />
Target<br />
LEA<br />
Rate<br />
LEA<br />
Rate<br />
— —<br />
— —<br />
— —<br />
— —<br />
— —<br />
Target<br />
Met by<br />
LEA(Y/N)<br />
B) Acquisition and Use of<br />
Knowledge and Skills<br />
(Including early language/<br />
communication and early literacy)<br />
B) Acquisition and Use of<br />
Knowledge and Skills **<br />
State<br />
Rate<br />
1.75%<br />
6.59%<br />
34.23%<br />
43.51%<br />
13.92%<br />
State<br />
Target<br />
LEA<br />
Rate<br />
Target<br />
Met by<br />
LEA(Y/N)<br />
C) Use of Appropriate Behaviors<br />
to Meet Their Needs<br />
State<br />
Rate<br />
State<br />
Target<br />
LEA<br />
Rate<br />
Target<br />
Met by<br />
LEA(Y/N)<br />
89.61% 90.50% — — N/A 90.31% 90.50% — — N/A 90.82% 92.50% — — N/A<br />
66.58% 69.50% — — N/A 57.43% 60.50% — — N/A 76.69% 78.50% — — N/A<br />
NOTE: * Including social relationships ** Including early language/ communication and early literacy<br />
Note: - - denotes not applicable<br />
State<br />
Rate<br />
LEA<br />
Rate<br />
— —<br />
— —<br />
— —<br />
— —<br />
— —<br />
C) Use of<br />
Appropriate<br />
Behaviors to<br />
Meet Their Needs<br />
State<br />
Rate<br />
4.51%<br />
17.34%<br />
41.72%<br />
34.97%<br />
LEA<br />
Rate<br />
1.46% — —<br />
— —<br />
— —<br />
— —<br />
— —<br />
Page 3 of 5
LEA: 2605 - LAKE HAMILTON SCHOOL <strong>DISTRICT</strong><br />
Indicator 08: Parent Involvement<br />
Percent of surveyed<br />
parents who reported<br />
school facilitated parent<br />
involvement as a means<br />
of improving services<br />
and results for children<br />
with disabilities.<br />
Early Childhood<br />
(3-5)<br />
School Age<br />
(5-21)<br />
State<br />
Rate<br />
90.47%<br />
95.05%<br />
Indicator 09: Disproportionality - Eligibility<br />
Disproportionate representation of racial<br />
and ethnic groups in special education and<br />
related services that is a result of<br />
inappropriate identification (e.g.<br />
monitoring data, review of policies,<br />
practices, and procedures under 618(d),<br />
etc.).<br />
State<br />
Rate<br />
State<br />
Target<br />
88.00%<br />
96.00%<br />
State<br />
Target<br />
0.00% 0.00%<br />
LEA<br />
Rate<br />
— —<br />
89.01%<br />
Indicator 10: Disproportionality-Child with a Disability<br />
Disproportionate representation of racial<br />
and ethnic groups in specific disability<br />
categories that is a result of inappropriate<br />
identification (e.g. monitoring data, review<br />
of policies, practices, and procedures under<br />
618(d), etc.).<br />
Indicator 11: Child Find<br />
Percent of children with<br />
parental consent to evaluate<br />
who are evaluated within<br />
the State established timeline<br />
of 60 days.<br />
Overall<br />
(3-21)<br />
Early Childhood<br />
(3-5)<br />
School Age<br />
(5-21)<br />
State<br />
Rate<br />
0.00%<br />
Indicator 12: Early Childhood Transition<br />
Percent of children referred by Part C prior to<br />
age 3, who are found eligible for Part B, and<br />
who have an IEP developed and implemented<br />
by their third birthday.<br />
Note: - - denotes not applicable<br />
State<br />
Rate<br />
99.41%<br />
99.70%<br />
98.97%<br />
State<br />
Rate<br />
State<br />
Target<br />
0.00%<br />
State<br />
Target<br />
100.00%<br />
100.00%<br />
100.00%<br />
State<br />
Target<br />
Target Met by<br />
LEA (Y/N)<br />
Y<br />
Target Met by<br />
LEA (Y/N)<br />
Y<br />
LEA<br />
Rate<br />
100.00%<br />
— —<br />
100.00%<br />
LEA<br />
Rate<br />
Target Met by<br />
LEA (Y/N)<br />
N/A<br />
N<br />
Note: The target for Indicator 09 is to have zero percent<br />
(0%) of districts identified as having disproportionate<br />
representation as a result of inappropriate<br />
identification in eligibility.<br />
Note: The target for Indicator 10 is to have zero<br />
percent (0%) of districts identified as having<br />
disproportionate representation as a result of<br />
inappropriate identification in a disability<br />
category.<br />
Target Met by<br />
LEA (Y/N)<br />
N/A<br />
Y<br />
Target Met<br />
by LEA<br />
(Y/N)<br />
99.21% 100.00% - - N/A<br />
Y<br />
Note: * Indicates a zero reponse rate for the<br />
district.<br />
Page 4 of 5
LEA: 2605 - LAKE HAMILTON SCHOOL <strong>DISTRICT</strong><br />
Indicator 13: Secondary Transition<br />
Percent of youth with disabilities aged 16 and<br />
up with an IEP that includes coordinated,<br />
measurable, annual IEP goals and transition<br />
services that will reasonably enable the student<br />
to meet the post-secondary goals.<br />
Indicator 14: Post-School Outcomes<br />
A. Percent of youth enrolled in higher<br />
education within one year of leaving high<br />
school.<br />
State<br />
Rate<br />
State<br />
Target<br />
Note: Data for this Indicator is from the on-site monitoring of LEAs for the given year.<br />
B. Percent of youth enrolled in higher<br />
education or competitively employed<br />
within one year of leaving high school.<br />
C. Percent of youth enrolled in higher<br />
education or in some other postsecondary<br />
education or training program; or<br />
competitively employed or in some other<br />
employment within one year of leaving<br />
high school.<br />
State<br />
Rate<br />
Indicator 20: Reported Data-Timely and Accurate*<br />
District submitted<br />
required data elements<br />
on or before due dates;<br />
made revisions within<br />
the alloted reveiw<br />
periods.<br />
Accurate and Timely<br />
Data Submission<br />
Overall (3-21)<br />
Early Childhood (3-5)<br />
School Age (5-21)<br />
State<br />
Target<br />
100.00%<br />
100.00%<br />
100.00%<br />
State<br />
Target<br />
LEA<br />
Rate<br />
LEA<br />
Rate<br />
Target Met by<br />
LEA (Y/N)<br />
Target Met<br />
by LEA<br />
(Y/N)<br />
Target Met<br />
by LEA<br />
(Y/N)<br />
*Data reviewed for timely and accurate submissions included all APSCN cycle data except for personnel<br />
Note: - - denotes not applicable<br />
96.19 100.00 20.00% N<br />
14.53<br />
State<br />
Rate<br />
49.42<br />
State<br />
Rate<br />
54.07<br />
13.00<br />
State<br />
Target<br />
49.00<br />
State<br />
Target<br />
60.00<br />
Y<br />
N/A<br />
Y<br />
0.00%<br />
LEA<br />
Rate<br />
60.00%<br />
LEA<br />
Rate<br />
60.00%<br />
N<br />
Target Met<br />
by LEA<br />
(Y/N)<br />
Y<br />
Target Met<br />
by LEA<br />
(Y/N)<br />
Y<br />
Page 5 of 5
LEA: 2606 - LAKESIDE SCHOOL <strong>DISTRICT</strong><br />
<strong>ARKANSAS</strong> <strong>SPECIAL</strong> <strong>EDUCATION</strong><br />
<strong>DISTRICT</strong> <strong>ANNUAL</strong> PERFORMANCE REPORT<br />
2010/11 School Year<br />
Publication Date: March 2012<br />
Each State must have in place a State Performance Plan (SPP) to evaluate the State's efforts to meet the requirements and<br />
purposes of the implementation of the Individuals with Disabilities Education Act (IDEA). The SPP is a six-year plan, which<br />
describes Arkansas's performance on 20 indicators. The Office of Special Education Programs in the U. S. Department of<br />
Education requires that States report annually to the public on the performance of each local education agency (LEA) on 14 of<br />
20 indicators as compared with targets established by the State in the SPP. Arkansas will report indicators 1 through 14 and<br />
20 for each LEA serving children with disabilities (CWD). Any LEA not meeting targets on compliance indicators (0% for<br />
Indicators 4B, 09 & 10 and 100% for Indicators 11, 12, 13, and 20) are non-compliant with IDEA.<br />
There are no report changes for the 2010/11 school year profile; However, it is important to recognize that: .<br />
1. Indicator 01 (Graduation) is reported a year in arrear (2009/10 graduates) and is based on a four-year cohort. This<br />
means the rate is a measure of students who entered in ninth grade and graduate in four years. The calculation is a<br />
requirement under Title I of the Elementary and Secondary Education Act (ESEA).<br />
2. Indicator 02 (Drop out) is reported a year in arrear. This means the rate is a measure of students who dropped out in<br />
the 2009/10 school year. The Indicator 02 data are aligned with the Common Core of Data (CCD) requirements for<br />
grades 7-12.<br />
3. Indicator 04A and 4B (Suspension/Expulsion) is reported a year in arrear. This means the rate is a measure of<br />
students who had out-of-school suspensions and/or expulsions totaling more than 10 days.<br />
Percent of youth<br />
with IEPs<br />
graduating from<br />
high school with a<br />
regular diploma<br />
For a complete description of all the Indicators, please visit the special education website at<br />
http://arksped.k12.ar.us/sections/policy.html<br />
Indicator 01: Graduation Rates (2009/10 school year) Indicator 02: Dropout Rates (2009/10 school year)<br />
State<br />
Rate<br />
State<br />
Target<br />
75.76% 85.00%<br />
LEA<br />
Rate<br />
87.50%<br />
Target Met<br />
by LEA<br />
(Y/N)<br />
Y<br />
Percent of<br />
youth with<br />
IEPs dropping<br />
out of high<br />
school<br />
State<br />
Rate<br />
Indicator 03: Assessment on Statewide Benchmark Exam (grades 3-8, 11)<br />
A) Adequate Yearly Progress<br />
n=40<br />
Literacy<br />
Mathematics<br />
Met Disability Subgroup "n"<br />
for Reporting Purposes (Y/N)<br />
State Target for % of Districts Meeting<br />
AYP for Disability Subgroup<br />
State<br />
Target<br />
3.06% 4.20%<br />
LEA<br />
Rate<br />
1.52%<br />
% of Districts Meeting AYP<br />
for Disability Subgroup<br />
Target Met by<br />
LEA (Y/N)<br />
Y<br />
Target Met by<br />
LEA(Y/N)<br />
Overall N 17.15% 6.25%<br />
NA<br />
N<br />
N<br />
Note: For a district to qualify as having a disability subgroup it must have a minimum of 40 (n=40) students with disabilities in a school building.<br />
B) Participation<br />
Participation Rate: # of<br />
CWD Tested ÷ # of CWD<br />
Enrolled in grades tested.<br />
Participation Rate: Literacy<br />
Participation Rate: Math<br />
Note: - - denotes not applicable<br />
State<br />
Rate<br />
98.78%<br />
State<br />
Target<br />
95.00%<br />
LEA<br />
Rate<br />
100.00%<br />
Target Met<br />
by LEA (Y/N)<br />
98.61% 95.00% 99.39% Y<br />
Y<br />
C) Performance Proficiency<br />
Percent of CWD Scoring<br />
Proficient or Above<br />
Proficiency Rate: Literacy<br />
Proficiency Rate:<br />
Mathematics<br />
16.00%<br />
16.00%<br />
State<br />
Rate<br />
31.49%<br />
44.86%<br />
State<br />
Target<br />
45.22%<br />
51.14%<br />
LEA<br />
Rate<br />
44.06%<br />
59.74%<br />
NA<br />
NA<br />
Target<br />
Met by<br />
LEA (Y/N)<br />
N<br />
Y<br />
Page 1 of 5
LEA: 2606 - LAKESIDE SCHOOL <strong>DISTRICT</strong><br />
Indicator 04: Out-of-School Suspensions and Expulsions (2009/10 school year)<br />
A) Suspension/Expulsion<br />
Percent difference of CWD with out-of- school suspensions and<br />
expulsions totaling greater than 10 days in a school year as<br />
compared to the same data for general education students in<br />
the district.<br />
B) Suspension/Expulsion by Race and Ethnicity<br />
Percent of districts that have: (a) a significant discrepancy, by race or<br />
ethnicity, in the rate of suspensions and expulsions of greater than 10<br />
days in a school year for children with IEPs; and (b) policies,<br />
procedures or practices that contribute to the significant discrepancy<br />
and do not comply with requirements relating to the development<br />
and implementation of IEPs, the use of positive behavioral<br />
interventions and supports, and procedural safeguards.<br />
Indicator 05: School Age (5-21) Least Restrictive Environment<br />
A) In the Regular Class 80% or more of the day<br />
Percent of CWD with<br />
IEPs receiving instruction<br />
in the regular class 80%<br />
or more of the day.<br />
State<br />
Rate<br />
State<br />
Target<br />
LEA<br />
Rate<br />
B) In the Regular Class less than 40% of the day<br />
Percent of CWD with<br />
IEPs receiving instruction<br />
in the regular class less<br />
than 60% of the day.<br />
53.87% 59.77%<br />
State<br />
Rate<br />
State<br />
Target<br />
12.42% 12.51%<br />
43.06%<br />
LEA<br />
Rate<br />
8.38%<br />
C) Other Settings outside the regular class<br />
Percent of CWD with IEPs served in<br />
public or private separate schools,<br />
residential placements, or<br />
homebound/hospital placements.<br />
State<br />
Rate<br />
State<br />
Target<br />
2.80% 2.56%<br />
Target Met<br />
by LEA (Y/N)<br />
N<br />
Target Met<br />
by LEA (Y/N)<br />
Y<br />
LEA<br />
Rate<br />
1.45%<br />
Target Met<br />
by LEA(Y/N)<br />
Indicator 06: Early Childhood (3-5) Least Restrictive Environment<br />
A) Regular Early Childhood Program<br />
Percent of children (aged 3 through 5) with IEPs attending a regular<br />
early childhood program and receiving the majority of special<br />
education and related services in the regular early childhood program<br />
Allowable<br />
Difference<br />
LEA: 2606 - LAKESIDE SCHOOL <strong>DISTRICT</strong><br />
Indicator 07: Preschool (3-5) Outcomes<br />
a) Percent of preschool CWD<br />
children who did not<br />
improve functioning.<br />
b) Percent of preschool CWD<br />
who improved but whose<br />
functioning remained below<br />
same age peers.<br />
c) Percent of preschool CWD<br />
who improved at a level<br />
nearer to same aged peers.<br />
d) Percent of preschool CWD<br />
who improved functioning to<br />
reach a level comparable to<br />
same age peers.<br />
e) Percent of preschool CWD<br />
children who maintain<br />
functioning at a level<br />
comparable to same aged<br />
peers.<br />
Summary<br />
Statements<br />
1) Of those preschool<br />
children who entered<br />
the preschool program<br />
below age expectations<br />
in each Outcome, the<br />
percent who<br />
substantially increased<br />
their rate of growth by<br />
the time they turned 6<br />
years of age or exited<br />
the program.<br />
2) The percent of<br />
preschool children who<br />
were functioning<br />
within age expectations<br />
in each Outcome by the<br />
time they turned 6<br />
years of age or exited<br />
A) Positive Social -Emotional<br />
Skills*<br />
State<br />
Rate<br />
A) Positive Social -<br />
Emotional Skills<br />
(Including social<br />
relationships)<br />
State<br />
Rate<br />
2.14%<br />
5.31%<br />
25.97%<br />
38.22%<br />
28.36%<br />
State<br />
Target<br />
LEA<br />
Rate<br />
LEA<br />
Rate<br />
— —<br />
— —<br />
— —<br />
— —<br />
— —<br />
Target<br />
Met by<br />
LEA(Y/N)<br />
B) Acquisition and Use of<br />
Knowledge and Skills<br />
(Including early language/<br />
communication and early literacy)<br />
B) Acquisition and Use of<br />
Knowledge and Skills **<br />
State<br />
Rate<br />
1.75%<br />
6.59%<br />
34.23%<br />
43.51%<br />
13.92%<br />
State<br />
Target<br />
LEA<br />
Rate<br />
Target<br />
Met by<br />
LEA(Y/N)<br />
C) Use of Appropriate Behaviors<br />
to Meet Their Needs<br />
State<br />
Rate<br />
State<br />
Target<br />
LEA<br />
Rate<br />
Target<br />
Met by<br />
LEA(Y/N)<br />
89.61% 90.50% — — N/A 90.31% 90.50% — — N/A 90.82% 92.50% — — N/A<br />
66.58% 69.50% — — N/A 57.43% 60.50% — — N/A 76.69% 78.50% — — N/A<br />
NOTE: * Including social relationships ** Including early language/ communication and early literacy<br />
Note: - - denotes not applicable<br />
State<br />
Rate<br />
LEA<br />
Rate<br />
— —<br />
— —<br />
— —<br />
— —<br />
— —<br />
C) Use of<br />
Appropriate<br />
Behaviors to<br />
Meet Their Needs<br />
State<br />
Rate<br />
4.51%<br />
17.34%<br />
41.72%<br />
34.97%<br />
LEA<br />
Rate<br />
1.46% — —<br />
— —<br />
— —<br />
— —<br />
— —<br />
Page 3 of 5
LEA: 2606 - LAKESIDE SCHOOL <strong>DISTRICT</strong><br />
Indicator 08: Parent Involvement<br />
Percent of surveyed<br />
parents who reported<br />
school facilitated parent<br />
involvement as a means<br />
of improving services<br />
and results for children<br />
with disabilities.<br />
Early Childhood<br />
(3-5)<br />
School Age<br />
(5-21)<br />
State<br />
Rate<br />
90.47%<br />
95.05%<br />
Indicator 09: Disproportionality - Eligibility<br />
Disproportionate representation of racial<br />
and ethnic groups in special education and<br />
related services that is a result of<br />
inappropriate identification (e.g.<br />
monitoring data, review of policies,<br />
practices, and procedures under 618(d),<br />
etc.).<br />
State<br />
Rate<br />
State<br />
Target<br />
88.00%<br />
96.00%<br />
State<br />
Target<br />
0.00% 0.00%<br />
LEA<br />
Rate<br />
— —<br />
100.00%<br />
Indicator 10: Disproportionality-Child with a Disability<br />
Disproportionate representation of racial<br />
and ethnic groups in specific disability<br />
categories that is a result of inappropriate<br />
identification (e.g. monitoring data, review<br />
of policies, practices, and procedures under<br />
618(d), etc.).<br />
Indicator 11: Child Find<br />
Percent of children with<br />
parental consent to evaluate<br />
who are evaluated within<br />
the State established timeline<br />
of 60 days.<br />
Overall<br />
(3-21)<br />
Early Childhood<br />
(3-5)<br />
School Age<br />
(5-21)<br />
State<br />
Rate<br />
0.00%<br />
Indicator 12: Early Childhood Transition<br />
Percent of children referred by Part C prior to<br />
age 3, who are found eligible for Part B, and<br />
who have an IEP developed and implemented<br />
by their third birthday.<br />
Note: - - denotes not applicable<br />
State<br />
Rate<br />
99.41%<br />
99.70%<br />
98.97%<br />
State<br />
Rate<br />
State<br />
Target<br />
0.00%<br />
State<br />
Target<br />
100.00%<br />
100.00%<br />
100.00%<br />
State<br />
Target<br />
Target Met by<br />
LEA (Y/N)<br />
Y<br />
Target Met by<br />
LEA (Y/N)<br />
Y<br />
LEA<br />
Rate<br />
100.00%<br />
— —<br />
100.00%<br />
LEA<br />
Rate<br />
Target Met by<br />
LEA (Y/N)<br />
N/A<br />
Y<br />
Note: The target for Indicator 09 is to have zero percent<br />
(0%) of districts identified as having disproportionate<br />
representation as a result of inappropriate<br />
identification in eligibility.<br />
Note: The target for Indicator 10 is to have zero<br />
percent (0%) of districts identified as having<br />
disproportionate representation as a result of<br />
inappropriate identification in a disability<br />
category.<br />
Target Met by<br />
LEA (Y/N)<br />
N/A<br />
Y<br />
Target Met<br />
by LEA<br />
(Y/N)<br />
99.21% 100.00% - - N/A<br />
Y<br />
Note: * Indicates a zero reponse rate for the<br />
district.<br />
Page 4 of 5
LEA: 2606 - LAKESIDE SCHOOL <strong>DISTRICT</strong><br />
Indicator 13: Secondary Transition<br />
Percent of youth with disabilities aged 16 and<br />
up with an IEP that includes coordinated,<br />
measurable, annual IEP goals and transition<br />
services that will reasonably enable the student<br />
to meet the post-secondary goals.<br />
Indicator 14: Post-School Outcomes<br />
A. Percent of youth enrolled in higher<br />
education within one year of leaving high<br />
school.<br />
State<br />
Rate<br />
State<br />
Target<br />
Note: Data for this Indicator is from the on-site monitoring of LEAs for the given year.<br />
B. Percent of youth enrolled in higher<br />
education or competitively employed<br />
within one year of leaving high school.<br />
C. Percent of youth enrolled in higher<br />
education or in some other postsecondary<br />
education or training program; or<br />
competitively employed or in some other<br />
employment within one year of leaving<br />
high school.<br />
State<br />
Rate<br />
Indicator 20: Reported Data-Timely and Accurate*<br />
District submitted<br />
required data elements<br />
on or before due dates;<br />
made revisions within<br />
the alloted reveiw<br />
periods.<br />
Accurate and Timely<br />
Data Submission<br />
Overall (3-21)<br />
Early Childhood (3-5)<br />
School Age (5-21)<br />
State<br />
Target<br />
100.00%<br />
100.00%<br />
100.00%<br />
State<br />
Target<br />
LEA<br />
Rate<br />
LEA<br />
Rate<br />
Target Met by<br />
LEA (Y/N)<br />
Target Met<br />
by LEA<br />
(Y/N)<br />
Target Met<br />
by LEA<br />
(Y/N)<br />
*Data reviewed for timely and accurate submissions included all APSCN cycle data except for personnel<br />
Note: - - denotes not applicable<br />
96.19 100.00 40.00% N<br />
14.53<br />
State<br />
Rate<br />
49.42<br />
State<br />
Rate<br />
54.07<br />
13.00<br />
State<br />
Target<br />
49.00<br />
State<br />
Target<br />
60.00<br />
Y<br />
N/A<br />
Y<br />
— —<br />
LEA<br />
Rate<br />
— —<br />
LEA<br />
Rate<br />
— —<br />
N/A<br />
Target Met<br />
by LEA<br />
(Y/N)<br />
N/A<br />
Target Met<br />
by LEA<br />
(Y/N)<br />
N/A<br />
Page 5 of 5
<strong>ARKANSAS</strong> <strong>SPECIAL</strong> <strong>EDUCATION</strong><br />
<strong>DISTRICT</strong> <strong>ANNUAL</strong> PERFORMANCE REPORT<br />
2010/11 School Year<br />
Publication Date: March 2012<br />
Each State must have in place a State Performance Plan (SPP) to evaluate the State's efforts to meet the requirements and<br />
purposes of the implementation of the Individuals with Disabilities Education Act (IDEA). The SPP is a six-year plan, which<br />
describes Arkansas's performance on 20 indicators. The Office of Special Education Programs in the U. S. Department of<br />
Education requires that States report annually to the public on the performance of each local education agency (LEA) on 14 of<br />
20 indicators as compared with targets established by the State in the SPP. Arkansas will report indicators 1 through 14 and<br />
20 for each LEA serving children with disabilities (CWD). Any LEA not meeting targets on compliance indicators (0% for<br />
Indicators 4B, 09 & 10 and 100% for Indicators 11, 12, 13, and 20) are non-compliant with IDEA.<br />
There are no report changes for the 2010/11 school year profile; However, it is important to recognize that: .<br />
1. Indicator 01 (Graduation) is reported a year in arrear (2009/10 graduates) and is based on a four-year cohort. This<br />
means the rate is a measure of students who entered in ninth grade and graduate in four years. The calculation is a<br />
requirement under Title I of the Elementary and Secondary Education Act (ESEA).<br />
2. Indicator 02 (Drop out) is reported a year in arrear. This means the rate is a measure of students who dropped out in<br />
the 2009/10 school year. The Indicator 02 data are aligned with the Common Core of Data (CCD) requirements for<br />
grades 7-12.<br />
3. Indicator 04A and 4B (Suspension/Expulsion) is reported a year in arrear. This means the rate is a measure of<br />
students who had out-of-school suspensions and/or expulsions totaling more than 10 days.<br />
For a complete description of all the Indicators, please visit the special education website at<br />
http://arksped.k12.ar.us/sections/policy.html<br />
LEA: 2607 - MOUNTAIN PINE SCHOOL <strong>DISTRICT</strong><br />
Indicator 01: Graduation Rates (2009/10 school year) Indicator 02: Dropout Rates (2009/10 school year)<br />
Percent of youth<br />
with IEPs<br />
graduating from<br />
high school with a<br />
regular diploma<br />
State<br />
Rate<br />
State<br />
Target<br />
75.76% 85.00%<br />
LEA<br />
Rate<br />
100.00%<br />
Target Met<br />
by LEA<br />
(Y/N)<br />
Y<br />
Percent of<br />
youth with<br />
IEPs dropping<br />
out of high<br />
school<br />
State<br />
Rate<br />
Indicator 03: Assessment on Statewide Benchmark Exam (grades 3-8, 11)<br />
A) Adequate Yearly Progress<br />
n=40<br />
Literacy<br />
Mathematics<br />
Met Disability Subgroup "n"<br />
for Reporting Purposes (Y/N)<br />
State Target for % of Districts Meeting<br />
AYP for Disability Subgroup<br />
State<br />
Target<br />
3.06% 4.20%<br />
LEA<br />
Rate<br />
0.00%<br />
% of Districts Meeting AYP<br />
for Disability Subgroup<br />
Target Met by<br />
LEA (Y/N)<br />
Y<br />
Target Met by<br />
LEA(Y/N)<br />
Overall N 17.15% 6.25%<br />
NA<br />
N<br />
N<br />
Note: For a district to qualify as having a disability subgroup it must have a minimum of 40 (n=40) students with disabilities in a school building.<br />
B) Participation<br />
Participation Rate: # of<br />
CWD Tested ÷ # of CWD<br />
Enrolled in grades tested.<br />
Participation Rate: Literacy<br />
Participation Rate: Math<br />
Note: - - denotes not applicable<br />
State<br />
Rate<br />
98.78%<br />
State<br />
Target<br />
95.00%<br />
LEA<br />
Rate<br />
97.62%<br />
Target Met<br />
by LEA (Y/N)<br />
98.61% 95.00% 98.00% Y<br />
Y<br />
C) Performance Proficiency<br />
Percent of CWD Scoring<br />
Proficient or Above<br />
Proficiency Rate: Literacy<br />
Proficiency Rate:<br />
Mathematics<br />
16.00%<br />
16.00%<br />
State<br />
Rate<br />
31.49%<br />
44.86%<br />
State<br />
Target<br />
45.22%<br />
51.14%<br />
LEA<br />
Rate<br />
8.33%<br />
25.00%<br />
NA<br />
NA<br />
Target<br />
Met by<br />
LEA (Y/N)<br />
N<br />
N<br />
Page 1 of 5
LEA: 2607 - MOUNTAIN PINE SCHOOL <strong>DISTRICT</strong><br />
Indicator 04: Out-of-School Suspensions and Expulsions (2009/10 school year)<br />
A) Suspension/Expulsion<br />
Percent difference of CWD with out-of- school suspensions and<br />
expulsions totaling greater than 10 days in a school year as<br />
compared to the same data for general education students in<br />
the district.<br />
B) Suspension/Expulsion by Race and Ethnicity<br />
Percent of districts that have: (a) a significant discrepancy, by race or<br />
ethnicity, in the rate of suspensions and expulsions of greater than 10<br />
days in a school year for children with IEPs; and (b) policies,<br />
procedures or practices that contribute to the significant discrepancy<br />
and do not comply with requirements relating to the development<br />
and implementation of IEPs, the use of positive behavioral<br />
interventions and supports, and procedural safeguards.<br />
Indicator 05: School Age (5-21) Least Restrictive Environment<br />
A) In the Regular Class 80% or more of the day<br />
Percent of CWD with<br />
IEPs receiving instruction<br />
in the regular class 80%<br />
or more of the day.<br />
State<br />
Rate<br />
State<br />
Target<br />
LEA<br />
Rate<br />
B) In the Regular Class less than 40% of the day<br />
Percent of CWD with<br />
IEPs receiving instruction<br />
in the regular class less<br />
than 60% of the day.<br />
53.87% 59.77%<br />
State<br />
Rate<br />
State<br />
Target<br />
12.42% 12.51%<br />
61.18%<br />
LEA<br />
Rate<br />
2.35%<br />
C) Other Settings outside the regular class<br />
Percent of CWD with IEPs served in<br />
public or private separate schools,<br />
residential placements, or<br />
homebound/hospital placements.<br />
State<br />
Rate<br />
State<br />
Target<br />
2.80% 2.56%<br />
Target Met<br />
by LEA (Y/N)<br />
Y<br />
Target Met<br />
by LEA (Y/N)<br />
Y<br />
LEA<br />
Rate<br />
1.18%<br />
Target Met<br />
by LEA(Y/N)<br />
Indicator 06: Early Childhood (3-5) Least Restrictive Environment<br />
A) Regular Early Childhood Program<br />
Percent of children (aged 3 through 5) with IEPs attending a regular<br />
early childhood program and receiving the majority of special<br />
education and related services in the regular early childhood program<br />
Allowable<br />
Difference<br />
LEA: 2607 - MOUNTAIN PINE SCHOOL <strong>DISTRICT</strong><br />
Indicator 07: Preschool (3-5) Outcomes<br />
a) Percent of preschool CWD<br />
children who did not<br />
improve functioning.<br />
b) Percent of preschool CWD<br />
who improved but whose<br />
functioning remained below<br />
same age peers.<br />
c) Percent of preschool CWD<br />
who improved at a level<br />
nearer to same aged peers.<br />
d) Percent of preschool CWD<br />
who improved functioning to<br />
reach a level comparable to<br />
same age peers.<br />
e) Percent of preschool CWD<br />
children who maintain<br />
functioning at a level<br />
comparable to same aged<br />
peers.<br />
Summary<br />
Statements<br />
1) Of those preschool<br />
children who entered<br />
the preschool program<br />
below age expectations<br />
in each Outcome, the<br />
percent who<br />
substantially increased<br />
their rate of growth by<br />
the time they turned 6<br />
years of age or exited<br />
the program.<br />
2) The percent of<br />
preschool children who<br />
were functioning<br />
within age expectations<br />
in each Outcome by the<br />
time they turned 6<br />
years of age or exited<br />
A) Positive Social -Emotional<br />
Skills*<br />
State<br />
Rate<br />
A) Positive Social -<br />
Emotional Skills<br />
(Including social<br />
relationships)<br />
State<br />
Rate<br />
2.14%<br />
5.31%<br />
25.97%<br />
38.22%<br />
28.36%<br />
State<br />
Target<br />
LEA<br />
Rate<br />
LEA<br />
Rate<br />
— —<br />
— —<br />
— —<br />
— —<br />
— —<br />
Target<br />
Met by<br />
LEA(Y/N)<br />
B) Acquisition and Use of<br />
Knowledge and Skills<br />
(Including early language/<br />
communication and early literacy)<br />
B) Acquisition and Use of<br />
Knowledge and Skills **<br />
State<br />
Rate<br />
1.75%<br />
6.59%<br />
34.23%<br />
43.51%<br />
13.92%<br />
State<br />
Target<br />
LEA<br />
Rate<br />
Target<br />
Met by<br />
LEA(Y/N)<br />
C) Use of Appropriate Behaviors<br />
to Meet Their Needs<br />
State<br />
Rate<br />
State<br />
Target<br />
LEA<br />
Rate<br />
Target<br />
Met by<br />
LEA(Y/N)<br />
89.61% 90.50% — — N/A 90.31% 90.50% — — N/A 90.82% 92.50% — — N/A<br />
66.58% 69.50% — — N/A 57.43% 60.50% — — N/A 76.69% 78.50% — — N/A<br />
NOTE: * Including social relationships ** Including early language/ communication and early literacy<br />
Note: - - denotes not applicable<br />
State<br />
Rate<br />
LEA<br />
Rate<br />
— —<br />
— —<br />
— —<br />
— —<br />
— —<br />
C) Use of<br />
Appropriate<br />
Behaviors to<br />
Meet Their Needs<br />
State<br />
Rate<br />
4.51%<br />
17.34%<br />
41.72%<br />
34.97%<br />
LEA<br />
Rate<br />
1.46% — —<br />
— —<br />
— —<br />
— —<br />
— —<br />
Page 3 of 5
LEA: 2607 - MOUNTAIN PINE SCHOOL <strong>DISTRICT</strong><br />
Indicator 08: Parent Involvement<br />
Percent of surveyed<br />
parents who reported<br />
school facilitated parent<br />
involvement as a means<br />
of improving services<br />
and results for children<br />
with disabilities.<br />
Early Childhood<br />
(3-5)<br />
School Age<br />
(5-21)<br />
State<br />
Rate<br />
90.47%<br />
95.05%<br />
Indicator 09: Disproportionality - Eligibility<br />
Disproportionate representation of racial<br />
and ethnic groups in special education and<br />
related services that is a result of<br />
inappropriate identification (e.g.<br />
monitoring data, review of policies,<br />
practices, and procedures under 618(d),<br />
etc.).<br />
State<br />
Rate<br />
State<br />
Target<br />
88.00%<br />
96.00%<br />
State<br />
Target<br />
0.00% 0.00%<br />
LEA<br />
Rate<br />
— —<br />
100.00%<br />
Indicator 10: Disproportionality-Child with a Disability<br />
Disproportionate representation of racial<br />
and ethnic groups in specific disability<br />
categories that is a result of inappropriate<br />
identification (e.g. monitoring data, review<br />
of policies, practices, and procedures under<br />
618(d), etc.).<br />
Indicator 11: Child Find<br />
Percent of children with<br />
parental consent to evaluate<br />
who are evaluated within<br />
the State established timeline<br />
of 60 days.<br />
Overall<br />
(3-21)<br />
Early Childhood<br />
(3-5)<br />
School Age<br />
(5-21)<br />
State<br />
Rate<br />
0.00%<br />
Indicator 12: Early Childhood Transition<br />
Percent of children referred by Part C prior to<br />
age 3, who are found eligible for Part B, and<br />
who have an IEP developed and implemented<br />
by their third birthday.<br />
Note: - - denotes not applicable<br />
State<br />
Rate<br />
99.41%<br />
99.70%<br />
98.97%<br />
State<br />
Rate<br />
State<br />
Target<br />
0.00%<br />
State<br />
Target<br />
100.00%<br />
100.00%<br />
100.00%<br />
State<br />
Target<br />
Target Met by<br />
LEA (Y/N)<br />
Y<br />
Target Met by<br />
LEA (Y/N)<br />
Y<br />
LEA<br />
Rate<br />
90.91%<br />
— —<br />
90.91%<br />
LEA<br />
Rate<br />
Target Met by<br />
LEA (Y/N)<br />
N/A<br />
Y<br />
Note: The target for Indicator 09 is to have zero percent<br />
(0%) of districts identified as having disproportionate<br />
representation as a result of inappropriate<br />
identification in eligibility.<br />
Note: The target for Indicator 10 is to have zero<br />
percent (0%) of districts identified as having<br />
disproportionate representation as a result of<br />
inappropriate identification in a disability<br />
category.<br />
Target Met by<br />
LEA (Y/N)<br />
N/A<br />
N<br />
Target Met<br />
by LEA<br />
(Y/N)<br />
99.21% 100.00% - - N/A<br />
N<br />
Note: * Indicates a zero reponse rate for the<br />
district.<br />
Page 4 of 5
LEA: 2607 - MOUNTAIN PINE SCHOOL <strong>DISTRICT</strong><br />
Indicator 13: Secondary Transition<br />
Percent of youth with disabilities aged 16 and<br />
up with an IEP that includes coordinated,<br />
measurable, annual IEP goals and transition<br />
services that will reasonably enable the student<br />
to meet the post-secondary goals.<br />
Indicator 14: Post-School Outcomes<br />
A. Percent of youth enrolled in higher<br />
education within one year of leaving high<br />
school.<br />
State<br />
Rate<br />
State<br />
Target<br />
Note: Data for this Indicator is from the on-site monitoring of LEAs for the given year.<br />
B. Percent of youth enrolled in higher<br />
education or competitively employed<br />
within one year of leaving high school.<br />
C. Percent of youth enrolled in higher<br />
education or in some other postsecondary<br />
education or training program; or<br />
competitively employed or in some other<br />
employment within one year of leaving<br />
high school.<br />
State<br />
Rate<br />
Indicator 20: Reported Data-Timely and Accurate*<br />
District submitted<br />
required data elements<br />
on or before due dates;<br />
made revisions within<br />
the alloted reveiw<br />
periods.<br />
Accurate and Timely<br />
Data Submission<br />
Overall (3-21)<br />
Early Childhood (3-5)<br />
School Age (5-21)<br />
State<br />
Target<br />
100.00%<br />
100.00%<br />
100.00%<br />
State<br />
Target<br />
LEA<br />
Rate<br />
LEA<br />
Rate<br />
Target Met by<br />
LEA (Y/N)<br />
Target Met<br />
by LEA<br />
(Y/N)<br />
Target Met<br />
by LEA<br />
(Y/N)<br />
*Data reviewed for timely and accurate submissions included all APSCN cycle data except for personnel<br />
Note: - - denotes not applicable<br />
96.19 100.00 — — N/A<br />
14.53<br />
State<br />
Rate<br />
49.42<br />
State<br />
Rate<br />
54.07<br />
13.00<br />
State<br />
Target<br />
49.00<br />
State<br />
Target<br />
60.00<br />
Y<br />
N/A<br />
Y<br />
— —<br />
LEA<br />
Rate<br />
— —<br />
LEA<br />
Rate<br />
— —<br />
N/A<br />
Target Met<br />
by LEA<br />
(Y/N)<br />
N/A<br />
Target Met<br />
by LEA<br />
(Y/N)<br />
N/A<br />
Page 5 of 5
LEA: 2703 - POYEN SCHOOL <strong>DISTRICT</strong><br />
<strong>ARKANSAS</strong> <strong>SPECIAL</strong> <strong>EDUCATION</strong><br />
<strong>DISTRICT</strong> <strong>ANNUAL</strong> PERFORMANCE REPORT<br />
2010/11 School Year<br />
Publication Date: March 2012<br />
Each State must have in place a State Performance Plan (SPP) to evaluate the State's efforts to meet the requirements and<br />
purposes of the implementation of the Individuals with Disabilities Education Act (IDEA). The SPP is a six-year plan, which<br />
describes Arkansas's performance on 20 indicators. The Office of Special Education Programs in the U. S. Department of<br />
Education requires that States report annually to the public on the performance of each local education agency (LEA) on 14 of<br />
20 indicators as compared with targets established by the State in the SPP. Arkansas will report indicators 1 through 14 and<br />
20 for each LEA serving children with disabilities (CWD). Any LEA not meeting targets on compliance indicators (0% for<br />
Indicators 4B, 09 & 10 and 100% for Indicators 11, 12, 13, and 20) are non-compliant with IDEA.<br />
There are no report changes for the 2010/11 school year profile; However, it is important to recognize that: .<br />
1. Indicator 01 (Graduation) is reported a year in arrear (2009/10 graduates) and is based on a four-year cohort. This<br />
means the rate is a measure of students who entered in ninth grade and graduate in four years. The calculation is a<br />
requirement under Title I of the Elementary and Secondary Education Act (ESEA).<br />
2. Indicator 02 (Drop out) is reported a year in arrear. This means the rate is a measure of students who dropped out in<br />
the 2009/10 school year. The Indicator 02 data are aligned with the Common Core of Data (CCD) requirements for<br />
grades 7-12.<br />
3. Indicator 04A and 4B (Suspension/Expulsion) is reported a year in arrear. This means the rate is a measure of<br />
students who had out-of-school suspensions and/or expulsions totaling more than 10 days.<br />
Percent of youth<br />
with IEPs<br />
graduating from<br />
high school with a<br />
regular diploma<br />
For a complete description of all the Indicators, please visit the special education website at<br />
http://arksped.k12.ar.us/sections/policy.html<br />
Indicator 01: Graduation Rates (2009/10 school year) Indicator 02: Dropout Rates (2009/10 school year)<br />
State<br />
Rate<br />
State<br />
Target<br />
75.76% 85.00%<br />
LEA<br />
Rate<br />
66.67%<br />
Target Met<br />
by LEA<br />
(Y/N)<br />
N<br />
Percent of<br />
youth with<br />
IEPs dropping<br />
out of high<br />
school<br />
State<br />
Rate<br />
Indicator 03: Assessment on Statewide Benchmark Exam (grades 3-8, 11)<br />
A) Adequate Yearly Progress<br />
n=40<br />
Literacy<br />
Mathematics<br />
Met Disability Subgroup "n"<br />
for Reporting Purposes (Y/N)<br />
State Target for % of Districts Meeting<br />
AYP for Disability Subgroup<br />
State<br />
Target<br />
3.06% 4.20%<br />
LEA<br />
Rate<br />
9.09%<br />
% of Districts Meeting AYP<br />
for Disability Subgroup<br />
Target Met by<br />
LEA (Y/N)<br />
N<br />
Target Met by<br />
LEA(Y/N)<br />
Overall N 17.15% 6.25%<br />
NA<br />
N<br />
N<br />
Note: For a district to qualify as having a disability subgroup it must have a minimum of 40 (n=40) students with disabilities in a school building.<br />
B) Participation<br />
Participation Rate: # of<br />
CWD Tested ÷ # of CWD<br />
Enrolled in grades tested.<br />
Participation Rate: Literacy<br />
Participation Rate: Math<br />
Note: - - denotes not applicable<br />
State<br />
Rate<br />
98.78%<br />
State<br />
Target<br />
95.00%<br />
LEA<br />
Rate<br />
100.00%<br />
Target Met<br />
by LEA (Y/N)<br />
98.61% 95.00% 100.00% Y<br />
Y<br />
C) Performance Proficiency<br />
Percent of CWD Scoring<br />
Proficient or Above<br />
Proficiency Rate: Literacy<br />
Proficiency Rate:<br />
Mathematics<br />
16.00%<br />
16.00%<br />
State<br />
Rate<br />
31.49%<br />
44.86%<br />
State<br />
Target<br />
45.22%<br />
51.14%<br />
LEA<br />
Rate<br />
21.43%<br />
32.00%<br />
NA<br />
NA<br />
Target<br />
Met by<br />
LEA (Y/N)<br />
N<br />
N<br />
Page 1 of 5
LEA: 2703 - POYEN SCHOOL <strong>DISTRICT</strong><br />
Indicator 04: Out-of-School Suspensions and Expulsions (2009/10 school year)<br />
A) Suspension/Expulsion<br />
Percent difference of CWD with out-of- school suspensions and<br />
expulsions totaling greater than 10 days in a school year as<br />
compared to the same data for general education students in<br />
the district.<br />
B) Suspension/Expulsion by Race and Ethnicity<br />
Percent of districts that have: (a) a significant discrepancy, by race or<br />
ethnicity, in the rate of suspensions and expulsions of greater than 10<br />
days in a school year for children with IEPs; and (b) policies,<br />
procedures or practices that contribute to the significant discrepancy<br />
and do not comply with requirements relating to the development<br />
and implementation of IEPs, the use of positive behavioral<br />
interventions and supports, and procedural safeguards.<br />
Indicator 05: School Age (5-21) Least Restrictive Environment<br />
A) In the Regular Class 80% or more of the day<br />
Percent of CWD with<br />
IEPs receiving instruction<br />
in the regular class 80%<br />
or more of the day.<br />
State<br />
Rate<br />
State<br />
Target<br />
LEA<br />
Rate<br />
B) In the Regular Class less than 40% of the day<br />
Percent of CWD with<br />
IEPs receiving instruction<br />
in the regular class less<br />
than 60% of the day.<br />
53.87% 59.77%<br />
State<br />
Rate<br />
State<br />
Target<br />
12.42% 12.51%<br />
66.04%<br />
LEA<br />
Rate<br />
3.77%<br />
C) Other Settings outside the regular class<br />
Percent of CWD with IEPs served in<br />
public or private separate schools,<br />
residential placements, or<br />
homebound/hospital placements.<br />
State<br />
Rate<br />
State<br />
Target<br />
2.80% 2.56%<br />
Target Met<br />
by LEA (Y/N)<br />
Y<br />
Target Met<br />
by LEA (Y/N)<br />
Y<br />
LEA<br />
Rate<br />
0.00%<br />
Target Met<br />
by LEA(Y/N)<br />
Indicator 06: Early Childhood (3-5) Least Restrictive Environment<br />
A) Regular Early Childhood Program<br />
Percent of children (aged 3 through 5) with IEPs attending a regular<br />
early childhood program and receiving the majority of special<br />
education and related services in the regular early childhood program<br />
Allowable<br />
Difference<br />
LEA: 2703 - POYEN SCHOOL <strong>DISTRICT</strong><br />
Indicator 07: Preschool (3-5) Outcomes<br />
a) Percent of preschool CWD<br />
children who did not<br />
improve functioning.<br />
b) Percent of preschool CWD<br />
who improved but whose<br />
functioning remained below<br />
same age peers.<br />
c) Percent of preschool CWD<br />
who improved at a level<br />
nearer to same aged peers.<br />
d) Percent of preschool CWD<br />
who improved functioning to<br />
reach a level comparable to<br />
same age peers.<br />
e) Percent of preschool CWD<br />
children who maintain<br />
functioning at a level<br />
comparable to same aged<br />
peers.<br />
Summary<br />
Statements<br />
1) Of those preschool<br />
children who entered<br />
the preschool program<br />
below age expectations<br />
in each Outcome, the<br />
percent who<br />
substantially increased<br />
their rate of growth by<br />
the time they turned 6<br />
years of age or exited<br />
the program.<br />
2) The percent of<br />
preschool children who<br />
were functioning<br />
within age expectations<br />
in each Outcome by the<br />
time they turned 6<br />
years of age or exited<br />
A) Positive Social -Emotional<br />
Skills*<br />
State<br />
Rate<br />
A) Positive Social -<br />
Emotional Skills<br />
(Including social<br />
relationships)<br />
State<br />
Rate<br />
2.14%<br />
5.31%<br />
25.97%<br />
38.22%<br />
28.36%<br />
State<br />
Target<br />
LEA<br />
Rate<br />
LEA<br />
Rate<br />
— —<br />
— —<br />
— —<br />
— —<br />
— —<br />
Target<br />
Met by<br />
LEA(Y/N)<br />
B) Acquisition and Use of<br />
Knowledge and Skills<br />
(Including early language/<br />
communication and early literacy)<br />
B) Acquisition and Use of<br />
Knowledge and Skills **<br />
State<br />
Rate<br />
1.75%<br />
6.59%<br />
34.23%<br />
43.51%<br />
13.92%<br />
State<br />
Target<br />
LEA<br />
Rate<br />
Target<br />
Met by<br />
LEA(Y/N)<br />
C) Use of Appropriate Behaviors<br />
to Meet Their Needs<br />
State<br />
Rate<br />
State<br />
Target<br />
LEA<br />
Rate<br />
Target<br />
Met by<br />
LEA(Y/N)<br />
89.61% 90.50% — — N/A 90.31% 90.50% — — N/A 90.82% 92.50% — — N/A<br />
66.58% 69.50% — — N/A 57.43% 60.50% — — N/A 76.69% 78.50% — — N/A<br />
NOTE: * Including social relationships ** Including early language/ communication and early literacy<br />
Note: - - denotes not applicable<br />
State<br />
Rate<br />
LEA<br />
Rate<br />
— —<br />
— —<br />
— —<br />
— —<br />
— —<br />
C) Use of<br />
Appropriate<br />
Behaviors to<br />
Meet Their Needs<br />
State<br />
Rate<br />
4.51%<br />
17.34%<br />
41.72%<br />
34.97%<br />
LEA<br />
Rate<br />
1.46% — —<br />
— —<br />
— —<br />
— —<br />
— —<br />
Page 3 of 5
LEA: 2703 - POYEN SCHOOL <strong>DISTRICT</strong><br />
Indicator 08: Parent Involvement<br />
Percent of surveyed<br />
parents who reported<br />
school facilitated parent<br />
involvement as a means<br />
of improving services<br />
and results for children<br />
with disabilities.<br />
Early Childhood<br />
(3-5)<br />
School Age<br />
(5-21)<br />
State<br />
Rate<br />
90.47%<br />
95.05%<br />
Indicator 09: Disproportionality - Eligibility<br />
Disproportionate representation of racial<br />
and ethnic groups in special education and<br />
related services that is a result of<br />
inappropriate identification (e.g.<br />
monitoring data, review of policies,<br />
practices, and procedures under 618(d),<br />
etc.).<br />
State<br />
Rate<br />
State<br />
Target<br />
88.00%<br />
96.00%<br />
State<br />
Target<br />
0.00% 0.00%<br />
LEA<br />
Rate<br />
— —<br />
97.37%<br />
Indicator 10: Disproportionality-Child with a Disability<br />
Disproportionate representation of racial<br />
and ethnic groups in specific disability<br />
categories that is a result of inappropriate<br />
identification (e.g. monitoring data, review<br />
of policies, practices, and procedures under<br />
618(d), etc.).<br />
Indicator 11: Child Find<br />
Percent of children with<br />
parental consent to evaluate<br />
who are evaluated within<br />
the State established timeline<br />
of 60 days.<br />
Overall<br />
(3-21)<br />
Early Childhood<br />
(3-5)<br />
School Age<br />
(5-21)<br />
State<br />
Rate<br />
0.00%<br />
Indicator 12: Early Childhood Transition<br />
Percent of children referred by Part C prior to<br />
age 3, who are found eligible for Part B, and<br />
who have an IEP developed and implemented<br />
by their third birthday.<br />
Note: - - denotes not applicable<br />
State<br />
Rate<br />
99.41%<br />
99.70%<br />
98.97%<br />
State<br />
Rate<br />
State<br />
Target<br />
0.00%<br />
State<br />
Target<br />
100.00%<br />
100.00%<br />
100.00%<br />
State<br />
Target<br />
Target Met by<br />
LEA (Y/N)<br />
Y<br />
Target Met by<br />
LEA (Y/N)<br />
Y<br />
LEA<br />
Rate<br />
100.00%<br />
— —<br />
100.00%<br />
LEA<br />
Rate<br />
Target Met by<br />
LEA (Y/N)<br />
N/A<br />
Y<br />
Note: The target for Indicator 09 is to have zero percent<br />
(0%) of districts identified as having disproportionate<br />
representation as a result of inappropriate<br />
identification in eligibility.<br />
Note: The target for Indicator 10 is to have zero<br />
percent (0%) of districts identified as having<br />
disproportionate representation as a result of<br />
inappropriate identification in a disability<br />
category.<br />
Target Met by<br />
LEA (Y/N)<br />
N/A<br />
Y<br />
Target Met<br />
by LEA<br />
(Y/N)<br />
99.21% 100.00% - - N/A<br />
Y<br />
Note: * Indicates a zero reponse rate for the<br />
district.<br />
Page 4 of 5
LEA: 2703 - POYEN SCHOOL <strong>DISTRICT</strong><br />
Indicator 13: Secondary Transition<br />
Percent of youth with disabilities aged 16 and<br />
up with an IEP that includes coordinated,<br />
measurable, annual IEP goals and transition<br />
services that will reasonably enable the student<br />
to meet the post-secondary goals.<br />
Indicator 14: Post-School Outcomes<br />
A. Percent of youth enrolled in higher<br />
education within one year of leaving high<br />
school.<br />
State<br />
Rate<br />
State<br />
Target<br />
Note: Data for this Indicator is from the on-site monitoring of LEAs for the given year.<br />
B. Percent of youth enrolled in higher<br />
education or competitively employed<br />
within one year of leaving high school.<br />
C. Percent of youth enrolled in higher<br />
education or in some other postsecondary<br />
education or training program; or<br />
competitively employed or in some other<br />
employment within one year of leaving<br />
high school.<br />
State<br />
Rate<br />
Indicator 20: Reported Data-Timely and Accurate*<br />
District submitted<br />
required data elements<br />
on or before due dates;<br />
made revisions within<br />
the alloted reveiw<br />
periods.<br />
Accurate and Timely<br />
Data Submission<br />
Overall (3-21)<br />
Early Childhood (3-5)<br />
School Age (5-21)<br />
State<br />
Target<br />
100.00%<br />
100.00%<br />
100.00%<br />
State<br />
Target<br />
LEA<br />
Rate<br />
LEA<br />
Rate<br />
Target Met by<br />
LEA (Y/N)<br />
Target Met<br />
by LEA<br />
(Y/N)<br />
Target Met<br />
by LEA<br />
(Y/N)<br />
*Data reviewed for timely and accurate submissions included all APSCN cycle data except for personnel<br />
Note: - - denotes not applicable<br />
96.19 100.00 100.00% Y<br />
14.53<br />
State<br />
Rate<br />
49.42<br />
State<br />
Rate<br />
54.07<br />
13.00<br />
State<br />
Target<br />
49.00<br />
State<br />
Target<br />
60.00<br />
Y<br />
N/A<br />
Y<br />
0.00%<br />
LEA<br />
Rate<br />
50.00%<br />
LEA<br />
Rate<br />
50.00%<br />
N<br />
Target Met<br />
by LEA<br />
(Y/N)<br />
Y<br />
Target Met<br />
by LEA<br />
(Y/N)<br />
N<br />
Page 5 of 5
LEA: 2705 - SHERIDAN SCHOOL <strong>DISTRICT</strong><br />
<strong>ARKANSAS</strong> <strong>SPECIAL</strong> <strong>EDUCATION</strong><br />
<strong>DISTRICT</strong> <strong>ANNUAL</strong> PERFORMANCE REPORT<br />
2010/11 School Year<br />
Publication Date: March 2012<br />
Each State must have in place a State Performance Plan (SPP) to evaluate the State's efforts to meet the requirements and<br />
purposes of the implementation of the Individuals with Disabilities Education Act (IDEA). The SPP is a six-year plan, which<br />
describes Arkansas's performance on 20 indicators. The Office of Special Education Programs in the U. S. Department of<br />
Education requires that States report annually to the public on the performance of each local education agency (LEA) on 14 of<br />
20 indicators as compared with targets established by the State in the SPP. Arkansas will report indicators 1 through 14 and<br />
20 for each LEA serving children with disabilities (CWD). Any LEA not meeting targets on compliance indicators (0% for<br />
Indicators 4B, 09 & 10 and 100% for Indicators 11, 12, 13, and 20) are non-compliant with IDEA.<br />
There are no report changes for the 2010/11 school year profile; However, it is important to recognize that: .<br />
1. Indicator 01 (Graduation) is reported a year in arrear (2009/10 graduates) and is based on a four-year cohort. This<br />
means the rate is a measure of students who entered in ninth grade and graduate in four years. The calculation is a<br />
requirement under Title I of the Elementary and Secondary Education Act (ESEA).<br />
2. Indicator 02 (Drop out) is reported a year in arrear. This means the rate is a measure of students who dropped out in<br />
the 2009/10 school year. The Indicator 02 data are aligned with the Common Core of Data (CCD) requirements for<br />
grades 7-12.<br />
3. Indicator 04A and 4B (Suspension/Expulsion) is reported a year in arrear. This means the rate is a measure of<br />
students who had out-of-school suspensions and/or expulsions totaling more than 10 days.<br />
Percent of youth<br />
with IEPs<br />
graduating from<br />
high school with a<br />
regular diploma<br />
For a complete description of all the Indicators, please visit the special education website at<br />
http://arksped.k12.ar.us/sections/policy.html<br />
Indicator 01: Graduation Rates (2009/10 school year) Indicator 02: Dropout Rates (2009/10 school year)<br />
State<br />
Rate<br />
State<br />
Target<br />
75.76% 85.00%<br />
LEA<br />
Rate<br />
71.43%<br />
Target Met<br />
by LEA<br />
(Y/N)<br />
N<br />
Percent of<br />
youth with<br />
IEPs dropping<br />
out of high<br />
school<br />
State<br />
Rate<br />
Indicator 03: Assessment on Statewide Benchmark Exam (grades 3-8, 11)<br />
A) Adequate Yearly Progress<br />
n=40<br />
Literacy<br />
Mathematics<br />
Met Disability Subgroup "n"<br />
for Reporting Purposes (Y/N)<br />
State Target for % of Districts Meeting<br />
AYP for Disability Subgroup<br />
State<br />
Target<br />
3.06% 4.20%<br />
LEA<br />
Rate<br />
2.38%<br />
% of Districts Meeting AYP<br />
for Disability Subgroup<br />
Target Met by<br />
LEA (Y/N)<br />
Y<br />
Target Met by<br />
LEA(Y/N)<br />
Overall N 17.15% 6.25%<br />
NA<br />
N<br />
N<br />
Note: For a district to qualify as having a disability subgroup it must have a minimum of 40 (n=40) students with disabilities in a school building.<br />
B) Participation<br />
Participation Rate: # of<br />
CWD Tested ÷ # of CWD<br />
Enrolled in grades tested.<br />
Participation Rate: Literacy<br />
Participation Rate: Math<br />
Note: - - denotes not applicable<br />
State<br />
Rate<br />
98.78%<br />
State<br />
Target<br />
95.00%<br />
LEA<br />
Rate<br />
100.00%<br />
Target Met<br />
by LEA (Y/N)<br />
98.61% 95.00% 99.47% Y<br />
Y<br />
C) Performance Proficiency<br />
Percent of CWD Scoring<br />
Proficient or Above<br />
Proficiency Rate: Literacy<br />
Proficiency Rate:<br />
Mathematics<br />
16.00%<br />
16.00%<br />
State<br />
Rate<br />
31.49%<br />
44.86%<br />
State<br />
Target<br />
45.22%<br />
51.14%<br />
LEA<br />
Rate<br />
36.26%<br />
57.87%<br />
NA<br />
NA<br />
Target<br />
Met by<br />
LEA (Y/N)<br />
N<br />
Y<br />
Page 1 of 5
LEA: 2705 - SHERIDAN SCHOOL <strong>DISTRICT</strong><br />
Indicator 04: Out-of-School Suspensions and Expulsions (2009/10 school year)<br />
A) Suspension/Expulsion<br />
Percent difference of CWD with out-of- school suspensions and<br />
expulsions totaling greater than 10 days in a school year as<br />
compared to the same data for general education students in<br />
the district.<br />
B) Suspension/Expulsion by Race and Ethnicity<br />
Percent of districts that have: (a) a significant discrepancy, by race or<br />
ethnicity, in the rate of suspensions and expulsions of greater than 10<br />
days in a school year for children with IEPs; and (b) policies,<br />
procedures or practices that contribute to the significant discrepancy<br />
and do not comply with requirements relating to the development<br />
and implementation of IEPs, the use of positive behavioral<br />
interventions and supports, and procedural safeguards.<br />
Indicator 05: School Age (5-21) Least Restrictive Environment<br />
A) In the Regular Class 80% or more of the day<br />
Percent of CWD with<br />
IEPs receiving instruction<br />
in the regular class 80%<br />
or more of the day.<br />
State<br />
Rate<br />
State<br />
Target<br />
LEA<br />
Rate<br />
B) In the Regular Class less than 40% of the day<br />
Percent of CWD with<br />
IEPs receiving instruction<br />
in the regular class less<br />
than 60% of the day.<br />
53.87% 59.77%<br />
State<br />
Rate<br />
State<br />
Target<br />
12.42% 12.51%<br />
47.94%<br />
LEA<br />
Rate<br />
17.78%<br />
C) Other Settings outside the regular class<br />
Percent of CWD with IEPs served in<br />
public or private separate schools,<br />
residential placements, or<br />
homebound/hospital placements.<br />
State<br />
Rate<br />
State<br />
Target<br />
2.80% 2.56%<br />
Target Met<br />
by LEA (Y/N)<br />
N<br />
Target Met<br />
by LEA (Y/N)<br />
N<br />
LEA<br />
Rate<br />
0.26%<br />
Target Met<br />
by LEA(Y/N)<br />
Indicator 06: Early Childhood (3-5) Least Restrictive Environment<br />
A) Regular Early Childhood Program<br />
Percent of children (aged 3 through 5) with IEPs attending a regular<br />
early childhood program and receiving the majority of special<br />
education and related services in the regular early childhood program<br />
Allowable<br />
Difference<br />
LEA: 2705 - SHERIDAN SCHOOL <strong>DISTRICT</strong><br />
Indicator 07: Preschool (3-5) Outcomes<br />
a) Percent of preschool CWD<br />
children who did not<br />
improve functioning.<br />
b) Percent of preschool CWD<br />
who improved but whose<br />
functioning remained below<br />
same age peers.<br />
c) Percent of preschool CWD<br />
who improved at a level<br />
nearer to same aged peers.<br />
d) Percent of preschool CWD<br />
who improved functioning to<br />
reach a level comparable to<br />
same age peers.<br />
e) Percent of preschool CWD<br />
children who maintain<br />
functioning at a level<br />
comparable to same aged<br />
peers.<br />
Summary<br />
Statements<br />
1) Of those preschool<br />
children who entered<br />
the preschool program<br />
below age expectations<br />
in each Outcome, the<br />
percent who<br />
substantially increased<br />
their rate of growth by<br />
the time they turned 6<br />
years of age or exited<br />
the program.<br />
2) The percent of<br />
preschool children who<br />
were functioning<br />
within age expectations<br />
in each Outcome by the<br />
time they turned 6<br />
years of age or exited<br />
A) Positive Social -Emotional<br />
Skills*<br />
State<br />
Rate<br />
A) Positive Social -<br />
Emotional Skills<br />
(Including social<br />
relationships)<br />
State<br />
Rate<br />
2.14%<br />
5.31%<br />
25.97%<br />
38.22%<br />
28.36%<br />
State<br />
Target<br />
LEA<br />
Rate<br />
LEA<br />
Rate<br />
— —<br />
— —<br />
— —<br />
— —<br />
— —<br />
Target<br />
Met by<br />
LEA(Y/N)<br />
B) Acquisition and Use of<br />
Knowledge and Skills<br />
(Including early language/<br />
communication and early literacy)<br />
B) Acquisition and Use of<br />
Knowledge and Skills **<br />
State<br />
Rate<br />
1.75%<br />
6.59%<br />
34.23%<br />
43.51%<br />
13.92%<br />
State<br />
Target<br />
LEA<br />
Rate<br />
Target<br />
Met by<br />
LEA(Y/N)<br />
C) Use of Appropriate Behaviors<br />
to Meet Their Needs<br />
State<br />
Rate<br />
State<br />
Target<br />
LEA<br />
Rate<br />
Target<br />
Met by<br />
LEA(Y/N)<br />
89.61% 90.50% — — N/A 90.31% 90.50% — — N/A 90.82% 92.50% — — N/A<br />
66.58% 69.50% — — N/A 57.43% 60.50% — — N/A 76.69% 78.50% — — N/A<br />
NOTE: * Including social relationships ** Including early language/ communication and early literacy<br />
Note: - - denotes not applicable<br />
State<br />
Rate<br />
LEA<br />
Rate<br />
— —<br />
— —<br />
— —<br />
— —<br />
— —<br />
C) Use of<br />
Appropriate<br />
Behaviors to<br />
Meet Their Needs<br />
State<br />
Rate<br />
4.51%<br />
17.34%<br />
41.72%<br />
34.97%<br />
LEA<br />
Rate<br />
1.46% — —<br />
— —<br />
— —<br />
— —<br />
— —<br />
Page 3 of 5
LEA: 2705 - SHERIDAN SCHOOL <strong>DISTRICT</strong><br />
Indicator 08: Parent Involvement<br />
Percent of surveyed<br />
parents who reported<br />
school facilitated parent<br />
involvement as a means<br />
of improving services<br />
and results for children<br />
with disabilities.<br />
Early Childhood<br />
(3-5)<br />
School Age<br />
(5-21)<br />
State<br />
Rate<br />
90.47%<br />
95.05%<br />
Indicator 09: Disproportionality - Eligibility<br />
Disproportionate representation of racial<br />
and ethnic groups in special education and<br />
related services that is a result of<br />
inappropriate identification (e.g.<br />
monitoring data, review of policies,<br />
practices, and procedures under 618(d),<br />
etc.).<br />
State<br />
Rate<br />
State<br />
Target<br />
88.00%<br />
96.00%<br />
State<br />
Target<br />
0.00% 0.00%<br />
LEA<br />
Rate<br />
— —<br />
90.84%<br />
Indicator 10: Disproportionality-Child with a Disability<br />
Disproportionate representation of racial<br />
and ethnic groups in specific disability<br />
categories that is a result of inappropriate<br />
identification (e.g. monitoring data, review<br />
of policies, practices, and procedures under<br />
618(d), etc.).<br />
Indicator 11: Child Find<br />
Percent of children with<br />
parental consent to evaluate<br />
who are evaluated within<br />
the State established timeline<br />
of 60 days.<br />
Overall<br />
(3-21)<br />
Early Childhood<br />
(3-5)<br />
School Age<br />
(5-21)<br />
State<br />
Rate<br />
0.00%<br />
Indicator 12: Early Childhood Transition<br />
Percent of children referred by Part C prior to<br />
age 3, who are found eligible for Part B, and<br />
who have an IEP developed and implemented<br />
by their third birthday.<br />
Note: - - denotes not applicable<br />
State<br />
Rate<br />
99.41%<br />
99.70%<br />
98.97%<br />
State<br />
Rate<br />
State<br />
Target<br />
0.00%<br />
State<br />
Target<br />
100.00%<br />
100.00%<br />
100.00%<br />
State<br />
Target<br />
Target Met by<br />
LEA (Y/N)<br />
Y<br />
Target Met by<br />
LEA (Y/N)<br />
Y<br />
LEA<br />
Rate<br />
100.00%<br />
— —<br />
100.00%<br />
LEA<br />
Rate<br />
Target Met by<br />
LEA (Y/N)<br />
N/A<br />
N<br />
Note: The target for Indicator 09 is to have zero percent<br />
(0%) of districts identified as having disproportionate<br />
representation as a result of inappropriate<br />
identification in eligibility.<br />
Note: The target for Indicator 10 is to have zero<br />
percent (0%) of districts identified as having<br />
disproportionate representation as a result of<br />
inappropriate identification in a disability<br />
category.<br />
Target Met by<br />
LEA (Y/N)<br />
N/A<br />
Y<br />
Target Met<br />
by LEA<br />
(Y/N)<br />
99.21% 100.00% - - N/A<br />
Y<br />
Note: * Indicates a zero reponse rate for the<br />
district.<br />
Page 4 of 5
LEA: 2705 - SHERIDAN SCHOOL <strong>DISTRICT</strong><br />
Indicator 13: Secondary Transition<br />
Percent of youth with disabilities aged 16 and<br />
up with an IEP that includes coordinated,<br />
measurable, annual IEP goals and transition<br />
services that will reasonably enable the student<br />
to meet the post-secondary goals.<br />
Indicator 14: Post-School Outcomes<br />
A. Percent of youth enrolled in higher<br />
education within one year of leaving high<br />
school.<br />
State<br />
Rate<br />
State<br />
Target<br />
Note: Data for this Indicator is from the on-site monitoring of LEAs for the given year.<br />
B. Percent of youth enrolled in higher<br />
education or competitively employed<br />
within one year of leaving high school.<br />
C. Percent of youth enrolled in higher<br />
education or in some other postsecondary<br />
education or training program; or<br />
competitively employed or in some other<br />
employment within one year of leaving<br />
high school.<br />
State<br />
Rate<br />
Indicator 20: Reported Data-Timely and Accurate*<br />
District submitted<br />
required data elements<br />
on or before due dates;<br />
made revisions within<br />
the alloted reveiw<br />
periods.<br />
Accurate and Timely<br />
Data Submission<br />
Overall (3-21)<br />
Early Childhood (3-5)<br />
School Age (5-21)<br />
State<br />
Target<br />
100.00%<br />
100.00%<br />
100.00%<br />
State<br />
Target<br />
LEA<br />
Rate<br />
LEA<br />
Rate<br />
Target Met by<br />
LEA (Y/N)<br />
Target Met<br />
by LEA<br />
(Y/N)<br />
Target Met<br />
by LEA<br />
(Y/N)<br />
*Data reviewed for timely and accurate submissions included all APSCN cycle data except for personnel<br />
Note: - - denotes not applicable<br />
96.19 100.00 — — N/A<br />
14.53<br />
State<br />
Rate<br />
49.42<br />
State<br />
Rate<br />
54.07<br />
13.00<br />
State<br />
Target<br />
49.00<br />
State<br />
Target<br />
60.00<br />
Y<br />
N/A<br />
Y<br />
— —<br />
LEA<br />
Rate<br />
— —<br />
LEA<br />
Rate<br />
— —<br />
N/A<br />
Target Met<br />
by LEA<br />
(Y/N)<br />
N/A<br />
Target Met<br />
by LEA<br />
(Y/N)<br />
N/A<br />
Page 5 of 5
<strong>ARKANSAS</strong> <strong>SPECIAL</strong> <strong>EDUCATION</strong><br />
<strong>DISTRICT</strong> <strong>ANNUAL</strong> PERFORMANCE REPORT<br />
2010/11 School Year<br />
Publication Date: March 2012<br />
Each State must have in place a State Performance Plan (SPP) to evaluate the State's efforts to meet the requirements and<br />
purposes of the implementation of the Individuals with Disabilities Education Act (IDEA). The SPP is a six-year plan, which<br />
describes Arkansas's performance on 20 indicators. The Office of Special Education Programs in the U. S. Department of<br />
Education requires that States report annually to the public on the performance of each local education agency (LEA) on 14 of<br />
20 indicators as compared with targets established by the State in the SPP. Arkansas will report indicators 1 through 14 and<br />
20 for each LEA serving children with disabilities (CWD). Any LEA not meeting targets on compliance indicators (0% for<br />
Indicators 4B, 09 & 10 and 100% for Indicators 11, 12, 13, and 20) are non-compliant with IDEA.<br />
There are no report changes for the 2010/11 school year profile; However, it is important to recognize that: .<br />
1. Indicator 01 (Graduation) is reported a year in arrear (2009/10 graduates) and is based on a four-year cohort. This<br />
means the rate is a measure of students who entered in ninth grade and graduate in four years. The calculation is a<br />
requirement under Title I of the Elementary and Secondary Education Act (ESEA).<br />
2. Indicator 02 (Drop out) is reported a year in arrear. This means the rate is a measure of students who dropped out in<br />
the 2009/10 school year. The Indicator 02 data are aligned with the Common Core of Data (CCD) requirements for<br />
grades 7-12.<br />
3. Indicator 04A and 4B (Suspension/Expulsion) is reported a year in arrear. This means the rate is a measure of<br />
students who had out-of-school suspensions and/or expulsions totaling more than 10 days.<br />
For a complete description of all the Indicators, please visit the special education website at<br />
http://arksped.k12.ar.us/sections/policy.html<br />
LEA: 2803 - MARMADUKE SCHOOL <strong>DISTRICT</strong><br />
Indicator 01: Graduation Rates (2009/10 school year) Indicator 02: Dropout Rates (2009/10 school year)<br />
Percent of youth<br />
with IEPs<br />
graduating from<br />
high school with a<br />
regular diploma<br />
State<br />
Rate<br />
State<br />
Target<br />
75.76% 85.00%<br />
LEA<br />
Rate<br />
71.43%<br />
Target Met<br />
by LEA<br />
(Y/N)<br />
N<br />
Percent of<br />
youth with<br />
IEPs dropping<br />
out of high<br />
school<br />
State<br />
Rate<br />
Indicator 03: Assessment on Statewide Benchmark Exam (grades 3-8, 11)<br />
A) Adequate Yearly Progress<br />
n=40<br />
Literacy<br />
Mathematics<br />
Met Disability Subgroup "n"<br />
for Reporting Purposes (Y/N)<br />
State Target for % of Districts Meeting<br />
AYP for Disability Subgroup<br />
State<br />
Target<br />
3.06% 4.20%<br />
LEA<br />
Rate<br />
3.03%<br />
% of Districts Meeting AYP<br />
for Disability Subgroup<br />
Target Met by<br />
LEA (Y/N)<br />
Y<br />
Target Met by<br />
LEA(Y/N)<br />
Overall N 17.15% 6.25%<br />
NA<br />
N<br />
N<br />
Note: For a district to qualify as having a disability subgroup it must have a minimum of 40 (n=40) students with disabilities in a school building.<br />
B) Participation<br />
Participation Rate: # of<br />
CWD Tested ÷ # of CWD<br />
Enrolled in grades tested.<br />
Participation Rate: Literacy<br />
Participation Rate: Math<br />
Note: - - denotes not applicable<br />
State<br />
Rate<br />
98.78%<br />
State<br />
Target<br />
95.00%<br />
LEA<br />
Rate<br />
100.00%<br />
Target Met<br />
by LEA (Y/N)<br />
98.61% 95.00% 100.00% Y<br />
Y<br />
C) Performance Proficiency<br />
Percent of CWD Scoring<br />
Proficient or Above<br />
Proficiency Rate: Literacy<br />
Proficiency Rate:<br />
Mathematics<br />
16.00%<br />
16.00%<br />
State<br />
Rate<br />
31.49%<br />
44.86%<br />
State<br />
Target<br />
45.22%<br />
51.14%<br />
LEA<br />
Rate<br />
14.55%<br />
25.42%<br />
NA<br />
NA<br />
Target<br />
Met by<br />
LEA (Y/N)<br />
N<br />
N<br />
Page 1 of 5
LEA: 2803 - MARMADUKE SCHOOL <strong>DISTRICT</strong><br />
Indicator 04: Out-of-School Suspensions and Expulsions (2009/10 school year)<br />
A) Suspension/Expulsion<br />
Percent difference of CWD with out-of- school suspensions and<br />
expulsions totaling greater than 10 days in a school year as<br />
compared to the same data for general education students in<br />
the district.<br />
B) Suspension/Expulsion by Race and Ethnicity<br />
Percent of districts that have: (a) a significant discrepancy, by race or<br />
ethnicity, in the rate of suspensions and expulsions of greater than 10<br />
days in a school year for children with IEPs; and (b) policies,<br />
procedures or practices that contribute to the significant discrepancy<br />
and do not comply with requirements relating to the development<br />
and implementation of IEPs, the use of positive behavioral<br />
interventions and supports, and procedural safeguards.<br />
Indicator 05: School Age (5-21) Least Restrictive Environment<br />
A) In the Regular Class 80% or more of the day<br />
Percent of CWD with<br />
IEPs receiving instruction<br />
in the regular class 80%<br />
or more of the day.<br />
State<br />
Rate<br />
State<br />
Target<br />
LEA<br />
Rate<br />
B) In the Regular Class less than 40% of the day<br />
Percent of CWD with<br />
IEPs receiving instruction<br />
in the regular class less<br />
than 60% of the day.<br />
53.87% 59.77%<br />
State<br />
Rate<br />
State<br />
Target<br />
12.42% 12.51%<br />
57.76%<br />
LEA<br />
Rate<br />
8.62%<br />
C) Other Settings outside the regular class<br />
Percent of CWD with IEPs served in<br />
public or private separate schools,<br />
residential placements, or<br />
homebound/hospital placements.<br />
State<br />
Rate<br />
State<br />
Target<br />
2.80% 2.56%<br />
Target Met<br />
by LEA (Y/N)<br />
N<br />
Target Met<br />
by LEA (Y/N)<br />
Y<br />
LEA<br />
Rate<br />
0.00%<br />
Target Met<br />
by LEA(Y/N)<br />
Indicator 06: Early Childhood (3-5) Least Restrictive Environment<br />
A) Regular Early Childhood Program<br />
Percent of children (aged 3 through 5) with IEPs attending a regular<br />
early childhood program and receiving the majority of special<br />
education and related services in the regular early childhood program<br />
Allowable<br />
Difference<br />
LEA: 2803 - MARMADUKE SCHOOL <strong>DISTRICT</strong><br />
Indicator 07: Preschool (3-5) Outcomes<br />
a) Percent of preschool CWD<br />
children who did not<br />
improve functioning.<br />
b) Percent of preschool CWD<br />
who improved but whose<br />
functioning remained below<br />
same age peers.<br />
c) Percent of preschool CWD<br />
who improved at a level<br />
nearer to same aged peers.<br />
d) Percent of preschool CWD<br />
who improved functioning to<br />
reach a level comparable to<br />
same age peers.<br />
e) Percent of preschool CWD<br />
children who maintain<br />
functioning at a level<br />
comparable to same aged<br />
peers.<br />
Summary<br />
Statements<br />
1) Of those preschool<br />
children who entered<br />
the preschool program<br />
below age expectations<br />
in each Outcome, the<br />
percent who<br />
substantially increased<br />
their rate of growth by<br />
the time they turned 6<br />
years of age or exited<br />
the program.<br />
2) The percent of<br />
preschool children who<br />
were functioning<br />
within age expectations<br />
in each Outcome by the<br />
time they turned 6<br />
years of age or exited<br />
A) Positive Social -Emotional<br />
Skills*<br />
State<br />
Rate<br />
A) Positive Social -<br />
Emotional Skills<br />
(Including social<br />
relationships)<br />
State<br />
Rate<br />
2.14%<br />
5.31%<br />
25.97%<br />
38.22%<br />
28.36%<br />
State<br />
Target<br />
LEA<br />
Rate<br />
LEA<br />
Rate<br />
— —<br />
— —<br />
— —<br />
— —<br />
— —<br />
Target<br />
Met by<br />
LEA(Y/N)<br />
B) Acquisition and Use of<br />
Knowledge and Skills<br />
(Including early language/<br />
communication and early literacy)<br />
B) Acquisition and Use of<br />
Knowledge and Skills **<br />
State<br />
Rate<br />
1.75%<br />
6.59%<br />
34.23%<br />
43.51%<br />
13.92%<br />
State<br />
Target<br />
LEA<br />
Rate<br />
Target<br />
Met by<br />
LEA(Y/N)<br />
C) Use of Appropriate Behaviors<br />
to Meet Their Needs<br />
State<br />
Rate<br />
State<br />
Target<br />
LEA<br />
Rate<br />
Target<br />
Met by<br />
LEA(Y/N)<br />
89.61% 90.50% — — N/A 90.31% 90.50% — — N/A 90.82% 92.50% — — N/A<br />
66.58% 69.50% — — N/A 57.43% 60.50% — — N/A 76.69% 78.50% — — N/A<br />
NOTE: * Including social relationships ** Including early language/ communication and early literacy<br />
Note: - - denotes not applicable<br />
State<br />
Rate<br />
LEA<br />
Rate<br />
— —<br />
— —<br />
— —<br />
— —<br />
— —<br />
C) Use of<br />
Appropriate<br />
Behaviors to<br />
Meet Their Needs<br />
State<br />
Rate<br />
4.51%<br />
17.34%<br />
41.72%<br />
34.97%<br />
LEA<br />
Rate<br />
1.46% — —<br />
— —<br />
— —<br />
— —<br />
— —<br />
Page 3 of 5
LEA: 2803 - MARMADUKE SCHOOL <strong>DISTRICT</strong><br />
Indicator 08: Parent Involvement<br />
Percent of surveyed<br />
parents who reported<br />
school facilitated parent<br />
involvement as a means<br />
of improving services<br />
and results for children<br />
with disabilities.<br />
Early Childhood<br />
(3-5)<br />
School Age<br />
(5-21)<br />
State<br />
Rate<br />
90.47%<br />
95.05%<br />
Indicator 09: Disproportionality - Eligibility<br />
Disproportionate representation of racial<br />
and ethnic groups in special education and<br />
related services that is a result of<br />
inappropriate identification (e.g.<br />
monitoring data, review of policies,<br />
practices, and procedures under 618(d),<br />
etc.).<br />
State<br />
Rate<br />
State<br />
Target<br />
88.00%<br />
96.00%<br />
State<br />
Target<br />
0.00% 0.00%<br />
LEA<br />
Rate<br />
— —<br />
95.92%<br />
Indicator 10: Disproportionality-Child with a Disability<br />
Disproportionate representation of racial<br />
and ethnic groups in specific disability<br />
categories that is a result of inappropriate<br />
identification (e.g. monitoring data, review<br />
of policies, practices, and procedures under<br />
618(d), etc.).<br />
Indicator 11: Child Find<br />
Percent of children with<br />
parental consent to evaluate<br />
who are evaluated within<br />
the State established timeline<br />
of 60 days.<br />
Overall<br />
(3-21)<br />
Early Childhood<br />
(3-5)<br />
School Age<br />
(5-21)<br />
State<br />
Rate<br />
0.00%<br />
Indicator 12: Early Childhood Transition<br />
Percent of children referred by Part C prior to<br />
age 3, who are found eligible for Part B, and<br />
who have an IEP developed and implemented<br />
by their third birthday.<br />
Note: - - denotes not applicable<br />
State<br />
Rate<br />
99.41%<br />
99.70%<br />
98.97%<br />
State<br />
Rate<br />
State<br />
Target<br />
0.00%<br />
State<br />
Target<br />
100.00%<br />
100.00%<br />
100.00%<br />
State<br />
Target<br />
Target Met by<br />
LEA (Y/N)<br />
Y<br />
Target Met by<br />
LEA (Y/N)<br />
Y<br />
LEA<br />
Rate<br />
100.00%<br />
— —<br />
100.00%<br />
LEA<br />
Rate<br />
Target Met by<br />
LEA (Y/N)<br />
N/A<br />
N<br />
Note: The target for Indicator 09 is to have zero percent<br />
(0%) of districts identified as having disproportionate<br />
representation as a result of inappropriate<br />
identification in eligibility.<br />
Note: The target for Indicator 10 is to have zero<br />
percent (0%) of districts identified as having<br />
disproportionate representation as a result of<br />
inappropriate identification in a disability<br />
category.<br />
Target Met by<br />
LEA (Y/N)<br />
N/A<br />
Y<br />
Target Met<br />
by LEA<br />
(Y/N)<br />
99.21% 100.00% - - N/A<br />
Y<br />
Note: * Indicates a zero reponse rate for the<br />
district.<br />
Page 4 of 5
LEA: 2803 - MARMADUKE SCHOOL <strong>DISTRICT</strong><br />
Indicator 13: Secondary Transition<br />
Percent of youth with disabilities aged 16 and<br />
up with an IEP that includes coordinated,<br />
measurable, annual IEP goals and transition<br />
services that will reasonably enable the student<br />
to meet the post-secondary goals.<br />
Indicator 14: Post-School Outcomes<br />
A. Percent of youth enrolled in higher<br />
education within one year of leaving high<br />
school.<br />
State<br />
Rate<br />
State<br />
Target<br />
Note: Data for this Indicator is from the on-site monitoring of LEAs for the given year.<br />
B. Percent of youth enrolled in higher<br />
education or competitively employed<br />
within one year of leaving high school.<br />
C. Percent of youth enrolled in higher<br />
education or in some other postsecondary<br />
education or training program; or<br />
competitively employed or in some other<br />
employment within one year of leaving<br />
high school.<br />
State<br />
Rate<br />
Indicator 20: Reported Data-Timely and Accurate*<br />
District submitted<br />
required data elements<br />
on or before due dates;<br />
made revisions within<br />
the alloted reveiw<br />
periods.<br />
Accurate and Timely<br />
Data Submission<br />
Overall (3-21)<br />
Early Childhood (3-5)<br />
School Age (5-21)<br />
State<br />
Target<br />
100.00%<br />
100.00%<br />
100.00%<br />
State<br />
Target<br />
LEA<br />
Rate<br />
LEA<br />
Rate<br />
Target Met by<br />
LEA (Y/N)<br />
Target Met<br />
by LEA<br />
(Y/N)<br />
Target Met<br />
by LEA<br />
(Y/N)<br />
*Data reviewed for timely and accurate submissions included all APSCN cycle data except for personnel<br />
Note: - - denotes not applicable<br />
96.19 100.00 100.00% Y<br />
14.53<br />
State<br />
Rate<br />
49.42<br />
State<br />
Rate<br />
54.07<br />
13.00<br />
State<br />
Target<br />
49.00<br />
State<br />
Target<br />
60.00<br />
Y<br />
N/A<br />
Y<br />
— —<br />
LEA<br />
Rate<br />
— —<br />
LEA<br />
Rate<br />
— —<br />
N/A<br />
Target Met<br />
by LEA<br />
(Y/N)<br />
N/A<br />
Target Met<br />
by LEA<br />
(Y/N)<br />
N/A<br />
Page 5 of 5
<strong>ARKANSAS</strong> <strong>SPECIAL</strong> <strong>EDUCATION</strong><br />
<strong>DISTRICT</strong> <strong>ANNUAL</strong> PERFORMANCE REPORT<br />
2010/11 School Year<br />
Publication Date: March 2012<br />
Each State must have in place a State Performance Plan (SPP) to evaluate the State's efforts to meet the requirements and<br />
purposes of the implementation of the Individuals with Disabilities Education Act (IDEA). The SPP is a six-year plan, which<br />
describes Arkansas's performance on 20 indicators. The Office of Special Education Programs in the U. S. Department of<br />
Education requires that States report annually to the public on the performance of each local education agency (LEA) on 14 of<br />
20 indicators as compared with targets established by the State in the SPP. Arkansas will report indicators 1 through 14 and<br />
20 for each LEA serving children with disabilities (CWD). Any LEA not meeting targets on compliance indicators (0% for<br />
Indicators 4B, 09 & 10 and 100% for Indicators 11, 12, 13, and 20) are non-compliant with IDEA.<br />
There are no report changes for the 2010/11 school year profile; However, it is important to recognize that: .<br />
1. Indicator 01 (Graduation) is reported a year in arrear (2009/10 graduates) and is based on a four-year cohort. This<br />
means the rate is a measure of students who entered in ninth grade and graduate in four years. The calculation is a<br />
requirement under Title I of the Elementary and Secondary Education Act (ESEA).<br />
2. Indicator 02 (Drop out) is reported a year in arrear. This means the rate is a measure of students who dropped out in<br />
the 2009/10 school year. The Indicator 02 data are aligned with the Common Core of Data (CCD) requirements for<br />
grades 7-12.<br />
3. Indicator 04A and 4B (Suspension/Expulsion) is reported a year in arrear. This means the rate is a measure of<br />
students who had out-of-school suspensions and/or expulsions totaling more than 10 days.<br />
For a complete description of all the Indicators, please visit the special education website at<br />
http://arksped.k12.ar.us/sections/policy.html<br />
LEA: 2807 - GREENE COUNTY TECH SCHOOL <strong>DISTRICT</strong><br />
Indicator 01: Graduation Rates (2009/10 school year) Indicator 02: Dropout Rates (2009/10 school year)<br />
Percent of youth<br />
with IEPs<br />
graduating from<br />
high school with a<br />
regular diploma<br />
State<br />
Rate<br />
State<br />
Target<br />
75.76% 85.00%<br />
LEA<br />
Rate<br />
63.64%<br />
Target Met<br />
by LEA<br />
(Y/N)<br />
N<br />
Percent of<br />
youth with<br />
IEPs dropping<br />
out of high<br />
school<br />
State<br />
Rate<br />
Indicator 03: Assessment on Statewide Benchmark Exam (grades 3-8, 11)<br />
A) Adequate Yearly Progress<br />
n=40<br />
Literacy<br />
Mathematics<br />
Met Disability Subgroup "n"<br />
for Reporting Purposes (Y/N)<br />
State Target for % of Districts Meeting<br />
AYP for Disability Subgroup<br />
State<br />
Target<br />
3.06% 4.20%<br />
LEA<br />
Rate<br />
2.03%<br />
% of Districts Meeting AYP<br />
for Disability Subgroup<br />
Target Met by<br />
LEA (Y/N)<br />
Y<br />
Target Met by<br />
LEA(Y/N)<br />
Overall N 17.15% 6.25%<br />
NA<br />
N<br />
N<br />
Note: For a district to qualify as having a disability subgroup it must have a minimum of 40 (n=40) students with disabilities in a school building.<br />
B) Participation<br />
Participation Rate: # of<br />
CWD Tested ÷ # of CWD<br />
Enrolled in grades tested.<br />
Participation Rate: Literacy<br />
Participation Rate: Math<br />
Note: - - denotes not applicable<br />
State<br />
Rate<br />
98.78%<br />
State<br />
Target<br />
95.00%<br />
LEA<br />
Rate<br />
99.25%<br />
Target Met<br />
by LEA (Y/N)<br />
98.61% 95.00% 98.90% Y<br />
Y<br />
C) Performance Proficiency<br />
Percent of CWD Scoring<br />
Proficient or Above<br />
Proficiency Rate: Literacy<br />
Proficiency Rate:<br />
Mathematics<br />
16.00%<br />
16.00%<br />
State<br />
Rate<br />
31.49%<br />
44.86%<br />
State<br />
Target<br />
45.22%<br />
51.14%<br />
LEA<br />
Rate<br />
27.45%<br />
50.78%<br />
NA<br />
NA<br />
Target<br />
Met by<br />
LEA (Y/N)<br />
N<br />
N<br />
Page 1 of 5
LEA: 2807 - GREENE COUNTY TECH SCHOOL <strong>DISTRICT</strong><br />
Indicator 04: Out-of-School Suspensions and Expulsions (2009/10 school year)<br />
A) Suspension/Expulsion<br />
Percent difference of CWD with out-of- school suspensions and<br />
expulsions totaling greater than 10 days in a school year as<br />
compared to the same data for general education students in<br />
the district.<br />
B) Suspension/Expulsion by Race and Ethnicity<br />
Percent of districts that have: (a) a significant discrepancy, by race or<br />
ethnicity, in the rate of suspensions and expulsions of greater than 10<br />
days in a school year for children with IEPs; and (b) policies,<br />
procedures or practices that contribute to the significant discrepancy<br />
and do not comply with requirements relating to the development<br />
and implementation of IEPs, the use of positive behavioral<br />
interventions and supports, and procedural safeguards.<br />
Indicator 05: School Age (5-21) Least Restrictive Environment<br />
A) In the Regular Class 80% or more of the day<br />
Percent of CWD with<br />
IEPs receiving instruction<br />
in the regular class 80%<br />
or more of the day.<br />
State<br />
Rate<br />
State<br />
Target<br />
LEA<br />
Rate<br />
B) In the Regular Class less than 40% of the day<br />
Percent of CWD with<br />
IEPs receiving instruction<br />
in the regular class less<br />
than 60% of the day.<br />
53.87% 59.77%<br />
State<br />
Rate<br />
State<br />
Target<br />
12.42% 12.51%<br />
40.70%<br />
LEA<br />
Rate<br />
16.28%<br />
C) Other Settings outside the regular class<br />
Percent of CWD with IEPs served in<br />
public or private separate schools,<br />
residential placements, or<br />
homebound/hospital placements.<br />
State<br />
Rate<br />
State<br />
Target<br />
2.80% 2.56%<br />
Target Met<br />
by LEA (Y/N)<br />
N<br />
Target Met<br />
by LEA (Y/N)<br />
N<br />
LEA<br />
Rate<br />
0.19%<br />
Target Met<br />
by LEA(Y/N)<br />
Indicator 06: Early Childhood (3-5) Least Restrictive Environment<br />
A) Regular Early Childhood Program<br />
Percent of children (aged 3 through 5) with IEPs attending a regular<br />
early childhood program and receiving the majority of special<br />
education and related services in the regular early childhood program<br />
Allowable<br />
Difference<br />
LEA: 2807 - GREENE COUNTY TECH SCHOOL <strong>DISTRICT</strong><br />
Indicator 07: Preschool (3-5) Outcomes<br />
a) Percent of preschool CWD<br />
children who did not<br />
improve functioning.<br />
b) Percent of preschool CWD<br />
who improved but whose<br />
functioning remained below<br />
same age peers.<br />
c) Percent of preschool CWD<br />
who improved at a level<br />
nearer to same aged peers.<br />
d) Percent of preschool CWD<br />
who improved functioning to<br />
reach a level comparable to<br />
same age peers.<br />
e) Percent of preschool CWD<br />
children who maintain<br />
functioning at a level<br />
comparable to same aged<br />
peers.<br />
Summary<br />
Statements<br />
1) Of those preschool<br />
children who entered<br />
the preschool program<br />
below age expectations<br />
in each Outcome, the<br />
percent who<br />
substantially increased<br />
their rate of growth by<br />
the time they turned 6<br />
years of age or exited<br />
the program.<br />
2) The percent of<br />
preschool children who<br />
were functioning<br />
within age expectations<br />
in each Outcome by the<br />
time they turned 6<br />
years of age or exited<br />
A) Positive Social -Emotional<br />
Skills*<br />
State<br />
Rate<br />
A) Positive Social -<br />
Emotional Skills<br />
(Including social<br />
relationships)<br />
State<br />
Rate<br />
2.14%<br />
5.31%<br />
25.97%<br />
38.22%<br />
28.36%<br />
State<br />
Target<br />
LEA<br />
Rate<br />
LEA<br />
Rate<br />
0.00%<br />
0.00%<br />
0.00%<br />
0.00%<br />
0.00%<br />
Target<br />
Met by<br />
LEA(Y/N)<br />
B) Acquisition and Use of<br />
Knowledge and Skills<br />
(Including early language/<br />
communication and early literacy)<br />
B) Acquisition and Use of<br />
Knowledge and Skills **<br />
State<br />
Rate<br />
1.75%<br />
6.59%<br />
34.23%<br />
43.51%<br />
13.92%<br />
State<br />
Target<br />
LEA<br />
Rate<br />
Target<br />
Met by<br />
LEA(Y/N)<br />
C) Use of Appropriate Behaviors<br />
to Meet Their Needs<br />
State<br />
Rate<br />
State<br />
Target<br />
LEA<br />
Rate<br />
Target<br />
Met by<br />
LEA(Y/N)<br />
89.61% 90.50% — — N/A 90.31% 90.50% — — N/A 90.82% 92.50% — — N/A<br />
66.58% 69.50% — — N/A 57.43% 60.50% — — N/A 76.69% 78.50% — — N/A<br />
NOTE: * Including social relationships ** Including early language/ communication and early literacy<br />
Note: - - denotes not applicable<br />
State<br />
Rate<br />
LEA<br />
Rate<br />
0.00%<br />
0.00%<br />
0.00%<br />
0.00%<br />
0.00%<br />
C) Use of<br />
Appropriate<br />
Behaviors to<br />
Meet Their Needs<br />
State<br />
Rate<br />
4.51%<br />
17.34%<br />
41.72%<br />
34.97%<br />
LEA<br />
Rate<br />
1.46% 0.00%<br />
0.00%<br />
0.00%<br />
0.00%<br />
0.00%<br />
Page 3 of 5
LEA: 2807 - GREENE COUNTY TECH SCHOOL <strong>DISTRICT</strong><br />
Indicator 08: Parent Involvement<br />
Percent of surveyed<br />
parents who reported<br />
school facilitated parent<br />
involvement as a means<br />
of improving services<br />
and results for children<br />
with disabilities.<br />
Early Childhood<br />
(3-5)<br />
School Age<br />
(5-21)<br />
State<br />
Rate<br />
90.47%<br />
95.05%<br />
Indicator 09: Disproportionality - Eligibility<br />
Disproportionate representation of racial<br />
and ethnic groups in special education and<br />
related services that is a result of<br />
inappropriate identification (e.g.<br />
monitoring data, review of policies,<br />
practices, and procedures under 618(d),<br />
etc.).<br />
State<br />
Rate<br />
State<br />
Target<br />
88.00%<br />
96.00%<br />
State<br />
Target<br />
0.00% 0.00%<br />
LEA<br />
Rate<br />
— —<br />
— —<br />
Indicator 10: Disproportionality-Child with a Disability<br />
Disproportionate representation of racial<br />
and ethnic groups in specific disability<br />
categories that is a result of inappropriate<br />
identification (e.g. monitoring data, review<br />
of policies, practices, and procedures under<br />
618(d), etc.).<br />
Indicator 11: Child Find<br />
Percent of children with<br />
parental consent to evaluate<br />
who are evaluated within<br />
the State established timeline<br />
of 60 days.<br />
Overall<br />
(3-21)<br />
Early Childhood<br />
(3-5)<br />
School Age<br />
(5-21)<br />
State<br />
Rate<br />
0.00%<br />
Indicator 12: Early Childhood Transition<br />
Percent of children referred by Part C prior to<br />
age 3, who are found eligible for Part B, and<br />
who have an IEP developed and implemented<br />
by their third birthday.<br />
Note: - - denotes not applicable<br />
State<br />
Rate<br />
99.41%<br />
99.70%<br />
98.97%<br />
State<br />
Rate<br />
State<br />
Target<br />
0.00%<br />
State<br />
Target<br />
100.00%<br />
100.00%<br />
100.00%<br />
State<br />
Target<br />
Target Met by<br />
LEA (Y/N)<br />
Y<br />
Target Met by<br />
LEA (Y/N)<br />
Y<br />
LEA<br />
Rate<br />
100.00%<br />
100.00%<br />
100.00%<br />
LEA<br />
Rate<br />
Target Met by<br />
LEA (Y/N)<br />
N/A<br />
N<br />
Note: The target for Indicator 09 is to have zero percent<br />
(0%) of districts identified as having disproportionate<br />
representation as a result of inappropriate<br />
identification in eligibility.<br />
Note: The target for Indicator 10 is to have zero<br />
percent (0%) of districts identified as having<br />
disproportionate representation as a result of<br />
inappropriate identification in a disability<br />
category.<br />
Target Met by<br />
LEA (Y/N)<br />
Y<br />
Y<br />
Target Met<br />
by LEA<br />
(Y/N)<br />
99.21% 100.00% - - N/A<br />
Y<br />
Note: * Indicates a zero reponse rate for the<br />
district.<br />
Page 4 of 5
LEA: 2807 - GREENE COUNTY TECH SCHOOL <strong>DISTRICT</strong><br />
Indicator 13: Secondary Transition<br />
Percent of youth with disabilities aged 16 and<br />
up with an IEP that includes coordinated,<br />
measurable, annual IEP goals and transition<br />
services that will reasonably enable the student<br />
to meet the post-secondary goals.<br />
Indicator 14: Post-School Outcomes<br />
A. Percent of youth enrolled in higher<br />
education within one year of leaving high<br />
school.<br />
State<br />
Rate<br />
State<br />
Target<br />
Note: Data for this Indicator is from the on-site monitoring of LEAs for the given year.<br />
B. Percent of youth enrolled in higher<br />
education or competitively employed<br />
within one year of leaving high school.<br />
C. Percent of youth enrolled in higher<br />
education or in some other postsecondary<br />
education or training program; or<br />
competitively employed or in some other<br />
employment within one year of leaving<br />
high school.<br />
State<br />
Rate<br />
Indicator 20: Reported Data-Timely and Accurate*<br />
District submitted<br />
required data elements<br />
on or before due dates;<br />
made revisions within<br />
the alloted reveiw<br />
periods.<br />
Accurate and Timely<br />
Data Submission<br />
Overall (3-21)<br />
Early Childhood (3-5)<br />
School Age (5-21)<br />
State<br />
Target<br />
100.00%<br />
100.00%<br />
100.00%<br />
State<br />
Target<br />
LEA<br />
Rate<br />
LEA<br />
Rate<br />
Target Met by<br />
LEA (Y/N)<br />
Target Met<br />
by LEA<br />
(Y/N)<br />
Target Met<br />
by LEA<br />
(Y/N)<br />
*Data reviewed for timely and accurate submissions included all APSCN cycle data except for personnel<br />
Note: - - denotes not applicable<br />
96.19 100.00 — — N/A<br />
14.53<br />
State<br />
Rate<br />
49.42<br />
State<br />
Rate<br />
54.07<br />
13.00<br />
State<br />
Target<br />
49.00<br />
State<br />
Target<br />
60.00<br />
Y<br />
Y<br />
Y<br />
— —<br />
LEA<br />
Rate<br />
— —<br />
LEA<br />
Rate<br />
— —<br />
N/A<br />
Target Met<br />
by LEA<br />
(Y/N)<br />
N/A<br />
Target Met<br />
by LEA<br />
(Y/N)<br />
N/A<br />
Page 5 of 5
<strong>ARKANSAS</strong> <strong>SPECIAL</strong> <strong>EDUCATION</strong><br />
<strong>DISTRICT</strong> <strong>ANNUAL</strong> PERFORMANCE REPORT<br />
2010/11 School Year<br />
Publication Date: March 2012<br />
Each State must have in place a State Performance Plan (SPP) to evaluate the State's efforts to meet the requirements and<br />
purposes of the implementation of the Individuals with Disabilities Education Act (IDEA). The SPP is a six-year plan, which<br />
describes Arkansas's performance on 20 indicators. The Office of Special Education Programs in the U. S. Department of<br />
Education requires that States report annually to the public on the performance of each local education agency (LEA) on 14 of<br />
20 indicators as compared with targets established by the State in the SPP. Arkansas will report indicators 1 through 14 and<br />
20 for each LEA serving children with disabilities (CWD). Any LEA not meeting targets on compliance indicators (0% for<br />
Indicators 4B, 09 & 10 and 100% for Indicators 11, 12, 13, and 20) are non-compliant with IDEA.<br />
There are no report changes for the 2010/11 school year profile; However, it is important to recognize that: .<br />
1. Indicator 01 (Graduation) is reported a year in arrear (2009/10 graduates) and is based on a four-year cohort. This<br />
means the rate is a measure of students who entered in ninth grade and graduate in four years. The calculation is a<br />
requirement under Title I of the Elementary and Secondary Education Act (ESEA).<br />
2. Indicator 02 (Drop out) is reported a year in arrear. This means the rate is a measure of students who dropped out in<br />
the 2009/10 school year. The Indicator 02 data are aligned with the Common Core of Data (CCD) requirements for<br />
grades 7-12.<br />
3. Indicator 04A and 4B (Suspension/Expulsion) is reported a year in arrear. This means the rate is a measure of<br />
students who had out-of-school suspensions and/or expulsions totaling more than 10 days.<br />
For a complete description of all the Indicators, please visit the special education website at<br />
http://arksped.k12.ar.us/sections/policy.html<br />
LEA: 2808 - PARAGOULD SCHOOL <strong>DISTRICT</strong><br />
Indicator 01: Graduation Rates (2009/10 school year) Indicator 02: Dropout Rates (2009/10 school year)<br />
Percent of youth<br />
with IEPs<br />
graduating from<br />
high school with a<br />
regular diploma<br />
State<br />
Rate<br />
State<br />
Target<br />
75.76% 85.00%<br />
LEA<br />
Rate<br />
69.23%<br />
Target Met<br />
by LEA<br />
(Y/N)<br />
N<br />
Percent of<br />
youth with<br />
IEPs dropping<br />
out of high<br />
school<br />
State<br />
Rate<br />
Indicator 03: Assessment on Statewide Benchmark Exam (grades 3-8, 11)<br />
A) Adequate Yearly Progress<br />
n=40<br />
Literacy<br />
Mathematics<br />
Met Disability Subgroup "n"<br />
for Reporting Purposes (Y/N)<br />
State Target for % of Districts Meeting<br />
AYP for Disability Subgroup<br />
State<br />
Target<br />
3.06% 4.20%<br />
LEA<br />
Rate<br />
2.05%<br />
% of Districts Meeting AYP<br />
for Disability Subgroup<br />
Target Met by<br />
LEA (Y/N)<br />
Y<br />
Target Met by<br />
LEA(Y/N)<br />
Overall N 17.15% 6.25%<br />
NA<br />
N<br />
N<br />
Note: For a district to qualify as having a disability subgroup it must have a minimum of 40 (n=40) students with disabilities in a school building.<br />
B) Participation<br />
Participation Rate: # of<br />
CWD Tested ÷ # of CWD<br />
Enrolled in grades tested.<br />
Participation Rate: Literacy<br />
Participation Rate: Math<br />
Note: - - denotes not applicable<br />
State<br />
Rate<br />
98.78%<br />
State<br />
Target<br />
95.00%<br />
LEA<br />
Rate<br />
99.44%<br />
Target Met<br />
by LEA (Y/N)<br />
98.61% 95.00% 99.44% Y<br />
Y<br />
C) Performance Proficiency<br />
Percent of CWD Scoring<br />
Proficient or Above<br />
Proficiency Rate: Literacy<br />
Proficiency Rate:<br />
Mathematics<br />
16.00%<br />
16.00%<br />
State<br />
Rate<br />
31.49%<br />
44.86%<br />
State<br />
Target<br />
45.22%<br />
51.14%<br />
LEA<br />
Rate<br />
33.12%<br />
49.38%<br />
NA<br />
NA<br />
Target<br />
Met by<br />
LEA (Y/N)<br />
N<br />
N<br />
Page 1 of 5
LEA: 2808 - PARAGOULD SCHOOL <strong>DISTRICT</strong><br />
Indicator 04: Out-of-School Suspensions and Expulsions (2009/10 school year)<br />
A) Suspension/Expulsion<br />
Percent difference of CWD with out-of- school suspensions and<br />
expulsions totaling greater than 10 days in a school year as<br />
compared to the same data for general education students in<br />
the district.<br />
B) Suspension/Expulsion by Race and Ethnicity<br />
Percent of districts that have: (a) a significant discrepancy, by race or<br />
ethnicity, in the rate of suspensions and expulsions of greater than 10<br />
days in a school year for children with IEPs; and (b) policies,<br />
procedures or practices that contribute to the significant discrepancy<br />
and do not comply with requirements relating to the development<br />
and implementation of IEPs, the use of positive behavioral<br />
interventions and supports, and procedural safeguards.<br />
Indicator 05: School Age (5-21) Least Restrictive Environment<br />
A) In the Regular Class 80% or more of the day<br />
Percent of CWD with<br />
IEPs receiving instruction<br />
in the regular class 80%<br />
or more of the day.<br />
State<br />
Rate<br />
State<br />
Target<br />
LEA<br />
Rate<br />
B) In the Regular Class less than 40% of the day<br />
Percent of CWD with<br />
IEPs receiving instruction<br />
in the regular class less<br />
than 60% of the day.<br />
53.87% 59.77%<br />
State<br />
Rate<br />
State<br />
Target<br />
12.42% 12.51%<br />
56.02%<br />
LEA<br />
Rate<br />
10.08%<br />
C) Other Settings outside the regular class<br />
Percent of CWD with IEPs served in<br />
public or private separate schools,<br />
residential placements, or<br />
homebound/hospital placements.<br />
State<br />
Rate<br />
State<br />
Target<br />
2.80% 2.56%<br />
Target Met<br />
by LEA (Y/N)<br />
N<br />
Target Met<br />
by LEA (Y/N)<br />
Y<br />
LEA<br />
Rate<br />
0.28%<br />
Target Met<br />
by LEA(Y/N)<br />
Indicator 06: Early Childhood (3-5) Least Restrictive Environment<br />
A) Regular Early Childhood Program<br />
Percent of children (aged 3 through 5) with IEPs attending a regular<br />
early childhood program and receiving the majority of special<br />
education and related services in the regular early childhood program<br />
Allowable<br />
Difference<br />
LEA: 2808 - PARAGOULD SCHOOL <strong>DISTRICT</strong><br />
Indicator 07: Preschool (3-5) Outcomes<br />
a) Percent of preschool CWD<br />
children who did not<br />
improve functioning.<br />
b) Percent of preschool CWD<br />
who improved but whose<br />
functioning remained below<br />
same age peers.<br />
c) Percent of preschool CWD<br />
who improved at a level<br />
nearer to same aged peers.<br />
d) Percent of preschool CWD<br />
who improved functioning to<br />
reach a level comparable to<br />
same age peers.<br />
e) Percent of preschool CWD<br />
children who maintain<br />
functioning at a level<br />
comparable to same aged<br />
peers.<br />
Summary<br />
Statements<br />
1) Of those preschool<br />
children who entered<br />
the preschool program<br />
below age expectations<br />
in each Outcome, the<br />
percent who<br />
substantially increased<br />
their rate of growth by<br />
the time they turned 6<br />
years of age or exited<br />
the program.<br />
2) The percent of<br />
preschool children who<br />
were functioning<br />
within age expectations<br />
in each Outcome by the<br />
time they turned 6<br />
years of age or exited<br />
A) Positive Social -Emotional<br />
Skills*<br />
State<br />
Rate<br />
A) Positive Social -<br />
Emotional Skills<br />
(Including social<br />
relationships)<br />
State<br />
Rate<br />
2.14%<br />
5.31%<br />
25.97%<br />
38.22%<br />
28.36%<br />
State<br />
Target<br />
LEA<br />
Rate<br />
LEA<br />
Rate<br />
— —<br />
— —<br />
19.05%<br />
42.86%<br />
38.10%<br />
Target<br />
Met by<br />
LEA(Y/N)<br />
B) Acquisition and Use of<br />
Knowledge and Skills<br />
(Including early language/<br />
communication and early literacy)<br />
B) Acquisition and Use of<br />
Knowledge and Skills **<br />
State<br />
Rate<br />
1.75%<br />
6.59%<br />
34.23%<br />
43.51%<br />
13.92%<br />
State<br />
Target<br />
LEA<br />
Rate<br />
Target<br />
Met by<br />
LEA(Y/N)<br />
C) Use of Appropriate Behaviors<br />
to Meet Their Needs<br />
State<br />
Rate<br />
State<br />
Target<br />
LEA<br />
Rate<br />
Target<br />
Met by<br />
LEA(Y/N)<br />
89.61% 90.50% 100.00% Y 90.31% 90.50% 92.86% Y 90.82% 92.50% 66.67% N<br />
66.58% 69.50% 80.95% Y 57.43% 60.50% 71.43% Y 76.69% 78.50% 80.95% Y<br />
NOTE: * Including social relationships ** Including early language/ communication and early literacy<br />
Note: - - denotes not applicable<br />
State<br />
Rate<br />
LEA<br />
Rate<br />
— —<br />
4.76%<br />
23.81%<br />
38.10%<br />
33.33%<br />
C) Use of<br />
Appropriate<br />
Behaviors to<br />
Meet Their Needs<br />
State<br />
Rate<br />
4.51%<br />
17.34%<br />
41.72%<br />
34.97%<br />
LEA<br />
Rate<br />
1.46% — —<br />
14.29%<br />
4.76%<br />
23.81%<br />
57.14%<br />
Page 3 of 5
LEA: 2808 - PARAGOULD SCHOOL <strong>DISTRICT</strong><br />
Indicator 08: Parent Involvement<br />
Percent of surveyed<br />
parents who reported<br />
school facilitated parent<br />
involvement as a means<br />
of improving services<br />
and results for children<br />
with disabilities.<br />
Early Childhood<br />
(3-5)<br />
School Age<br />
(5-21)<br />
State<br />
Rate<br />
90.47%<br />
95.05%<br />
Indicator 09: Disproportionality - Eligibility<br />
Disproportionate representation of racial<br />
and ethnic groups in special education and<br />
related services that is a result of<br />
inappropriate identification (e.g.<br />
monitoring data, review of policies,<br />
practices, and procedures under 618(d),<br />
etc.).<br />
State<br />
Rate<br />
State<br />
Target<br />
88.00%<br />
96.00%<br />
State<br />
Target<br />
0.00% 0.00%<br />
LEA<br />
Rate<br />
100.00%<br />
98.75%<br />
Indicator 10: Disproportionality-Child with a Disability<br />
Disproportionate representation of racial<br />
and ethnic groups in specific disability<br />
categories that is a result of inappropriate<br />
identification (e.g. monitoring data, review<br />
of policies, practices, and procedures under<br />
618(d), etc.).<br />
Indicator 11: Child Find<br />
Percent of children with<br />
parental consent to evaluate<br />
who are evaluated within<br />
the State established timeline<br />
of 60 days.<br />
Overall<br />
(3-21)<br />
Early Childhood<br />
(3-5)<br />
School Age<br />
(5-21)<br />
State<br />
Rate<br />
0.00%<br />
Indicator 12: Early Childhood Transition<br />
Percent of children referred by Part C prior to<br />
age 3, who are found eligible for Part B, and<br />
who have an IEP developed and implemented<br />
by their third birthday.<br />
Note: - - denotes not applicable<br />
State<br />
Rate<br />
99.41%<br />
99.70%<br />
98.97%<br />
State<br />
Rate<br />
State<br />
Target<br />
0.00%<br />
State<br />
Target<br />
100.00%<br />
100.00%<br />
100.00%<br />
State<br />
Target<br />
Target Met by<br />
LEA (Y/N)<br />
Y<br />
Target Met by<br />
LEA (Y/N)<br />
Y<br />
LEA<br />
Rate<br />
100.00%<br />
100.00%<br />
100.00%<br />
LEA<br />
Rate<br />
Target Met by<br />
LEA (Y/N)<br />
Y<br />
Y<br />
Note: The target for Indicator 09 is to have zero percent<br />
(0%) of districts identified as having disproportionate<br />
representation as a result of inappropriate<br />
identification in eligibility.<br />
Note: The target for Indicator 10 is to have zero<br />
percent (0%) of districts identified as having<br />
disproportionate representation as a result of<br />
inappropriate identification in a disability<br />
category.<br />
Target Met by<br />
LEA (Y/N)<br />
Y<br />
Y<br />
Target Met<br />
by LEA<br />
(Y/N)<br />
99.21% 100.00% 100.00% Y<br />
Y<br />
Note: * Indicates a zero reponse rate for the<br />
district.<br />
Page 4 of 5
LEA: 2808 - PARAGOULD SCHOOL <strong>DISTRICT</strong><br />
Indicator 13: Secondary Transition<br />
Percent of youth with disabilities aged 16 and<br />
up with an IEP that includes coordinated,<br />
measurable, annual IEP goals and transition<br />
services that will reasonably enable the student<br />
to meet the post-secondary goals.<br />
Indicator 14: Post-School Outcomes<br />
A. Percent of youth enrolled in higher<br />
education within one year of leaving high<br />
school.<br />
State<br />
Rate<br />
State<br />
Target<br />
Note: Data for this Indicator is from the on-site monitoring of LEAs for the given year.<br />
B. Percent of youth enrolled in higher<br />
education or competitively employed<br />
within one year of leaving high school.<br />
C. Percent of youth enrolled in higher<br />
education or in some other postsecondary<br />
education or training program; or<br />
competitively employed or in some other<br />
employment within one year of leaving<br />
high school.<br />
State<br />
Rate<br />
Indicator 20: Reported Data-Timely and Accurate*<br />
District submitted<br />
required data elements<br />
on or before due dates;<br />
made revisions within<br />
the alloted reveiw<br />
periods.<br />
Accurate and Timely<br />
Data Submission<br />
Overall (3-21)<br />
Early Childhood (3-5)<br />
School Age (5-21)<br />
State<br />
Target<br />
100.00%<br />
100.00%<br />
100.00%<br />
State<br />
Target<br />
LEA<br />
Rate<br />
LEA<br />
Rate<br />
Target Met by<br />
LEA (Y/N)<br />
Target Met<br />
by LEA<br />
(Y/N)<br />
Target Met<br />
by LEA<br />
(Y/N)<br />
*Data reviewed for timely and accurate submissions included all APSCN cycle data except for personnel<br />
Note: - - denotes not applicable<br />
96.19 100.00 — — N/A<br />
14.53<br />
State<br />
Rate<br />
49.42<br />
State<br />
Rate<br />
54.07<br />
13.00<br />
State<br />
Target<br />
49.00<br />
State<br />
Target<br />
60.00<br />
Y<br />
Y<br />
Y<br />
— —<br />
LEA<br />
Rate<br />
— —<br />
LEA<br />
Rate<br />
— —<br />
N/A<br />
Target Met<br />
by LEA<br />
(Y/N)<br />
N/A<br />
Target Met<br />
by LEA<br />
(Y/N)<br />
N/A<br />
Page 5 of 5
LEA: 2901 - BLEVINS SCHOOL <strong>DISTRICT</strong><br />
<strong>ARKANSAS</strong> <strong>SPECIAL</strong> <strong>EDUCATION</strong><br />
<strong>DISTRICT</strong> <strong>ANNUAL</strong> PERFORMANCE REPORT<br />
2010/11 School Year<br />
Publication Date: March 2012<br />
Each State must have in place a State Performance Plan (SPP) to evaluate the State's efforts to meet the requirements and<br />
purposes of the implementation of the Individuals with Disabilities Education Act (IDEA). The SPP is a six-year plan, which<br />
describes Arkansas's performance on 20 indicators. The Office of Special Education Programs in the U. S. Department of<br />
Education requires that States report annually to the public on the performance of each local education agency (LEA) on 14 of<br />
20 indicators as compared with targets established by the State in the SPP. Arkansas will report indicators 1 through 14 and<br />
20 for each LEA serving children with disabilities (CWD). Any LEA not meeting targets on compliance indicators (0% for<br />
Indicators 4B, 09 & 10 and 100% for Indicators 11, 12, 13, and 20) are non-compliant with IDEA.<br />
There are no report changes for the 2010/11 school year profile; However, it is important to recognize that: .<br />
1. Indicator 01 (Graduation) is reported a year in arrear (2009/10 graduates) and is based on a four-year cohort. This<br />
means the rate is a measure of students who entered in ninth grade and graduate in four years. The calculation is a<br />
requirement under Title I of the Elementary and Secondary Education Act (ESEA).<br />
2. Indicator 02 (Drop out) is reported a year in arrear. This means the rate is a measure of students who dropped out in<br />
the 2009/10 school year. The Indicator 02 data are aligned with the Common Core of Data (CCD) requirements for<br />
grades 7-12.<br />
3. Indicator 04A and 4B (Suspension/Expulsion) is reported a year in arrear. This means the rate is a measure of<br />
students who had out-of-school suspensions and/or expulsions totaling more than 10 days.<br />
Percent of youth<br />
with IEPs<br />
graduating from<br />
high school with a<br />
regular diploma<br />
For a complete description of all the Indicators, please visit the special education website at<br />
http://arksped.k12.ar.us/sections/policy.html<br />
Indicator 01: Graduation Rates (2009/10 school year) Indicator 02: Dropout Rates (2009/10 school year)<br />
State<br />
Rate<br />
State<br />
Target<br />
75.76% 85.00%<br />
LEA<br />
Rate<br />
71.43%<br />
Target Met<br />
by LEA<br />
(Y/N)<br />
N<br />
Percent of<br />
youth with<br />
IEPs dropping<br />
out of high<br />
school<br />
State<br />
Rate<br />
Indicator 03: Assessment on Statewide Benchmark Exam (grades 3-8, 11)<br />
A) Adequate Yearly Progress<br />
n=40<br />
Literacy<br />
Mathematics<br />
Met Disability Subgroup "n"<br />
for Reporting Purposes (Y/N)<br />
State Target for % of Districts Meeting<br />
AYP for Disability Subgroup<br />
State<br />
Target<br />
3.06% 4.20%<br />
LEA<br />
Rate<br />
9.52%<br />
% of Districts Meeting AYP<br />
for Disability Subgroup<br />
Target Met by<br />
LEA (Y/N)<br />
N<br />
Target Met by<br />
LEA(Y/N)<br />
Overall N 17.15% 6.25%<br />
NA<br />
N<br />
N<br />
Note: For a district to qualify as having a disability subgroup it must have a minimum of 40 (n=40) students with disabilities in a school building.<br />
B) Participation<br />
Participation Rate: # of<br />
CWD Tested ÷ # of CWD<br />
Enrolled in grades tested.<br />
Participation Rate: Literacy<br />
Participation Rate: Math<br />
Note: - - denotes not applicable<br />
State<br />
Rate<br />
98.78%<br />
State<br />
Target<br />
95.00%<br />
LEA<br />
Rate<br />
100.00%<br />
Target Met<br />
by LEA (Y/N)<br />
98.61% 95.00% 96.36% Y<br />
Y<br />
C) Performance Proficiency<br />
Percent of CWD Scoring<br />
Proficient or Above<br />
Proficiency Rate: Literacy<br />
Proficiency Rate:<br />
Mathematics<br />
16.00%<br />
16.00%<br />
State<br />
Rate<br />
31.49%<br />
44.86%<br />
State<br />
Target<br />
45.22%<br />
51.14%<br />
LEA<br />
Rate<br />
25.58%<br />
23.40%<br />
NA<br />
NA<br />
Target<br />
Met by<br />
LEA (Y/N)<br />
N<br />
N<br />
Page 1 of 5
LEA: 2901 - BLEVINS SCHOOL <strong>DISTRICT</strong><br />
Indicator 04: Out-of-School Suspensions and Expulsions (2009/10 school year)<br />
A) Suspension/Expulsion<br />
Percent difference of CWD with out-of- school suspensions and<br />
expulsions totaling greater than 10 days in a school year as<br />
compared to the same data for general education students in<br />
the district.<br />
B) Suspension/Expulsion by Race and Ethnicity<br />
Percent of districts that have: (a) a significant discrepancy, by race or<br />
ethnicity, in the rate of suspensions and expulsions of greater than 10<br />
days in a school year for children with IEPs; and (b) policies,<br />
procedures or practices that contribute to the significant discrepancy<br />
and do not comply with requirements relating to the development<br />
and implementation of IEPs, the use of positive behavioral<br />
interventions and supports, and procedural safeguards.<br />
Indicator 05: School Age (5-21) Least Restrictive Environment<br />
A) In the Regular Class 80% or more of the day<br />
Percent of CWD with<br />
IEPs receiving instruction<br />
in the regular class 80%<br />
or more of the day.<br />
State<br />
Rate<br />
State<br />
Target<br />
LEA<br />
Rate<br />
B) In the Regular Class less than 40% of the day<br />
Percent of CWD with<br />
IEPs receiving instruction<br />
in the regular class less<br />
than 60% of the day.<br />
53.87% 59.77%<br />
State<br />
Rate<br />
State<br />
Target<br />
12.42% 12.51%<br />
65.38%<br />
LEA<br />
Rate<br />
19.23%<br />
C) Other Settings outside the regular class<br />
Percent of CWD with IEPs served in<br />
public or private separate schools,<br />
residential placements, or<br />
homebound/hospital placements.<br />
State<br />
Rate<br />
State<br />
Target<br />
2.80% 2.56%<br />
Target Met<br />
by LEA (Y/N)<br />
Y<br />
Target Met<br />
by LEA (Y/N)<br />
N<br />
LEA<br />
Rate<br />
0.00%<br />
Target Met<br />
by LEA(Y/N)<br />
Indicator 06: Early Childhood (3-5) Least Restrictive Environment<br />
A) Regular Early Childhood Program<br />
Percent of children (aged 3 through 5) with IEPs attending a regular<br />
early childhood program and receiving the majority of special<br />
education and related services in the regular early childhood program<br />
Allowable<br />
Difference<br />
LEA: 2901 - BLEVINS SCHOOL <strong>DISTRICT</strong><br />
Indicator 07: Preschool (3-5) Outcomes<br />
a) Percent of preschool CWD<br />
children who did not<br />
improve functioning.<br />
b) Percent of preschool CWD<br />
who improved but whose<br />
functioning remained below<br />
same age peers.<br />
c) Percent of preschool CWD<br />
who improved at a level<br />
nearer to same aged peers.<br />
d) Percent of preschool CWD<br />
who improved functioning to<br />
reach a level comparable to<br />
same age peers.<br />
e) Percent of preschool CWD<br />
children who maintain<br />
functioning at a level<br />
comparable to same aged<br />
peers.<br />
Summary<br />
Statements<br />
1) Of those preschool<br />
children who entered<br />
the preschool program<br />
below age expectations<br />
in each Outcome, the<br />
percent who<br />
substantially increased<br />
their rate of growth by<br />
the time they turned 6<br />
years of age or exited<br />
the program.<br />
2) The percent of<br />
preschool children who<br />
were functioning<br />
within age expectations<br />
in each Outcome by the<br />
time they turned 6<br />
years of age or exited<br />
A) Positive Social -Emotional<br />
Skills*<br />
State<br />
Rate<br />
A) Positive Social -<br />
Emotional Skills<br />
(Including social<br />
relationships)<br />
State<br />
Rate<br />
2.14%<br />
5.31%<br />
25.97%<br />
38.22%<br />
28.36%<br />
State<br />
Target<br />
LEA<br />
Rate<br />
LEA<br />
Rate<br />
— —<br />
— —<br />
— —<br />
— —<br />
— —<br />
Target<br />
Met by<br />
LEA(Y/N)<br />
B) Acquisition and Use of<br />
Knowledge and Skills<br />
(Including early language/<br />
communication and early literacy)<br />
B) Acquisition and Use of<br />
Knowledge and Skills **<br />
State<br />
Rate<br />
1.75%<br />
6.59%<br />
34.23%<br />
43.51%<br />
13.92%<br />
State<br />
Target<br />
LEA<br />
Rate<br />
Target<br />
Met by<br />
LEA(Y/N)<br />
C) Use of Appropriate Behaviors<br />
to Meet Their Needs<br />
State<br />
Rate<br />
State<br />
Target<br />
LEA<br />
Rate<br />
Target<br />
Met by<br />
LEA(Y/N)<br />
89.61% 90.50% — — N/A 90.31% 90.50% — — N/A 90.82% 92.50% — — N/A<br />
66.58% 69.50% — — N/A 57.43% 60.50% — — N/A 76.69% 78.50% — — N/A<br />
NOTE: * Including social relationships ** Including early language/ communication and early literacy<br />
Note: - - denotes not applicable<br />
State<br />
Rate<br />
LEA<br />
Rate<br />
— —<br />
— —<br />
— —<br />
— —<br />
— —<br />
C) Use of<br />
Appropriate<br />
Behaviors to<br />
Meet Their Needs<br />
State<br />
Rate<br />
4.51%<br />
17.34%<br />
41.72%<br />
34.97%<br />
LEA<br />
Rate<br />
1.46% — —<br />
— —<br />
— —<br />
— —<br />
— —<br />
Page 3 of 5
LEA: 2901 - BLEVINS SCHOOL <strong>DISTRICT</strong><br />
Indicator 08: Parent Involvement<br />
Percent of surveyed<br />
parents who reported<br />
school facilitated parent<br />
involvement as a means<br />
of improving services<br />
and results for children<br />
with disabilities.<br />
Early Childhood<br />
(3-5)<br />
School Age<br />
(5-21)<br />
State<br />
Rate<br />
90.47%<br />
95.05%<br />
Indicator 09: Disproportionality - Eligibility<br />
Disproportionate representation of racial<br />
and ethnic groups in special education and<br />
related services that is a result of<br />
inappropriate identification (e.g.<br />
monitoring data, review of policies,<br />
practices, and procedures under 618(d),<br />
etc.).<br />
State<br />
Rate<br />
State<br />
Target<br />
88.00%<br />
96.00%<br />
State<br />
Target<br />
0.00% 0.00%<br />
LEA<br />
Rate<br />
— —<br />
100.00%<br />
Indicator 10: Disproportionality-Child with a Disability<br />
Disproportionate representation of racial<br />
and ethnic groups in specific disability<br />
categories that is a result of inappropriate<br />
identification (e.g. monitoring data, review<br />
of policies, practices, and procedures under<br />
618(d), etc.).<br />
Indicator 11: Child Find<br />
Percent of children with<br />
parental consent to evaluate<br />
who are evaluated within<br />
the State established timeline<br />
of 60 days.<br />
Overall<br />
(3-21)<br />
Early Childhood<br />
(3-5)<br />
School Age<br />
(5-21)<br />
State<br />
Rate<br />
0.00%<br />
Indicator 12: Early Childhood Transition<br />
Percent of children referred by Part C prior to<br />
age 3, who are found eligible for Part B, and<br />
who have an IEP developed and implemented<br />
by their third birthday.<br />
Note: - - denotes not applicable<br />
State<br />
Rate<br />
99.41%<br />
99.70%<br />
98.97%<br />
State<br />
Rate<br />
State<br />
Target<br />
0.00%<br />
State<br />
Target<br />
100.00%<br />
100.00%<br />
100.00%<br />
State<br />
Target<br />
Target Met by<br />
LEA (Y/N)<br />
Y<br />
Target Met by<br />
LEA (Y/N)<br />
Y<br />
LEA<br />
Rate<br />
100.00%<br />
— —<br />
100.00%<br />
LEA<br />
Rate<br />
Target Met by<br />
LEA (Y/N)<br />
N/A<br />
Y<br />
Note: The target for Indicator 09 is to have zero percent<br />
(0%) of districts identified as having disproportionate<br />
representation as a result of inappropriate<br />
identification in eligibility.<br />
Note: The target for Indicator 10 is to have zero<br />
percent (0%) of districts identified as having<br />
disproportionate representation as a result of<br />
inappropriate identification in a disability<br />
category.<br />
Target Met by<br />
LEA (Y/N)<br />
N/A<br />
Y<br />
Target Met<br />
by LEA<br />
(Y/N)<br />
99.21% 100.00% - - N/A<br />
Y<br />
Note: * Indicates a zero reponse rate for the<br />
district.<br />
Page 4 of 5
LEA: 2901 - BLEVINS SCHOOL <strong>DISTRICT</strong><br />
Indicator 13: Secondary Transition<br />
Percent of youth with disabilities aged 16 and<br />
up with an IEP that includes coordinated,<br />
measurable, annual IEP goals and transition<br />
services that will reasonably enable the student<br />
to meet the post-secondary goals.<br />
Indicator 14: Post-School Outcomes<br />
A. Percent of youth enrolled in higher<br />
education within one year of leaving high<br />
school.<br />
State<br />
Rate<br />
State<br />
Target<br />
Note: Data for this Indicator is from the on-site monitoring of LEAs for the given year.<br />
B. Percent of youth enrolled in higher<br />
education or competitively employed<br />
within one year of leaving high school.<br />
C. Percent of youth enrolled in higher<br />
education or in some other postsecondary<br />
education or training program; or<br />
competitively employed or in some other<br />
employment within one year of leaving<br />
high school.<br />
State<br />
Rate<br />
Indicator 20: Reported Data-Timely and Accurate*<br />
District submitted<br />
required data elements<br />
on or before due dates;<br />
made revisions within<br />
the alloted reveiw<br />
periods.<br />
Accurate and Timely<br />
Data Submission<br />
Overall (3-21)<br />
Early Childhood (3-5)<br />
School Age (5-21)<br />
State<br />
Target<br />
100.00%<br />
100.00%<br />
100.00%<br />
State<br />
Target<br />
LEA<br />
Rate<br />
LEA<br />
Rate<br />
Target Met by<br />
LEA (Y/N)<br />
Target Met<br />
by LEA<br />
(Y/N)<br />
Target Met<br />
by LEA<br />
(Y/N)<br />
*Data reviewed for timely and accurate submissions included all APSCN cycle data except for personnel<br />
Note: - - denotes not applicable<br />
96.19 100.00 — — N/A<br />
14.53<br />
State<br />
Rate<br />
49.42<br />
State<br />
Rate<br />
54.07<br />
13.00<br />
State<br />
Target<br />
49.00<br />
State<br />
Target<br />
60.00<br />
Y<br />
N/A<br />
Y<br />
— —<br />
LEA<br />
Rate<br />
— —<br />
LEA<br />
Rate<br />
— —<br />
N/A<br />
Target Met<br />
by LEA<br />
(Y/N)<br />
N/A<br />
Target Met<br />
by LEA<br />
(Y/N)<br />
N/A<br />
Page 5 of 5
LEA: 2903 - HOPE SCHOOL <strong>DISTRICT</strong><br />
<strong>ARKANSAS</strong> <strong>SPECIAL</strong> <strong>EDUCATION</strong><br />
<strong>DISTRICT</strong> <strong>ANNUAL</strong> PERFORMANCE REPORT<br />
2010/11 School Year<br />
Publication Date: March 2012<br />
Each State must have in place a State Performance Plan (SPP) to evaluate the State's efforts to meet the requirements and<br />
purposes of the implementation of the Individuals with Disabilities Education Act (IDEA). The SPP is a six-year plan, which<br />
describes Arkansas's performance on 20 indicators. The Office of Special Education Programs in the U. S. Department of<br />
Education requires that States report annually to the public on the performance of each local education agency (LEA) on 14 of<br />
20 indicators as compared with targets established by the State in the SPP. Arkansas will report indicators 1 through 14 and<br />
20 for each LEA serving children with disabilities (CWD). Any LEA not meeting targets on compliance indicators (0% for<br />
Indicators 4B, 09 & 10 and 100% for Indicators 11, 12, 13, and 20) are non-compliant with IDEA.<br />
There are no report changes for the 2010/11 school year profile; However, it is important to recognize that: .<br />
1. Indicator 01 (Graduation) is reported a year in arrear (2009/10 graduates) and is based on a four-year cohort. This<br />
means the rate is a measure of students who entered in ninth grade and graduate in four years. The calculation is a<br />
requirement under Title I of the Elementary and Secondary Education Act (ESEA).<br />
2. Indicator 02 (Drop out) is reported a year in arrear. This means the rate is a measure of students who dropped out in<br />
the 2009/10 school year. The Indicator 02 data are aligned with the Common Core of Data (CCD) requirements for<br />
grades 7-12.<br />
3. Indicator 04A and 4B (Suspension/Expulsion) is reported a year in arrear. This means the rate is a measure of<br />
students who had out-of-school suspensions and/or expulsions totaling more than 10 days.<br />
Percent of youth<br />
with IEPs<br />
graduating from<br />
high school with a<br />
regular diploma<br />
For a complete description of all the Indicators, please visit the special education website at<br />
http://arksped.k12.ar.us/sections/policy.html<br />
Indicator 01: Graduation Rates (2009/10 school year) Indicator 02: Dropout Rates (2009/10 school year)<br />
State<br />
Rate<br />
State<br />
Target<br />
75.76% 85.00%<br />
LEA<br />
Rate<br />
94.74%<br />
Target Met<br />
by LEA<br />
(Y/N)<br />
Y<br />
Percent of<br />
youth with<br />
IEPs dropping<br />
out of high<br />
school<br />
State<br />
Rate<br />
Indicator 03: Assessment on Statewide Benchmark Exam (grades 3-8, 11)<br />
A) Adequate Yearly Progress<br />
n=40<br />
Literacy<br />
Mathematics<br />
Met Disability Subgroup "n"<br />
for Reporting Purposes (Y/N)<br />
State Target for % of Districts Meeting<br />
AYP for Disability Subgroup<br />
State<br />
Target<br />
3.06% 4.20%<br />
LEA<br />
Rate<br />
1.15%<br />
% of Districts Meeting AYP<br />
for Disability Subgroup<br />
Target Met by<br />
LEA (Y/N)<br />
Y<br />
Target Met by<br />
LEA(Y/N)<br />
Overall N 17.15% 6.25%<br />
NA<br />
N<br />
N<br />
Note: For a district to qualify as having a disability subgroup it must have a minimum of 40 (n=40) students with disabilities in a school building.<br />
B) Participation<br />
Participation Rate: # of<br />
CWD Tested ÷ # of CWD<br />
Enrolled in grades tested.<br />
Participation Rate: Literacy<br />
Participation Rate: Math<br />
Note: - - denotes not applicable<br />
State<br />
Rate<br />
98.78%<br />
State<br />
Target<br />
95.00%<br />
LEA<br />
Rate<br />
100.00%<br />
Target Met<br />
by LEA (Y/N)<br />
98.61% 95.00% 98.15% Y<br />
Y<br />
C) Performance Proficiency<br />
Percent of CWD Scoring<br />
Proficient or Above<br />
Proficiency Rate: Literacy<br />
Proficiency Rate:<br />
Mathematics<br />
16.00%<br />
16.00%<br />
State<br />
Rate<br />
31.49%<br />
44.86%<br />
State<br />
Target<br />
45.22%<br />
51.14%<br />
LEA<br />
Rate<br />
10.40%<br />
17.93%<br />
NA<br />
NA<br />
Target<br />
Met by<br />
LEA (Y/N)<br />
N<br />
N<br />
Page 1 of 5
LEA: 2903 - HOPE SCHOOL <strong>DISTRICT</strong><br />
Indicator 04: Out-of-School Suspensions and Expulsions (2009/10 school year)<br />
A) Suspension/Expulsion<br />
Percent difference of CWD with out-of- school suspensions and<br />
expulsions totaling greater than 10 days in a school year as<br />
compared to the same data for general education students in<br />
the district.<br />
B) Suspension/Expulsion by Race and Ethnicity<br />
Percent of districts that have: (a) a significant discrepancy, by race or<br />
ethnicity, in the rate of suspensions and expulsions of greater than 10<br />
days in a school year for children with IEPs; and (b) policies,<br />
procedures or practices that contribute to the significant discrepancy<br />
and do not comply with requirements relating to the development<br />
and implementation of IEPs, the use of positive behavioral<br />
interventions and supports, and procedural safeguards.<br />
Indicator 05: School Age (5-21) Least Restrictive Environment<br />
A) In the Regular Class 80% or more of the day<br />
Percent of CWD with<br />
IEPs receiving instruction<br />
in the regular class 80%<br />
or more of the day.<br />
State<br />
Rate<br />
State<br />
Target<br />
LEA<br />
Rate<br />
B) In the Regular Class less than 40% of the day<br />
Percent of CWD with<br />
IEPs receiving instruction<br />
in the regular class less<br />
than 60% of the day.<br />
53.87% 59.77%<br />
State<br />
Rate<br />
State<br />
Target<br />
12.42% 12.51%<br />
83.69%<br />
LEA<br />
Rate<br />
7.80%<br />
C) Other Settings outside the regular class<br />
Percent of CWD with IEPs served in<br />
public or private separate schools,<br />
residential placements, or<br />
homebound/hospital placements.<br />
State<br />
Rate<br />
State<br />
Target<br />
2.80% 2.56%<br />
Target Met<br />
by LEA (Y/N)<br />
Y<br />
Target Met<br />
by LEA (Y/N)<br />
Y<br />
LEA<br />
Rate<br />
0.35%<br />
Target Met<br />
by LEA(Y/N)<br />
Indicator 06: Early Childhood (3-5) Least Restrictive Environment<br />
A) Regular Early Childhood Program<br />
Percent of children (aged 3 through 5) with IEPs attending a regular<br />
early childhood program and receiving the majority of special<br />
education and related services in the regular early childhood program<br />
Allowable<br />
Difference<br />
LEA: 2903 - HOPE SCHOOL <strong>DISTRICT</strong><br />
Indicator 07: Preschool (3-5) Outcomes<br />
a) Percent of preschool CWD<br />
children who did not<br />
improve functioning.<br />
b) Percent of preschool CWD<br />
who improved but whose<br />
functioning remained below<br />
same age peers.<br />
c) Percent of preschool CWD<br />
who improved at a level<br />
nearer to same aged peers.<br />
d) Percent of preschool CWD<br />
who improved functioning to<br />
reach a level comparable to<br />
same age peers.<br />
e) Percent of preschool CWD<br />
children who maintain<br />
functioning at a level<br />
comparable to same aged<br />
peers.<br />
Summary<br />
Statements<br />
1) Of those preschool<br />
children who entered<br />
the preschool program<br />
below age expectations<br />
in each Outcome, the<br />
percent who<br />
substantially increased<br />
their rate of growth by<br />
the time they turned 6<br />
years of age or exited<br />
the program.<br />
2) The percent of<br />
preschool children who<br />
were functioning<br />
within age expectations<br />
in each Outcome by the<br />
time they turned 6<br />
years of age or exited<br />
A) Positive Social -Emotional<br />
Skills*<br />
State<br />
Rate<br />
A) Positive Social -<br />
Emotional Skills<br />
(Including social<br />
relationships)<br />
State<br />
Rate<br />
2.14%<br />
5.31%<br />
25.97%<br />
38.22%<br />
28.36%<br />
State<br />
Target<br />
LEA<br />
Rate<br />
LEA<br />
Rate<br />
— —<br />
— —<br />
— —<br />
— —<br />
— —<br />
Target<br />
Met by<br />
LEA(Y/N)<br />
B) Acquisition and Use of<br />
Knowledge and Skills<br />
(Including early language/<br />
communication and early literacy)<br />
B) Acquisition and Use of<br />
Knowledge and Skills **<br />
State<br />
Rate<br />
1.75%<br />
6.59%<br />
34.23%<br />
43.51%<br />
13.92%<br />
State<br />
Target<br />
LEA<br />
Rate<br />
Target<br />
Met by<br />
LEA(Y/N)<br />
C) Use of Appropriate Behaviors<br />
to Meet Their Needs<br />
State<br />
Rate<br />
State<br />
Target<br />
LEA<br />
Rate<br />
Target<br />
Met by<br />
LEA(Y/N)<br />
89.61% 90.50% — — N/A 90.31% 90.50% — — N/A 90.82% 92.50% — — N/A<br />
66.58% 69.50% — — N/A 57.43% 60.50% — — N/A 76.69% 78.50% — — N/A<br />
NOTE: * Including social relationships ** Including early language/ communication and early literacy<br />
Note: - - denotes not applicable<br />
State<br />
Rate<br />
LEA<br />
Rate<br />
— —<br />
— —<br />
— —<br />
— —<br />
— —<br />
C) Use of<br />
Appropriate<br />
Behaviors to<br />
Meet Their Needs<br />
State<br />
Rate<br />
4.51%<br />
17.34%<br />
41.72%<br />
34.97%<br />
LEA<br />
Rate<br />
1.46% — —<br />
— —<br />
— —<br />
— —<br />
— —<br />
Page 3 of 5
LEA: 2903 - HOPE SCHOOL <strong>DISTRICT</strong><br />
Indicator 08: Parent Involvement<br />
Percent of surveyed<br />
parents who reported<br />
school facilitated parent<br />
involvement as a means<br />
of improving services<br />
and results for children<br />
with disabilities.<br />
Early Childhood<br />
(3-5)<br />
School Age<br />
(5-21)<br />
State<br />
Rate<br />
90.47%<br />
95.05%<br />
Indicator 09: Disproportionality - Eligibility<br />
Disproportionate representation of racial<br />
and ethnic groups in special education and<br />
related services that is a result of<br />
inappropriate identification (e.g.<br />
monitoring data, review of policies,<br />
practices, and procedures under 618(d),<br />
etc.).<br />
State<br />
Rate<br />
State<br />
Target<br />
88.00%<br />
96.00%<br />
State<br />
Target<br />
0.00% 0.00%<br />
LEA<br />
Rate<br />
— —<br />
95.15%<br />
Indicator 10: Disproportionality-Child with a Disability<br />
Disproportionate representation of racial<br />
and ethnic groups in specific disability<br />
categories that is a result of inappropriate<br />
identification (e.g. monitoring data, review<br />
of policies, practices, and procedures under<br />
618(d), etc.).<br />
Indicator 11: Child Find<br />
Percent of children with<br />
parental consent to evaluate<br />
who are evaluated within<br />
the State established timeline<br />
of 60 days.<br />
Overall<br />
(3-21)<br />
Early Childhood<br />
(3-5)<br />
School Age<br />
(5-21)<br />
State<br />
Rate<br />
0.00%<br />
Indicator 12: Early Childhood Transition<br />
Percent of children referred by Part C prior to<br />
age 3, who are found eligible for Part B, and<br />
who have an IEP developed and implemented<br />
by their third birthday.<br />
Note: - - denotes not applicable<br />
State<br />
Rate<br />
99.41%<br />
99.70%<br />
98.97%<br />
State<br />
Rate<br />
State<br />
Target<br />
0.00%<br />
State<br />
Target<br />
100.00%<br />
100.00%<br />
100.00%<br />
State<br />
Target<br />
Target Met by<br />
LEA (Y/N)<br />
Y<br />
Target Met by<br />
LEA (Y/N)<br />
Y<br />
LEA<br />
Rate<br />
100.00%<br />
— —<br />
100.00%<br />
LEA<br />
Rate<br />
Target Met by<br />
LEA (Y/N)<br />
N/A<br />
N<br />
Note: The target for Indicator 09 is to have zero percent<br />
(0%) of districts identified as having disproportionate<br />
representation as a result of inappropriate<br />
identification in eligibility.<br />
Note: The target for Indicator 10 is to have zero<br />
percent (0%) of districts identified as having<br />
disproportionate representation as a result of<br />
inappropriate identification in a disability<br />
category.<br />
Target Met by<br />
LEA (Y/N)<br />
N/A<br />
Y<br />
Target Met<br />
by LEA<br />
(Y/N)<br />
99.21% 100.00% - - N/A<br />
Y<br />
Note: * Indicates a zero reponse rate for the<br />
district.<br />
Page 4 of 5
LEA: 2903 - HOPE SCHOOL <strong>DISTRICT</strong><br />
Indicator 13: Secondary Transition<br />
Percent of youth with disabilities aged 16 and<br />
up with an IEP that includes coordinated,<br />
measurable, annual IEP goals and transition<br />
services that will reasonably enable the student<br />
to meet the post-secondary goals.<br />
Indicator 14: Post-School Outcomes<br />
A. Percent of youth enrolled in higher<br />
education within one year of leaving high<br />
school.<br />
State<br />
Rate<br />
State<br />
Target<br />
Note: Data for this Indicator is from the on-site monitoring of LEAs for the given year.<br />
B. Percent of youth enrolled in higher<br />
education or competitively employed<br />
within one year of leaving high school.<br />
C. Percent of youth enrolled in higher<br />
education or in some other postsecondary<br />
education or training program; or<br />
competitively employed or in some other<br />
employment within one year of leaving<br />
high school.<br />
State<br />
Rate<br />
Indicator 20: Reported Data-Timely and Accurate*<br />
District submitted<br />
required data elements<br />
on or before due dates;<br />
made revisions within<br />
the alloted reveiw<br />
periods.<br />
Accurate and Timely<br />
Data Submission<br />
Overall (3-21)<br />
Early Childhood (3-5)<br />
School Age (5-21)<br />
State<br />
Target<br />
100.00%<br />
100.00%<br />
100.00%<br />
State<br />
Target<br />
LEA<br />
Rate<br />
LEA<br />
Rate<br />
Target Met by<br />
LEA (Y/N)<br />
Target Met<br />
by LEA<br />
(Y/N)<br />
Target Met<br />
by LEA<br />
(Y/N)<br />
*Data reviewed for timely and accurate submissions included all APSCN cycle data except for personnel<br />
Note: - - denotes not applicable<br />
96.19 100.00 — — N/A<br />
14.53<br />
State<br />
Rate<br />
49.42<br />
State<br />
Rate<br />
54.07<br />
13.00<br />
State<br />
Target<br />
49.00<br />
State<br />
Target<br />
60.00<br />
Y<br />
N/A<br />
Y<br />
— —<br />
LEA<br />
Rate<br />
— —<br />
LEA<br />
Rate<br />
— —<br />
N/A<br />
Target Met<br />
by LEA<br />
(Y/N)<br />
N/A<br />
Target Met<br />
by LEA<br />
(Y/N)<br />
N/A<br />
Page 5 of 5
<strong>ARKANSAS</strong> <strong>SPECIAL</strong> <strong>EDUCATION</strong><br />
<strong>DISTRICT</strong> <strong>ANNUAL</strong> PERFORMANCE REPORT<br />
2010/11 School Year<br />
Publication Date: March 2012<br />
Each State must have in place a State Performance Plan (SPP) to evaluate the State's efforts to meet the requirements and<br />
purposes of the implementation of the Individuals with Disabilities Education Act (IDEA). The SPP is a six-year plan, which<br />
describes Arkansas's performance on 20 indicators. The Office of Special Education Programs in the U. S. Department of<br />
Education requires that States report annually to the public on the performance of each local education agency (LEA) on 14 of<br />
20 indicators as compared with targets established by the State in the SPP. Arkansas will report indicators 1 through 14 and<br />
20 for each LEA serving children with disabilities (CWD). Any LEA not meeting targets on compliance indicators (0% for<br />
Indicators 4B, 09 & 10 and 100% for Indicators 11, 12, 13, and 20) are non-compliant with IDEA.<br />
There are no report changes for the 2010/11 school year profile; However, it is important to recognize that: .<br />
1. Indicator 01 (Graduation) is reported a year in arrear (2009/10 graduates) and is based on a four-year cohort. This<br />
means the rate is a measure of students who entered in ninth grade and graduate in four years. The calculation is a<br />
requirement under Title I of the Elementary and Secondary Education Act (ESEA).<br />
2. Indicator 02 (Drop out) is reported a year in arrear. This means the rate is a measure of students who dropped out in<br />
the 2009/10 school year. The Indicator 02 data are aligned with the Common Core of Data (CCD) requirements for<br />
grades 7-12.<br />
3. Indicator 04A and 4B (Suspension/Expulsion) is reported a year in arrear. This means the rate is a measure of<br />
students who had out-of-school suspensions and/or expulsions totaling more than 10 days.<br />
For a complete description of all the Indicators, please visit the special education website at<br />
http://arksped.k12.ar.us/sections/policy.html<br />
LEA: 2906 - SPRING HILL SCHOOL <strong>DISTRICT</strong><br />
Indicator 01: Graduation Rates (2009/10 school year) Indicator 02: Dropout Rates (2009/10 school year)<br />
Percent of youth<br />
with IEPs<br />
graduating from<br />
high school with a<br />
regular diploma<br />
State<br />
Rate<br />
State<br />
Target<br />
75.76% 85.00%<br />
LEA<br />
Rate<br />
60.00%<br />
Target Met<br />
by LEA<br />
(Y/N)<br />
N<br />
Percent of<br />
youth with<br />
IEPs dropping<br />
out of high<br />
school<br />
State<br />
Rate<br />
Indicator 03: Assessment on Statewide Benchmark Exam (grades 3-8, 11)<br />
A) Adequate Yearly Progress<br />
n=40<br />
Literacy<br />
Mathematics<br />
Met Disability Subgroup "n"<br />
for Reporting Purposes (Y/N)<br />
State Target for % of Districts Meeting<br />
AYP for Disability Subgroup<br />
State<br />
Target<br />
3.06% 4.20%<br />
LEA<br />
Rate<br />
0.00%<br />
% of Districts Meeting AYP<br />
for Disability Subgroup<br />
Target Met by<br />
LEA (Y/N)<br />
Y<br />
Target Met by<br />
LEA(Y/N)<br />
Overall N 17.15% 6.25%<br />
NA<br />
N<br />
N<br />
Note: For a district to qualify as having a disability subgroup it must have a minimum of 40 (n=40) students with disabilities in a school building.<br />
B) Participation<br />
Participation Rate: # of<br />
CWD Tested ÷ # of CWD<br />
Enrolled in grades tested.<br />
Participation Rate: Literacy<br />
Participation Rate: Math<br />
Note: - - denotes not applicable<br />
State<br />
Rate<br />
98.78%<br />
State<br />
Target<br />
95.00%<br />
LEA<br />
Rate<br />
100.00%<br />
Target Met<br />
by LEA (Y/N)<br />
98.61% 95.00% 100.00% Y<br />
Y<br />
C) Performance Proficiency<br />
Percent of CWD Scoring<br />
Proficient or Above<br />
Proficiency Rate: Literacy<br />
Proficiency Rate:<br />
Mathematics<br />
16.00%<br />
16.00%<br />
State<br />
Rate<br />
31.49%<br />
44.86%<br />
State<br />
Target<br />
45.22%<br />
51.14%<br />
LEA<br />
Rate<br />
18.75%<br />
50.00%<br />
NA<br />
NA<br />
Target<br />
Met by<br />
LEA (Y/N)<br />
N<br />
N<br />
Page 1 of 5
LEA: 2906 - SPRING HILL SCHOOL <strong>DISTRICT</strong><br />
Indicator 04: Out-of-School Suspensions and Expulsions (2009/10 school year)<br />
A) Suspension/Expulsion<br />
Percent difference of CWD with out-of- school suspensions and<br />
expulsions totaling greater than 10 days in a school year as<br />
compared to the same data for general education students in<br />
the district.<br />
B) Suspension/Expulsion by Race and Ethnicity<br />
Percent of districts that have: (a) a significant discrepancy, by race or<br />
ethnicity, in the rate of suspensions and expulsions of greater than 10<br />
days in a school year for children with IEPs; and (b) policies,<br />
procedures or practices that contribute to the significant discrepancy<br />
and do not comply with requirements relating to the development<br />
and implementation of IEPs, the use of positive behavioral<br />
interventions and supports, and procedural safeguards.<br />
Indicator 05: School Age (5-21) Least Restrictive Environment<br />
A) In the Regular Class 80% or more of the day<br />
Percent of CWD with<br />
IEPs receiving instruction<br />
in the regular class 80%<br />
or more of the day.<br />
State<br />
Rate<br />
State<br />
Target<br />
LEA<br />
Rate<br />
B) In the Regular Class less than 40% of the day<br />
Percent of CWD with<br />
IEPs receiving instruction<br />
in the regular class less<br />
than 60% of the day.<br />
53.87% 59.77%<br />
State<br />
Rate<br />
State<br />
Target<br />
12.42% 12.51%<br />
82.93%<br />
LEA<br />
Rate<br />
0.00%<br />
C) Other Settings outside the regular class<br />
Percent of CWD with IEPs served in<br />
public or private separate schools,<br />
residential placements, or<br />
homebound/hospital placements.<br />
State<br />
Rate<br />
State<br />
Target<br />
2.80% 2.56%<br />
Target Met<br />
by LEA (Y/N)<br />
Y<br />
Target Met<br />
by LEA (Y/N)<br />
Y<br />
LEA<br />
Rate<br />
2.44%<br />
Target Met<br />
by LEA(Y/N)<br />
Indicator 06: Early Childhood (3-5) Least Restrictive Environment<br />
A) Regular Early Childhood Program<br />
Percent of children (aged 3 through 5) with IEPs attending a regular<br />
early childhood program and receiving the majority of special<br />
education and related services in the regular early childhood program<br />
Allowable<br />
Difference<br />
LEA: 2906 - SPRING HILL SCHOOL <strong>DISTRICT</strong><br />
Indicator 07: Preschool (3-5) Outcomes<br />
a) Percent of preschool CWD<br />
children who did not<br />
improve functioning.<br />
b) Percent of preschool CWD<br />
who improved but whose<br />
functioning remained below<br />
same age peers.<br />
c) Percent of preschool CWD<br />
who improved at a level<br />
nearer to same aged peers.<br />
d) Percent of preschool CWD<br />
who improved functioning to<br />
reach a level comparable to<br />
same age peers.<br />
e) Percent of preschool CWD<br />
children who maintain<br />
functioning at a level<br />
comparable to same aged<br />
peers.<br />
Summary<br />
Statements<br />
1) Of those preschool<br />
children who entered<br />
the preschool program<br />
below age expectations<br />
in each Outcome, the<br />
percent who<br />
substantially increased<br />
their rate of growth by<br />
the time they turned 6<br />
years of age or exited<br />
the program.<br />
2) The percent of<br />
preschool children who<br />
were functioning<br />
within age expectations<br />
in each Outcome by the<br />
time they turned 6<br />
years of age or exited<br />
A) Positive Social -Emotional<br />
Skills*<br />
State<br />
Rate<br />
A) Positive Social -<br />
Emotional Skills<br />
(Including social<br />
relationships)<br />
State<br />
Rate<br />
2.14%<br />
5.31%<br />
25.97%<br />
38.22%<br />
28.36%<br />
State<br />
Target<br />
LEA<br />
Rate<br />
LEA<br />
Rate<br />
— —<br />
— —<br />
— —<br />
— —<br />
— —<br />
Target<br />
Met by<br />
LEA(Y/N)<br />
B) Acquisition and Use of<br />
Knowledge and Skills<br />
(Including early language/<br />
communication and early literacy)<br />
B) Acquisition and Use of<br />
Knowledge and Skills **<br />
State<br />
Rate<br />
1.75%<br />
6.59%<br />
34.23%<br />
43.51%<br />
13.92%<br />
State<br />
Target<br />
LEA<br />
Rate<br />
Target<br />
Met by<br />
LEA(Y/N)<br />
C) Use of Appropriate Behaviors<br />
to Meet Their Needs<br />
State<br />
Rate<br />
State<br />
Target<br />
LEA<br />
Rate<br />
Target<br />
Met by<br />
LEA(Y/N)<br />
89.61% 90.50% — — N/A 90.31% 90.50% — — N/A 90.82% 92.50% — — N/A<br />
66.58% 69.50% — — N/A 57.43% 60.50% — — N/A 76.69% 78.50% — — N/A<br />
NOTE: * Including social relationships ** Including early language/ communication and early literacy<br />
Note: - - denotes not applicable<br />
State<br />
Rate<br />
LEA<br />
Rate<br />
— —<br />
— —<br />
— —<br />
— —<br />
— —<br />
C) Use of<br />
Appropriate<br />
Behaviors to<br />
Meet Their Needs<br />
State<br />
Rate<br />
4.51%<br />
17.34%<br />
41.72%<br />
34.97%<br />
LEA<br />
Rate<br />
1.46% — —<br />
— —<br />
— —<br />
— —<br />
— —<br />
Page 3 of 5
LEA: 2906 - SPRING HILL SCHOOL <strong>DISTRICT</strong><br />
Indicator 08: Parent Involvement<br />
Percent of surveyed<br />
parents who reported<br />
school facilitated parent<br />
involvement as a means<br />
of improving services<br />
and results for children<br />
with disabilities.<br />
Early Childhood<br />
(3-5)<br />
School Age<br />
(5-21)<br />
State<br />
Rate<br />
90.47%<br />
95.05%<br />
Indicator 09: Disproportionality - Eligibility<br />
Disproportionate representation of racial<br />
and ethnic groups in special education and<br />
related services that is a result of<br />
inappropriate identification (e.g.<br />
monitoring data, review of policies,<br />
practices, and procedures under 618(d),<br />
etc.).<br />
State<br />
Rate<br />
State<br />
Target<br />
88.00%<br />
96.00%<br />
State<br />
Target<br />
0.00% 0.00%<br />
LEA<br />
Rate<br />
— —<br />
— —<br />
Indicator 10: Disproportionality-Child with a Disability<br />
Disproportionate representation of racial<br />
and ethnic groups in specific disability<br />
categories that is a result of inappropriate<br />
identification (e.g. monitoring data, review<br />
of policies, practices, and procedures under<br />
618(d), etc.).<br />
Indicator 11: Child Find<br />
Percent of children with<br />
parental consent to evaluate<br />
who are evaluated within<br />
the State established timeline<br />
of 60 days.<br />
Overall<br />
(3-21)<br />
Early Childhood<br />
(3-5)<br />
School Age<br />
(5-21)<br />
State<br />
Rate<br />
0.00%<br />
Indicator 12: Early Childhood Transition<br />
Percent of children referred by Part C prior to<br />
age 3, who are found eligible for Part B, and<br />
who have an IEP developed and implemented<br />
by their third birthday.<br />
Note: - - denotes not applicable<br />
State<br />
Rate<br />
99.41%<br />
99.70%<br />
98.97%<br />
State<br />
Rate<br />
State<br />
Target<br />
0.00%<br />
State<br />
Target<br />
100.00%<br />
100.00%<br />
100.00%<br />
State<br />
Target<br />
Target Met by<br />
LEA (Y/N)<br />
Y<br />
Target Met by<br />
LEA (Y/N)<br />
Y<br />
LEA<br />
Rate<br />
100.00%<br />
— —<br />
100.00%<br />
LEA<br />
Rate<br />
Target Met by<br />
LEA (Y/N)<br />
N/A<br />
N<br />
Note: The target for Indicator 09 is to have zero percent<br />
(0%) of districts identified as having disproportionate<br />
representation as a result of inappropriate<br />
identification in eligibility.<br />
Note: The target for Indicator 10 is to have zero<br />
percent (0%) of districts identified as having<br />
disproportionate representation as a result of<br />
inappropriate identification in a disability<br />
category.<br />
Target Met by<br />
LEA (Y/N)<br />
N/A<br />
Y<br />
Target Met<br />
by LEA<br />
(Y/N)<br />
99.21% 100.00% - - N/A<br />
Y<br />
Note: * Indicates a zero reponse rate for the<br />
district.<br />
Page 4 of 5
LEA: 2906 - SPRING HILL SCHOOL <strong>DISTRICT</strong><br />
Indicator 13: Secondary Transition<br />
Percent of youth with disabilities aged 16 and<br />
up with an IEP that includes coordinated,<br />
measurable, annual IEP goals and transition<br />
services that will reasonably enable the student<br />
to meet the post-secondary goals.<br />
Indicator 14: Post-School Outcomes<br />
A. Percent of youth enrolled in higher<br />
education within one year of leaving high<br />
school.<br />
State<br />
Rate<br />
State<br />
Target<br />
Note: Data for this Indicator is from the on-site monitoring of LEAs for the given year.<br />
B. Percent of youth enrolled in higher<br />
education or competitively employed<br />
within one year of leaving high school.<br />
C. Percent of youth enrolled in higher<br />
education or in some other postsecondary<br />
education or training program; or<br />
competitively employed or in some other<br />
employment within one year of leaving<br />
high school.<br />
State<br />
Rate<br />
Indicator 20: Reported Data-Timely and Accurate*<br />
District submitted<br />
required data elements<br />
on or before due dates;<br />
made revisions within<br />
the alloted reveiw<br />
periods.<br />
Accurate and Timely<br />
Data Submission<br />
Overall (3-21)<br />
Early Childhood (3-5)<br />
School Age (5-21)<br />
State<br />
Target<br />
100.00%<br />
100.00%<br />
100.00%<br />
State<br />
Target<br />
LEA<br />
Rate<br />
LEA<br />
Rate<br />
Target Met by<br />
LEA (Y/N)<br />
Target Met<br />
by LEA<br />
(Y/N)<br />
Target Met<br />
by LEA<br />
(Y/N)<br />
*Data reviewed for timely and accurate submissions included all APSCN cycle data except for personnel<br />
Note: - - denotes not applicable<br />
96.19 100.00 — — N/A<br />
14.53<br />
State<br />
Rate<br />
49.42<br />
State<br />
Rate<br />
54.07<br />
13.00<br />
State<br />
Target<br />
49.00<br />
State<br />
Target<br />
60.00<br />
Y<br />
N/A<br />
Y<br />
— —<br />
LEA<br />
Rate<br />
— —<br />
LEA<br />
Rate<br />
— —<br />
N/A<br />
Target Met<br />
by LEA<br />
(Y/N)<br />
N/A<br />
Target Met<br />
by LEA<br />
(Y/N)<br />
N/A<br />
Page 5 of 5
<strong>ARKANSAS</strong> <strong>SPECIAL</strong> <strong>EDUCATION</strong><br />
<strong>DISTRICT</strong> <strong>ANNUAL</strong> PERFORMANCE REPORT<br />
2010/11 School Year<br />
Publication Date: March 2012<br />
Each State must have in place a State Performance Plan (SPP) to evaluate the State's efforts to meet the requirements and<br />
purposes of the implementation of the Individuals with Disabilities Education Act (IDEA). The SPP is a six-year plan, which<br />
describes Arkansas's performance on 20 indicators. The Office of Special Education Programs in the U. S. Department of<br />
Education requires that States report annually to the public on the performance of each local education agency (LEA) on 14 of<br />
20 indicators as compared with targets established by the State in the SPP. Arkansas will report indicators 1 through 14 and<br />
20 for each LEA serving children with disabilities (CWD). Any LEA not meeting targets on compliance indicators (0% for<br />
Indicators 4B, 09 & 10 and 100% for Indicators 11, 12, 13, and 20) are non-compliant with IDEA.<br />
There are no report changes for the 2010/11 school year profile; However, it is important to recognize that: .<br />
1. Indicator 01 (Graduation) is reported a year in arrear (2009/10 graduates) and is based on a four-year cohort. This<br />
means the rate is a measure of students who entered in ninth grade and graduate in four years. The calculation is a<br />
requirement under Title I of the Elementary and Secondary Education Act (ESEA).<br />
2. Indicator 02 (Drop out) is reported a year in arrear. This means the rate is a measure of students who dropped out in<br />
the 2009/10 school year. The Indicator 02 data are aligned with the Common Core of Data (CCD) requirements for<br />
grades 7-12.<br />
3. Indicator 04A and 4B (Suspension/Expulsion) is reported a year in arrear. This means the rate is a measure of<br />
students who had out-of-school suspensions and/or expulsions totaling more than 10 days.<br />
For a complete description of all the Indicators, please visit the special education website at<br />
http://arksped.k12.ar.us/sections/policy.html<br />
LEA: 2920 - SOUTHWEST <strong>ARKANSAS</strong> <strong>EDUCATION</strong>AL CO-OP<br />
Indicator 01: Graduation Rates (2009/10 school year) Indicator 02: Dropout Rates (2009/10 school year)<br />
Percent of youth<br />
with IEPs<br />
graduating from<br />
high school with a<br />
regular diploma<br />
State<br />
Rate<br />
State<br />
Target<br />
75.76% 85.00%<br />
LEA<br />
Rate<br />
— —<br />
Target Met<br />
by LEA<br />
(Y/N)<br />
NA<br />
Percent of<br />
youth with<br />
IEPs dropping<br />
out of high<br />
school<br />
State<br />
Rate<br />
Indicator 03: Assessment on Statewide Benchmark Exam (grades 3-8, 11)<br />
A) Adequate Yearly Progress<br />
n=40<br />
Literacy<br />
Mathematics<br />
Met Disability Subgroup "n"<br />
for Reporting Purposes (Y/N)<br />
State Target for % of Districts Meeting<br />
AYP for Disability Subgroup<br />
State<br />
Target<br />
3.06% 4.20%<br />
LEA<br />
Rate<br />
— —<br />
% of Districts Meeting AYP<br />
for Disability Subgroup<br />
Target Met by<br />
LEA (Y/N)<br />
N/A<br />
Target Met by<br />
LEA(Y/N)<br />
Overall N/A 17.15% 6.25%<br />
N/A<br />
N/A<br />
N/A<br />
Note: For a district to qualify as having a disability subgroup it must have a minimum of 40 (n=40) students with disabilities in a school building.<br />
B) Participation<br />
Participation Rate: # of<br />
CWD Tested ÷ # of CWD<br />
Enrolled in grades tested.<br />
Participation Rate: Literacy<br />
Participation Rate: Math<br />
Note: - - denotes not applicable<br />
State<br />
Rate<br />
98.78%<br />
State<br />
Target<br />
95.00%<br />
LEA<br />
Rate<br />
— —<br />
Target Met<br />
by LEA (Y/N)<br />
N/A<br />
98.61% 95.00% — — N/A<br />
C) Performance Proficiency<br />
Percent of CWD Scoring<br />
Proficient or Above<br />
Proficiency Rate: Literacy<br />
Proficiency Rate:<br />
Mathematics<br />
16.00%<br />
16.00%<br />
State<br />
Rate<br />
31.49%<br />
44.86%<br />
State<br />
Target<br />
45.22%<br />
51.14%<br />
LEA<br />
Rate<br />
— —<br />
— —<br />
N/A<br />
N/A<br />
Target<br />
Met by<br />
LEA (Y/N)<br />
N/A<br />
N/A<br />
Page 1 of 5
LEA: 2920 - SOUTHWEST <strong>ARKANSAS</strong> <strong>EDUCATION</strong>AL CO-OP<br />
Indicator 04: Out-of-School Suspensions and Expulsions (2009/10 school year)<br />
A) Suspension/Expulsion<br />
Percent difference of CWD with out-of- school suspensions and<br />
expulsions totaling greater than 10 days in a school year as<br />
compared to the same data for general education students in<br />
the district.<br />
B) Suspension/Expulsion by Race and Ethnicity<br />
Percent of districts that have: (a) a significant discrepancy, by race or<br />
ethnicity, in the rate of suspensions and expulsions of greater than 10<br />
days in a school year for children with IEPs; and (b) policies,<br />
procedures or practices that contribute to the significant discrepancy<br />
and do not comply with requirements relating to the development<br />
and implementation of IEPs, the use of positive behavioral<br />
interventions and supports, and procedural safeguards.<br />
Indicator 05: School Age (5-21) Least Restrictive Environment<br />
A) In the Regular Class 80% or more of the day<br />
Percent of CWD with<br />
IEPs receiving instruction<br />
in the regular class 80%<br />
or more of the day.<br />
State<br />
Rate<br />
State<br />
Target<br />
LEA<br />
Rate<br />
B) In the Regular Class less than 40% of the day<br />
Percent of CWD with<br />
IEPs receiving instruction<br />
in the regular class less<br />
than 60% of the day.<br />
53.87% 59.77%<br />
State<br />
Rate<br />
State<br />
Target<br />
12.42% 12.51%<br />
— —<br />
LEA<br />
Rate<br />
— —<br />
C) Other Settings outside the regular class<br />
Percent of CWD with IEPs served in<br />
public or private separate schools,<br />
residential placements, or<br />
homebound/hospital placements.<br />
State<br />
Rate<br />
State<br />
Target<br />
2.80% 2.56%<br />
Target Met<br />
by LEA (Y/N)<br />
N/A<br />
Target Met<br />
by LEA (Y/N)<br />
N/A<br />
LEA<br />
Rate<br />
— —<br />
Target Met<br />
by LEA(Y/N)<br />
N/A<br />
Indicator 06: Early Childhood (3-5) Least Restrictive Environment<br />
A) Regular Early Childhood Program<br />
Percent of children (aged 3 through 5) with IEPs attending a regular<br />
early childhood program and receiving the majority of special<br />
education and related services in the regular early childhood program<br />
Allowable<br />
Difference<br />
LEA: 2920 - SOUTHWEST <strong>ARKANSAS</strong> <strong>EDUCATION</strong>AL CO-OP<br />
Indicator 07: Preschool (3-5) Outcomes<br />
a) Percent of preschool CWD<br />
children who did not<br />
improve functioning.<br />
b) Percent of preschool CWD<br />
who improved but whose<br />
functioning remained below<br />
same age peers.<br />
c) Percent of preschool CWD<br />
who improved at a level<br />
nearer to same aged peers.<br />
d) Percent of preschool CWD<br />
who improved functioning to<br />
reach a level comparable to<br />
same age peers.<br />
e) Percent of preschool CWD<br />
children who maintain<br />
functioning at a level<br />
comparable to same aged<br />
peers.<br />
Summary<br />
Statements<br />
1) Of those preschool<br />
children who entered<br />
the preschool program<br />
below age expectations<br />
in each Outcome, the<br />
percent who<br />
substantially increased<br />
their rate of growth by<br />
the time they turned 6<br />
years of age or exited<br />
the program.<br />
2) The percent of<br />
preschool children who<br />
were functioning<br />
within age expectations<br />
in each Outcome by the<br />
time they turned 6<br />
years of age or exited<br />
A) Positive Social -Emotional<br />
Skills*<br />
State<br />
Rate<br />
A) Positive Social -<br />
Emotional Skills<br />
(Including social<br />
relationships)<br />
State<br />
Rate<br />
2.14%<br />
5.31%<br />
25.97%<br />
38.22%<br />
28.36%<br />
State<br />
Target<br />
LEA<br />
Rate<br />
LEA<br />
Rate<br />
— —<br />
2.76%<br />
13.81%<br />
50.83%<br />
32.60%<br />
Target<br />
Met by<br />
LEA(Y/N)<br />
B) Acquisition and Use of<br />
Knowledge and Skills<br />
(Including early language/<br />
communication and early literacy)<br />
B) Acquisition and Use of<br />
Knowledge and Skills **<br />
State<br />
Rate<br />
1.75%<br />
6.59%<br />
34.23%<br />
43.51%<br />
13.92%<br />
State<br />
Target<br />
LEA<br />
Rate<br />
Target<br />
Met by<br />
LEA(Y/N)<br />
C) Use of Appropriate Behaviors<br />
to Meet Their Needs<br />
State<br />
Rate<br />
State<br />
Target<br />
LEA<br />
Rate<br />
Target<br />
Met by<br />
LEA(Y/N)<br />
89.61% 90.50% 95.90% Y 90.31% 90.50% 96.41% Y 90.82% 92.50% 94.87% Y<br />
66.58% 69.50% 83.43% Y 57.43% 60.50% 71.82% Y 76.69% 78.50% 85.08% Y<br />
NOTE: * Including social relationships ** Including early language/ communication and early literacy<br />
Note: - - denotes not applicable<br />
State<br />
Rate<br />
LEA<br />
Rate<br />
— —<br />
3.31%<br />
24.86%<br />
64.09%<br />
7.73%<br />
C) Use of<br />
Appropriate<br />
Behaviors to<br />
Meet Their Needs<br />
State<br />
Rate<br />
4.51%<br />
17.34%<br />
41.72%<br />
34.97%<br />
LEA<br />
Rate<br />
1.46% — —<br />
3.31%<br />
11.60%<br />
49.72%<br />
35.36%<br />
Page 3 of 5
LEA: 2920 - SOUTHWEST <strong>ARKANSAS</strong> <strong>EDUCATION</strong>AL CO-OP<br />
Indicator 08: Parent Involvement<br />
Percent of surveyed<br />
parents who reported<br />
school facilitated parent<br />
involvement as a means<br />
of improving services<br />
and results for children<br />
with disabilities.<br />
Early Childhood<br />
(3-5)<br />
School Age<br />
(5-21)<br />
State<br />
Rate<br />
90.47%<br />
95.05%<br />
Indicator 09: Disproportionality - Eligibility<br />
Disproportionate representation of racial<br />
and ethnic groups in special education and<br />
related services that is a result of<br />
inappropriate identification (e.g.<br />
monitoring data, review of policies,<br />
practices, and procedures under 618(d),<br />
etc.).<br />
State<br />
Rate<br />
State<br />
Target<br />
88.00%<br />
96.00%<br />
State<br />
Target<br />
0.00% 0.00%<br />
LEA<br />
Rate<br />
99.12%<br />
— —<br />
Indicator 10: Disproportionality-Child with a Disability<br />
Disproportionate representation of racial<br />
and ethnic groups in specific disability<br />
categories that is a result of inappropriate<br />
identification (e.g. monitoring data, review<br />
of policies, practices, and procedures under<br />
618(d), etc.).<br />
Indicator 11: Child Find<br />
Percent of children with<br />
parental consent to evaluate<br />
who are evaluated within<br />
the State established timeline<br />
of 60 days.<br />
Overall<br />
(3-21)<br />
Early Childhood<br />
(3-5)<br />
School Age<br />
(5-21)<br />
State<br />
Rate<br />
0.00%<br />
Indicator 12: Early Childhood Transition<br />
Percent of children referred by Part C prior to<br />
age 3, who are found eligible for Part B, and<br />
who have an IEP developed and implemented<br />
by their third birthday.<br />
Note: - - denotes not applicable<br />
State<br />
Rate<br />
99.41%<br />
99.70%<br />
98.97%<br />
State<br />
Rate<br />
State<br />
Target<br />
0.00%<br />
State<br />
Target<br />
100.00%<br />
100.00%<br />
100.00%<br />
State<br />
Target<br />
Target Met by<br />
LEA (Y/N)<br />
N/A<br />
Target Met by<br />
LEA (Y/N)<br />
N/A<br />
LEA<br />
Rate<br />
100.00%<br />
100.00%<br />
— —<br />
LEA<br />
Rate<br />
Target Met by<br />
LEA (Y/N)<br />
Y<br />
N/A<br />
Note: The target for Indicator 09 is to have zero percent<br />
(0%) of districts identified as having disproportionate<br />
representation as a result of inappropriate<br />
identification in eligibility.<br />
Note: The target for Indicator 10 is to have zero<br />
percent (0%) of districts identified as having<br />
disproportionate representation as a result of<br />
inappropriate identification in a disability<br />
category.<br />
Target Met by<br />
LEA (Y/N)<br />
Y<br />
N/A<br />
Target Met<br />
by LEA<br />
(Y/N)<br />
99.21% 100.00% - - N/A<br />
Y<br />
Note: * Indicates a zero reponse rate for the<br />
district.<br />
Page 4 of 5
LEA: 2920 - SOUTHWEST <strong>ARKANSAS</strong> <strong>EDUCATION</strong>AL CO-OP<br />
Indicator 13: Secondary Transition<br />
Percent of youth with disabilities aged 16 and<br />
up with an IEP that includes coordinated,<br />
measurable, annual IEP goals and transition<br />
services that will reasonably enable the student<br />
to meet the post-secondary goals.<br />
Indicator 14: Post-School Outcomes<br />
A. Percent of youth enrolled in higher<br />
education within one year of leaving high<br />
school.<br />
State<br />
Rate<br />
State<br />
Target<br />
Note: Data for this Indicator is from the on-site monitoring of LEAs for the given year.<br />
B. Percent of youth enrolled in higher<br />
education or competitively employed<br />
within one year of leaving high school.<br />
C. Percent of youth enrolled in higher<br />
education or in some other postsecondary<br />
education or training program; or<br />
competitively employed or in some other<br />
employment within one year of leaving<br />
high school.<br />
State<br />
Rate<br />
Indicator 20: Reported Data-Timely and Accurate*<br />
District submitted<br />
required data elements<br />
on or before due dates;<br />
made revisions within<br />
the alloted reveiw<br />
periods.<br />
Accurate and Timely<br />
Data Submission<br />
Overall (3-21)<br />
Early Childhood (3-5)<br />
School Age (5-21)<br />
State<br />
Target<br />
100.00%<br />
100.00%<br />
100.00%<br />
State<br />
Target<br />
LEA<br />
Rate<br />
LEA<br />
Rate<br />
Target Met by<br />
LEA (Y/N)<br />
Target Met<br />
by LEA<br />
(Y/N)<br />
Target Met<br />
by LEA<br />
(Y/N)<br />
*Data reviewed for timely and accurate submissions included all APSCN cycle data except for personnel<br />
Note: - - denotes not applicable<br />
96.19 100.00 — — N/A<br />
14.53<br />
State<br />
Rate<br />
49.42<br />
State<br />
Rate<br />
54.07<br />
13.00<br />
State<br />
Target<br />
49.00<br />
State<br />
Target<br />
60.00<br />
Y<br />
Y<br />
N/A<br />
— —<br />
LEA<br />
Rate<br />
— —<br />
LEA<br />
Rate<br />
— —<br />
N/A<br />
Target Met<br />
by LEA<br />
(Y/N)<br />
N/A<br />
Target Met<br />
by LEA<br />
(Y/N)<br />
N/A<br />
Page 5 of 5
LEA: 3001 - BISMARCK SCHOOL <strong>DISTRICT</strong><br />
<strong>ARKANSAS</strong> <strong>SPECIAL</strong> <strong>EDUCATION</strong><br />
<strong>DISTRICT</strong> <strong>ANNUAL</strong> PERFORMANCE REPORT<br />
2010/11 School Year<br />
Publication Date: March 2012<br />
Each State must have in place a State Performance Plan (SPP) to evaluate the State's efforts to meet the requirements and<br />
purposes of the implementation of the Individuals with Disabilities Education Act (IDEA). The SPP is a six-year plan, which<br />
describes Arkansas's performance on 20 indicators. The Office of Special Education Programs in the U. S. Department of<br />
Education requires that States report annually to the public on the performance of each local education agency (LEA) on 14 of<br />
20 indicators as compared with targets established by the State in the SPP. Arkansas will report indicators 1 through 14 and<br />
20 for each LEA serving children with disabilities (CWD). Any LEA not meeting targets on compliance indicators (0% for<br />
Indicators 4B, 09 & 10 and 100% for Indicators 11, 12, 13, and 20) are non-compliant with IDEA.<br />
There are no report changes for the 2010/11 school year profile; However, it is important to recognize that: .<br />
1. Indicator 01 (Graduation) is reported a year in arrear (2009/10 graduates) and is based on a four-year cohort. This<br />
means the rate is a measure of students who entered in ninth grade and graduate in four years. The calculation is a<br />
requirement under Title I of the Elementary and Secondary Education Act (ESEA).<br />
2. Indicator 02 (Drop out) is reported a year in arrear. This means the rate is a measure of students who dropped out in<br />
the 2009/10 school year. The Indicator 02 data are aligned with the Common Core of Data (CCD) requirements for<br />
grades 7-12.<br />
3. Indicator 04A and 4B (Suspension/Expulsion) is reported a year in arrear. This means the rate is a measure of<br />
students who had out-of-school suspensions and/or expulsions totaling more than 10 days.<br />
Percent of youth<br />
with IEPs<br />
graduating from<br />
high school with a<br />
regular diploma<br />
For a complete description of all the Indicators, please visit the special education website at<br />
http://arksped.k12.ar.us/sections/policy.html<br />
Indicator 01: Graduation Rates (2009/10 school year) Indicator 02: Dropout Rates (2009/10 school year)<br />
State<br />
Rate<br />
State<br />
Target<br />
75.76% 85.00%<br />
LEA<br />
Rate<br />
76.92%<br />
Target Met<br />
by LEA<br />
(Y/N)<br />
N<br />
Percent of<br />
youth with<br />
IEPs dropping<br />
out of high<br />
school<br />
State<br />
Rate<br />
Indicator 03: Assessment on Statewide Benchmark Exam (grades 3-8, 11)<br />
A) Adequate Yearly Progress<br />
n=40<br />
Literacy<br />
Mathematics<br />
Met Disability Subgroup "n"<br />
for Reporting Purposes (Y/N)<br />
State Target for % of Districts Meeting<br />
AYP for Disability Subgroup<br />
State<br />
Target<br />
3.06% 4.20%<br />
LEA<br />
Rate<br />
6.67%<br />
% of Districts Meeting AYP<br />
for Disability Subgroup<br />
Target Met by<br />
LEA (Y/N)<br />
N<br />
Target Met by<br />
LEA(Y/N)<br />
Overall N 17.15% 6.25%<br />
NA<br />
N<br />
N<br />
Note: For a district to qualify as having a disability subgroup it must have a minimum of 40 (n=40) students with disabilities in a school building.<br />
B) Participation<br />
Participation Rate: # of<br />
CWD Tested ÷ # of CWD<br />
Enrolled in grades tested.<br />
Participation Rate: Literacy<br />
Participation Rate: Math<br />
Note: - - denotes not applicable<br />
State<br />
Rate<br />
98.78%<br />
State<br />
Target<br />
95.00%<br />
LEA<br />
Rate<br />
100.00%<br />
Target Met<br />
by LEA (Y/N)<br />
98.61% 95.00% 100.00% Y<br />
Y<br />
C) Performance Proficiency<br />
Percent of CWD Scoring<br />
Proficient or Above<br />
Proficiency Rate: Literacy<br />
Proficiency Rate:<br />
Mathematics<br />
16.00%<br />
16.00%<br />
State<br />
Rate<br />
31.49%<br />
44.86%<br />
State<br />
Target<br />
45.22%<br />
51.14%<br />
LEA<br />
Rate<br />
31.25%<br />
38.46%<br />
NA<br />
NA<br />
Target<br />
Met by<br />
LEA (Y/N)<br />
N<br />
N<br />
Page 1 of 5
LEA: 3001 - BISMARCK SCHOOL <strong>DISTRICT</strong><br />
Indicator 04: Out-of-School Suspensions and Expulsions (2009/10 school year)<br />
A) Suspension/Expulsion<br />
Percent difference of CWD with out-of- school suspensions and<br />
expulsions totaling greater than 10 days in a school year as<br />
compared to the same data for general education students in<br />
the district.<br />
B) Suspension/Expulsion by Race and Ethnicity<br />
Percent of districts that have: (a) a significant discrepancy, by race or<br />
ethnicity, in the rate of suspensions and expulsions of greater than 10<br />
days in a school year for children with IEPs; and (b) policies,<br />
procedures or practices that contribute to the significant discrepancy<br />
and do not comply with requirements relating to the development<br />
and implementation of IEPs, the use of positive behavioral<br />
interventions and supports, and procedural safeguards.<br />
Indicator 05: School Age (5-21) Least Restrictive Environment<br />
A) In the Regular Class 80% or more of the day<br />
Percent of CWD with<br />
IEPs receiving instruction<br />
in the regular class 80%<br />
or more of the day.<br />
State<br />
Rate<br />
State<br />
Target<br />
LEA<br />
Rate<br />
B) In the Regular Class less than 40% of the day<br />
Percent of CWD with<br />
IEPs receiving instruction<br />
in the regular class less<br />
than 60% of the day.<br />
53.87% 59.77%<br />
State<br />
Rate<br />
State<br />
Target<br />
12.42% 12.51%<br />
42.86%<br />
LEA<br />
Rate<br />
12.61%<br />
C) Other Settings outside the regular class<br />
Percent of CWD with IEPs served in<br />
public or private separate schools,<br />
residential placements, or<br />
homebound/hospital placements.<br />
State<br />
Rate<br />
State<br />
Target<br />
2.80% 2.56%<br />
Target Met<br />
by LEA (Y/N)<br />
N<br />
Target Met<br />
by LEA (Y/N)<br />
N<br />
LEA<br />
Rate<br />
5.88%<br />
Target Met<br />
by LEA(Y/N)<br />
Indicator 06: Early Childhood (3-5) Least Restrictive Environment<br />
A) Regular Early Childhood Program<br />
Percent of children (aged 3 through 5) with IEPs attending a regular<br />
early childhood program and receiving the majority of special<br />
education and related services in the regular early childhood program<br />
Allowable<br />
Difference<br />
LEA: 3001 - BISMARCK SCHOOL <strong>DISTRICT</strong><br />
Indicator 07: Preschool (3-5) Outcomes<br />
a) Percent of preschool CWD<br />
children who did not<br />
improve functioning.<br />
b) Percent of preschool CWD<br />
who improved but whose<br />
functioning remained below<br />
same age peers.<br />
c) Percent of preschool CWD<br />
who improved at a level<br />
nearer to same aged peers.<br />
d) Percent of preschool CWD<br />
who improved functioning to<br />
reach a level comparable to<br />
same age peers.<br />
e) Percent of preschool CWD<br />
children who maintain<br />
functioning at a level<br />
comparable to same aged<br />
peers.<br />
Summary<br />
Statements<br />
1) Of those preschool<br />
children who entered<br />
the preschool program<br />
below age expectations<br />
in each Outcome, the<br />
percent who<br />
substantially increased<br />
their rate of growth by<br />
the time they turned 6<br />
years of age or exited<br />
the program.<br />
2) The percent of<br />
preschool children who<br />
were functioning<br />
within age expectations<br />
in each Outcome by the<br />
time they turned 6<br />
years of age or exited<br />
A) Positive Social -Emotional<br />
Skills*<br />
State<br />
Rate<br />
A) Positive Social -<br />
Emotional Skills<br />
(Including social<br />
relationships)<br />
State<br />
Rate<br />
2.14%<br />
5.31%<br />
25.97%<br />
38.22%<br />
28.36%<br />
State<br />
Target<br />
LEA<br />
Rate<br />
LEA<br />
Rate<br />
— —<br />
— —<br />
— —<br />
— —<br />
— —<br />
Target<br />
Met by<br />
LEA(Y/N)<br />
B) Acquisition and Use of<br />
Knowledge and Skills<br />
(Including early language/<br />
communication and early literacy)<br />
B) Acquisition and Use of<br />
Knowledge and Skills **<br />
State<br />
Rate<br />
1.75%<br />
6.59%<br />
34.23%<br />
43.51%<br />
13.92%<br />
State<br />
Target<br />
LEA<br />
Rate<br />
Target<br />
Met by<br />
LEA(Y/N)<br />
C) Use of Appropriate Behaviors<br />
to Meet Their Needs<br />
State<br />
Rate<br />
State<br />
Target<br />
LEA<br />
Rate<br />
Target<br />
Met by<br />
LEA(Y/N)<br />
89.61% 90.50% — — N/A 90.31% 90.50% — — N/A 90.82% 92.50% — — N/A<br />
66.58% 69.50% — — N/A 57.43% 60.50% — — N/A 76.69% 78.50% — — N/A<br />
NOTE: * Including social relationships ** Including early language/ communication and early literacy<br />
Note: - - denotes not applicable<br />
State<br />
Rate<br />
LEA<br />
Rate<br />
— —<br />
— —<br />
— —<br />
— —<br />
— —<br />
C) Use of<br />
Appropriate<br />
Behaviors to<br />
Meet Their Needs<br />
State<br />
Rate<br />
4.51%<br />
17.34%<br />
41.72%<br />
34.97%<br />
LEA<br />
Rate<br />
1.46% — —<br />
— —<br />
— —<br />
— —<br />
— —<br />
Page 3 of 5
LEA: 3001 - BISMARCK SCHOOL <strong>DISTRICT</strong><br />
Indicator 08: Parent Involvement<br />
Percent of surveyed<br />
parents who reported<br />
school facilitated parent<br />
involvement as a means<br />
of improving services<br />
and results for children<br />
with disabilities.<br />
Early Childhood<br />
(3-5)<br />
School Age<br />
(5-21)<br />
State<br />
Rate<br />
90.47%<br />
95.05%<br />
Indicator 09: Disproportionality - Eligibility<br />
Disproportionate representation of racial<br />
and ethnic groups in special education and<br />
related services that is a result of<br />
inappropriate identification (e.g.<br />
monitoring data, review of policies,<br />
practices, and procedures under 618(d),<br />
etc.).<br />
State<br />
Rate<br />
State<br />
Target<br />
88.00%<br />
96.00%<br />
State<br />
Target<br />
0.00% 0.00%<br />
LEA<br />
Rate<br />
— —<br />
98.36%<br />
Indicator 10: Disproportionality-Child with a Disability<br />
Disproportionate representation of racial<br />
and ethnic groups in specific disability<br />
categories that is a result of inappropriate<br />
identification (e.g. monitoring data, review<br />
of policies, practices, and procedures under<br />
618(d), etc.).<br />
Indicator 11: Child Find<br />
Percent of children with<br />
parental consent to evaluate<br />
who are evaluated within<br />
the State established timeline<br />
of 60 days.<br />
Overall<br />
(3-21)<br />
Early Childhood<br />
(3-5)<br />
School Age<br />
(5-21)<br />
State<br />
Rate<br />
0.00%<br />
Indicator 12: Early Childhood Transition<br />
Percent of children referred by Part C prior to<br />
age 3, who are found eligible for Part B, and<br />
who have an IEP developed and implemented<br />
by their third birthday.<br />
Note: - - denotes not applicable<br />
State<br />
Rate<br />
99.41%<br />
99.70%<br />
98.97%<br />
State<br />
Rate<br />
State<br />
Target<br />
0.00%<br />
State<br />
Target<br />
100.00%<br />
100.00%<br />
100.00%<br />
State<br />
Target<br />
Target Met by<br />
LEA (Y/N)<br />
Y<br />
Target Met by<br />
LEA (Y/N)<br />
Y<br />
LEA<br />
Rate<br />
100.00%<br />
— —<br />
100.00%<br />
LEA<br />
Rate<br />
Target Met by<br />
LEA (Y/N)<br />
N/A<br />
Y<br />
Note: The target for Indicator 09 is to have zero percent<br />
(0%) of districts identified as having disproportionate<br />
representation as a result of inappropriate<br />
identification in eligibility.<br />
Note: The target for Indicator 10 is to have zero<br />
percent (0%) of districts identified as having<br />
disproportionate representation as a result of<br />
inappropriate identification in a disability<br />
category.<br />
Target Met by<br />
LEA (Y/N)<br />
N/A<br />
Y<br />
Target Met<br />
by LEA<br />
(Y/N)<br />
99.21% 100.00% - - N/A<br />
Y<br />
Note: * Indicates a zero reponse rate for the<br />
district.<br />
Page 4 of 5
LEA: 3001 - BISMARCK SCHOOL <strong>DISTRICT</strong><br />
Indicator 13: Secondary Transition<br />
Percent of youth with disabilities aged 16 and<br />
up with an IEP that includes coordinated,<br />
measurable, annual IEP goals and transition<br />
services that will reasonably enable the student<br />
to meet the post-secondary goals.<br />
Indicator 14: Post-School Outcomes<br />
A. Percent of youth enrolled in higher<br />
education within one year of leaving high<br />
school.<br />
State<br />
Rate<br />
State<br />
Target<br />
Note: Data for this Indicator is from the on-site monitoring of LEAs for the given year.<br />
B. Percent of youth enrolled in higher<br />
education or competitively employed<br />
within one year of leaving high school.<br />
C. Percent of youth enrolled in higher<br />
education or in some other postsecondary<br />
education or training program; or<br />
competitively employed or in some other<br />
employment within one year of leaving<br />
high school.<br />
State<br />
Rate<br />
Indicator 20: Reported Data-Timely and Accurate*<br />
District submitted<br />
required data elements<br />
on or before due dates;<br />
made revisions within<br />
the alloted reveiw<br />
periods.<br />
Accurate and Timely<br />
Data Submission<br />
Overall (3-21)<br />
Early Childhood (3-5)<br />
School Age (5-21)<br />
State<br />
Target<br />
100.00%<br />
100.00%<br />
100.00%<br />
State<br />
Target<br />
LEA<br />
Rate<br />
LEA<br />
Rate<br />
Target Met by<br />
LEA (Y/N)<br />
Target Met<br />
by LEA<br />
(Y/N)<br />
Target Met<br />
by LEA<br />
(Y/N)<br />
*Data reviewed for timely and accurate submissions included all APSCN cycle data except for personnel<br />
Note: - - denotes not applicable<br />
96.19 100.00 100.00% Y<br />
14.53<br />
State<br />
Rate<br />
49.42<br />
State<br />
Rate<br />
54.07<br />
13.00<br />
State<br />
Target<br />
49.00<br />
State<br />
Target<br />
60.00<br />
Y<br />
N/A<br />
Y<br />
— —<br />
LEA<br />
Rate<br />
— —<br />
LEA<br />
Rate<br />
— —<br />
N/A<br />
Target Met<br />
by LEA<br />
(Y/N)<br />
N/A<br />
Target Met<br />
by LEA<br />
(Y/N)<br />
N/A<br />
Page 5 of 5
LEA: 3002 - GLEN ROSE SCHOOL <strong>DISTRICT</strong><br />
<strong>ARKANSAS</strong> <strong>SPECIAL</strong> <strong>EDUCATION</strong><br />
<strong>DISTRICT</strong> <strong>ANNUAL</strong> PERFORMANCE REPORT<br />
2010/11 School Year<br />
Publication Date: March 2012<br />
Each State must have in place a State Performance Plan (SPP) to evaluate the State's efforts to meet the requirements and<br />
purposes of the implementation of the Individuals with Disabilities Education Act (IDEA). The SPP is a six-year plan, which<br />
describes Arkansas's performance on 20 indicators. The Office of Special Education Programs in the U. S. Department of<br />
Education requires that States report annually to the public on the performance of each local education agency (LEA) on 14 of<br />
20 indicators as compared with targets established by the State in the SPP. Arkansas will report indicators 1 through 14 and<br />
20 for each LEA serving children with disabilities (CWD). Any LEA not meeting targets on compliance indicators (0% for<br />
Indicators 4B, 09 & 10 and 100% for Indicators 11, 12, 13, and 20) are non-compliant with IDEA.<br />
There are no report changes for the 2010/11 school year profile; However, it is important to recognize that: .<br />
1. Indicator 01 (Graduation) is reported a year in arrear (2009/10 graduates) and is based on a four-year cohort. This<br />
means the rate is a measure of students who entered in ninth grade and graduate in four years. The calculation is a<br />
requirement under Title I of the Elementary and Secondary Education Act (ESEA).<br />
2. Indicator 02 (Drop out) is reported a year in arrear. This means the rate is a measure of students who dropped out in<br />
the 2009/10 school year. The Indicator 02 data are aligned with the Common Core of Data (CCD) requirements for<br />
grades 7-12.<br />
3. Indicator 04A and 4B (Suspension/Expulsion) is reported a year in arrear. This means the rate is a measure of<br />
students who had out-of-school suspensions and/or expulsions totaling more than 10 days.<br />
Percent of youth<br />
with IEPs<br />
graduating from<br />
high school with a<br />
regular diploma<br />
For a complete description of all the Indicators, please visit the special education website at<br />
http://arksped.k12.ar.us/sections/policy.html<br />
Indicator 01: Graduation Rates (2009/10 school year) Indicator 02: Dropout Rates (2009/10 school year)<br />
State<br />
Rate<br />
State<br />
Target<br />
75.76% 85.00%<br />
LEA<br />
Rate<br />
90.91%<br />
Target Met<br />
by LEA<br />
(Y/N)<br />
Y<br />
Percent of<br />
youth with<br />
IEPs dropping<br />
out of high<br />
school<br />
State<br />
Rate<br />
Indicator 03: Assessment on Statewide Benchmark Exam (grades 3-8, 11)<br />
A) Adequate Yearly Progress<br />
n=40<br />
Literacy<br />
Mathematics<br />
Met Disability Subgroup "n"<br />
for Reporting Purposes (Y/N)<br />
State Target for % of Districts Meeting<br />
AYP for Disability Subgroup<br />
State<br />
Target<br />
3.06% 4.20%<br />
LEA<br />
Rate<br />
1.54%<br />
% of Districts Meeting AYP<br />
for Disability Subgroup<br />
Target Met by<br />
LEA (Y/N)<br />
Y<br />
Target Met by<br />
LEA(Y/N)<br />
Overall N 17.15% 6.25%<br />
NA<br />
N<br />
N<br />
Note: For a district to qualify as having a disability subgroup it must have a minimum of 40 (n=40) students with disabilities in a school building.<br />
B) Participation<br />
Participation Rate: # of<br />
CWD Tested ÷ # of CWD<br />
Enrolled in grades tested.<br />
Participation Rate: Literacy<br />
Participation Rate: Math<br />
Note: - - denotes not applicable<br />
State<br />
Rate<br />
98.78%<br />
State<br />
Target<br />
95.00%<br />
LEA<br />
Rate<br />
100.00%<br />
Target Met<br />
by LEA (Y/N)<br />
98.61% 95.00% 100.00% Y<br />
Y<br />
C) Performance Proficiency<br />
Percent of CWD Scoring<br />
Proficient or Above<br />
Proficiency Rate: Literacy<br />
Proficiency Rate:<br />
Mathematics<br />
16.00%<br />
16.00%<br />
State<br />
Rate<br />
31.49%<br />
44.86%<br />
State<br />
Target<br />
45.22%<br />
51.14%<br />
LEA<br />
Rate<br />
36.51%<br />
46.77%<br />
NA<br />
NA<br />
Target<br />
Met by<br />
LEA (Y/N)<br />
N<br />
N<br />
Page 1 of 5
LEA: 3002 - GLEN ROSE SCHOOL <strong>DISTRICT</strong><br />
Indicator 04: Out-of-School Suspensions and Expulsions (2009/10 school year)<br />
A) Suspension/Expulsion<br />
Percent difference of CWD with out-of- school suspensions and<br />
expulsions totaling greater than 10 days in a school year as<br />
compared to the same data for general education students in<br />
the district.<br />
B) Suspension/Expulsion by Race and Ethnicity<br />
Percent of districts that have: (a) a significant discrepancy, by race or<br />
ethnicity, in the rate of suspensions and expulsions of greater than 10<br />
days in a school year for children with IEPs; and (b) policies,<br />
procedures or practices that contribute to the significant discrepancy<br />
and do not comply with requirements relating to the development<br />
and implementation of IEPs, the use of positive behavioral<br />
interventions and supports, and procedural safeguards.<br />
Indicator 05: School Age (5-21) Least Restrictive Environment<br />
A) In the Regular Class 80% or more of the day<br />
Percent of CWD with<br />
IEPs receiving instruction<br />
in the regular class 80%<br />
or more of the day.<br />
State<br />
Rate<br />
State<br />
Target<br />
LEA<br />
Rate<br />
B) In the Regular Class less than 40% of the day<br />
Percent of CWD with<br />
IEPs receiving instruction<br />
in the regular class less<br />
than 60% of the day.<br />
53.87% 59.77%<br />
State<br />
Rate<br />
State<br />
Target<br />
12.42% 12.51%<br />
40.77%<br />
LEA<br />
Rate<br />
8.46%<br />
C) Other Settings outside the regular class<br />
Percent of CWD with IEPs served in<br />
public or private separate schools,<br />
residential placements, or<br />
homebound/hospital placements.<br />
State<br />
Rate<br />
State<br />
Target<br />
2.80% 2.56%<br />
Target Met<br />
by LEA (Y/N)<br />
N<br />
Target Met<br />
by LEA (Y/N)<br />
Y<br />
LEA<br />
Rate<br />
0.77%<br />
Target Met<br />
by LEA(Y/N)<br />
Indicator 06: Early Childhood (3-5) Least Restrictive Environment<br />
A) Regular Early Childhood Program<br />
Percent of children (aged 3 through 5) with IEPs attending a regular<br />
early childhood program and receiving the majority of special<br />
education and related services in the regular early childhood program<br />
Allowable<br />
Difference<br />
LEA: 3002 - GLEN ROSE SCHOOL <strong>DISTRICT</strong><br />
Indicator 07: Preschool (3-5) Outcomes<br />
a) Percent of preschool CWD<br />
children who did not<br />
improve functioning.<br />
b) Percent of preschool CWD<br />
who improved but whose<br />
functioning remained below<br />
same age peers.<br />
c) Percent of preschool CWD<br />
who improved at a level<br />
nearer to same aged peers.<br />
d) Percent of preschool CWD<br />
who improved functioning to<br />
reach a level comparable to<br />
same age peers.<br />
e) Percent of preschool CWD<br />
children who maintain<br />
functioning at a level<br />
comparable to same aged<br />
peers.<br />
Summary<br />
Statements<br />
1) Of those preschool<br />
children who entered<br />
the preschool program<br />
below age expectations<br />
in each Outcome, the<br />
percent who<br />
substantially increased<br />
their rate of growth by<br />
the time they turned 6<br />
years of age or exited<br />
the program.<br />
2) The percent of<br />
preschool children who<br />
were functioning<br />
within age expectations<br />
in each Outcome by the<br />
time they turned 6<br />
years of age or exited<br />
A) Positive Social -Emotional<br />
Skills*<br />
State<br />
Rate<br />
A) Positive Social -<br />
Emotional Skills<br />
(Including social<br />
relationships)<br />
State<br />
Rate<br />
2.14%<br />
5.31%<br />
25.97%<br />
38.22%<br />
28.36%<br />
State<br />
Target<br />
LEA<br />
Rate<br />
LEA<br />
Rate<br />
— —<br />
— —<br />
— —<br />
— —<br />
— —<br />
Target<br />
Met by<br />
LEA(Y/N)<br />
B) Acquisition and Use of<br />
Knowledge and Skills<br />
(Including early language/<br />
communication and early literacy)<br />
B) Acquisition and Use of<br />
Knowledge and Skills **<br />
State<br />
Rate<br />
1.75%<br />
6.59%<br />
34.23%<br />
43.51%<br />
13.92%<br />
State<br />
Target<br />
LEA<br />
Rate<br />
Target<br />
Met by<br />
LEA(Y/N)<br />
C) Use of Appropriate Behaviors<br />
to Meet Their Needs<br />
State<br />
Rate<br />
State<br />
Target<br />
LEA<br />
Rate<br />
Target<br />
Met by<br />
LEA(Y/N)<br />
89.61% 90.50% — — N/A 90.31% 90.50% — — N/A 90.82% 92.50% — — N/A<br />
66.58% 69.50% — — N/A 57.43% 60.50% — — N/A 76.69% 78.50% — — N/A<br />
NOTE: * Including social relationships ** Including early language/ communication and early literacy<br />
Note: - - denotes not applicable<br />
State<br />
Rate<br />
LEA<br />
Rate<br />
— —<br />
— —<br />
— —<br />
— —<br />
— —<br />
C) Use of<br />
Appropriate<br />
Behaviors to<br />
Meet Their Needs<br />
State<br />
Rate<br />
4.51%<br />
17.34%<br />
41.72%<br />
34.97%<br />
LEA<br />
Rate<br />
1.46% — —<br />
— —<br />
— —<br />
— —<br />
— —<br />
Page 3 of 5
LEA: 3002 - GLEN ROSE SCHOOL <strong>DISTRICT</strong><br />
Indicator 08: Parent Involvement<br />
Percent of surveyed<br />
parents who reported<br />
school facilitated parent<br />
involvement as a means<br />
of improving services<br />
and results for children<br />
with disabilities.<br />
Early Childhood<br />
(3-5)<br />
School Age<br />
(5-21)<br />
State<br />
Rate<br />
90.47%<br />
95.05%<br />
Indicator 09: Disproportionality - Eligibility<br />
Disproportionate representation of racial<br />
and ethnic groups in special education and<br />
related services that is a result of<br />
inappropriate identification (e.g.<br />
monitoring data, review of policies,<br />
practices, and procedures under 618(d),<br />
etc.).<br />
State<br />
Rate<br />
State<br />
Target<br />
88.00%<br />
96.00%<br />
State<br />
Target<br />
0.00% 0.00%<br />
LEA<br />
Rate<br />
— —<br />
83.82%<br />
Indicator 10: Disproportionality-Child with a Disability<br />
Disproportionate representation of racial<br />
and ethnic groups in specific disability<br />
categories that is a result of inappropriate<br />
identification (e.g. monitoring data, review<br />
of policies, practices, and procedures under<br />
618(d), etc.).<br />
Indicator 11: Child Find<br />
Percent of children with<br />
parental consent to evaluate<br />
who are evaluated within<br />
the State established timeline<br />
of 60 days.<br />
Overall<br />
(3-21)<br />
Early Childhood<br />
(3-5)<br />
School Age<br />
(5-21)<br />
State<br />
Rate<br />
0.00%<br />
Indicator 12: Early Childhood Transition<br />
Percent of children referred by Part C prior to<br />
age 3, who are found eligible for Part B, and<br />
who have an IEP developed and implemented<br />
by their third birthday.<br />
Note: - - denotes not applicable<br />
State<br />
Rate<br />
99.41%<br />
99.70%<br />
98.97%<br />
State<br />
Rate<br />
State<br />
Target<br />
0.00%<br />
State<br />
Target<br />
100.00%<br />
100.00%<br />
100.00%<br />
State<br />
Target<br />
Target Met by<br />
LEA (Y/N)<br />
Y<br />
Target Met by<br />
LEA (Y/N)<br />
Y<br />
LEA<br />
Rate<br />
100.00%<br />
— —<br />
100.00%<br />
LEA<br />
Rate<br />
Target Met by<br />
LEA (Y/N)<br />
N/A<br />
N<br />
Note: The target for Indicator 09 is to have zero percent<br />
(0%) of districts identified as having disproportionate<br />
representation as a result of inappropriate<br />
identification in eligibility.<br />
Note: The target for Indicator 10 is to have zero<br />
percent (0%) of districts identified as having<br />
disproportionate representation as a result of<br />
inappropriate identification in a disability<br />
category.<br />
Target Met by<br />
LEA (Y/N)<br />
N/A<br />
Y<br />
Target Met<br />
by LEA<br />
(Y/N)<br />
99.21% 100.00% - - N/A<br />
Y<br />
Note: * Indicates a zero reponse rate for the<br />
district.<br />
Page 4 of 5
LEA: 3002 - GLEN ROSE SCHOOL <strong>DISTRICT</strong><br />
Indicator 13: Secondary Transition<br />
Percent of youth with disabilities aged 16 and<br />
up with an IEP that includes coordinated,<br />
measurable, annual IEP goals and transition<br />
services that will reasonably enable the student<br />
to meet the post-secondary goals.<br />
Indicator 14: Post-School Outcomes<br />
A. Percent of youth enrolled in higher<br />
education within one year of leaving high<br />
school.<br />
State<br />
Rate<br />
State<br />
Target<br />
Note: Data for this Indicator is from the on-site monitoring of LEAs for the given year.<br />
B. Percent of youth enrolled in higher<br />
education or competitively employed<br />
within one year of leaving high school.<br />
C. Percent of youth enrolled in higher<br />
education or in some other postsecondary<br />
education or training program; or<br />
competitively employed or in some other<br />
employment within one year of leaving<br />
high school.<br />
State<br />
Rate<br />
Indicator 20: Reported Data-Timely and Accurate*<br />
District submitted<br />
required data elements<br />
on or before due dates;<br />
made revisions within<br />
the alloted reveiw<br />
periods.<br />
Accurate and Timely<br />
Data Submission<br />
Overall (3-21)<br />
Early Childhood (3-5)<br />
School Age (5-21)<br />
State<br />
Target<br />
100.00%<br />
100.00%<br />
100.00%<br />
State<br />
Target<br />
LEA<br />
Rate<br />
LEA<br />
Rate<br />
Target Met by<br />
LEA (Y/N)<br />
Target Met<br />
by LEA<br />
(Y/N)<br />
Target Met<br />
by LEA<br />
(Y/N)<br />
*Data reviewed for timely and accurate submissions included all APSCN cycle data except for personnel<br />
Note: - - denotes not applicable<br />
96.19 100.00 100.00% Y<br />
14.53<br />
State<br />
Rate<br />
49.42<br />
State<br />
Rate<br />
54.07<br />
13.00<br />
State<br />
Target<br />
49.00<br />
State<br />
Target<br />
60.00<br />
Y<br />
N/A<br />
Y<br />
— —<br />
LEA<br />
Rate<br />
— —<br />
LEA<br />
Rate<br />
— —<br />
N/A<br />
Target Met<br />
by LEA<br />
(Y/N)<br />
N/A<br />
Target Met<br />
by LEA<br />
(Y/N)<br />
N/A<br />
Page 5 of 5
<strong>ARKANSAS</strong> <strong>SPECIAL</strong> <strong>EDUCATION</strong><br />
<strong>DISTRICT</strong> <strong>ANNUAL</strong> PERFORMANCE REPORT<br />
2010/11 School Year<br />
Publication Date: March 2012<br />
Each State must have in place a State Performance Plan (SPP) to evaluate the State's efforts to meet the requirements and<br />
purposes of the implementation of the Individuals with Disabilities Education Act (IDEA). The SPP is a six-year plan, which<br />
describes Arkansas's performance on 20 indicators. The Office of Special Education Programs in the U. S. Department of<br />
Education requires that States report annually to the public on the performance of each local education agency (LEA) on 14 of<br />
20 indicators as compared with targets established by the State in the SPP. Arkansas will report indicators 1 through 14 and<br />
20 for each LEA serving children with disabilities (CWD). Any LEA not meeting targets on compliance indicators (0% for<br />
Indicators 4B, 09 & 10 and 100% for Indicators 11, 12, 13, and 20) are non-compliant with IDEA.<br />
There are no report changes for the 2010/11 school year profile; However, it is important to recognize that: .<br />
1. Indicator 01 (Graduation) is reported a year in arrear (2009/10 graduates) and is based on a four-year cohort. This<br />
means the rate is a measure of students who entered in ninth grade and graduate in four years. The calculation is a<br />
requirement under Title I of the Elementary and Secondary Education Act (ESEA).<br />
2. Indicator 02 (Drop out) is reported a year in arrear. This means the rate is a measure of students who dropped out in<br />
the 2009/10 school year. The Indicator 02 data are aligned with the Common Core of Data (CCD) requirements for<br />
grades 7-12.<br />
3. Indicator 04A and 4B (Suspension/Expulsion) is reported a year in arrear. This means the rate is a measure of<br />
students who had out-of-school suspensions and/or expulsions totaling more than 10 days.<br />
For a complete description of all the Indicators, please visit the special education website at<br />
http://arksped.k12.ar.us/sections/policy.html<br />
LEA: 3003 - MAGNET COVE SCHOOL <strong>DISTRICT</strong><br />
Indicator 01: Graduation Rates (2009/10 school year) Indicator 02: Dropout Rates (2009/10 school year)<br />
Percent of youth<br />
with IEPs<br />
graduating from<br />
high school with a<br />
regular diploma<br />
State<br />
Rate<br />
State<br />
Target<br />
75.76% 85.00%<br />
LEA<br />
Rate<br />
92.86%<br />
Target Met<br />
by LEA<br />
(Y/N)<br />
Y<br />
Percent of<br />
youth with<br />
IEPs dropping<br />
out of high<br />
school<br />
State<br />
Rate<br />
Indicator 03: Assessment on Statewide Benchmark Exam (grades 3-8, 11)<br />
A) Adequate Yearly Progress<br />
n=40<br />
Literacy<br />
Mathematics<br />
Met Disability Subgroup "n"<br />
for Reporting Purposes (Y/N)<br />
State Target for % of Districts Meeting<br />
AYP for Disability Subgroup<br />
State<br />
Target<br />
3.06% 4.20%<br />
LEA<br />
Rate<br />
0.00%<br />
% of Districts Meeting AYP<br />
for Disability Subgroup<br />
Target Met by<br />
LEA (Y/N)<br />
Y<br />
Target Met by<br />
LEA(Y/N)<br />
Overall N 17.15% 6.25%<br />
NA<br />
N<br />
N<br />
Note: For a district to qualify as having a disability subgroup it must have a minimum of 40 (n=40) students with disabilities in a school building.<br />
B) Participation<br />
Participation Rate: # of<br />
CWD Tested ÷ # of CWD<br />
Enrolled in grades tested.<br />
Participation Rate: Literacy<br />
Participation Rate: Math<br />
Note: - - denotes not applicable<br />
State<br />
Rate<br />
98.78%<br />
State<br />
Target<br />
95.00%<br />
LEA<br />
Rate<br />
100.00%<br />
Target Met<br />
by LEA (Y/N)<br />
98.61% 95.00% 100.00% Y<br />
Y<br />
C) Performance Proficiency<br />
Percent of CWD Scoring<br />
Proficient or Above<br />
Proficiency Rate: Literacy<br />
Proficiency Rate:<br />
Mathematics<br />
16.00%<br />
16.00%<br />
State<br />
Rate<br />
31.49%<br />
44.86%<br />
State<br />
Target<br />
45.22%<br />
51.14%<br />
LEA<br />
Rate<br />
42.42%<br />
43.33%<br />
NA<br />
NA<br />
Target<br />
Met by<br />
LEA (Y/N)<br />
N<br />
N<br />
Page 1 of 5
LEA: 3003 - MAGNET COVE SCHOOL <strong>DISTRICT</strong><br />
Indicator 04: Out-of-School Suspensions and Expulsions (2009/10 school year)<br />
A) Suspension/Expulsion<br />
Percent difference of CWD with out-of- school suspensions and<br />
expulsions totaling greater than 10 days in a school year as<br />
compared to the same data for general education students in<br />
the district.<br />
B) Suspension/Expulsion by Race and Ethnicity<br />
Percent of districts that have: (a) a significant discrepancy, by race or<br />
ethnicity, in the rate of suspensions and expulsions of greater than 10<br />
days in a school year for children with IEPs; and (b) policies,<br />
procedures or practices that contribute to the significant discrepancy<br />
and do not comply with requirements relating to the development<br />
and implementation of IEPs, the use of positive behavioral<br />
interventions and supports, and procedural safeguards.<br />
Indicator 05: School Age (5-21) Least Restrictive Environment<br />
A) In the Regular Class 80% or more of the day<br />
Percent of CWD with<br />
IEPs receiving instruction<br />
in the regular class 80%<br />
or more of the day.<br />
State<br />
Rate<br />
State<br />
Target<br />
LEA<br />
Rate<br />
B) In the Regular Class less than 40% of the day<br />
Percent of CWD with<br />
IEPs receiving instruction<br />
in the regular class less<br />
than 60% of the day.<br />
53.87% 59.77%<br />
State<br />
Rate<br />
State<br />
Target<br />
12.42% 12.51%<br />
52.24%<br />
LEA<br />
Rate<br />
11.94%<br />
C) Other Settings outside the regular class<br />
Percent of CWD with IEPs served in<br />
public or private separate schools,<br />
residential placements, or<br />
homebound/hospital placements.<br />
State<br />
Rate<br />
State<br />
Target<br />
2.80% 2.56%<br />
Target Met<br />
by LEA (Y/N)<br />
N<br />
Target Met<br />
by LEA (Y/N)<br />
Y<br />
LEA<br />
Rate<br />
5.97%<br />
Target Met<br />
by LEA(Y/N)<br />
Indicator 06: Early Childhood (3-5) Least Restrictive Environment<br />
A) Regular Early Childhood Program<br />
Percent of children (aged 3 through 5) with IEPs attending a regular<br />
early childhood program and receiving the majority of special<br />
education and related services in the regular early childhood program<br />
Allowable<br />
Difference<br />
LEA: 3003 - MAGNET COVE SCHOOL <strong>DISTRICT</strong><br />
Indicator 07: Preschool (3-5) Outcomes<br />
a) Percent of preschool CWD<br />
children who did not<br />
improve functioning.<br />
b) Percent of preschool CWD<br />
who improved but whose<br />
functioning remained below<br />
same age peers.<br />
c) Percent of preschool CWD<br />
who improved at a level<br />
nearer to same aged peers.<br />
d) Percent of preschool CWD<br />
who improved functioning to<br />
reach a level comparable to<br />
same age peers.<br />
e) Percent of preschool CWD<br />
children who maintain<br />
functioning at a level<br />
comparable to same aged<br />
peers.<br />
Summary<br />
Statements<br />
1) Of those preschool<br />
children who entered<br />
the preschool program<br />
below age expectations<br />
in each Outcome, the<br />
percent who<br />
substantially increased<br />
their rate of growth by<br />
the time they turned 6<br />
years of age or exited<br />
the program.<br />
2) The percent of<br />
preschool children who<br />
were functioning<br />
within age expectations<br />
in each Outcome by the<br />
time they turned 6<br />
years of age or exited<br />
A) Positive Social -Emotional<br />
Skills*<br />
State<br />
Rate<br />
A) Positive Social -<br />
Emotional Skills<br />
(Including social<br />
relationships)<br />
State<br />
Rate<br />
2.14%<br />
5.31%<br />
25.97%<br />
38.22%<br />
28.36%<br />
State<br />
Target<br />
LEA<br />
Rate<br />
LEA<br />
Rate<br />
— —<br />
— —<br />
— —<br />
— —<br />
— —<br />
Target<br />
Met by<br />
LEA(Y/N)<br />
B) Acquisition and Use of<br />
Knowledge and Skills<br />
(Including early language/<br />
communication and early literacy)<br />
B) Acquisition and Use of<br />
Knowledge and Skills **<br />
State<br />
Rate<br />
1.75%<br />
6.59%<br />
34.23%<br />
43.51%<br />
13.92%<br />
State<br />
Target<br />
LEA<br />
Rate<br />
Target<br />
Met by<br />
LEA(Y/N)<br />
C) Use of Appropriate Behaviors<br />
to Meet Their Needs<br />
State<br />
Rate<br />
State<br />
Target<br />
LEA<br />
Rate<br />
Target<br />
Met by<br />
LEA(Y/N)<br />
89.61% 90.50% — — N/A 90.31% 90.50% — — N/A 90.82% 92.50% — — N/A<br />
66.58% 69.50% — — N/A 57.43% 60.50% — — N/A 76.69% 78.50% — — N/A<br />
NOTE: * Including social relationships ** Including early language/ communication and early literacy<br />
Note: - - denotes not applicable<br />
State<br />
Rate<br />
LEA<br />
Rate<br />
— —<br />
— —<br />
— —<br />
— —<br />
— —<br />
C) Use of<br />
Appropriate<br />
Behaviors to<br />
Meet Their Needs<br />
State<br />
Rate<br />
4.51%<br />
17.34%<br />
41.72%<br />
34.97%<br />
LEA<br />
Rate<br />
1.46% — —<br />
— —<br />
— —<br />
— —<br />
— —<br />
Page 3 of 5
LEA: 3003 - MAGNET COVE SCHOOL <strong>DISTRICT</strong><br />
Indicator 08: Parent Involvement<br />
Percent of surveyed<br />
parents who reported<br />
school facilitated parent<br />
involvement as a means<br />
of improving services<br />
and results for children<br />
with disabilities.<br />
Early Childhood<br />
(3-5)<br />
School Age<br />
(5-21)<br />
State<br />
Rate<br />
90.47%<br />
95.05%<br />
Indicator 09: Disproportionality - Eligibility<br />
Disproportionate representation of racial<br />
and ethnic groups in special education and<br />
related services that is a result of<br />
inappropriate identification (e.g.<br />
monitoring data, review of policies,<br />
practices, and procedures under 618(d),<br />
etc.).<br />
State<br />
Rate<br />
State<br />
Target<br />
88.00%<br />
96.00%<br />
State<br />
Target<br />
0.00% 0.00%<br />
LEA<br />
Rate<br />
— —<br />
87.50%<br />
Indicator 10: Disproportionality-Child with a Disability<br />
Disproportionate representation of racial<br />
and ethnic groups in specific disability<br />
categories that is a result of inappropriate<br />
identification (e.g. monitoring data, review<br />
of policies, practices, and procedures under<br />
618(d), etc.).<br />
Indicator 11: Child Find<br />
Percent of children with<br />
parental consent to evaluate<br />
who are evaluated within<br />
the State established timeline<br />
of 60 days.<br />
Overall<br />
(3-21)<br />
Early Childhood<br />
(3-5)<br />
School Age<br />
(5-21)<br />
State<br />
Rate<br />
0.00%<br />
Indicator 12: Early Childhood Transition<br />
Percent of children referred by Part C prior to<br />
age 3, who are found eligible for Part B, and<br />
who have an IEP developed and implemented<br />
by their third birthday.<br />
Note: - - denotes not applicable<br />
State<br />
Rate<br />
99.41%<br />
99.70%<br />
98.97%<br />
State<br />
Rate<br />
State<br />
Target<br />
0.00%<br />
State<br />
Target<br />
100.00%<br />
100.00%<br />
100.00%<br />
State<br />
Target<br />
Target Met by<br />
LEA (Y/N)<br />
Y<br />
Target Met by<br />
LEA (Y/N)<br />
Y<br />
LEA<br />
Rate<br />
100.00%<br />
— —<br />
100.00%<br />
LEA<br />
Rate<br />
Target Met by<br />
LEA (Y/N)<br />
N/A<br />
N<br />
Note: The target for Indicator 09 is to have zero percent<br />
(0%) of districts identified as having disproportionate<br />
representation as a result of inappropriate<br />
identification in eligibility.<br />
Note: The target for Indicator 10 is to have zero<br />
percent (0%) of districts identified as having<br />
disproportionate representation as a result of<br />
inappropriate identification in a disability<br />
category.<br />
Target Met by<br />
LEA (Y/N)<br />
N/A<br />
Y<br />
Target Met<br />
by LEA<br />
(Y/N)<br />
99.21% 100.00% - - N/A<br />
Y<br />
Note: * Indicates a zero reponse rate for the<br />
district.<br />
Page 4 of 5
LEA: 3003 - MAGNET COVE SCHOOL <strong>DISTRICT</strong><br />
Indicator 13: Secondary Transition<br />
Percent of youth with disabilities aged 16 and<br />
up with an IEP that includes coordinated,<br />
measurable, annual IEP goals and transition<br />
services that will reasonably enable the student<br />
to meet the post-secondary goals.<br />
Indicator 14: Post-School Outcomes<br />
A. Percent of youth enrolled in higher<br />
education within one year of leaving high<br />
school.<br />
State<br />
Rate<br />
State<br />
Target<br />
Note: Data for this Indicator is from the on-site monitoring of LEAs for the given year.<br />
B. Percent of youth enrolled in higher<br />
education or competitively employed<br />
within one year of leaving high school.<br />
C. Percent of youth enrolled in higher<br />
education or in some other postsecondary<br />
education or training program; or<br />
competitively employed or in some other<br />
employment within one year of leaving<br />
high school.<br />
State<br />
Rate<br />
Indicator 20: Reported Data-Timely and Accurate*<br />
District submitted<br />
required data elements<br />
on or before due dates;<br />
made revisions within<br />
the alloted reveiw<br />
periods.<br />
Accurate and Timely<br />
Data Submission<br />
Overall (3-21)<br />
Early Childhood (3-5)<br />
School Age (5-21)<br />
State<br />
Target<br />
100.00%<br />
100.00%<br />
100.00%<br />
State<br />
Target<br />
LEA<br />
Rate<br />
LEA<br />
Rate<br />
Target Met by<br />
LEA (Y/N)<br />
Target Met<br />
by LEA<br />
(Y/N)<br />
Target Met<br />
by LEA<br />
(Y/N)<br />
*Data reviewed for timely and accurate submissions included all APSCN cycle data except for personnel<br />
Note: - - denotes not applicable<br />
96.19 100.00 — — N/A<br />
14.53<br />
State<br />
Rate<br />
49.42<br />
State<br />
Rate<br />
54.07<br />
13.00<br />
State<br />
Target<br />
49.00<br />
State<br />
Target<br />
60.00<br />
Y<br />
N/A<br />
Y<br />
0.00%<br />
LEA<br />
Rate<br />
100.00%<br />
LEA<br />
Rate<br />
100.00%<br />
N<br />
Target Met<br />
by LEA<br />
(Y/N)<br />
Y<br />
Target Met<br />
by LEA<br />
(Y/N)<br />
Y<br />
Page 5 of 5
LEA: 3004 - MALVERN SCHOOL <strong>DISTRICT</strong><br />
<strong>ARKANSAS</strong> <strong>SPECIAL</strong> <strong>EDUCATION</strong><br />
<strong>DISTRICT</strong> <strong>ANNUAL</strong> PERFORMANCE REPORT<br />
2010/11 School Year<br />
Publication Date: March 2012<br />
Each State must have in place a State Performance Plan (SPP) to evaluate the State's efforts to meet the requirements and<br />
purposes of the implementation of the Individuals with Disabilities Education Act (IDEA). The SPP is a six-year plan, which<br />
describes Arkansas's performance on 20 indicators. The Office of Special Education Programs in the U. S. Department of<br />
Education requires that States report annually to the public on the performance of each local education agency (LEA) on 14 of<br />
20 indicators as compared with targets established by the State in the SPP. Arkansas will report indicators 1 through 14 and<br />
20 for each LEA serving children with disabilities (CWD). Any LEA not meeting targets on compliance indicators (0% for<br />
Indicators 4B, 09 & 10 and 100% for Indicators 11, 12, 13, and 20) are non-compliant with IDEA.<br />
There are no report changes for the 2010/11 school year profile; However, it is important to recognize that: .<br />
1. Indicator 01 (Graduation) is reported a year in arrear (2009/10 graduates) and is based on a four-year cohort. This<br />
means the rate is a measure of students who entered in ninth grade and graduate in four years. The calculation is a<br />
requirement under Title I of the Elementary and Secondary Education Act (ESEA).<br />
2. Indicator 02 (Drop out) is reported a year in arrear. This means the rate is a measure of students who dropped out in<br />
the 2009/10 school year. The Indicator 02 data are aligned with the Common Core of Data (CCD) requirements for<br />
grades 7-12.<br />
3. Indicator 04A and 4B (Suspension/Expulsion) is reported a year in arrear. This means the rate is a measure of<br />
students who had out-of-school suspensions and/or expulsions totaling more than 10 days.<br />
Percent of youth<br />
with IEPs<br />
graduating from<br />
high school with a<br />
regular diploma<br />
For a complete description of all the Indicators, please visit the special education website at<br />
http://arksped.k12.ar.us/sections/policy.html<br />
Indicator 01: Graduation Rates (2009/10 school year) Indicator 02: Dropout Rates (2009/10 school year)<br />
State<br />
Rate<br />
State<br />
Target<br />
75.76% 85.00%<br />
LEA<br />
Rate<br />
70.59%<br />
Target Met<br />
by LEA<br />
(Y/N)<br />
N<br />
Percent of<br />
youth with<br />
IEPs dropping<br />
out of high<br />
school<br />
State<br />
Rate<br />
Indicator 03: Assessment on Statewide Benchmark Exam (grades 3-8, 11)<br />
A) Adequate Yearly Progress<br />
n=40<br />
Literacy<br />
Mathematics<br />
Met Disability Subgroup "n"<br />
for Reporting Purposes (Y/N)<br />
State Target for % of Districts Meeting<br />
AYP for Disability Subgroup<br />
State<br />
Target<br />
3.06% 4.20%<br />
LEA<br />
Rate<br />
2.68%<br />
% of Districts Meeting AYP<br />
for Disability Subgroup<br />
Target Met by<br />
LEA (Y/N)<br />
Y<br />
Target Met by<br />
LEA(Y/N)<br />
Overall N 17.15% 6.25%<br />
NA<br />
N<br />
N<br />
Note: For a district to qualify as having a disability subgroup it must have a minimum of 40 (n=40) students with disabilities in a school building.<br />
B) Participation<br />
Participation Rate: # of<br />
CWD Tested ÷ # of CWD<br />
Enrolled in grades tested.<br />
Participation Rate: Literacy<br />
Participation Rate: Math<br />
Note: - - denotes not applicable<br />
State<br />
Rate<br />
98.78%<br />
State<br />
Target<br />
95.00%<br />
LEA<br />
Rate<br />
100.00%<br />
Target Met<br />
by LEA (Y/N)<br />
98.61% 95.00% 99.25% Y<br />
Y<br />
C) Performance Proficiency<br />
Percent of CWD Scoring<br />
Proficient or Above<br />
Proficiency Rate: Literacy<br />
Proficiency Rate:<br />
Mathematics<br />
16.00%<br />
16.00%<br />
State<br />
Rate<br />
31.49%<br />
44.86%<br />
State<br />
Target<br />
45.22%<br />
51.14%<br />
LEA<br />
Rate<br />
22.86%<br />
34.51%<br />
NA<br />
NA<br />
Target<br />
Met by<br />
LEA (Y/N)<br />
N<br />
N<br />
Page 1 of 5
LEA: 3004 - MALVERN SCHOOL <strong>DISTRICT</strong><br />
Indicator 04: Out-of-School Suspensions and Expulsions (2009/10 school year)<br />
A) Suspension/Expulsion<br />
Percent difference of CWD with out-of- school suspensions and<br />
expulsions totaling greater than 10 days in a school year as<br />
compared to the same data for general education students in<br />
the district.<br />
B) Suspension/Expulsion by Race and Ethnicity<br />
Percent of districts that have: (a) a significant discrepancy, by race or<br />
ethnicity, in the rate of suspensions and expulsions of greater than 10<br />
days in a school year for children with IEPs; and (b) policies,<br />
procedures or practices that contribute to the significant discrepancy<br />
and do not comply with requirements relating to the development<br />
and implementation of IEPs, the use of positive behavioral<br />
interventions and supports, and procedural safeguards.<br />
Indicator 05: School Age (5-21) Least Restrictive Environment<br />
A) In the Regular Class 80% or more of the day<br />
Percent of CWD with<br />
IEPs receiving instruction<br />
in the regular class 80%<br />
or more of the day.<br />
State<br />
Rate<br />
State<br />
Target<br />
LEA<br />
Rate<br />
B) In the Regular Class less than 40% of the day<br />
Percent of CWD with<br />
IEPs receiving instruction<br />
in the regular class less<br />
than 60% of the day.<br />
53.87% 59.77%<br />
State<br />
Rate<br />
State<br />
Target<br />
12.42% 12.51%<br />
58.97%<br />
LEA<br />
Rate<br />
10.62%<br />
C) Other Settings outside the regular class<br />
Percent of CWD with IEPs served in<br />
public or private separate schools,<br />
residential placements, or<br />
homebound/hospital placements.<br />
State<br />
Rate<br />
State<br />
Target<br />
2.80% 2.56%<br />
Target Met<br />
by LEA (Y/N)<br />
N<br />
Target Met<br />
by LEA (Y/N)<br />
Y<br />
LEA<br />
Rate<br />
3.30%<br />
Target Met<br />
by LEA(Y/N)<br />
Indicator 06: Early Childhood (3-5) Least Restrictive Environment<br />
A) Regular Early Childhood Program<br />
Percent of children (aged 3 through 5) with IEPs attending a regular<br />
early childhood program and receiving the majority of special<br />
education and related services in the regular early childhood program<br />
Allowable<br />
Difference<br />
LEA: 3004 - MALVERN SCHOOL <strong>DISTRICT</strong><br />
Indicator 07: Preschool (3-5) Outcomes<br />
a) Percent of preschool CWD<br />
children who did not<br />
improve functioning.<br />
b) Percent of preschool CWD<br />
who improved but whose<br />
functioning remained below<br />
same age peers.<br />
c) Percent of preschool CWD<br />
who improved at a level<br />
nearer to same aged peers.<br />
d) Percent of preschool CWD<br />
who improved functioning to<br />
reach a level comparable to<br />
same age peers.<br />
e) Percent of preschool CWD<br />
children who maintain<br />
functioning at a level<br />
comparable to same aged<br />
peers.<br />
Summary<br />
Statements<br />
1) Of those preschool<br />
children who entered<br />
the preschool program<br />
below age expectations<br />
in each Outcome, the<br />
percent who<br />
substantially increased<br />
their rate of growth by<br />
the time they turned 6<br />
years of age or exited<br />
the program.<br />
2) The percent of<br />
preschool children who<br />
were functioning<br />
within age expectations<br />
in each Outcome by the<br />
time they turned 6<br />
years of age or exited<br />
A) Positive Social -Emotional<br />
Skills*<br />
State<br />
Rate<br />
A) Positive Social -<br />
Emotional Skills<br />
(Including social<br />
relationships)<br />
State<br />
Rate<br />
2.14%<br />
5.31%<br />
25.97%<br />
38.22%<br />
28.36%<br />
State<br />
Target<br />
LEA<br />
Rate<br />
LEA<br />
Rate<br />
— —<br />
— —<br />
— —<br />
— —<br />
— —<br />
Target<br />
Met by<br />
LEA(Y/N)<br />
B) Acquisition and Use of<br />
Knowledge and Skills<br />
(Including early language/<br />
communication and early literacy)<br />
B) Acquisition and Use of<br />
Knowledge and Skills **<br />
State<br />
Rate<br />
1.75%<br />
6.59%<br />
34.23%<br />
43.51%<br />
13.92%<br />
State<br />
Target<br />
LEA<br />
Rate<br />
Target<br />
Met by<br />
LEA(Y/N)<br />
C) Use of Appropriate Behaviors<br />
to Meet Their Needs<br />
State<br />
Rate<br />
State<br />
Target<br />
LEA<br />
Rate<br />
Target<br />
Met by<br />
LEA(Y/N)<br />
89.61% 90.50% — — N/A 90.31% 90.50% — — N/A 90.82% 92.50% — — N/A<br />
66.58% 69.50% — — N/A 57.43% 60.50% — — N/A 76.69% 78.50% — — N/A<br />
NOTE: * Including social relationships ** Including early language/ communication and early literacy<br />
Note: - - denotes not applicable<br />
State<br />
Rate<br />
LEA<br />
Rate<br />
— —<br />
— —<br />
— —<br />
— —<br />
— —<br />
C) Use of<br />
Appropriate<br />
Behaviors to<br />
Meet Their Needs<br />
State<br />
Rate<br />
4.51%<br />
17.34%<br />
41.72%<br />
34.97%<br />
LEA<br />
Rate<br />
1.46% — —<br />
— —<br />
— —<br />
— —<br />
— —<br />
Page 3 of 5
LEA: 3004 - MALVERN SCHOOL <strong>DISTRICT</strong><br />
Indicator 08: Parent Involvement<br />
Percent of surveyed<br />
parents who reported<br />
school facilitated parent<br />
involvement as a means<br />
of improving services<br />
and results for children<br />
with disabilities.<br />
Early Childhood<br />
(3-5)<br />
School Age<br />
(5-21)<br />
State<br />
Rate<br />
90.47%<br />
95.05%<br />
Indicator 09: Disproportionality - Eligibility<br />
Disproportionate representation of racial<br />
and ethnic groups in special education and<br />
related services that is a result of<br />
inappropriate identification (e.g.<br />
monitoring data, review of policies,<br />
practices, and procedures under 618(d),<br />
etc.).<br />
State<br />
Rate<br />
State<br />
Target<br />
88.00%<br />
96.00%<br />
State<br />
Target<br />
0.00% 0.00%<br />
LEA<br />
Rate<br />
— —<br />
90.00%<br />
Indicator 10: Disproportionality-Child with a Disability<br />
Disproportionate representation of racial<br />
and ethnic groups in specific disability<br />
categories that is a result of inappropriate<br />
identification (e.g. monitoring data, review<br />
of policies, practices, and procedures under<br />
618(d), etc.).<br />
Indicator 11: Child Find<br />
Percent of children with<br />
parental consent to evaluate<br />
who are evaluated within<br />
the State established timeline<br />
of 60 days.<br />
Overall<br />
(3-21)<br />
Early Childhood<br />
(3-5)<br />
School Age<br />
(5-21)<br />
State<br />
Rate<br />
0.00%<br />
Indicator 12: Early Childhood Transition<br />
Percent of children referred by Part C prior to<br />
age 3, who are found eligible for Part B, and<br />
who have an IEP developed and implemented<br />
by their third birthday.<br />
Note: - - denotes not applicable<br />
State<br />
Rate<br />
99.41%<br />
99.70%<br />
98.97%<br />
State<br />
Rate<br />
State<br />
Target<br />
0.00%<br />
State<br />
Target<br />
100.00%<br />
100.00%<br />
100.00%<br />
State<br />
Target<br />
Target Met by<br />
LEA (Y/N)<br />
Y<br />
Target Met by<br />
LEA (Y/N)<br />
Y<br />
LEA<br />
Rate<br />
100.00%<br />
— —<br />
100.00%<br />
LEA<br />
Rate<br />
Target Met by<br />
LEA (Y/N)<br />
N/A<br />
N<br />
Note: The target for Indicator 09 is to have zero percent<br />
(0%) of districts identified as having disproportionate<br />
representation as a result of inappropriate<br />
identification in eligibility.<br />
Note: The target for Indicator 10 is to have zero<br />
percent (0%) of districts identified as having<br />
disproportionate representation as a result of<br />
inappropriate identification in a disability<br />
category.<br />
Target Met by<br />
LEA (Y/N)<br />
N/A<br />
Y<br />
Target Met<br />
by LEA<br />
(Y/N)<br />
99.21% 100.00% - - N/A<br />
Y<br />
Note: * Indicates a zero reponse rate for the<br />
district.<br />
Page 4 of 5
LEA: 3004 - MALVERN SCHOOL <strong>DISTRICT</strong><br />
Indicator 13: Secondary Transition<br />
Percent of youth with disabilities aged 16 and<br />
up with an IEP that includes coordinated,<br />
measurable, annual IEP goals and transition<br />
services that will reasonably enable the student<br />
to meet the post-secondary goals.<br />
Indicator 14: Post-School Outcomes<br />
A. Percent of youth enrolled in higher<br />
education within one year of leaving high<br />
school.<br />
State<br />
Rate<br />
State<br />
Target<br />
Note: Data for this Indicator is from the on-site monitoring of LEAs for the given year.<br />
B. Percent of youth enrolled in higher<br />
education or competitively employed<br />
within one year of leaving high school.<br />
C. Percent of youth enrolled in higher<br />
education or in some other postsecondary<br />
education or training program; or<br />
competitively employed or in some other<br />
employment within one year of leaving<br />
high school.<br />
State<br />
Rate<br />
Indicator 20: Reported Data-Timely and Accurate*<br />
District submitted<br />
required data elements<br />
on or before due dates;<br />
made revisions within<br />
the alloted reveiw<br />
periods.<br />
Accurate and Timely<br />
Data Submission<br />
Overall (3-21)<br />
Early Childhood (3-5)<br />
School Age (5-21)<br />
State<br />
Target<br />
100.00%<br />
100.00%<br />
100.00%<br />
State<br />
Target<br />
LEA<br />
Rate<br />
LEA<br />
Rate<br />
Target Met by<br />
LEA (Y/N)<br />
Target Met<br />
by LEA<br />
(Y/N)<br />
Target Met<br />
by LEA<br />
(Y/N)<br />
*Data reviewed for timely and accurate submissions included all APSCN cycle data except for personnel<br />
Note: - - denotes not applicable<br />
96.19 100.00 — — N/A<br />
14.53<br />
State<br />
Rate<br />
49.42<br />
State<br />
Rate<br />
54.07<br />
13.00<br />
State<br />
Target<br />
49.00<br />
State<br />
Target<br />
60.00<br />
Y<br />
N/A<br />
Y<br />
— —<br />
LEA<br />
Rate<br />
— —<br />
LEA<br />
Rate<br />
— —<br />
N/A<br />
Target Met<br />
by LEA<br />
(Y/N)<br />
N/A<br />
Target Met<br />
by LEA<br />
(Y/N)<br />
N/A<br />
Page 5 of 5
LEA: 3005 - OUACHITA SCHOOL <strong>DISTRICT</strong><br />
<strong>ARKANSAS</strong> <strong>SPECIAL</strong> <strong>EDUCATION</strong><br />
<strong>DISTRICT</strong> <strong>ANNUAL</strong> PERFORMANCE REPORT<br />
2010/11 School Year<br />
Publication Date: March 2012<br />
Each State must have in place a State Performance Plan (SPP) to evaluate the State's efforts to meet the requirements and<br />
purposes of the implementation of the Individuals with Disabilities Education Act (IDEA). The SPP is a six-year plan, which<br />
describes Arkansas's performance on 20 indicators. The Office of Special Education Programs in the U. S. Department of<br />
Education requires that States report annually to the public on the performance of each local education agency (LEA) on 14 of<br />
20 indicators as compared with targets established by the State in the SPP. Arkansas will report indicators 1 through 14 and<br />
20 for each LEA serving children with disabilities (CWD). Any LEA not meeting targets on compliance indicators (0% for<br />
Indicators 4B, 09 & 10 and 100% for Indicators 11, 12, 13, and 20) are non-compliant with IDEA.<br />
There are no report changes for the 2010/11 school year profile; However, it is important to recognize that: .<br />
1. Indicator 01 (Graduation) is reported a year in arrear (2009/10 graduates) and is based on a four-year cohort. This<br />
means the rate is a measure of students who entered in ninth grade and graduate in four years. The calculation is a<br />
requirement under Title I of the Elementary and Secondary Education Act (ESEA).<br />
2. Indicator 02 (Drop out) is reported a year in arrear. This means the rate is a measure of students who dropped out in<br />
the 2009/10 school year. The Indicator 02 data are aligned with the Common Core of Data (CCD) requirements for<br />
grades 7-12.<br />
3. Indicator 04A and 4B (Suspension/Expulsion) is reported a year in arrear. This means the rate is a measure of<br />
students who had out-of-school suspensions and/or expulsions totaling more than 10 days.<br />
Percent of youth<br />
with IEPs<br />
graduating from<br />
high school with a<br />
regular diploma<br />
For a complete description of all the Indicators, please visit the special education website at<br />
http://arksped.k12.ar.us/sections/policy.html<br />
Indicator 01: Graduation Rates (2009/10 school year) Indicator 02: Dropout Rates (2009/10 school year)<br />
State<br />
Rate<br />
State<br />
Target<br />
75.76% 85.00%<br />
LEA<br />
Rate<br />
100.00%<br />
Target Met<br />
by LEA<br />
(Y/N)<br />
Y<br />
Percent of<br />
youth with<br />
IEPs dropping<br />
out of high<br />
school<br />
State<br />
Rate<br />
Indicator 03: Assessment on Statewide Benchmark Exam (grades 3-8, 11)<br />
A) Adequate Yearly Progress<br />
n=40<br />
Literacy<br />
Mathematics<br />
Met Disability Subgroup "n"<br />
for Reporting Purposes (Y/N)<br />
State Target for % of Districts Meeting<br />
AYP for Disability Subgroup<br />
State<br />
Target<br />
3.06% 4.20%<br />
LEA<br />
Rate<br />
4.76%<br />
% of Districts Meeting AYP<br />
for Disability Subgroup<br />
Target Met by<br />
LEA (Y/N)<br />
N<br />
Target Met by<br />
LEA(Y/N)<br />
Overall N 17.15% 6.25%<br />
NA<br />
N<br />
N<br />
Note: For a district to qualify as having a disability subgroup it must have a minimum of 40 (n=40) students with disabilities in a school building.<br />
B) Participation<br />
Participation Rate: # of<br />
CWD Tested ÷ # of CWD<br />
Enrolled in grades tested.<br />
Participation Rate: Literacy<br />
Participation Rate: Math<br />
Note: - - denotes not applicable<br />
State<br />
Rate<br />
98.78%<br />
State<br />
Target<br />
95.00%<br />
LEA<br />
Rate<br />
100.00%<br />
Target Met<br />
by LEA (Y/N)<br />
98.61% 95.00% 100.00% Y<br />
Y<br />
C) Performance Proficiency<br />
Percent of CWD Scoring<br />
Proficient or Above<br />
Proficiency Rate: Literacy<br />
Proficiency Rate:<br />
Mathematics<br />
16.00%<br />
16.00%<br />
State<br />
Rate<br />
31.49%<br />
44.86%<br />
State<br />
Target<br />
45.22%<br />
51.14%<br />
LEA<br />
Rate<br />
23.53%<br />
33.33%<br />
NA<br />
NA<br />
Target<br />
Met by<br />
LEA (Y/N)<br />
N<br />
N<br />
Page 1 of 5
LEA: 3005 - OUACHITA SCHOOL <strong>DISTRICT</strong><br />
Indicator 04: Out-of-School Suspensions and Expulsions (2009/10 school year)<br />
A) Suspension/Expulsion<br />
Percent difference of CWD with out-of- school suspensions and<br />
expulsions totaling greater than 10 days in a school year as<br />
compared to the same data for general education students in<br />
the district.<br />
B) Suspension/Expulsion by Race and Ethnicity<br />
Percent of districts that have: (a) a significant discrepancy, by race or<br />
ethnicity, in the rate of suspensions and expulsions of greater than 10<br />
days in a school year for children with IEPs; and (b) policies,<br />
procedures or practices that contribute to the significant discrepancy<br />
and do not comply with requirements relating to the development<br />
and implementation of IEPs, the use of positive behavioral<br />
interventions and supports, and procedural safeguards.<br />
Indicator 05: School Age (5-21) Least Restrictive Environment<br />
A) In the Regular Class 80% or more of the day<br />
Percent of CWD with<br />
IEPs receiving instruction<br />
in the regular class 80%<br />
or more of the day.<br />
State<br />
Rate<br />
State<br />
Target<br />
LEA<br />
Rate<br />
B) In the Regular Class less than 40% of the day<br />
Percent of CWD with<br />
IEPs receiving instruction<br />
in the regular class less<br />
than 60% of the day.<br />
53.87% 59.77%<br />
State<br />
Rate<br />
State<br />
Target<br />
12.42% 12.51%<br />
73.33%<br />
LEA<br />
Rate<br />
2.22%<br />
C) Other Settings outside the regular class<br />
Percent of CWD with IEPs served in<br />
public or private separate schools,<br />
residential placements, or<br />
homebound/hospital placements.<br />
State<br />
Rate<br />
State<br />
Target<br />
2.80% 2.56%<br />
Target Met<br />
by LEA (Y/N)<br />
Y<br />
Target Met<br />
by LEA (Y/N)<br />
Y<br />
LEA<br />
Rate<br />
2.22%<br />
Target Met<br />
by LEA(Y/N)<br />
Indicator 06: Early Childhood (3-5) Least Restrictive Environment<br />
A) Regular Early Childhood Program<br />
Percent of children (aged 3 through 5) with IEPs attending a regular<br />
early childhood program and receiving the majority of special<br />
education and related services in the regular early childhood program<br />
Allowable<br />
Difference<br />
LEA: 3005 - OUACHITA SCHOOL <strong>DISTRICT</strong><br />
Indicator 07: Preschool (3-5) Outcomes<br />
a) Percent of preschool CWD<br />
children who did not<br />
improve functioning.<br />
b) Percent of preschool CWD<br />
who improved but whose<br />
functioning remained below<br />
same age peers.<br />
c) Percent of preschool CWD<br />
who improved at a level<br />
nearer to same aged peers.<br />
d) Percent of preschool CWD<br />
who improved functioning to<br />
reach a level comparable to<br />
same age peers.<br />
e) Percent of preschool CWD<br />
children who maintain<br />
functioning at a level<br />
comparable to same aged<br />
peers.<br />
Summary<br />
Statements<br />
1) Of those preschool<br />
children who entered<br />
the preschool program<br />
below age expectations<br />
in each Outcome, the<br />
percent who<br />
substantially increased<br />
their rate of growth by<br />
the time they turned 6<br />
years of age or exited<br />
the program.<br />
2) The percent of<br />
preschool children who<br />
were functioning<br />
within age expectations<br />
in each Outcome by the<br />
time they turned 6<br />
years of age or exited<br />
A) Positive Social -Emotional<br />
Skills*<br />
State<br />
Rate<br />
A) Positive Social -<br />
Emotional Skills<br />
(Including social<br />
relationships)<br />
State<br />
Rate<br />
2.14%<br />
5.31%<br />
25.97%<br />
38.22%<br />
28.36%<br />
State<br />
Target<br />
LEA<br />
Rate<br />
LEA<br />
Rate<br />
— —<br />
— —<br />
— —<br />
— —<br />
— —<br />
Target<br />
Met by<br />
LEA(Y/N)<br />
B) Acquisition and Use of<br />
Knowledge and Skills<br />
(Including early language/<br />
communication and early literacy)<br />
B) Acquisition and Use of<br />
Knowledge and Skills **<br />
State<br />
Rate<br />
1.75%<br />
6.59%<br />
34.23%<br />
43.51%<br />
13.92%<br />
State<br />
Target<br />
LEA<br />
Rate<br />
Target<br />
Met by<br />
LEA(Y/N)<br />
C) Use of Appropriate Behaviors<br />
to Meet Their Needs<br />
State<br />
Rate<br />
State<br />
Target<br />
LEA<br />
Rate<br />
Target<br />
Met by<br />
LEA(Y/N)<br />
89.61% 90.50% — — N/A 90.31% 90.50% — — N/A 90.82% 92.50% — — N/A<br />
66.58% 69.50% — — N/A 57.43% 60.50% — — N/A 76.69% 78.50% — — N/A<br />
NOTE: * Including social relationships ** Including early language/ communication and early literacy<br />
Note: - - denotes not applicable<br />
State<br />
Rate<br />
LEA<br />
Rate<br />
— —<br />
— —<br />
— —<br />
— —<br />
— —<br />
C) Use of<br />
Appropriate<br />
Behaviors to<br />
Meet Their Needs<br />
State<br />
Rate<br />
4.51%<br />
17.34%<br />
41.72%<br />
34.97%<br />
LEA<br />
Rate<br />
1.46% — —<br />
— —<br />
— —<br />
— —<br />
— —<br />
Page 3 of 5
LEA: 3005 - OUACHITA SCHOOL <strong>DISTRICT</strong><br />
Indicator 08: Parent Involvement<br />
Percent of surveyed<br />
parents who reported<br />
school facilitated parent<br />
involvement as a means<br />
of improving services<br />
and results for children<br />
with disabilities.<br />
Early Childhood<br />
(3-5)<br />
School Age<br />
(5-21)<br />
State<br />
Rate<br />
90.47%<br />
95.05%<br />
Indicator 09: Disproportionality - Eligibility<br />
Disproportionate representation of racial<br />
and ethnic groups in special education and<br />
related services that is a result of<br />
inappropriate identification (e.g.<br />
monitoring data, review of policies,<br />
practices, and procedures under 618(d),<br />
etc.).<br />
State<br />
Rate<br />
State<br />
Target<br />
88.00%<br />
96.00%<br />
State<br />
Target<br />
0.00% 0.00%<br />
LEA<br />
Rate<br />
— —<br />
96.00%<br />
Indicator 10: Disproportionality-Child with a Disability<br />
Disproportionate representation of racial<br />
and ethnic groups in specific disability<br />
categories that is a result of inappropriate<br />
identification (e.g. monitoring data, review<br />
of policies, practices, and procedures under<br />
618(d), etc.).<br />
Indicator 11: Child Find<br />
Percent of children with<br />
parental consent to evaluate<br />
who are evaluated within<br />
the State established timeline<br />
of 60 days.<br />
Overall<br />
(3-21)<br />
Early Childhood<br />
(3-5)<br />
School Age<br />
(5-21)<br />
State<br />
Rate<br />
0.00%<br />
Indicator 12: Early Childhood Transition<br />
Percent of children referred by Part C prior to<br />
age 3, who are found eligible for Part B, and<br />
who have an IEP developed and implemented<br />
by their third birthday.<br />
Note: - - denotes not applicable<br />
State<br />
Rate<br />
99.41%<br />
99.70%<br />
98.97%<br />
State<br />
Rate<br />
State<br />
Target<br />
0.00%<br />
State<br />
Target<br />
100.00%<br />
100.00%<br />
100.00%<br />
State<br />
Target<br />
Target Met by<br />
LEA (Y/N)<br />
Y<br />
Target Met by<br />
LEA (Y/N)<br />
Y<br />
LEA<br />
Rate<br />
100.00%<br />
— —<br />
100.00%<br />
LEA<br />
Rate<br />
Target Met by<br />
LEA (Y/N)<br />
N/A<br />
Y<br />
Note: The target for Indicator 09 is to have zero percent<br />
(0%) of districts identified as having disproportionate<br />
representation as a result of inappropriate<br />
identification in eligibility.<br />
Note: The target for Indicator 10 is to have zero<br />
percent (0%) of districts identified as having<br />
disproportionate representation as a result of<br />
inappropriate identification in a disability<br />
category.<br />
Target Met by<br />
LEA (Y/N)<br />
N/A<br />
Y<br />
Target Met<br />
by LEA<br />
(Y/N)<br />
99.21% 100.00% - - N/A<br />
Y<br />
Note: * Indicates a zero reponse rate for the<br />
district.<br />
Page 4 of 5
LEA: 3005 - OUACHITA SCHOOL <strong>DISTRICT</strong><br />
Indicator 13: Secondary Transition<br />
Percent of youth with disabilities aged 16 and<br />
up with an IEP that includes coordinated,<br />
measurable, annual IEP goals and transition<br />
services that will reasonably enable the student<br />
to meet the post-secondary goals.<br />
Indicator 14: Post-School Outcomes<br />
A. Percent of youth enrolled in higher<br />
education within one year of leaving high<br />
school.<br />
State<br />
Rate<br />
State<br />
Target<br />
Note: Data for this Indicator is from the on-site monitoring of LEAs for the given year.<br />
B. Percent of youth enrolled in higher<br />
education or competitively employed<br />
within one year of leaving high school.<br />
C. Percent of youth enrolled in higher<br />
education or in some other postsecondary<br />
education or training program; or<br />
competitively employed or in some other<br />
employment within one year of leaving<br />
high school.<br />
State<br />
Rate<br />
Indicator 20: Reported Data-Timely and Accurate*<br />
District submitted<br />
required data elements<br />
on or before due dates;<br />
made revisions within<br />
the alloted reveiw<br />
periods.<br />
Accurate and Timely<br />
Data Submission<br />
Overall (3-21)<br />
Early Childhood (3-5)<br />
School Age (5-21)<br />
State<br />
Target<br />
100.00%<br />
100.00%<br />
100.00%<br />
State<br />
Target<br />
LEA<br />
Rate<br />
LEA<br />
Rate<br />
Target Met by<br />
LEA (Y/N)<br />
Target Met<br />
by LEA<br />
(Y/N)<br />
Target Met<br />
by LEA<br />
(Y/N)<br />
*Data reviewed for timely and accurate submissions included all APSCN cycle data except for personnel<br />
Note: - - denotes not applicable<br />
96.19 100.00 — — N/A<br />
14.53<br />
State<br />
Rate<br />
49.42<br />
State<br />
Rate<br />
54.07<br />
13.00<br />
State<br />
Target<br />
49.00<br />
State<br />
Target<br />
60.00<br />
Y<br />
N/A<br />
Y<br />
— —<br />
LEA<br />
Rate<br />
— —<br />
LEA<br />
Rate<br />
— —<br />
N/A<br />
Target Met<br />
by LEA<br />
(Y/N)<br />
N/A<br />
Target Met<br />
by LEA<br />
(Y/N)<br />
N/A<br />
Page 5 of 5
LEA: 3102 - DIERKS SCHOOL <strong>DISTRICT</strong><br />
<strong>ARKANSAS</strong> <strong>SPECIAL</strong> <strong>EDUCATION</strong><br />
<strong>DISTRICT</strong> <strong>ANNUAL</strong> PERFORMANCE REPORT<br />
2010/11 School Year<br />
Publication Date: March 2012<br />
Each State must have in place a State Performance Plan (SPP) to evaluate the State's efforts to meet the requirements and<br />
purposes of the implementation of the Individuals with Disabilities Education Act (IDEA). The SPP is a six-year plan, which<br />
describes Arkansas's performance on 20 indicators. The Office of Special Education Programs in the U. S. Department of<br />
Education requires that States report annually to the public on the performance of each local education agency (LEA) on 14 of<br />
20 indicators as compared with targets established by the State in the SPP. Arkansas will report indicators 1 through 14 and<br />
20 for each LEA serving children with disabilities (CWD). Any LEA not meeting targets on compliance indicators (0% for<br />
Indicators 4B, 09 & 10 and 100% for Indicators 11, 12, 13, and 20) are non-compliant with IDEA.<br />
There are no report changes for the 2010/11 school year profile; However, it is important to recognize that: .<br />
1. Indicator 01 (Graduation) is reported a year in arrear (2009/10 graduates) and is based on a four-year cohort. This<br />
means the rate is a measure of students who entered in ninth grade and graduate in four years. The calculation is a<br />
requirement under Title I of the Elementary and Secondary Education Act (ESEA).<br />
2. Indicator 02 (Drop out) is reported a year in arrear. This means the rate is a measure of students who dropped out in<br />
the 2009/10 school year. The Indicator 02 data are aligned with the Common Core of Data (CCD) requirements for<br />
grades 7-12.<br />
3. Indicator 04A and 4B (Suspension/Expulsion) is reported a year in arrear. This means the rate is a measure of<br />
students who had out-of-school suspensions and/or expulsions totaling more than 10 days.<br />
Percent of youth<br />
with IEPs<br />
graduating from<br />
high school with a<br />
regular diploma<br />
For a complete description of all the Indicators, please visit the special education website at<br />
http://arksped.k12.ar.us/sections/policy.html<br />
Indicator 01: Graduation Rates (2009/10 school year) Indicator 02: Dropout Rates (2009/10 school year)<br />
State<br />
Rate<br />
State<br />
Target<br />
75.76% 85.00%<br />
LEA<br />
Rate<br />
80.00%<br />
Target Met<br />
by LEA<br />
(Y/N)<br />
N<br />
Percent of<br />
youth with<br />
IEPs dropping<br />
out of high<br />
school<br />
State<br />
Rate<br />
Indicator 03: Assessment on Statewide Benchmark Exam (grades 3-8, 11)<br />
A) Adequate Yearly Progress<br />
n=40<br />
Literacy<br />
Mathematics<br />
Met Disability Subgroup "n"<br />
for Reporting Purposes (Y/N)<br />
State Target for % of Districts Meeting<br />
AYP for Disability Subgroup<br />
State<br />
Target<br />
3.06% 4.20%<br />
LEA<br />
Rate<br />
0.00%<br />
% of Districts Meeting AYP<br />
for Disability Subgroup<br />
Target Met by<br />
LEA (Y/N)<br />
Y<br />
Target Met by<br />
LEA(Y/N)<br />
Overall N 17.15% 6.25%<br />
NA<br />
N<br />
N<br />
Note: For a district to qualify as having a disability subgroup it must have a minimum of 40 (n=40) students with disabilities in a school building.<br />
B) Participation<br />
Participation Rate: # of<br />
CWD Tested ÷ # of CWD<br />
Enrolled in grades tested.<br />
Participation Rate: Literacy<br />
Participation Rate: Math<br />
Note: - - denotes not applicable<br />
State<br />
Rate<br />
98.78%<br />
State<br />
Target<br />
95.00%<br />
LEA<br />
Rate<br />
100.00%<br />
Target Met<br />
by LEA (Y/N)<br />
98.61% 95.00% 100.00% Y<br />
Y<br />
C) Performance Proficiency<br />
Percent of CWD Scoring<br />
Proficient or Above<br />
Proficiency Rate: Literacy<br />
Proficiency Rate:<br />
Mathematics<br />
16.00%<br />
16.00%<br />
State<br />
Rate<br />
31.49%<br />
44.86%<br />
State<br />
Target<br />
45.22%<br />
51.14%<br />
LEA<br />
Rate<br />
7.69%<br />
29.63%<br />
NA<br />
NA<br />
Target<br />
Met by<br />
LEA (Y/N)<br />
N<br />
N<br />
Page 1 of 5
LEA: 3102 - DIERKS SCHOOL <strong>DISTRICT</strong><br />
Indicator 04: Out-of-School Suspensions and Expulsions (2009/10 school year)<br />
A) Suspension/Expulsion<br />
Percent difference of CWD with out-of- school suspensions and<br />
expulsions totaling greater than 10 days in a school year as<br />
compared to the same data for general education students in<br />
the district.<br />
B) Suspension/Expulsion by Race and Ethnicity<br />
Percent of districts that have: (a) a significant discrepancy, by race or<br />
ethnicity, in the rate of suspensions and expulsions of greater than 10<br />
days in a school year for children with IEPs; and (b) policies,<br />
procedures or practices that contribute to the significant discrepancy<br />
and do not comply with requirements relating to the development<br />
and implementation of IEPs, the use of positive behavioral<br />
interventions and supports, and procedural safeguards.<br />
Indicator 05: School Age (5-21) Least Restrictive Environment<br />
A) In the Regular Class 80% or more of the day<br />
Percent of CWD with<br />
IEPs receiving instruction<br />
in the regular class 80%<br />
or more of the day.<br />
State<br />
Rate<br />
State<br />
Target<br />
LEA<br />
Rate<br />
B) In the Regular Class less than 40% of the day<br />
Percent of CWD with<br />
IEPs receiving instruction<br />
in the regular class less<br />
than 60% of the day.<br />
53.87% 59.77%<br />
State<br />
Rate<br />
State<br />
Target<br />
12.42% 12.51%<br />
57.81%<br />
LEA<br />
Rate<br />
4.69%<br />
C) Other Settings outside the regular class<br />
Percent of CWD with IEPs served in<br />
public or private separate schools,<br />
residential placements, or<br />
homebound/hospital placements.<br />
State<br />
Rate<br />
State<br />
Target<br />
2.80% 2.56%<br />
Target Met<br />
by LEA (Y/N)<br />
N<br />
Target Met<br />
by LEA (Y/N)<br />
Y<br />
LEA<br />
Rate<br />
0.00%<br />
Target Met<br />
by LEA(Y/N)<br />
Indicator 06: Early Childhood (3-5) Least Restrictive Environment<br />
A) Regular Early Childhood Program<br />
Percent of children (aged 3 through 5) with IEPs attending a regular<br />
early childhood program and receiving the majority of special<br />
education and related services in the regular early childhood program<br />
Allowable<br />
Difference<br />
LEA: 3102 - DIERKS SCHOOL <strong>DISTRICT</strong><br />
Indicator 07: Preschool (3-5) Outcomes<br />
a) Percent of preschool CWD<br />
children who did not<br />
improve functioning.<br />
b) Percent of preschool CWD<br />
who improved but whose<br />
functioning remained below<br />
same age peers.<br />
c) Percent of preschool CWD<br />
who improved at a level<br />
nearer to same aged peers.<br />
d) Percent of preschool CWD<br />
who improved functioning to<br />
reach a level comparable to<br />
same age peers.<br />
e) Percent of preschool CWD<br />
children who maintain<br />
functioning at a level<br />
comparable to same aged<br />
peers.<br />
Summary<br />
Statements<br />
1) Of those preschool<br />
children who entered<br />
the preschool program<br />
below age expectations<br />
in each Outcome, the<br />
percent who<br />
substantially increased<br />
their rate of growth by<br />
the time they turned 6<br />
years of age or exited<br />
the program.<br />
2) The percent of<br />
preschool children who<br />
were functioning<br />
within age expectations<br />
in each Outcome by the<br />
time they turned 6<br />
years of age or exited<br />
A) Positive Social -Emotional<br />
Skills*<br />
State<br />
Rate<br />
A) Positive Social -<br />
Emotional Skills<br />
(Including social<br />
relationships)<br />
State<br />
Rate<br />
2.14%<br />
5.31%<br />
25.97%<br />
38.22%<br />
28.36%<br />
State<br />
Target<br />
LEA<br />
Rate<br />
LEA<br />
Rate<br />
— —<br />
— —<br />
— —<br />
— —<br />
— —<br />
Target<br />
Met by<br />
LEA(Y/N)<br />
B) Acquisition and Use of<br />
Knowledge and Skills<br />
(Including early language/<br />
communication and early literacy)<br />
B) Acquisition and Use of<br />
Knowledge and Skills **<br />
State<br />
Rate<br />
1.75%<br />
6.59%<br />
34.23%<br />
43.51%<br />
13.92%<br />
State<br />
Target<br />
LEA<br />
Rate<br />
Target<br />
Met by<br />
LEA(Y/N)<br />
C) Use of Appropriate Behaviors<br />
to Meet Their Needs<br />
State<br />
Rate<br />
State<br />
Target<br />
LEA<br />
Rate<br />
Target<br />
Met by<br />
LEA(Y/N)<br />
89.61% 90.50% — — N/A 90.31% 90.50% — — N/A 90.82% 92.50% — — N/A<br />
66.58% 69.50% — — N/A 57.43% 60.50% — — N/A 76.69% 78.50% — — N/A<br />
NOTE: * Including social relationships ** Including early language/ communication and early literacy<br />
Note: - - denotes not applicable<br />
State<br />
Rate<br />
LEA<br />
Rate<br />
— —<br />
— —<br />
— —<br />
— —<br />
— —<br />
C) Use of<br />
Appropriate<br />
Behaviors to<br />
Meet Their Needs<br />
State<br />
Rate<br />
4.51%<br />
17.34%<br />
41.72%<br />
34.97%<br />
LEA<br />
Rate<br />
1.46% — —<br />
— —<br />
— —<br />
— —<br />
— —<br />
Page 3 of 5
LEA: 3102 - DIERKS SCHOOL <strong>DISTRICT</strong><br />
Indicator 08: Parent Involvement<br />
Percent of surveyed<br />
parents who reported<br />
school facilitated parent<br />
involvement as a means<br />
of improving services<br />
and results for children<br />
with disabilities.<br />
Early Childhood<br />
(3-5)<br />
School Age<br />
(5-21)<br />
State<br />
Rate<br />
90.47%<br />
95.05%<br />
Indicator 09: Disproportionality - Eligibility<br />
Disproportionate representation of racial<br />
and ethnic groups in special education and<br />
related services that is a result of<br />
inappropriate identification (e.g.<br />
monitoring data, review of policies,<br />
practices, and procedures under 618(d),<br />
etc.).<br />
State<br />
Rate<br />
State<br />
Target<br />
88.00%<br />
96.00%<br />
State<br />
Target<br />
0.00% 0.00%<br />
LEA<br />
Rate<br />
— —<br />
84.21%<br />
Indicator 10: Disproportionality-Child with a Disability<br />
Disproportionate representation of racial<br />
and ethnic groups in specific disability<br />
categories that is a result of inappropriate<br />
identification (e.g. monitoring data, review<br />
of policies, practices, and procedures under<br />
618(d), etc.).<br />
Indicator 11: Child Find<br />
Percent of children with<br />
parental consent to evaluate<br />
who are evaluated within<br />
the State established timeline<br />
of 60 days.<br />
Overall<br />
(3-21)<br />
Early Childhood<br />
(3-5)<br />
School Age<br />
(5-21)<br />
State<br />
Rate<br />
0.00%<br />
Indicator 12: Early Childhood Transition<br />
Percent of children referred by Part C prior to<br />
age 3, who are found eligible for Part B, and<br />
who have an IEP developed and implemented<br />
by their third birthday.<br />
Note: - - denotes not applicable<br />
State<br />
Rate<br />
99.41%<br />
99.70%<br />
98.97%<br />
State<br />
Rate<br />
State<br />
Target<br />
0.00%<br />
State<br />
Target<br />
100.00%<br />
100.00%<br />
100.00%<br />
State<br />
Target<br />
Target Met by<br />
LEA (Y/N)<br />
Y<br />
Target Met by<br />
LEA (Y/N)<br />
Y<br />
LEA<br />
Rate<br />
100.00%<br />
— —<br />
100.00%<br />
LEA<br />
Rate<br />
Target Met by<br />
LEA (Y/N)<br />
N/A<br />
N<br />
Note: The target for Indicator 09 is to have zero percent<br />
(0%) of districts identified as having disproportionate<br />
representation as a result of inappropriate<br />
identification in eligibility.<br />
Note: The target for Indicator 10 is to have zero<br />
percent (0%) of districts identified as having<br />
disproportionate representation as a result of<br />
inappropriate identification in a disability<br />
category.<br />
Target Met by<br />
LEA (Y/N)<br />
N/A<br />
Y<br />
Target Met<br />
by LEA<br />
(Y/N)<br />
99.21% 100.00% - - N/A<br />
Y<br />
Note: * Indicates a zero reponse rate for the<br />
district.<br />
Page 4 of 5
LEA: 3102 - DIERKS SCHOOL <strong>DISTRICT</strong><br />
Indicator 13: Secondary Transition<br />
Percent of youth with disabilities aged 16 and<br />
up with an IEP that includes coordinated,<br />
measurable, annual IEP goals and transition<br />
services that will reasonably enable the student<br />
to meet the post-secondary goals.<br />
Indicator 14: Post-School Outcomes<br />
A. Percent of youth enrolled in higher<br />
education within one year of leaving high<br />
school.<br />
State<br />
Rate<br />
State<br />
Target<br />
Note: Data for this Indicator is from the on-site monitoring of LEAs for the given year.<br />
B. Percent of youth enrolled in higher<br />
education or competitively employed<br />
within one year of leaving high school.<br />
C. Percent of youth enrolled in higher<br />
education or in some other postsecondary<br />
education or training program; or<br />
competitively employed or in some other<br />
employment within one year of leaving<br />
high school.<br />
State<br />
Rate<br />
Indicator 20: Reported Data-Timely and Accurate*<br />
District submitted<br />
required data elements<br />
on or before due dates;<br />
made revisions within<br />
the alloted reveiw<br />
periods.<br />
Accurate and Timely<br />
Data Submission<br />
Overall (3-21)<br />
Early Childhood (3-5)<br />
School Age (5-21)<br />
State<br />
Target<br />
100.00%<br />
100.00%<br />
100.00%<br />
State<br />
Target<br />
LEA<br />
Rate<br />
LEA<br />
Rate<br />
Target Met by<br />
LEA (Y/N)<br />
Target Met<br />
by LEA<br />
(Y/N)<br />
Target Met<br />
by LEA<br />
(Y/N)<br />
*Data reviewed for timely and accurate submissions included all APSCN cycle data except for personnel<br />
Note: - - denotes not applicable<br />
96.19 100.00 — — N/A<br />
14.53<br />
State<br />
Rate<br />
49.42<br />
State<br />
Rate<br />
54.07<br />
13.00<br />
State<br />
Target<br />
49.00<br />
State<br />
Target<br />
60.00<br />
Y<br />
N/A<br />
Y<br />
— —<br />
LEA<br />
Rate<br />
— —<br />
LEA<br />
Rate<br />
— —<br />
N/A<br />
Target Met<br />
by LEA<br />
(Y/N)<br />
N/A<br />
Target Met<br />
by LEA<br />
(Y/N)<br />
N/A<br />
Page 5 of 5
<strong>ARKANSAS</strong> <strong>SPECIAL</strong> <strong>EDUCATION</strong><br />
<strong>DISTRICT</strong> <strong>ANNUAL</strong> PERFORMANCE REPORT<br />
2010/11 School Year<br />
Publication Date: March 2012<br />
Each State must have in place a State Performance Plan (SPP) to evaluate the State's efforts to meet the requirements and<br />
purposes of the implementation of the Individuals with Disabilities Education Act (IDEA). The SPP is a six-year plan, which<br />
describes Arkansas's performance on 20 indicators. The Office of Special Education Programs in the U. S. Department of<br />
Education requires that States report annually to the public on the performance of each local education agency (LEA) on 14 of<br />
20 indicators as compared with targets established by the State in the SPP. Arkansas will report indicators 1 through 14 and<br />
20 for each LEA serving children with disabilities (CWD). Any LEA not meeting targets on compliance indicators (0% for<br />
Indicators 4B, 09 & 10 and 100% for Indicators 11, 12, 13, and 20) are non-compliant with IDEA.<br />
There are no report changes for the 2010/11 school year profile; However, it is important to recognize that: .<br />
1. Indicator 01 (Graduation) is reported a year in arrear (2009/10 graduates) and is based on a four-year cohort. This<br />
means the rate is a measure of students who entered in ninth grade and graduate in four years. The calculation is a<br />
requirement under Title I of the Elementary and Secondary Education Act (ESEA).<br />
2. Indicator 02 (Drop out) is reported a year in arrear. This means the rate is a measure of students who dropped out in<br />
the 2009/10 school year. The Indicator 02 data are aligned with the Common Core of Data (CCD) requirements for<br />
grades 7-12.<br />
3. Indicator 04A and 4B (Suspension/Expulsion) is reported a year in arrear. This means the rate is a measure of<br />
students who had out-of-school suspensions and/or expulsions totaling more than 10 days.<br />
For a complete description of all the Indicators, please visit the special education website at<br />
http://arksped.k12.ar.us/sections/policy.html<br />
LEA: 3104 - MINERAL SPRINGS SCHOOL <strong>DISTRICT</strong><br />
Indicator 01: Graduation Rates (2009/10 school year) Indicator 02: Dropout Rates (2009/10 school year)<br />
Percent of youth<br />
with IEPs<br />
graduating from<br />
high school with a<br />
regular diploma<br />
State<br />
Rate<br />
State<br />
Target<br />
75.76% 85.00%<br />
LEA<br />
Rate<br />
100.00%<br />
Target Met<br />
by LEA<br />
(Y/N)<br />
Y<br />
Percent of<br />
youth with<br />
IEPs dropping<br />
out of high<br />
school<br />
State<br />
Rate<br />
Indicator 03: Assessment on Statewide Benchmark Exam (grades 3-8, 11)<br />
A) Adequate Yearly Progress<br />
n=40<br />
Literacy<br />
Mathematics<br />
Met Disability Subgroup "n"<br />
for Reporting Purposes (Y/N)<br />
State Target for % of Districts Meeting<br />
AYP for Disability Subgroup<br />
State<br />
Target<br />
3.06% 4.20%<br />
LEA<br />
Rate<br />
0.00%<br />
% of Districts Meeting AYP<br />
for Disability Subgroup<br />
Target Met by<br />
LEA (Y/N)<br />
Y<br />
Target Met by<br />
LEA(Y/N)<br />
Overall N 17.15% 6.25%<br />
NA<br />
N<br />
N<br />
Note: For a district to qualify as having a disability subgroup it must have a minimum of 40 (n=40) students with disabilities in a school building.<br />
B) Participation<br />
Participation Rate: # of<br />
CWD Tested ÷ # of CWD<br />
Enrolled in grades tested.<br />
Participation Rate: Literacy<br />
Participation Rate: Math<br />
Note: - - denotes not applicable<br />
State<br />
Rate<br />
98.78%<br />
State<br />
Target<br />
95.00%<br />
LEA<br />
Rate<br />
100.00%<br />
Target Met<br />
by LEA (Y/N)<br />
98.61% 95.00% 100.00% Y<br />
Y<br />
C) Performance Proficiency<br />
Percent of CWD Scoring<br />
Proficient or Above<br />
Proficiency Rate: Literacy<br />
Proficiency Rate:<br />
Mathematics<br />
16.00%<br />
16.00%<br />
State<br />
Rate<br />
31.49%<br />
44.86%<br />
State<br />
Target<br />
45.22%<br />
51.14%<br />
LEA<br />
Rate<br />
19.35%<br />
33.33%<br />
NA<br />
NA<br />
Target<br />
Met by<br />
LEA (Y/N)<br />
N<br />
N<br />
Page 1 of 5
LEA: 3104 - MINERAL SPRINGS SCHOOL <strong>DISTRICT</strong><br />
Indicator 04: Out-of-School Suspensions and Expulsions (2009/10 school year)<br />
A) Suspension/Expulsion<br />
Percent difference of CWD with out-of- school suspensions and<br />
expulsions totaling greater than 10 days in a school year as<br />
compared to the same data for general education students in<br />
the district.<br />
B) Suspension/Expulsion by Race and Ethnicity<br />
Percent of districts that have: (a) a significant discrepancy, by race or<br />
ethnicity, in the rate of suspensions and expulsions of greater than 10<br />
days in a school year for children with IEPs; and (b) policies,<br />
procedures or practices that contribute to the significant discrepancy<br />
and do not comply with requirements relating to the development<br />
and implementation of IEPs, the use of positive behavioral<br />
interventions and supports, and procedural safeguards.<br />
Indicator 05: School Age (5-21) Least Restrictive Environment<br />
A) In the Regular Class 80% or more of the day<br />
Percent of CWD with<br />
IEPs receiving instruction<br />
in the regular class 80%<br />
or more of the day.<br />
State<br />
Rate<br />
State<br />
Target<br />
LEA<br />
Rate<br />
B) In the Regular Class less than 40% of the day<br />
Percent of CWD with<br />
IEPs receiving instruction<br />
in the regular class less<br />
than 60% of the day.<br />
53.87% 59.77%<br />
State<br />
Rate<br />
State<br />
Target<br />
12.42% 12.51%<br />
54.79%<br />
LEA<br />
Rate<br />
6.85%<br />
C) Other Settings outside the regular class<br />
Percent of CWD with IEPs served in<br />
public or private separate schools,<br />
residential placements, or<br />
homebound/hospital placements.<br />
State<br />
Rate<br />
State<br />
Target<br />
2.80% 2.56%<br />
Target Met<br />
by LEA (Y/N)<br />
N<br />
Target Met<br />
by LEA (Y/N)<br />
Y<br />
LEA<br />
Rate<br />
2.74%<br />
Target Met<br />
by LEA(Y/N)<br />
Indicator 06: Early Childhood (3-5) Least Restrictive Environment<br />
A) Regular Early Childhood Program<br />
Percent of children (aged 3 through 5) with IEPs attending a regular<br />
early childhood program and receiving the majority of special<br />
education and related services in the regular early childhood program<br />
Allowable<br />
Difference<br />
LEA: 3104 - MINERAL SPRINGS SCHOOL <strong>DISTRICT</strong><br />
Indicator 07: Preschool (3-5) Outcomes<br />
a) Percent of preschool CWD<br />
children who did not<br />
improve functioning.<br />
b) Percent of preschool CWD<br />
who improved but whose<br />
functioning remained below<br />
same age peers.<br />
c) Percent of preschool CWD<br />
who improved at a level<br />
nearer to same aged peers.<br />
d) Percent of preschool CWD<br />
who improved functioning to<br />
reach a level comparable to<br />
same age peers.<br />
e) Percent of preschool CWD<br />
children who maintain<br />
functioning at a level<br />
comparable to same aged<br />
peers.<br />
Summary<br />
Statements<br />
1) Of those preschool<br />
children who entered<br />
the preschool program<br />
below age expectations<br />
in each Outcome, the<br />
percent who<br />
substantially increased<br />
their rate of growth by<br />
the time they turned 6<br />
years of age or exited<br />
the program.<br />
2) The percent of<br />
preschool children who<br />
were functioning<br />
within age expectations<br />
in each Outcome by the<br />
time they turned 6<br />
years of age or exited<br />
A) Positive Social -Emotional<br />
Skills*<br />
State<br />
Rate<br />
A) Positive Social -<br />
Emotional Skills<br />
(Including social<br />
relationships)<br />
State<br />
Rate<br />
2.14%<br />
5.31%<br />
25.97%<br />
38.22%<br />
28.36%<br />
State<br />
Target<br />
LEA<br />
Rate<br />
LEA<br />
Rate<br />
— —<br />
— —<br />
— —<br />
— —<br />
— —<br />
Target<br />
Met by<br />
LEA(Y/N)<br />
B) Acquisition and Use of<br />
Knowledge and Skills<br />
(Including early language/<br />
communication and early literacy)<br />
B) Acquisition and Use of<br />
Knowledge and Skills **<br />
State<br />
Rate<br />
1.75%<br />
6.59%<br />
34.23%<br />
43.51%<br />
13.92%<br />
State<br />
Target<br />
LEA<br />
Rate<br />
Target<br />
Met by<br />
LEA(Y/N)<br />
C) Use of Appropriate Behaviors<br />
to Meet Their Needs<br />
State<br />
Rate<br />
State<br />
Target<br />
LEA<br />
Rate<br />
Target<br />
Met by<br />
LEA(Y/N)<br />
89.61% 90.50% — — N/A 90.31% 90.50% — — N/A 90.82% 92.50% — — N/A<br />
66.58% 69.50% — — N/A 57.43% 60.50% — — N/A 76.69% 78.50% — — N/A<br />
NOTE: * Including social relationships ** Including early language/ communication and early literacy<br />
Note: - - denotes not applicable<br />
State<br />
Rate<br />
LEA<br />
Rate<br />
— —<br />
— —<br />
— —<br />
— —<br />
— —<br />
C) Use of<br />
Appropriate<br />
Behaviors to<br />
Meet Their Needs<br />
State<br />
Rate<br />
4.51%<br />
17.34%<br />
41.72%<br />
34.97%<br />
LEA<br />
Rate<br />
1.46% — —<br />
— —<br />
— —<br />
— —<br />
— —<br />
Page 3 of 5
LEA: 3104 - MINERAL SPRINGS SCHOOL <strong>DISTRICT</strong><br />
Indicator 08: Parent Involvement<br />
Percent of surveyed<br />
parents who reported<br />
school facilitated parent<br />
involvement as a means<br />
of improving services<br />
and results for children<br />
with disabilities.<br />
Early Childhood<br />
(3-5)<br />
School Age<br />
(5-21)<br />
State<br />
Rate<br />
90.47%<br />
95.05%<br />
Indicator 09: Disproportionality - Eligibility<br />
Disproportionate representation of racial<br />
and ethnic groups in special education and<br />
related services that is a result of<br />
inappropriate identification (e.g.<br />
monitoring data, review of policies,<br />
practices, and procedures under 618(d),<br />
etc.).<br />
State<br />
Rate<br />
State<br />
Target<br />
88.00%<br />
96.00%<br />
State<br />
Target<br />
0.00% 0.00%<br />
LEA<br />
Rate<br />
— —<br />
97.44%<br />
Indicator 10: Disproportionality-Child with a Disability<br />
Disproportionate representation of racial<br />
and ethnic groups in specific disability<br />
categories that is a result of inappropriate<br />
identification (e.g. monitoring data, review<br />
of policies, practices, and procedures under<br />
618(d), etc.).<br />
Indicator 11: Child Find<br />
Percent of children with<br />
parental consent to evaluate<br />
who are evaluated within<br />
the State established timeline<br />
of 60 days.<br />
Overall<br />
(3-21)<br />
Early Childhood<br />
(3-5)<br />
School Age<br />
(5-21)<br />
State<br />
Rate<br />
0.00%<br />
Indicator 12: Early Childhood Transition<br />
Percent of children referred by Part C prior to<br />
age 3, who are found eligible for Part B, and<br />
who have an IEP developed and implemented<br />
by their third birthday.<br />
Note: - - denotes not applicable<br />
State<br />
Rate<br />
99.41%<br />
99.70%<br />
98.97%<br />
State<br />
Rate<br />
State<br />
Target<br />
0.00%<br />
State<br />
Target<br />
100.00%<br />
100.00%<br />
100.00%<br />
State<br />
Target<br />
Target Met by<br />
LEA (Y/N)<br />
Y<br />
Target Met by<br />
LEA (Y/N)<br />
Y<br />
LEA<br />
Rate<br />
100.00%<br />
— —<br />
100.00%<br />
LEA<br />
Rate<br />
Target Met by<br />
LEA (Y/N)<br />
N/A<br />
Y<br />
Note: The target for Indicator 09 is to have zero percent<br />
(0%) of districts identified as having disproportionate<br />
representation as a result of inappropriate<br />
identification in eligibility.<br />
Note: The target for Indicator 10 is to have zero<br />
percent (0%) of districts identified as having<br />
disproportionate representation as a result of<br />
inappropriate identification in a disability<br />
category.<br />
Target Met by<br />
LEA (Y/N)<br />
N/A<br />
Y<br />
Target Met<br />
by LEA<br />
(Y/N)<br />
99.21% 100.00% - - N/A<br />
Y<br />
Note: * Indicates a zero reponse rate for the<br />
district.<br />
Page 4 of 5
LEA: 3104 - MINERAL SPRINGS SCHOOL <strong>DISTRICT</strong><br />
Indicator 13: Secondary Transition<br />
Percent of youth with disabilities aged 16 and<br />
up with an IEP that includes coordinated,<br />
measurable, annual IEP goals and transition<br />
services that will reasonably enable the student<br />
to meet the post-secondary goals.<br />
Indicator 14: Post-School Outcomes<br />
A. Percent of youth enrolled in higher<br />
education within one year of leaving high<br />
school.<br />
State<br />
Rate<br />
State<br />
Target<br />
Note: Data for this Indicator is from the on-site monitoring of LEAs for the given year.<br />
B. Percent of youth enrolled in higher<br />
education or competitively employed<br />
within one year of leaving high school.<br />
C. Percent of youth enrolled in higher<br />
education or in some other postsecondary<br />
education or training program; or<br />
competitively employed or in some other<br />
employment within one year of leaving<br />
high school.<br />
State<br />
Rate<br />
Indicator 20: Reported Data-Timely and Accurate*<br />
District submitted<br />
required data elements<br />
on or before due dates;<br />
made revisions within<br />
the alloted reveiw<br />
periods.<br />
Accurate and Timely<br />
Data Submission<br />
Overall (3-21)<br />
Early Childhood (3-5)<br />
School Age (5-21)<br />
State<br />
Target<br />
100.00%<br />
100.00%<br />
100.00%<br />
State<br />
Target<br />
LEA<br />
Rate<br />
LEA<br />
Rate<br />
Target Met by<br />
LEA (Y/N)<br />
Target Met<br />
by LEA<br />
(Y/N)<br />
Target Met<br />
by LEA<br />
(Y/N)<br />
*Data reviewed for timely and accurate submissions included all APSCN cycle data except for personnel<br />
Note: - - denotes not applicable<br />
96.19 100.00 — — N/A<br />
14.53<br />
State<br />
Rate<br />
49.42<br />
State<br />
Rate<br />
54.07<br />
13.00<br />
State<br />
Target<br />
49.00<br />
State<br />
Target<br />
60.00<br />
Y<br />
N/A<br />
Y<br />
— —<br />
LEA<br />
Rate<br />
— —<br />
LEA<br />
Rate<br />
— —<br />
N/A<br />
Target Met<br />
by LEA<br />
(Y/N)<br />
N/A<br />
Target Met<br />
by LEA<br />
(Y/N)<br />
N/A<br />
Page 5 of 5
LEA: 3105 - NASHVILLE SCHOOL <strong>DISTRICT</strong><br />
<strong>ARKANSAS</strong> <strong>SPECIAL</strong> <strong>EDUCATION</strong><br />
<strong>DISTRICT</strong> <strong>ANNUAL</strong> PERFORMANCE REPORT<br />
2010/11 School Year<br />
Publication Date: March 2012<br />
Each State must have in place a State Performance Plan (SPP) to evaluate the State's efforts to meet the requirements and<br />
purposes of the implementation of the Individuals with Disabilities Education Act (IDEA). The SPP is a six-year plan, which<br />
describes Arkansas's performance on 20 indicators. The Office of Special Education Programs in the U. S. Department of<br />
Education requires that States report annually to the public on the performance of each local education agency (LEA) on 14 of<br />
20 indicators as compared with targets established by the State in the SPP. Arkansas will report indicators 1 through 14 and<br />
20 for each LEA serving children with disabilities (CWD). Any LEA not meeting targets on compliance indicators (0% for<br />
Indicators 4B, 09 & 10 and 100% for Indicators 11, 12, 13, and 20) are non-compliant with IDEA.<br />
There are no report changes for the 2010/11 school year profile; However, it is important to recognize that: .<br />
1. Indicator 01 (Graduation) is reported a year in arrear (2009/10 graduates) and is based on a four-year cohort. This<br />
means the rate is a measure of students who entered in ninth grade and graduate in four years. The calculation is a<br />
requirement under Title I of the Elementary and Secondary Education Act (ESEA).<br />
2. Indicator 02 (Drop out) is reported a year in arrear. This means the rate is a measure of students who dropped out in<br />
the 2009/10 school year. The Indicator 02 data are aligned with the Common Core of Data (CCD) requirements for<br />
grades 7-12.<br />
3. Indicator 04A and 4B (Suspension/Expulsion) is reported a year in arrear. This means the rate is a measure of<br />
students who had out-of-school suspensions and/or expulsions totaling more than 10 days.<br />
Percent of youth<br />
with IEPs<br />
graduating from<br />
high school with a<br />
regular diploma<br />
For a complete description of all the Indicators, please visit the special education website at<br />
http://arksped.k12.ar.us/sections/policy.html<br />
Indicator 01: Graduation Rates (2009/10 school year) Indicator 02: Dropout Rates (2009/10 school year)<br />
State<br />
Rate<br />
State<br />
Target<br />
75.76% 85.00%<br />
LEA<br />
Rate<br />
93.75%<br />
Target Met<br />
by LEA<br />
(Y/N)<br />
Y<br />
Percent of<br />
youth with<br />
IEPs dropping<br />
out of high<br />
school<br />
State<br />
Rate<br />
Indicator 03: Assessment on Statewide Benchmark Exam (grades 3-8, 11)<br />
A) Adequate Yearly Progress<br />
n=40<br />
Literacy<br />
Mathematics<br />
Met Disability Subgroup "n"<br />
for Reporting Purposes (Y/N)<br />
State Target for % of Districts Meeting<br />
AYP for Disability Subgroup<br />
State<br />
Target<br />
3.06% 4.20%<br />
LEA<br />
Rate<br />
0.00%<br />
% of Districts Meeting AYP<br />
for Disability Subgroup<br />
Target Met by<br />
LEA (Y/N)<br />
Y<br />
Target Met by<br />
LEA(Y/N)<br />
Overall N 17.15% 6.25%<br />
NA<br />
N<br />
N<br />
Note: For a district to qualify as having a disability subgroup it must have a minimum of 40 (n=40) students with disabilities in a school building.<br />
B) Participation<br />
Participation Rate: # of<br />
CWD Tested ÷ # of CWD<br />
Enrolled in grades tested.<br />
Participation Rate: Literacy<br />
Participation Rate: Math<br />
Note: - - denotes not applicable<br />
State<br />
Rate<br />
98.78%<br />
State<br />
Target<br />
95.00%<br />
LEA<br />
Rate<br />
98.32%<br />
Target Met<br />
by LEA (Y/N)<br />
98.61% 95.00% 99.16% Y<br />
Y<br />
C) Performance Proficiency<br />
Percent of CWD Scoring<br />
Proficient or Above<br />
Proficiency Rate: Literacy<br />
Proficiency Rate:<br />
Mathematics<br />
16.00%<br />
16.00%<br />
State<br />
Rate<br />
31.49%<br />
44.86%<br />
State<br />
Target<br />
45.22%<br />
51.14%<br />
LEA<br />
Rate<br />
26.53%<br />
46.00%<br />
NA<br />
NA<br />
Target<br />
Met by<br />
LEA (Y/N)<br />
N<br />
N<br />
Page 1 of 5
LEA: 3105 - NASHVILLE SCHOOL <strong>DISTRICT</strong><br />
Indicator 04: Out-of-School Suspensions and Expulsions (2009/10 school year)<br />
A) Suspension/Expulsion<br />
Percent difference of CWD with out-of- school suspensions and<br />
expulsions totaling greater than 10 days in a school year as<br />
compared to the same data for general education students in<br />
the district.<br />
B) Suspension/Expulsion by Race and Ethnicity<br />
Percent of districts that have: (a) a significant discrepancy, by race or<br />
ethnicity, in the rate of suspensions and expulsions of greater than 10<br />
days in a school year for children with IEPs; and (b) policies,<br />
procedures or practices that contribute to the significant discrepancy<br />
and do not comply with requirements relating to the development<br />
and implementation of IEPs, the use of positive behavioral<br />
interventions and supports, and procedural safeguards.<br />
Indicator 05: School Age (5-21) Least Restrictive Environment<br />
A) In the Regular Class 80% or more of the day<br />
Percent of CWD with<br />
IEPs receiving instruction<br />
in the regular class 80%<br />
or more of the day.<br />
State<br />
Rate<br />
State<br />
Target<br />
LEA<br />
Rate<br />
B) In the Regular Class less than 40% of the day<br />
Percent of CWD with<br />
IEPs receiving instruction<br />
in the regular class less<br />
than 60% of the day.<br />
53.87% 59.77%<br />
State<br />
Rate<br />
State<br />
Target<br />
12.42% 12.51%<br />
54.38%<br />
LEA<br />
Rate<br />
8.76%<br />
C) Other Settings outside the regular class<br />
Percent of CWD with IEPs served in<br />
public or private separate schools,<br />
residential placements, or<br />
homebound/hospital placements.<br />
State<br />
Rate<br />
State<br />
Target<br />
2.80% 2.56%<br />
Target Met<br />
by LEA (Y/N)<br />
N<br />
Target Met<br />
by LEA (Y/N)<br />
Y<br />
LEA<br />
Rate<br />
0.00%<br />
Target Met<br />
by LEA(Y/N)<br />
Indicator 06: Early Childhood (3-5) Least Restrictive Environment<br />
A) Regular Early Childhood Program<br />
Percent of children (aged 3 through 5) with IEPs attending a regular<br />
early childhood program and receiving the majority of special<br />
education and related services in the regular early childhood program<br />
Allowable<br />
Difference<br />
LEA: 3105 - NASHVILLE SCHOOL <strong>DISTRICT</strong><br />
Indicator 07: Preschool (3-5) Outcomes<br />
a) Percent of preschool CWD<br />
children who did not<br />
improve functioning.<br />
b) Percent of preschool CWD<br />
who improved but whose<br />
functioning remained below<br />
same age peers.<br />
c) Percent of preschool CWD<br />
who improved at a level<br />
nearer to same aged peers.<br />
d) Percent of preschool CWD<br />
who improved functioning to<br />
reach a level comparable to<br />
same age peers.<br />
e) Percent of preschool CWD<br />
children who maintain<br />
functioning at a level<br />
comparable to same aged<br />
peers.<br />
Summary<br />
Statements<br />
1) Of those preschool<br />
children who entered<br />
the preschool program<br />
below age expectations<br />
in each Outcome, the<br />
percent who<br />
substantially increased<br />
their rate of growth by<br />
the time they turned 6<br />
years of age or exited<br />
the program.<br />
2) The percent of<br />
preschool children who<br />
were functioning<br />
within age expectations<br />
in each Outcome by the<br />
time they turned 6<br />
years of age or exited<br />
A) Positive Social -Emotional<br />
Skills*<br />
State<br />
Rate<br />
A) Positive Social -<br />
Emotional Skills<br />
(Including social<br />
relationships)<br />
State<br />
Rate<br />
2.14%<br />
5.31%<br />
25.97%<br />
38.22%<br />
28.36%<br />
State<br />
Target<br />
LEA<br />
Rate<br />
LEA<br />
Rate<br />
— —<br />
— —<br />
— —<br />
— —<br />
— —<br />
Target<br />
Met by<br />
LEA(Y/N)<br />
B) Acquisition and Use of<br />
Knowledge and Skills<br />
(Including early language/<br />
communication and early literacy)<br />
B) Acquisition and Use of<br />
Knowledge and Skills **<br />
State<br />
Rate<br />
1.75%<br />
6.59%<br />
34.23%<br />
43.51%<br />
13.92%<br />
State<br />
Target<br />
LEA<br />
Rate<br />
Target<br />
Met by<br />
LEA(Y/N)<br />
C) Use of Appropriate Behaviors<br />
to Meet Their Needs<br />
State<br />
Rate<br />
State<br />
Target<br />
LEA<br />
Rate<br />
Target<br />
Met by<br />
LEA(Y/N)<br />
89.61% 90.50% — — N/A 90.31% 90.50% — — N/A 90.82% 92.50% — — N/A<br />
66.58% 69.50% — — N/A 57.43% 60.50% — — N/A 76.69% 78.50% — — N/A<br />
NOTE: * Including social relationships ** Including early language/ communication and early literacy<br />
Note: - - denotes not applicable<br />
State<br />
Rate<br />
LEA<br />
Rate<br />
— —<br />
— —<br />
— —<br />
— —<br />
— —<br />
C) Use of<br />
Appropriate<br />
Behaviors to<br />
Meet Their Needs<br />
State<br />
Rate<br />
4.51%<br />
17.34%<br />
41.72%<br />
34.97%<br />
LEA<br />
Rate<br />
1.46% — —<br />
— —<br />
— —<br />
— —<br />
— —<br />
Page 3 of 5
LEA: 3105 - NASHVILLE SCHOOL <strong>DISTRICT</strong><br />
Indicator 08: Parent Involvement<br />
Percent of surveyed<br />
parents who reported<br />
school facilitated parent<br />
involvement as a means<br />
of improving services<br />
and results for children<br />
with disabilities.<br />
Early Childhood<br />
(3-5)<br />
School Age<br />
(5-21)<br />
State<br />
Rate<br />
90.47%<br />
95.05%<br />
Indicator 09: Disproportionality - Eligibility<br />
Disproportionate representation of racial<br />
and ethnic groups in special education and<br />
related services that is a result of<br />
inappropriate identification (e.g.<br />
monitoring data, review of policies,<br />
practices, and procedures under 618(d),<br />
etc.).<br />
State<br />
Rate<br />
State<br />
Target<br />
88.00%<br />
96.00%<br />
State<br />
Target<br />
0.00% 0.00%<br />
LEA<br />
Rate<br />
— —<br />
98.59%<br />
Indicator 10: Disproportionality-Child with a Disability<br />
Disproportionate representation of racial<br />
and ethnic groups in specific disability<br />
categories that is a result of inappropriate<br />
identification (e.g. monitoring data, review<br />
of policies, practices, and procedures under<br />
618(d), etc.).<br />
Indicator 11: Child Find<br />
Percent of children with<br />
parental consent to evaluate<br />
who are evaluated within<br />
the State established timeline<br />
of 60 days.<br />
Overall<br />
(3-21)<br />
Early Childhood<br />
(3-5)<br />
School Age<br />
(5-21)<br />
State<br />
Rate<br />
0.00%<br />
Indicator 12: Early Childhood Transition<br />
Percent of children referred by Part C prior to<br />
age 3, who are found eligible for Part B, and<br />
who have an IEP developed and implemented<br />
by their third birthday.<br />
Note: - - denotes not applicable<br />
State<br />
Rate<br />
99.41%<br />
99.70%<br />
98.97%<br />
State<br />
Rate<br />
State<br />
Target<br />
0.00%<br />
State<br />
Target<br />
100.00%<br />
100.00%<br />
100.00%<br />
State<br />
Target<br />
Target Met by<br />
LEA (Y/N)<br />
Y<br />
Target Met by<br />
LEA (Y/N)<br />
Y<br />
LEA<br />
Rate<br />
100.00%<br />
— —<br />
100.00%<br />
LEA<br />
Rate<br />
Target Met by<br />
LEA (Y/N)<br />
N/A<br />
Y<br />
Note: The target for Indicator 09 is to have zero percent<br />
(0%) of districts identified as having disproportionate<br />
representation as a result of inappropriate<br />
identification in eligibility.<br />
Note: The target for Indicator 10 is to have zero<br />
percent (0%) of districts identified as having<br />
disproportionate representation as a result of<br />
inappropriate identification in a disability<br />
category.<br />
Target Met by<br />
LEA (Y/N)<br />
N/A<br />
Y<br />
Target Met<br />
by LEA<br />
(Y/N)<br />
99.21% 100.00% - - N/A<br />
Y<br />
Note: * Indicates a zero reponse rate for the<br />
district.<br />
Page 4 of 5
LEA: 3105 - NASHVILLE SCHOOL <strong>DISTRICT</strong><br />
Indicator 13: Secondary Transition<br />
Percent of youth with disabilities aged 16 and<br />
up with an IEP that includes coordinated,<br />
measurable, annual IEP goals and transition<br />
services that will reasonably enable the student<br />
to meet the post-secondary goals.<br />
Indicator 14: Post-School Outcomes<br />
A. Percent of youth enrolled in higher<br />
education within one year of leaving high<br />
school.<br />
State<br />
Rate<br />
State<br />
Target<br />
Note: Data for this Indicator is from the on-site monitoring of LEAs for the given year.<br />
B. Percent of youth enrolled in higher<br />
education or competitively employed<br />
within one year of leaving high school.<br />
C. Percent of youth enrolled in higher<br />
education or in some other postsecondary<br />
education or training program; or<br />
competitively employed or in some other<br />
employment within one year of leaving<br />
high school.<br />
State<br />
Rate<br />
Indicator 20: Reported Data-Timely and Accurate*<br />
District submitted<br />
required data elements<br />
on or before due dates;<br />
made revisions within<br />
the alloted reveiw<br />
periods.<br />
Accurate and Timely<br />
Data Submission<br />
Overall (3-21)<br />
Early Childhood (3-5)<br />
School Age (5-21)<br />
State<br />
Target<br />
100.00%<br />
100.00%<br />
100.00%<br />
State<br />
Target<br />
LEA<br />
Rate<br />
LEA<br />
Rate<br />
Target Met by<br />
LEA (Y/N)<br />
Target Met<br />
by LEA<br />
(Y/N)<br />
Target Met<br />
by LEA<br />
(Y/N)<br />
*Data reviewed for timely and accurate submissions included all APSCN cycle data except for personnel<br />
Note: - - denotes not applicable<br />
96.19 100.00 — — N/A<br />
14.53<br />
State<br />
Rate<br />
49.42<br />
State<br />
Rate<br />
54.07<br />
13.00<br />
State<br />
Target<br />
49.00<br />
State<br />
Target<br />
60.00<br />
Y<br />
N/A<br />
Y<br />
— —<br />
LEA<br />
Rate<br />
— —<br />
LEA<br />
Rate<br />
— —<br />
N/A<br />
Target Met<br />
by LEA<br />
(Y/N)<br />
N/A<br />
Target Met<br />
by LEA<br />
(Y/N)<br />
N/A<br />
Page 5 of 5
LEA: 3201 - BATESVILLE SCHOOL <strong>DISTRICT</strong><br />
<strong>ARKANSAS</strong> <strong>SPECIAL</strong> <strong>EDUCATION</strong><br />
<strong>DISTRICT</strong> <strong>ANNUAL</strong> PERFORMANCE REPORT<br />
2010/11 School Year<br />
Publication Date: March 2012<br />
Each State must have in place a State Performance Plan (SPP) to evaluate the State's efforts to meet the requirements and<br />
purposes of the implementation of the Individuals with Disabilities Education Act (IDEA). The SPP is a six-year plan, which<br />
describes Arkansas's performance on 20 indicators. The Office of Special Education Programs in the U. S. Department of<br />
Education requires that States report annually to the public on the performance of each local education agency (LEA) on 14 of<br />
20 indicators as compared with targets established by the State in the SPP. Arkansas will report indicators 1 through 14 and<br />
20 for each LEA serving children with disabilities (CWD). Any LEA not meeting targets on compliance indicators (0% for<br />
Indicators 4B, 09 & 10 and 100% for Indicators 11, 12, 13, and 20) are non-compliant with IDEA.<br />
There are no report changes for the 2010/11 school year profile; However, it is important to recognize that: .<br />
1. Indicator 01 (Graduation) is reported a year in arrear (2009/10 graduates) and is based on a four-year cohort. This<br />
means the rate is a measure of students who entered in ninth grade and graduate in four years. The calculation is a<br />
requirement under Title I of the Elementary and Secondary Education Act (ESEA).<br />
2. Indicator 02 (Drop out) is reported a year in arrear. This means the rate is a measure of students who dropped out in<br />
the 2009/10 school year. The Indicator 02 data are aligned with the Common Core of Data (CCD) requirements for<br />
grades 7-12.<br />
3. Indicator 04A and 4B (Suspension/Expulsion) is reported a year in arrear. This means the rate is a measure of<br />
students who had out-of-school suspensions and/or expulsions totaling more than 10 days.<br />
Percent of youth<br />
with IEPs<br />
graduating from<br />
high school with a<br />
regular diploma<br />
For a complete description of all the Indicators, please visit the special education website at<br />
http://arksped.k12.ar.us/sections/policy.html<br />
Indicator 01: Graduation Rates (2009/10 school year) Indicator 02: Dropout Rates (2009/10 school year)<br />
State<br />
Rate<br />
State<br />
Target<br />
75.76% 85.00%<br />
LEA<br />
Rate<br />
65.22%<br />
Target Met<br />
by LEA<br />
(Y/N)<br />
N<br />
Percent of<br />
youth with<br />
IEPs dropping<br />
out of high<br />
school<br />
State<br />
Rate<br />
Indicator 03: Assessment on Statewide Benchmark Exam (grades 3-8, 11)<br />
A) Adequate Yearly Progress<br />
n=40<br />
Literacy<br />
Mathematics<br />
Met Disability Subgroup "n"<br />
for Reporting Purposes (Y/N)<br />
State Target for % of Districts Meeting<br />
AYP for Disability Subgroup<br />
State<br />
Target<br />
3.06% 4.20%<br />
LEA<br />
Rate<br />
3.73%<br />
% of Districts Meeting AYP<br />
for Disability Subgroup<br />
Target Met by<br />
LEA (Y/N)<br />
Y<br />
Target Met by<br />
LEA(Y/N)<br />
Overall N 17.15% 6.25%<br />
NA<br />
N<br />
N<br />
Note: For a district to qualify as having a disability subgroup it must have a minimum of 40 (n=40) students with disabilities in a school building.<br />
B) Participation<br />
Participation Rate: # of<br />
CWD Tested ÷ # of CWD<br />
Enrolled in grades tested.<br />
Participation Rate: Literacy<br />
Participation Rate: Math<br />
Note: - - denotes not applicable<br />
State<br />
Rate<br />
98.78%<br />
State<br />
Target<br />
95.00%<br />
LEA<br />
Rate<br />
100.00%<br />
Target Met<br />
by LEA (Y/N)<br />
98.61% 95.00% 99.53% Y<br />
Y<br />
C) Performance Proficiency<br />
Percent of CWD Scoring<br />
Proficient or Above<br />
Proficiency Rate: Literacy<br />
Proficiency Rate:<br />
Mathematics<br />
16.00%<br />
16.00%<br />
State<br />
Rate<br />
31.49%<br />
44.86%<br />
State<br />
Target<br />
45.22%<br />
51.14%<br />
LEA<br />
Rate<br />
40.98%<br />
53.77%<br />
NA<br />
NA<br />
Target<br />
Met by<br />
LEA (Y/N)<br />
N<br />
Y<br />
Page 1 of 5
LEA: 3201 - BATESVILLE SCHOOL <strong>DISTRICT</strong><br />
Indicator 04: Out-of-School Suspensions and Expulsions (2009/10 school year)<br />
A) Suspension/Expulsion<br />
Percent difference of CWD with out-of- school suspensions and<br />
expulsions totaling greater than 10 days in a school year as<br />
compared to the same data for general education students in<br />
the district.<br />
B) Suspension/Expulsion by Race and Ethnicity<br />
Percent of districts that have: (a) a significant discrepancy, by race or<br />
ethnicity, in the rate of suspensions and expulsions of greater than 10<br />
days in a school year for children with IEPs; and (b) policies,<br />
procedures or practices that contribute to the significant discrepancy<br />
and do not comply with requirements relating to the development<br />
and implementation of IEPs, the use of positive behavioral<br />
interventions and supports, and procedural safeguards.<br />
Indicator 05: School Age (5-21) Least Restrictive Environment<br />
A) In the Regular Class 80% or more of the day<br />
Percent of CWD with<br />
IEPs receiving instruction<br />
in the regular class 80%<br />
or more of the day.<br />
State<br />
Rate<br />
State<br />
Target<br />
LEA<br />
Rate<br />
B) In the Regular Class less than 40% of the day<br />
Percent of CWD with<br />
IEPs receiving instruction<br />
in the regular class less<br />
than 60% of the day.<br />
53.87% 59.77%<br />
State<br />
Rate<br />
State<br />
Target<br />
12.42% 12.51%<br />
62.73%<br />
LEA<br />
Rate<br />
3.94%<br />
C) Other Settings outside the regular class<br />
Percent of CWD with IEPs served in<br />
public or private separate schools,<br />
residential placements, or<br />
homebound/hospital placements.<br />
State<br />
Rate<br />
State<br />
Target<br />
2.80% 2.56%<br />
Target Met<br />
by LEA (Y/N)<br />
Y<br />
Target Met<br />
by LEA (Y/N)<br />
Y<br />
LEA<br />
Rate<br />
1.84%<br />
Target Met<br />
by LEA(Y/N)<br />
Indicator 06: Early Childhood (3-5) Least Restrictive Environment<br />
A) Regular Early Childhood Program<br />
Percent of children (aged 3 through 5) with IEPs attending a regular<br />
early childhood program and receiving the majority of special<br />
education and related services in the regular early childhood program<br />
Allowable<br />
Difference<br />
LEA: 3201 - BATESVILLE SCHOOL <strong>DISTRICT</strong><br />
Indicator 07: Preschool (3-5) Outcomes<br />
a) Percent of preschool CWD<br />
children who did not<br />
improve functioning.<br />
b) Percent of preschool CWD<br />
who improved but whose<br />
functioning remained below<br />
same age peers.<br />
c) Percent of preschool CWD<br />
who improved at a level<br />
nearer to same aged peers.<br />
d) Percent of preschool CWD<br />
who improved functioning to<br />
reach a level comparable to<br />
same age peers.<br />
e) Percent of preschool CWD<br />
children who maintain<br />
functioning at a level<br />
comparable to same aged<br />
peers.<br />
Summary<br />
Statements<br />
1) Of those preschool<br />
children who entered<br />
the preschool program<br />
below age expectations<br />
in each Outcome, the<br />
percent who<br />
substantially increased<br />
their rate of growth by<br />
the time they turned 6<br />
years of age or exited<br />
the program.<br />
2) The percent of<br />
preschool children who<br />
were functioning<br />
within age expectations<br />
in each Outcome by the<br />
time they turned 6<br />
years of age or exited<br />
A) Positive Social -Emotional<br />
Skills*<br />
State<br />
Rate<br />
A) Positive Social -<br />
Emotional Skills<br />
(Including social<br />
relationships)<br />
State<br />
Rate<br />
2.14%<br />
5.31%<br />
25.97%<br />
38.22%<br />
28.36%<br />
State<br />
Target<br />
LEA<br />
Rate<br />
LEA<br />
Rate<br />
— —<br />
— —<br />
8.82%<br />
40.20%<br />
50.98%<br />
Target<br />
Met by<br />
LEA(Y/N)<br />
B) Acquisition and Use of<br />
Knowledge and Skills<br />
(Including early language/<br />
communication and early literacy)<br />
B) Acquisition and Use of<br />
Knowledge and Skills **<br />
State<br />
Rate<br />
1.75%<br />
6.59%<br />
34.23%<br />
43.51%<br />
13.92%<br />
State<br />
Target<br />
LEA<br />
Rate<br />
Target<br />
Met by<br />
LEA(Y/N)<br />
C) Use of Appropriate Behaviors<br />
to Meet Their Needs<br />
State<br />
Rate<br />
State<br />
Target<br />
LEA<br />
Rate<br />
Target<br />
Met by<br />
LEA(Y/N)<br />
89.61% 90.50% 100.00% Y 90.31% 90.50% 92.19% Y 90.82% 92.50% 100.00% Y<br />
66.58% 69.50% 91.18% Y 57.43% 60.50% 76.47% Y 76.69% 78.50% 92.16% Y<br />
NOTE: * Including social relationships ** Including early language/ communication and early literacy<br />
Note: - - denotes not applicable<br />
State<br />
Rate<br />
LEA<br />
Rate<br />
— —<br />
4.90%<br />
18.63%<br />
39.22%<br />
37.25%<br />
C) Use of<br />
Appropriate<br />
Behaviors to<br />
Meet Their Needs<br />
State<br />
Rate<br />
4.51%<br />
17.34%<br />
41.72%<br />
34.97%<br />
LEA<br />
Rate<br />
1.46% — —<br />
— —<br />
7.84%<br />
82.35%<br />
9.80%<br />
Page 3 of 5
LEA: 3201 - BATESVILLE SCHOOL <strong>DISTRICT</strong><br />
Indicator 08: Parent Involvement<br />
Percent of surveyed<br />
parents who reported<br />
school facilitated parent<br />
involvement as a means<br />
of improving services<br />
and results for children<br />
with disabilities.<br />
Early Childhood<br />
(3-5)<br />
School Age<br />
(5-21)<br />
State<br />
Rate<br />
90.47%<br />
95.05%<br />
Indicator 09: Disproportionality - Eligibility<br />
Disproportionate representation of racial<br />
and ethnic groups in special education and<br />
related services that is a result of<br />
inappropriate identification (e.g.<br />
monitoring data, review of policies,<br />
practices, and procedures under 618(d),<br />
etc.).<br />
State<br />
Rate<br />
State<br />
Target<br />
88.00%<br />
96.00%<br />
State<br />
Target<br />
0.00% 0.00%<br />
LEA<br />
Rate<br />
90.91%<br />
97.90%<br />
Indicator 10: Disproportionality-Child with a Disability<br />
Disproportionate representation of racial<br />
and ethnic groups in specific disability<br />
categories that is a result of inappropriate<br />
identification (e.g. monitoring data, review<br />
of policies, practices, and procedures under<br />
618(d), etc.).<br />
Indicator 11: Child Find<br />
Percent of children with<br />
parental consent to evaluate<br />
who are evaluated within<br />
the State established timeline<br />
of 60 days.<br />
Overall<br />
(3-21)<br />
Early Childhood<br />
(3-5)<br />
School Age<br />
(5-21)<br />
State<br />
Rate<br />
0.00%<br />
Indicator 12: Early Childhood Transition<br />
Percent of children referred by Part C prior to<br />
age 3, who are found eligible for Part B, and<br />
who have an IEP developed and implemented<br />
by their third birthday.<br />
Note: - - denotes not applicable<br />
State<br />
Rate<br />
99.41%<br />
99.70%<br />
98.97%<br />
State<br />
Rate<br />
State<br />
Target<br />
0.00%<br />
State<br />
Target<br />
100.00%<br />
100.00%<br />
100.00%<br />
State<br />
Target<br />
Target Met by<br />
LEA (Y/N)<br />
Y<br />
Target Met by<br />
LEA (Y/N)<br />
Y<br />
LEA<br />
Rate<br />
100.00%<br />
100.00%<br />
100.00%<br />
LEA<br />
Rate<br />
Target Met by<br />
LEA (Y/N)<br />
Y<br />
Y<br />
Note: The target for Indicator 09 is to have zero percent<br />
(0%) of districts identified as having disproportionate<br />
representation as a result of inappropriate<br />
identification in eligibility.<br />
Note: The target for Indicator 10 is to have zero<br />
percent (0%) of districts identified as having<br />
disproportionate representation as a result of<br />
inappropriate identification in a disability<br />
category.<br />
Target Met by<br />
LEA (Y/N)<br />
Y<br />
Y<br />
Target Met<br />
by LEA<br />
(Y/N)<br />
99.21% 100.00% 100.00% Y<br />
Y<br />
Note: * Indicates a zero reponse rate for the<br />
district.<br />
Page 4 of 5
LEA: 3201 - BATESVILLE SCHOOL <strong>DISTRICT</strong><br />
Indicator 13: Secondary Transition<br />
Percent of youth with disabilities aged 16 and<br />
up with an IEP that includes coordinated,<br />
measurable, annual IEP goals and transition<br />
services that will reasonably enable the student<br />
to meet the post-secondary goals.<br />
Indicator 14: Post-School Outcomes<br />
A. Percent of youth enrolled in higher<br />
education within one year of leaving high<br />
school.<br />
State<br />
Rate<br />
State<br />
Target<br />
Note: Data for this Indicator is from the on-site monitoring of LEAs for the given year.<br />
B. Percent of youth enrolled in higher<br />
education or competitively employed<br />
within one year of leaving high school.<br />
C. Percent of youth enrolled in higher<br />
education or in some other postsecondary<br />
education or training program; or<br />
competitively employed or in some other<br />
employment within one year of leaving<br />
high school.<br />
State<br />
Rate<br />
Indicator 20: Reported Data-Timely and Accurate*<br />
District submitted<br />
required data elements<br />
on or before due dates;<br />
made revisions within<br />
the alloted reveiw<br />
periods.<br />
Accurate and Timely<br />
Data Submission<br />
Overall (3-21)<br />
Early Childhood (3-5)<br />
School Age (5-21)<br />
State<br />
Target<br />
100.00%<br />
100.00%<br />
100.00%<br />
State<br />
Target<br />
LEA<br />
Rate<br />
LEA<br />
Rate<br />
Target Met by<br />
LEA (Y/N)<br />
Target Met<br />
by LEA<br />
(Y/N)<br />
Target Met<br />
by LEA<br />
(Y/N)<br />
*Data reviewed for timely and accurate submissions included all APSCN cycle data except for personnel<br />
Note: - - denotes not applicable<br />
96.19 100.00 — — N/A<br />
14.53<br />
State<br />
Rate<br />
49.42<br />
State<br />
Rate<br />
54.07<br />
13.00<br />
State<br />
Target<br />
49.00<br />
State<br />
Target<br />
60.00<br />
Y<br />
Y<br />
Y<br />
33.33%<br />
LEA<br />
Rate<br />
66.67%<br />
LEA<br />
Rate<br />
66.67%<br />
Y<br />
Target Met<br />
by LEA<br />
(Y/N)<br />
Y<br />
Target Met<br />
by LEA<br />
(Y/N)<br />
Y<br />
Page 5 of 5
LEA: 3209 - SOUTHSIDE SCHOOL <strong>DISTRICT</strong><br />
<strong>ARKANSAS</strong> <strong>SPECIAL</strong> <strong>EDUCATION</strong><br />
<strong>DISTRICT</strong> <strong>ANNUAL</strong> PERFORMANCE REPORT<br />
2010/11 School Year<br />
Publication Date: March 2012<br />
Each State must have in place a State Performance Plan (SPP) to evaluate the State's efforts to meet the requirements and<br />
purposes of the implementation of the Individuals with Disabilities Education Act (IDEA). The SPP is a six-year plan, which<br />
describes Arkansas's performance on 20 indicators. The Office of Special Education Programs in the U. S. Department of<br />
Education requires that States report annually to the public on the performance of each local education agency (LEA) on 14 of<br />
20 indicators as compared with targets established by the State in the SPP. Arkansas will report indicators 1 through 14 and<br />
20 for each LEA serving children with disabilities (CWD). Any LEA not meeting targets on compliance indicators (0% for<br />
Indicators 4B, 09 & 10 and 100% for Indicators 11, 12, 13, and 20) are non-compliant with IDEA.<br />
There are no report changes for the 2010/11 school year profile; However, it is important to recognize that: .<br />
1. Indicator 01 (Graduation) is reported a year in arrear (2009/10 graduates) and is based on a four-year cohort. This<br />
means the rate is a measure of students who entered in ninth grade and graduate in four years. The calculation is a<br />
requirement under Title I of the Elementary and Secondary Education Act (ESEA).<br />
2. Indicator 02 (Drop out) is reported a year in arrear. This means the rate is a measure of students who dropped out in<br />
the 2009/10 school year. The Indicator 02 data are aligned with the Common Core of Data (CCD) requirements for<br />
grades 7-12.<br />
3. Indicator 04A and 4B (Suspension/Expulsion) is reported a year in arrear. This means the rate is a measure of<br />
students who had out-of-school suspensions and/or expulsions totaling more than 10 days.<br />
Percent of youth<br />
with IEPs<br />
graduating from<br />
high school with a<br />
regular diploma<br />
For a complete description of all the Indicators, please visit the special education website at<br />
http://arksped.k12.ar.us/sections/policy.html<br />
Indicator 01: Graduation Rates (2009/10 school year) Indicator 02: Dropout Rates (2009/10 school year)<br />
State<br />
Rate<br />
State<br />
Target<br />
75.76% 85.00%<br />
LEA<br />
Rate<br />
78.26%<br />
Target Met<br />
by LEA<br />
(Y/N)<br />
N<br />
Percent of<br />
youth with<br />
IEPs dropping<br />
out of high<br />
school<br />
State<br />
Rate<br />
Indicator 03: Assessment on Statewide Benchmark Exam (grades 3-8, 11)<br />
A) Adequate Yearly Progress<br />
n=40<br />
Literacy<br />
Mathematics<br />
Met Disability Subgroup "n"<br />
for Reporting Purposes (Y/N)<br />
State Target for % of Districts Meeting<br />
AYP for Disability Subgroup<br />
State<br />
Target<br />
3.06% 4.20%<br />
LEA<br />
Rate<br />
3.57%<br />
% of Districts Meeting AYP<br />
for Disability Subgroup<br />
Target Met by<br />
LEA (Y/N)<br />
Y<br />
Target Met by<br />
LEA(Y/N)<br />
Overall N 17.15% 6.25%<br />
NA<br />
N<br />
N<br />
Note: For a district to qualify as having a disability subgroup it must have a minimum of 40 (n=40) students with disabilities in a school building.<br />
B) Participation<br />
Participation Rate: # of<br />
CWD Tested ÷ # of CWD<br />
Enrolled in grades tested.<br />
Participation Rate: Literacy<br />
Participation Rate: Math<br />
Note: - - denotes not applicable<br />
State<br />
Rate<br />
98.78%<br />
State<br />
Target<br />
95.00%<br />
LEA<br />
Rate<br />
100.00%<br />
Target Met<br />
by LEA (Y/N)<br />
98.61% 95.00% 99.00% Y<br />
Y<br />
C) Performance Proficiency<br />
Percent of CWD Scoring<br />
Proficient or Above<br />
Proficiency Rate: Literacy<br />
Proficiency Rate:<br />
Mathematics<br />
16.00%<br />
16.00%<br />
State<br />
Rate<br />
31.49%<br />
44.86%<br />
State<br />
Target<br />
45.22%<br />
51.14%<br />
LEA<br />
Rate<br />
39.78%<br />
61.70%<br />
NA<br />
NA<br />
Target<br />
Met by<br />
LEA (Y/N)<br />
N<br />
Y<br />
Page 1 of 5
LEA: 3209 - SOUTHSIDE SCHOOL <strong>DISTRICT</strong><br />
Indicator 04: Out-of-School Suspensions and Expulsions (2009/10 school year)<br />
A) Suspension/Expulsion<br />
Percent difference of CWD with out-of- school suspensions and<br />
expulsions totaling greater than 10 days in a school year as<br />
compared to the same data for general education students in<br />
the district.<br />
B) Suspension/Expulsion by Race and Ethnicity<br />
Percent of districts that have: (a) a significant discrepancy, by race or<br />
ethnicity, in the rate of suspensions and expulsions of greater than 10<br />
days in a school year for children with IEPs; and (b) policies,<br />
procedures or practices that contribute to the significant discrepancy<br />
and do not comply with requirements relating to the development<br />
and implementation of IEPs, the use of positive behavioral<br />
interventions and supports, and procedural safeguards.<br />
Indicator 05: School Age (5-21) Least Restrictive Environment<br />
A) In the Regular Class 80% or more of the day<br />
Percent of CWD with<br />
IEPs receiving instruction<br />
in the regular class 80%<br />
or more of the day.<br />
State<br />
Rate<br />
State<br />
Target<br />
LEA<br />
Rate<br />
B) In the Regular Class less than 40% of the day<br />
Percent of CWD with<br />
IEPs receiving instruction<br />
in the regular class less<br />
than 60% of the day.<br />
53.87% 59.77%<br />
State<br />
Rate<br />
State<br />
Target<br />
12.42% 12.51%<br />
53.95%<br />
LEA<br />
Rate<br />
2.79%<br />
C) Other Settings outside the regular class<br />
Percent of CWD with IEPs served in<br />
public or private separate schools,<br />
residential placements, or<br />
homebound/hospital placements.<br />
State<br />
Rate<br />
State<br />
Target<br />
2.80% 2.56%<br />
Target Met<br />
by LEA (Y/N)<br />
N<br />
Target Met<br />
by LEA (Y/N)<br />
Y<br />
LEA<br />
Rate<br />
2.33%<br />
Target Met<br />
by LEA(Y/N)<br />
Indicator 06: Early Childhood (3-5) Least Restrictive Environment<br />
A) Regular Early Childhood Program<br />
Percent of children (aged 3 through 5) with IEPs attending a regular<br />
early childhood program and receiving the majority of special<br />
education and related services in the regular early childhood program<br />
Allowable<br />
Difference<br />
LEA: 3209 - SOUTHSIDE SCHOOL <strong>DISTRICT</strong><br />
Indicator 07: Preschool (3-5) Outcomes<br />
a) Percent of preschool CWD<br />
children who did not<br />
improve functioning.<br />
b) Percent of preschool CWD<br />
who improved but whose<br />
functioning remained below<br />
same age peers.<br />
c) Percent of preschool CWD<br />
who improved at a level<br />
nearer to same aged peers.<br />
d) Percent of preschool CWD<br />
who improved functioning to<br />
reach a level comparable to<br />
same age peers.<br />
e) Percent of preschool CWD<br />
children who maintain<br />
functioning at a level<br />
comparable to same aged<br />
peers.<br />
Summary<br />
Statements<br />
1) Of those preschool<br />
children who entered<br />
the preschool program<br />
below age expectations<br />
in each Outcome, the<br />
percent who<br />
substantially increased<br />
their rate of growth by<br />
the time they turned 6<br />
years of age or exited<br />
the program.<br />
2) The percent of<br />
preschool children who<br />
were functioning<br />
within age expectations<br />
in each Outcome by the<br />
time they turned 6<br />
years of age or exited<br />
A) Positive Social -Emotional<br />
Skills*<br />
State<br />
Rate<br />
A) Positive Social -<br />
Emotional Skills<br />
(Including social<br />
relationships)<br />
State<br />
Rate<br />
2.14%<br />
5.31%<br />
25.97%<br />
38.22%<br />
28.36%<br />
State<br />
Target<br />
LEA<br />
Rate<br />
LEA<br />
Rate<br />
— —<br />
3.85%<br />
— —<br />
23.08%<br />
73.08%<br />
Target<br />
Met by<br />
LEA(Y/N)<br />
B) Acquisition and Use of<br />
Knowledge and Skills<br />
(Including early language/<br />
communication and early literacy)<br />
B) Acquisition and Use of<br />
Knowledge and Skills **<br />
State<br />
Rate<br />
1.75%<br />
6.59%<br />
34.23%<br />
43.51%<br />
13.92%<br />
State<br />
Target<br />
LEA<br />
Rate<br />
Target<br />
Met by<br />
LEA(Y/N)<br />
C) Use of Appropriate Behaviors<br />
to Meet Their Needs<br />
State<br />
Rate<br />
State<br />
Target<br />
LEA<br />
Rate<br />
Target<br />
Met by<br />
LEA(Y/N)<br />
89.61% 90.50% 85.71% N 90.31% 90.50% 96.00% Y 90.82% 92.50% 93.75% Y<br />
66.58% 69.50% 96.15% Y 57.43% 60.50% 46.15% N 76.69% 78.50% 96.15% Y<br />
NOTE: * Including social relationships ** Including early language/ communication and early literacy<br />
Note: - - denotes not applicable<br />
State<br />
Rate<br />
LEA<br />
Rate<br />
— —<br />
3.85%<br />
50.00%<br />
42.31%<br />
3.85%<br />
C) Use of<br />
Appropriate<br />
Behaviors to<br />
Meet Their Needs<br />
State<br />
Rate<br />
4.51%<br />
17.34%<br />
41.72%<br />
34.97%<br />
LEA<br />
Rate<br />
1.46% — —<br />
3.85%<br />
— —<br />
57.69%<br />
38.46%<br />
Page 3 of 5
LEA: 3209 - SOUTHSIDE SCHOOL <strong>DISTRICT</strong><br />
Indicator 08: Parent Involvement<br />
Percent of surveyed<br />
parents who reported<br />
school facilitated parent<br />
involvement as a means<br />
of improving services<br />
and results for children<br />
with disabilities.<br />
Early Childhood<br />
(3-5)<br />
School Age<br />
(5-21)<br />
State<br />
Rate<br />
90.47%<br />
95.05%<br />
Indicator 09: Disproportionality - Eligibility<br />
Disproportionate representation of racial<br />
and ethnic groups in special education and<br />
related services that is a result of<br />
inappropriate identification (e.g.<br />
monitoring data, review of policies,<br />
practices, and procedures under 618(d),<br />
etc.).<br />
State<br />
Rate<br />
State<br />
Target<br />
88.00%<br />
96.00%<br />
State<br />
Target<br />
0.00% 0.00%<br />
LEA<br />
Rate<br />
96.77%<br />
94.20%<br />
Indicator 10: Disproportionality-Child with a Disability<br />
Disproportionate representation of racial<br />
and ethnic groups in specific disability<br />
categories that is a result of inappropriate<br />
identification (e.g. monitoring data, review<br />
of policies, practices, and procedures under<br />
618(d), etc.).<br />
Indicator 11: Child Find<br />
Percent of children with<br />
parental consent to evaluate<br />
who are evaluated within<br />
the State established timeline<br />
of 60 days.<br />
Overall<br />
(3-21)<br />
Early Childhood<br />
(3-5)<br />
School Age<br />
(5-21)<br />
State<br />
Rate<br />
0.00%<br />
Indicator 12: Early Childhood Transition<br />
Percent of children referred by Part C prior to<br />
age 3, who are found eligible for Part B, and<br />
who have an IEP developed and implemented<br />
by their third birthday.<br />
Note: - - denotes not applicable<br />
State<br />
Rate<br />
99.41%<br />
99.70%<br />
98.97%<br />
State<br />
Rate<br />
State<br />
Target<br />
0.00%<br />
State<br />
Target<br />
100.00%<br />
100.00%<br />
100.00%<br />
State<br />
Target<br />
Target Met by<br />
LEA (Y/N)<br />
Y<br />
Target Met by<br />
LEA (Y/N)<br />
Y<br />
LEA<br />
Rate<br />
100.00%<br />
100.00%<br />
100.00%<br />
LEA<br />
Rate<br />
Target Met by<br />
LEA (Y/N)<br />
Y<br />
N<br />
Note: The target for Indicator 09 is to have zero percent<br />
(0%) of districts identified as having disproportionate<br />
representation as a result of inappropriate<br />
identification in eligibility.<br />
Note: The target for Indicator 10 is to have zero<br />
percent (0%) of districts identified as having<br />
disproportionate representation as a result of<br />
inappropriate identification in a disability<br />
category.<br />
Target Met by<br />
LEA (Y/N)<br />
Y<br />
Y<br />
Target Met<br />
by LEA<br />
(Y/N)<br />
99.21% 100.00% 100.00% Y<br />
Y<br />
Note: * Indicates a zero reponse rate for the<br />
district.<br />
Page 4 of 5
LEA: 3209 - SOUTHSIDE SCHOOL <strong>DISTRICT</strong><br />
Indicator 13: Secondary Transition<br />
Percent of youth with disabilities aged 16 and<br />
up with an IEP that includes coordinated,<br />
measurable, annual IEP goals and transition<br />
services that will reasonably enable the student<br />
to meet the post-secondary goals.<br />
Indicator 14: Post-School Outcomes<br />
A. Percent of youth enrolled in higher<br />
education within one year of leaving high<br />
school.<br />
State<br />
Rate<br />
State<br />
Target<br />
Note: Data for this Indicator is from the on-site monitoring of LEAs for the given year.<br />
B. Percent of youth enrolled in higher<br />
education or competitively employed<br />
within one year of leaving high school.<br />
C. Percent of youth enrolled in higher<br />
education or in some other postsecondary<br />
education or training program; or<br />
competitively employed or in some other<br />
employment within one year of leaving<br />
high school.<br />
State<br />
Rate<br />
Indicator 20: Reported Data-Timely and Accurate*<br />
District submitted<br />
required data elements<br />
on or before due dates;<br />
made revisions within<br />
the alloted reveiw<br />
periods.<br />
Accurate and Timely<br />
Data Submission<br />
Overall (3-21)<br />
Early Childhood (3-5)<br />
School Age (5-21)<br />
State<br />
Target<br />
100.00%<br />
100.00%<br />
100.00%<br />
State<br />
Target<br />
LEA<br />
Rate<br />
LEA<br />
Rate<br />
Target Met by<br />
LEA (Y/N)<br />
Target Met<br />
by LEA<br />
(Y/N)<br />
Target Met<br />
by LEA<br />
(Y/N)<br />
*Data reviewed for timely and accurate submissions included all APSCN cycle data except for personnel<br />
Note: - - denotes not applicable<br />
96.19 100.00 100.00% Y<br />
14.53<br />
State<br />
Rate<br />
49.42<br />
State<br />
Rate<br />
54.07<br />
13.00<br />
State<br />
Target<br />
49.00<br />
State<br />
Target<br />
60.00<br />
Y<br />
Y<br />
Y<br />
— —<br />
LEA<br />
Rate<br />
— —<br />
LEA<br />
Rate<br />
— —<br />
N/A<br />
Target Met<br />
by LEA<br />
(Y/N)<br />
N/A<br />
Target Met<br />
by LEA<br />
(Y/N)<br />
N/A<br />
Page 5 of 5
LEA: 3211 - MIDLAND SCHOOL <strong>DISTRICT</strong><br />
<strong>ARKANSAS</strong> <strong>SPECIAL</strong> <strong>EDUCATION</strong><br />
<strong>DISTRICT</strong> <strong>ANNUAL</strong> PERFORMANCE REPORT<br />
2010/11 School Year<br />
Publication Date: March 2012<br />
Each State must have in place a State Performance Plan (SPP) to evaluate the State's efforts to meet the requirements and<br />
purposes of the implementation of the Individuals with Disabilities Education Act (IDEA). The SPP is a six-year plan, which<br />
describes Arkansas's performance on 20 indicators. The Office of Special Education Programs in the U. S. Department of<br />
Education requires that States report annually to the public on the performance of each local education agency (LEA) on 14 of<br />
20 indicators as compared with targets established by the State in the SPP. Arkansas will report indicators 1 through 14 and<br />
20 for each LEA serving children with disabilities (CWD). Any LEA not meeting targets on compliance indicators (0% for<br />
Indicators 4B, 09 & 10 and 100% for Indicators 11, 12, 13, and 20) are non-compliant with IDEA.<br />
There are no report changes for the 2010/11 school year profile; However, it is important to recognize that: .<br />
1. Indicator 01 (Graduation) is reported a year in arrear (2009/10 graduates) and is based on a four-year cohort. This<br />
means the rate is a measure of students who entered in ninth grade and graduate in four years. The calculation is a<br />
requirement under Title I of the Elementary and Secondary Education Act (ESEA).<br />
2. Indicator 02 (Drop out) is reported a year in arrear. This means the rate is a measure of students who dropped out in<br />
the 2009/10 school year. The Indicator 02 data are aligned with the Common Core of Data (CCD) requirements for<br />
grades 7-12.<br />
3. Indicator 04A and 4B (Suspension/Expulsion) is reported a year in arrear. This means the rate is a measure of<br />
students who had out-of-school suspensions and/or expulsions totaling more than 10 days.<br />
Percent of youth<br />
with IEPs<br />
graduating from<br />
high school with a<br />
regular diploma<br />
For a complete description of all the Indicators, please visit the special education website at<br />
http://arksped.k12.ar.us/sections/policy.html<br />
Indicator 01: Graduation Rates (2009/10 school year) Indicator 02: Dropout Rates (2009/10 school year)<br />
State<br />
Rate<br />
State<br />
Target<br />
75.76% 85.00%<br />
LEA<br />
Rate<br />
100.00%<br />
Target Met<br />
by LEA<br />
(Y/N)<br />
Y<br />
Percent of<br />
youth with<br />
IEPs dropping<br />
out of high<br />
school<br />
State<br />
Rate<br />
Indicator 03: Assessment on Statewide Benchmark Exam (grades 3-8, 11)<br />
A) Adequate Yearly Progress<br />
n=40<br />
Literacy<br />
Mathematics<br />
Met Disability Subgroup "n"<br />
for Reporting Purposes (Y/N)<br />
State Target for % of Districts Meeting<br />
AYP for Disability Subgroup<br />
State<br />
Target<br />
3.06% 4.20%<br />
LEA<br />
Rate<br />
3.85%<br />
% of Districts Meeting AYP<br />
for Disability Subgroup<br />
Target Met by<br />
LEA (Y/N)<br />
Y<br />
Target Met by<br />
LEA(Y/N)<br />
Overall N 17.15% 6.25%<br />
NA<br />
N<br />
N<br />
Note: For a district to qualify as having a disability subgroup it must have a minimum of 40 (n=40) students with disabilities in a school building.<br />
B) Participation<br />
Participation Rate: # of<br />
CWD Tested ÷ # of CWD<br />
Enrolled in grades tested.<br />
Participation Rate: Literacy<br />
Participation Rate: Math<br />
Note: - - denotes not applicable<br />
State<br />
Rate<br />
98.78%<br />
State<br />
Target<br />
95.00%<br />
LEA<br />
Rate<br />
96.88%<br />
Target Met<br />
by LEA (Y/N)<br />
98.61% 95.00% 96.77% Y<br />
Y<br />
C) Performance Proficiency<br />
Percent of CWD Scoring<br />
Proficient or Above<br />
Proficiency Rate: Literacy<br />
Proficiency Rate:<br />
Mathematics<br />
16.00%<br />
16.00%<br />
State<br />
Rate<br />
31.49%<br />
44.86%<br />
State<br />
Target<br />
45.22%<br />
51.14%<br />
LEA<br />
Rate<br />
40.00%<br />
53.33%<br />
NA<br />
NA<br />
Target<br />
Met by<br />
LEA (Y/N)<br />
N<br />
Y<br />
Page 1 of 5
LEA: 3211 - MIDLAND SCHOOL <strong>DISTRICT</strong><br />
Indicator 04: Out-of-School Suspensions and Expulsions (2009/10 school year)<br />
A) Suspension/Expulsion<br />
Percent difference of CWD with out-of- school suspensions and<br />
expulsions totaling greater than 10 days in a school year as<br />
compared to the same data for general education students in<br />
the district.<br />
B) Suspension/Expulsion by Race and Ethnicity<br />
Percent of districts that have: (a) a significant discrepancy, by race or<br />
ethnicity, in the rate of suspensions and expulsions of greater than 10<br />
days in a school year for children with IEPs; and (b) policies,<br />
procedures or practices that contribute to the significant discrepancy<br />
and do not comply with requirements relating to the development<br />
and implementation of IEPs, the use of positive behavioral<br />
interventions and supports, and procedural safeguards.<br />
Indicator 05: School Age (5-21) Least Restrictive Environment<br />
A) In the Regular Class 80% or more of the day<br />
Percent of CWD with<br />
IEPs receiving instruction<br />
in the regular class 80%<br />
or more of the day.<br />
State<br />
Rate<br />
State<br />
Target<br />
LEA<br />
Rate<br />
B) In the Regular Class less than 40% of the day<br />
Percent of CWD with<br />
IEPs receiving instruction<br />
in the regular class less<br />
than 60% of the day.<br />
53.87% 59.77%<br />
State<br />
Rate<br />
State<br />
Target<br />
12.42% 12.51%<br />
54.05%<br />
LEA<br />
Rate<br />
16.22%<br />
C) Other Settings outside the regular class<br />
Percent of CWD with IEPs served in<br />
public or private separate schools,<br />
residential placements, or<br />
homebound/hospital placements.<br />
State<br />
Rate<br />
State<br />
Target<br />
2.80% 2.56%<br />
Target Met<br />
by LEA (Y/N)<br />
N<br />
Target Met<br />
by LEA (Y/N)<br />
N<br />
LEA<br />
Rate<br />
0.00%<br />
Target Met<br />
by LEA(Y/N)<br />
Indicator 06: Early Childhood (3-5) Least Restrictive Environment<br />
A) Regular Early Childhood Program<br />
Percent of children (aged 3 through 5) with IEPs attending a regular<br />
early childhood program and receiving the majority of special<br />
education and related services in the regular early childhood program<br />
Allowable<br />
Difference<br />
LEA: 3211 - MIDLAND SCHOOL <strong>DISTRICT</strong><br />
Indicator 07: Preschool (3-5) Outcomes<br />
a) Percent of preschool CWD<br />
children who did not<br />
improve functioning.<br />
b) Percent of preschool CWD<br />
who improved but whose<br />
functioning remained below<br />
same age peers.<br />
c) Percent of preschool CWD<br />
who improved at a level<br />
nearer to same aged peers.<br />
d) Percent of preschool CWD<br />
who improved functioning to<br />
reach a level comparable to<br />
same age peers.<br />
e) Percent of preschool CWD<br />
children who maintain<br />
functioning at a level<br />
comparable to same aged<br />
peers.<br />
Summary<br />
Statements<br />
1) Of those preschool<br />
children who entered<br />
the preschool program<br />
below age expectations<br />
in each Outcome, the<br />
percent who<br />
substantially increased<br />
their rate of growth by<br />
the time they turned 6<br />
years of age or exited<br />
the program.<br />
2) The percent of<br />
preschool children who<br />
were functioning<br />
within age expectations<br />
in each Outcome by the<br />
time they turned 6<br />
years of age or exited<br />
A) Positive Social -Emotional<br />
Skills*<br />
State<br />
Rate<br />
A) Positive Social -<br />
Emotional Skills<br />
(Including social<br />
relationships)<br />
State<br />
Rate<br />
2.14%<br />
5.31%<br />
25.97%<br />
38.22%<br />
28.36%<br />
State<br />
Target<br />
LEA<br />
Rate<br />
LEA<br />
Rate<br />
— —<br />
— —<br />
— —<br />
81.25%<br />
18.75%<br />
Target<br />
Met by<br />
LEA(Y/N)<br />
B) Acquisition and Use of<br />
Knowledge and Skills<br />
(Including early language/<br />
communication and early literacy)<br />
B) Acquisition and Use of<br />
Knowledge and Skills **<br />
State<br />
Rate<br />
1.75%<br />
6.59%<br />
34.23%<br />
43.51%<br />
13.92%<br />
State<br />
Target<br />
LEA<br />
Rate<br />
Target<br />
Met by<br />
LEA(Y/N)<br />
C) Use of Appropriate Behaviors<br />
to Meet Their Needs<br />
State<br />
Rate<br />
State<br />
Target<br />
LEA<br />
Rate<br />
Target<br />
Met by<br />
LEA(Y/N)<br />
89.61% 90.50% 100.00% Y 90.31% 90.50% 100.00% Y 90.82% 92.50% 100.00% Y<br />
66.58% 69.50% 100.00% Y 57.43% 60.50% 75.00% Y 76.69% 78.50% 75.00% N<br />
NOTE: * Including social relationships ** Including early language/ communication and early literacy<br />
Note: - - denotes not applicable<br />
State<br />
Rate<br />
LEA<br />
Rate<br />
— —<br />
— —<br />
25.00%<br />
75.00%<br />
— —<br />
C) Use of<br />
Appropriate<br />
Behaviors to<br />
Meet Their Needs<br />
State<br />
Rate<br />
4.51%<br />
17.34%<br />
41.72%<br />
34.97%<br />
LEA<br />
Rate<br />
1.46% — —<br />
— —<br />
25.00%<br />
75.00%<br />
— —<br />
Page 3 of 5
LEA: 3211 - MIDLAND SCHOOL <strong>DISTRICT</strong><br />
Indicator 08: Parent Involvement<br />
Percent of surveyed<br />
parents who reported<br />
school facilitated parent<br />
involvement as a means<br />
of improving services<br />
and results for children<br />
with disabilities.<br />
Early Childhood<br />
(3-5)<br />
School Age<br />
(5-21)<br />
State<br />
Rate<br />
90.47%<br />
95.05%<br />
Indicator 09: Disproportionality - Eligibility<br />
Disproportionate representation of racial<br />
and ethnic groups in special education and<br />
related services that is a result of<br />
inappropriate identification (e.g.<br />
monitoring data, review of policies,<br />
practices, and procedures under 618(d),<br />
etc.).<br />
State<br />
Rate<br />
State<br />
Target<br />
88.00%<br />
96.00%<br />
State<br />
Target<br />
0.00% 0.00%<br />
LEA<br />
Rate<br />
100.00%<br />
100.00%<br />
Indicator 10: Disproportionality-Child with a Disability<br />
Disproportionate representation of racial<br />
and ethnic groups in specific disability<br />
categories that is a result of inappropriate<br />
identification (e.g. monitoring data, review<br />
of policies, practices, and procedures under<br />
618(d), etc.).<br />
Indicator 11: Child Find<br />
Percent of children with<br />
parental consent to evaluate<br />
who are evaluated within<br />
the State established timeline<br />
of 60 days.<br />
Overall<br />
(3-21)<br />
Early Childhood<br />
(3-5)<br />
School Age<br />
(5-21)<br />
State<br />
Rate<br />
0.00%<br />
Indicator 12: Early Childhood Transition<br />
Percent of children referred by Part C prior to<br />
age 3, who are found eligible for Part B, and<br />
who have an IEP developed and implemented<br />
by their third birthday.<br />
Note: - - denotes not applicable<br />
State<br />
Rate<br />
99.41%<br />
99.70%<br />
98.97%<br />
State<br />
Rate<br />
State<br />
Target<br />
0.00%<br />
State<br />
Target<br />
100.00%<br />
100.00%<br />
100.00%<br />
State<br />
Target<br />
Target Met by<br />
LEA (Y/N)<br />
Y<br />
Target Met by<br />
LEA (Y/N)<br />
Y<br />
LEA<br />
Rate<br />
100.00%<br />
100.00%<br />
100.00%<br />
LEA<br />
Rate<br />
Target Met by<br />
LEA (Y/N)<br />
Y<br />
Y<br />
Note: The target for Indicator 09 is to have zero percent<br />
(0%) of districts identified as having disproportionate<br />
representation as a result of inappropriate<br />
identification in eligibility.<br />
Note: The target for Indicator 10 is to have zero<br />
percent (0%) of districts identified as having<br />
disproportionate representation as a result of<br />
inappropriate identification in a disability<br />
category.<br />
Target Met by<br />
LEA (Y/N)<br />
Y<br />
Y<br />
Target Met<br />
by LEA<br />
(Y/N)<br />
99.21% 100.00% - - N/A<br />
Y<br />
Note: * Indicates a zero reponse rate for the<br />
district.<br />
Page 4 of 5
LEA: 3211 - MIDLAND SCHOOL <strong>DISTRICT</strong><br />
Indicator 13: Secondary Transition<br />
Percent of youth with disabilities aged 16 and<br />
up with an IEP that includes coordinated,<br />
measurable, annual IEP goals and transition<br />
services that will reasonably enable the student<br />
to meet the post-secondary goals.<br />
Indicator 14: Post-School Outcomes<br />
A. Percent of youth enrolled in higher<br />
education within one year of leaving high<br />
school.<br />
State<br />
Rate<br />
State<br />
Target<br />
Note: Data for this Indicator is from the on-site monitoring of LEAs for the given year.<br />
B. Percent of youth enrolled in higher<br />
education or competitively employed<br />
within one year of leaving high school.<br />
C. Percent of youth enrolled in higher<br />
education or in some other postsecondary<br />
education or training program; or<br />
competitively employed or in some other<br />
employment within one year of leaving<br />
high school.<br />
State<br />
Rate<br />
Indicator 20: Reported Data-Timely and Accurate*<br />
District submitted<br />
required data elements<br />
on or before due dates;<br />
made revisions within<br />
the alloted reveiw<br />
periods.<br />
Accurate and Timely<br />
Data Submission<br />
Overall (3-21)<br />
Early Childhood (3-5)<br />
School Age (5-21)<br />
State<br />
Target<br />
100.00%<br />
100.00%<br />
100.00%<br />
State<br />
Target<br />
LEA<br />
Rate<br />
LEA<br />
Rate<br />
Target Met by<br />
LEA (Y/N)<br />
Target Met<br />
by LEA<br />
(Y/N)<br />
Target Met<br />
by LEA<br />
(Y/N)<br />
*Data reviewed for timely and accurate submissions included all APSCN cycle data except for personnel<br />
Note: - - denotes not applicable<br />
96.19 100.00 100.00% Y<br />
14.53<br />
State<br />
Rate<br />
49.42<br />
State<br />
Rate<br />
54.07<br />
13.00<br />
State<br />
Target<br />
49.00<br />
State<br />
Target<br />
60.00<br />
Y<br />
Y<br />
Y<br />
— —<br />
LEA<br />
Rate<br />
— —<br />
LEA<br />
Rate<br />
— —<br />
N/A<br />
Target Met<br />
by LEA<br />
(Y/N)<br />
N/A<br />
Target Met<br />
by LEA<br />
(Y/N)<br />
N/A<br />
Page 5 of 5
<strong>ARKANSAS</strong> <strong>SPECIAL</strong> <strong>EDUCATION</strong><br />
<strong>DISTRICT</strong> <strong>ANNUAL</strong> PERFORMANCE REPORT<br />
2010/11 School Year<br />
Publication Date: March 2012<br />
Each State must have in place a State Performance Plan (SPP) to evaluate the State's efforts to meet the requirements and<br />
purposes of the implementation of the Individuals with Disabilities Education Act (IDEA). The SPP is a six-year plan, which<br />
describes Arkansas's performance on 20 indicators. The Office of Special Education Programs in the U. S. Department of<br />
Education requires that States report annually to the public on the performance of each local education agency (LEA) on 14 of<br />
20 indicators as compared with targets established by the State in the SPP. Arkansas will report indicators 1 through 14 and<br />
20 for each LEA serving children with disabilities (CWD). Any LEA not meeting targets on compliance indicators (0% for<br />
Indicators 4B, 09 & 10 and 100% for Indicators 11, 12, 13, and 20) are non-compliant with IDEA.<br />
There are no report changes for the 2010/11 school year profile; However, it is important to recognize that: .<br />
1. Indicator 01 (Graduation) is reported a year in arrear (2009/10 graduates) and is based on a four-year cohort. This<br />
means the rate is a measure of students who entered in ninth grade and graduate in four years. The calculation is a<br />
requirement under Title I of the Elementary and Secondary Education Act (ESEA).<br />
2. Indicator 02 (Drop out) is reported a year in arrear. This means the rate is a measure of students who dropped out in<br />
the 2009/10 school year. The Indicator 02 data are aligned with the Common Core of Data (CCD) requirements for<br />
grades 7-12.<br />
3. Indicator 04A and 4B (Suspension/Expulsion) is reported a year in arrear. This means the rate is a measure of<br />
students who had out-of-school suspensions and/or expulsions totaling more than 10 days.<br />
For a complete description of all the Indicators, please visit the special education website at<br />
http://arksped.k12.ar.us/sections/policy.html<br />
LEA: 3212 - CEDAR RIDGE SCHOOL <strong>DISTRICT</strong><br />
Indicator 01: Graduation Rates (2009/10 school year) Indicator 02: Dropout Rates (2009/10 school year)<br />
Percent of youth<br />
with IEPs<br />
graduating from<br />
high school with a<br />
regular diploma<br />
State<br />
Rate<br />
State<br />
Target<br />
75.76% 85.00%<br />
LEA<br />
Rate<br />
85.71%<br />
Target Met<br />
by LEA<br />
(Y/N)<br />
Y<br />
Percent of<br />
youth with<br />
IEPs dropping<br />
out of high<br />
school<br />
State<br />
Rate<br />
Indicator 03: Assessment on Statewide Benchmark Exam (grades 3-8, 11)<br />
A) Adequate Yearly Progress<br />
n=40<br />
Literacy<br />
Mathematics<br />
Met Disability Subgroup "n"<br />
for Reporting Purposes (Y/N)<br />
State Target for % of Districts Meeting<br />
AYP for Disability Subgroup<br />
State<br />
Target<br />
3.06% 4.20%<br />
LEA<br />
Rate<br />
0.00%<br />
% of Districts Meeting AYP<br />
for Disability Subgroup<br />
Target Met by<br />
LEA (Y/N)<br />
Y<br />
Target Met by<br />
LEA(Y/N)<br />
Overall N 17.15% 6.25%<br />
NA<br />
N<br />
N<br />
Note: For a district to qualify as having a disability subgroup it must have a minimum of 40 (n=40) students with disabilities in a school building.<br />
B) Participation<br />
Participation Rate: # of<br />
CWD Tested ÷ # of CWD<br />
Enrolled in grades tested.<br />
Participation Rate: Literacy<br />
Participation Rate: Math<br />
Note: - - denotes not applicable<br />
State<br />
Rate<br />
98.78%<br />
State<br />
Target<br />
95.00%<br />
LEA<br />
Rate<br />
98.31%<br />
Target Met<br />
by LEA (Y/N)<br />
98.61% 95.00% 98.33% Y<br />
Y<br />
C) Performance Proficiency<br />
Percent of CWD Scoring<br />
Proficient or Above<br />
Proficiency Rate: Literacy<br />
Proficiency Rate:<br />
Mathematics<br />
16.00%<br />
16.00%<br />
State<br />
Rate<br />
31.49%<br />
44.86%<br />
State<br />
Target<br />
45.22%<br />
51.14%<br />
LEA<br />
Rate<br />
31.03%<br />
37.29%<br />
NA<br />
NA<br />
Target<br />
Met by<br />
LEA (Y/N)<br />
N<br />
N<br />
Page 1 of 5
LEA: 3212 - CEDAR RIDGE SCHOOL <strong>DISTRICT</strong><br />
Indicator 04: Out-of-School Suspensions and Expulsions (2009/10 school year)<br />
A) Suspension/Expulsion<br />
Percent difference of CWD with out-of- school suspensions and<br />
expulsions totaling greater than 10 days in a school year as<br />
compared to the same data for general education students in<br />
the district.<br />
B) Suspension/Expulsion by Race and Ethnicity<br />
Percent of districts that have: (a) a significant discrepancy, by race or<br />
ethnicity, in the rate of suspensions and expulsions of greater than 10<br />
days in a school year for children with IEPs; and (b) policies,<br />
procedures or practices that contribute to the significant discrepancy<br />
and do not comply with requirements relating to the development<br />
and implementation of IEPs, the use of positive behavioral<br />
interventions and supports, and procedural safeguards.<br />
Indicator 05: School Age (5-21) Least Restrictive Environment<br />
A) In the Regular Class 80% or more of the day<br />
Percent of CWD with<br />
IEPs receiving instruction<br />
in the regular class 80%<br />
or more of the day.<br />
State<br />
Rate<br />
State<br />
Target<br />
LEA<br />
Rate<br />
B) In the Regular Class less than 40% of the day<br />
Percent of CWD with<br />
IEPs receiving instruction<br />
in the regular class less<br />
than 60% of the day.<br />
53.87% 59.77%<br />
State<br />
Rate<br />
State<br />
Target<br />
12.42% 12.51%<br />
68.18%<br />
LEA<br />
Rate<br />
6.36%<br />
C) Other Settings outside the regular class<br />
Percent of CWD with IEPs served in<br />
public or private separate schools,<br />
residential placements, or<br />
homebound/hospital placements.<br />
State<br />
Rate<br />
State<br />
Target<br />
2.80% 2.56%<br />
Target Met<br />
by LEA (Y/N)<br />
Y<br />
Target Met<br />
by LEA (Y/N)<br />
Y<br />
LEA<br />
Rate<br />
0.00%<br />
Target Met<br />
by LEA(Y/N)<br />
Indicator 06: Early Childhood (3-5) Least Restrictive Environment<br />
A) Regular Early Childhood Program<br />
Percent of children (aged 3 through 5) with IEPs attending a regular<br />
early childhood program and receiving the majority of special<br />
education and related services in the regular early childhood program<br />
Allowable<br />
Difference<br />
LEA: 3212 - CEDAR RIDGE SCHOOL <strong>DISTRICT</strong><br />
Indicator 07: Preschool (3-5) Outcomes<br />
a) Percent of preschool CWD<br />
children who did not<br />
improve functioning.<br />
b) Percent of preschool CWD<br />
who improved but whose<br />
functioning remained below<br />
same age peers.<br />
c) Percent of preschool CWD<br />
who improved at a level<br />
nearer to same aged peers.<br />
d) Percent of preschool CWD<br />
who improved functioning to<br />
reach a level comparable to<br />
same age peers.<br />
e) Percent of preschool CWD<br />
children who maintain<br />
functioning at a level<br />
comparable to same aged<br />
peers.<br />
Summary<br />
Statements<br />
1) Of those preschool<br />
children who entered<br />
the preschool program<br />
below age expectations<br />
in each Outcome, the<br />
percent who<br />
substantially increased<br />
their rate of growth by<br />
the time they turned 6<br />
years of age or exited<br />
the program.<br />
2) The percent of<br />
preschool children who<br />
were functioning<br />
within age expectations<br />
in each Outcome by the<br />
time they turned 6<br />
years of age or exited<br />
A) Positive Social -Emotional<br />
Skills*<br />
State<br />
Rate<br />
A) Positive Social -<br />
Emotional Skills<br />
(Including social<br />
relationships)<br />
State<br />
Rate<br />
2.14%<br />
5.31%<br />
25.97%<br />
38.22%<br />
28.36%<br />
State<br />
Target<br />
LEA<br />
Rate<br />
LEA<br />
Rate<br />
— —<br />
— —<br />
— —<br />
5.26%<br />
94.74%<br />
Target<br />
Met by<br />
LEA(Y/N)<br />
B) Acquisition and Use of<br />
Knowledge and Skills<br />
(Including early language/<br />
communication and early literacy)<br />
B) Acquisition and Use of<br />
Knowledge and Skills **<br />
State<br />
Rate<br />
1.75%<br />
6.59%<br />
34.23%<br />
43.51%<br />
13.92%<br />
State<br />
Target<br />
LEA<br />
Rate<br />
Target<br />
Met by<br />
LEA(Y/N)<br />
C) Use of Appropriate Behaviors<br />
to Meet Their Needs<br />
State<br />
Rate<br />
State<br />
Target<br />
LEA<br />
Rate<br />
Target<br />
Met by<br />
LEA(Y/N)<br />
89.61% 90.50% 100.00% Y 90.31% 90.50% 100.00% Y 90.82% 92.50% 100.00% Y<br />
66.58% 69.50% 100.00% Y 57.43% 60.50% 100.00% Y 76.69% 78.50% 100.00% Y<br />
NOTE: * Including social relationships ** Including early language/ communication and early literacy<br />
Note: - - denotes not applicable<br />
State<br />
Rate<br />
LEA<br />
Rate<br />
— —<br />
— —<br />
— —<br />
10.53%<br />
89.47%<br />
C) Use of<br />
Appropriate<br />
Behaviors to<br />
Meet Their Needs<br />
State<br />
Rate<br />
4.51%<br />
17.34%<br />
41.72%<br />
34.97%<br />
LEA<br />
Rate<br />
1.46% — —<br />
— —<br />
— —<br />
5.26%<br />
94.74%<br />
Page 3 of 5
LEA: 3212 - CEDAR RIDGE SCHOOL <strong>DISTRICT</strong><br />
Indicator 08: Parent Involvement<br />
Percent of surveyed<br />
parents who reported<br />
school facilitated parent<br />
involvement as a means<br />
of improving services<br />
and results for children<br />
with disabilities.<br />
Early Childhood<br />
(3-5)<br />
School Age<br />
(5-21)<br />
State<br />
Rate<br />
90.47%<br />
95.05%<br />
Indicator 09: Disproportionality - Eligibility<br />
Disproportionate representation of racial<br />
and ethnic groups in special education and<br />
related services that is a result of<br />
inappropriate identification (e.g.<br />
monitoring data, review of policies,<br />
practices, and procedures under 618(d),<br />
etc.).<br />
State<br />
Rate<br />
State<br />
Target<br />
88.00%<br />
96.00%<br />
State<br />
Target<br />
0.00% 0.00%<br />
LEA<br />
Rate<br />
100.00%<br />
96.08%<br />
Indicator 10: Disproportionality-Child with a Disability<br />
Disproportionate representation of racial<br />
and ethnic groups in specific disability<br />
categories that is a result of inappropriate<br />
identification (e.g. monitoring data, review<br />
of policies, practices, and procedures under<br />
618(d), etc.).<br />
Indicator 11: Child Find<br />
Percent of children with<br />
parental consent to evaluate<br />
who are evaluated within<br />
the State established timeline<br />
of 60 days.<br />
Overall<br />
(3-21)<br />
Early Childhood<br />
(3-5)<br />
School Age<br />
(5-21)<br />
State<br />
Rate<br />
0.00%<br />
Indicator 12: Early Childhood Transition<br />
Percent of children referred by Part C prior to<br />
age 3, who are found eligible for Part B, and<br />
who have an IEP developed and implemented<br />
by their third birthday.<br />
Note: - - denotes not applicable<br />
State<br />
Rate<br />
99.41%<br />
99.70%<br />
98.97%<br />
State<br />
Rate<br />
State<br />
Target<br />
0.00%<br />
State<br />
Target<br />
100.00%<br />
100.00%<br />
100.00%<br />
State<br />
Target<br />
Target Met by<br />
LEA (Y/N)<br />
Y<br />
Target Met by<br />
LEA (Y/N)<br />
Y<br />
LEA<br />
Rate<br />
100.00%<br />
100.00%<br />
100.00%<br />
LEA<br />
Rate<br />
Target Met by<br />
LEA (Y/N)<br />
Y<br />
Y<br />
Note: The target for Indicator 09 is to have zero percent<br />
(0%) of districts identified as having disproportionate<br />
representation as a result of inappropriate<br />
identification in eligibility.<br />
Note: The target for Indicator 10 is to have zero<br />
percent (0%) of districts identified as having<br />
disproportionate representation as a result of<br />
inappropriate identification in a disability<br />
category.<br />
Target Met by<br />
LEA (Y/N)<br />
Y<br />
Y<br />
Target Met<br />
by LEA<br />
(Y/N)<br />
99.21% 100.00% 100.00% Y<br />
Y<br />
Note: * Indicates a zero reponse rate for the<br />
district.<br />
Page 4 of 5
LEA: 3212 - CEDAR RIDGE SCHOOL <strong>DISTRICT</strong><br />
Indicator 13: Secondary Transition<br />
Percent of youth with disabilities aged 16 and<br />
up with an IEP that includes coordinated,<br />
measurable, annual IEP goals and transition<br />
services that will reasonably enable the student<br />
to meet the post-secondary goals.<br />
Indicator 14: Post-School Outcomes<br />
A. Percent of youth enrolled in higher<br />
education within one year of leaving high<br />
school.<br />
State<br />
Rate<br />
State<br />
Target<br />
Note: Data for this Indicator is from the on-site monitoring of LEAs for the given year.<br />
B. Percent of youth enrolled in higher<br />
education or competitively employed<br />
within one year of leaving high school.<br />
C. Percent of youth enrolled in higher<br />
education or in some other postsecondary<br />
education or training program; or<br />
competitively employed or in some other<br />
employment within one year of leaving<br />
high school.<br />
State<br />
Rate<br />
Indicator 20: Reported Data-Timely and Accurate*<br />
District submitted<br />
required data elements<br />
on or before due dates;<br />
made revisions within<br />
the alloted reveiw<br />
periods.<br />
Accurate and Timely<br />
Data Submission<br />
Overall (3-21)<br />
Early Childhood (3-5)<br />
School Age (5-21)<br />
State<br />
Target<br />
100.00%<br />
100.00%<br />
100.00%<br />
State<br />
Target<br />
LEA<br />
Rate<br />
LEA<br />
Rate<br />
Target Met by<br />
LEA (Y/N)<br />
Target Met<br />
by LEA<br />
(Y/N)<br />
Target Met<br />
by LEA<br />
(Y/N)<br />
*Data reviewed for timely and accurate submissions included all APSCN cycle data except for personnel<br />
Note: - - denotes not applicable<br />
96.19 100.00 — — N/A<br />
14.53<br />
State<br />
Rate<br />
49.42<br />
State<br />
Rate<br />
54.07<br />
13.00<br />
State<br />
Target<br />
49.00<br />
State<br />
Target<br />
60.00<br />
Y<br />
Y<br />
Y<br />
0.00%<br />
LEA<br />
Rate<br />
50.00%<br />
LEA<br />
Rate<br />
50.00%<br />
N<br />
Target Met<br />
by LEA<br />
(Y/N)<br />
Y<br />
Target Met<br />
by LEA<br />
(Y/N)<br />
N<br />
Page 5 of 5
<strong>ARKANSAS</strong> <strong>SPECIAL</strong> <strong>EDUCATION</strong><br />
<strong>DISTRICT</strong> <strong>ANNUAL</strong> PERFORMANCE REPORT<br />
2010/11 School Year<br />
Publication Date: March 2012<br />
Each State must have in place a State Performance Plan (SPP) to evaluate the State's efforts to meet the requirements and<br />
purposes of the implementation of the Individuals with Disabilities Education Act (IDEA). The SPP is a six-year plan, which<br />
describes Arkansas's performance on 20 indicators. The Office of Special Education Programs in the U. S. Department of<br />
Education requires that States report annually to the public on the performance of each local education agency (LEA) on 14 of<br />
20 indicators as compared with targets established by the State in the SPP. Arkansas will report indicators 1 through 14 and<br />
20 for each LEA serving children with disabilities (CWD). Any LEA not meeting targets on compliance indicators (0% for<br />
Indicators 4B, 09 & 10 and 100% for Indicators 11, 12, 13, and 20) are non-compliant with IDEA.<br />
There are no report changes for the 2010/11 school year profile; However, it is important to recognize that: .<br />
1. Indicator 01 (Graduation) is reported a year in arrear (2009/10 graduates) and is based on a four-year cohort. This<br />
means the rate is a measure of students who entered in ninth grade and graduate in four years. The calculation is a<br />
requirement under Title I of the Elementary and Secondary Education Act (ESEA).<br />
2. Indicator 02 (Drop out) is reported a year in arrear. This means the rate is a measure of students who dropped out in<br />
the 2009/10 school year. The Indicator 02 data are aligned with the Common Core of Data (CCD) requirements for<br />
grades 7-12.<br />
3. Indicator 04A and 4B (Suspension/Expulsion) is reported a year in arrear. This means the rate is a measure of<br />
students who had out-of-school suspensions and/or expulsions totaling more than 10 days.<br />
For a complete description of all the Indicators, please visit the special education website at<br />
http://arksped.k12.ar.us/sections/policy.html<br />
LEA: 3301 - CALICO ROCK SCHOOL <strong>DISTRICT</strong><br />
Indicator 01: Graduation Rates (2009/10 school year) Indicator 02: Dropout Rates (2009/10 school year)<br />
Percent of youth<br />
with IEPs<br />
graduating from<br />
high school with a<br />
regular diploma<br />
State<br />
Rate<br />
State<br />
Target<br />
75.76% 85.00%<br />
LEA<br />
Rate<br />
66.67%<br />
Target Met<br />
by LEA<br />
(Y/N)<br />
N<br />
Percent of<br />
youth with<br />
IEPs dropping<br />
out of high<br />
school<br />
State<br />
Rate<br />
Indicator 03: Assessment on Statewide Benchmark Exam (grades 3-8, 11)<br />
A) Adequate Yearly Progress<br />
n=40<br />
Literacy<br />
Mathematics<br />
Met Disability Subgroup "n"<br />
for Reporting Purposes (Y/N)<br />
State Target for % of Districts Meeting<br />
AYP for Disability Subgroup<br />
State<br />
Target<br />
3.06% 4.20%<br />
LEA<br />
Rate<br />
0.00%<br />
% of Districts Meeting AYP<br />
for Disability Subgroup<br />
Target Met by<br />
LEA (Y/N)<br />
Y<br />
Target Met by<br />
LEA(Y/N)<br />
Overall N 17.15% 6.25%<br />
NA<br />
N<br />
N<br />
Note: For a district to qualify as having a disability subgroup it must have a minimum of 40 (n=40) students with disabilities in a school building.<br />
B) Participation<br />
Participation Rate: # of<br />
CWD Tested ÷ # of CWD<br />
Enrolled in grades tested.<br />
Participation Rate: Literacy<br />
Participation Rate: Math<br />
Note: - - denotes not applicable<br />
State<br />
Rate<br />
98.78%<br />
State<br />
Target<br />
95.00%<br />
LEA<br />
Rate<br />
100.00%<br />
Target Met<br />
by LEA (Y/N)<br />
98.61% 95.00% 100.00% Y<br />
Y<br />
C) Performance Proficiency<br />
Percent of CWD Scoring<br />
Proficient or Above<br />
Proficiency Rate: Literacy<br />
Proficiency Rate:<br />
Mathematics<br />
16.00%<br />
16.00%<br />
State<br />
Rate<br />
31.49%<br />
44.86%<br />
State<br />
Target<br />
45.22%<br />
51.14%<br />
LEA<br />
Rate<br />
33.33%<br />
33.33%<br />
NA<br />
NA<br />
Target<br />
Met by<br />
LEA (Y/N)<br />
N<br />
N<br />
Page 1 of 5
LEA: 3301 - CALICO ROCK SCHOOL <strong>DISTRICT</strong><br />
Indicator 04: Out-of-School Suspensions and Expulsions (2009/10 school year)<br />
A) Suspension/Expulsion<br />
Percent difference of CWD with out-of- school suspensions and<br />
expulsions totaling greater than 10 days in a school year as<br />
compared to the same data for general education students in<br />
the district.<br />
B) Suspension/Expulsion by Race and Ethnicity<br />
Percent of districts that have: (a) a significant discrepancy, by race or<br />
ethnicity, in the rate of suspensions and expulsions of greater than 10<br />
days in a school year for children with IEPs; and (b) policies,<br />
procedures or practices that contribute to the significant discrepancy<br />
and do not comply with requirements relating to the development<br />
and implementation of IEPs, the use of positive behavioral<br />
interventions and supports, and procedural safeguards.<br />
Indicator 05: School Age (5-21) Least Restrictive Environment<br />
A) In the Regular Class 80% or more of the day<br />
Percent of CWD with<br />
IEPs receiving instruction<br />
in the regular class 80%<br />
or more of the day.<br />
State<br />
Rate<br />
State<br />
Target<br />
LEA<br />
Rate<br />
B) In the Regular Class less than 40% of the day<br />
Percent of CWD with<br />
IEPs receiving instruction<br />
in the regular class less<br />
than 60% of the day.<br />
53.87% 59.77%<br />
State<br />
Rate<br />
State<br />
Target<br />
12.42% 12.51%<br />
89.80%<br />
LEA<br />
Rate<br />
0.00%<br />
C) Other Settings outside the regular class<br />
Percent of CWD with IEPs served in<br />
public or private separate schools,<br />
residential placements, or<br />
homebound/hospital placements.<br />
State<br />
Rate<br />
State<br />
Target<br />
2.80% 2.56%<br />
Target Met<br />
by LEA (Y/N)<br />
Y<br />
Target Met<br />
by LEA (Y/N)<br />
Y<br />
LEA<br />
Rate<br />
0.00%<br />
Target Met<br />
by LEA(Y/N)<br />
Indicator 06: Early Childhood (3-5) Least Restrictive Environment<br />
A) Regular Early Childhood Program<br />
Percent of children (aged 3 through 5) with IEPs attending a regular<br />
early childhood program and receiving the majority of special<br />
education and related services in the regular early childhood program<br />
Allowable<br />
Difference<br />
LEA: 3301 - CALICO ROCK SCHOOL <strong>DISTRICT</strong><br />
Indicator 07: Preschool (3-5) Outcomes<br />
a) Percent of preschool CWD<br />
children who did not<br />
improve functioning.<br />
b) Percent of preschool CWD<br />
who improved but whose<br />
functioning remained below<br />
same age peers.<br />
c) Percent of preschool CWD<br />
who improved at a level<br />
nearer to same aged peers.<br />
d) Percent of preschool CWD<br />
who improved functioning to<br />
reach a level comparable to<br />
same age peers.<br />
e) Percent of preschool CWD<br />
children who maintain<br />
functioning at a level<br />
comparable to same aged<br />
peers.<br />
Summary<br />
Statements<br />
1) Of those preschool<br />
children who entered<br />
the preschool program<br />
below age expectations<br />
in each Outcome, the<br />
percent who<br />
substantially increased<br />
their rate of growth by<br />
the time they turned 6<br />
years of age or exited<br />
the program.<br />
2) The percent of<br />
preschool children who<br />
were functioning<br />
within age expectations<br />
in each Outcome by the<br />
time they turned 6<br />
years of age or exited<br />
A) Positive Social -Emotional<br />
Skills*<br />
State<br />
Rate<br />
A) Positive Social -<br />
Emotional Skills<br />
(Including social<br />
relationships)<br />
State<br />
Rate<br />
2.14%<br />
5.31%<br />
25.97%<br />
38.22%<br />
28.36%<br />
State<br />
Target<br />
LEA<br />
Rate<br />
LEA<br />
Rate<br />
— —<br />
— —<br />
— —<br />
— —<br />
— —<br />
Target<br />
Met by<br />
LEA(Y/N)<br />
B) Acquisition and Use of<br />
Knowledge and Skills<br />
(Including early language/<br />
communication and early literacy)<br />
B) Acquisition and Use of<br />
Knowledge and Skills **<br />
State<br />
Rate<br />
1.75%<br />
6.59%<br />
34.23%<br />
43.51%<br />
13.92%<br />
State<br />
Target<br />
LEA<br />
Rate<br />
Target<br />
Met by<br />
LEA(Y/N)<br />
C) Use of Appropriate Behaviors<br />
to Meet Their Needs<br />
State<br />
Rate<br />
State<br />
Target<br />
LEA<br />
Rate<br />
Target<br />
Met by<br />
LEA(Y/N)<br />
89.61% 90.50% — — N/A 90.31% 90.50% — — N/A 90.82% 92.50% — — N/A<br />
66.58% 69.50% — — N/A 57.43% 60.50% — — N/A 76.69% 78.50% — — N/A<br />
NOTE: * Including social relationships ** Including early language/ communication and early literacy<br />
Note: - - denotes not applicable<br />
State<br />
Rate<br />
LEA<br />
Rate<br />
— —<br />
— —<br />
— —<br />
— —<br />
— —<br />
C) Use of<br />
Appropriate<br />
Behaviors to<br />
Meet Their Needs<br />
State<br />
Rate<br />
4.51%<br />
17.34%<br />
41.72%<br />
34.97%<br />
LEA<br />
Rate<br />
1.46% — —<br />
— —<br />
— —<br />
— —<br />
— —<br />
Page 3 of 5
LEA: 3301 - CALICO ROCK SCHOOL <strong>DISTRICT</strong><br />
Indicator 08: Parent Involvement<br />
Percent of surveyed<br />
parents who reported<br />
school facilitated parent<br />
involvement as a means<br />
of improving services<br />
and results for children<br />
with disabilities.<br />
Early Childhood<br />
(3-5)<br />
School Age<br />
(5-21)<br />
State<br />
Rate<br />
90.47%<br />
95.05%<br />
Indicator 09: Disproportionality - Eligibility<br />
Disproportionate representation of racial<br />
and ethnic groups in special education and<br />
related services that is a result of<br />
inappropriate identification (e.g.<br />
monitoring data, review of policies,<br />
practices, and procedures under 618(d),<br />
etc.).<br />
State<br />
Rate<br />
State<br />
Target<br />
88.00%<br />
96.00%<br />
State<br />
Target<br />
0.00% 0.00%<br />
LEA<br />
Rate<br />
— —<br />
100.00%<br />
Indicator 10: Disproportionality-Child with a Disability<br />
Disproportionate representation of racial<br />
and ethnic groups in specific disability<br />
categories that is a result of inappropriate<br />
identification (e.g. monitoring data, review<br />
of policies, practices, and procedures under<br />
618(d), etc.).<br />
Indicator 11: Child Find<br />
Percent of children with<br />
parental consent to evaluate<br />
who are evaluated within<br />
the State established timeline<br />
of 60 days.<br />
Overall<br />
(3-21)<br />
Early Childhood<br />
(3-5)<br />
School Age<br />
(5-21)<br />
State<br />
Rate<br />
0.00%<br />
Indicator 12: Early Childhood Transition<br />
Percent of children referred by Part C prior to<br />
age 3, who are found eligible for Part B, and<br />
who have an IEP developed and implemented<br />
by their third birthday.<br />
Note: - - denotes not applicable<br />
State<br />
Rate<br />
99.41%<br />
99.70%<br />
98.97%<br />
State<br />
Rate<br />
State<br />
Target<br />
0.00%<br />
State<br />
Target<br />
100.00%<br />
100.00%<br />
100.00%<br />
State<br />
Target<br />
Target Met by<br />
LEA (Y/N)<br />
Y<br />
Target Met by<br />
LEA (Y/N)<br />
Y<br />
LEA<br />
Rate<br />
100.00%<br />
— —<br />
100.00%<br />
LEA<br />
Rate<br />
Target Met by<br />
LEA (Y/N)<br />
N/A<br />
Y<br />
Note: The target for Indicator 09 is to have zero percent<br />
(0%) of districts identified as having disproportionate<br />
representation as a result of inappropriate<br />
identification in eligibility.<br />
Note: The target for Indicator 10 is to have zero<br />
percent (0%) of districts identified as having<br />
disproportionate representation as a result of<br />
inappropriate identification in a disability<br />
category.<br />
Target Met by<br />
LEA (Y/N)<br />
N/A<br />
Y<br />
Target Met<br />
by LEA<br />
(Y/N)<br />
99.21% 100.00% - - N/A<br />
Y<br />
Note: * Indicates a zero reponse rate for the<br />
district.<br />
Page 4 of 5
LEA: 3301 - CALICO ROCK SCHOOL <strong>DISTRICT</strong><br />
Indicator 13: Secondary Transition<br />
Percent of youth with disabilities aged 16 and<br />
up with an IEP that includes coordinated,<br />
measurable, annual IEP goals and transition<br />
services that will reasonably enable the student<br />
to meet the post-secondary goals.<br />
Indicator 14: Post-School Outcomes<br />
A. Percent of youth enrolled in higher<br />
education within one year of leaving high<br />
school.<br />
State<br />
Rate<br />
State<br />
Target<br />
Note: Data for this Indicator is from the on-site monitoring of LEAs for the given year.<br />
B. Percent of youth enrolled in higher<br />
education or competitively employed<br />
within one year of leaving high school.<br />
C. Percent of youth enrolled in higher<br />
education or in some other postsecondary<br />
education or training program; or<br />
competitively employed or in some other<br />
employment within one year of leaving<br />
high school.<br />
State<br />
Rate<br />
Indicator 20: Reported Data-Timely and Accurate*<br />
District submitted<br />
required data elements<br />
on or before due dates;<br />
made revisions within<br />
the alloted reveiw<br />
periods.<br />
Accurate and Timely<br />
Data Submission<br />
Overall (3-21)<br />
Early Childhood (3-5)<br />
School Age (5-21)<br />
State<br />
Target<br />
100.00%<br />
100.00%<br />
100.00%<br />
State<br />
Target<br />
LEA<br />
Rate<br />
LEA<br />
Rate<br />
Target Met by<br />
LEA (Y/N)<br />
Target Met<br />
by LEA<br />
(Y/N)<br />
Target Met<br />
by LEA<br />
(Y/N)<br />
*Data reviewed for timely and accurate submissions included all APSCN cycle data except for personnel<br />
Note: - - denotes not applicable<br />
96.19 100.00 — — N/A<br />
14.53<br />
State<br />
Rate<br />
49.42<br />
State<br />
Rate<br />
54.07<br />
13.00<br />
State<br />
Target<br />
49.00<br />
State<br />
Target<br />
60.00<br />
Y<br />
N/A<br />
Y<br />
— —<br />
LEA<br />
Rate<br />
— —<br />
LEA<br />
Rate<br />
— —<br />
N/A<br />
Target Met<br />
by LEA<br />
(Y/N)<br />
N/A<br />
Target Met<br />
by LEA<br />
(Y/N)<br />
N/A<br />
Page 5 of 5
<strong>ARKANSAS</strong> <strong>SPECIAL</strong> <strong>EDUCATION</strong><br />
<strong>DISTRICT</strong> <strong>ANNUAL</strong> PERFORMANCE REPORT<br />
2010/11 School Year<br />
Publication Date: March 2012<br />
Each State must have in place a State Performance Plan (SPP) to evaluate the State's efforts to meet the requirements and<br />
purposes of the implementation of the Individuals with Disabilities Education Act (IDEA). The SPP is a six-year plan, which<br />
describes Arkansas's performance on 20 indicators. The Office of Special Education Programs in the U. S. Department of<br />
Education requires that States report annually to the public on the performance of each local education agency (LEA) on 14 of<br />
20 indicators as compared with targets established by the State in the SPP. Arkansas will report indicators 1 through 14 and<br />
20 for each LEA serving children with disabilities (CWD). Any LEA not meeting targets on compliance indicators (0% for<br />
Indicators 4B, 09 & 10 and 100% for Indicators 11, 12, 13, and 20) are non-compliant with IDEA.<br />
There are no report changes for the 2010/11 school year profile; However, it is important to recognize that: .<br />
1. Indicator 01 (Graduation) is reported a year in arrear (2009/10 graduates) and is based on a four-year cohort. This<br />
means the rate is a measure of students who entered in ninth grade and graduate in four years. The calculation is a<br />
requirement under Title I of the Elementary and Secondary Education Act (ESEA).<br />
2. Indicator 02 (Drop out) is reported a year in arrear. This means the rate is a measure of students who dropped out in<br />
the 2009/10 school year. The Indicator 02 data are aligned with the Common Core of Data (CCD) requirements for<br />
grades 7-12.<br />
3. Indicator 04A and 4B (Suspension/Expulsion) is reported a year in arrear. This means the rate is a measure of<br />
students who had out-of-school suspensions and/or expulsions totaling more than 10 days.<br />
For a complete description of all the Indicators, please visit the special education website at<br />
http://arksped.k12.ar.us/sections/policy.html<br />
LEA: 3302 - MELBOURNE SCHOOL <strong>DISTRICT</strong><br />
Indicator 01: Graduation Rates (2009/10 school year) Indicator 02: Dropout Rates (2009/10 school year)<br />
Percent of youth<br />
with IEPs<br />
graduating from<br />
high school with a<br />
regular diploma<br />
State<br />
Rate<br />
State<br />
Target<br />
75.76% 85.00%<br />
LEA<br />
Rate<br />
100.00%<br />
Target Met<br />
by LEA<br />
(Y/N)<br />
Y<br />
Percent of<br />
youth with<br />
IEPs dropping<br />
out of high<br />
school<br />
State<br />
Rate<br />
Indicator 03: Assessment on Statewide Benchmark Exam (grades 3-8, 11)<br />
A) Adequate Yearly Progress<br />
n=40<br />
Literacy<br />
Mathematics<br />
Met Disability Subgroup "n"<br />
for Reporting Purposes (Y/N)<br />
State Target for % of Districts Meeting<br />
AYP for Disability Subgroup<br />
State<br />
Target<br />
3.06% 4.20%<br />
LEA<br />
Rate<br />
0.00%<br />
% of Districts Meeting AYP<br />
for Disability Subgroup<br />
Target Met by<br />
LEA (Y/N)<br />
Y<br />
Target Met by<br />
LEA(Y/N)<br />
Overall N 17.15% 6.25%<br />
NA<br />
N<br />
N<br />
Note: For a district to qualify as having a disability subgroup it must have a minimum of 40 (n=40) students with disabilities in a school building.<br />
B) Participation<br />
Participation Rate: # of<br />
CWD Tested ÷ # of CWD<br />
Enrolled in grades tested.<br />
Participation Rate: Literacy<br />
Participation Rate: Math<br />
Note: - - denotes not applicable<br />
State<br />
Rate<br />
98.78%<br />
State<br />
Target<br />
95.00%<br />
LEA<br />
Rate<br />
100.00%<br />
Target Met<br />
by LEA (Y/N)<br />
98.61% 95.00% 100.00% Y<br />
Y<br />
C) Performance Proficiency<br />
Percent of CWD Scoring<br />
Proficient or Above<br />
Proficiency Rate: Literacy<br />
Proficiency Rate:<br />
Mathematics<br />
16.00%<br />
16.00%<br />
State<br />
Rate<br />
31.49%<br />
44.86%<br />
State<br />
Target<br />
45.22%<br />
51.14%<br />
LEA<br />
Rate<br />
34.29%<br />
58.33%<br />
NA<br />
NA<br />
Target<br />
Met by<br />
LEA (Y/N)<br />
N<br />
Y<br />
Page 1 of 5
LEA: 3302 - MELBOURNE SCHOOL <strong>DISTRICT</strong><br />
Indicator 04: Out-of-School Suspensions and Expulsions (2009/10 school year)<br />
A) Suspension/Expulsion<br />
Percent difference of CWD with out-of- school suspensions and<br />
expulsions totaling greater than 10 days in a school year as<br />
compared to the same data for general education students in<br />
the district.<br />
B) Suspension/Expulsion by Race and Ethnicity<br />
Percent of districts that have: (a) a significant discrepancy, by race or<br />
ethnicity, in the rate of suspensions and expulsions of greater than 10<br />
days in a school year for children with IEPs; and (b) policies,<br />
procedures or practices that contribute to the significant discrepancy<br />
and do not comply with requirements relating to the development<br />
and implementation of IEPs, the use of positive behavioral<br />
interventions and supports, and procedural safeguards.<br />
Indicator 05: School Age (5-21) Least Restrictive Environment<br />
A) In the Regular Class 80% or more of the day<br />
Percent of CWD with<br />
IEPs receiving instruction<br />
in the regular class 80%<br />
or more of the day.<br />
State<br />
Rate<br />
State<br />
Target<br />
LEA<br />
Rate<br />
B) In the Regular Class less than 40% of the day<br />
Percent of CWD with<br />
IEPs receiving instruction<br />
in the regular class less<br />
than 60% of the day.<br />
53.87% 59.77%<br />
State<br />
Rate<br />
State<br />
Target<br />
12.42% 12.51%<br />
59.79%<br />
LEA<br />
Rate<br />
8.25%<br />
C) Other Settings outside the regular class<br />
Percent of CWD with IEPs served in<br />
public or private separate schools,<br />
residential placements, or<br />
homebound/hospital placements.<br />
State<br />
Rate<br />
State<br />
Target<br />
2.80% 2.56%<br />
Target Met<br />
by LEA (Y/N)<br />
Y<br />
Target Met<br />
by LEA (Y/N)<br />
Y<br />
LEA<br />
Rate<br />
2.06%<br />
Target Met<br />
by LEA(Y/N)<br />
Indicator 06: Early Childhood (3-5) Least Restrictive Environment<br />
A) Regular Early Childhood Program<br />
Percent of children (aged 3 through 5) with IEPs attending a regular<br />
early childhood program and receiving the majority of special<br />
education and related services in the regular early childhood program<br />
Allowable<br />
Difference<br />
LEA: 3302 - MELBOURNE SCHOOL <strong>DISTRICT</strong><br />
Indicator 07: Preschool (3-5) Outcomes<br />
a) Percent of preschool CWD<br />
children who did not<br />
improve functioning.<br />
b) Percent of preschool CWD<br />
who improved but whose<br />
functioning remained below<br />
same age peers.<br />
c) Percent of preschool CWD<br />
who improved at a level<br />
nearer to same aged peers.<br />
d) Percent of preschool CWD<br />
who improved functioning to<br />
reach a level comparable to<br />
same age peers.<br />
e) Percent of preschool CWD<br />
children who maintain<br />
functioning at a level<br />
comparable to same aged<br />
peers.<br />
Summary<br />
Statements<br />
1) Of those preschool<br />
children who entered<br />
the preschool program<br />
below age expectations<br />
in each Outcome, the<br />
percent who<br />
substantially increased<br />
their rate of growth by<br />
the time they turned 6<br />
years of age or exited<br />
the program.<br />
2) The percent of<br />
preschool children who<br />
were functioning<br />
within age expectations<br />
in each Outcome by the<br />
time they turned 6<br />
years of age or exited<br />
A) Positive Social -Emotional<br />
Skills*<br />
State<br />
Rate<br />
A) Positive Social -<br />
Emotional Skills<br />
(Including social<br />
relationships)<br />
State<br />
Rate<br />
2.14%<br />
5.31%<br />
25.97%<br />
38.22%<br />
28.36%<br />
State<br />
Target<br />
LEA<br />
Rate<br />
LEA<br />
Rate<br />
— —<br />
— —<br />
— —<br />
— —<br />
— —<br />
Target<br />
Met by<br />
LEA(Y/N)<br />
B) Acquisition and Use of<br />
Knowledge and Skills<br />
(Including early language/<br />
communication and early literacy)<br />
B) Acquisition and Use of<br />
Knowledge and Skills **<br />
State<br />
Rate<br />
1.75%<br />
6.59%<br />
34.23%<br />
43.51%<br />
13.92%<br />
State<br />
Target<br />
LEA<br />
Rate<br />
Target<br />
Met by<br />
LEA(Y/N)<br />
C) Use of Appropriate Behaviors<br />
to Meet Their Needs<br />
State<br />
Rate<br />
State<br />
Target<br />
LEA<br />
Rate<br />
Target<br />
Met by<br />
LEA(Y/N)<br />
89.61% 90.50% — — N/A 90.31% 90.50% — — N/A 90.82% 92.50% — — N/A<br />
66.58% 69.50% — — N/A 57.43% 60.50% — — N/A 76.69% 78.50% — — N/A<br />
NOTE: * Including social relationships ** Including early language/ communication and early literacy<br />
Note: - - denotes not applicable<br />
State<br />
Rate<br />
LEA<br />
Rate<br />
— —<br />
— —<br />
— —<br />
— —<br />
— —<br />
C) Use of<br />
Appropriate<br />
Behaviors to<br />
Meet Their Needs<br />
State<br />
Rate<br />
4.51%<br />
17.34%<br />
41.72%<br />
34.97%<br />
LEA<br />
Rate<br />
1.46% — —<br />
— —<br />
— —<br />
— —<br />
— —<br />
Page 3 of 5
LEA: 3302 - MELBOURNE SCHOOL <strong>DISTRICT</strong><br />
Indicator 08: Parent Involvement<br />
Percent of surveyed<br />
parents who reported<br />
school facilitated parent<br />
involvement as a means<br />
of improving services<br />
and results for children<br />
with disabilities.<br />
Early Childhood<br />
(3-5)<br />
School Age<br />
(5-21)<br />
State<br />
Rate<br />
90.47%<br />
95.05%<br />
Indicator 09: Disproportionality - Eligibility<br />
Disproportionate representation of racial<br />
and ethnic groups in special education and<br />
related services that is a result of<br />
inappropriate identification (e.g.<br />
monitoring data, review of policies,<br />
practices, and procedures under 618(d),<br />
etc.).<br />
State<br />
Rate<br />
State<br />
Target<br />
88.00%<br />
96.00%<br />
State<br />
Target<br />
0.00% 0.00%<br />
LEA<br />
Rate<br />
— —<br />
94.44%<br />
Indicator 10: Disproportionality-Child with a Disability<br />
Disproportionate representation of racial<br />
and ethnic groups in specific disability<br />
categories that is a result of inappropriate<br />
identification (e.g. monitoring data, review<br />
of policies, practices, and procedures under<br />
618(d), etc.).<br />
Indicator 11: Child Find<br />
Percent of children with<br />
parental consent to evaluate<br />
who are evaluated within<br />
the State established timeline<br />
of 60 days.<br />
Overall<br />
(3-21)<br />
Early Childhood<br />
(3-5)<br />
School Age<br />
(5-21)<br />
State<br />
Rate<br />
0.00%<br />
Indicator 12: Early Childhood Transition<br />
Percent of children referred by Part C prior to<br />
age 3, who are found eligible for Part B, and<br />
who have an IEP developed and implemented<br />
by their third birthday.<br />
Note: - - denotes not applicable<br />
State<br />
Rate<br />
99.41%<br />
99.70%<br />
98.97%<br />
State<br />
Rate<br />
State<br />
Target<br />
0.00%<br />
State<br />
Target<br />
100.00%<br />
100.00%<br />
100.00%<br />
State<br />
Target<br />
Target Met by<br />
LEA (Y/N)<br />
Y<br />
Target Met by<br />
LEA (Y/N)<br />
Y<br />
LEA<br />
Rate<br />
100.00%<br />
— —<br />
100.00%<br />
LEA<br />
Rate<br />
Target Met by<br />
LEA (Y/N)<br />
N/A<br />
N<br />
Note: The target for Indicator 09 is to have zero percent<br />
(0%) of districts identified as having disproportionate<br />
representation as a result of inappropriate<br />
identification in eligibility.<br />
Note: The target for Indicator 10 is to have zero<br />
percent (0%) of districts identified as having<br />
disproportionate representation as a result of<br />
inappropriate identification in a disability<br />
category.<br />
Target Met by<br />
LEA (Y/N)<br />
N/A<br />
Y<br />
Target Met<br />
by LEA<br />
(Y/N)<br />
99.21% 100.00% - - N/A<br />
Y<br />
Note: * Indicates a zero reponse rate for the<br />
district.<br />
Page 4 of 5
LEA: 3302 - MELBOURNE SCHOOL <strong>DISTRICT</strong><br />
Indicator 13: Secondary Transition<br />
Percent of youth with disabilities aged 16 and<br />
up with an IEP that includes coordinated,<br />
measurable, annual IEP goals and transition<br />
services that will reasonably enable the student<br />
to meet the post-secondary goals.<br />
Indicator 14: Post-School Outcomes<br />
A. Percent of youth enrolled in higher<br />
education within one year of leaving high<br />
school.<br />
State<br />
Rate<br />
State<br />
Target<br />
Note: Data for this Indicator is from the on-site monitoring of LEAs for the given year.<br />
B. Percent of youth enrolled in higher<br />
education or competitively employed<br />
within one year of leaving high school.<br />
C. Percent of youth enrolled in higher<br />
education or in some other postsecondary<br />
education or training program; or<br />
competitively employed or in some other<br />
employment within one year of leaving<br />
high school.<br />
State<br />
Rate<br />
Indicator 20: Reported Data-Timely and Accurate*<br />
District submitted<br />
required data elements<br />
on or before due dates;<br />
made revisions within<br />
the alloted reveiw<br />
periods.<br />
Accurate and Timely<br />
Data Submission<br />
Overall (3-21)<br />
Early Childhood (3-5)<br />
School Age (5-21)<br />
State<br />
Target<br />
100.00%<br />
100.00%<br />
100.00%<br />
State<br />
Target<br />
LEA<br />
Rate<br />
LEA<br />
Rate<br />
Target Met by<br />
LEA (Y/N)<br />
Target Met<br />
by LEA<br />
(Y/N)<br />
Target Met<br />
by LEA<br />
(Y/N)<br />
*Data reviewed for timely and accurate submissions included all APSCN cycle data except for personnel<br />
Note: - - denotes not applicable<br />
96.19 100.00 — — N/A<br />
14.53<br />
State<br />
Rate<br />
49.42<br />
State<br />
Rate<br />
54.07<br />
13.00<br />
State<br />
Target<br />
49.00<br />
State<br />
Target<br />
60.00<br />
Y<br />
N/A<br />
Y<br />
— —<br />
LEA<br />
Rate<br />
— —<br />
LEA<br />
Rate<br />
— —<br />
N/A<br />
Target Met<br />
by LEA<br />
(Y/N)<br />
N/A<br />
Target Met<br />
by LEA<br />
(Y/N)<br />
N/A<br />
Page 5 of 5
<strong>ARKANSAS</strong> <strong>SPECIAL</strong> <strong>EDUCATION</strong><br />
<strong>DISTRICT</strong> <strong>ANNUAL</strong> PERFORMANCE REPORT<br />
2010/11 School Year<br />
Publication Date: March 2012<br />
Each State must have in place a State Performance Plan (SPP) to evaluate the State's efforts to meet the requirements and<br />
purposes of the implementation of the Individuals with Disabilities Education Act (IDEA). The SPP is a six-year plan, which<br />
describes Arkansas's performance on 20 indicators. The Office of Special Education Programs in the U. S. Department of<br />
Education requires that States report annually to the public on the performance of each local education agency (LEA) on 14 of<br />
20 indicators as compared with targets established by the State in the SPP. Arkansas will report indicators 1 through 14 and<br />
20 for each LEA serving children with disabilities (CWD). Any LEA not meeting targets on compliance indicators (0% for<br />
Indicators 4B, 09 & 10 and 100% for Indicators 11, 12, 13, and 20) are non-compliant with IDEA.<br />
There are no report changes for the 2010/11 school year profile; However, it is important to recognize that: .<br />
1. Indicator 01 (Graduation) is reported a year in arrear (2009/10 graduates) and is based on a four-year cohort. This<br />
means the rate is a measure of students who entered in ninth grade and graduate in four years. The calculation is a<br />
requirement under Title I of the Elementary and Secondary Education Act (ESEA).<br />
2. Indicator 02 (Drop out) is reported a year in arrear. This means the rate is a measure of students who dropped out in<br />
the 2009/10 school year. The Indicator 02 data are aligned with the Common Core of Data (CCD) requirements for<br />
grades 7-12.<br />
3. Indicator 04A and 4B (Suspension/Expulsion) is reported a year in arrear. This means the rate is a measure of<br />
students who had out-of-school suspensions and/or expulsions totaling more than 10 days.<br />
For a complete description of all the Indicators, please visit the special education website at<br />
http://arksped.k12.ar.us/sections/policy.html<br />
LEA: 3306 - IZARD CO. CONS. SCHOOL <strong>DISTRICT</strong><br />
Indicator 01: Graduation Rates (2009/10 school year) Indicator 02: Dropout Rates (2009/10 school year)<br />
Percent of youth<br />
with IEPs<br />
graduating from<br />
high school with a<br />
regular diploma<br />
State<br />
Rate<br />
State<br />
Target<br />
75.76% 85.00%<br />
LEA<br />
Rate<br />
100.00%<br />
Target Met<br />
by LEA<br />
(Y/N)<br />
Y<br />
Percent of<br />
youth with<br />
IEPs dropping<br />
out of high<br />
school<br />
State<br />
Rate<br />
Indicator 03: Assessment on Statewide Benchmark Exam (grades 3-8, 11)<br />
A) Adequate Yearly Progress<br />
n=40<br />
Literacy<br />
Mathematics<br />
Met Disability Subgroup "n"<br />
for Reporting Purposes (Y/N)<br />
State Target for % of Districts Meeting<br />
AYP for Disability Subgroup<br />
State<br />
Target<br />
3.06% 4.20%<br />
LEA<br />
Rate<br />
0.00%<br />
% of Districts Meeting AYP<br />
for Disability Subgroup<br />
Target Met by<br />
LEA (Y/N)<br />
Y<br />
Target Met by<br />
LEA(Y/N)<br />
Overall N 17.15% 6.25%<br />
NA<br />
N<br />
N<br />
Note: For a district to qualify as having a disability subgroup it must have a minimum of 40 (n=40) students with disabilities in a school building.<br />
B) Participation<br />
Participation Rate: # of<br />
CWD Tested ÷ # of CWD<br />
Enrolled in grades tested.<br />
Participation Rate: Literacy<br />
Participation Rate: Math<br />
Note: - - denotes not applicable<br />
State<br />
Rate<br />
98.78%<br />
State<br />
Target<br />
95.00%<br />
LEA<br />
Rate<br />
100.00%<br />
Target Met<br />
by LEA (Y/N)<br />
98.61% 95.00% 100.00% Y<br />
Y<br />
C) Performance Proficiency<br />
Percent of CWD Scoring<br />
Proficient or Above<br />
Proficiency Rate: Literacy<br />
Proficiency Rate:<br />
Mathematics<br />
16.00%<br />
16.00%<br />
State<br />
Rate<br />
31.49%<br />
44.86%<br />
State<br />
Target<br />
45.22%<br />
51.14%<br />
LEA<br />
Rate<br />
28.89%<br />
48.89%<br />
NA<br />
NA<br />
Target<br />
Met by<br />
LEA (Y/N)<br />
N<br />
N<br />
Page 1 of 5
LEA: 3306 - IZARD CO. CONS. SCHOOL <strong>DISTRICT</strong><br />
Indicator 04: Out-of-School Suspensions and Expulsions (2009/10 school year)<br />
A) Suspension/Expulsion<br />
Percent difference of CWD with out-of- school suspensions and<br />
expulsions totaling greater than 10 days in a school year as<br />
compared to the same data for general education students in<br />
the district.<br />
B) Suspension/Expulsion by Race and Ethnicity<br />
Percent of districts that have: (a) a significant discrepancy, by race or<br />
ethnicity, in the rate of suspensions and expulsions of greater than 10<br />
days in a school year for children with IEPs; and (b) policies,<br />
procedures or practices that contribute to the significant discrepancy<br />
and do not comply with requirements relating to the development<br />
and implementation of IEPs, the use of positive behavioral<br />
interventions and supports, and procedural safeguards.<br />
Indicator 05: School Age (5-21) Least Restrictive Environment<br />
A) In the Regular Class 80% or more of the day<br />
Percent of CWD with<br />
IEPs receiving instruction<br />
in the regular class 80%<br />
or more of the day.<br />
State<br />
Rate<br />
State<br />
Target<br />
LEA<br />
Rate<br />
B) In the Regular Class less than 40% of the day<br />
Percent of CWD with<br />
IEPs receiving instruction<br />
in the regular class less<br />
than 60% of the day.<br />
53.87% 59.77%<br />
State<br />
Rate<br />
State<br />
Target<br />
12.42% 12.51%<br />
52.75%<br />
LEA<br />
Rate<br />
9.89%<br />
C) Other Settings outside the regular class<br />
Percent of CWD with IEPs served in<br />
public or private separate schools,<br />
residential placements, or<br />
homebound/hospital placements.<br />
State<br />
Rate<br />
State<br />
Target<br />
2.80% 2.56%<br />
Target Met<br />
by LEA (Y/N)<br />
N<br />
Target Met<br />
by LEA (Y/N)<br />
Y<br />
LEA<br />
Rate<br />
0.00%<br />
Target Met<br />
by LEA(Y/N)<br />
Indicator 06: Early Childhood (3-5) Least Restrictive Environment<br />
A) Regular Early Childhood Program<br />
Percent of children (aged 3 through 5) with IEPs attending a regular<br />
early childhood program and receiving the majority of special<br />
education and related services in the regular early childhood program<br />
Allowable<br />
Difference<br />
LEA: 3306 - IZARD CO. CONS. SCHOOL <strong>DISTRICT</strong><br />
Indicator 07: Preschool (3-5) Outcomes<br />
a) Percent of preschool CWD<br />
children who did not<br />
improve functioning.<br />
b) Percent of preschool CWD<br />
who improved but whose<br />
functioning remained below<br />
same age peers.<br />
c) Percent of preschool CWD<br />
who improved at a level<br />
nearer to same aged peers.<br />
d) Percent of preschool CWD<br />
who improved functioning to<br />
reach a level comparable to<br />
same age peers.<br />
e) Percent of preschool CWD<br />
children who maintain<br />
functioning at a level<br />
comparable to same aged<br />
peers.<br />
Summary<br />
Statements<br />
1) Of those preschool<br />
children who entered<br />
the preschool program<br />
below age expectations<br />
in each Outcome, the<br />
percent who<br />
substantially increased<br />
their rate of growth by<br />
the time they turned 6<br />
years of age or exited<br />
the program.<br />
2) The percent of<br />
preschool children who<br />
were functioning<br />
within age expectations<br />
in each Outcome by the<br />
time they turned 6<br />
years of age or exited<br />
A) Positive Social -Emotional<br />
Skills*<br />
State<br />
Rate<br />
A) Positive Social -<br />
Emotional Skills<br />
(Including social<br />
relationships)<br />
State<br />
Rate<br />
2.14%<br />
5.31%<br />
25.97%<br />
38.22%<br />
28.36%<br />
State<br />
Target<br />
LEA<br />
Rate<br />
LEA<br />
Rate<br />
— —<br />
15.38%<br />
23.08%<br />
61.54%<br />
— —<br />
Target<br />
Met by<br />
LEA(Y/N)<br />
B) Acquisition and Use of<br />
Knowledge and Skills<br />
(Including early language/<br />
communication and early literacy)<br />
B) Acquisition and Use of<br />
Knowledge and Skills **<br />
State<br />
Rate<br />
1.75%<br />
6.59%<br />
34.23%<br />
43.51%<br />
13.92%<br />
State<br />
Target<br />
LEA<br />
Rate<br />
Target<br />
Met by<br />
LEA(Y/N)<br />
C) Use of Appropriate Behaviors<br />
to Meet Their Needs<br />
State<br />
Rate<br />
State<br />
Target<br />
LEA<br />
Rate<br />
Target<br />
Met by<br />
LEA(Y/N)<br />
89.61% 90.50% 84.62% N 90.31% 90.50% 92.31% Y 90.82% 92.50% 100.00% Y<br />
66.58% 69.50% 61.54% N 57.43% 60.50% 84.62% Y 76.69% 78.50% 100.00% Y<br />
NOTE: * Including social relationships ** Including early language/ communication and early literacy<br />
Note: - - denotes not applicable<br />
State<br />
Rate<br />
LEA<br />
Rate<br />
— —<br />
7.69%<br />
7.69%<br />
84.62%<br />
— —<br />
C) Use of<br />
Appropriate<br />
Behaviors to<br />
Meet Their Needs<br />
State<br />
Rate<br />
4.51%<br />
17.34%<br />
41.72%<br />
34.97%<br />
LEA<br />
Rate<br />
1.46% — —<br />
— —<br />
— —<br />
84.62%<br />
15.38%<br />
Page 3 of 5
LEA: 3306 - IZARD CO. CONS. SCHOOL <strong>DISTRICT</strong><br />
Indicator 08: Parent Involvement<br />
Percent of surveyed<br />
parents who reported<br />
school facilitated parent<br />
involvement as a means<br />
of improving services<br />
and results for children<br />
with disabilities.<br />
Early Childhood<br />
(3-5)<br />
School Age<br />
(5-21)<br />
State<br />
Rate<br />
90.47%<br />
95.05%<br />
Indicator 09: Disproportionality - Eligibility<br />
Disproportionate representation of racial<br />
and ethnic groups in special education and<br />
related services that is a result of<br />
inappropriate identification (e.g.<br />
monitoring data, review of policies,<br />
practices, and procedures under 618(d),<br />
etc.).<br />
State<br />
Rate<br />
State<br />
Target<br />
88.00%<br />
96.00%<br />
State<br />
Target<br />
0.00% 0.00%<br />
LEA<br />
Rate<br />
33.33%<br />
98.28%<br />
Indicator 10: Disproportionality-Child with a Disability<br />
Disproportionate representation of racial<br />
and ethnic groups in specific disability<br />
categories that is a result of inappropriate<br />
identification (e.g. monitoring data, review<br />
of policies, practices, and procedures under<br />
618(d), etc.).<br />
Indicator 11: Child Find<br />
Percent of children with<br />
parental consent to evaluate<br />
who are evaluated within<br />
the State established timeline<br />
of 60 days.<br />
Overall<br />
(3-21)<br />
Early Childhood<br />
(3-5)<br />
School Age<br />
(5-21)<br />
State<br />
Rate<br />
0.00%<br />
Indicator 12: Early Childhood Transition<br />
Percent of children referred by Part C prior to<br />
age 3, who are found eligible for Part B, and<br />
who have an IEP developed and implemented<br />
by their third birthday.<br />
Note: - - denotes not applicable<br />
State<br />
Rate<br />
99.41%<br />
99.70%<br />
98.97%<br />
State<br />
Rate<br />
State<br />
Target<br />
0.00%<br />
State<br />
Target<br />
100.00%<br />
100.00%<br />
100.00%<br />
State<br />
Target<br />
Target Met by<br />
LEA (Y/N)<br />
Y<br />
Target Met by<br />
LEA (Y/N)<br />
Y<br />
LEA<br />
Rate<br />
100.00%<br />
100.00%<br />
100.00%<br />
LEA<br />
Rate<br />
Target Met by<br />
LEA (Y/N)<br />
N<br />
Y<br />
Note: The target for Indicator 09 is to have zero percent<br />
(0%) of districts identified as having disproportionate<br />
representation as a result of inappropriate<br />
identification in eligibility.<br />
Note: The target for Indicator 10 is to have zero<br />
percent (0%) of districts identified as having<br />
disproportionate representation as a result of<br />
inappropriate identification in a disability<br />
category.<br />
Target Met by<br />
LEA (Y/N)<br />
Y<br />
Y<br />
Target Met<br />
by LEA<br />
(Y/N)<br />
99.21% 100.00% - - N/A<br />
Y<br />
Note: * Indicates a zero reponse rate for the<br />
district.<br />
Page 4 of 5
LEA: 3306 - IZARD CO. CONS. SCHOOL <strong>DISTRICT</strong><br />
Indicator 13: Secondary Transition<br />
Percent of youth with disabilities aged 16 and<br />
up with an IEP that includes coordinated,<br />
measurable, annual IEP goals and transition<br />
services that will reasonably enable the student<br />
to meet the post-secondary goals.<br />
Indicator 14: Post-School Outcomes<br />
A. Percent of youth enrolled in higher<br />
education within one year of leaving high<br />
school.<br />
State<br />
Rate<br />
State<br />
Target<br />
Note: Data for this Indicator is from the on-site monitoring of LEAs for the given year.<br />
B. Percent of youth enrolled in higher<br />
education or competitively employed<br />
within one year of leaving high school.<br />
C. Percent of youth enrolled in higher<br />
education or in some other postsecondary<br />
education or training program; or<br />
competitively employed or in some other<br />
employment within one year of leaving<br />
high school.<br />
State<br />
Rate<br />
Indicator 20: Reported Data-Timely and Accurate*<br />
District submitted<br />
required data elements<br />
on or before due dates;<br />
made revisions within<br />
the alloted reveiw<br />
periods.<br />
Accurate and Timely<br />
Data Submission<br />
Overall (3-21)<br />
Early Childhood (3-5)<br />
School Age (5-21)<br />
State<br />
Target<br />
100.00%<br />
100.00%<br />
100.00%<br />
State<br />
Target<br />
LEA<br />
Rate<br />
LEA<br />
Rate<br />
Target Met by<br />
LEA (Y/N)<br />
Target Met<br />
by LEA<br />
(Y/N)<br />
Target Met<br />
by LEA<br />
(Y/N)<br />
*Data reviewed for timely and accurate submissions included all APSCN cycle data except for personnel<br />
Note: - - denotes not applicable<br />
96.19 100.00 100.00% Y<br />
14.53<br />
State<br />
Rate<br />
49.42<br />
State<br />
Rate<br />
54.07<br />
13.00<br />
State<br />
Target<br />
49.00<br />
State<br />
Target<br />
60.00<br />
Y<br />
Y<br />
Y<br />
100.00%<br />
LEA<br />
Rate<br />
100.00%<br />
LEA<br />
Rate<br />
100.00%<br />
Y<br />
Target Met<br />
by LEA<br />
(Y/N)<br />
Y<br />
Target Met<br />
by LEA<br />
(Y/N)<br />
Y<br />
Page 5 of 5
<strong>ARKANSAS</strong> <strong>SPECIAL</strong> <strong>EDUCATION</strong><br />
<strong>DISTRICT</strong> <strong>ANNUAL</strong> PERFORMANCE REPORT<br />
2010/11 School Year<br />
Publication Date: March 2012<br />
Each State must have in place a State Performance Plan (SPP) to evaluate the State's efforts to meet the requirements and<br />
purposes of the implementation of the Individuals with Disabilities Education Act (IDEA). The SPP is a six-year plan, which<br />
describes Arkansas's performance on 20 indicators. The Office of Special Education Programs in the U. S. Department of<br />
Education requires that States report annually to the public on the performance of each local education agency (LEA) on 14 of<br />
20 indicators as compared with targets established by the State in the SPP. Arkansas will report indicators 1 through 14 and<br />
20 for each LEA serving children with disabilities (CWD). Any LEA not meeting targets on compliance indicators (0% for<br />
Indicators 4B, 09 & 10 and 100% for Indicators 11, 12, 13, and 20) are non-compliant with IDEA.<br />
There are no report changes for the 2010/11 school year profile; However, it is important to recognize that: .<br />
1. Indicator 01 (Graduation) is reported a year in arrear (2009/10 graduates) and is based on a four-year cohort. This<br />
means the rate is a measure of students who entered in ninth grade and graduate in four years. The calculation is a<br />
requirement under Title I of the Elementary and Secondary Education Act (ESEA).<br />
2. Indicator 02 (Drop out) is reported a year in arrear. This means the rate is a measure of students who dropped out in<br />
the 2009/10 school year. The Indicator 02 data are aligned with the Common Core of Data (CCD) requirements for<br />
grades 7-12.<br />
3. Indicator 04A and 4B (Suspension/Expulsion) is reported a year in arrear. This means the rate is a measure of<br />
students who had out-of-school suspensions and/or expulsions totaling more than 10 days.<br />
For a complete description of all the Indicators, please visit the special education website at<br />
http://arksped.k12.ar.us/sections/policy.html<br />
LEA: 3320 - NORTH CENTRAL <strong>ARKANSAS</strong> <strong>EDUCATION</strong> SERVICE CENTER<br />
Indicator 01: Graduation Rates (2009/10 school year) Indicator 02: Dropout Rates (2009/10 school year)<br />
Percent of youth<br />
with IEPs<br />
graduating from<br />
high school with a<br />
regular diploma<br />
State<br />
Rate<br />
State<br />
Target<br />
75.76% 85.00%<br />
LEA<br />
Rate<br />
— —<br />
Target Met<br />
by LEA<br />
(Y/N)<br />
NA<br />
Percent of<br />
youth with<br />
IEPs dropping<br />
out of high<br />
school<br />
State<br />
Rate<br />
Indicator 03: Assessment on Statewide Benchmark Exam (grades 3-8, 11)<br />
A) Adequate Yearly Progress<br />
n=40<br />
Literacy<br />
Mathematics<br />
Met Disability Subgroup "n"<br />
for Reporting Purposes (Y/N)<br />
State Target for % of Districts Meeting<br />
AYP for Disability Subgroup<br />
State<br />
Target<br />
3.06% 4.20%<br />
LEA<br />
Rate<br />
— —<br />
% of Districts Meeting AYP<br />
for Disability Subgroup<br />
Target Met by<br />
LEA (Y/N)<br />
N/A<br />
Target Met by<br />
LEA(Y/N)<br />
Overall N/A 17.15% 6.25%<br />
N/A<br />
N/A<br />
N/A<br />
Note: For a district to qualify as having a disability subgroup it must have a minimum of 40 (n=40) students with disabilities in a school building.<br />
B) Participation<br />
Participation Rate: # of<br />
CWD Tested ÷ # of CWD<br />
Enrolled in grades tested.<br />
Participation Rate: Literacy<br />
Participation Rate: Math<br />
Note: - - denotes not applicable<br />
State<br />
Rate<br />
98.78%<br />
State<br />
Target<br />
95.00%<br />
LEA<br />
Rate<br />
— —<br />
Target Met<br />
by LEA (Y/N)<br />
N/A<br />
98.61% 95.00% — — N/A<br />
C) Performance Proficiency<br />
Percent of CWD Scoring<br />
Proficient or Above<br />
Proficiency Rate: Literacy<br />
Proficiency Rate:<br />
Mathematics<br />
16.00%<br />
16.00%<br />
State<br />
Rate<br />
31.49%<br />
44.86%<br />
State<br />
Target<br />
45.22%<br />
51.14%<br />
LEA<br />
Rate<br />
— —<br />
— —<br />
N/A<br />
N/A<br />
Target<br />
Met by<br />
LEA (Y/N)<br />
N/A<br />
N/A<br />
Page 1 of 5
LEA: 3320 - NORTH CENTRAL <strong>ARKANSAS</strong> <strong>EDUCATION</strong> SERVICE CENTER<br />
Indicator 04: Out-of-School Suspensions and Expulsions (2009/10 school year)<br />
A) Suspension/Expulsion<br />
Percent difference of CWD with out-of- school suspensions and<br />
expulsions totaling greater than 10 days in a school year as<br />
compared to the same data for general education students in<br />
the district.<br />
B) Suspension/Expulsion by Race and Ethnicity<br />
Percent of districts that have: (a) a significant discrepancy, by race or<br />
ethnicity, in the rate of suspensions and expulsions of greater than 10<br />
days in a school year for children with IEPs; and (b) policies,<br />
procedures or practices that contribute to the significant discrepancy<br />
and do not comply with requirements relating to the development<br />
and implementation of IEPs, the use of positive behavioral<br />
interventions and supports, and procedural safeguards.<br />
Indicator 05: School Age (5-21) Least Restrictive Environment<br />
A) In the Regular Class 80% or more of the day<br />
Percent of CWD with<br />
IEPs receiving instruction<br />
in the regular class 80%<br />
or more of the day.<br />
State<br />
Rate<br />
State<br />
Target<br />
LEA<br />
Rate<br />
B) In the Regular Class less than 40% of the day<br />
Percent of CWD with<br />
IEPs receiving instruction<br />
in the regular class less<br />
than 60% of the day.<br />
53.87% 59.77%<br />
State<br />
Rate<br />
State<br />
Target<br />
12.42% 12.51%<br />
— —<br />
LEA<br />
Rate<br />
— —<br />
C) Other Settings outside the regular class<br />
Percent of CWD with IEPs served in<br />
public or private separate schools,<br />
residential placements, or<br />
homebound/hospital placements.<br />
State<br />
Rate<br />
State<br />
Target<br />
2.80% 2.56%<br />
Target Met<br />
by LEA (Y/N)<br />
N/A<br />
Target Met<br />
by LEA (Y/N)<br />
N/A<br />
LEA<br />
Rate<br />
— —<br />
Target Met<br />
by LEA(Y/N)<br />
N/A<br />
Indicator 06: Early Childhood (3-5) Least Restrictive Environment<br />
A) Regular Early Childhood Program<br />
Percent of children (aged 3 through 5) with IEPs attending a regular<br />
early childhood program and receiving the majority of special<br />
education and related services in the regular early childhood program<br />
Allowable<br />
Difference<br />
LEA: 3320 - NORTH CENTRAL <strong>ARKANSAS</strong> <strong>EDUCATION</strong> SERVICE CENTER<br />
Indicator 07: Preschool (3-5) Outcomes<br />
a) Percent of preschool CWD<br />
children who did not<br />
improve functioning.<br />
b) Percent of preschool CWD<br />
who improved but whose<br />
functioning remained below<br />
same age peers.<br />
c) Percent of preschool CWD<br />
who improved at a level<br />
nearer to same aged peers.<br />
d) Percent of preschool CWD<br />
who improved functioning to<br />
reach a level comparable to<br />
same age peers.<br />
e) Percent of preschool CWD<br />
children who maintain<br />
functioning at a level<br />
comparable to same aged<br />
peers.<br />
Summary<br />
Statements<br />
1) Of those preschool<br />
children who entered<br />
the preschool program<br />
below age expectations<br />
in each Outcome, the<br />
percent who<br />
substantially increased<br />
their rate of growth by<br />
the time they turned 6<br />
years of age or exited<br />
the program.<br />
2) The percent of<br />
preschool children who<br />
were functioning<br />
within age expectations<br />
in each Outcome by the<br />
time they turned 6<br />
years of age or exited<br />
A) Positive Social -Emotional<br />
Skills*<br />
State<br />
Rate<br />
A) Positive Social -<br />
Emotional Skills<br />
(Including social<br />
relationships)<br />
State<br />
Rate<br />
2.14%<br />
5.31%<br />
25.97%<br />
38.22%<br />
28.36%<br />
State<br />
Target<br />
LEA<br />
Rate<br />
LEA<br />
Rate<br />
— —<br />
5.56%<br />
19.14%<br />
58.64%<br />
16.67%<br />
Target<br />
Met by<br />
LEA(Y/N)<br />
B) Acquisition and Use of<br />
Knowledge and Skills<br />
(Including early language/<br />
communication and early literacy)<br />
B) Acquisition and Use of<br />
Knowledge and Skills **<br />
State<br />
Rate<br />
1.75%<br />
6.59%<br />
34.23%<br />
43.51%<br />
13.92%<br />
State<br />
Target<br />
LEA<br />
Rate<br />
Target<br />
Met by<br />
LEA(Y/N)<br />
C) Use of Appropriate Behaviors<br />
to Meet Their Needs<br />
State<br />
Rate<br />
State<br />
Target<br />
LEA<br />
Rate<br />
Target<br />
Met by<br />
LEA(Y/N)<br />
89.61% 90.50% 93.33% Y 90.31% 90.50% 95.97% Y 90.82% 92.50% 95.33% Y<br />
66.58% 69.50% 75.31% Y 57.43% 60.50% 75.93% Y 76.69% 78.50% 85.80% Y<br />
NOTE: * Including social relationships ** Including early language/ communication and early literacy<br />
Note: - - denotes not applicable<br />
State<br />
Rate<br />
LEA<br />
Rate<br />
— —<br />
3.09%<br />
20.99%<br />
52.47%<br />
23.46%<br />
C) Use of<br />
Appropriate<br />
Behaviors to<br />
Meet Their Needs<br />
State<br />
Rate<br />
4.51%<br />
17.34%<br />
41.72%<br />
34.97%<br />
LEA<br />
Rate<br />
1.46% — —<br />
3.09%<br />
11.11%<br />
51.85%<br />
33.95%<br />
Page 3 of 5
LEA: 3320 - NORTH CENTRAL <strong>ARKANSAS</strong> <strong>EDUCATION</strong> SERVICE CENTER<br />
Indicator 08: Parent Involvement<br />
Percent of surveyed<br />
parents who reported<br />
school facilitated parent<br />
involvement as a means<br />
of improving services<br />
and results for children<br />
with disabilities.<br />
Early Childhood<br />
(3-5)<br />
School Age<br />
(5-21)<br />
State<br />
Rate<br />
90.47%<br />
95.05%<br />
Indicator 09: Disproportionality - Eligibility<br />
Disproportionate representation of racial<br />
and ethnic groups in special education and<br />
related services that is a result of<br />
inappropriate identification (e.g.<br />
monitoring data, review of policies,<br />
practices, and procedures under 618(d),<br />
etc.).<br />
State<br />
Rate<br />
State<br />
Target<br />
88.00%<br />
96.00%<br />
State<br />
Target<br />
0.00% 0.00%<br />
LEA<br />
Rate<br />
95.17%<br />
— —<br />
Indicator 10: Disproportionality-Child with a Disability<br />
Disproportionate representation of racial<br />
and ethnic groups in specific disability<br />
categories that is a result of inappropriate<br />
identification (e.g. monitoring data, review<br />
of policies, practices, and procedures under<br />
618(d), etc.).<br />
Indicator 11: Child Find<br />
Percent of children with<br />
parental consent to evaluate<br />
who are evaluated within<br />
the State established timeline<br />
of 60 days.<br />
Overall<br />
(3-21)<br />
Early Childhood<br />
(3-5)<br />
School Age<br />
(5-21)<br />
State<br />
Rate<br />
0.00%<br />
Indicator 12: Early Childhood Transition<br />
Percent of children referred by Part C prior to<br />
age 3, who are found eligible for Part B, and<br />
who have an IEP developed and implemented<br />
by their third birthday.<br />
Note: - - denotes not applicable<br />
State<br />
Rate<br />
99.41%<br />
99.70%<br />
98.97%<br />
State<br />
Rate<br />
State<br />
Target<br />
0.00%<br />
State<br />
Target<br />
100.00%<br />
100.00%<br />
100.00%<br />
State<br />
Target<br />
Target Met by<br />
LEA (Y/N)<br />
N/A<br />
Target Met by<br />
LEA (Y/N)<br />
N/A<br />
LEA<br />
Rate<br />
100.00%<br />
100.00%<br />
— —<br />
LEA<br />
Rate<br />
Target Met by<br />
LEA (Y/N)<br />
Y<br />
N/A<br />
Note: The target for Indicator 09 is to have zero percent<br />
(0%) of districts identified as having disproportionate<br />
representation as a result of inappropriate<br />
identification in eligibility.<br />
Note: The target for Indicator 10 is to have zero<br />
percent (0%) of districts identified as having<br />
disproportionate representation as a result of<br />
inappropriate identification in a disability<br />
category.<br />
Target Met by<br />
LEA (Y/N)<br />
Y<br />
N/A<br />
Target Met<br />
by LEA<br />
(Y/N)<br />
99.21% 100.00% 100.00% Y<br />
Y<br />
Note: * Indicates a zero reponse rate for the<br />
district.<br />
Page 4 of 5
LEA: 3320 - NORTH CENTRAL <strong>ARKANSAS</strong> <strong>EDUCATION</strong> SERVICE CENTER<br />
Indicator 13: Secondary Transition<br />
Percent of youth with disabilities aged 16 and<br />
up with an IEP that includes coordinated,<br />
measurable, annual IEP goals and transition<br />
services that will reasonably enable the student<br />
to meet the post-secondary goals.<br />
Indicator 14: Post-School Outcomes<br />
A. Percent of youth enrolled in higher<br />
education within one year of leaving high<br />
school.<br />
State<br />
Rate<br />
State<br />
Target<br />
Note: Data for this Indicator is from the on-site monitoring of LEAs for the given year.<br />
B. Percent of youth enrolled in higher<br />
education or competitively employed<br />
within one year of leaving high school.<br />
C. Percent of youth enrolled in higher<br />
education or in some other postsecondary<br />
education or training program; or<br />
competitively employed or in some other<br />
employment within one year of leaving<br />
high school.<br />
State<br />
Rate<br />
Indicator 20: Reported Data-Timely and Accurate*<br />
District submitted<br />
required data elements<br />
on or before due dates;<br />
made revisions within<br />
the alloted reveiw<br />
periods.<br />
Accurate and Timely<br />
Data Submission<br />
Overall (3-21)<br />
Early Childhood (3-5)<br />
School Age (5-21)<br />
State<br />
Target<br />
100.00%<br />
100.00%<br />
100.00%<br />
State<br />
Target<br />
LEA<br />
Rate<br />
LEA<br />
Rate<br />
Target Met by<br />
LEA (Y/N)<br />
Target Met<br />
by LEA<br />
(Y/N)<br />
Target Met<br />
by LEA<br />
(Y/N)<br />
*Data reviewed for timely and accurate submissions included all APSCN cycle data except for personnel<br />
Note: - - denotes not applicable<br />
96.19 100.00 — — N/A<br />
14.53<br />
State<br />
Rate<br />
49.42<br />
State<br />
Rate<br />
54.07<br />
13.00<br />
State<br />
Target<br />
49.00<br />
State<br />
Target<br />
60.00<br />
Y<br />
Y<br />
N/A<br />
— —<br />
LEA<br />
Rate<br />
— —<br />
LEA<br />
Rate<br />
— —<br />
N/A<br />
Target Met<br />
by LEA<br />
(Y/N)<br />
N/A<br />
Target Met<br />
by LEA<br />
(Y/N)<br />
N/A<br />
Page 5 of 5
LEA: 3403 - NEWPORT SCHOOL <strong>DISTRICT</strong><br />
<strong>ARKANSAS</strong> <strong>SPECIAL</strong> <strong>EDUCATION</strong><br />
<strong>DISTRICT</strong> <strong>ANNUAL</strong> PERFORMANCE REPORT<br />
2010/11 School Year<br />
Publication Date: March 2012<br />
Each State must have in place a State Performance Plan (SPP) to evaluate the State's efforts to meet the requirements and<br />
purposes of the implementation of the Individuals with Disabilities Education Act (IDEA). The SPP is a six-year plan, which<br />
describes Arkansas's performance on 20 indicators. The Office of Special Education Programs in the U. S. Department of<br />
Education requires that States report annually to the public on the performance of each local education agency (LEA) on 14 of<br />
20 indicators as compared with targets established by the State in the SPP. Arkansas will report indicators 1 through 14 and<br />
20 for each LEA serving children with disabilities (CWD). Any LEA not meeting targets on compliance indicators (0% for<br />
Indicators 4B, 09 & 10 and 100% for Indicators 11, 12, 13, and 20) are non-compliant with IDEA.<br />
There are no report changes for the 2010/11 school year profile; However, it is important to recognize that: .<br />
1. Indicator 01 (Graduation) is reported a year in arrear (2009/10 graduates) and is based on a four-year cohort. This<br />
means the rate is a measure of students who entered in ninth grade and graduate in four years. The calculation is a<br />
requirement under Title I of the Elementary and Secondary Education Act (ESEA).<br />
2. Indicator 02 (Drop out) is reported a year in arrear. This means the rate is a measure of students who dropped out in<br />
the 2009/10 school year. The Indicator 02 data are aligned with the Common Core of Data (CCD) requirements for<br />
grades 7-12.<br />
3. Indicator 04A and 4B (Suspension/Expulsion) is reported a year in arrear. This means the rate is a measure of<br />
students who had out-of-school suspensions and/or expulsions totaling more than 10 days.<br />
Percent of youth<br />
with IEPs<br />
graduating from<br />
high school with a<br />
regular diploma<br />
For a complete description of all the Indicators, please visit the special education website at<br />
http://arksped.k12.ar.us/sections/policy.html<br />
Indicator 01: Graduation Rates (2009/10 school year) Indicator 02: Dropout Rates (2009/10 school year)<br />
State<br />
Rate<br />
State<br />
Target<br />
75.76% 85.00%<br />
LEA<br />
Rate<br />
68.75%<br />
Target Met<br />
by LEA<br />
(Y/N)<br />
N<br />
Percent of<br />
youth with<br />
IEPs dropping<br />
out of high<br />
school<br />
State<br />
Rate<br />
Indicator 03: Assessment on Statewide Benchmark Exam (grades 3-8, 11)<br />
A) Adequate Yearly Progress<br />
n=40<br />
Literacy<br />
Mathematics<br />
Met Disability Subgroup "n"<br />
for Reporting Purposes (Y/N)<br />
State Target for % of Districts Meeting<br />
AYP for Disability Subgroup<br />
State<br />
Target<br />
3.06% 4.20%<br />
LEA<br />
Rate<br />
3.33%<br />
% of Districts Meeting AYP<br />
for Disability Subgroup<br />
Target Met by<br />
LEA (Y/N)<br />
Y<br />
Target Met by<br />
LEA(Y/N)<br />
Overall N 17.15% 6.25%<br />
NA<br />
N<br />
N<br />
Note: For a district to qualify as having a disability subgroup it must have a minimum of 40 (n=40) students with disabilities in a school building.<br />
B) Participation<br />
Participation Rate: # of<br />
CWD Tested ÷ # of CWD<br />
Enrolled in grades tested.<br />
Participation Rate: Literacy<br />
Participation Rate: Math<br />
Note: - - denotes not applicable<br />
State<br />
Rate<br />
98.78%<br />
State<br />
Target<br />
95.00%<br />
LEA<br />
Rate<br />
100.00%<br />
Target Met<br />
by LEA (Y/N)<br />
98.61% 95.00% 100.00% Y<br />
Y<br />
C) Performance Proficiency<br />
Percent of CWD Scoring<br />
Proficient or Above<br />
Proficiency Rate: Literacy<br />
Proficiency Rate:<br />
Mathematics<br />
16.00%<br />
16.00%<br />
State<br />
Rate<br />
31.49%<br />
44.86%<br />
State<br />
Target<br />
45.22%<br />
51.14%<br />
LEA<br />
Rate<br />
21.74%<br />
44.76%<br />
NA<br />
NA<br />
Target<br />
Met by<br />
LEA (Y/N)<br />
N<br />
N<br />
Page 1 of 5
LEA: 3403 - NEWPORT SCHOOL <strong>DISTRICT</strong><br />
Indicator 04: Out-of-School Suspensions and Expulsions (2009/10 school year)<br />
A) Suspension/Expulsion<br />
Percent difference of CWD with out-of- school suspensions and<br />
expulsions totaling greater than 10 days in a school year as<br />
compared to the same data for general education students in<br />
the district.<br />
B) Suspension/Expulsion by Race and Ethnicity<br />
Percent of districts that have: (a) a significant discrepancy, by race or<br />
ethnicity, in the rate of suspensions and expulsions of greater than 10<br />
days in a school year for children with IEPs; and (b) policies,<br />
procedures or practices that contribute to the significant discrepancy<br />
and do not comply with requirements relating to the development<br />
and implementation of IEPs, the use of positive behavioral<br />
interventions and supports, and procedural safeguards.<br />
Indicator 05: School Age (5-21) Least Restrictive Environment<br />
A) In the Regular Class 80% or more of the day<br />
Percent of CWD with<br />
IEPs receiving instruction<br />
in the regular class 80%<br />
or more of the day.<br />
State<br />
Rate<br />
State<br />
Target<br />
LEA<br />
Rate<br />
B) In the Regular Class less than 40% of the day<br />
Percent of CWD with<br />
IEPs receiving instruction<br />
in the regular class less<br />
than 60% of the day.<br />
53.87% 59.77%<br />
State<br />
Rate<br />
State<br />
Target<br />
12.42% 12.51%<br />
73.68%<br />
LEA<br />
Rate<br />
7.18%<br />
C) Other Settings outside the regular class<br />
Percent of CWD with IEPs served in<br />
public or private separate schools,<br />
residential placements, or<br />
homebound/hospital placements.<br />
State<br />
Rate<br />
State<br />
Target<br />
2.80% 2.56%<br />
Target Met<br />
by LEA (Y/N)<br />
Y<br />
Target Met<br />
by LEA (Y/N)<br />
Y<br />
LEA<br />
Rate<br />
0.00%<br />
Target Met<br />
by LEA(Y/N)<br />
Indicator 06: Early Childhood (3-5) Least Restrictive Environment<br />
A) Regular Early Childhood Program<br />
Percent of children (aged 3 through 5) with IEPs attending a regular<br />
early childhood program and receiving the majority of special<br />
education and related services in the regular early childhood program<br />
Allowable<br />
Difference<br />
LEA: 3403 - NEWPORT SCHOOL <strong>DISTRICT</strong><br />
Indicator 07: Preschool (3-5) Outcomes<br />
a) Percent of preschool CWD<br />
children who did not<br />
improve functioning.<br />
b) Percent of preschool CWD<br />
who improved but whose<br />
functioning remained below<br />
same age peers.<br />
c) Percent of preschool CWD<br />
who improved at a level<br />
nearer to same aged peers.<br />
d) Percent of preschool CWD<br />
who improved functioning to<br />
reach a level comparable to<br />
same age peers.<br />
e) Percent of preschool CWD<br />
children who maintain<br />
functioning at a level<br />
comparable to same aged<br />
peers.<br />
Summary<br />
Statements<br />
1) Of those preschool<br />
children who entered<br />
the preschool program<br />
below age expectations<br />
in each Outcome, the<br />
percent who<br />
substantially increased<br />
their rate of growth by<br />
the time they turned 6<br />
years of age or exited<br />
the program.<br />
2) The percent of<br />
preschool children who<br />
were functioning<br />
within age expectations<br />
in each Outcome by the<br />
time they turned 6<br />
years of age or exited<br />
A) Positive Social -Emotional<br />
Skills*<br />
State<br />
Rate<br />
A) Positive Social -<br />
Emotional Skills<br />
(Including social<br />
relationships)<br />
State<br />
Rate<br />
2.14%<br />
5.31%<br />
25.97%<br />
38.22%<br />
28.36%<br />
State<br />
Target<br />
LEA<br />
Rate<br />
LEA<br />
Rate<br />
— —<br />
— —<br />
27.27%<br />
63.64%<br />
9.09%<br />
Target<br />
Met by<br />
LEA(Y/N)<br />
B) Acquisition and Use of<br />
Knowledge and Skills<br />
(Including early language/<br />
communication and early literacy)<br />
B) Acquisition and Use of<br />
Knowledge and Skills **<br />
State<br />
Rate<br />
1.75%<br />
6.59%<br />
34.23%<br />
43.51%<br />
13.92%<br />
State<br />
Target<br />
LEA<br />
Rate<br />
Target<br />
Met by<br />
LEA(Y/N)<br />
C) Use of Appropriate Behaviors<br />
to Meet Their Needs<br />
State<br />
Rate<br />
State<br />
Target<br />
LEA<br />
Rate<br />
Target<br />
Met by<br />
LEA(Y/N)<br />
89.61% 90.50% 100.00% Y 90.31% 90.50% 100.00% Y 90.82% 92.50% 100.00% Y<br />
66.58% 69.50% 72.73% Y 57.43% 60.50% 36.36% N 76.69% 78.50% 72.73% N<br />
NOTE: * Including social relationships ** Including early language/ communication and early literacy<br />
Note: - - denotes not applicable<br />
State<br />
Rate<br />
LEA<br />
Rate<br />
— —<br />
— —<br />
63.64%<br />
36.36%<br />
— —<br />
C) Use of<br />
Appropriate<br />
Behaviors to<br />
Meet Their Needs<br />
State<br />
Rate<br />
4.51%<br />
17.34%<br />
41.72%<br />
34.97%<br />
LEA<br />
Rate<br />
1.46% — —<br />
— —<br />
27.27%<br />
63.64%<br />
9.09%<br />
Page 3 of 5
LEA: 3403 - NEWPORT SCHOOL <strong>DISTRICT</strong><br />
Indicator 08: Parent Involvement<br />
Percent of surveyed<br />
parents who reported<br />
school facilitated parent<br />
involvement as a means<br />
of improving services<br />
and results for children<br />
with disabilities.<br />
Early Childhood<br />
(3-5)<br />
School Age<br />
(5-21)<br />
State<br />
Rate<br />
90.47%<br />
95.05%<br />
Indicator 09: Disproportionality - Eligibility<br />
Disproportionate representation of racial<br />
and ethnic groups in special education and<br />
related services that is a result of<br />
inappropriate identification (e.g.<br />
monitoring data, review of policies,<br />
practices, and procedures under 618(d),<br />
etc.).<br />
State<br />
Rate<br />
State<br />
Target<br />
88.00%<br />
96.00%<br />
State<br />
Target<br />
0.00% 0.00%<br />
LEA<br />
Rate<br />
100.00%<br />
100.00%<br />
Indicator 10: Disproportionality-Child with a Disability<br />
Disproportionate representation of racial<br />
and ethnic groups in specific disability<br />
categories that is a result of inappropriate<br />
identification (e.g. monitoring data, review<br />
of policies, practices, and procedures under<br />
618(d), etc.).<br />
Indicator 11: Child Find<br />
Percent of children with<br />
parental consent to evaluate<br />
who are evaluated within<br />
the State established timeline<br />
of 60 days.<br />
Overall<br />
(3-21)<br />
Early Childhood<br />
(3-5)<br />
School Age<br />
(5-21)<br />
State<br />
Rate<br />
0.00%<br />
Indicator 12: Early Childhood Transition<br />
Percent of children referred by Part C prior to<br />
age 3, who are found eligible for Part B, and<br />
who have an IEP developed and implemented<br />
by their third birthday.<br />
Note: - - denotes not applicable<br />
State<br />
Rate<br />
99.41%<br />
99.70%<br />
98.97%<br />
State<br />
Rate<br />
State<br />
Target<br />
0.00%<br />
State<br />
Target<br />
100.00%<br />
100.00%<br />
100.00%<br />
State<br />
Target<br />
Target Met by<br />
LEA (Y/N)<br />
Y<br />
Target Met by<br />
LEA (Y/N)<br />
Y<br />
LEA<br />
Rate<br />
100.00%<br />
100.00%<br />
100.00%<br />
LEA<br />
Rate<br />
Target Met by<br />
LEA (Y/N)<br />
Y<br />
Y<br />
Note: The target for Indicator 09 is to have zero percent<br />
(0%) of districts identified as having disproportionate<br />
representation as a result of inappropriate<br />
identification in eligibility.<br />
Note: The target for Indicator 10 is to have zero<br />
percent (0%) of districts identified as having<br />
disproportionate representation as a result of<br />
inappropriate identification in a disability<br />
category.<br />
Target Met by<br />
LEA (Y/N)<br />
Y<br />
Y<br />
Target Met<br />
by LEA<br />
(Y/N)<br />
99.21% 100.00% - - N/A<br />
Y<br />
Note: * Indicates a zero reponse rate for the<br />
district.<br />
Page 4 of 5
LEA: 3403 - NEWPORT SCHOOL <strong>DISTRICT</strong><br />
Indicator 13: Secondary Transition<br />
Percent of youth with disabilities aged 16 and<br />
up with an IEP that includes coordinated,<br />
measurable, annual IEP goals and transition<br />
services that will reasonably enable the student<br />
to meet the post-secondary goals.<br />
Indicator 14: Post-School Outcomes<br />
A. Percent of youth enrolled in higher<br />
education within one year of leaving high<br />
school.<br />
State<br />
Rate<br />
State<br />
Target<br />
Note: Data for this Indicator is from the on-site monitoring of LEAs for the given year.<br />
B. Percent of youth enrolled in higher<br />
education or competitively employed<br />
within one year of leaving high school.<br />
C. Percent of youth enrolled in higher<br />
education or in some other postsecondary<br />
education or training program; or<br />
competitively employed or in some other<br />
employment within one year of leaving<br />
high school.<br />
State<br />
Rate<br />
Indicator 20: Reported Data-Timely and Accurate*<br />
District submitted<br />
required data elements<br />
on or before due dates;<br />
made revisions within<br />
the alloted reveiw<br />
periods.<br />
Accurate and Timely<br />
Data Submission<br />
Overall (3-21)<br />
Early Childhood (3-5)<br />
School Age (5-21)<br />
State<br />
Target<br />
100.00%<br />
100.00%<br />
100.00%<br />
State<br />
Target<br />
LEA<br />
Rate<br />
LEA<br />
Rate<br />
Target Met by<br />
LEA (Y/N)<br />
Target Met<br />
by LEA<br />
(Y/N)<br />
Target Met<br />
by LEA<br />
(Y/N)<br />
*Data reviewed for timely and accurate submissions included all APSCN cycle data except for personnel<br />
Note: - - denotes not applicable<br />
96.19 100.00 — — N/A<br />
14.53<br />
State<br />
Rate<br />
49.42<br />
State<br />
Rate<br />
54.07<br />
13.00<br />
State<br />
Target<br />
49.00<br />
State<br />
Target<br />
60.00<br />
Y<br />
Y<br />
Y<br />
— —<br />
LEA<br />
Rate<br />
— —<br />
LEA<br />
Rate<br />
— —<br />
N/A<br />
Target Met<br />
by LEA<br />
(Y/N)<br />
N/A<br />
Target Met<br />
by LEA<br />
(Y/N)<br />
N/A<br />
Page 5 of 5
<strong>ARKANSAS</strong> <strong>SPECIAL</strong> <strong>EDUCATION</strong><br />
<strong>DISTRICT</strong> <strong>ANNUAL</strong> PERFORMANCE REPORT<br />
2010/11 School Year<br />
Publication Date: March 2012<br />
Each State must have in place a State Performance Plan (SPP) to evaluate the State's efforts to meet the requirements and<br />
purposes of the implementation of the Individuals with Disabilities Education Act (IDEA). The SPP is a six-year plan, which<br />
describes Arkansas's performance on 20 indicators. The Office of Special Education Programs in the U. S. Department of<br />
Education requires that States report annually to the public on the performance of each local education agency (LEA) on 14 of<br />
20 indicators as compared with targets established by the State in the SPP. Arkansas will report indicators 1 through 14 and<br />
20 for each LEA serving children with disabilities (CWD). Any LEA not meeting targets on compliance indicators (0% for<br />
Indicators 4B, 09 & 10 and 100% for Indicators 11, 12, 13, and 20) are non-compliant with IDEA.<br />
There are no report changes for the 2010/11 school year profile; However, it is important to recognize that: .<br />
1. Indicator 01 (Graduation) is reported a year in arrear (2009/10 graduates) and is based on a four-year cohort. This<br />
means the rate is a measure of students who entered in ninth grade and graduate in four years. The calculation is a<br />
requirement under Title I of the Elementary and Secondary Education Act (ESEA).<br />
2. Indicator 02 (Drop out) is reported a year in arrear. This means the rate is a measure of students who dropped out in<br />
the 2009/10 school year. The Indicator 02 data are aligned with the Common Core of Data (CCD) requirements for<br />
grades 7-12.<br />
3. Indicator 04A and 4B (Suspension/Expulsion) is reported a year in arrear. This means the rate is a measure of<br />
students who had out-of-school suspensions and/or expulsions totaling more than 10 days.<br />
For a complete description of all the Indicators, please visit the special education website at<br />
http://arksped.k12.ar.us/sections/policy.html<br />
LEA: 3405 - JACKSON CO. SCHOOL <strong>DISTRICT</strong><br />
Indicator 01: Graduation Rates (2009/10 school year) Indicator 02: Dropout Rates (2009/10 school year)<br />
Percent of youth<br />
with IEPs<br />
graduating from<br />
high school with a<br />
regular diploma<br />
State<br />
Rate<br />
State<br />
Target<br />
75.76% 85.00%<br />
LEA<br />
Rate<br />
83.33%<br />
Target Met<br />
by LEA<br />
(Y/N)<br />
N<br />
Percent of<br />
youth with<br />
IEPs dropping<br />
out of high<br />
school<br />
State<br />
Rate<br />
Indicator 03: Assessment on Statewide Benchmark Exam (grades 3-8, 11)<br />
A) Adequate Yearly Progress<br />
n=40<br />
Literacy<br />
Mathematics<br />
Met Disability Subgroup "n"<br />
for Reporting Purposes (Y/N)<br />
State Target for % of Districts Meeting<br />
AYP for Disability Subgroup<br />
State<br />
Target<br />
3.06% 4.20%<br />
LEA<br />
Rate<br />
8.33%<br />
% of Districts Meeting AYP<br />
for Disability Subgroup<br />
Target Met by<br />
LEA (Y/N)<br />
N<br />
Target Met by<br />
LEA(Y/N)<br />
Overall N 17.15% 6.25%<br />
NA<br />
N<br />
N<br />
Note: For a district to qualify as having a disability subgroup it must have a minimum of 40 (n=40) students with disabilities in a school building.<br />
B) Participation<br />
Participation Rate: # of<br />
CWD Tested ÷ # of CWD<br />
Enrolled in grades tested.<br />
Participation Rate: Literacy<br />
Participation Rate: Math<br />
Note: - - denotes not applicable<br />
State<br />
Rate<br />
98.78%<br />
State<br />
Target<br />
95.00%<br />
LEA<br />
Rate<br />
100.00%<br />
Target Met<br />
by LEA (Y/N)<br />
98.61% 95.00% 97.78% Y<br />
Y<br />
C) Performance Proficiency<br />
Percent of CWD Scoring<br />
Proficient or Above<br />
Proficiency Rate: Literacy<br />
Proficiency Rate:<br />
Mathematics<br />
16.00%<br />
16.00%<br />
State<br />
Rate<br />
31.49%<br />
44.86%<br />
State<br />
Target<br />
45.22%<br />
51.14%<br />
LEA<br />
Rate<br />
29.03%<br />
75.00%<br />
NA<br />
NA<br />
Target<br />
Met by<br />
LEA (Y/N)<br />
N<br />
Y<br />
Page 1 of 5
LEA: 3405 - JACKSON CO. SCHOOL <strong>DISTRICT</strong><br />
Indicator 04: Out-of-School Suspensions and Expulsions (2009/10 school year)<br />
A) Suspension/Expulsion<br />
Percent difference of CWD with out-of- school suspensions and<br />
expulsions totaling greater than 10 days in a school year as<br />
compared to the same data for general education students in<br />
the district.<br />
B) Suspension/Expulsion by Race and Ethnicity<br />
Percent of districts that have: (a) a significant discrepancy, by race or<br />
ethnicity, in the rate of suspensions and expulsions of greater than 10<br />
days in a school year for children with IEPs; and (b) policies,<br />
procedures or practices that contribute to the significant discrepancy<br />
and do not comply with requirements relating to the development<br />
and implementation of IEPs, the use of positive behavioral<br />
interventions and supports, and procedural safeguards.<br />
Indicator 05: School Age (5-21) Least Restrictive Environment<br />
A) In the Regular Class 80% or more of the day<br />
Percent of CWD with<br />
IEPs receiving instruction<br />
in the regular class 80%<br />
or more of the day.<br />
State<br />
Rate<br />
State<br />
Target<br />
LEA<br />
Rate<br />
B) In the Regular Class less than 40% of the day<br />
Percent of CWD with<br />
IEPs receiving instruction<br />
in the regular class less<br />
than 60% of the day.<br />
53.87% 59.77%<br />
State<br />
Rate<br />
State<br />
Target<br />
12.42% 12.51%<br />
63.53%<br />
LEA<br />
Rate<br />
8.24%<br />
C) Other Settings outside the regular class<br />
Percent of CWD with IEPs served in<br />
public or private separate schools,<br />
residential placements, or<br />
homebound/hospital placements.<br />
State<br />
Rate<br />
State<br />
Target<br />
2.80% 2.56%<br />
Target Met<br />
by LEA (Y/N)<br />
Y<br />
Target Met<br />
by LEA (Y/N)<br />
Y<br />
LEA<br />
Rate<br />
1.18%<br />
Target Met<br />
by LEA(Y/N)<br />
Indicator 06: Early Childhood (3-5) Least Restrictive Environment<br />
A) Regular Early Childhood Program<br />
Percent of children (aged 3 through 5) with IEPs attending a regular<br />
early childhood program and receiving the majority of special<br />
education and related services in the regular early childhood program<br />
Allowable<br />
Difference<br />
LEA: 3405 - JACKSON CO. SCHOOL <strong>DISTRICT</strong><br />
Indicator 07: Preschool (3-5) Outcomes<br />
a) Percent of preschool CWD<br />
children who did not<br />
improve functioning.<br />
b) Percent of preschool CWD<br />
who improved but whose<br />
functioning remained below<br />
same age peers.<br />
c) Percent of preschool CWD<br />
who improved at a level<br />
nearer to same aged peers.<br />
d) Percent of preschool CWD<br />
who improved functioning to<br />
reach a level comparable to<br />
same age peers.<br />
e) Percent of preschool CWD<br />
children who maintain<br />
functioning at a level<br />
comparable to same aged<br />
peers.<br />
Summary<br />
Statements<br />
1) Of those preschool<br />
children who entered<br />
the preschool program<br />
below age expectations<br />
in each Outcome, the<br />
percent who<br />
substantially increased<br />
their rate of growth by<br />
the time they turned 6<br />
years of age or exited<br />
the program.<br />
2) The percent of<br />
preschool children who<br />
were functioning<br />
within age expectations<br />
in each Outcome by the<br />
time they turned 6<br />
years of age or exited<br />
A) Positive Social -Emotional<br />
Skills*<br />
State<br />
Rate<br />
A) Positive Social -<br />
Emotional Skills<br />
(Including social<br />
relationships)<br />
State<br />
Rate<br />
2.14%<br />
5.31%<br />
25.97%<br />
38.22%<br />
28.36%<br />
State<br />
Target<br />
LEA<br />
Rate<br />
LEA<br />
Rate<br />
— —<br />
— —<br />
— —<br />
— —<br />
— —<br />
Target<br />
Met by<br />
LEA(Y/N)<br />
B) Acquisition and Use of<br />
Knowledge and Skills<br />
(Including early language/<br />
communication and early literacy)<br />
B) Acquisition and Use of<br />
Knowledge and Skills **<br />
State<br />
Rate<br />
1.75%<br />
6.59%<br />
34.23%<br />
43.51%<br />
13.92%<br />
State<br />
Target<br />
LEA<br />
Rate<br />
Target<br />
Met by<br />
LEA(Y/N)<br />
C) Use of Appropriate Behaviors<br />
to Meet Their Needs<br />
State<br />
Rate<br />
State<br />
Target<br />
LEA<br />
Rate<br />
Target<br />
Met by<br />
LEA(Y/N)<br />
89.61% 90.50% — — N/A 90.31% 90.50% — — N/A 90.82% 92.50% — — N/A<br />
66.58% 69.50% — — N/A 57.43% 60.50% — — N/A 76.69% 78.50% — — N/A<br />
NOTE: * Including social relationships ** Including early language/ communication and early literacy<br />
Note: - - denotes not applicable<br />
State<br />
Rate<br />
LEA<br />
Rate<br />
— —<br />
— —<br />
— —<br />
— —<br />
— —<br />
C) Use of<br />
Appropriate<br />
Behaviors to<br />
Meet Their Needs<br />
State<br />
Rate<br />
4.51%<br />
17.34%<br />
41.72%<br />
34.97%<br />
LEA<br />
Rate<br />
1.46% — —<br />
— —<br />
— —<br />
— —<br />
— —<br />
Page 3 of 5
LEA: 3405 - JACKSON CO. SCHOOL <strong>DISTRICT</strong><br />
Indicator 08: Parent Involvement<br />
Percent of surveyed<br />
parents who reported<br />
school facilitated parent<br />
involvement as a means<br />
of improving services<br />
and results for children<br />
with disabilities.<br />
Early Childhood<br />
(3-5)<br />
School Age<br />
(5-21)<br />
State<br />
Rate<br />
90.47%<br />
95.05%<br />
Indicator 09: Disproportionality - Eligibility<br />
Disproportionate representation of racial<br />
and ethnic groups in special education and<br />
related services that is a result of<br />
inappropriate identification (e.g.<br />
monitoring data, review of policies,<br />
practices, and procedures under 618(d),<br />
etc.).<br />
State<br />
Rate<br />
State<br />
Target<br />
88.00%<br />
96.00%<br />
State<br />
Target<br />
0.00% 0.00%<br />
LEA<br />
Rate<br />
— —<br />
100.00%<br />
Indicator 10: Disproportionality-Child with a Disability<br />
Disproportionate representation of racial<br />
and ethnic groups in specific disability<br />
categories that is a result of inappropriate<br />
identification (e.g. monitoring data, review<br />
of policies, practices, and procedures under<br />
618(d), etc.).<br />
Indicator 11: Child Find<br />
Percent of children with<br />
parental consent to evaluate<br />
who are evaluated within<br />
the State established timeline<br />
of 60 days.<br />
Overall<br />
(3-21)<br />
Early Childhood<br />
(3-5)<br />
School Age<br />
(5-21)<br />
State<br />
Rate<br />
0.00%<br />
Indicator 12: Early Childhood Transition<br />
Percent of children referred by Part C prior to<br />
age 3, who are found eligible for Part B, and<br />
who have an IEP developed and implemented<br />
by their third birthday.<br />
Note: - - denotes not applicable<br />
State<br />
Rate<br />
99.41%<br />
99.70%<br />
98.97%<br />
State<br />
Rate<br />
State<br />
Target<br />
0.00%<br />
State<br />
Target<br />
100.00%<br />
100.00%<br />
100.00%<br />
State<br />
Target<br />
Target Met by<br />
LEA (Y/N)<br />
Y<br />
Target Met by<br />
LEA (Y/N)<br />
Y<br />
LEA<br />
Rate<br />
100.00%<br />
— —<br />
100.00%<br />
LEA<br />
Rate<br />
Target Met by<br />
LEA (Y/N)<br />
N/A<br />
Y<br />
Note: The target for Indicator 09 is to have zero percent<br />
(0%) of districts identified as having disproportionate<br />
representation as a result of inappropriate<br />
identification in eligibility.<br />
Note: The target for Indicator 10 is to have zero<br />
percent (0%) of districts identified as having<br />
disproportionate representation as a result of<br />
inappropriate identification in a disability<br />
category.<br />
Target Met by<br />
LEA (Y/N)<br />
N/A<br />
Y<br />
Target Met<br />
by LEA<br />
(Y/N)<br />
99.21% 100.00% - - N/A<br />
Y<br />
Note: * Indicates a zero reponse rate for the<br />
district.<br />
Page 4 of 5
LEA: 3405 - JACKSON CO. SCHOOL <strong>DISTRICT</strong><br />
Indicator 13: Secondary Transition<br />
Percent of youth with disabilities aged 16 and<br />
up with an IEP that includes coordinated,<br />
measurable, annual IEP goals and transition<br />
services that will reasonably enable the student<br />
to meet the post-secondary goals.<br />
Indicator 14: Post-School Outcomes<br />
A. Percent of youth enrolled in higher<br />
education within one year of leaving high<br />
school.<br />
State<br />
Rate<br />
State<br />
Target<br />
Note: Data for this Indicator is from the on-site monitoring of LEAs for the given year.<br />
B. Percent of youth enrolled in higher<br />
education or competitively employed<br />
within one year of leaving high school.<br />
C. Percent of youth enrolled in higher<br />
education or in some other postsecondary<br />
education or training program; or<br />
competitively employed or in some other<br />
employment within one year of leaving<br />
high school.<br />
State<br />
Rate<br />
Indicator 20: Reported Data-Timely and Accurate*<br />
District submitted<br />
required data elements<br />
on or before due dates;<br />
made revisions within<br />
the alloted reveiw<br />
periods.<br />
Accurate and Timely<br />
Data Submission<br />
Overall (3-21)<br />
Early Childhood (3-5)<br />
School Age (5-21)<br />
State<br />
Target<br />
100.00%<br />
100.00%<br />
100.00%<br />
State<br />
Target<br />
LEA<br />
Rate<br />
LEA<br />
Rate<br />
Target Met by<br />
LEA (Y/N)<br />
Target Met<br />
by LEA<br />
(Y/N)<br />
Target Met<br />
by LEA<br />
(Y/N)<br />
*Data reviewed for timely and accurate submissions included all APSCN cycle data except for personnel<br />
Note: - - denotes not applicable<br />
96.19 100.00 100.00% Y<br />
14.53<br />
State<br />
Rate<br />
49.42<br />
State<br />
Rate<br />
54.07<br />
13.00<br />
State<br />
Target<br />
49.00<br />
State<br />
Target<br />
60.00<br />
Y<br />
N/A<br />
Y<br />
— —<br />
LEA<br />
Rate<br />
— —<br />
LEA<br />
Rate<br />
— —<br />
N/A<br />
Target Met<br />
by LEA<br />
(Y/N)<br />
N/A<br />
Target Met<br />
by LEA<br />
(Y/N)<br />
N/A<br />
Page 5 of 5
<strong>ARKANSAS</strong> <strong>SPECIAL</strong> <strong>EDUCATION</strong><br />
<strong>DISTRICT</strong> <strong>ANNUAL</strong> PERFORMANCE REPORT<br />
2010/11 School Year<br />
Publication Date: March 2012<br />
Each State must have in place a State Performance Plan (SPP) to evaluate the State's efforts to meet the requirements and<br />
purposes of the implementation of the Individuals with Disabilities Education Act (IDEA). The SPP is a six-year plan, which<br />
describes Arkansas's performance on 20 indicators. The Office of Special Education Programs in the U. S. Department of<br />
Education requires that States report annually to the public on the performance of each local education agency (LEA) on 14 of<br />
20 indicators as compared with targets established by the State in the SPP. Arkansas will report indicators 1 through 14 and<br />
20 for each LEA serving children with disabilities (CWD). Any LEA not meeting targets on compliance indicators (0% for<br />
Indicators 4B, 09 & 10 and 100% for Indicators 11, 12, 13, and 20) are non-compliant with IDEA.<br />
There are no report changes for the 2010/11 school year profile; However, it is important to recognize that: .<br />
1. Indicator 01 (Graduation) is reported a year in arrear (2009/10 graduates) and is based on a four-year cohort. This<br />
means the rate is a measure of students who entered in ninth grade and graduate in four years. The calculation is a<br />
requirement under Title I of the Elementary and Secondary Education Act (ESEA).<br />
2. Indicator 02 (Drop out) is reported a year in arrear. This means the rate is a measure of students who dropped out in<br />
the 2009/10 school year. The Indicator 02 data are aligned with the Common Core of Data (CCD) requirements for<br />
grades 7-12.<br />
3. Indicator 04A and 4B (Suspension/Expulsion) is reported a year in arrear. This means the rate is a measure of<br />
students who had out-of-school suspensions and/or expulsions totaling more than 10 days.<br />
For a complete description of all the Indicators, please visit the special education website at<br />
http://arksped.k12.ar.us/sections/policy.html<br />
LEA: 3502 - DOLLARWAY SCHOOL <strong>DISTRICT</strong><br />
Indicator 01: Graduation Rates (2009/10 school year) Indicator 02: Dropout Rates (2009/10 school year)<br />
Percent of youth<br />
with IEPs<br />
graduating from<br />
high school with a<br />
regular diploma<br />
State<br />
Rate<br />
State<br />
Target<br />
75.76% 85.00%<br />
LEA<br />
Rate<br />
57.89%<br />
Target Met<br />
by LEA<br />
(Y/N)<br />
N<br />
Percent of<br />
youth with<br />
IEPs dropping<br />
out of high<br />
school<br />
State<br />
Rate<br />
Indicator 03: Assessment on Statewide Benchmark Exam (grades 3-8, 11)<br />
A) Adequate Yearly Progress<br />
n=40<br />
Literacy<br />
Mathematics<br />
Met Disability Subgroup "n"<br />
for Reporting Purposes (Y/N)<br />
State Target for % of Districts Meeting<br />
AYP for Disability Subgroup<br />
State<br />
Target<br />
3.06% 4.20%<br />
LEA<br />
Rate<br />
6.48%<br />
% of Districts Meeting AYP<br />
for Disability Subgroup<br />
Target Met by<br />
LEA (Y/N)<br />
N<br />
Target Met by<br />
LEA(Y/N)<br />
Overall N 17.15% 6.25%<br />
NA<br />
N<br />
N<br />
Note: For a district to qualify as having a disability subgroup it must have a minimum of 40 (n=40) students with disabilities in a school building.<br />
B) Participation<br />
Participation Rate: # of<br />
CWD Tested ÷ # of CWD<br />
Enrolled in grades tested.<br />
Participation Rate: Literacy<br />
Participation Rate: Math<br />
Note: - - denotes not applicable<br />
State<br />
Rate<br />
98.78%<br />
State<br />
Target<br />
95.00%<br />
LEA<br />
Rate<br />
100.00%<br />
Target Met<br />
by LEA (Y/N)<br />
98.61% 95.00% 97.87% Y<br />
Y<br />
C) Performance Proficiency<br />
Percent of CWD Scoring<br />
Proficient or Above<br />
Proficiency Rate: Literacy<br />
Proficiency Rate:<br />
Mathematics<br />
16.00%<br />
16.00%<br />
State<br />
Rate<br />
31.49%<br />
44.86%<br />
State<br />
Target<br />
45.22%<br />
51.14%<br />
LEA<br />
Rate<br />
17.86%<br />
34.07%<br />
NA<br />
NA<br />
Target<br />
Met by<br />
LEA (Y/N)<br />
N<br />
N<br />
Page 1 of 5
LEA: 3502 - DOLLARWAY SCHOOL <strong>DISTRICT</strong><br />
Indicator 04: Out-of-School Suspensions and Expulsions (2009/10 school year)<br />
A) Suspension/Expulsion<br />
Percent difference of CWD with out-of- school suspensions and<br />
expulsions totaling greater than 10 days in a school year as<br />
compared to the same data for general education students in<br />
the district.<br />
B) Suspension/Expulsion by Race and Ethnicity<br />
Percent of districts that have: (a) a significant discrepancy, by race or<br />
ethnicity, in the rate of suspensions and expulsions of greater than 10<br />
days in a school year for children with IEPs; and (b) policies,<br />
procedures or practices that contribute to the significant discrepancy<br />
and do not comply with requirements relating to the development<br />
and implementation of IEPs, the use of positive behavioral<br />
interventions and supports, and procedural safeguards.<br />
Indicator 05: School Age (5-21) Least Restrictive Environment<br />
A) In the Regular Class 80% or more of the day<br />
Percent of CWD with<br />
IEPs receiving instruction<br />
in the regular class 80%<br />
or more of the day.<br />
State<br />
Rate<br />
State<br />
Target<br />
LEA<br />
Rate<br />
B) In the Regular Class less than 40% of the day<br />
Percent of CWD with<br />
IEPs receiving instruction<br />
in the regular class less<br />
than 60% of the day.<br />
53.87% 59.77%<br />
State<br />
Rate<br />
State<br />
Target<br />
12.42% 12.51%<br />
43.56%<br />
LEA<br />
Rate<br />
0.00%<br />
C) Other Settings outside the regular class<br />
Percent of CWD with IEPs served in<br />
public or private separate schools,<br />
residential placements, or<br />
homebound/hospital placements.<br />
State<br />
Rate<br />
State<br />
Target<br />
2.80% 2.56%<br />
Target Met<br />
by LEA (Y/N)<br />
N<br />
Target Met<br />
by LEA (Y/N)<br />
Y<br />
LEA<br />
Rate<br />
9.20%<br />
Target Met<br />
by LEA(Y/N)<br />
Indicator 06: Early Childhood (3-5) Least Restrictive Environment<br />
A) Regular Early Childhood Program<br />
Percent of children (aged 3 through 5) with IEPs attending a regular<br />
early childhood program and receiving the majority of special<br />
education and related services in the regular early childhood program<br />
Allowable<br />
Difference<br />
LEA: 3502 - DOLLARWAY SCHOOL <strong>DISTRICT</strong><br />
Indicator 07: Preschool (3-5) Outcomes<br />
a) Percent of preschool CWD<br />
children who did not<br />
improve functioning.<br />
b) Percent of preschool CWD<br />
who improved but whose<br />
functioning remained below<br />
same age peers.<br />
c) Percent of preschool CWD<br />
who improved at a level<br />
nearer to same aged peers.<br />
d) Percent of preschool CWD<br />
who improved functioning to<br />
reach a level comparable to<br />
same age peers.<br />
e) Percent of preschool CWD<br />
children who maintain<br />
functioning at a level<br />
comparable to same aged<br />
peers.<br />
Summary<br />
Statements<br />
1) Of those preschool<br />
children who entered<br />
the preschool program<br />
below age expectations<br />
in each Outcome, the<br />
percent who<br />
substantially increased<br />
their rate of growth by<br />
the time they turned 6<br />
years of age or exited<br />
the program.<br />
2) The percent of<br />
preschool children who<br />
were functioning<br />
within age expectations<br />
in each Outcome by the<br />
time they turned 6<br />
years of age or exited<br />
A) Positive Social -Emotional<br />
Skills*<br />
State<br />
Rate<br />
A) Positive Social -<br />
Emotional Skills<br />
(Including social<br />
relationships)<br />
State<br />
Rate<br />
2.14%<br />
5.31%<br />
25.97%<br />
38.22%<br />
28.36%<br />
State<br />
Target<br />
LEA<br />
Rate<br />
LEA<br />
Rate<br />
— —<br />
— —<br />
— —<br />
— —<br />
— —<br />
Target<br />
Met by<br />
LEA(Y/N)<br />
B) Acquisition and Use of<br />
Knowledge and Skills<br />
(Including early language/<br />
communication and early literacy)<br />
B) Acquisition and Use of<br />
Knowledge and Skills **<br />
State<br />
Rate<br />
1.75%<br />
6.59%<br />
34.23%<br />
43.51%<br />
13.92%<br />
State<br />
Target<br />
LEA<br />
Rate<br />
Target<br />
Met by<br />
LEA(Y/N)<br />
C) Use of Appropriate Behaviors<br />
to Meet Their Needs<br />
State<br />
Rate<br />
State<br />
Target<br />
LEA<br />
Rate<br />
Target<br />
Met by<br />
LEA(Y/N)<br />
89.61% 90.50% — — N/A 90.31% 90.50% — — N/A 90.82% 92.50% — — N/A<br />
66.58% 69.50% — — N/A 57.43% 60.50% — — N/A 76.69% 78.50% — — N/A<br />
NOTE: * Including social relationships ** Including early language/ communication and early literacy<br />
Note: - - denotes not applicable<br />
State<br />
Rate<br />
LEA<br />
Rate<br />
— —<br />
— —<br />
— —<br />
— —<br />
— —<br />
C) Use of<br />
Appropriate<br />
Behaviors to<br />
Meet Their Needs<br />
State<br />
Rate<br />
4.51%<br />
17.34%<br />
41.72%<br />
34.97%<br />
LEA<br />
Rate<br />
1.46% — —<br />
— —<br />
— —<br />
— —<br />
— —<br />
Page 3 of 5
LEA: 3502 - DOLLARWAY SCHOOL <strong>DISTRICT</strong><br />
Indicator 08: Parent Involvement<br />
Percent of surveyed<br />
parents who reported<br />
school facilitated parent<br />
involvement as a means<br />
of improving services<br />
and results for children<br />
with disabilities.<br />
Early Childhood<br />
(3-5)<br />
School Age<br />
(5-21)<br />
State<br />
Rate<br />
90.47%<br />
95.05%<br />
Indicator 09: Disproportionality - Eligibility<br />
Disproportionate representation of racial<br />
and ethnic groups in special education and<br />
related services that is a result of<br />
inappropriate identification (e.g.<br />
monitoring data, review of policies,<br />
practices, and procedures under 618(d),<br />
etc.).<br />
State<br />
Rate<br />
State<br />
Target<br />
88.00%<br />
96.00%<br />
State<br />
Target<br />
0.00% 0.00%<br />
LEA<br />
Rate<br />
100.00%<br />
98.11%<br />
Indicator 10: Disproportionality-Child with a Disability<br />
Disproportionate representation of racial<br />
and ethnic groups in specific disability<br />
categories that is a result of inappropriate<br />
identification (e.g. monitoring data, review<br />
of policies, practices, and procedures under<br />
618(d), etc.).<br />
Indicator 11: Child Find<br />
Percent of children with<br />
parental consent to evaluate<br />
who are evaluated within<br />
the State established timeline<br />
of 60 days.<br />
Overall<br />
(3-21)<br />
Early Childhood<br />
(3-5)<br />
School Age<br />
(5-21)<br />
State<br />
Rate<br />
0.00%<br />
Indicator 12: Early Childhood Transition<br />
Percent of children referred by Part C prior to<br />
age 3, who are found eligible for Part B, and<br />
who have an IEP developed and implemented<br />
by their third birthday.<br />
Note: - - denotes not applicable<br />
State<br />
Rate<br />
99.41%<br />
99.70%<br />
98.97%<br />
State<br />
Rate<br />
State<br />
Target<br />
0.00%<br />
State<br />
Target<br />
100.00%<br />
100.00%<br />
100.00%<br />
State<br />
Target<br />
Target Met by<br />
LEA (Y/N)<br />
Y<br />
Target Met by<br />
LEA (Y/N)<br />
Y<br />
LEA<br />
Rate<br />
100.00%<br />
— —<br />
100.00%<br />
LEA<br />
Rate<br />
Target Met by<br />
LEA (Y/N)<br />
Y<br />
Y<br />
Note: The target for Indicator 09 is to have zero percent<br />
(0%) of districts identified as having disproportionate<br />
representation as a result of inappropriate<br />
identification in eligibility.<br />
Note: The target for Indicator 10 is to have zero<br />
percent (0%) of districts identified as having<br />
disproportionate representation as a result of<br />
inappropriate identification in a disability<br />
category.<br />
Target Met by<br />
LEA (Y/N)<br />
N/A<br />
Y<br />
Target Met<br />
by LEA<br />
(Y/N)<br />
99.21% 100.00% - - N/A<br />
Y<br />
Note: * Indicates a zero reponse rate for the<br />
district.<br />
Page 4 of 5
LEA: 3502 - DOLLARWAY SCHOOL <strong>DISTRICT</strong><br />
Indicator 13: Secondary Transition<br />
Percent of youth with disabilities aged 16 and<br />
up with an IEP that includes coordinated,<br />
measurable, annual IEP goals and transition<br />
services that will reasonably enable the student<br />
to meet the post-secondary goals.<br />
Indicator 14: Post-School Outcomes<br />
A. Percent of youth enrolled in higher<br />
education within one year of leaving high<br />
school.<br />
State<br />
Rate<br />
State<br />
Target<br />
Note: Data for this Indicator is from the on-site monitoring of LEAs for the given year.<br />
B. Percent of youth enrolled in higher<br />
education or competitively employed<br />
within one year of leaving high school.<br />
C. Percent of youth enrolled in higher<br />
education or in some other postsecondary<br />
education or training program; or<br />
competitively employed or in some other<br />
employment within one year of leaving<br />
high school.<br />
State<br />
Rate<br />
Indicator 20: Reported Data-Timely and Accurate*<br />
District submitted<br />
required data elements<br />
on or before due dates;<br />
made revisions within<br />
the alloted reveiw<br />
periods.<br />
Accurate and Timely<br />
Data Submission<br />
Overall (3-21)<br />
Early Childhood (3-5)<br />
School Age (5-21)<br />
State<br />
Target<br />
100.00%<br />
100.00%<br />
100.00%<br />
State<br />
Target<br />
LEA<br />
Rate<br />
LEA<br />
Rate<br />
Target Met by<br />
LEA (Y/N)<br />
Target Met<br />
by LEA<br />
(Y/N)<br />
Target Met<br />
by LEA<br />
(Y/N)<br />
*Data reviewed for timely and accurate submissions included all APSCN cycle data except for personnel<br />
Note: - - denotes not applicable<br />
96.19 100.00 — — N/A<br />
14.53<br />
State<br />
Rate<br />
49.42<br />
State<br />
Rate<br />
54.07<br />
13.00<br />
State<br />
Target<br />
49.00<br />
State<br />
Target<br />
60.00<br />
Y<br />
N/A<br />
Y<br />
— —<br />
LEA<br />
Rate<br />
— —<br />
LEA<br />
Rate<br />
— —<br />
N/A<br />
Target Met<br />
by LEA<br />
(Y/N)<br />
N/A<br />
Target Met<br />
by LEA<br />
(Y/N)<br />
N/A<br />
Page 5 of 5
LEA: 3505 - PINE BLUFF SCHOOL <strong>DISTRICT</strong><br />
<strong>ARKANSAS</strong> <strong>SPECIAL</strong> <strong>EDUCATION</strong><br />
<strong>DISTRICT</strong> <strong>ANNUAL</strong> PERFORMANCE REPORT<br />
2010/11 School Year<br />
Publication Date: March 2012<br />
Each State must have in place a State Performance Plan (SPP) to evaluate the State's efforts to meet the requirements and<br />
purposes of the implementation of the Individuals with Disabilities Education Act (IDEA). The SPP is a six-year plan, which<br />
describes Arkansas's performance on 20 indicators. The Office of Special Education Programs in the U. S. Department of<br />
Education requires that States report annually to the public on the performance of each local education agency (LEA) on 14 of<br />
20 indicators as compared with targets established by the State in the SPP. Arkansas will report indicators 1 through 14 and<br />
20 for each LEA serving children with disabilities (CWD). Any LEA not meeting targets on compliance indicators (0% for<br />
Indicators 4B, 09 & 10 and 100% for Indicators 11, 12, 13, and 20) are non-compliant with IDEA.<br />
There are no report changes for the 2010/11 school year profile; However, it is important to recognize that: .<br />
1. Indicator 01 (Graduation) is reported a year in arrear (2009/10 graduates) and is based on a four-year cohort. This<br />
means the rate is a measure of students who entered in ninth grade and graduate in four years. The calculation is a<br />
requirement under Title I of the Elementary and Secondary Education Act (ESEA).<br />
2. Indicator 02 (Drop out) is reported a year in arrear. This means the rate is a measure of students who dropped out in<br />
the 2009/10 school year. The Indicator 02 data are aligned with the Common Core of Data (CCD) requirements for<br />
grades 7-12.<br />
3. Indicator 04A and 4B (Suspension/Expulsion) is reported a year in arrear. This means the rate is a measure of<br />
students who had out-of-school suspensions and/or expulsions totaling more than 10 days.<br />
Percent of youth<br />
with IEPs<br />
graduating from<br />
high school with a<br />
regular diploma<br />
For a complete description of all the Indicators, please visit the special education website at<br />
http://arksped.k12.ar.us/sections/policy.html<br />
Indicator 01: Graduation Rates (2009/10 school year) Indicator 02: Dropout Rates (2009/10 school year)<br />
State<br />
Rate<br />
State<br />
Target<br />
75.76% 85.00%<br />
LEA<br />
Rate<br />
65.79%<br />
Target Met<br />
by LEA<br />
(Y/N)<br />
N<br />
Percent of<br />
youth with<br />
IEPs dropping<br />
out of high<br />
school<br />
State<br />
Rate<br />
Indicator 03: Assessment on Statewide Benchmark Exam (grades 3-8, 11)<br />
A) Adequate Yearly Progress<br />
n=40<br />
Literacy<br />
Mathematics<br />
Met Disability Subgroup "n"<br />
for Reporting Purposes (Y/N)<br />
State Target for % of Districts Meeting<br />
AYP for Disability Subgroup<br />
State<br />
Target<br />
3.06% 4.20%<br />
LEA<br />
Rate<br />
4.63%<br />
% of Districts Meeting AYP<br />
for Disability Subgroup<br />
Target Met by<br />
LEA (Y/N)<br />
N<br />
Target Met by<br />
LEA(Y/N)<br />
Overall N 17.15% 6.25%<br />
NA<br />
N<br />
N<br />
Note: For a district to qualify as having a disability subgroup it must have a minimum of 40 (n=40) students with disabilities in a school building.<br />
B) Participation<br />
Participation Rate: # of<br />
CWD Tested ÷ # of CWD<br />
Enrolled in grades tested.<br />
Participation Rate: Literacy<br />
Participation Rate: Math<br />
Note: - - denotes not applicable<br />
State<br />
Rate<br />
98.78%<br />
State<br />
Target<br />
95.00%<br />
LEA<br />
Rate<br />
97.18%<br />
Target Met<br />
by LEA (Y/N)<br />
98.61% 95.00% 96.33% Y<br />
Y<br />
C) Performance Proficiency<br />
Percent of CWD Scoring<br />
Proficient or Above<br />
Proficiency Rate: Literacy<br />
Proficiency Rate:<br />
Mathematics<br />
16.00%<br />
16.00%<br />
State<br />
Rate<br />
31.49%<br />
44.86%<br />
State<br />
Target<br />
45.22%<br />
51.14%<br />
LEA<br />
Rate<br />
24.47%<br />
38.89%<br />
NA<br />
NA<br />
Target<br />
Met by<br />
LEA (Y/N)<br />
N<br />
N<br />
Page 1 of 5
LEA: 3505 - PINE BLUFF SCHOOL <strong>DISTRICT</strong><br />
Indicator 04: Out-of-School Suspensions and Expulsions (2009/10 school year)<br />
A) Suspension/Expulsion<br />
Percent difference of CWD with out-of- school suspensions and<br />
expulsions totaling greater than 10 days in a school year as<br />
compared to the same data for general education students in<br />
the district.<br />
B) Suspension/Expulsion by Race and Ethnicity<br />
Percent of districts that have: (a) a significant discrepancy, by race or<br />
ethnicity, in the rate of suspensions and expulsions of greater than 10<br />
days in a school year for children with IEPs; and (b) policies,<br />
procedures or practices that contribute to the significant discrepancy<br />
and do not comply with requirements relating to the development<br />
and implementation of IEPs, the use of positive behavioral<br />
interventions and supports, and procedural safeguards.<br />
Indicator 05: School Age (5-21) Least Restrictive Environment<br />
A) In the Regular Class 80% or more of the day<br />
Percent of CWD with<br />
IEPs receiving instruction<br />
in the regular class 80%<br />
or more of the day.<br />
State<br />
Rate<br />
State<br />
Target<br />
LEA<br />
Rate<br />
B) In the Regular Class less than 40% of the day<br />
Percent of CWD with<br />
IEPs receiving instruction<br />
in the regular class less<br />
than 60% of the day.<br />
53.87% 59.77%<br />
State<br />
Rate<br />
State<br />
Target<br />
12.42% 12.51%<br />
13.48%<br />
LEA<br />
Rate<br />
25.35%<br />
C) Other Settings outside the regular class<br />
Percent of CWD with IEPs served in<br />
public or private separate schools,<br />
residential placements, or<br />
homebound/hospital placements.<br />
State<br />
Rate<br />
State<br />
Target<br />
2.80% 2.56%<br />
Target Met<br />
by LEA (Y/N)<br />
N<br />
Target Met<br />
by LEA (Y/N)<br />
N<br />
LEA<br />
Rate<br />
5.32%<br />
Target Met<br />
by LEA(Y/N)<br />
Indicator 06: Early Childhood (3-5) Least Restrictive Environment<br />
A) Regular Early Childhood Program<br />
Percent of children (aged 3 through 5) with IEPs attending a regular<br />
early childhood program and receiving the majority of special<br />
education and related services in the regular early childhood program<br />
Allowable<br />
Difference<br />
LEA: 3505 - PINE BLUFF SCHOOL <strong>DISTRICT</strong><br />
Indicator 07: Preschool (3-5) Outcomes<br />
a) Percent of preschool CWD<br />
children who did not<br />
improve functioning.<br />
b) Percent of preschool CWD<br />
who improved but whose<br />
functioning remained below<br />
same age peers.<br />
c) Percent of preschool CWD<br />
who improved at a level<br />
nearer to same aged peers.<br />
d) Percent of preschool CWD<br />
who improved functioning to<br />
reach a level comparable to<br />
same age peers.<br />
e) Percent of preschool CWD<br />
children who maintain<br />
functioning at a level<br />
comparable to same aged<br />
peers.<br />
Summary<br />
Statements<br />
1) Of those preschool<br />
children who entered<br />
the preschool program<br />
below age expectations<br />
in each Outcome, the<br />
percent who<br />
substantially increased<br />
their rate of growth by<br />
the time they turned 6<br />
years of age or exited<br />
the program.<br />
2) The percent of<br />
preschool children who<br />
were functioning<br />
within age expectations<br />
in each Outcome by the<br />
time they turned 6<br />
years of age or exited<br />
A) Positive Social -Emotional<br />
Skills*<br />
State<br />
Rate<br />
A) Positive Social -<br />
Emotional Skills<br />
(Including social<br />
relationships)<br />
State<br />
Rate<br />
2.14%<br />
5.31%<br />
25.97%<br />
38.22%<br />
28.36%<br />
State<br />
Target<br />
LEA<br />
Rate<br />
LEA<br />
Rate<br />
— —<br />
— —<br />
— —<br />
— —<br />
— —<br />
Target<br />
Met by<br />
LEA(Y/N)<br />
B) Acquisition and Use of<br />
Knowledge and Skills<br />
(Including early language/<br />
communication and early literacy)<br />
B) Acquisition and Use of<br />
Knowledge and Skills **<br />
State<br />
Rate<br />
1.75%<br />
6.59%<br />
34.23%<br />
43.51%<br />
13.92%<br />
State<br />
Target<br />
LEA<br />
Rate<br />
Target<br />
Met by<br />
LEA(Y/N)<br />
C) Use of Appropriate Behaviors<br />
to Meet Their Needs<br />
State<br />
Rate<br />
State<br />
Target<br />
LEA<br />
Rate<br />
Target<br />
Met by<br />
LEA(Y/N)<br />
89.61% 90.50% — — N/A 90.31% 90.50% — — N/A 90.82% 92.50% — — N/A<br />
66.58% 69.50% — — N/A 57.43% 60.50% — — N/A 76.69% 78.50% — — N/A<br />
NOTE: * Including social relationships ** Including early language/ communication and early literacy<br />
Note: - - denotes not applicable<br />
State<br />
Rate<br />
LEA<br />
Rate<br />
— —<br />
— —<br />
— —<br />
— —<br />
— —<br />
C) Use of<br />
Appropriate<br />
Behaviors to<br />
Meet Their Needs<br />
State<br />
Rate<br />
4.51%<br />
17.34%<br />
41.72%<br />
34.97%<br />
LEA<br />
Rate<br />
1.46% — —<br />
— —<br />
— —<br />
— —<br />
— —<br />
Page 3 of 5
LEA: 3505 - PINE BLUFF SCHOOL <strong>DISTRICT</strong><br />
Indicator 08: Parent Involvement<br />
Percent of surveyed<br />
parents who reported<br />
school facilitated parent<br />
involvement as a means<br />
of improving services<br />
and results for children<br />
with disabilities.<br />
Early Childhood<br />
(3-5)<br />
School Age<br />
(5-21)<br />
State<br />
Rate<br />
90.47%<br />
95.05%<br />
Indicator 09: Disproportionality - Eligibility<br />
Disproportionate representation of racial<br />
and ethnic groups in special education and<br />
related services that is a result of<br />
inappropriate identification (e.g.<br />
monitoring data, review of policies,<br />
practices, and procedures under 618(d),<br />
etc.).<br />
State<br />
Rate<br />
State<br />
Target<br />
88.00%<br />
96.00%<br />
State<br />
Target<br />
0.00% 0.00%<br />
LEA<br />
Rate<br />
— —<br />
92.31%<br />
Indicator 10: Disproportionality-Child with a Disability<br />
Disproportionate representation of racial<br />
and ethnic groups in specific disability<br />
categories that is a result of inappropriate<br />
identification (e.g. monitoring data, review<br />
of policies, practices, and procedures under<br />
618(d), etc.).<br />
Indicator 11: Child Find<br />
Percent of children with<br />
parental consent to evaluate<br />
who are evaluated within<br />
the State established timeline<br />
of 60 days.<br />
Overall<br />
(3-21)<br />
Early Childhood<br />
(3-5)<br />
School Age<br />
(5-21)<br />
State<br />
Rate<br />
0.00%<br />
Indicator 12: Early Childhood Transition<br />
Percent of children referred by Part C prior to<br />
age 3, who are found eligible for Part B, and<br />
who have an IEP developed and implemented<br />
by their third birthday.<br />
Note: - - denotes not applicable<br />
State<br />
Rate<br />
99.41%<br />
99.70%<br />
98.97%<br />
State<br />
Rate<br />
State<br />
Target<br />
0.00%<br />
State<br />
Target<br />
100.00%<br />
100.00%<br />
100.00%<br />
State<br />
Target<br />
Target Met by<br />
LEA (Y/N)<br />
Y<br />
Target Met by<br />
LEA (Y/N)<br />
Y<br />
LEA<br />
Rate<br />
63.16%<br />
— —<br />
63.16%<br />
LEA<br />
Rate<br />
Target Met by<br />
LEA (Y/N)<br />
N/A<br />
N<br />
Note: The target for Indicator 09 is to have zero percent<br />
(0%) of districts identified as having disproportionate<br />
representation as a result of inappropriate<br />
identification in eligibility.<br />
Note: The target for Indicator 10 is to have zero<br />
percent (0%) of districts identified as having<br />
disproportionate representation as a result of<br />
inappropriate identification in a disability<br />
category.<br />
Target Met by<br />
LEA (Y/N)<br />
N/A<br />
N<br />
Target Met<br />
by LEA<br />
(Y/N)<br />
99.21% 100.00% - - N/A<br />
N<br />
Note: * Indicates a zero reponse rate for the<br />
district.<br />
Page 4 of 5
LEA: 3505 - PINE BLUFF SCHOOL <strong>DISTRICT</strong><br />
Indicator 13: Secondary Transition<br />
Percent of youth with disabilities aged 16 and<br />
up with an IEP that includes coordinated,<br />
measurable, annual IEP goals and transition<br />
services that will reasonably enable the student<br />
to meet the post-secondary goals.<br />
Indicator 14: Post-School Outcomes<br />
A. Percent of youth enrolled in higher<br />
education within one year of leaving high<br />
school.<br />
State<br />
Rate<br />
State<br />
Target<br />
Note: Data for this Indicator is from the on-site monitoring of LEAs for the given year.<br />
B. Percent of youth enrolled in higher<br />
education or competitively employed<br />
within one year of leaving high school.<br />
C. Percent of youth enrolled in higher<br />
education or in some other postsecondary<br />
education or training program; or<br />
competitively employed or in some other<br />
employment within one year of leaving<br />
high school.<br />
State<br />
Rate<br />
Indicator 20: Reported Data-Timely and Accurate*<br />
District submitted<br />
required data elements<br />
on or before due dates;<br />
made revisions within<br />
the alloted reveiw<br />
periods.<br />
Accurate and Timely<br />
Data Submission<br />
Overall (3-21)<br />
Early Childhood (3-5)<br />
School Age (5-21)<br />
State<br />
Target<br />
100.00%<br />
100.00%<br />
100.00%<br />
State<br />
Target<br />
LEA<br />
Rate<br />
LEA<br />
Rate<br />
Target Met by<br />
LEA (Y/N)<br />
Target Met<br />
by LEA<br />
(Y/N)<br />
Target Met<br />
by LEA<br />
(Y/N)<br />
*Data reviewed for timely and accurate submissions included all APSCN cycle data except for personnel<br />
Note: - - denotes not applicable<br />
96.19 100.00 100.00% Y<br />
14.53<br />
State<br />
Rate<br />
49.42<br />
State<br />
Rate<br />
54.07<br />
13.00<br />
State<br />
Target<br />
49.00<br />
State<br />
Target<br />
60.00<br />
Y<br />
N/A<br />
Y<br />
— —<br />
LEA<br />
Rate<br />
— —<br />
LEA<br />
Rate<br />
— —<br />
N/A<br />
Target Met<br />
by LEA<br />
(Y/N)<br />
N/A<br />
Target Met<br />
by LEA<br />
(Y/N)<br />
N/A<br />
Page 5 of 5
<strong>ARKANSAS</strong> <strong>SPECIAL</strong> <strong>EDUCATION</strong><br />
<strong>DISTRICT</strong> <strong>ANNUAL</strong> PERFORMANCE REPORT<br />
2010/11 School Year<br />
Publication Date: March 2012<br />
Each State must have in place a State Performance Plan (SPP) to evaluate the State's efforts to meet the requirements and<br />
purposes of the implementation of the Individuals with Disabilities Education Act (IDEA). The SPP is a six-year plan, which<br />
describes Arkansas's performance on 20 indicators. The Office of Special Education Programs in the U. S. Department of<br />
Education requires that States report annually to the public on the performance of each local education agency (LEA) on 14 of<br />
20 indicators as compared with targets established by the State in the SPP. Arkansas will report indicators 1 through 14 and<br />
20 for each LEA serving children with disabilities (CWD). Any LEA not meeting targets on compliance indicators (0% for<br />
Indicators 4B, 09 & 10 and 100% for Indicators 11, 12, 13, and 20) are non-compliant with IDEA.<br />
There are no report changes for the 2010/11 school year profile; However, it is important to recognize that: .<br />
1. Indicator 01 (Graduation) is reported a year in arrear (2009/10 graduates) and is based on a four-year cohort. This<br />
means the rate is a measure of students who entered in ninth grade and graduate in four years. The calculation is a<br />
requirement under Title I of the Elementary and Secondary Education Act (ESEA).<br />
2. Indicator 02 (Drop out) is reported a year in arrear. This means the rate is a measure of students who dropped out in<br />
the 2009/10 school year. The Indicator 02 data are aligned with the Common Core of Data (CCD) requirements for<br />
grades 7-12.<br />
3. Indicator 04A and 4B (Suspension/Expulsion) is reported a year in arrear. This means the rate is a measure of<br />
students who had out-of-school suspensions and/or expulsions totaling more than 10 days.<br />
For a complete description of all the Indicators, please visit the special education website at<br />
http://arksped.k12.ar.us/sections/policy.html<br />
LEA: 3509 - WATSON CHAPEL SCHOOL <strong>DISTRICT</strong><br />
Indicator 01: Graduation Rates (2009/10 school year) Indicator 02: Dropout Rates (2009/10 school year)<br />
Percent of youth<br />
with IEPs<br />
graduating from<br />
high school with a<br />
regular diploma<br />
State<br />
Rate<br />
State<br />
Target<br />
75.76% 85.00%<br />
LEA<br />
Rate<br />
66.67%<br />
Target Met<br />
by LEA<br />
(Y/N)<br />
N<br />
Percent of<br />
youth with<br />
IEPs dropping<br />
out of high<br />
school<br />
State<br />
Rate<br />
Indicator 03: Assessment on Statewide Benchmark Exam (grades 3-8, 11)<br />
A) Adequate Yearly Progress<br />
n=40<br />
Literacy<br />
Mathematics<br />
Met Disability Subgroup "n"<br />
for Reporting Purposes (Y/N)<br />
State Target for % of Districts Meeting<br />
AYP for Disability Subgroup<br />
State<br />
Target<br />
3.06% 4.20%<br />
LEA<br />
Rate<br />
3.45%<br />
% of Districts Meeting AYP<br />
for Disability Subgroup<br />
Target Met by<br />
LEA (Y/N)<br />
Y<br />
Target Met by<br />
LEA(Y/N)<br />
Overall N 17.15% 6.25%<br />
NA<br />
N<br />
N<br />
Note: For a district to qualify as having a disability subgroup it must have a minimum of 40 (n=40) students with disabilities in a school building.<br />
B) Participation<br />
Participation Rate: # of<br />
CWD Tested ÷ # of CWD<br />
Enrolled in grades tested.<br />
Participation Rate: Literacy<br />
Participation Rate: Math<br />
Note: - - denotes not applicable<br />
State<br />
Rate<br />
98.78%<br />
State<br />
Target<br />
95.00%<br />
LEA<br />
Rate<br />
97.42%<br />
Target Met<br />
by LEA (Y/N)<br />
98.61% 95.00% 96.30% Y<br />
Y<br />
C) Performance Proficiency<br />
Percent of CWD Scoring<br />
Proficient or Above<br />
Proficiency Rate: Literacy<br />
Proficiency Rate:<br />
Mathematics<br />
16.00%<br />
16.00%<br />
State<br />
Rate<br />
31.49%<br />
44.86%<br />
State<br />
Target<br />
45.22%<br />
51.14%<br />
LEA<br />
Rate<br />
23.53%<br />
32.87%<br />
NA<br />
NA<br />
Target<br />
Met by<br />
LEA (Y/N)<br />
N<br />
N<br />
Page 1 of 5
LEA: 3509 - WATSON CHAPEL SCHOOL <strong>DISTRICT</strong><br />
Indicator 04: Out-of-School Suspensions and Expulsions (2009/10 school year)<br />
A) Suspension/Expulsion<br />
Percent difference of CWD with out-of- school suspensions and<br />
expulsions totaling greater than 10 days in a school year as<br />
compared to the same data for general education students in<br />
the district.<br />
B) Suspension/Expulsion by Race and Ethnicity<br />
Percent of districts that have: (a) a significant discrepancy, by race or<br />
ethnicity, in the rate of suspensions and expulsions of greater than 10<br />
days in a school year for children with IEPs; and (b) policies,<br />
procedures or practices that contribute to the significant discrepancy<br />
and do not comply with requirements relating to the development<br />
and implementation of IEPs, the use of positive behavioral<br />
interventions and supports, and procedural safeguards.<br />
Indicator 05: School Age (5-21) Least Restrictive Environment<br />
A) In the Regular Class 80% or more of the day<br />
Percent of CWD with<br />
IEPs receiving instruction<br />
in the regular class 80%<br />
or more of the day.<br />
State<br />
Rate<br />
State<br />
Target<br />
LEA<br />
Rate<br />
B) In the Regular Class less than 40% of the day<br />
Percent of CWD with<br />
IEPs receiving instruction<br />
in the regular class less<br />
than 60% of the day.<br />
53.87% 59.77%<br />
State<br />
Rate<br />
State<br />
Target<br />
12.42% 12.51%<br />
31.27%<br />
LEA<br />
Rate<br />
10.31%<br />
C) Other Settings outside the regular class<br />
Percent of CWD with IEPs served in<br />
public or private separate schools,<br />
residential placements, or<br />
homebound/hospital placements.<br />
State<br />
Rate<br />
State<br />
Target<br />
2.80% 2.56%<br />
Target Met<br />
by LEA (Y/N)<br />
N<br />
Target Met<br />
by LEA (Y/N)<br />
Y<br />
LEA<br />
Rate<br />
7.56%<br />
Target Met<br />
by LEA(Y/N)<br />
Indicator 06: Early Childhood (3-5) Least Restrictive Environment<br />
A) Regular Early Childhood Program<br />
Percent of children (aged 3 through 5) with IEPs attending a regular<br />
early childhood program and receiving the majority of special<br />
education and related services in the regular early childhood program<br />
Allowable<br />
Difference<br />
LEA: 3509 - WATSON CHAPEL SCHOOL <strong>DISTRICT</strong><br />
Indicator 07: Preschool (3-5) Outcomes<br />
a) Percent of preschool CWD<br />
children who did not<br />
improve functioning.<br />
b) Percent of preschool CWD<br />
who improved but whose<br />
functioning remained below<br />
same age peers.<br />
c) Percent of preschool CWD<br />
who improved at a level<br />
nearer to same aged peers.<br />
d) Percent of preschool CWD<br />
who improved functioning to<br />
reach a level comparable to<br />
same age peers.<br />
e) Percent of preschool CWD<br />
children who maintain<br />
functioning at a level<br />
comparable to same aged<br />
peers.<br />
Summary<br />
Statements<br />
1) Of those preschool<br />
children who entered<br />
the preschool program<br />
below age expectations<br />
in each Outcome, the<br />
percent who<br />
substantially increased<br />
their rate of growth by<br />
the time they turned 6<br />
years of age or exited<br />
the program.<br />
2) The percent of<br />
preschool children who<br />
were functioning<br />
within age expectations<br />
in each Outcome by the<br />
time they turned 6<br />
years of age or exited<br />
A) Positive Social -Emotional<br />
Skills*<br />
State<br />
Rate<br />
A) Positive Social -<br />
Emotional Skills<br />
(Including social<br />
relationships)<br />
State<br />
Rate<br />
2.14%<br />
5.31%<br />
25.97%<br />
38.22%<br />
28.36%<br />
State<br />
Target<br />
LEA<br />
Rate<br />
LEA<br />
Rate<br />
— —<br />
— —<br />
— —<br />
— —<br />
— —<br />
Target<br />
Met by<br />
LEA(Y/N)<br />
B) Acquisition and Use of<br />
Knowledge and Skills<br />
(Including early language/<br />
communication and early literacy)<br />
B) Acquisition and Use of<br />
Knowledge and Skills **<br />
State<br />
Rate<br />
1.75%<br />
6.59%<br />
34.23%<br />
43.51%<br />
13.92%<br />
State<br />
Target<br />
LEA<br />
Rate<br />
Target<br />
Met by<br />
LEA(Y/N)<br />
C) Use of Appropriate Behaviors<br />
to Meet Their Needs<br />
State<br />
Rate<br />
State<br />
Target<br />
LEA<br />
Rate<br />
Target<br />
Met by<br />
LEA(Y/N)<br />
89.61% 90.50% — — N/A 90.31% 90.50% — — N/A 90.82% 92.50% — — N/A<br />
66.58% 69.50% — — N/A 57.43% 60.50% — — N/A 76.69% 78.50% — — N/A<br />
NOTE: * Including social relationships ** Including early language/ communication and early literacy<br />
Note: - - denotes not applicable<br />
State<br />
Rate<br />
LEA<br />
Rate<br />
— —<br />
— —<br />
— —<br />
— —<br />
— —<br />
C) Use of<br />
Appropriate<br />
Behaviors to<br />
Meet Their Needs<br />
State<br />
Rate<br />
4.51%<br />
17.34%<br />
41.72%<br />
34.97%<br />
LEA<br />
Rate<br />
1.46% — —<br />
— —<br />
— —<br />
— —<br />
— —<br />
Page 3 of 5
LEA: 3509 - WATSON CHAPEL SCHOOL <strong>DISTRICT</strong><br />
Indicator 08: Parent Involvement<br />
Percent of surveyed<br />
parents who reported<br />
school facilitated parent<br />
involvement as a means<br />
of improving services<br />
and results for children<br />
with disabilities.<br />
Early Childhood<br />
(3-5)<br />
School Age<br />
(5-21)<br />
State<br />
Rate<br />
90.47%<br />
95.05%<br />
Indicator 09: Disproportionality - Eligibility<br />
Disproportionate representation of racial<br />
and ethnic groups in special education and<br />
related services that is a result of<br />
inappropriate identification (e.g.<br />
monitoring data, review of policies,<br />
practices, and procedures under 618(d),<br />
etc.).<br />
State<br />
Rate<br />
State<br />
Target<br />
88.00%<br />
96.00%<br />
State<br />
Target<br />
0.00% 0.00%<br />
LEA<br />
Rate<br />
— —<br />
92.90%<br />
Indicator 10: Disproportionality-Child with a Disability<br />
Disproportionate representation of racial<br />
and ethnic groups in specific disability<br />
categories that is a result of inappropriate<br />
identification (e.g. monitoring data, review<br />
of policies, practices, and procedures under<br />
618(d), etc.).<br />
Indicator 11: Child Find<br />
Percent of children with<br />
parental consent to evaluate<br />
who are evaluated within<br />
the State established timeline<br />
of 60 days.<br />
Overall<br />
(3-21)<br />
Early Childhood<br />
(3-5)<br />
School Age<br />
(5-21)<br />
State<br />
Rate<br />
0.00%<br />
Indicator 12: Early Childhood Transition<br />
Percent of children referred by Part C prior to<br />
age 3, who are found eligible for Part B, and<br />
who have an IEP developed and implemented<br />
by their third birthday.<br />
Note: - - denotes not applicable<br />
State<br />
Rate<br />
99.41%<br />
99.70%<br />
98.97%<br />
State<br />
Rate<br />
State<br />
Target<br />
0.00%<br />
State<br />
Target<br />
100.00%<br />
100.00%<br />
100.00%<br />
State<br />
Target<br />
Target Met by<br />
LEA (Y/N)<br />
Y<br />
Target Met by<br />
LEA (Y/N)<br />
Y<br />
LEA<br />
Rate<br />
100.00%<br />
— —<br />
100.00%<br />
LEA<br />
Rate<br />
Target Met by<br />
LEA (Y/N)<br />
N/A<br />
N<br />
Note: The target for Indicator 09 is to have zero percent<br />
(0%) of districts identified as having disproportionate<br />
representation as a result of inappropriate<br />
identification in eligibility.<br />
Note: The target for Indicator 10 is to have zero<br />
percent (0%) of districts identified as having<br />
disproportionate representation as a result of<br />
inappropriate identification in a disability<br />
category.<br />
Target Met by<br />
LEA (Y/N)<br />
N/A<br />
Y<br />
Target Met<br />
by LEA<br />
(Y/N)<br />
99.21% 100.00% - - N/A<br />
Y<br />
Note: * Indicates a zero reponse rate for the<br />
district.<br />
Page 4 of 5
LEA: 3509 - WATSON CHAPEL SCHOOL <strong>DISTRICT</strong><br />
Indicator 13: Secondary Transition<br />
Percent of youth with disabilities aged 16 and<br />
up with an IEP that includes coordinated,<br />
measurable, annual IEP goals and transition<br />
services that will reasonably enable the student<br />
to meet the post-secondary goals.<br />
Indicator 14: Post-School Outcomes<br />
A. Percent of youth enrolled in higher<br />
education within one year of leaving high<br />
school.<br />
State<br />
Rate<br />
State<br />
Target<br />
Note: Data for this Indicator is from the on-site monitoring of LEAs for the given year.<br />
B. Percent of youth enrolled in higher<br />
education or competitively employed<br />
within one year of leaving high school.<br />
C. Percent of youth enrolled in higher<br />
education or in some other postsecondary<br />
education or training program; or<br />
competitively employed or in some other<br />
employment within one year of leaving<br />
high school.<br />
State<br />
Rate<br />
Indicator 20: Reported Data-Timely and Accurate*<br />
District submitted<br />
required data elements<br />
on or before due dates;<br />
made revisions within<br />
the alloted reveiw<br />
periods.<br />
Accurate and Timely<br />
Data Submission<br />
Overall (3-21)<br />
Early Childhood (3-5)<br />
School Age (5-21)<br />
State<br />
Target<br />
100.00%<br />
100.00%<br />
100.00%<br />
State<br />
Target<br />
LEA<br />
Rate<br />
LEA<br />
Rate<br />
Target Met by<br />
LEA (Y/N)<br />
Target Met<br />
by LEA<br />
(Y/N)<br />
Target Met<br />
by LEA<br />
(Y/N)<br />
*Data reviewed for timely and accurate submissions included all APSCN cycle data except for personnel<br />
Note: - - denotes not applicable<br />
96.19 100.00 100.00% Y<br />
14.53<br />
State<br />
Rate<br />
49.42<br />
State<br />
Rate<br />
54.07<br />
13.00<br />
State<br />
Target<br />
49.00<br />
State<br />
Target<br />
60.00<br />
Y<br />
N/A<br />
Y<br />
— —<br />
LEA<br />
Rate<br />
— —<br />
LEA<br />
Rate<br />
— —<br />
N/A<br />
Target Met<br />
by LEA<br />
(Y/N)<br />
N/A<br />
Target Met<br />
by LEA<br />
(Y/N)<br />
N/A<br />
Page 5 of 5
<strong>ARKANSAS</strong> <strong>SPECIAL</strong> <strong>EDUCATION</strong><br />
<strong>DISTRICT</strong> <strong>ANNUAL</strong> PERFORMANCE REPORT<br />
2010/11 School Year<br />
Publication Date: March 2012<br />
Each State must have in place a State Performance Plan (SPP) to evaluate the State's efforts to meet the requirements and<br />
purposes of the implementation of the Individuals with Disabilities Education Act (IDEA). The SPP is a six-year plan, which<br />
describes Arkansas's performance on 20 indicators. The Office of Special Education Programs in the U. S. Department of<br />
Education requires that States report annually to the public on the performance of each local education agency (LEA) on 14 of<br />
20 indicators as compared with targets established by the State in the SPP. Arkansas will report indicators 1 through 14 and<br />
20 for each LEA serving children with disabilities (CWD). Any LEA not meeting targets on compliance indicators (0% for<br />
Indicators 4B, 09 & 10 and 100% for Indicators 11, 12, 13, and 20) are non-compliant with IDEA.<br />
There are no report changes for the 2010/11 school year profile; However, it is important to recognize that: .<br />
1. Indicator 01 (Graduation) is reported a year in arrear (2009/10 graduates) and is based on a four-year cohort. This<br />
means the rate is a measure of students who entered in ninth grade and graduate in four years. The calculation is a<br />
requirement under Title I of the Elementary and Secondary Education Act (ESEA).<br />
2. Indicator 02 (Drop out) is reported a year in arrear. This means the rate is a measure of students who dropped out in<br />
the 2009/10 school year. The Indicator 02 data are aligned with the Common Core of Data (CCD) requirements for<br />
grades 7-12.<br />
3. Indicator 04A and 4B (Suspension/Expulsion) is reported a year in arrear. This means the rate is a measure of<br />
students who had out-of-school suspensions and/or expulsions totaling more than 10 days.<br />
For a complete description of all the Indicators, please visit the special education website at<br />
http://arksped.k12.ar.us/sections/policy.html<br />
LEA: 3510 - WHITE HALL SCHOOL <strong>DISTRICT</strong><br />
Indicator 01: Graduation Rates (2009/10 school year) Indicator 02: Dropout Rates (2009/10 school year)<br />
Percent of youth<br />
with IEPs<br />
graduating from<br />
high school with a<br />
regular diploma<br />
State<br />
Rate<br />
State<br />
Target<br />
75.76% 85.00%<br />
LEA<br />
Rate<br />
61.11%<br />
Target Met<br />
by LEA<br />
(Y/N)<br />
N<br />
Percent of<br />
youth with<br />
IEPs dropping<br />
out of high<br />
school<br />
State<br />
Rate<br />
Indicator 03: Assessment on Statewide Benchmark Exam (grades 3-8, 11)<br />
A) Adequate Yearly Progress<br />
n=40<br />
Literacy<br />
Mathematics<br />
Met Disability Subgroup "n"<br />
for Reporting Purposes (Y/N)<br />
State Target for % of Districts Meeting<br />
AYP for Disability Subgroup<br />
State<br />
Target<br />
3.06% 4.20%<br />
LEA<br />
Rate<br />
2.61%<br />
% of Districts Meeting AYP<br />
for Disability Subgroup<br />
Target Met by<br />
LEA (Y/N)<br />
Y<br />
Target Met by<br />
LEA(Y/N)<br />
Overall N 17.15% 6.25%<br />
NA<br />
N<br />
N<br />
Note: For a district to qualify as having a disability subgroup it must have a minimum of 40 (n=40) students with disabilities in a school building.<br />
B) Participation<br />
Participation Rate: # of<br />
CWD Tested ÷ # of CWD<br />
Enrolled in grades tested.<br />
Participation Rate: Literacy<br />
Participation Rate: Math<br />
Note: - - denotes not applicable<br />
State<br />
Rate<br />
98.78%<br />
State<br />
Target<br />
95.00%<br />
LEA<br />
Rate<br />
98.03%<br />
Target Met<br />
by LEA (Y/N)<br />
98.61% 95.00% 98.68% Y<br />
Y<br />
C) Performance Proficiency<br />
Percent of CWD Scoring<br />
Proficient or Above<br />
Proficiency Rate: Literacy<br />
Proficiency Rate:<br />
Mathematics<br />
16.00%<br />
16.00%<br />
State<br />
Rate<br />
31.49%<br />
44.86%<br />
State<br />
Target<br />
45.22%<br />
51.14%<br />
LEA<br />
Rate<br />
36.88%<br />
56.03%<br />
NA<br />
NA<br />
Target<br />
Met by<br />
LEA (Y/N)<br />
N<br />
Y<br />
Page 1 of 5
LEA: 3510 - WHITE HALL SCHOOL <strong>DISTRICT</strong><br />
Indicator 04: Out-of-School Suspensions and Expulsions (2009/10 school year)<br />
A) Suspension/Expulsion<br />
Percent difference of CWD with out-of- school suspensions and<br />
expulsions totaling greater than 10 days in a school year as<br />
compared to the same data for general education students in<br />
the district.<br />
B) Suspension/Expulsion by Race and Ethnicity<br />
Percent of districts that have: (a) a significant discrepancy, by race or<br />
ethnicity, in the rate of suspensions and expulsions of greater than 10<br />
days in a school year for children with IEPs; and (b) policies,<br />
procedures or practices that contribute to the significant discrepancy<br />
and do not comply with requirements relating to the development<br />
and implementation of IEPs, the use of positive behavioral<br />
interventions and supports, and procedural safeguards.<br />
Indicator 05: School Age (5-21) Least Restrictive Environment<br />
A) In the Regular Class 80% or more of the day<br />
Percent of CWD with<br />
IEPs receiving instruction<br />
in the regular class 80%<br />
or more of the day.<br />
State<br />
Rate<br />
State<br />
Target<br />
LEA<br />
Rate<br />
B) In the Regular Class less than 40% of the day<br />
Percent of CWD with<br />
IEPs receiving instruction<br />
in the regular class less<br />
than 60% of the day.<br />
53.87% 59.77%<br />
State<br />
Rate<br />
State<br />
Target<br />
12.42% 12.51%<br />
47.39%<br />
LEA<br />
Rate<br />
16.42%<br />
C) Other Settings outside the regular class<br />
Percent of CWD with IEPs served in<br />
public or private separate schools,<br />
residential placements, or<br />
homebound/hospital placements.<br />
State<br />
Rate<br />
State<br />
Target<br />
2.80% 2.56%<br />
Target Met<br />
by LEA (Y/N)<br />
N<br />
Target Met<br />
by LEA (Y/N)<br />
N<br />
LEA<br />
Rate<br />
2.61%<br />
Target Met<br />
by LEA(Y/N)<br />
Indicator 06: Early Childhood (3-5) Least Restrictive Environment<br />
A) Regular Early Childhood Program<br />
Percent of children (aged 3 through 5) with IEPs attending a regular<br />
early childhood program and receiving the majority of special<br />
education and related services in the regular early childhood program<br />
Allowable<br />
Difference<br />
LEA: 3510 - WHITE HALL SCHOOL <strong>DISTRICT</strong><br />
Indicator 07: Preschool (3-5) Outcomes<br />
a) Percent of preschool CWD<br />
children who did not<br />
improve functioning.<br />
b) Percent of preschool CWD<br />
who improved but whose<br />
functioning remained below<br />
same age peers.<br />
c) Percent of preschool CWD<br />
who improved at a level<br />
nearer to same aged peers.<br />
d) Percent of preschool CWD<br />
who improved functioning to<br />
reach a level comparable to<br />
same age peers.<br />
e) Percent of preschool CWD<br />
children who maintain<br />
functioning at a level<br />
comparable to same aged<br />
peers.<br />
Summary<br />
Statements<br />
1) Of those preschool<br />
children who entered<br />
the preschool program<br />
below age expectations<br />
in each Outcome, the<br />
percent who<br />
substantially increased<br />
their rate of growth by<br />
the time they turned 6<br />
years of age or exited<br />
the program.<br />
2) The percent of<br />
preschool children who<br />
were functioning<br />
within age expectations<br />
in each Outcome by the<br />
time they turned 6<br />
years of age or exited<br />
A) Positive Social -Emotional<br />
Skills*<br />
State<br />
Rate<br />
A) Positive Social -<br />
Emotional Skills<br />
(Including social<br />
relationships)<br />
State<br />
Rate<br />
2.14%<br />
5.31%<br />
25.97%<br />
38.22%<br />
28.36%<br />
State<br />
Target<br />
LEA<br />
Rate<br />
LEA<br />
Rate<br />
— —<br />
— —<br />
— —<br />
— —<br />
— —<br />
Target<br />
Met by<br />
LEA(Y/N)<br />
B) Acquisition and Use of<br />
Knowledge and Skills<br />
(Including early language/<br />
communication and early literacy)<br />
B) Acquisition and Use of<br />
Knowledge and Skills **<br />
State<br />
Rate<br />
1.75%<br />
6.59%<br />
34.23%<br />
43.51%<br />
13.92%<br />
State<br />
Target<br />
LEA<br />
Rate<br />
Target<br />
Met by<br />
LEA(Y/N)<br />
C) Use of Appropriate Behaviors<br />
to Meet Their Needs<br />
State<br />
Rate<br />
State<br />
Target<br />
LEA<br />
Rate<br />
Target<br />
Met by<br />
LEA(Y/N)<br />
89.61% 90.50% — — N/A 90.31% 90.50% — — N/A 90.82% 92.50% — — N/A<br />
66.58% 69.50% — — N/A 57.43% 60.50% — — N/A 76.69% 78.50% — — N/A<br />
NOTE: * Including social relationships ** Including early language/ communication and early literacy<br />
Note: - - denotes not applicable<br />
State<br />
Rate<br />
LEA<br />
Rate<br />
— —<br />
— —<br />
— —<br />
— —<br />
— —<br />
C) Use of<br />
Appropriate<br />
Behaviors to<br />
Meet Their Needs<br />
State<br />
Rate<br />
4.51%<br />
17.34%<br />
41.72%<br />
34.97%<br />
LEA<br />
Rate<br />
1.46% — —<br />
— —<br />
— —<br />
— —<br />
— —<br />
Page 3 of 5
LEA: 3510 - WHITE HALL SCHOOL <strong>DISTRICT</strong><br />
Indicator 08: Parent Involvement<br />
Percent of surveyed<br />
parents who reported<br />
school facilitated parent<br />
involvement as a means<br />
of improving services<br />
and results for children<br />
with disabilities.<br />
Early Childhood<br />
(3-5)<br />
School Age<br />
(5-21)<br />
State<br />
Rate<br />
90.47%<br />
95.05%<br />
Indicator 09: Disproportionality - Eligibility<br />
Disproportionate representation of racial<br />
and ethnic groups in special education and<br />
related services that is a result of<br />
inappropriate identification (e.g.<br />
monitoring data, review of policies,<br />
practices, and procedures under 618(d),<br />
etc.).<br />
State<br />
Rate<br />
State<br />
Target<br />
88.00%<br />
96.00%<br />
State<br />
Target<br />
0.00% 0.00%<br />
LEA<br />
Rate<br />
— —<br />
95.02%<br />
Indicator 10: Disproportionality-Child with a Disability<br />
Disproportionate representation of racial<br />
and ethnic groups in specific disability<br />
categories that is a result of inappropriate<br />
identification (e.g. monitoring data, review<br />
of policies, practices, and procedures under<br />
618(d), etc.).<br />
Indicator 11: Child Find<br />
Percent of children with<br />
parental consent to evaluate<br />
who are evaluated within<br />
the State established timeline<br />
of 60 days.<br />
Overall<br />
(3-21)<br />
Early Childhood<br />
(3-5)<br />
School Age<br />
(5-21)<br />
State<br />
Rate<br />
0.00%<br />
Indicator 12: Early Childhood Transition<br />
Percent of children referred by Part C prior to<br />
age 3, who are found eligible for Part B, and<br />
who have an IEP developed and implemented<br />
by their third birthday.<br />
Note: - - denotes not applicable<br />
State<br />
Rate<br />
99.41%<br />
99.70%<br />
98.97%<br />
State<br />
Rate<br />
State<br />
Target<br />
0.00%<br />
State<br />
Target<br />
100.00%<br />
100.00%<br />
100.00%<br />
State<br />
Target<br />
Target Met by<br />
LEA (Y/N)<br />
Y<br />
Target Met by<br />
LEA (Y/N)<br />
Y<br />
LEA<br />
Rate<br />
98.15%<br />
— —<br />
98.15%<br />
LEA<br />
Rate<br />
Target Met by<br />
LEA (Y/N)<br />
N/A<br />
N<br />
Note: The target for Indicator 09 is to have zero percent<br />
(0%) of districts identified as having disproportionate<br />
representation as a result of inappropriate<br />
identification in eligibility.<br />
Note: The target for Indicator 10 is to have zero<br />
percent (0%) of districts identified as having<br />
disproportionate representation as a result of<br />
inappropriate identification in a disability<br />
category.<br />
Target Met by<br />
LEA (Y/N)<br />
N/A<br />
N<br />
Target Met<br />
by LEA<br />
(Y/N)<br />
99.21% 100.00% - - N/A<br />
N<br />
Note: * Indicates a zero reponse rate for the<br />
district.<br />
Page 4 of 5
LEA: 3510 - WHITE HALL SCHOOL <strong>DISTRICT</strong><br />
Indicator 13: Secondary Transition<br />
Percent of youth with disabilities aged 16 and<br />
up with an IEP that includes coordinated,<br />
measurable, annual IEP goals and transition<br />
services that will reasonably enable the student<br />
to meet the post-secondary goals.<br />
Indicator 14: Post-School Outcomes<br />
A. Percent of youth enrolled in higher<br />
education within one year of leaving high<br />
school.<br />
State<br />
Rate<br />
State<br />
Target<br />
Note: Data for this Indicator is from the on-site monitoring of LEAs for the given year.<br />
B. Percent of youth enrolled in higher<br />
education or competitively employed<br />
within one year of leaving high school.<br />
C. Percent of youth enrolled in higher<br />
education or in some other postsecondary<br />
education or training program; or<br />
competitively employed or in some other<br />
employment within one year of leaving<br />
high school.<br />
State<br />
Rate<br />
Indicator 20: Reported Data-Timely and Accurate*<br />
District submitted<br />
required data elements<br />
on or before due dates;<br />
made revisions within<br />
the alloted reveiw<br />
periods.<br />
Accurate and Timely<br />
Data Submission<br />
Overall (3-21)<br />
Early Childhood (3-5)<br />
School Age (5-21)<br />
State<br />
Target<br />
100.00%<br />
100.00%<br />
100.00%<br />
State<br />
Target<br />
LEA<br />
Rate<br />
LEA<br />
Rate<br />
Target Met by<br />
LEA (Y/N)<br />
Target Met<br />
by LEA<br />
(Y/N)<br />
Target Met<br />
by LEA<br />
(Y/N)<br />
*Data reviewed for timely and accurate submissions included all APSCN cycle data except for personnel<br />
Note: - - denotes not applicable<br />
96.19 100.00 — — N/A<br />
14.53<br />
State<br />
Rate<br />
49.42<br />
State<br />
Rate<br />
54.07<br />
13.00<br />
State<br />
Target<br />
49.00<br />
State<br />
Target<br />
60.00<br />
Y<br />
N/A<br />
Y<br />
— —<br />
LEA<br />
Rate<br />
— —<br />
LEA<br />
Rate<br />
— —<br />
N/A<br />
Target Met<br />
by LEA<br />
(Y/N)<br />
N/A<br />
Target Met<br />
by LEA<br />
(Y/N)<br />
N/A<br />
Page 5 of 5
<strong>ARKANSAS</strong> <strong>SPECIAL</strong> <strong>EDUCATION</strong><br />
<strong>DISTRICT</strong> <strong>ANNUAL</strong> PERFORMANCE REPORT<br />
2010/11 School Year<br />
Publication Date: March 2012<br />
Each State must have in place a State Performance Plan (SPP) to evaluate the State's efforts to meet the requirements and<br />
purposes of the implementation of the Individuals with Disabilities Education Act (IDEA). The SPP is a six-year plan, which<br />
describes Arkansas's performance on 20 indicators. The Office of Special Education Programs in the U. S. Department of<br />
Education requires that States report annually to the public on the performance of each local education agency (LEA) on 14 of<br />
20 indicators as compared with targets established by the State in the SPP. Arkansas will report indicators 1 through 14 and<br />
20 for each LEA serving children with disabilities (CWD). Any LEA not meeting targets on compliance indicators (0% for<br />
Indicators 4B, 09 & 10 and 100% for Indicators 11, 12, 13, and 20) are non-compliant with IDEA.<br />
There are no report changes for the 2010/11 school year profile; However, it is important to recognize that: .<br />
1. Indicator 01 (Graduation) is reported a year in arrear (2009/10 graduates) and is based on a four-year cohort. This<br />
means the rate is a measure of students who entered in ninth grade and graduate in four years. The calculation is a<br />
requirement under Title I of the Elementary and Secondary Education Act (ESEA).<br />
2. Indicator 02 (Drop out) is reported a year in arrear. This means the rate is a measure of students who dropped out in<br />
the 2009/10 school year. The Indicator 02 data are aligned with the Common Core of Data (CCD) requirements for<br />
grades 7-12.<br />
3. Indicator 04A and 4B (Suspension/Expulsion) is reported a year in arrear. This means the rate is a measure of<br />
students who had out-of-school suspensions and/or expulsions totaling more than 10 days.<br />
For a complete description of all the Indicators, please visit the special education website at<br />
http://arksped.k12.ar.us/sections/policy.html<br />
LEA: 3520 - <strong>ARKANSAS</strong> RIVER <strong>EDUCATION</strong> SERVICE CO-OP<br />
Indicator 01: Graduation Rates (2009/10 school year) Indicator 02: Dropout Rates (2009/10 school year)<br />
Percent of youth<br />
with IEPs<br />
graduating from<br />
high school with a<br />
regular diploma<br />
State<br />
Rate<br />
State<br />
Target<br />
75.76% 85.00%<br />
LEA<br />
Rate<br />
— —<br />
Target Met<br />
by LEA<br />
(Y/N)<br />
NA<br />
Percent of<br />
youth with<br />
IEPs dropping<br />
out of high<br />
school<br />
State<br />
Rate<br />
Indicator 03: Assessment on Statewide Benchmark Exam (grades 3-8, 11)<br />
A) Adequate Yearly Progress<br />
n=40<br />
Literacy<br />
Mathematics<br />
Met Disability Subgroup "n"<br />
for Reporting Purposes (Y/N)<br />
State Target for % of Districts Meeting<br />
AYP for Disability Subgroup<br />
State<br />
Target<br />
3.06% 4.20%<br />
LEA<br />
Rate<br />
— —<br />
% of Districts Meeting AYP<br />
for Disability Subgroup<br />
Target Met by<br />
LEA (Y/N)<br />
N/A<br />
Target Met by<br />
LEA(Y/N)<br />
Overall N/A 17.15% 6.25%<br />
N/A<br />
N/A<br />
N/A<br />
Note: For a district to qualify as having a disability subgroup it must have a minimum of 40 (n=40) students with disabilities in a school building.<br />
B) Participation<br />
Participation Rate: # of<br />
CWD Tested ÷ # of CWD<br />
Enrolled in grades tested.<br />
Participation Rate: Literacy<br />
Participation Rate: Math<br />
Note: - - denotes not applicable<br />
State<br />
Rate<br />
98.78%<br />
State<br />
Target<br />
95.00%<br />
LEA<br />
Rate<br />
— —<br />
Target Met<br />
by LEA (Y/N)<br />
N/A<br />
98.61% 95.00% — — N/A<br />
C) Performance Proficiency<br />
Percent of CWD Scoring<br />
Proficient or Above<br />
Proficiency Rate: Literacy<br />
Proficiency Rate:<br />
Mathematics<br />
16.00%<br />
16.00%<br />
State<br />
Rate<br />
31.49%<br />
44.86%<br />
State<br />
Target<br />
45.22%<br />
51.14%<br />
LEA<br />
Rate<br />
— —<br />
— —<br />
N/A<br />
N/A<br />
Target<br />
Met by<br />
LEA (Y/N)<br />
N/A<br />
N/A<br />
Page 1 of 5
LEA: 3520 - <strong>ARKANSAS</strong> RIVER <strong>EDUCATION</strong> SERVICE CO-OP<br />
Indicator 04: Out-of-School Suspensions and Expulsions (2009/10 school year)<br />
A) Suspension/Expulsion<br />
Percent difference of CWD with out-of- school suspensions and<br />
expulsions totaling greater than 10 days in a school year as<br />
compared to the same data for general education students in<br />
the district.<br />
B) Suspension/Expulsion by Race and Ethnicity<br />
Percent of districts that have: (a) a significant discrepancy, by race or<br />
ethnicity, in the rate of suspensions and expulsions of greater than 10<br />
days in a school year for children with IEPs; and (b) policies,<br />
procedures or practices that contribute to the significant discrepancy<br />
and do not comply with requirements relating to the development<br />
and implementation of IEPs, the use of positive behavioral<br />
interventions and supports, and procedural safeguards.<br />
Indicator 05: School Age (5-21) Least Restrictive Environment<br />
A) In the Regular Class 80% or more of the day<br />
Percent of CWD with<br />
IEPs receiving instruction<br />
in the regular class 80%<br />
or more of the day.<br />
State<br />
Rate<br />
State<br />
Target<br />
LEA<br />
Rate<br />
B) In the Regular Class less than 40% of the day<br />
Percent of CWD with<br />
IEPs receiving instruction<br />
in the regular class less<br />
than 60% of the day.<br />
53.87% 59.77%<br />
State<br />
Rate<br />
State<br />
Target<br />
12.42% 12.51%<br />
— —<br />
LEA<br />
Rate<br />
— —<br />
C) Other Settings outside the regular class<br />
Percent of CWD with IEPs served in<br />
public or private separate schools,<br />
residential placements, or<br />
homebound/hospital placements.<br />
State<br />
Rate<br />
State<br />
Target<br />
2.80% 2.56%<br />
Target Met<br />
by LEA (Y/N)<br />
N/A<br />
Target Met<br />
by LEA (Y/N)<br />
N/A<br />
LEA<br />
Rate<br />
— —<br />
Target Met<br />
by LEA(Y/N)<br />
N/A<br />
Indicator 06: Early Childhood (3-5) Least Restrictive Environment<br />
A) Regular Early Childhood Program<br />
Percent of children (aged 3 through 5) with IEPs attending a regular<br />
early childhood program and receiving the majority of special<br />
education and related services in the regular early childhood program<br />
Allowable<br />
Difference<br />
LEA: 3520 - <strong>ARKANSAS</strong> RIVER <strong>EDUCATION</strong> SERVICE CO-OP<br />
Indicator 07: Preschool (3-5) Outcomes<br />
a) Percent of preschool CWD<br />
children who did not<br />
improve functioning.<br />
b) Percent of preschool CWD<br />
who improved but whose<br />
functioning remained below<br />
same age peers.<br />
c) Percent of preschool CWD<br />
who improved at a level<br />
nearer to same aged peers.<br />
d) Percent of preschool CWD<br />
who improved functioning to<br />
reach a level comparable to<br />
same age peers.<br />
e) Percent of preschool CWD<br />
children who maintain<br />
functioning at a level<br />
comparable to same aged<br />
peers.<br />
Summary<br />
Statements<br />
1) Of those preschool<br />
children who entered<br />
the preschool program<br />
below age expectations<br />
in each Outcome, the<br />
percent who<br />
substantially increased<br />
their rate of growth by<br />
the time they turned 6<br />
years of age or exited<br />
the program.<br />
2) The percent of<br />
preschool children who<br />
were functioning<br />
within age expectations<br />
in each Outcome by the<br />
time they turned 6<br />
years of age or exited<br />
A) Positive Social -Emotional<br />
Skills*<br />
State<br />
Rate<br />
A) Positive Social -<br />
Emotional Skills<br />
(Including social<br />
relationships)<br />
State<br />
Rate<br />
2.14%<br />
5.31%<br />
25.97%<br />
38.22%<br />
28.36%<br />
State<br />
Target<br />
LEA<br />
Rate<br />
LEA<br />
Rate<br />
13.68%<br />
0.94%<br />
18.87%<br />
49.53%<br />
16.98%<br />
Target<br />
Met by<br />
LEA(Y/N)<br />
B) Acquisition and Use of<br />
Knowledge and Skills<br />
(Including early language/<br />
communication and early literacy)<br />
B) Acquisition and Use of<br />
Knowledge and Skills **<br />
State<br />
Rate<br />
1.75%<br />
6.59%<br />
34.23%<br />
43.51%<br />
13.92%<br />
State<br />
Target<br />
LEA<br />
Rate<br />
Target<br />
Met by<br />
LEA(Y/N)<br />
C) Use of Appropriate Behaviors<br />
to Meet Their Needs<br />
State<br />
Rate<br />
State<br />
Target<br />
LEA<br />
Rate<br />
Target<br />
Met by<br />
LEA(Y/N)<br />
89.61% 90.50% 82.39% N 90.31% 90.50% 90.50% Y 90.82% 92.50% 86.33% N<br />
66.58% 69.50% 66.51% N 57.43% 60.50% 31.60% N 76.69% 78.50% 76.89% N<br />
NOTE: * Including social relationships ** Including early language/ communication and early literacy<br />
Note: - - denotes not applicable<br />
State<br />
Rate<br />
LEA<br />
Rate<br />
8.02%<br />
0.94%<br />
59.43%<br />
25.94%<br />
5.66%<br />
C) Use of<br />
Appropriate<br />
Behaviors to<br />
Meet Their Needs<br />
State<br />
Rate<br />
4.51%<br />
17.34%<br />
41.72%<br />
34.97%<br />
LEA<br />
Rate<br />
1.46% 7.08%<br />
1.89%<br />
14.15%<br />
42.45%<br />
34.43%<br />
Page 3 of 5
LEA: 3520 - <strong>ARKANSAS</strong> RIVER <strong>EDUCATION</strong> SERVICE CO-OP<br />
Indicator 08: Parent Involvement<br />
Percent of surveyed<br />
parents who reported<br />
school facilitated parent<br />
involvement as a means<br />
of improving services<br />
and results for children<br />
with disabilities.<br />
Early Childhood<br />
(3-5)<br />
School Age<br />
(5-21)<br />
State<br />
Rate<br />
90.47%<br />
95.05%<br />
Indicator 09: Disproportionality - Eligibility<br />
Disproportionate representation of racial<br />
and ethnic groups in special education and<br />
related services that is a result of<br />
inappropriate identification (e.g.<br />
monitoring data, review of policies,<br />
practices, and procedures under 618(d),<br />
etc.).<br />
State<br />
Rate<br />
State<br />
Target<br />
88.00%<br />
96.00%<br />
State<br />
Target<br />
0.00% 0.00%<br />
LEA<br />
Rate<br />
83.74%<br />
— —<br />
Indicator 10: Disproportionality-Child with a Disability<br />
Disproportionate representation of racial<br />
and ethnic groups in specific disability<br />
categories that is a result of inappropriate<br />
identification (e.g. monitoring data, review<br />
of policies, practices, and procedures under<br />
618(d), etc.).<br />
Indicator 11: Child Find<br />
Percent of children with<br />
parental consent to evaluate<br />
who are evaluated within<br />
the State established timeline<br />
of 60 days.<br />
Overall<br />
(3-21)<br />
Early Childhood<br />
(3-5)<br />
School Age<br />
(5-21)<br />
State<br />
Rate<br />
0.00%<br />
Indicator 12: Early Childhood Transition<br />
Percent of children referred by Part C prior to<br />
age 3, who are found eligible for Part B, and<br />
who have an IEP developed and implemented<br />
by their third birthday.<br />
Note: - - denotes not applicable<br />
State<br />
Rate<br />
99.41%<br />
99.70%<br />
98.97%<br />
State<br />
Rate<br />
State<br />
Target<br />
0.00%<br />
State<br />
Target<br />
100.00%<br />
100.00%<br />
100.00%<br />
State<br />
Target<br />
Target Met by<br />
LEA (Y/N)<br />
N/A<br />
Target Met by<br />
LEA (Y/N)<br />
N/A<br />
LEA<br />
Rate<br />
100.00%<br />
100.00%<br />
— —<br />
LEA<br />
Rate<br />
Target Met by<br />
LEA (Y/N)<br />
N<br />
N/A<br />
Note: The target for Indicator 09 is to have zero percent<br />
(0%) of districts identified as having disproportionate<br />
representation as a result of inappropriate<br />
identification in eligibility.<br />
Note: The target for Indicator 10 is to have zero<br />
percent (0%) of districts identified as having<br />
disproportionate representation as a result of<br />
inappropriate identification in a disability<br />
category.<br />
Target Met by<br />
LEA (Y/N)<br />
Y<br />
N/A<br />
Target Met<br />
by LEA<br />
(Y/N)<br />
99.21% 100.00% - - N/A<br />
Y<br />
Note: * Indicates a zero reponse rate for the<br />
district.<br />
Page 4 of 5
LEA: 3520 - <strong>ARKANSAS</strong> RIVER <strong>EDUCATION</strong> SERVICE CO-OP<br />
Indicator 13: Secondary Transition<br />
Percent of youth with disabilities aged 16 and<br />
up with an IEP that includes coordinated,<br />
measurable, annual IEP goals and transition<br />
services that will reasonably enable the student<br />
to meet the post-secondary goals.<br />
Indicator 14: Post-School Outcomes<br />
A. Percent of youth enrolled in higher<br />
education within one year of leaving high<br />
school.<br />
State<br />
Rate<br />
State<br />
Target<br />
Note: Data for this Indicator is from the on-site monitoring of LEAs for the given year.<br />
B. Percent of youth enrolled in higher<br />
education or competitively employed<br />
within one year of leaving high school.<br />
C. Percent of youth enrolled in higher<br />
education or in some other postsecondary<br />
education or training program; or<br />
competitively employed or in some other<br />
employment within one year of leaving<br />
high school.<br />
State<br />
Rate<br />
Indicator 20: Reported Data-Timely and Accurate*<br />
District submitted<br />
required data elements<br />
on or before due dates;<br />
made revisions within<br />
the alloted reveiw<br />
periods.<br />
Accurate and Timely<br />
Data Submission<br />
Overall (3-21)<br />
Early Childhood (3-5)<br />
School Age (5-21)<br />
State<br />
Target<br />
100.00%<br />
100.00%<br />
100.00%<br />
State<br />
Target<br />
LEA<br />
Rate<br />
LEA<br />
Rate<br />
Target Met by<br />
LEA (Y/N)<br />
Target Met<br />
by LEA<br />
(Y/N)<br />
Target Met<br />
by LEA<br />
(Y/N)<br />
*Data reviewed for timely and accurate submissions included all APSCN cycle data except for personnel<br />
Note: - - denotes not applicable<br />
96.19 100.00 — — N/A<br />
14.53<br />
State<br />
Rate<br />
49.42<br />
State<br />
Rate<br />
54.07<br />
13.00<br />
State<br />
Target<br />
49.00<br />
State<br />
Target<br />
60.00<br />
Y<br />
Y<br />
N/A<br />
— —<br />
LEA<br />
Rate<br />
— —<br />
LEA<br />
Rate<br />
— —<br />
N/A<br />
Target Met<br />
by LEA<br />
(Y/N)<br />
N/A<br />
Target Met<br />
by LEA<br />
(Y/N)<br />
N/A<br />
Page 5 of 5
<strong>ARKANSAS</strong> <strong>SPECIAL</strong> <strong>EDUCATION</strong><br />
<strong>DISTRICT</strong> <strong>ANNUAL</strong> PERFORMANCE REPORT<br />
2010/11 School Year<br />
Publication Date: March 2012<br />
Each State must have in place a State Performance Plan (SPP) to evaluate the State's efforts to meet the requirements and<br />
purposes of the implementation of the Individuals with Disabilities Education Act (IDEA). The SPP is a six-year plan, which<br />
describes Arkansas's performance on 20 indicators. The Office of Special Education Programs in the U. S. Department of<br />
Education requires that States report annually to the public on the performance of each local education agency (LEA) on 14 of<br />
20 indicators as compared with targets established by the State in the SPP. Arkansas will report indicators 1 through 14 and<br />
20 for each LEA serving children with disabilities (CWD). Any LEA not meeting targets on compliance indicators (0% for<br />
Indicators 4B, 09 & 10 and 100% for Indicators 11, 12, 13, and 20) are non-compliant with IDEA.<br />
There are no report changes for the 2010/11 school year profile; However, it is important to recognize that: .<br />
1. Indicator 01 (Graduation) is reported a year in arrear (2009/10 graduates) and is based on a four-year cohort. This<br />
means the rate is a measure of students who entered in ninth grade and graduate in four years. The calculation is a<br />
requirement under Title I of the Elementary and Secondary Education Act (ESEA).<br />
2. Indicator 02 (Drop out) is reported a year in arrear. This means the rate is a measure of students who dropped out in<br />
the 2009/10 school year. The Indicator 02 data are aligned with the Common Core of Data (CCD) requirements for<br />
grades 7-12.<br />
3. Indicator 04A and 4B (Suspension/Expulsion) is reported a year in arrear. This means the rate is a measure of<br />
students who had out-of-school suspensions and/or expulsions totaling more than 10 days.<br />
For a complete description of all the Indicators, please visit the special education website at<br />
http://arksped.k12.ar.us/sections/policy.html<br />
LEA: 3601 - CLARKSVILLE SCHOOL <strong>DISTRICT</strong><br />
Indicator 01: Graduation Rates (2009/10 school year) Indicator 02: Dropout Rates (2009/10 school year)<br />
Percent of youth<br />
with IEPs<br />
graduating from<br />
high school with a<br />
regular diploma<br />
State<br />
Rate<br />
State<br />
Target<br />
75.76% 85.00%<br />
LEA<br />
Rate<br />
95.00%<br />
Target Met<br />
by LEA<br />
(Y/N)<br />
Y<br />
Percent of<br />
youth with<br />
IEPs dropping<br />
out of high<br />
school<br />
State<br />
Rate<br />
Indicator 03: Assessment on Statewide Benchmark Exam (grades 3-8, 11)<br />
A) Adequate Yearly Progress<br />
n=40<br />
Literacy<br />
Mathematics<br />
Met Disability Subgroup "n"<br />
for Reporting Purposes (Y/N)<br />
State Target for % of Districts Meeting<br />
AYP for Disability Subgroup<br />
State<br />
Target<br />
3.06% 4.20%<br />
LEA<br />
Rate<br />
2.83%<br />
% of Districts Meeting AYP<br />
for Disability Subgroup<br />
Target Met by<br />
LEA (Y/N)<br />
Y<br />
Target Met by<br />
LEA(Y/N)<br />
Overall N 17.15% 6.25%<br />
NA<br />
N<br />
N<br />
Note: For a district to qualify as having a disability subgroup it must have a minimum of 40 (n=40) students with disabilities in a school building.<br />
B) Participation<br />
Participation Rate: # of<br />
CWD Tested ÷ # of CWD<br />
Enrolled in grades tested.<br />
Participation Rate: Literacy<br />
Participation Rate: Math<br />
Note: - - denotes not applicable<br />
State<br />
Rate<br />
98.78%<br />
State<br />
Target<br />
95.00%<br />
LEA<br />
Rate<br />
100.00%<br />
Target Met<br />
by LEA (Y/N)<br />
98.61% 95.00% 100.00% Y<br />
Y<br />
C) Performance Proficiency<br />
Percent of CWD Scoring<br />
Proficient or Above<br />
Proficiency Rate: Literacy<br />
Proficiency Rate:<br />
Mathematics<br />
16.00%<br />
16.00%<br />
State<br />
Rate<br />
31.49%<br />
44.86%<br />
State<br />
Target<br />
45.22%<br />
51.14%<br />
LEA<br />
Rate<br />
36.55%<br />
47.30%<br />
NA<br />
NA<br />
Target<br />
Met by<br />
LEA (Y/N)<br />
N<br />
N<br />
Page 1 of 5
LEA: 3601 - CLARKSVILLE SCHOOL <strong>DISTRICT</strong><br />
Indicator 04: Out-of-School Suspensions and Expulsions (2009/10 school year)<br />
A) Suspension/Expulsion<br />
Percent difference of CWD with out-of- school suspensions and<br />
expulsions totaling greater than 10 days in a school year as<br />
compared to the same data for general education students in<br />
the district.<br />
B) Suspension/Expulsion by Race and Ethnicity<br />
Percent of districts that have: (a) a significant discrepancy, by race or<br />
ethnicity, in the rate of suspensions and expulsions of greater than 10<br />
days in a school year for children with IEPs; and (b) policies,<br />
procedures or practices that contribute to the significant discrepancy<br />
and do not comply with requirements relating to the development<br />
and implementation of IEPs, the use of positive behavioral<br />
interventions and supports, and procedural safeguards.<br />
Indicator 05: School Age (5-21) Least Restrictive Environment<br />
A) In the Regular Class 80% or more of the day<br />
Percent of CWD with<br />
IEPs receiving instruction<br />
in the regular class 80%<br />
or more of the day.<br />
State<br />
Rate<br />
State<br />
Target<br />
LEA<br />
Rate<br />
B) In the Regular Class less than 40% of the day<br />
Percent of CWD with<br />
IEPs receiving instruction<br />
in the regular class less<br />
than 60% of the day.<br />
53.87% 59.77%<br />
State<br />
Rate<br />
State<br />
Target<br />
12.42% 12.51%<br />
45.19%<br />
LEA<br />
Rate<br />
9.63%<br />
C) Other Settings outside the regular class<br />
Percent of CWD with IEPs served in<br />
public or private separate schools,<br />
residential placements, or<br />
homebound/hospital placements.<br />
State<br />
Rate<br />
State<br />
Target<br />
2.80% 2.56%<br />
Target Met<br />
by LEA (Y/N)<br />
N<br />
Target Met<br />
by LEA (Y/N)<br />
Y<br />
LEA<br />
Rate<br />
0.74%<br />
Target Met<br />
by LEA(Y/N)<br />
Indicator 06: Early Childhood (3-5) Least Restrictive Environment<br />
A) Regular Early Childhood Program<br />
Percent of children (aged 3 through 5) with IEPs attending a regular<br />
early childhood program and receiving the majority of special<br />
education and related services in the regular early childhood program<br />
Allowable<br />
Difference<br />
LEA: 3601 - CLARKSVILLE SCHOOL <strong>DISTRICT</strong><br />
Indicator 07: Preschool (3-5) Outcomes<br />
a) Percent of preschool CWD<br />
children who did not<br />
improve functioning.<br />
b) Percent of preschool CWD<br />
who improved but whose<br />
functioning remained below<br />
same age peers.<br />
c) Percent of preschool CWD<br />
who improved at a level<br />
nearer to same aged peers.<br />
d) Percent of preschool CWD<br />
who improved functioning to<br />
reach a level comparable to<br />
same age peers.<br />
e) Percent of preschool CWD<br />
children who maintain<br />
functioning at a level<br />
comparable to same aged<br />
peers.<br />
Summary<br />
Statements<br />
1) Of those preschool<br />
children who entered<br />
the preschool program<br />
below age expectations<br />
in each Outcome, the<br />
percent who<br />
substantially increased<br />
their rate of growth by<br />
the time they turned 6<br />
years of age or exited<br />
the program.<br />
2) The percent of<br />
preschool children who<br />
were functioning<br />
within age expectations<br />
in each Outcome by the<br />
time they turned 6<br />
years of age or exited<br />
A) Positive Social -Emotional<br />
Skills*<br />
State<br />
Rate<br />
A) Positive Social -<br />
Emotional Skills<br />
(Including social<br />
relationships)<br />
State<br />
Rate<br />
2.14%<br />
5.31%<br />
25.97%<br />
38.22%<br />
28.36%<br />
State<br />
Target<br />
LEA<br />
Rate<br />
LEA<br />
Rate<br />
— —<br />
— —<br />
— —<br />
— —<br />
— —<br />
Target<br />
Met by<br />
LEA(Y/N)<br />
B) Acquisition and Use of<br />
Knowledge and Skills<br />
(Including early language/<br />
communication and early literacy)<br />
B) Acquisition and Use of<br />
Knowledge and Skills **<br />
State<br />
Rate<br />
1.75%<br />
6.59%<br />
34.23%<br />
43.51%<br />
13.92%<br />
State<br />
Target<br />
LEA<br />
Rate<br />
Target<br />
Met by<br />
LEA(Y/N)<br />
C) Use of Appropriate Behaviors<br />
to Meet Their Needs<br />
State<br />
Rate<br />
State<br />
Target<br />
LEA<br />
Rate<br />
Target<br />
Met by<br />
LEA(Y/N)<br />
89.61% 90.50% — — N/A 90.31% 90.50% — — N/A 90.82% 92.50% — — N/A<br />
66.58% 69.50% — — N/A 57.43% 60.50% — — N/A 76.69% 78.50% — — N/A<br />
NOTE: * Including social relationships ** Including early language/ communication and early literacy<br />
Note: - - denotes not applicable<br />
State<br />
Rate<br />
LEA<br />
Rate<br />
— —<br />
— —<br />
— —<br />
— —<br />
— —<br />
C) Use of<br />
Appropriate<br />
Behaviors to<br />
Meet Their Needs<br />
State<br />
Rate<br />
4.51%<br />
17.34%<br />
41.72%<br />
34.97%<br />
LEA<br />
Rate<br />
1.46% — —<br />
— —<br />
— —<br />
— —<br />
— —<br />
Page 3 of 5
LEA: 3601 - CLARKSVILLE SCHOOL <strong>DISTRICT</strong><br />
Indicator 08: Parent Involvement<br />
Percent of surveyed<br />
parents who reported<br />
school facilitated parent<br />
involvement as a means<br />
of improving services<br />
and results for children<br />
with disabilities.<br />
Early Childhood<br />
(3-5)<br />
School Age<br />
(5-21)<br />
State<br />
Rate<br />
90.47%<br />
95.05%<br />
Indicator 09: Disproportionality - Eligibility<br />
Disproportionate representation of racial<br />
and ethnic groups in special education and<br />
related services that is a result of<br />
inappropriate identification (e.g.<br />
monitoring data, review of policies,<br />
practices, and procedures under 618(d),<br />
etc.).<br />
State<br />
Rate<br />
State<br />
Target<br />
88.00%<br />
96.00%<br />
State<br />
Target<br />
0.00% 0.00%<br />
LEA<br />
Rate<br />
— —<br />
94.93%<br />
Indicator 10: Disproportionality-Child with a Disability<br />
Disproportionate representation of racial<br />
and ethnic groups in specific disability<br />
categories that is a result of inappropriate<br />
identification (e.g. monitoring data, review<br />
of policies, practices, and procedures under<br />
618(d), etc.).<br />
Indicator 11: Child Find<br />
Percent of children with<br />
parental consent to evaluate<br />
who are evaluated within<br />
the State established timeline<br />
of 60 days.<br />
Overall<br />
(3-21)<br />
Early Childhood<br />
(3-5)<br />
School Age<br />
(5-21)<br />
State<br />
Rate<br />
0.00%<br />
Indicator 12: Early Childhood Transition<br />
Percent of children referred by Part C prior to<br />
age 3, who are found eligible for Part B, and<br />
who have an IEP developed and implemented<br />
by their third birthday.<br />
Note: - - denotes not applicable<br />
State<br />
Rate<br />
99.41%<br />
99.70%<br />
98.97%<br />
State<br />
Rate<br />
State<br />
Target<br />
0.00%<br />
State<br />
Target<br />
100.00%<br />
100.00%<br />
100.00%<br />
State<br />
Target<br />
Target Met by<br />
LEA (Y/N)<br />
Y<br />
Target Met by<br />
LEA (Y/N)<br />
Y<br />
LEA<br />
Rate<br />
100.00%<br />
— —<br />
100.00%<br />
LEA<br />
Rate<br />
Target Met by<br />
LEA (Y/N)<br />
N/A<br />
N<br />
Note: The target for Indicator 09 is to have zero percent<br />
(0%) of districts identified as having disproportionate<br />
representation as a result of inappropriate<br />
identification in eligibility.<br />
Note: The target for Indicator 10 is to have zero<br />
percent (0%) of districts identified as having<br />
disproportionate representation as a result of<br />
inappropriate identification in a disability<br />
category.<br />
Target Met by<br />
LEA (Y/N)<br />
N/A<br />
Y<br />
Target Met<br />
by LEA<br />
(Y/N)<br />
99.21% 100.00% - - N/A<br />
Y<br />
Note: * Indicates a zero reponse rate for the<br />
district.<br />
Page 4 of 5
LEA: 3601 - CLARKSVILLE SCHOOL <strong>DISTRICT</strong><br />
Indicator 13: Secondary Transition<br />
Percent of youth with disabilities aged 16 and<br />
up with an IEP that includes coordinated,<br />
measurable, annual IEP goals and transition<br />
services that will reasonably enable the student<br />
to meet the post-secondary goals.<br />
Indicator 14: Post-School Outcomes<br />
A. Percent of youth enrolled in higher<br />
education within one year of leaving high<br />
school.<br />
State<br />
Rate<br />
State<br />
Target<br />
Note: Data for this Indicator is from the on-site monitoring of LEAs for the given year.<br />
B. Percent of youth enrolled in higher<br />
education or competitively employed<br />
within one year of leaving high school.<br />
C. Percent of youth enrolled in higher<br />
education or in some other postsecondary<br />
education or training program; or<br />
competitively employed or in some other<br />
employment within one year of leaving<br />
high school.<br />
State<br />
Rate<br />
Indicator 20: Reported Data-Timely and Accurate*<br />
District submitted<br />
required data elements<br />
on or before due dates;<br />
made revisions within<br />
the alloted reveiw<br />
periods.<br />
Accurate and Timely<br />
Data Submission<br />
Overall (3-21)<br />
Early Childhood (3-5)<br />
School Age (5-21)<br />
State<br />
Target<br />
100.00%<br />
100.00%<br />
100.00%<br />
State<br />
Target<br />
LEA<br />
Rate<br />
LEA<br />
Rate<br />
Target Met by<br />
LEA (Y/N)<br />
Target Met<br />
by LEA<br />
(Y/N)<br />
Target Met<br />
by LEA<br />
(Y/N)<br />
*Data reviewed for timely and accurate submissions included all APSCN cycle data except for personnel<br />
Note: - - denotes not applicable<br />
96.19 100.00 100.00% Y<br />
14.53<br />
State<br />
Rate<br />
49.42<br />
State<br />
Rate<br />
54.07<br />
13.00<br />
State<br />
Target<br />
49.00<br />
State<br />
Target<br />
60.00<br />
Y<br />
N/A<br />
Y<br />
— —<br />
LEA<br />
Rate<br />
— —<br />
LEA<br />
Rate<br />
— —<br />
N/A<br />
Target Met<br />
by LEA<br />
(Y/N)<br />
N/A<br />
Target Met<br />
by LEA<br />
(Y/N)<br />
N/A<br />
Page 5 of 5
LEA: 3604 - LAMAR SCHOOL <strong>DISTRICT</strong><br />
<strong>ARKANSAS</strong> <strong>SPECIAL</strong> <strong>EDUCATION</strong><br />
<strong>DISTRICT</strong> <strong>ANNUAL</strong> PERFORMANCE REPORT<br />
2010/11 School Year<br />
Publication Date: March 2012<br />
Each State must have in place a State Performance Plan (SPP) to evaluate the State's efforts to meet the requirements and<br />
purposes of the implementation of the Individuals with Disabilities Education Act (IDEA). The SPP is a six-year plan, which<br />
describes Arkansas's performance on 20 indicators. The Office of Special Education Programs in the U. S. Department of<br />
Education requires that States report annually to the public on the performance of each local education agency (LEA) on 14 of<br />
20 indicators as compared with targets established by the State in the SPP. Arkansas will report indicators 1 through 14 and<br />
20 for each LEA serving children with disabilities (CWD). Any LEA not meeting targets on compliance indicators (0% for<br />
Indicators 4B, 09 & 10 and 100% for Indicators 11, 12, 13, and 20) are non-compliant with IDEA.<br />
There are no report changes for the 2010/11 school year profile; However, it is important to recognize that: .<br />
1. Indicator 01 (Graduation) is reported a year in arrear (2009/10 graduates) and is based on a four-year cohort. This<br />
means the rate is a measure of students who entered in ninth grade and graduate in four years. The calculation is a<br />
requirement under Title I of the Elementary and Secondary Education Act (ESEA).<br />
2. Indicator 02 (Drop out) is reported a year in arrear. This means the rate is a measure of students who dropped out in<br />
the 2009/10 school year. The Indicator 02 data are aligned with the Common Core of Data (CCD) requirements for<br />
grades 7-12.<br />
3. Indicator 04A and 4B (Suspension/Expulsion) is reported a year in arrear. This means the rate is a measure of<br />
students who had out-of-school suspensions and/or expulsions totaling more than 10 days.<br />
Percent of youth<br />
with IEPs<br />
graduating from<br />
high school with a<br />
regular diploma<br />
For a complete description of all the Indicators, please visit the special education website at<br />
http://arksped.k12.ar.us/sections/policy.html<br />
Indicator 01: Graduation Rates (2009/10 school year) Indicator 02: Dropout Rates (2009/10 school year)<br />
State<br />
Rate<br />
State<br />
Target<br />
75.76% 85.00%<br />
LEA<br />
Rate<br />
90.00%<br />
Target Met<br />
by LEA<br />
(Y/N)<br />
Y<br />
Percent of<br />
youth with<br />
IEPs dropping<br />
out of high<br />
school<br />
State<br />
Rate<br />
Indicator 03: Assessment on Statewide Benchmark Exam (grades 3-8, 11)<br />
A) Adequate Yearly Progress<br />
n=40<br />
Literacy<br />
Mathematics<br />
Met Disability Subgroup "n"<br />
for Reporting Purposes (Y/N)<br />
State Target for % of Districts Meeting<br />
AYP for Disability Subgroup<br />
State<br />
Target<br />
3.06% 4.20%<br />
LEA<br />
Rate<br />
2.33%<br />
% of Districts Meeting AYP<br />
for Disability Subgroup<br />
Target Met by<br />
LEA (Y/N)<br />
Y<br />
Target Met by<br />
LEA(Y/N)<br />
Overall N 17.15% 6.25%<br />
NA<br />
N<br />
N<br />
Note: For a district to qualify as having a disability subgroup it must have a minimum of 40 (n=40) students with disabilities in a school building.<br />
B) Participation<br />
Participation Rate: # of<br />
CWD Tested ÷ # of CWD<br />
Enrolled in grades tested.<br />
Participation Rate: Literacy<br />
Participation Rate: Math<br />
Note: - - denotes not applicable<br />
State<br />
Rate<br />
98.78%<br />
State<br />
Target<br />
95.00%<br />
LEA<br />
Rate<br />
98.31%<br />
Target Met<br />
by LEA (Y/N)<br />
98.61% 95.00% 98.18% Y<br />
Y<br />
C) Performance Proficiency<br />
Percent of CWD Scoring<br />
Proficient or Above<br />
Proficiency Rate: Literacy<br />
Proficiency Rate:<br />
Mathematics<br />
16.00%<br />
16.00%<br />
State<br />
Rate<br />
31.49%<br />
44.86%<br />
State<br />
Target<br />
45.22%<br />
51.14%<br />
LEA<br />
Rate<br />
34.00%<br />
45.65%<br />
NA<br />
NA<br />
Target<br />
Met by<br />
LEA (Y/N)<br />
N<br />
N<br />
Page 1 of 5
LEA: 3604 - LAMAR SCHOOL <strong>DISTRICT</strong><br />
Indicator 04: Out-of-School Suspensions and Expulsions (2009/10 school year)<br />
A) Suspension/Expulsion<br />
Percent difference of CWD with out-of- school suspensions and<br />
expulsions totaling greater than 10 days in a school year as<br />
compared to the same data for general education students in<br />
the district.<br />
B) Suspension/Expulsion by Race and Ethnicity<br />
Percent of districts that have: (a) a significant discrepancy, by race or<br />
ethnicity, in the rate of suspensions and expulsions of greater than 10<br />
days in a school year for children with IEPs; and (b) policies,<br />
procedures or practices that contribute to the significant discrepancy<br />
and do not comply with requirements relating to the development<br />
and implementation of IEPs, the use of positive behavioral<br />
interventions and supports, and procedural safeguards.<br />
Indicator 05: School Age (5-21) Least Restrictive Environment<br />
A) In the Regular Class 80% or more of the day<br />
Percent of CWD with<br />
IEPs receiving instruction<br />
in the regular class 80%<br />
or more of the day.<br />
State<br />
Rate<br />
State<br />
Target<br />
LEA<br />
Rate<br />
B) In the Regular Class less than 40% of the day<br />
Percent of CWD with<br />
IEPs receiving instruction<br />
in the regular class less<br />
than 60% of the day.<br />
53.87% 59.77%<br />
State<br />
Rate<br />
State<br />
Target<br />
12.42% 12.51%<br />
49.06%<br />
LEA<br />
Rate<br />
13.21%<br />
C) Other Settings outside the regular class<br />
Percent of CWD with IEPs served in<br />
public or private separate schools,<br />
residential placements, or<br />
homebound/hospital placements.<br />
State<br />
Rate<br />
State<br />
Target<br />
2.80% 2.56%<br />
Target Met<br />
by LEA (Y/N)<br />
N<br />
Target Met<br />
by LEA (Y/N)<br />
N<br />
LEA<br />
Rate<br />
0.94%<br />
Target Met<br />
by LEA(Y/N)<br />
Indicator 06: Early Childhood (3-5) Least Restrictive Environment<br />
A) Regular Early Childhood Program<br />
Percent of children (aged 3 through 5) with IEPs attending a regular<br />
early childhood program and receiving the majority of special<br />
education and related services in the regular early childhood program<br />
Allowable<br />
Difference<br />
LEA: 3604 - LAMAR SCHOOL <strong>DISTRICT</strong><br />
Indicator 07: Preschool (3-5) Outcomes<br />
a) Percent of preschool CWD<br />
children who did not<br />
improve functioning.<br />
b) Percent of preschool CWD<br />
who improved but whose<br />
functioning remained below<br />
same age peers.<br />
c) Percent of preschool CWD<br />
who improved at a level<br />
nearer to same aged peers.<br />
d) Percent of preschool CWD<br />
who improved functioning to<br />
reach a level comparable to<br />
same age peers.<br />
e) Percent of preschool CWD<br />
children who maintain<br />
functioning at a level<br />
comparable to same aged<br />
peers.<br />
Summary<br />
Statements<br />
1) Of those preschool<br />
children who entered<br />
the preschool program<br />
below age expectations<br />
in each Outcome, the<br />
percent who<br />
substantially increased<br />
their rate of growth by<br />
the time they turned 6<br />
years of age or exited<br />
the program.<br />
2) The percent of<br />
preschool children who<br />
were functioning<br />
within age expectations<br />
in each Outcome by the<br />
time they turned 6<br />
years of age or exited<br />
A) Positive Social -Emotional<br />
Skills*<br />
State<br />
Rate<br />
A) Positive Social -<br />
Emotional Skills<br />
(Including social<br />
relationships)<br />
State<br />
Rate<br />
2.14%<br />
5.31%<br />
25.97%<br />
38.22%<br />
28.36%<br />
State<br />
Target<br />
LEA<br />
Rate<br />
LEA<br />
Rate<br />
— —<br />
— —<br />
— —<br />
— —<br />
— —<br />
Target<br />
Met by<br />
LEA(Y/N)<br />
B) Acquisition and Use of<br />
Knowledge and Skills<br />
(Including early language/<br />
communication and early literacy)<br />
B) Acquisition and Use of<br />
Knowledge and Skills **<br />
State<br />
Rate<br />
1.75%<br />
6.59%<br />
34.23%<br />
43.51%<br />
13.92%<br />
State<br />
Target<br />
LEA<br />
Rate<br />
Target<br />
Met by<br />
LEA(Y/N)<br />
C) Use of Appropriate Behaviors<br />
to Meet Their Needs<br />
State<br />
Rate<br />
State<br />
Target<br />
LEA<br />
Rate<br />
Target<br />
Met by<br />
LEA(Y/N)<br />
89.61% 90.50% — — N/A 90.31% 90.50% — — N/A 90.82% 92.50% — — N/A<br />
66.58% 69.50% — — N/A 57.43% 60.50% — — N/A 76.69% 78.50% — — N/A<br />
NOTE: * Including social relationships ** Including early language/ communication and early literacy<br />
Note: - - denotes not applicable<br />
State<br />
Rate<br />
LEA<br />
Rate<br />
— —<br />
— —<br />
— —<br />
— —<br />
— —<br />
C) Use of<br />
Appropriate<br />
Behaviors to<br />
Meet Their Needs<br />
State<br />
Rate<br />
4.51%<br />
17.34%<br />
41.72%<br />
34.97%<br />
LEA<br />
Rate<br />
1.46% — —<br />
— —<br />
— —<br />
— —<br />
— —<br />
Page 3 of 5
LEA: 3604 - LAMAR SCHOOL <strong>DISTRICT</strong><br />
Indicator 08: Parent Involvement<br />
Percent of surveyed<br />
parents who reported<br />
school facilitated parent<br />
involvement as a means<br />
of improving services<br />
and results for children<br />
with disabilities.<br />
Early Childhood<br />
(3-5)<br />
School Age<br />
(5-21)<br />
State<br />
Rate<br />
90.47%<br />
95.05%<br />
Indicator 09: Disproportionality - Eligibility<br />
Disproportionate representation of racial<br />
and ethnic groups in special education and<br />
related services that is a result of<br />
inappropriate identification (e.g.<br />
monitoring data, review of policies,<br />
practices, and procedures under 618(d),<br />
etc.).<br />
State<br />
Rate<br />
State<br />
Target<br />
88.00%<br />
96.00%<br />
State<br />
Target<br />
0.00% 0.00%<br />
LEA<br />
Rate<br />
— —<br />
100.00%<br />
Indicator 10: Disproportionality-Child with a Disability<br />
Disproportionate representation of racial<br />
and ethnic groups in specific disability<br />
categories that is a result of inappropriate<br />
identification (e.g. monitoring data, review<br />
of policies, practices, and procedures under<br />
618(d), etc.).<br />
Indicator 11: Child Find<br />
Percent of children with<br />
parental consent to evaluate<br />
who are evaluated within<br />
the State established timeline<br />
of 60 days.<br />
Overall<br />
(3-21)<br />
Early Childhood<br />
(3-5)<br />
School Age<br />
(5-21)<br />
State<br />
Rate<br />
0.00%<br />
Indicator 12: Early Childhood Transition<br />
Percent of children referred by Part C prior to<br />
age 3, who are found eligible for Part B, and<br />
who have an IEP developed and implemented<br />
by their third birthday.<br />
Note: - - denotes not applicable<br />
State<br />
Rate<br />
99.41%<br />
99.70%<br />
98.97%<br />
State<br />
Rate<br />
State<br />
Target<br />
0.00%<br />
State<br />
Target<br />
100.00%<br />
100.00%<br />
100.00%<br />
State<br />
Target<br />
Target Met by<br />
LEA (Y/N)<br />
Y<br />
Target Met by<br />
LEA (Y/N)<br />
Y<br />
LEA<br />
Rate<br />
100.00%<br />
— —<br />
100.00%<br />
LEA<br />
Rate<br />
Target Met by<br />
LEA (Y/N)<br />
N/A<br />
Y<br />
Note: The target for Indicator 09 is to have zero percent<br />
(0%) of districts identified as having disproportionate<br />
representation as a result of inappropriate<br />
identification in eligibility.<br />
Note: The target for Indicator 10 is to have zero<br />
percent (0%) of districts identified as having<br />
disproportionate representation as a result of<br />
inappropriate identification in a disability<br />
category.<br />
Target Met by<br />
LEA (Y/N)<br />
N/A<br />
Y<br />
Target Met<br />
by LEA<br />
(Y/N)<br />
99.21% 100.00% - - N/A<br />
Y<br />
Note: * Indicates a zero reponse rate for the<br />
district.<br />
Page 4 of 5
LEA: 3604 - LAMAR SCHOOL <strong>DISTRICT</strong><br />
Indicator 13: Secondary Transition<br />
Percent of youth with disabilities aged 16 and<br />
up with an IEP that includes coordinated,<br />
measurable, annual IEP goals and transition<br />
services that will reasonably enable the student<br />
to meet the post-secondary goals.<br />
Indicator 14: Post-School Outcomes<br />
A. Percent of youth enrolled in higher<br />
education within one year of leaving high<br />
school.<br />
State<br />
Rate<br />
State<br />
Target<br />
Note: Data for this Indicator is from the on-site monitoring of LEAs for the given year.<br />
B. Percent of youth enrolled in higher<br />
education or competitively employed<br />
within one year of leaving high school.<br />
C. Percent of youth enrolled in higher<br />
education or in some other postsecondary<br />
education or training program; or<br />
competitively employed or in some other<br />
employment within one year of leaving<br />
high school.<br />
State<br />
Rate<br />
Indicator 20: Reported Data-Timely and Accurate*<br />
District submitted<br />
required data elements<br />
on or before due dates;<br />
made revisions within<br />
the alloted reveiw<br />
periods.<br />
Accurate and Timely<br />
Data Submission<br />
Overall (3-21)<br />
Early Childhood (3-5)<br />
School Age (5-21)<br />
State<br />
Target<br />
100.00%<br />
100.00%<br />
100.00%<br />
State<br />
Target<br />
LEA<br />
Rate<br />
LEA<br />
Rate<br />
Target Met by<br />
LEA (Y/N)<br />
Target Met<br />
by LEA<br />
(Y/N)<br />
Target Met<br />
by LEA<br />
(Y/N)<br />
*Data reviewed for timely and accurate submissions included all APSCN cycle data except for personnel<br />
Note: - - denotes not applicable<br />
96.19 100.00 — — N/A<br />
14.53<br />
State<br />
Rate<br />
49.42<br />
State<br />
Rate<br />
54.07<br />
13.00<br />
State<br />
Target<br />
49.00<br />
State<br />
Target<br />
60.00<br />
Y<br />
N/A<br />
Y<br />
— —<br />
LEA<br />
Rate<br />
— —<br />
LEA<br />
Rate<br />
— —<br />
N/A<br />
Target Met<br />
by LEA<br />
(Y/N)<br />
N/A<br />
Target Met<br />
by LEA<br />
(Y/N)<br />
N/A<br />
Page 5 of 5
LEA: 3606 - WESTSIDE SCHOOL <strong>DISTRICT</strong><br />
<strong>ARKANSAS</strong> <strong>SPECIAL</strong> <strong>EDUCATION</strong><br />
<strong>DISTRICT</strong> <strong>ANNUAL</strong> PERFORMANCE REPORT<br />
2010/11 School Year<br />
Publication Date: March 2012<br />
Each State must have in place a State Performance Plan (SPP) to evaluate the State's efforts to meet the requirements and<br />
purposes of the implementation of the Individuals with Disabilities Education Act (IDEA). The SPP is a six-year plan, which<br />
describes Arkansas's performance on 20 indicators. The Office of Special Education Programs in the U. S. Department of<br />
Education requires that States report annually to the public on the performance of each local education agency (LEA) on 14 of<br />
20 indicators as compared with targets established by the State in the SPP. Arkansas will report indicators 1 through 14 and<br />
20 for each LEA serving children with disabilities (CWD). Any LEA not meeting targets on compliance indicators (0% for<br />
Indicators 4B, 09 & 10 and 100% for Indicators 11, 12, 13, and 20) are non-compliant with IDEA.<br />
There are no report changes for the 2010/11 school year profile; However, it is important to recognize that: .<br />
1. Indicator 01 (Graduation) is reported a year in arrear (2009/10 graduates) and is based on a four-year cohort. This<br />
means the rate is a measure of students who entered in ninth grade and graduate in four years. The calculation is a<br />
requirement under Title I of the Elementary and Secondary Education Act (ESEA).<br />
2. Indicator 02 (Drop out) is reported a year in arrear. This means the rate is a measure of students who dropped out in<br />
the 2009/10 school year. The Indicator 02 data are aligned with the Common Core of Data (CCD) requirements for<br />
grades 7-12.<br />
3. Indicator 04A and 4B (Suspension/Expulsion) is reported a year in arrear. This means the rate is a measure of<br />
students who had out-of-school suspensions and/or expulsions totaling more than 10 days.<br />
Percent of youth<br />
with IEPs<br />
graduating from<br />
high school with a<br />
regular diploma<br />
For a complete description of all the Indicators, please visit the special education website at<br />
http://arksped.k12.ar.us/sections/policy.html<br />
Indicator 01: Graduation Rates (2009/10 school year) Indicator 02: Dropout Rates (2009/10 school year)<br />
State<br />
Rate<br />
State<br />
Target<br />
75.76% 85.00%<br />
LEA<br />
Rate<br />
50.00%<br />
Target Met<br />
by LEA<br />
(Y/N)<br />
N<br />
Percent of<br />
youth with<br />
IEPs dropping<br />
out of high<br />
school<br />
State<br />
Rate<br />
Indicator 03: Assessment on Statewide Benchmark Exam (grades 3-8, 11)<br />
A) Adequate Yearly Progress<br />
n=40<br />
Literacy<br />
Mathematics<br />
Met Disability Subgroup "n"<br />
for Reporting Purposes (Y/N)<br />
State Target for % of Districts Meeting<br />
AYP for Disability Subgroup<br />
State<br />
Target<br />
3.06% 4.20%<br />
LEA<br />
Rate<br />
0.00%<br />
% of Districts Meeting AYP<br />
for Disability Subgroup<br />
Target Met by<br />
LEA (Y/N)<br />
Y<br />
Target Met by<br />
LEA(Y/N)<br />
Overall N 17.15% 6.25%<br />
NA<br />
N<br />
N<br />
Note: For a district to qualify as having a disability subgroup it must have a minimum of 40 (n=40) students with disabilities in a school building.<br />
B) Participation<br />
Participation Rate: # of<br />
CWD Tested ÷ # of CWD<br />
Enrolled in grades tested.<br />
Participation Rate: Literacy<br />
Participation Rate: Math<br />
Note: - - denotes not applicable<br />
State<br />
Rate<br />
98.78%<br />
State<br />
Target<br />
95.00%<br />
LEA<br />
Rate<br />
100.00%<br />
Target Met<br />
by LEA (Y/N)<br />
98.61% 95.00% 100.00% Y<br />
Y<br />
C) Performance Proficiency<br />
Percent of CWD Scoring<br />
Proficient or Above<br />
Proficiency Rate: Literacy<br />
Proficiency Rate:<br />
Mathematics<br />
16.00%<br />
16.00%<br />
State<br />
Rate<br />
31.49%<br />
44.86%<br />
State<br />
Target<br />
45.22%<br />
51.14%<br />
LEA<br />
Rate<br />
25.58%<br />
48.00%<br />
NA<br />
NA<br />
Target<br />
Met by<br />
LEA (Y/N)<br />
N<br />
N<br />
Page 1 of 5
LEA: 3606 - WESTSIDE SCHOOL <strong>DISTRICT</strong><br />
Indicator 04: Out-of-School Suspensions and Expulsions (2009/10 school year)<br />
A) Suspension/Expulsion<br />
Percent difference of CWD with out-of- school suspensions and<br />
expulsions totaling greater than 10 days in a school year as<br />
compared to the same data for general education students in<br />
the district.<br />
B) Suspension/Expulsion by Race and Ethnicity<br />
Percent of districts that have: (a) a significant discrepancy, by race or<br />
ethnicity, in the rate of suspensions and expulsions of greater than 10<br />
days in a school year for children with IEPs; and (b) policies,<br />
procedures or practices that contribute to the significant discrepancy<br />
and do not comply with requirements relating to the development<br />
and implementation of IEPs, the use of positive behavioral<br />
interventions and supports, and procedural safeguards.<br />
Indicator 05: School Age (5-21) Least Restrictive Environment<br />
A) In the Regular Class 80% or more of the day<br />
Percent of CWD with<br />
IEPs receiving instruction<br />
in the regular class 80%<br />
or more of the day.<br />
State<br />
Rate<br />
State<br />
Target<br />
LEA<br />
Rate<br />
B) In the Regular Class less than 40% of the day<br />
Percent of CWD with<br />
IEPs receiving instruction<br />
in the regular class less<br />
than 60% of the day.<br />
53.87% 59.77%<br />
State<br />
Rate<br />
State<br />
Target<br />
12.42% 12.51%<br />
47.19%<br />
LEA<br />
Rate<br />
7.87%<br />
C) Other Settings outside the regular class<br />
Percent of CWD with IEPs served in<br />
public or private separate schools,<br />
residential placements, or<br />
homebound/hospital placements.<br />
State<br />
Rate<br />
State<br />
Target<br />
2.80% 2.56%<br />
Target Met<br />
by LEA (Y/N)<br />
N<br />
Target Met<br />
by LEA (Y/N)<br />
Y<br />
LEA<br />
Rate<br />
1.12%<br />
Target Met<br />
by LEA(Y/N)<br />
Indicator 06: Early Childhood (3-5) Least Restrictive Environment<br />
A) Regular Early Childhood Program<br />
Percent of children (aged 3 through 5) with IEPs attending a regular<br />
early childhood program and receiving the majority of special<br />
education and related services in the regular early childhood program<br />
Allowable<br />
Difference<br />
LEA: 3606 - WESTSIDE SCHOOL <strong>DISTRICT</strong><br />
Indicator 07: Preschool (3-5) Outcomes<br />
a) Percent of preschool CWD<br />
children who did not<br />
improve functioning.<br />
b) Percent of preschool CWD<br />
who improved but whose<br />
functioning remained below<br />
same age peers.<br />
c) Percent of preschool CWD<br />
who improved at a level<br />
nearer to same aged peers.<br />
d) Percent of preschool CWD<br />
who improved functioning to<br />
reach a level comparable to<br />
same age peers.<br />
e) Percent of preschool CWD<br />
children who maintain<br />
functioning at a level<br />
comparable to same aged<br />
peers.<br />
Summary<br />
Statements<br />
1) Of those preschool<br />
children who entered<br />
the preschool program<br />
below age expectations<br />
in each Outcome, the<br />
percent who<br />
substantially increased<br />
their rate of growth by<br />
the time they turned 6<br />
years of age or exited<br />
the program.<br />
2) The percent of<br />
preschool children who<br />
were functioning<br />
within age expectations<br />
in each Outcome by the<br />
time they turned 6<br />
years of age or exited<br />
A) Positive Social -Emotional<br />
Skills*<br />
State<br />
Rate<br />
A) Positive Social -<br />
Emotional Skills<br />
(Including social<br />
relationships)<br />
State<br />
Rate<br />
2.14%<br />
5.31%<br />
25.97%<br />
38.22%<br />
28.36%<br />
State<br />
Target<br />
LEA<br />
Rate<br />
LEA<br />
Rate<br />
— —<br />
— —<br />
— —<br />
— —<br />
— —<br />
Target<br />
Met by<br />
LEA(Y/N)<br />
B) Acquisition and Use of<br />
Knowledge and Skills<br />
(Including early language/<br />
communication and early literacy)<br />
B) Acquisition and Use of<br />
Knowledge and Skills **<br />
State<br />
Rate<br />
1.75%<br />
6.59%<br />
34.23%<br />
43.51%<br />
13.92%<br />
State<br />
Target<br />
LEA<br />
Rate<br />
Target<br />
Met by<br />
LEA(Y/N)<br />
C) Use of Appropriate Behaviors<br />
to Meet Their Needs<br />
State<br />
Rate<br />
State<br />
Target<br />
LEA<br />
Rate<br />
Target<br />
Met by<br />
LEA(Y/N)<br />
89.61% 90.50% — — N/A 90.31% 90.50% — — N/A 90.82% 92.50% — — N/A<br />
66.58% 69.50% — — N/A 57.43% 60.50% — — N/A 76.69% 78.50% — — N/A<br />
NOTE: * Including social relationships ** Including early language/ communication and early literacy<br />
Note: - - denotes not applicable<br />
State<br />
Rate<br />
LEA<br />
Rate<br />
— —<br />
— —<br />
— —<br />
— —<br />
— —<br />
C) Use of<br />
Appropriate<br />
Behaviors to<br />
Meet Their Needs<br />
State<br />
Rate<br />
4.51%<br />
17.34%<br />
41.72%<br />
34.97%<br />
LEA<br />
Rate<br />
1.46% — —<br />
— —<br />
— —<br />
— —<br />
— —<br />
Page 3 of 5
LEA: 3606 - WESTSIDE SCHOOL <strong>DISTRICT</strong><br />
Indicator 08: Parent Involvement<br />
Percent of surveyed<br />
parents who reported<br />
school facilitated parent<br />
involvement as a means<br />
of improving services<br />
and results for children<br />
with disabilities.<br />
Early Childhood<br />
(3-5)<br />
School Age<br />
(5-21)<br />
State<br />
Rate<br />
90.47%<br />
95.05%<br />
Indicator 09: Disproportionality - Eligibility<br />
Disproportionate representation of racial<br />
and ethnic groups in special education and<br />
related services that is a result of<br />
inappropriate identification (e.g.<br />
monitoring data, review of policies,<br />
practices, and procedures under 618(d),<br />
etc.).<br />
State<br />
Rate<br />
State<br />
Target<br />
88.00%<br />
96.00%<br />
State<br />
Target<br />
0.00% 0.00%<br />
LEA<br />
Rate<br />
— —<br />
91.67%<br />
Indicator 10: Disproportionality-Child with a Disability<br />
Disproportionate representation of racial<br />
and ethnic groups in specific disability<br />
categories that is a result of inappropriate<br />
identification (e.g. monitoring data, review<br />
of policies, practices, and procedures under<br />
618(d), etc.).<br />
Indicator 11: Child Find<br />
Percent of children with<br />
parental consent to evaluate<br />
who are evaluated within<br />
the State established timeline<br />
of 60 days.<br />
Overall<br />
(3-21)<br />
Early Childhood<br />
(3-5)<br />
School Age<br />
(5-21)<br />
State<br />
Rate<br />
0.00%<br />
Indicator 12: Early Childhood Transition<br />
Percent of children referred by Part C prior to<br />
age 3, who are found eligible for Part B, and<br />
who have an IEP developed and implemented<br />
by their third birthday.<br />
Note: - - denotes not applicable<br />
State<br />
Rate<br />
99.41%<br />
99.70%<br />
98.97%<br />
State<br />
Rate<br />
State<br />
Target<br />
0.00%<br />
State<br />
Target<br />
100.00%<br />
100.00%<br />
100.00%<br />
State<br />
Target<br />
Target Met by<br />
LEA (Y/N)<br />
Y<br />
Target Met by<br />
LEA (Y/N)<br />
Y<br />
LEA<br />
Rate<br />
100.00%<br />
— —<br />
100.00%<br />
LEA<br />
Rate<br />
Target Met by<br />
LEA (Y/N)<br />
N/A<br />
N<br />
Note: The target for Indicator 09 is to have zero percent<br />
(0%) of districts identified as having disproportionate<br />
representation as a result of inappropriate<br />
identification in eligibility.<br />
Note: The target for Indicator 10 is to have zero<br />
percent (0%) of districts identified as having<br />
disproportionate representation as a result of<br />
inappropriate identification in a disability<br />
category.<br />
Target Met by<br />
LEA (Y/N)<br />
N/A<br />
Y<br />
Target Met<br />
by LEA<br />
(Y/N)<br />
99.21% 100.00% - - N/A<br />
Y<br />
Note: * Indicates a zero reponse rate for the<br />
district.<br />
Page 4 of 5
LEA: 3606 - WESTSIDE SCHOOL <strong>DISTRICT</strong><br />
Indicator 13: Secondary Transition<br />
Percent of youth with disabilities aged 16 and<br />
up with an IEP that includes coordinated,<br />
measurable, annual IEP goals and transition<br />
services that will reasonably enable the student<br />
to meet the post-secondary goals.<br />
Indicator 14: Post-School Outcomes<br />
A. Percent of youth enrolled in higher<br />
education within one year of leaving high<br />
school.<br />
State<br />
Rate<br />
State<br />
Target<br />
Note: Data for this Indicator is from the on-site monitoring of LEAs for the given year.<br />
B. Percent of youth enrolled in higher<br />
education or competitively employed<br />
within one year of leaving high school.<br />
C. Percent of youth enrolled in higher<br />
education or in some other postsecondary<br />
education or training program; or<br />
competitively employed or in some other<br />
employment within one year of leaving<br />
high school.<br />
State<br />
Rate<br />
Indicator 20: Reported Data-Timely and Accurate*<br />
District submitted<br />
required data elements<br />
on or before due dates;<br />
made revisions within<br />
the alloted reveiw<br />
periods.<br />
Accurate and Timely<br />
Data Submission<br />
Overall (3-21)<br />
Early Childhood (3-5)<br />
School Age (5-21)<br />
State<br />
Target<br />
100.00%<br />
100.00%<br />
100.00%<br />
State<br />
Target<br />
LEA<br />
Rate<br />
LEA<br />
Rate<br />
Target Met by<br />
LEA (Y/N)<br />
Target Met<br />
by LEA<br />
(Y/N)<br />
Target Met<br />
by LEA<br />
(Y/N)<br />
*Data reviewed for timely and accurate submissions included all APSCN cycle data except for personnel<br />
Note: - - denotes not applicable<br />
96.19 100.00 — — N/A<br />
14.53<br />
State<br />
Rate<br />
49.42<br />
State<br />
Rate<br />
54.07<br />
13.00<br />
State<br />
Target<br />
49.00<br />
State<br />
Target<br />
60.00<br />
Y<br />
N/A<br />
Y<br />
— —<br />
LEA<br />
Rate<br />
— —<br />
LEA<br />
Rate<br />
— —<br />
N/A<br />
Target Met<br />
by LEA<br />
(Y/N)<br />
N/A<br />
Target Met<br />
by LEA<br />
(Y/N)<br />
N/A<br />
Page 5 of 5
LEA: 3701 - BRADLEY SCHOOL <strong>DISTRICT</strong><br />
<strong>ARKANSAS</strong> <strong>SPECIAL</strong> <strong>EDUCATION</strong><br />
<strong>DISTRICT</strong> <strong>ANNUAL</strong> PERFORMANCE REPORT<br />
2010/11 School Year<br />
Publication Date: March 2012<br />
Each State must have in place a State Performance Plan (SPP) to evaluate the State's efforts to meet the requirements and<br />
purposes of the implementation of the Individuals with Disabilities Education Act (IDEA). The SPP is a six-year plan, which<br />
describes Arkansas's performance on 20 indicators. The Office of Special Education Programs in the U. S. Department of<br />
Education requires that States report annually to the public on the performance of each local education agency (LEA) on 14 of<br />
20 indicators as compared with targets established by the State in the SPP. Arkansas will report indicators 1 through 14 and<br />
20 for each LEA serving children with disabilities (CWD). Any LEA not meeting targets on compliance indicators (0% for<br />
Indicators 4B, 09 & 10 and 100% for Indicators 11, 12, 13, and 20) are non-compliant with IDEA.<br />
There are no report changes for the 2010/11 school year profile; However, it is important to recognize that: .<br />
1. Indicator 01 (Graduation) is reported a year in arrear (2009/10 graduates) and is based on a four-year cohort. This<br />
means the rate is a measure of students who entered in ninth grade and graduate in four years. The calculation is a<br />
requirement under Title I of the Elementary and Secondary Education Act (ESEA).<br />
2. Indicator 02 (Drop out) is reported a year in arrear. This means the rate is a measure of students who dropped out in<br />
the 2009/10 school year. The Indicator 02 data are aligned with the Common Core of Data (CCD) requirements for<br />
grades 7-12.<br />
3. Indicator 04A and 4B (Suspension/Expulsion) is reported a year in arrear. This means the rate is a measure of<br />
students who had out-of-school suspensions and/or expulsions totaling more than 10 days.<br />
Percent of youth<br />
with IEPs<br />
graduating from<br />
high school with a<br />
regular diploma<br />
For a complete description of all the Indicators, please visit the special education website at<br />
http://arksped.k12.ar.us/sections/policy.html<br />
Indicator 01: Graduation Rates (2009/10 school year) Indicator 02: Dropout Rates (2009/10 school year)<br />
State<br />
Rate<br />
State<br />
Target<br />
75.76% 85.00%<br />
LEA<br />
Rate<br />
100.00%<br />
Target Met<br />
by LEA<br />
(Y/N)<br />
Y<br />
Percent of<br />
youth with<br />
IEPs dropping<br />
out of high<br />
school<br />
State<br />
Rate<br />
Indicator 03: Assessment on Statewide Benchmark Exam (grades 3-8, 11)<br />
A) Adequate Yearly Progress<br />
n=40<br />
Literacy<br />
Mathematics<br />
Met Disability Subgroup "n"<br />
for Reporting Purposes (Y/N)<br />
State Target for % of Districts Meeting<br />
AYP for Disability Subgroup<br />
State<br />
Target<br />
3.06% 4.20%<br />
LEA<br />
Rate<br />
0.00%<br />
% of Districts Meeting AYP<br />
for Disability Subgroup<br />
Target Met by<br />
LEA (Y/N)<br />
Y<br />
Target Met by<br />
LEA(Y/N)<br />
Overall N 17.15% 6.25%<br />
NA<br />
N<br />
N<br />
Note: For a district to qualify as having a disability subgroup it must have a minimum of 40 (n=40) students with disabilities in a school building.<br />
B) Participation<br />
Participation Rate: # of<br />
CWD Tested ÷ # of CWD<br />
Enrolled in grades tested.<br />
Participation Rate: Literacy<br />
Participation Rate: Math<br />
Note: - - denotes not applicable<br />
State<br />
Rate<br />
98.78%<br />
State<br />
Target<br />
95.00%<br />
LEA<br />
Rate<br />
100.00%<br />
Target Met<br />
by LEA (Y/N)<br />
98.61% 95.00% 100.00% Y<br />
Y<br />
C) Performance Proficiency<br />
Percent of CWD Scoring<br />
Proficient or Above<br />
Proficiency Rate: Literacy<br />
Proficiency Rate:<br />
Mathematics<br />
16.00%<br />
16.00%<br />
State<br />
Rate<br />
31.49%<br />
44.86%<br />
State<br />
Target<br />
45.22%<br />
51.14%<br />
LEA<br />
Rate<br />
8.33%<br />
17.39%<br />
NA<br />
NA<br />
Target<br />
Met by<br />
LEA (Y/N)<br />
N<br />
N<br />
Page 1 of 5
LEA: 3701 - BRADLEY SCHOOL <strong>DISTRICT</strong><br />
Indicator 04: Out-of-School Suspensions and Expulsions (2009/10 school year)<br />
A) Suspension/Expulsion<br />
Percent difference of CWD with out-of- school suspensions and<br />
expulsions totaling greater than 10 days in a school year as<br />
compared to the same data for general education students in<br />
the district.<br />
B) Suspension/Expulsion by Race and Ethnicity<br />
Percent of districts that have: (a) a significant discrepancy, by race or<br />
ethnicity, in the rate of suspensions and expulsions of greater than 10<br />
days in a school year for children with IEPs; and (b) policies,<br />
procedures or practices that contribute to the significant discrepancy<br />
and do not comply with requirements relating to the development<br />
and implementation of IEPs, the use of positive behavioral<br />
interventions and supports, and procedural safeguards.<br />
Indicator 05: School Age (5-21) Least Restrictive Environment<br />
A) In the Regular Class 80% or more of the day<br />
Percent of CWD with<br />
IEPs receiving instruction<br />
in the regular class 80%<br />
or more of the day.<br />
State<br />
Rate<br />
State<br />
Target<br />
LEA<br />
Rate<br />
B) In the Regular Class less than 40% of the day<br />
Percent of CWD with<br />
IEPs receiving instruction<br />
in the regular class less<br />
than 60% of the day.<br />
53.87% 59.77%<br />
State<br />
Rate<br />
State<br />
Target<br />
12.42% 12.51%<br />
82.86%<br />
LEA<br />
Rate<br />
2.86%<br />
C) Other Settings outside the regular class<br />
Percent of CWD with IEPs served in<br />
public or private separate schools,<br />
residential placements, or<br />
homebound/hospital placements.<br />
State<br />
Rate<br />
State<br />
Target<br />
2.80% 2.56%<br />
Target Met<br />
by LEA (Y/N)<br />
Y<br />
Target Met<br />
by LEA (Y/N)<br />
Y<br />
LEA<br />
Rate<br />
2.86%<br />
Target Met<br />
by LEA(Y/N)<br />
Indicator 06: Early Childhood (3-5) Least Restrictive Environment<br />
A) Regular Early Childhood Program<br />
Percent of children (aged 3 through 5) with IEPs attending a regular<br />
early childhood program and receiving the majority of special<br />
education and related services in the regular early childhood program<br />
Allowable<br />
Difference<br />
LEA: 3701 - BRADLEY SCHOOL <strong>DISTRICT</strong><br />
Indicator 07: Preschool (3-5) Outcomes<br />
a) Percent of preschool CWD<br />
children who did not<br />
improve functioning.<br />
b) Percent of preschool CWD<br />
who improved but whose<br />
functioning remained below<br />
same age peers.<br />
c) Percent of preschool CWD<br />
who improved at a level<br />
nearer to same aged peers.<br />
d) Percent of preschool CWD<br />
who improved functioning to<br />
reach a level comparable to<br />
same age peers.<br />
e) Percent of preschool CWD<br />
children who maintain<br />
functioning at a level<br />
comparable to same aged<br />
peers.<br />
Summary<br />
Statements<br />
1) Of those preschool<br />
children who entered<br />
the preschool program<br />
below age expectations<br />
in each Outcome, the<br />
percent who<br />
substantially increased<br />
their rate of growth by<br />
the time they turned 6<br />
years of age or exited<br />
the program.<br />
2) The percent of<br />
preschool children who<br />
were functioning<br />
within age expectations<br />
in each Outcome by the<br />
time they turned 6<br />
years of age or exited<br />
A) Positive Social -Emotional<br />
Skills*<br />
State<br />
Rate<br />
A) Positive Social -<br />
Emotional Skills<br />
(Including social<br />
relationships)<br />
State<br />
Rate<br />
2.14%<br />
5.31%<br />
25.97%<br />
38.22%<br />
28.36%<br />
State<br />
Target<br />
LEA<br />
Rate<br />
LEA<br />
Rate<br />
— —<br />
— —<br />
— —<br />
— —<br />
— —<br />
Target<br />
Met by<br />
LEA(Y/N)<br />
B) Acquisition and Use of<br />
Knowledge and Skills<br />
(Including early language/<br />
communication and early literacy)<br />
B) Acquisition and Use of<br />
Knowledge and Skills **<br />
State<br />
Rate<br />
1.75%<br />
6.59%<br />
34.23%<br />
43.51%<br />
13.92%<br />
State<br />
Target<br />
LEA<br />
Rate<br />
Target<br />
Met by<br />
LEA(Y/N)<br />
C) Use of Appropriate Behaviors<br />
to Meet Their Needs<br />
State<br />
Rate<br />
State<br />
Target<br />
LEA<br />
Rate<br />
Target<br />
Met by<br />
LEA(Y/N)<br />
89.61% 90.50% — — N/A 90.31% 90.50% — — N/A 90.82% 92.50% — — N/A<br />
66.58% 69.50% — — N/A 57.43% 60.50% — — N/A 76.69% 78.50% — — N/A<br />
NOTE: * Including social relationships ** Including early language/ communication and early literacy<br />
Note: - - denotes not applicable<br />
State<br />
Rate<br />
LEA<br />
Rate<br />
— —<br />
— —<br />
— —<br />
— —<br />
— —<br />
C) Use of<br />
Appropriate<br />
Behaviors to<br />
Meet Their Needs<br />
State<br />
Rate<br />
4.51%<br />
17.34%<br />
41.72%<br />
34.97%<br />
LEA<br />
Rate<br />
1.46% — —<br />
— —<br />
— —<br />
— —<br />
— —<br />
Page 3 of 5
LEA: 3701 - BRADLEY SCHOOL <strong>DISTRICT</strong><br />
Indicator 08: Parent Involvement<br />
Percent of surveyed<br />
parents who reported<br />
school facilitated parent<br />
involvement as a means<br />
of improving services<br />
and results for children<br />
with disabilities.<br />
Early Childhood<br />
(3-5)<br />
School Age<br />
(5-21)<br />
State<br />
Rate<br />
90.47%<br />
95.05%<br />
Indicator 09: Disproportionality - Eligibility<br />
Disproportionate representation of racial<br />
and ethnic groups in special education and<br />
related services that is a result of<br />
inappropriate identification (e.g.<br />
monitoring data, review of policies,<br />
practices, and procedures under 618(d),<br />
etc.).<br />
State<br />
Rate<br />
State<br />
Target<br />
88.00%<br />
96.00%<br />
State<br />
Target<br />
0.00% 0.00%<br />
LEA<br />
Rate<br />
— —<br />
100.00%<br />
Indicator 10: Disproportionality-Child with a Disability<br />
Disproportionate representation of racial<br />
and ethnic groups in specific disability<br />
categories that is a result of inappropriate<br />
identification (e.g. monitoring data, review<br />
of policies, practices, and procedures under<br />
618(d), etc.).<br />
Indicator 11: Child Find<br />
Percent of children with<br />
parental consent to evaluate<br />
who are evaluated within<br />
the State established timeline<br />
of 60 days.<br />
Overall<br />
(3-21)<br />
Early Childhood<br />
(3-5)<br />
School Age<br />
(5-21)<br />
State<br />
Rate<br />
0.00%<br />
Indicator 12: Early Childhood Transition<br />
Percent of children referred by Part C prior to<br />
age 3, who are found eligible for Part B, and<br />
who have an IEP developed and implemented<br />
by their third birthday.<br />
Note: - - denotes not applicable<br />
State<br />
Rate<br />
99.41%<br />
99.70%<br />
98.97%<br />
State<br />
Rate<br />
State<br />
Target<br />
0.00%<br />
State<br />
Target<br />
100.00%<br />
100.00%<br />
100.00%<br />
State<br />
Target<br />
Target Met by<br />
LEA (Y/N)<br />
Y<br />
Target Met by<br />
LEA (Y/N)<br />
Y<br />
LEA<br />
Rate<br />
100.00%<br />
— —<br />
100.00%<br />
LEA<br />
Rate<br />
Target Met by<br />
LEA (Y/N)<br />
N/A<br />
Y<br />
Note: The target for Indicator 09 is to have zero percent<br />
(0%) of districts identified as having disproportionate<br />
representation as a result of inappropriate<br />
identification in eligibility.<br />
Note: The target for Indicator 10 is to have zero<br />
percent (0%) of districts identified as having<br />
disproportionate representation as a result of<br />
inappropriate identification in a disability<br />
category.<br />
Target Met by<br />
LEA (Y/N)<br />
N/A<br />
Y<br />
Target Met<br />
by LEA<br />
(Y/N)<br />
99.21% 100.00% - - N/A<br />
Y<br />
Note: * Indicates a zero reponse rate for the<br />
district.<br />
Page 4 of 5
LEA: 3701 - BRADLEY SCHOOL <strong>DISTRICT</strong><br />
Indicator 13: Secondary Transition<br />
Percent of youth with disabilities aged 16 and<br />
up with an IEP that includes coordinated,<br />
measurable, annual IEP goals and transition<br />
services that will reasonably enable the student<br />
to meet the post-secondary goals.<br />
Indicator 14: Post-School Outcomes<br />
A. Percent of youth enrolled in higher<br />
education within one year of leaving high<br />
school.<br />
State<br />
Rate<br />
State<br />
Target<br />
Note: Data for this Indicator is from the on-site monitoring of LEAs for the given year.<br />
B. Percent of youth enrolled in higher<br />
education or competitively employed<br />
within one year of leaving high school.<br />
C. Percent of youth enrolled in higher<br />
education or in some other postsecondary<br />
education or training program; or<br />
competitively employed or in some other<br />
employment within one year of leaving<br />
high school.<br />
State<br />
Rate<br />
Indicator 20: Reported Data-Timely and Accurate*<br />
District submitted<br />
required data elements<br />
on or before due dates;<br />
made revisions within<br />
the alloted reveiw<br />
periods.<br />
Accurate and Timely<br />
Data Submission<br />
Overall (3-21)<br />
Early Childhood (3-5)<br />
School Age (5-21)<br />
State<br />
Target<br />
100.00%<br />
100.00%<br />
100.00%<br />
State<br />
Target<br />
LEA<br />
Rate<br />
LEA<br />
Rate<br />
Target Met by<br />
LEA (Y/N)<br />
Target Met<br />
by LEA<br />
(Y/N)<br />
Target Met<br />
by LEA<br />
(Y/N)<br />
*Data reviewed for timely and accurate submissions included all APSCN cycle data except for personnel<br />
Note: - - denotes not applicable<br />
96.19 100.00 — — N/A<br />
14.53<br />
State<br />
Rate<br />
49.42<br />
State<br />
Rate<br />
54.07<br />
13.00<br />
State<br />
Target<br />
49.00<br />
State<br />
Target<br />
60.00<br />
Y<br />
N/A<br />
Y<br />
— —<br />
LEA<br />
Rate<br />
— —<br />
LEA<br />
Rate<br />
— —<br />
N/A<br />
Target Met<br />
by LEA<br />
(Y/N)<br />
N/A<br />
Target Met<br />
by LEA<br />
(Y/N)<br />
N/A<br />
Page 5 of 5
<strong>ARKANSAS</strong> <strong>SPECIAL</strong> <strong>EDUCATION</strong><br />
<strong>DISTRICT</strong> <strong>ANNUAL</strong> PERFORMANCE REPORT<br />
2010/11 School Year<br />
Publication Date: March 2012<br />
Each State must have in place a State Performance Plan (SPP) to evaluate the State's efforts to meet the requirements and<br />
purposes of the implementation of the Individuals with Disabilities Education Act (IDEA). The SPP is a six-year plan, which<br />
describes Arkansas's performance on 20 indicators. The Office of Special Education Programs in the U. S. Department of<br />
Education requires that States report annually to the public on the performance of each local education agency (LEA) on 14 of<br />
20 indicators as compared with targets established by the State in the SPP. Arkansas will report indicators 1 through 14 and<br />
20 for each LEA serving children with disabilities (CWD). Any LEA not meeting targets on compliance indicators (0% for<br />
Indicators 4B, 09 & 10 and 100% for Indicators 11, 12, 13, and 20) are non-compliant with IDEA.<br />
There are no report changes for the 2010/11 school year profile; However, it is important to recognize that: .<br />
1. Indicator 01 (Graduation) is reported a year in arrear (2009/10 graduates) and is based on a four-year cohort. This<br />
means the rate is a measure of students who entered in ninth grade and graduate in four years. The calculation is a<br />
requirement under Title I of the Elementary and Secondary Education Act (ESEA).<br />
2. Indicator 02 (Drop out) is reported a year in arrear. This means the rate is a measure of students who dropped out in<br />
the 2009/10 school year. The Indicator 02 data are aligned with the Common Core of Data (CCD) requirements for<br />
grades 7-12.<br />
3. Indicator 04A and 4B (Suspension/Expulsion) is reported a year in arrear. This means the rate is a measure of<br />
students who had out-of-school suspensions and/or expulsions totaling more than 10 days.<br />
For a complete description of all the Indicators, please visit the special education website at<br />
http://arksped.k12.ar.us/sections/policy.html<br />
LEA: 3704 - LAFAYETTE COUNTY SCHOOL <strong>DISTRICT</strong><br />
Indicator 01: Graduation Rates (2009/10 school year) Indicator 02: Dropout Rates (2009/10 school year)<br />
Percent of youth<br />
with IEPs<br />
graduating from<br />
high school with a<br />
regular diploma<br />
State<br />
Rate<br />
State<br />
Target<br />
75.76% 85.00%<br />
LEA<br />
Rate<br />
90.91%<br />
Target Met<br />
by LEA<br />
(Y/N)<br />
Y<br />
Percent of<br />
youth with<br />
IEPs dropping<br />
out of high<br />
school<br />
State<br />
Rate<br />
Indicator 03: Assessment on Statewide Benchmark Exam (grades 3-8, 11)<br />
A) Adequate Yearly Progress<br />
n=40<br />
Literacy<br />
Mathematics<br />
Met Disability Subgroup "n"<br />
for Reporting Purposes (Y/N)<br />
State Target for % of Districts Meeting<br />
AYP for Disability Subgroup<br />
State<br />
Target<br />
3.06% 4.20%<br />
LEA<br />
Rate<br />
1.69%<br />
% of Districts Meeting AYP<br />
for Disability Subgroup<br />
Target Met by<br />
LEA (Y/N)<br />
Y<br />
Target Met by<br />
LEA(Y/N)<br />
Overall N 17.15% 6.25%<br />
NA<br />
N<br />
N<br />
Note: For a district to qualify as having a disability subgroup it must have a minimum of 40 (n=40) students with disabilities in a school building.<br />
B) Participation<br />
Participation Rate: # of<br />
CWD Tested ÷ # of CWD<br />
Enrolled in grades tested.<br />
Participation Rate: Literacy<br />
Participation Rate: Math<br />
Note: - - denotes not applicable<br />
State<br />
Rate<br />
98.78%<br />
State<br />
Target<br />
95.00%<br />
LEA<br />
Rate<br />
97.50%<br />
Target Met<br />
by LEA (Y/N)<br />
98.61% 95.00% 95.35% Y<br />
Y<br />
C) Performance Proficiency<br />
Percent of CWD Scoring<br />
Proficient or Above<br />
Proficiency Rate: Literacy<br />
Proficiency Rate:<br />
Mathematics<br />
16.00%<br />
16.00%<br />
State<br />
Rate<br />
31.49%<br />
44.86%<br />
State<br />
Target<br />
45.22%<br />
51.14%<br />
LEA<br />
Rate<br />
13.51%<br />
27.03%<br />
NA<br />
NA<br />
Target<br />
Met by<br />
LEA (Y/N)<br />
N<br />
N<br />
Page 1 of 5
LEA: 3704 - LAFAYETTE COUNTY SCHOOL <strong>DISTRICT</strong><br />
Indicator 04: Out-of-School Suspensions and Expulsions (2009/10 school year)<br />
A) Suspension/Expulsion<br />
Percent difference of CWD with out-of- school suspensions and<br />
expulsions totaling greater than 10 days in a school year as<br />
compared to the same data for general education students in<br />
the district.<br />
B) Suspension/Expulsion by Race and Ethnicity<br />
Percent of districts that have: (a) a significant discrepancy, by race or<br />
ethnicity, in the rate of suspensions and expulsions of greater than 10<br />
days in a school year for children with IEPs; and (b) policies,<br />
procedures or practices that contribute to the significant discrepancy<br />
and do not comply with requirements relating to the development<br />
and implementation of IEPs, the use of positive behavioral<br />
interventions and supports, and procedural safeguards.<br />
Indicator 05: School Age (5-21) Least Restrictive Environment<br />
A) In the Regular Class 80% or more of the day<br />
Percent of CWD with<br />
IEPs receiving instruction<br />
in the regular class 80%<br />
or more of the day.<br />
State<br />
Rate<br />
State<br />
Target<br />
LEA<br />
Rate<br />
B) In the Regular Class less than 40% of the day<br />
Percent of CWD with<br />
IEPs receiving instruction<br />
in the regular class less<br />
than 60% of the day.<br />
53.87% 59.77%<br />
State<br />
Rate<br />
State<br />
Target<br />
12.42% 12.51%<br />
75.00%<br />
LEA<br />
Rate<br />
11.84%<br />
C) Other Settings outside the regular class<br />
Percent of CWD with IEPs served in<br />
public or private separate schools,<br />
residential placements, or<br />
homebound/hospital placements.<br />
State<br />
Rate<br />
State<br />
Target<br />
2.80% 2.56%<br />
Target Met<br />
by LEA (Y/N)<br />
Y<br />
Target Met<br />
by LEA (Y/N)<br />
Y<br />
LEA<br />
Rate<br />
2.63%<br />
Target Met<br />
by LEA(Y/N)<br />
Indicator 06: Early Childhood (3-5) Least Restrictive Environment<br />
A) Regular Early Childhood Program<br />
Percent of children (aged 3 through 5) with IEPs attending a regular<br />
early childhood program and receiving the majority of special<br />
education and related services in the regular early childhood program<br />
Allowable<br />
Difference<br />
LEA: 3704 - LAFAYETTE COUNTY SCHOOL <strong>DISTRICT</strong><br />
Indicator 07: Preschool (3-5) Outcomes<br />
a) Percent of preschool CWD<br />
children who did not<br />
improve functioning.<br />
b) Percent of preschool CWD<br />
who improved but whose<br />
functioning remained below<br />
same age peers.<br />
c) Percent of preschool CWD<br />
who improved at a level<br />
nearer to same aged peers.<br />
d) Percent of preschool CWD<br />
who improved functioning to<br />
reach a level comparable to<br />
same age peers.<br />
e) Percent of preschool CWD<br />
children who maintain<br />
functioning at a level<br />
comparable to same aged<br />
peers.<br />
Summary<br />
Statements<br />
1) Of those preschool<br />
children who entered<br />
the preschool program<br />
below age expectations<br />
in each Outcome, the<br />
percent who<br />
substantially increased<br />
their rate of growth by<br />
the time they turned 6<br />
years of age or exited<br />
the program.<br />
2) The percent of<br />
preschool children who<br />
were functioning<br />
within age expectations<br />
in each Outcome by the<br />
time they turned 6<br />
years of age or exited<br />
A) Positive Social -Emotional<br />
Skills*<br />
State<br />
Rate<br />
A) Positive Social -<br />
Emotional Skills<br />
(Including social<br />
relationships)<br />
State<br />
Rate<br />
2.14%<br />
5.31%<br />
25.97%<br />
38.22%<br />
28.36%<br />
State<br />
Target<br />
LEA<br />
Rate<br />
LEA<br />
Rate<br />
— —<br />
— —<br />
— —<br />
— —<br />
— —<br />
Target<br />
Met by<br />
LEA(Y/N)<br />
B) Acquisition and Use of<br />
Knowledge and Skills<br />
(Including early language/<br />
communication and early literacy)<br />
B) Acquisition and Use of<br />
Knowledge and Skills **<br />
State<br />
Rate<br />
1.75%<br />
6.59%<br />
34.23%<br />
43.51%<br />
13.92%<br />
State<br />
Target<br />
LEA<br />
Rate<br />
Target<br />
Met by<br />
LEA(Y/N)<br />
C) Use of Appropriate Behaviors<br />
to Meet Their Needs<br />
State<br />
Rate<br />
State<br />
Target<br />
LEA<br />
Rate<br />
Target<br />
Met by<br />
LEA(Y/N)<br />
89.61% 90.50% — — N/A 90.31% 90.50% — — N/A 90.82% 92.50% — — N/A<br />
66.58% 69.50% — — N/A 57.43% 60.50% — — N/A 76.69% 78.50% — — N/A<br />
NOTE: * Including social relationships ** Including early language/ communication and early literacy<br />
Note: - - denotes not applicable<br />
State<br />
Rate<br />
LEA<br />
Rate<br />
— —<br />
— —<br />
— —<br />
— —<br />
— —<br />
C) Use of<br />
Appropriate<br />
Behaviors to<br />
Meet Their Needs<br />
State<br />
Rate<br />
4.51%<br />
17.34%<br />
41.72%<br />
34.97%<br />
LEA<br />
Rate<br />
1.46% — —<br />
— —<br />
— —<br />
— —<br />
— —<br />
Page 3 of 5
LEA: 3704 - LAFAYETTE COUNTY SCHOOL <strong>DISTRICT</strong><br />
Indicator 08: Parent Involvement<br />
Percent of surveyed<br />
parents who reported<br />
school facilitated parent<br />
involvement as a means<br />
of improving services<br />
and results for children<br />
with disabilities.<br />
Early Childhood<br />
(3-5)<br />
School Age<br />
(5-21)<br />
State<br />
Rate<br />
90.47%<br />
95.05%<br />
Indicator 09: Disproportionality - Eligibility<br />
Disproportionate representation of racial<br />
and ethnic groups in special education and<br />
related services that is a result of<br />
inappropriate identification (e.g.<br />
monitoring data, review of policies,<br />
practices, and procedures under 618(d),<br />
etc.).<br />
State<br />
Rate<br />
State<br />
Target<br />
88.00%<br />
96.00%<br />
State<br />
Target<br />
0.00% 0.00%<br />
LEA<br />
Rate<br />
100.00%<br />
100.00%<br />
Indicator 10: Disproportionality-Child with a Disability<br />
Disproportionate representation of racial<br />
and ethnic groups in specific disability<br />
categories that is a result of inappropriate<br />
identification (e.g. monitoring data, review<br />
of policies, practices, and procedures under<br />
618(d), etc.).<br />
Indicator 11: Child Find<br />
Percent of children with<br />
parental consent to evaluate<br />
who are evaluated within<br />
the State established timeline<br />
of 60 days.<br />
Overall<br />
(3-21)<br />
Early Childhood<br />
(3-5)<br />
School Age<br />
(5-21)<br />
State<br />
Rate<br />
0.00%<br />
Indicator 12: Early Childhood Transition<br />
Percent of children referred by Part C prior to<br />
age 3, who are found eligible for Part B, and<br />
who have an IEP developed and implemented<br />
by their third birthday.<br />
Note: - - denotes not applicable<br />
State<br />
Rate<br />
99.41%<br />
99.70%<br />
98.97%<br />
State<br />
Rate<br />
State<br />
Target<br />
0.00%<br />
State<br />
Target<br />
100.00%<br />
100.00%<br />
100.00%<br />
State<br />
Target<br />
Target Met by<br />
LEA (Y/N)<br />
Y<br />
Target Met by<br />
LEA (Y/N)<br />
Y<br />
LEA<br />
Rate<br />
100.00%<br />
— —<br />
100.00%<br />
LEA<br />
Rate<br />
Target Met by<br />
LEA (Y/N)<br />
Y<br />
Y<br />
Note: The target for Indicator 09 is to have zero percent<br />
(0%) of districts identified as having disproportionate<br />
representation as a result of inappropriate<br />
identification in eligibility.<br />
Note: The target for Indicator 10 is to have zero<br />
percent (0%) of districts identified as having<br />
disproportionate representation as a result of<br />
inappropriate identification in a disability<br />
category.<br />
Target Met by<br />
LEA (Y/N)<br />
N/A<br />
Y<br />
Target Met<br />
by LEA<br />
(Y/N)<br />
99.21% 100.00% - - N/A<br />
Y<br />
Note: * Indicates a zero reponse rate for the<br />
district.<br />
Page 4 of 5
LEA: 3704 - LAFAYETTE COUNTY SCHOOL <strong>DISTRICT</strong><br />
Indicator 13: Secondary Transition<br />
Percent of youth with disabilities aged 16 and<br />
up with an IEP that includes coordinated,<br />
measurable, annual IEP goals and transition<br />
services that will reasonably enable the student<br />
to meet the post-secondary goals.<br />
Indicator 14: Post-School Outcomes<br />
A. Percent of youth enrolled in higher<br />
education within one year of leaving high<br />
school.<br />
State<br />
Rate<br />
State<br />
Target<br />
Note: Data for this Indicator is from the on-site monitoring of LEAs for the given year.<br />
B. Percent of youth enrolled in higher<br />
education or competitively employed<br />
within one year of leaving high school.<br />
C. Percent of youth enrolled in higher<br />
education or in some other postsecondary<br />
education or training program; or<br />
competitively employed or in some other<br />
employment within one year of leaving<br />
high school.<br />
State<br />
Rate<br />
Indicator 20: Reported Data-Timely and Accurate*<br />
District submitted<br />
required data elements<br />
on or before due dates;<br />
made revisions within<br />
the alloted reveiw<br />
periods.<br />
Accurate and Timely<br />
Data Submission<br />
Overall (3-21)<br />
Early Childhood (3-5)<br />
School Age (5-21)<br />
State<br />
Target<br />
100.00%<br />
100.00%<br />
100.00%<br />
State<br />
Target<br />
LEA<br />
Rate<br />
LEA<br />
Rate<br />
Target Met by<br />
LEA (Y/N)<br />
Target Met<br />
by LEA<br />
(Y/N)<br />
Target Met<br />
by LEA<br />
(Y/N)<br />
*Data reviewed for timely and accurate submissions included all APSCN cycle data except for personnel<br />
Note: - - denotes not applicable<br />
96.19 100.00 100.00% Y<br />
14.53<br />
State<br />
Rate<br />
49.42<br />
State<br />
Rate<br />
54.07<br />
13.00<br />
State<br />
Target<br />
49.00<br />
State<br />
Target<br />
60.00<br />
Y<br />
N/A<br />
Y<br />
— —<br />
LEA<br />
Rate<br />
— —<br />
LEA<br />
Rate<br />
— —<br />
N/A<br />
Target Met<br />
by LEA<br />
(Y/N)<br />
N/A<br />
Target Met<br />
by LEA<br />
(Y/N)<br />
N/A<br />
Page 5 of 5
LEA: 3804 - HOXIE SCHOOL <strong>DISTRICT</strong><br />
<strong>ARKANSAS</strong> <strong>SPECIAL</strong> <strong>EDUCATION</strong><br />
<strong>DISTRICT</strong> <strong>ANNUAL</strong> PERFORMANCE REPORT<br />
2010/11 School Year<br />
Publication Date: March 2012<br />
Each State must have in place a State Performance Plan (SPP) to evaluate the State's efforts to meet the requirements and<br />
purposes of the implementation of the Individuals with Disabilities Education Act (IDEA). The SPP is a six-year plan, which<br />
describes Arkansas's performance on 20 indicators. The Office of Special Education Programs in the U. S. Department of<br />
Education requires that States report annually to the public on the performance of each local education agency (LEA) on 14 of<br />
20 indicators as compared with targets established by the State in the SPP. Arkansas will report indicators 1 through 14 and<br />
20 for each LEA serving children with disabilities (CWD). Any LEA not meeting targets on compliance indicators (0% for<br />
Indicators 4B, 09 & 10 and 100% for Indicators 11, 12, 13, and 20) are non-compliant with IDEA.<br />
There are no report changes for the 2010/11 school year profile; However, it is important to recognize that: .<br />
1. Indicator 01 (Graduation) is reported a year in arrear (2009/10 graduates) and is based on a four-year cohort. This<br />
means the rate is a measure of students who entered in ninth grade and graduate in four years. The calculation is a<br />
requirement under Title I of the Elementary and Secondary Education Act (ESEA).<br />
2. Indicator 02 (Drop out) is reported a year in arrear. This means the rate is a measure of students who dropped out in<br />
the 2009/10 school year. The Indicator 02 data are aligned with the Common Core of Data (CCD) requirements for<br />
grades 7-12.<br />
3. Indicator 04A and 4B (Suspension/Expulsion) is reported a year in arrear. This means the rate is a measure of<br />
students who had out-of-school suspensions and/or expulsions totaling more than 10 days.<br />
Percent of youth<br />
with IEPs<br />
graduating from<br />
high school with a<br />
regular diploma<br />
For a complete description of all the Indicators, please visit the special education website at<br />
http://arksped.k12.ar.us/sections/policy.html<br />
Indicator 01: Graduation Rates (2009/10 school year) Indicator 02: Dropout Rates (2009/10 school year)<br />
State<br />
Rate<br />
State<br />
Target<br />
75.76% 85.00%<br />
LEA<br />
Rate<br />
73.33%<br />
Target Met<br />
by LEA<br />
(Y/N)<br />
N<br />
Percent of<br />
youth with<br />
IEPs dropping<br />
out of high<br />
school<br />
State<br />
Rate<br />
Indicator 03: Assessment on Statewide Benchmark Exam (grades 3-8, 11)<br />
A) Adequate Yearly Progress<br />
n=40<br />
Literacy<br />
Mathematics<br />
Met Disability Subgroup "n"<br />
for Reporting Purposes (Y/N)<br />
State Target for % of Districts Meeting<br />
AYP for Disability Subgroup<br />
State<br />
Target<br />
3.06% 4.20%<br />
LEA<br />
Rate<br />
0.00%<br />
% of Districts Meeting AYP<br />
for Disability Subgroup<br />
Target Met by<br />
LEA (Y/N)<br />
Y<br />
Target Met by<br />
LEA(Y/N)<br />
Overall N 17.15% 6.25%<br />
NA<br />
N<br />
N<br />
Note: For a district to qualify as having a disability subgroup it must have a minimum of 40 (n=40) students with disabilities in a school building.<br />
B) Participation<br />
Participation Rate: # of<br />
CWD Tested ÷ # of CWD<br />
Enrolled in grades tested.<br />
Participation Rate: Literacy<br />
Participation Rate: Math<br />
Note: - - denotes not applicable<br />
State<br />
Rate<br />
98.78%<br />
State<br />
Target<br />
95.00%<br />
LEA<br />
Rate<br />
100.00%<br />
Target Met<br />
by LEA (Y/N)<br />
98.61% 95.00% 100.00% Y<br />
Y<br />
C) Performance Proficiency<br />
Percent of CWD Scoring<br />
Proficient or Above<br />
Proficiency Rate: Literacy<br />
Proficiency Rate:<br />
Mathematics<br />
16.00%<br />
16.00%<br />
State<br />
Rate<br />
31.49%<br />
44.86%<br />
State<br />
Target<br />
45.22%<br />
51.14%<br />
LEA<br />
Rate<br />
21.88%<br />
49.25%<br />
NA<br />
NA<br />
Target<br />
Met by<br />
LEA (Y/N)<br />
N<br />
N<br />
Page 1 of 5
LEA: 3804 - HOXIE SCHOOL <strong>DISTRICT</strong><br />
Indicator 04: Out-of-School Suspensions and Expulsions (2009/10 school year)<br />
A) Suspension/Expulsion<br />
Percent difference of CWD with out-of- school suspensions and<br />
expulsions totaling greater than 10 days in a school year as<br />
compared to the same data for general education students in<br />
the district.<br />
B) Suspension/Expulsion by Race and Ethnicity<br />
Percent of districts that have: (a) a significant discrepancy, by race or<br />
ethnicity, in the rate of suspensions and expulsions of greater than 10<br />
days in a school year for children with IEPs; and (b) policies,<br />
procedures or practices that contribute to the significant discrepancy<br />
and do not comply with requirements relating to the development<br />
and implementation of IEPs, the use of positive behavioral<br />
interventions and supports, and procedural safeguards.<br />
Indicator 05: School Age (5-21) Least Restrictive Environment<br />
A) In the Regular Class 80% or more of the day<br />
Percent of CWD with<br />
IEPs receiving instruction<br />
in the regular class 80%<br />
or more of the day.<br />
State<br />
Rate<br />
State<br />
Target<br />
LEA<br />
Rate<br />
B) In the Regular Class less than 40% of the day<br />
Percent of CWD with<br />
IEPs receiving instruction<br />
in the regular class less<br />
than 60% of the day.<br />
53.87% 59.77%<br />
State<br />
Rate<br />
State<br />
Target<br />
12.42% 12.51%<br />
51.20%<br />
LEA<br />
Rate<br />
7.20%<br />
C) Other Settings outside the regular class<br />
Percent of CWD with IEPs served in<br />
public or private separate schools,<br />
residential placements, or<br />
homebound/hospital placements.<br />
State<br />
Rate<br />
State<br />
Target<br />
2.80% 2.56%<br />
Target Met<br />
by LEA (Y/N)<br />
N<br />
Target Met<br />
by LEA (Y/N)<br />
Y<br />
LEA<br />
Rate<br />
0.80%<br />
Target Met<br />
by LEA(Y/N)<br />
Indicator 06: Early Childhood (3-5) Least Restrictive Environment<br />
A) Regular Early Childhood Program<br />
Percent of children (aged 3 through 5) with IEPs attending a regular<br />
early childhood program and receiving the majority of special<br />
education and related services in the regular early childhood program<br />
Allowable<br />
Difference<br />
LEA: 3804 - HOXIE SCHOOL <strong>DISTRICT</strong><br />
Indicator 07: Preschool (3-5) Outcomes<br />
a) Percent of preschool CWD<br />
children who did not<br />
improve functioning.<br />
b) Percent of preschool CWD<br />
who improved but whose<br />
functioning remained below<br />
same age peers.<br />
c) Percent of preschool CWD<br />
who improved at a level<br />
nearer to same aged peers.<br />
d) Percent of preschool CWD<br />
who improved functioning to<br />
reach a level comparable to<br />
same age peers.<br />
e) Percent of preschool CWD<br />
children who maintain<br />
functioning at a level<br />
comparable to same aged<br />
peers.<br />
Summary<br />
Statements<br />
1) Of those preschool<br />
children who entered<br />
the preschool program<br />
below age expectations<br />
in each Outcome, the<br />
percent who<br />
substantially increased<br />
their rate of growth by<br />
the time they turned 6<br />
years of age or exited<br />
the program.<br />
2) The percent of<br />
preschool children who<br />
were functioning<br />
within age expectations<br />
in each Outcome by the<br />
time they turned 6<br />
years of age or exited<br />
A) Positive Social -Emotional<br />
Skills*<br />
State<br />
Rate<br />
A) Positive Social -<br />
Emotional Skills<br />
(Including social<br />
relationships)<br />
State<br />
Rate<br />
2.14%<br />
5.31%<br />
25.97%<br />
38.22%<br />
28.36%<br />
State<br />
Target<br />
LEA<br />
Rate<br />
LEA<br />
Rate<br />
— —<br />
— —<br />
— —<br />
— —<br />
— —<br />
Target<br />
Met by<br />
LEA(Y/N)<br />
B) Acquisition and Use of<br />
Knowledge and Skills<br />
(Including early language/<br />
communication and early literacy)<br />
B) Acquisition and Use of<br />
Knowledge and Skills **<br />
State<br />
Rate<br />
1.75%<br />
6.59%<br />
34.23%<br />
43.51%<br />
13.92%<br />
State<br />
Target<br />
LEA<br />
Rate<br />
Target<br />
Met by<br />
LEA(Y/N)<br />
C) Use of Appropriate Behaviors<br />
to Meet Their Needs<br />
State<br />
Rate<br />
State<br />
Target<br />
LEA<br />
Rate<br />
Target<br />
Met by<br />
LEA(Y/N)<br />
89.61% 90.50% — — N/A 90.31% 90.50% — — N/A 90.82% 92.50% — — N/A<br />
66.58% 69.50% — — N/A 57.43% 60.50% — — N/A 76.69% 78.50% — — N/A<br />
NOTE: * Including social relationships ** Including early language/ communication and early literacy<br />
Note: - - denotes not applicable<br />
State<br />
Rate<br />
LEA<br />
Rate<br />
— —<br />
— —<br />
— —<br />
— —<br />
— —<br />
C) Use of<br />
Appropriate<br />
Behaviors to<br />
Meet Their Needs<br />
State<br />
Rate<br />
4.51%<br />
17.34%<br />
41.72%<br />
34.97%<br />
LEA<br />
Rate<br />
1.46% — —<br />
— —<br />
— —<br />
— —<br />
— —<br />
Page 3 of 5
LEA: 3804 - HOXIE SCHOOL <strong>DISTRICT</strong><br />
Indicator 08: Parent Involvement<br />
Percent of surveyed<br />
parents who reported<br />
school facilitated parent<br />
involvement as a means<br />
of improving services<br />
and results for children<br />
with disabilities.<br />
Early Childhood<br />
(3-5)<br />
School Age<br />
(5-21)<br />
State<br />
Rate<br />
90.47%<br />
95.05%<br />
Indicator 09: Disproportionality - Eligibility<br />
Disproportionate representation of racial<br />
and ethnic groups in special education and<br />
related services that is a result of<br />
inappropriate identification (e.g.<br />
monitoring data, review of policies,<br />
practices, and procedures under 618(d),<br />
etc.).<br />
State<br />
Rate<br />
State<br />
Target<br />
88.00%<br />
96.00%<br />
State<br />
Target<br />
0.00% 0.00%<br />
LEA<br />
Rate<br />
— —<br />
97.80%<br />
Indicator 10: Disproportionality-Child with a Disability<br />
Disproportionate representation of racial<br />
and ethnic groups in specific disability<br />
categories that is a result of inappropriate<br />
identification (e.g. monitoring data, review<br />
of policies, practices, and procedures under<br />
618(d), etc.).<br />
Indicator 11: Child Find<br />
Percent of children with<br />
parental consent to evaluate<br />
who are evaluated within<br />
the State established timeline<br />
of 60 days.<br />
Overall<br />
(3-21)<br />
Early Childhood<br />
(3-5)<br />
School Age<br />
(5-21)<br />
State<br />
Rate<br />
0.00%<br />
Indicator 12: Early Childhood Transition<br />
Percent of children referred by Part C prior to<br />
age 3, who are found eligible for Part B, and<br />
who have an IEP developed and implemented<br />
by their third birthday.<br />
Note: - - denotes not applicable<br />
State<br />
Rate<br />
99.41%<br />
99.70%<br />
98.97%<br />
State<br />
Rate<br />
State<br />
Target<br />
0.00%<br />
State<br />
Target<br />
100.00%<br />
100.00%<br />
100.00%<br />
State<br />
Target<br />
Target Met by<br />
LEA (Y/N)<br />
Y<br />
Target Met by<br />
LEA (Y/N)<br />
Y<br />
LEA<br />
Rate<br />
100.00%<br />
— —<br />
100.00%<br />
LEA<br />
Rate<br />
Target Met by<br />
LEA (Y/N)<br />
N/A<br />
Y<br />
Note: The target for Indicator 09 is to have zero percent<br />
(0%) of districts identified as having disproportionate<br />
representation as a result of inappropriate<br />
identification in eligibility.<br />
Note: The target for Indicator 10 is to have zero<br />
percent (0%) of districts identified as having<br />
disproportionate representation as a result of<br />
inappropriate identification in a disability<br />
category.<br />
Target Met by<br />
LEA (Y/N)<br />
N/A<br />
Y<br />
Target Met<br />
by LEA<br />
(Y/N)<br />
99.21% 100.00% - - N/A<br />
Y<br />
Note: * Indicates a zero reponse rate for the<br />
district.<br />
Page 4 of 5
LEA: 3804 - HOXIE SCHOOL <strong>DISTRICT</strong><br />
Indicator 13: Secondary Transition<br />
Percent of youth with disabilities aged 16 and<br />
up with an IEP that includes coordinated,<br />
measurable, annual IEP goals and transition<br />
services that will reasonably enable the student<br />
to meet the post-secondary goals.<br />
Indicator 14: Post-School Outcomes<br />
A. Percent of youth enrolled in higher<br />
education within one year of leaving high<br />
school.<br />
State<br />
Rate<br />
State<br />
Target<br />
Note: Data for this Indicator is from the on-site monitoring of LEAs for the given year.<br />
B. Percent of youth enrolled in higher<br />
education or competitively employed<br />
within one year of leaving high school.<br />
C. Percent of youth enrolled in higher<br />
education or in some other postsecondary<br />
education or training program; or<br />
competitively employed or in some other<br />
employment within one year of leaving<br />
high school.<br />
State<br />
Rate<br />
Indicator 20: Reported Data-Timely and Accurate*<br />
District submitted<br />
required data elements<br />
on or before due dates;<br />
made revisions within<br />
the alloted reveiw<br />
periods.<br />
Accurate and Timely<br />
Data Submission<br />
Overall (3-21)<br />
Early Childhood (3-5)<br />
School Age (5-21)<br />
State<br />
Target<br />
100.00%<br />
100.00%<br />
100.00%<br />
State<br />
Target<br />
LEA<br />
Rate<br />
LEA<br />
Rate<br />
Target Met by<br />
LEA (Y/N)<br />
Target Met<br />
by LEA<br />
(Y/N)<br />
Target Met<br />
by LEA<br />
(Y/N)<br />
*Data reviewed for timely and accurate submissions included all APSCN cycle data except for personnel<br />
Note: - - denotes not applicable<br />
96.19 100.00 — — N/A<br />
14.53<br />
State<br />
Rate<br />
49.42<br />
State<br />
Rate<br />
54.07<br />
13.00<br />
State<br />
Target<br />
49.00<br />
State<br />
Target<br />
60.00<br />
Y<br />
N/A<br />
Y<br />
— —<br />
LEA<br />
Rate<br />
— —<br />
LEA<br />
Rate<br />
— —<br />
N/A<br />
Target Met<br />
by LEA<br />
(Y/N)<br />
N/A<br />
Target Met<br />
by LEA<br />
(Y/N)<br />
N/A<br />
Page 5 of 5
<strong>ARKANSAS</strong> <strong>SPECIAL</strong> <strong>EDUCATION</strong><br />
<strong>DISTRICT</strong> <strong>ANNUAL</strong> PERFORMANCE REPORT<br />
2010/11 School Year<br />
Publication Date: March 2012<br />
Each State must have in place a State Performance Plan (SPP) to evaluate the State's efforts to meet the requirements and<br />
purposes of the implementation of the Individuals with Disabilities Education Act (IDEA). The SPP is a six-year plan, which<br />
describes Arkansas's performance on 20 indicators. The Office of Special Education Programs in the U. S. Department of<br />
Education requires that States report annually to the public on the performance of each local education agency (LEA) on 14 of<br />
20 indicators as compared with targets established by the State in the SPP. Arkansas will report indicators 1 through 14 and<br />
20 for each LEA serving children with disabilities (CWD). Any LEA not meeting targets on compliance indicators (0% for<br />
Indicators 4B, 09 & 10 and 100% for Indicators 11, 12, 13, and 20) are non-compliant with IDEA.<br />
There are no report changes for the 2010/11 school year profile; However, it is important to recognize that: .<br />
1. Indicator 01 (Graduation) is reported a year in arrear (2009/10 graduates) and is based on a four-year cohort. This<br />
means the rate is a measure of students who entered in ninth grade and graduate in four years. The calculation is a<br />
requirement under Title I of the Elementary and Secondary Education Act (ESEA).<br />
2. Indicator 02 (Drop out) is reported a year in arrear. This means the rate is a measure of students who dropped out in<br />
the 2009/10 school year. The Indicator 02 data are aligned with the Common Core of Data (CCD) requirements for<br />
grades 7-12.<br />
3. Indicator 04A and 4B (Suspension/Expulsion) is reported a year in arrear. This means the rate is a measure of<br />
students who had out-of-school suspensions and/or expulsions totaling more than 10 days.<br />
For a complete description of all the Indicators, please visit the special education website at<br />
http://arksped.k12.ar.us/sections/policy.html<br />
LEA: 3806 - SLOAN-HENDRIX SCHOOL <strong>DISTRICT</strong><br />
Indicator 01: Graduation Rates (2009/10 school year) Indicator 02: Dropout Rates (2009/10 school year)<br />
Percent of youth<br />
with IEPs<br />
graduating from<br />
high school with a<br />
regular diploma<br />
State<br />
Rate<br />
State<br />
Target<br />
75.76% 85.00%<br />
LEA<br />
Rate<br />
80.00%<br />
Target Met<br />
by LEA<br />
(Y/N)<br />
N<br />
Percent of<br />
youth with<br />
IEPs dropping<br />
out of high<br />
school<br />
State<br />
Rate<br />
Indicator 03: Assessment on Statewide Benchmark Exam (grades 3-8, 11)<br />
A) Adequate Yearly Progress<br />
n=40<br />
Literacy<br />
Mathematics<br />
Met Disability Subgroup "n"<br />
for Reporting Purposes (Y/N)<br />
State Target for % of Districts Meeting<br />
AYP for Disability Subgroup<br />
State<br />
Target<br />
3.06% 4.20%<br />
LEA<br />
Rate<br />
2.56%<br />
% of Districts Meeting AYP<br />
for Disability Subgroup<br />
Target Met by<br />
LEA (Y/N)<br />
Y<br />
Target Met by<br />
LEA(Y/N)<br />
Overall N 17.15% 6.25%<br />
NA<br />
N<br />
N<br />
Note: For a district to qualify as having a disability subgroup it must have a minimum of 40 (n=40) students with disabilities in a school building.<br />
B) Participation<br />
Participation Rate: # of<br />
CWD Tested ÷ # of CWD<br />
Enrolled in grades tested.<br />
Participation Rate: Literacy<br />
Participation Rate: Math<br />
Note: - - denotes not applicable<br />
State<br />
Rate<br />
98.78%<br />
State<br />
Target<br />
95.00%<br />
LEA<br />
Rate<br />
100.00%<br />
Target Met<br />
by LEA (Y/N)<br />
98.61% 95.00% 100.00% Y<br />
Y<br />
C) Performance Proficiency<br />
Percent of CWD Scoring<br />
Proficient or Above<br />
Proficiency Rate: Literacy<br />
Proficiency Rate:<br />
Mathematics<br />
16.00%<br />
16.00%<br />
State<br />
Rate<br />
31.49%<br />
44.86%<br />
State<br />
Target<br />
45.22%<br />
51.14%<br />
LEA<br />
Rate<br />
24.44%<br />
34.78%<br />
NA<br />
NA<br />
Target<br />
Met by<br />
LEA (Y/N)<br />
N<br />
N<br />
Page 1 of 5
LEA: 3806 - SLOAN-HENDRIX SCHOOL <strong>DISTRICT</strong><br />
Indicator 04: Out-of-School Suspensions and Expulsions (2009/10 school year)<br />
A) Suspension/Expulsion<br />
Percent difference of CWD with out-of- school suspensions and<br />
expulsions totaling greater than 10 days in a school year as<br />
compared to the same data for general education students in<br />
the district.<br />
B) Suspension/Expulsion by Race and Ethnicity<br />
Percent of districts that have: (a) a significant discrepancy, by race or<br />
ethnicity, in the rate of suspensions and expulsions of greater than 10<br />
days in a school year for children with IEPs; and (b) policies,<br />
procedures or practices that contribute to the significant discrepancy<br />
and do not comply with requirements relating to the development<br />
and implementation of IEPs, the use of positive behavioral<br />
interventions and supports, and procedural safeguards.<br />
Indicator 05: School Age (5-21) Least Restrictive Environment<br />
A) In the Regular Class 80% or more of the day<br />
Percent of CWD with<br />
IEPs receiving instruction<br />
in the regular class 80%<br />
or more of the day.<br />
State<br />
Rate<br />
State<br />
Target<br />
LEA<br />
Rate<br />
B) In the Regular Class less than 40% of the day<br />
Percent of CWD with<br />
IEPs receiving instruction<br />
in the regular class less<br />
than 60% of the day.<br />
53.87% 59.77%<br />
State<br />
Rate<br />
State<br />
Target<br />
12.42% 12.51%<br />
58.24%<br />
LEA<br />
Rate<br />
1.10%<br />
C) Other Settings outside the regular class<br />
Percent of CWD with IEPs served in<br />
public or private separate schools,<br />
residential placements, or<br />
homebound/hospital placements.<br />
State<br />
Rate<br />
State<br />
Target<br />
2.80% 2.56%<br />
Target Met<br />
by LEA (Y/N)<br />
N<br />
Target Met<br />
by LEA (Y/N)<br />
Y<br />
LEA<br />
Rate<br />
2.20%<br />
Target Met<br />
by LEA(Y/N)<br />
Indicator 06: Early Childhood (3-5) Least Restrictive Environment<br />
A) Regular Early Childhood Program<br />
Percent of children (aged 3 through 5) with IEPs attending a regular<br />
early childhood program and receiving the majority of special<br />
education and related services in the regular early childhood program<br />
Allowable<br />
Difference<br />
LEA: 3806 - SLOAN-HENDRIX SCHOOL <strong>DISTRICT</strong><br />
Indicator 07: Preschool (3-5) Outcomes<br />
a) Percent of preschool CWD<br />
children who did not<br />
improve functioning.<br />
b) Percent of preschool CWD<br />
who improved but whose<br />
functioning remained below<br />
same age peers.<br />
c) Percent of preschool CWD<br />
who improved at a level<br />
nearer to same aged peers.<br />
d) Percent of preschool CWD<br />
who improved functioning to<br />
reach a level comparable to<br />
same age peers.<br />
e) Percent of preschool CWD<br />
children who maintain<br />
functioning at a level<br />
comparable to same aged<br />
peers.<br />
Summary<br />
Statements<br />
1) Of those preschool<br />
children who entered<br />
the preschool program<br />
below age expectations<br />
in each Outcome, the<br />
percent who<br />
substantially increased<br />
their rate of growth by<br />
the time they turned 6<br />
years of age or exited<br />
the program.<br />
2) The percent of<br />
preschool children who<br />
were functioning<br />
within age expectations<br />
in each Outcome by the<br />
time they turned 6<br />
years of age or exited<br />
A) Positive Social -Emotional<br />
Skills*<br />
State<br />
Rate<br />
A) Positive Social -<br />
Emotional Skills<br />
(Including social<br />
relationships)<br />
State<br />
Rate<br />
2.14%<br />
5.31%<br />
25.97%<br />
38.22%<br />
28.36%<br />
State<br />
Target<br />
LEA<br />
Rate<br />
LEA<br />
Rate<br />
— —<br />
— —<br />
— —<br />
— —<br />
— —<br />
Target<br />
Met by<br />
LEA(Y/N)<br />
B) Acquisition and Use of<br />
Knowledge and Skills<br />
(Including early language/<br />
communication and early literacy)<br />
B) Acquisition and Use of<br />
Knowledge and Skills **<br />
State<br />
Rate<br />
1.75%<br />
6.59%<br />
34.23%<br />
43.51%<br />
13.92%<br />
State<br />
Target<br />
LEA<br />
Rate<br />
Target<br />
Met by<br />
LEA(Y/N)<br />
C) Use of Appropriate Behaviors<br />
to Meet Their Needs<br />
State<br />
Rate<br />
State<br />
Target<br />
LEA<br />
Rate<br />
Target<br />
Met by<br />
LEA(Y/N)<br />
89.61% 90.50% — — N/A 90.31% 90.50% — — N/A 90.82% 92.50% — — N/A<br />
66.58% 69.50% — — N/A 57.43% 60.50% — — N/A 76.69% 78.50% — — N/A<br />
NOTE: * Including social relationships ** Including early language/ communication and early literacy<br />
Note: - - denotes not applicable<br />
State<br />
Rate<br />
LEA<br />
Rate<br />
— —<br />
— —<br />
— —<br />
— —<br />
— —<br />
C) Use of<br />
Appropriate<br />
Behaviors to<br />
Meet Their Needs<br />
State<br />
Rate<br />
4.51%<br />
17.34%<br />
41.72%<br />
34.97%<br />
LEA<br />
Rate<br />
1.46% — —<br />
— —<br />
— —<br />
— —<br />
— —<br />
Page 3 of 5
LEA: 3806 - SLOAN-HENDRIX SCHOOL <strong>DISTRICT</strong><br />
Indicator 08: Parent Involvement<br />
Percent of surveyed<br />
parents who reported<br />
school facilitated parent<br />
involvement as a means<br />
of improving services<br />
and results for children<br />
with disabilities.<br />
Early Childhood<br />
(3-5)<br />
School Age<br />
(5-21)<br />
State<br />
Rate<br />
90.47%<br />
95.05%<br />
Indicator 09: Disproportionality - Eligibility<br />
Disproportionate representation of racial<br />
and ethnic groups in special education and<br />
related services that is a result of<br />
inappropriate identification (e.g.<br />
monitoring data, review of policies,<br />
practices, and procedures under 618(d),<br />
etc.).<br />
State<br />
Rate<br />
State<br />
Target<br />
88.00%<br />
96.00%<br />
State<br />
Target<br />
0.00% 0.00%<br />
LEA<br />
Rate<br />
— —<br />
94.52%<br />
Indicator 10: Disproportionality-Child with a Disability<br />
Disproportionate representation of racial<br />
and ethnic groups in specific disability<br />
categories that is a result of inappropriate<br />
identification (e.g. monitoring data, review<br />
of policies, practices, and procedures under<br />
618(d), etc.).<br />
Indicator 11: Child Find<br />
Percent of children with<br />
parental consent to evaluate<br />
who are evaluated within<br />
the State established timeline<br />
of 60 days.<br />
Overall<br />
(3-21)<br />
Early Childhood<br />
(3-5)<br />
School Age<br />
(5-21)<br />
State<br />
Rate<br />
0.00%<br />
Indicator 12: Early Childhood Transition<br />
Percent of children referred by Part C prior to<br />
age 3, who are found eligible for Part B, and<br />
who have an IEP developed and implemented<br />
by their third birthday.<br />
Note: - - denotes not applicable<br />
State<br />
Rate<br />
99.41%<br />
99.70%<br />
98.97%<br />
State<br />
Rate<br />
State<br />
Target<br />
0.00%<br />
State<br />
Target<br />
100.00%<br />
100.00%<br />
100.00%<br />
State<br />
Target<br />
Target Met by<br />
LEA (Y/N)<br />
Y<br />
Target Met by<br />
LEA (Y/N)<br />
Y<br />
LEA<br />
Rate<br />
100.00%<br />
— —<br />
100.00%<br />
LEA<br />
Rate<br />
Target Met by<br />
LEA (Y/N)<br />
N/A<br />
N<br />
Note: The target for Indicator 09 is to have zero percent<br />
(0%) of districts identified as having disproportionate<br />
representation as a result of inappropriate<br />
identification in eligibility.<br />
Note: The target for Indicator 10 is to have zero<br />
percent (0%) of districts identified as having<br />
disproportionate representation as a result of<br />
inappropriate identification in a disability<br />
category.<br />
Target Met by<br />
LEA (Y/N)<br />
N/A<br />
Y<br />
Target Met<br />
by LEA<br />
(Y/N)<br />
99.21% 100.00% - - N/A<br />
Y<br />
Note: * Indicates a zero reponse rate for the<br />
district.<br />
Page 4 of 5
LEA: 3806 - SLOAN-HENDRIX SCHOOL <strong>DISTRICT</strong><br />
Indicator 13: Secondary Transition<br />
Percent of youth with disabilities aged 16 and<br />
up with an IEP that includes coordinated,<br />
measurable, annual IEP goals and transition<br />
services that will reasonably enable the student<br />
to meet the post-secondary goals.<br />
Indicator 14: Post-School Outcomes<br />
A. Percent of youth enrolled in higher<br />
education within one year of leaving high<br />
school.<br />
State<br />
Rate<br />
State<br />
Target<br />
Note: Data for this Indicator is from the on-site monitoring of LEAs for the given year.<br />
B. Percent of youth enrolled in higher<br />
education or competitively employed<br />
within one year of leaving high school.<br />
C. Percent of youth enrolled in higher<br />
education or in some other postsecondary<br />
education or training program; or<br />
competitively employed or in some other<br />
employment within one year of leaving<br />
high school.<br />
State<br />
Rate<br />
Indicator 20: Reported Data-Timely and Accurate*<br />
District submitted<br />
required data elements<br />
on or before due dates;<br />
made revisions within<br />
the alloted reveiw<br />
periods.<br />
Accurate and Timely<br />
Data Submission<br />
Overall (3-21)<br />
Early Childhood (3-5)<br />
School Age (5-21)<br />
State<br />
Target<br />
100.00%<br />
100.00%<br />
100.00%<br />
State<br />
Target<br />
LEA<br />
Rate<br />
LEA<br />
Rate<br />
Target Met by<br />
LEA (Y/N)<br />
Target Met<br />
by LEA<br />
(Y/N)<br />
Target Met<br />
by LEA<br />
(Y/N)<br />
*Data reviewed for timely and accurate submissions included all APSCN cycle data except for personnel<br />
Note: - - denotes not applicable<br />
96.19 100.00 — — N/A<br />
14.53<br />
State<br />
Rate<br />
49.42<br />
State<br />
Rate<br />
54.07<br />
13.00<br />
State<br />
Target<br />
49.00<br />
State<br />
Target<br />
60.00<br />
Y<br />
N/A<br />
Y<br />
— —<br />
LEA<br />
Rate<br />
— —<br />
LEA<br />
Rate<br />
— —<br />
N/A<br />
Target Met<br />
by LEA<br />
(Y/N)<br />
N/A<br />
Target Met<br />
by LEA<br />
(Y/N)<br />
N/A<br />
Page 5 of 5
LEA: 3809 - HILLCREST SCHOOL <strong>DISTRICT</strong><br />
<strong>ARKANSAS</strong> <strong>SPECIAL</strong> <strong>EDUCATION</strong><br />
<strong>DISTRICT</strong> <strong>ANNUAL</strong> PERFORMANCE REPORT<br />
2010/11 School Year<br />
Publication Date: March 2012<br />
Each State must have in place a State Performance Plan (SPP) to evaluate the State's efforts to meet the requirements and<br />
purposes of the implementation of the Individuals with Disabilities Education Act (IDEA). The SPP is a six-year plan, which<br />
describes Arkansas's performance on 20 indicators. The Office of Special Education Programs in the U. S. Department of<br />
Education requires that States report annually to the public on the performance of each local education agency (LEA) on 14 of<br />
20 indicators as compared with targets established by the State in the SPP. Arkansas will report indicators 1 through 14 and<br />
20 for each LEA serving children with disabilities (CWD). Any LEA not meeting targets on compliance indicators (0% for<br />
Indicators 4B, 09 & 10 and 100% for Indicators 11, 12, 13, and 20) are non-compliant with IDEA.<br />
There are no report changes for the 2010/11 school year profile; However, it is important to recognize that: .<br />
1. Indicator 01 (Graduation) is reported a year in arrear (2009/10 graduates) and is based on a four-year cohort. This<br />
means the rate is a measure of students who entered in ninth grade and graduate in four years. The calculation is a<br />
requirement under Title I of the Elementary and Secondary Education Act (ESEA).<br />
2. Indicator 02 (Drop out) is reported a year in arrear. This means the rate is a measure of students who dropped out in<br />
the 2009/10 school year. The Indicator 02 data are aligned with the Common Core of Data (CCD) requirements for<br />
grades 7-12.<br />
3. Indicator 04A and 4B (Suspension/Expulsion) is reported a year in arrear. This means the rate is a measure of<br />
students who had out-of-school suspensions and/or expulsions totaling more than 10 days.<br />
Percent of youth<br />
with IEPs<br />
graduating from<br />
high school with a<br />
regular diploma<br />
For a complete description of all the Indicators, please visit the special education website at<br />
http://arksped.k12.ar.us/sections/policy.html<br />
Indicator 01: Graduation Rates (2009/10 school year) Indicator 02: Dropout Rates (2009/10 school year)<br />
State<br />
Rate<br />
State<br />
Target<br />
75.76% 85.00%<br />
LEA<br />
Rate<br />
75.00%<br />
Target Met<br />
by LEA<br />
(Y/N)<br />
N<br />
Percent of<br />
youth with<br />
IEPs dropping<br />
out of high<br />
school<br />
State<br />
Rate<br />
Indicator 03: Assessment on Statewide Benchmark Exam (grades 3-8, 11)<br />
A) Adequate Yearly Progress<br />
n=40<br />
Literacy<br />
Mathematics<br />
Met Disability Subgroup "n"<br />
for Reporting Purposes (Y/N)<br />
State Target for % of Districts Meeting<br />
AYP for Disability Subgroup<br />
State<br />
Target<br />
3.06% 4.20%<br />
LEA<br />
Rate<br />
5.88%<br />
% of Districts Meeting AYP<br />
for Disability Subgroup<br />
Target Met by<br />
LEA (Y/N)<br />
N<br />
Target Met by<br />
LEA(Y/N)<br />
Overall N 17.15% 6.25%<br />
NA<br />
N<br />
N<br />
Note: For a district to qualify as having a disability subgroup it must have a minimum of 40 (n=40) students with disabilities in a school building.<br />
B) Participation<br />
Participation Rate: # of<br />
CWD Tested ÷ # of CWD<br />
Enrolled in grades tested.<br />
Participation Rate: Literacy<br />
Participation Rate: Math<br />
Note: - - denotes not applicable<br />
State<br />
Rate<br />
98.78%<br />
State<br />
Target<br />
95.00%<br />
LEA<br />
Rate<br />
100.00%<br />
Target Met<br />
by LEA (Y/N)<br />
98.61% 95.00% 100.00% Y<br />
Y<br />
C) Performance Proficiency<br />
Percent of CWD Scoring<br />
Proficient or Above<br />
Proficiency Rate: Literacy<br />
Proficiency Rate:<br />
Mathematics<br />
16.00%<br />
16.00%<br />
State<br />
Rate<br />
31.49%<br />
44.86%<br />
State<br />
Target<br />
45.22%<br />
51.14%<br />
LEA<br />
Rate<br />
24.24%<br />
50.00%<br />
NA<br />
NA<br />
Target<br />
Met by<br />
LEA (Y/N)<br />
N<br />
N<br />
Page 1 of 5
LEA: 3809 - HILLCREST SCHOOL <strong>DISTRICT</strong><br />
Indicator 04: Out-of-School Suspensions and Expulsions (2009/10 school year)<br />
A) Suspension/Expulsion<br />
Percent difference of CWD with out-of- school suspensions and<br />
expulsions totaling greater than 10 days in a school year as<br />
compared to the same data for general education students in<br />
the district.<br />
B) Suspension/Expulsion by Race and Ethnicity<br />
Percent of districts that have: (a) a significant discrepancy, by race or<br />
ethnicity, in the rate of suspensions and expulsions of greater than 10<br />
days in a school year for children with IEPs; and (b) policies,<br />
procedures or practices that contribute to the significant discrepancy<br />
and do not comply with requirements relating to the development<br />
and implementation of IEPs, the use of positive behavioral<br />
interventions and supports, and procedural safeguards.<br />
Indicator 05: School Age (5-21) Least Restrictive Environment<br />
A) In the Regular Class 80% or more of the day<br />
Percent of CWD with<br />
IEPs receiving instruction<br />
in the regular class 80%<br />
or more of the day.<br />
State<br />
Rate<br />
State<br />
Target<br />
LEA<br />
Rate<br />
B) In the Regular Class less than 40% of the day<br />
Percent of CWD with<br />
IEPs receiving instruction<br />
in the regular class less<br />
than 60% of the day.<br />
53.87% 59.77%<br />
State<br />
Rate<br />
State<br />
Target<br />
12.42% 12.51%<br />
51.61%<br />
LEA<br />
Rate<br />
3.23%<br />
C) Other Settings outside the regular class<br />
Percent of CWD with IEPs served in<br />
public or private separate schools,<br />
residential placements, or<br />
homebound/hospital placements.<br />
State<br />
Rate<br />
State<br />
Target<br />
2.80% 2.56%<br />
Target Met<br />
by LEA (Y/N)<br />
N<br />
Target Met<br />
by LEA (Y/N)<br />
Y<br />
LEA<br />
Rate<br />
1.61%<br />
Target Met<br />
by LEA(Y/N)<br />
Indicator 06: Early Childhood (3-5) Least Restrictive Environment<br />
A) Regular Early Childhood Program<br />
Percent of children (aged 3 through 5) with IEPs attending a regular<br />
early childhood program and receiving the majority of special<br />
education and related services in the regular early childhood program<br />
Allowable<br />
Difference<br />
LEA: 3809 - HILLCREST SCHOOL <strong>DISTRICT</strong><br />
Indicator 07: Preschool (3-5) Outcomes<br />
a) Percent of preschool CWD<br />
children who did not<br />
improve functioning.<br />
b) Percent of preschool CWD<br />
who improved but whose<br />
functioning remained below<br />
same age peers.<br />
c) Percent of preschool CWD<br />
who improved at a level<br />
nearer to same aged peers.<br />
d) Percent of preschool CWD<br />
who improved functioning to<br />
reach a level comparable to<br />
same age peers.<br />
e) Percent of preschool CWD<br />
children who maintain<br />
functioning at a level<br />
comparable to same aged<br />
peers.<br />
Summary<br />
Statements<br />
1) Of those preschool<br />
children who entered<br />
the preschool program<br />
below age expectations<br />
in each Outcome, the<br />
percent who<br />
substantially increased<br />
their rate of growth by<br />
the time they turned 6<br />
years of age or exited<br />
the program.<br />
2) The percent of<br />
preschool children who<br />
were functioning<br />
within age expectations<br />
in each Outcome by the<br />
time they turned 6<br />
years of age or exited<br />
A) Positive Social -Emotional<br />
Skills*<br />
State<br />
Rate<br />
A) Positive Social -<br />
Emotional Skills<br />
(Including social<br />
relationships)<br />
State<br />
Rate<br />
2.14%<br />
5.31%<br />
25.97%<br />
38.22%<br />
28.36%<br />
State<br />
Target<br />
LEA<br />
Rate<br />
LEA<br />
Rate<br />
— —<br />
— —<br />
— —<br />
— —<br />
— —<br />
Target<br />
Met by<br />
LEA(Y/N)<br />
B) Acquisition and Use of<br />
Knowledge and Skills<br />
(Including early language/<br />
communication and early literacy)<br />
B) Acquisition and Use of<br />
Knowledge and Skills **<br />
State<br />
Rate<br />
1.75%<br />
6.59%<br />
34.23%<br />
43.51%<br />
13.92%<br />
State<br />
Target<br />
LEA<br />
Rate<br />
Target<br />
Met by<br />
LEA(Y/N)<br />
C) Use of Appropriate Behaviors<br />
to Meet Their Needs<br />
State<br />
Rate<br />
State<br />
Target<br />
LEA<br />
Rate<br />
Target<br />
Met by<br />
LEA(Y/N)<br />
89.61% 90.50% — — N/A 90.31% 90.50% — — N/A 90.82% 92.50% — — N/A<br />
66.58% 69.50% — — N/A 57.43% 60.50% — — N/A 76.69% 78.50% — — N/A<br />
NOTE: * Including social relationships ** Including early language/ communication and early literacy<br />
Note: - - denotes not applicable<br />
State<br />
Rate<br />
LEA<br />
Rate<br />
— —<br />
— —<br />
— —<br />
— —<br />
— —<br />
C) Use of<br />
Appropriate<br />
Behaviors to<br />
Meet Their Needs<br />
State<br />
Rate<br />
4.51%<br />
17.34%<br />
41.72%<br />
34.97%<br />
LEA<br />
Rate<br />
1.46% — —<br />
— —<br />
— —<br />
— —<br />
— —<br />
Page 3 of 5
LEA: 3809 - HILLCREST SCHOOL <strong>DISTRICT</strong><br />
Indicator 08: Parent Involvement<br />
Percent of surveyed<br />
parents who reported<br />
school facilitated parent<br />
involvement as a means<br />
of improving services<br />
and results for children<br />
with disabilities.<br />
Early Childhood<br />
(3-5)<br />
School Age<br />
(5-21)<br />
State<br />
Rate<br />
90.47%<br />
95.05%<br />
Indicator 09: Disproportionality - Eligibility<br />
Disproportionate representation of racial<br />
and ethnic groups in special education and<br />
related services that is a result of<br />
inappropriate identification (e.g.<br />
monitoring data, review of policies,<br />
practices, and procedures under 618(d),<br />
etc.).<br />
State<br />
Rate<br />
State<br />
Target<br />
88.00%<br />
96.00%<br />
State<br />
Target<br />
0.00% 0.00%<br />
LEA<br />
Rate<br />
— —<br />
100.00%<br />
Indicator 10: Disproportionality-Child with a Disability<br />
Disproportionate representation of racial<br />
and ethnic groups in specific disability<br />
categories that is a result of inappropriate<br />
identification (e.g. monitoring data, review<br />
of policies, practices, and procedures under<br />
618(d), etc.).<br />
Indicator 11: Child Find<br />
Percent of children with<br />
parental consent to evaluate<br />
who are evaluated within<br />
the State established timeline<br />
of 60 days.<br />
Overall<br />
(3-21)<br />
Early Childhood<br />
(3-5)<br />
School Age<br />
(5-21)<br />
State<br />
Rate<br />
0.00%<br />
Indicator 12: Early Childhood Transition<br />
Percent of children referred by Part C prior to<br />
age 3, who are found eligible for Part B, and<br />
who have an IEP developed and implemented<br />
by their third birthday.<br />
Note: - - denotes not applicable<br />
State<br />
Rate<br />
99.41%<br />
99.70%<br />
98.97%<br />
State<br />
Rate<br />
State<br />
Target<br />
0.00%<br />
State<br />
Target<br />
100.00%<br />
100.00%<br />
100.00%<br />
State<br />
Target<br />
Target Met by<br />
LEA (Y/N)<br />
Y<br />
Target Met by<br />
LEA (Y/N)<br />
Y<br />
LEA<br />
Rate<br />
100.00%<br />
— —<br />
100.00%<br />
LEA<br />
Rate<br />
Target Met by<br />
LEA (Y/N)<br />
N/A<br />
Y<br />
Note: The target for Indicator 09 is to have zero percent<br />
(0%) of districts identified as having disproportionate<br />
representation as a result of inappropriate<br />
identification in eligibility.<br />
Note: The target for Indicator 10 is to have zero<br />
percent (0%) of districts identified as having<br />
disproportionate representation as a result of<br />
inappropriate identification in a disability<br />
category.<br />
Target Met by<br />
LEA (Y/N)<br />
N/A<br />
Y<br />
Target Met<br />
by LEA<br />
(Y/N)<br />
99.21% 100.00% - - N/A<br />
Y<br />
Note: * Indicates a zero reponse rate for the<br />
district.<br />
Page 4 of 5
LEA: 3809 - HILLCREST SCHOOL <strong>DISTRICT</strong><br />
Indicator 13: Secondary Transition<br />
Percent of youth with disabilities aged 16 and<br />
up with an IEP that includes coordinated,<br />
measurable, annual IEP goals and transition<br />
services that will reasonably enable the student<br />
to meet the post-secondary goals.<br />
Indicator 14: Post-School Outcomes<br />
A. Percent of youth enrolled in higher<br />
education within one year of leaving high<br />
school.<br />
State<br />
Rate<br />
State<br />
Target<br />
Note: Data for this Indicator is from the on-site monitoring of LEAs for the given year.<br />
B. Percent of youth enrolled in higher<br />
education or competitively employed<br />
within one year of leaving high school.<br />
C. Percent of youth enrolled in higher<br />
education or in some other postsecondary<br />
education or training program; or<br />
competitively employed or in some other<br />
employment within one year of leaving<br />
high school.<br />
State<br />
Rate<br />
Indicator 20: Reported Data-Timely and Accurate*<br />
District submitted<br />
required data elements<br />
on or before due dates;<br />
made revisions within<br />
the alloted reveiw<br />
periods.<br />
Accurate and Timely<br />
Data Submission<br />
Overall (3-21)<br />
Early Childhood (3-5)<br />
School Age (5-21)<br />
State<br />
Target<br />
100.00%<br />
100.00%<br />
100.00%<br />
State<br />
Target<br />
LEA<br />
Rate<br />
LEA<br />
Rate<br />
Target Met by<br />
LEA (Y/N)<br />
Target Met<br />
by LEA<br />
(Y/N)<br />
Target Met<br />
by LEA<br />
(Y/N)<br />
*Data reviewed for timely and accurate submissions included all APSCN cycle data except for personnel<br />
Note: - - denotes not applicable<br />
96.19 100.00 — — N/A<br />
14.53<br />
State<br />
Rate<br />
49.42<br />
State<br />
Rate<br />
54.07<br />
13.00<br />
State<br />
Target<br />
49.00<br />
State<br />
Target<br />
60.00<br />
Y<br />
N/A<br />
Y<br />
— —<br />
LEA<br />
Rate<br />
— —<br />
LEA<br />
Rate<br />
— —<br />
N/A<br />
Target Met<br />
by LEA<br />
(Y/N)<br />
N/A<br />
Target Met<br />
by LEA<br />
(Y/N)<br />
N/A<br />
Page 5 of 5
LEA: 3810 - LAWRENCE COUNTY<br />
<strong>ARKANSAS</strong> <strong>SPECIAL</strong> <strong>EDUCATION</strong><br />
<strong>DISTRICT</strong> <strong>ANNUAL</strong> PERFORMANCE REPORT<br />
2010/11 School Year<br />
Publication Date: March 2012<br />
Each State must have in place a State Performance Plan (SPP) to evaluate the State's efforts to meet the requirements and<br />
purposes of the implementation of the Individuals with Disabilities Education Act (IDEA). The SPP is a six-year plan, which<br />
describes Arkansas's performance on 20 indicators. The Office of Special Education Programs in the U. S. Department of<br />
Education requires that States report annually to the public on the performance of each local education agency (LEA) on 14 of<br />
20 indicators as compared with targets established by the State in the SPP. Arkansas will report indicators 1 through 14 and<br />
20 for each LEA serving children with disabilities (CWD). Any LEA not meeting targets on compliance indicators (0% for<br />
Indicators 4B, 09 & 10 and 100% for Indicators 11, 12, 13, and 20) are non-compliant with IDEA.<br />
There are no report changes for the 2010/11 school year profile; However, it is important to recognize that: .<br />
1. Indicator 01 (Graduation) is reported a year in arrear (2009/10 graduates) and is based on a four-year cohort. This<br />
means the rate is a measure of students who entered in ninth grade and graduate in four years. The calculation is a<br />
requirement under Title I of the Elementary and Secondary Education Act (ESEA).<br />
2. Indicator 02 (Drop out) is reported a year in arrear. This means the rate is a measure of students who dropped out in<br />
the 2009/10 school year. The Indicator 02 data are aligned with the Common Core of Data (CCD) requirements for<br />
grades 7-12.<br />
3. Indicator 04A and 4B (Suspension/Expulsion) is reported a year in arrear. This means the rate is a measure of<br />
students who had out-of-school suspensions and/or expulsions totaling more than 10 days.<br />
Percent of youth<br />
with IEPs<br />
graduating from<br />
high school with a<br />
regular diploma<br />
For a complete description of all the Indicators, please visit the special education website at<br />
http://arksped.k12.ar.us/sections/policy.html<br />
Indicator 01: Graduation Rates (2009/10 school year) Indicator 02: Dropout Rates (2009/10 school year)<br />
State<br />
Rate<br />
State<br />
Target<br />
75.76% 85.00%<br />
LEA<br />
Rate<br />
86.67%<br />
Target Met<br />
by LEA<br />
(Y/N)<br />
Y<br />
Percent of<br />
youth with<br />
IEPs dropping<br />
out of high<br />
school<br />
State<br />
Rate<br />
Indicator 03: Assessment on Statewide Benchmark Exam (grades 3-8, 11)<br />
A) Adequate Yearly Progress<br />
n=40<br />
Literacy<br />
Mathematics<br />
Met Disability Subgroup "n"<br />
for Reporting Purposes (Y/N)<br />
State Target for % of Districts Meeting<br />
AYP for Disability Subgroup<br />
State<br />
Target<br />
3.06% 4.20%<br />
LEA<br />
Rate<br />
4.11%<br />
% of Districts Meeting AYP<br />
for Disability Subgroup<br />
Target Met by<br />
LEA (Y/N)<br />
Y<br />
Target Met by<br />
LEA(Y/N)<br />
Overall N 17.15% 6.25%<br />
NA<br />
N<br />
N<br />
Note: For a district to qualify as having a disability subgroup it must have a minimum of 40 (n=40) students with disabilities in a school building.<br />
B) Participation<br />
Participation Rate: # of<br />
CWD Tested ÷ # of CWD<br />
Enrolled in grades tested.<br />
Participation Rate: Literacy<br />
Participation Rate: Math<br />
Note: - - denotes not applicable<br />
State<br />
Rate<br />
98.78%<br />
State<br />
Target<br />
95.00%<br />
LEA<br />
Rate<br />
97.10%<br />
Target Met<br />
by LEA (Y/N)<br />
98.61% 95.00% 98.51% Y<br />
Y<br />
C) Performance Proficiency<br />
Percent of CWD Scoring<br />
Proficient or Above<br />
Proficiency Rate: Literacy<br />
Proficiency Rate:<br />
Mathematics<br />
16.00%<br />
16.00%<br />
State<br />
Rate<br />
31.49%<br />
44.86%<br />
State<br />
Target<br />
45.22%<br />
51.14%<br />
LEA<br />
Rate<br />
26.67%<br />
41.67%<br />
NA<br />
NA<br />
Target<br />
Met by<br />
LEA (Y/N)<br />
N<br />
N<br />
Page 1 of 5
LEA: 3810 - LAWRENCE COUNTY<br />
Indicator 04: Out-of-School Suspensions and Expulsions (2009/10 school year)<br />
A) Suspension/Expulsion<br />
Percent difference of CWD with out-of- school suspensions and<br />
expulsions totaling greater than 10 days in a school year as<br />
compared to the same data for general education students in<br />
the district.<br />
B) Suspension/Expulsion by Race and Ethnicity<br />
Percent of districts that have: (a) a significant discrepancy, by race or<br />
ethnicity, in the rate of suspensions and expulsions of greater than 10<br />
days in a school year for children with IEPs; and (b) policies,<br />
procedures or practices that contribute to the significant discrepancy<br />
and do not comply with requirements relating to the development<br />
and implementation of IEPs, the use of positive behavioral<br />
interventions and supports, and procedural safeguards.<br />
Indicator 05: School Age (5-21) Least Restrictive Environment<br />
A) In the Regular Class 80% or more of the day<br />
Percent of CWD with<br />
IEPs receiving instruction<br />
in the regular class 80%<br />
or more of the day.<br />
State<br />
Rate<br />
State<br />
Target<br />
LEA<br />
Rate<br />
B) In the Regular Class less than 40% of the day<br />
Percent of CWD with<br />
IEPs receiving instruction<br />
in the regular class less<br />
than 60% of the day.<br />
53.87% 59.77%<br />
State<br />
Rate<br />
State<br />
Target<br />
12.42% 12.51%<br />
61.35%<br />
LEA<br />
Rate<br />
7.36%<br />
C) Other Settings outside the regular class<br />
Percent of CWD with IEPs served in<br />
public or private separate schools,<br />
residential placements, or<br />
homebound/hospital placements.<br />
State<br />
Rate<br />
State<br />
Target<br />
2.80% 2.56%<br />
Target Met<br />
by LEA (Y/N)<br />
Y<br />
Target Met<br />
by LEA (Y/N)<br />
Y<br />
LEA<br />
Rate<br />
0.00%<br />
Target Met<br />
by LEA(Y/N)<br />
Indicator 06: Early Childhood (3-5) Least Restrictive Environment<br />
A) Regular Early Childhood Program<br />
Percent of children (aged 3 through 5) with IEPs attending a regular<br />
early childhood program and receiving the majority of special<br />
education and related services in the regular early childhood program<br />
Allowable<br />
Difference<br />
LEA: 3810 - LAWRENCE COUNTY<br />
Indicator 07: Preschool (3-5) Outcomes<br />
a) Percent of preschool CWD<br />
children who did not<br />
improve functioning.<br />
b) Percent of preschool CWD<br />
who improved but whose<br />
functioning remained below<br />
same age peers.<br />
c) Percent of preschool CWD<br />
who improved at a level<br />
nearer to same aged peers.<br />
d) Percent of preschool CWD<br />
who improved functioning to<br />
reach a level comparable to<br />
same age peers.<br />
e) Percent of preschool CWD<br />
children who maintain<br />
functioning at a level<br />
comparable to same aged<br />
peers.<br />
Summary<br />
Statements<br />
1) Of those preschool<br />
children who entered<br />
the preschool program<br />
below age expectations<br />
in each Outcome, the<br />
percent who<br />
substantially increased<br />
their rate of growth by<br />
the time they turned 6<br />
years of age or exited<br />
the program.<br />
2) The percent of<br />
preschool children who<br />
were functioning<br />
within age expectations<br />
in each Outcome by the<br />
time they turned 6<br />
years of age or exited<br />
A) Positive Social -Emotional<br />
Skills*<br />
State<br />
Rate<br />
A) Positive Social -<br />
Emotional Skills<br />
(Including social<br />
relationships)<br />
State<br />
Rate<br />
2.14%<br />
5.31%<br />
25.97%<br />
38.22%<br />
28.36%<br />
State<br />
Target<br />
LEA<br />
Rate<br />
LEA<br />
Rate<br />
— —<br />
— —<br />
— —<br />
— —<br />
— —<br />
Target<br />
Met by<br />
LEA(Y/N)<br />
B) Acquisition and Use of<br />
Knowledge and Skills<br />
(Including early language/<br />
communication and early literacy)<br />
B) Acquisition and Use of<br />
Knowledge and Skills **<br />
State<br />
Rate<br />
1.75%<br />
6.59%<br />
34.23%<br />
43.51%<br />
13.92%<br />
State<br />
Target<br />
LEA<br />
Rate<br />
Target<br />
Met by<br />
LEA(Y/N)<br />
C) Use of Appropriate Behaviors<br />
to Meet Their Needs<br />
State<br />
Rate<br />
State<br />
Target<br />
LEA<br />
Rate<br />
Target<br />
Met by<br />
LEA(Y/N)<br />
89.61% 90.50% — — N/A 90.31% 90.50% — — N/A 90.82% 92.50% — — N/A<br />
66.58% 69.50% — — N/A 57.43% 60.50% — — N/A 76.69% 78.50% — — N/A<br />
NOTE: * Including social relationships ** Including early language/ communication and early literacy<br />
Note: - - denotes not applicable<br />
State<br />
Rate<br />
LEA<br />
Rate<br />
— —<br />
— —<br />
— —<br />
— —<br />
— —<br />
C) Use of<br />
Appropriate<br />
Behaviors to<br />
Meet Their Needs<br />
State<br />
Rate<br />
4.51%<br />
17.34%<br />
41.72%<br />
34.97%<br />
LEA<br />
Rate<br />
1.46% — —<br />
— —<br />
— —<br />
— —<br />
— —<br />
Page 3 of 5
LEA: 3810 - LAWRENCE COUNTY<br />
Indicator 08: Parent Involvement<br />
Percent of surveyed<br />
parents who reported<br />
school facilitated parent<br />
involvement as a means<br />
of improving services<br />
and results for children<br />
with disabilities.<br />
Early Childhood<br />
(3-5)<br />
School Age<br />
(5-21)<br />
State<br />
Rate<br />
90.47%<br />
95.05%<br />
Indicator 09: Disproportionality - Eligibility<br />
Disproportionate representation of racial<br />
and ethnic groups in special education and<br />
related services that is a result of<br />
inappropriate identification (e.g.<br />
monitoring data, review of policies,<br />
practices, and procedures under 618(d),<br />
etc.).<br />
State<br />
Rate<br />
State<br />
Target<br />
88.00%<br />
96.00%<br />
State<br />
Target<br />
0.00% 0.00%<br />
LEA<br />
Rate<br />
— —<br />
95.45%<br />
Indicator 10: Disproportionality-Child with a Disability<br />
Disproportionate representation of racial<br />
and ethnic groups in specific disability<br />
categories that is a result of inappropriate<br />
identification (e.g. monitoring data, review<br />
of policies, practices, and procedures under<br />
618(d), etc.).<br />
Indicator 11: Child Find<br />
Percent of children with<br />
parental consent to evaluate<br />
who are evaluated within<br />
the State established timeline<br />
of 60 days.<br />
Overall<br />
(3-21)<br />
Early Childhood<br />
(3-5)<br />
School Age<br />
(5-21)<br />
State<br />
Rate<br />
0.00%<br />
Indicator 12: Early Childhood Transition<br />
Percent of children referred by Part C prior to<br />
age 3, who are found eligible for Part B, and<br />
who have an IEP developed and implemented<br />
by their third birthday.<br />
Note: - - denotes not applicable<br />
State<br />
Rate<br />
99.41%<br />
99.70%<br />
98.97%<br />
State<br />
Rate<br />
State<br />
Target<br />
0.00%<br />
State<br />
Target<br />
100.00%<br />
100.00%<br />
100.00%<br />
State<br />
Target<br />
Target Met by<br />
LEA (Y/N)<br />
Y<br />
Target Met by<br />
LEA (Y/N)<br />
Y<br />
LEA<br />
Rate<br />
95.24%<br />
— —<br />
95.24%<br />
LEA<br />
Rate<br />
Target Met by<br />
LEA (Y/N)<br />
N/A<br />
N<br />
Note: The target for Indicator 09 is to have zero percent<br />
(0%) of districts identified as having disproportionate<br />
representation as a result of inappropriate<br />
identification in eligibility.<br />
Note: The target for Indicator 10 is to have zero<br />
percent (0%) of districts identified as having<br />
disproportionate representation as a result of<br />
inappropriate identification in a disability<br />
category.<br />
Target Met by<br />
LEA (Y/N)<br />
N/A<br />
N<br />
Target Met<br />
by LEA<br />
(Y/N)<br />
99.21% 100.00% - - N/A<br />
N<br />
Note: * Indicates a zero reponse rate for the<br />
district.<br />
Page 4 of 5
LEA: 3810 - LAWRENCE COUNTY<br />
Indicator 13: Secondary Transition<br />
Percent of youth with disabilities aged 16 and<br />
up with an IEP that includes coordinated,<br />
measurable, annual IEP goals and transition<br />
services that will reasonably enable the student<br />
to meet the post-secondary goals.<br />
Indicator 14: Post-School Outcomes<br />
A. Percent of youth enrolled in higher<br />
education within one year of leaving high<br />
school.<br />
State<br />
Rate<br />
State<br />
Target<br />
Note: Data for this Indicator is from the on-site monitoring of LEAs for the given year.<br />
B. Percent of youth enrolled in higher<br />
education or competitively employed<br />
within one year of leaving high school.<br />
C. Percent of youth enrolled in higher<br />
education or in some other postsecondary<br />
education or training program; or<br />
competitively employed or in some other<br />
employment within one year of leaving<br />
high school.<br />
State<br />
Rate<br />
Indicator 20: Reported Data-Timely and Accurate*<br />
District submitted<br />
required data elements<br />
on or before due dates;<br />
made revisions within<br />
the alloted reveiw<br />
periods.<br />
Accurate and Timely<br />
Data Submission<br />
Overall (3-21)<br />
Early Childhood (3-5)<br />
School Age (5-21)<br />
State<br />
Target<br />
100.00%<br />
100.00%<br />
100.00%<br />
State<br />
Target<br />
LEA<br />
Rate<br />
LEA<br />
Rate<br />
Target Met by<br />
LEA (Y/N)<br />
Target Met<br />
by LEA<br />
(Y/N)<br />
Target Met<br />
by LEA<br />
(Y/N)<br />
*Data reviewed for timely and accurate submissions included all APSCN cycle data except for personnel<br />
Note: - - denotes not applicable<br />
96.19 100.00 — — N/A<br />
14.53<br />
State<br />
Rate<br />
49.42<br />
State<br />
Rate<br />
54.07<br />
13.00<br />
State<br />
Target<br />
49.00<br />
State<br />
Target<br />
60.00<br />
Y<br />
N/A<br />
Y<br />
— —<br />
LEA<br />
Rate<br />
— —<br />
LEA<br />
Rate<br />
— —<br />
N/A<br />
Target Met<br />
by LEA<br />
(Y/N)<br />
N/A<br />
Target Met<br />
by LEA<br />
(Y/N)<br />
N/A<br />
Page 5 of 5
<strong>ARKANSAS</strong> <strong>SPECIAL</strong> <strong>EDUCATION</strong><br />
<strong>DISTRICT</strong> <strong>ANNUAL</strong> PERFORMANCE REPORT<br />
2010/11 School Year<br />
Publication Date: March 2012<br />
Each State must have in place a State Performance Plan (SPP) to evaluate the State's efforts to meet the requirements and<br />
purposes of the implementation of the Individuals with Disabilities Education Act (IDEA). The SPP is a six-year plan, which<br />
describes Arkansas's performance on 20 indicators. The Office of Special Education Programs in the U. S. Department of<br />
Education requires that States report annually to the public on the performance of each local education agency (LEA) on 14 of<br />
20 indicators as compared with targets established by the State in the SPP. Arkansas will report indicators 1 through 14 and<br />
20 for each LEA serving children with disabilities (CWD). Any LEA not meeting targets on compliance indicators (0% for<br />
Indicators 4B, 09 & 10 and 100% for Indicators 11, 12, 13, and 20) are non-compliant with IDEA.<br />
There are no report changes for the 2010/11 school year profile; However, it is important to recognize that: .<br />
1. Indicator 01 (Graduation) is reported a year in arrear (2009/10 graduates) and is based on a four-year cohort. This<br />
means the rate is a measure of students who entered in ninth grade and graduate in four years. The calculation is a<br />
requirement under Title I of the Elementary and Secondary Education Act (ESEA).<br />
2. Indicator 02 (Drop out) is reported a year in arrear. This means the rate is a measure of students who dropped out in<br />
the 2009/10 school year. The Indicator 02 data are aligned with the Common Core of Data (CCD) requirements for<br />
grades 7-12.<br />
3. Indicator 04A and 4B (Suspension/Expulsion) is reported a year in arrear. This means the rate is a measure of<br />
students who had out-of-school suspensions and/or expulsions totaling more than 10 days.<br />
For a complete description of all the Indicators, please visit the special education website at<br />
http://arksped.k12.ar.us/sections/policy.html<br />
LEA: 3820 - NORTHEAST <strong>ARKANSAS</strong> <strong>EDUCATION</strong> SERVICE CENTER<br />
Indicator 01: Graduation Rates (2009/10 school year) Indicator 02: Dropout Rates (2009/10 school year)<br />
Percent of youth<br />
with IEPs<br />
graduating from<br />
high school with a<br />
regular diploma<br />
State<br />
Rate<br />
State<br />
Target<br />
75.76% 85.00%<br />
LEA<br />
Rate<br />
— —<br />
Target Met<br />
by LEA<br />
(Y/N)<br />
NA<br />
Percent of<br />
youth with<br />
IEPs dropping<br />
out of high<br />
school<br />
State<br />
Rate<br />
Indicator 03: Assessment on Statewide Benchmark Exam (grades 3-8, 11)<br />
A) Adequate Yearly Progress<br />
n=40<br />
Literacy<br />
Mathematics<br />
Met Disability Subgroup "n"<br />
for Reporting Purposes (Y/N)<br />
State Target for % of Districts Meeting<br />
AYP for Disability Subgroup<br />
State<br />
Target<br />
3.06% 4.20%<br />
LEA<br />
Rate<br />
— —<br />
% of Districts Meeting AYP<br />
for Disability Subgroup<br />
Target Met by<br />
LEA (Y/N)<br />
N/A<br />
Target Met by<br />
LEA(Y/N)<br />
Overall N/A 17.15% 6.25%<br />
N/A<br />
N/A<br />
N/A<br />
Note: For a district to qualify as having a disability subgroup it must have a minimum of 40 (n=40) students with disabilities in a school building.<br />
B) Participation<br />
Participation Rate: # of<br />
CWD Tested ÷ # of CWD<br />
Enrolled in grades tested.<br />
Participation Rate: Literacy<br />
Participation Rate: Math<br />
Note: - - denotes not applicable<br />
State<br />
Rate<br />
98.78%<br />
State<br />
Target<br />
95.00%<br />
LEA<br />
Rate<br />
— —<br />
Target Met<br />
by LEA (Y/N)<br />
N/A<br />
98.61% 95.00% — — N/A<br />
C) Performance Proficiency<br />
Percent of CWD Scoring<br />
Proficient or Above<br />
Proficiency Rate: Literacy<br />
Proficiency Rate:<br />
Mathematics<br />
16.00%<br />
16.00%<br />
State<br />
Rate<br />
31.49%<br />
44.86%<br />
State<br />
Target<br />
45.22%<br />
51.14%<br />
LEA<br />
Rate<br />
— —<br />
— —<br />
N/A<br />
N/A<br />
Target<br />
Met by<br />
LEA (Y/N)<br />
N/A<br />
N/A<br />
Page 1 of 5
LEA: 3820 - NORTHEAST <strong>ARKANSAS</strong> <strong>EDUCATION</strong> SERVICE CENTER<br />
Indicator 04: Out-of-School Suspensions and Expulsions (2009/10 school year)<br />
A) Suspension/Expulsion<br />
Percent difference of CWD with out-of- school suspensions and<br />
expulsions totaling greater than 10 days in a school year as<br />
compared to the same data for general education students in<br />
the district.<br />
B) Suspension/Expulsion by Race and Ethnicity<br />
Percent of districts that have: (a) a significant discrepancy, by race or<br />
ethnicity, in the rate of suspensions and expulsions of greater than 10<br />
days in a school year for children with IEPs; and (b) policies,<br />
procedures or practices that contribute to the significant discrepancy<br />
and do not comply with requirements relating to the development<br />
and implementation of IEPs, the use of positive behavioral<br />
interventions and supports, and procedural safeguards.<br />
Indicator 05: School Age (5-21) Least Restrictive Environment<br />
A) In the Regular Class 80% or more of the day<br />
Percent of CWD with<br />
IEPs receiving instruction<br />
in the regular class 80%<br />
or more of the day.<br />
State<br />
Rate<br />
State<br />
Target<br />
LEA<br />
Rate<br />
B) In the Regular Class less than 40% of the day<br />
Percent of CWD with<br />
IEPs receiving instruction<br />
in the regular class less<br />
than 60% of the day.<br />
53.87% 59.77%<br />
State<br />
Rate<br />
State<br />
Target<br />
12.42% 12.51%<br />
— —<br />
LEA<br />
Rate<br />
— —<br />
C) Other Settings outside the regular class<br />
Percent of CWD with IEPs served in<br />
public or private separate schools,<br />
residential placements, or<br />
homebound/hospital placements.<br />
State<br />
Rate<br />
State<br />
Target<br />
2.80% 2.56%<br />
Target Met<br />
by LEA (Y/N)<br />
N/A<br />
Target Met<br />
by LEA (Y/N)<br />
N/A<br />
LEA<br />
Rate<br />
— —<br />
Target Met<br />
by LEA(Y/N)<br />
N/A<br />
Indicator 06: Early Childhood (3-5) Least Restrictive Environment<br />
A) Regular Early Childhood Program<br />
Percent of children (aged 3 through 5) with IEPs attending a regular<br />
early childhood program and receiving the majority of special<br />
education and related services in the regular early childhood program<br />
Allowable<br />
Difference<br />
LEA: 3820 - NORTHEAST <strong>ARKANSAS</strong> <strong>EDUCATION</strong> SERVICE CENTER<br />
Indicator 07: Preschool (3-5) Outcomes<br />
a) Percent of preschool CWD<br />
children who did not<br />
improve functioning.<br />
b) Percent of preschool CWD<br />
who improved but whose<br />
functioning remained below<br />
same age peers.<br />
c) Percent of preschool CWD<br />
who improved at a level<br />
nearer to same aged peers.<br />
d) Percent of preschool CWD<br />
who improved functioning to<br />
reach a level comparable to<br />
same age peers.<br />
e) Percent of preschool CWD<br />
children who maintain<br />
functioning at a level<br />
comparable to same aged<br />
peers.<br />
Summary<br />
Statements<br />
1) Of those preschool<br />
children who entered<br />
the preschool program<br />
below age expectations<br />
in each Outcome, the<br />
percent who<br />
substantially increased<br />
their rate of growth by<br />
the time they turned 6<br />
years of age or exited<br />
the program.<br />
2) The percent of<br />
preschool children who<br />
were functioning<br />
within age expectations<br />
in each Outcome by the<br />
time they turned 6<br />
years of age or exited<br />
A) Positive Social -Emotional<br />
Skills*<br />
State<br />
Rate<br />
A) Positive Social -<br />
Emotional Skills<br />
(Including social<br />
relationships)<br />
State<br />
Rate<br />
2.14%<br />
5.31%<br />
25.97%<br />
38.22%<br />
28.36%<br />
State<br />
Target<br />
LEA<br />
Rate<br />
LEA<br />
Rate<br />
— —<br />
5.69%<br />
6.50%<br />
21.95%<br />
65.85%<br />
Target<br />
Met by<br />
LEA(Y/N)<br />
B) Acquisition and Use of<br />
Knowledge and Skills<br />
(Including early language/<br />
communication and early literacy)<br />
B) Acquisition and Use of<br />
Knowledge and Skills **<br />
State<br />
Rate<br />
1.75%<br />
6.59%<br />
34.23%<br />
43.51%<br />
13.92%<br />
State<br />
Target<br />
LEA<br />
Rate<br />
Target<br />
Met by<br />
LEA(Y/N)<br />
C) Use of Appropriate Behaviors<br />
to Meet Their Needs<br />
State<br />
Rate<br />
State<br />
Target<br />
LEA<br />
Rate<br />
Target<br />
Met by<br />
LEA(Y/N)<br />
89.61% 90.50% 83.33% N 90.31% 90.50% 76.34% N 90.82% 92.50% 91.67% N<br />
66.58% 69.50% 87.80% Y 57.43% 60.50% 66.67% Y 76.69% 78.50% 96.75% Y<br />
NOTE: * Including social relationships ** Including early language/ communication and early literacy<br />
Note: - - denotes not applicable<br />
State<br />
Rate<br />
LEA<br />
Rate<br />
— —<br />
17.89%<br />
15.45%<br />
42.28%<br />
24.39%<br />
C) Use of<br />
Appropriate<br />
Behaviors to<br />
Meet Their Needs<br />
State<br />
Rate<br />
4.51%<br />
17.34%<br />
41.72%<br />
34.97%<br />
LEA<br />
Rate<br />
1.46% — —<br />
1.63%<br />
1.63%<br />
16.26%<br />
80.49%<br />
Page 3 of 5
LEA: 3820 - NORTHEAST <strong>ARKANSAS</strong> <strong>EDUCATION</strong> SERVICE CENTER<br />
Indicator 08: Parent Involvement<br />
Percent of surveyed<br />
parents who reported<br />
school facilitated parent<br />
involvement as a means<br />
of improving services<br />
and results for children<br />
with disabilities.<br />
Early Childhood<br />
(3-5)<br />
School Age<br />
(5-21)<br />
State<br />
Rate<br />
90.47%<br />
95.05%<br />
Indicator 09: Disproportionality - Eligibility<br />
Disproportionate representation of racial<br />
and ethnic groups in special education and<br />
related services that is a result of<br />
inappropriate identification (e.g.<br />
monitoring data, review of policies,<br />
practices, and procedures under 618(d),<br />
etc.).<br />
State<br />
Rate<br />
State<br />
Target<br />
88.00%<br />
96.00%<br />
State<br />
Target<br />
0.00% 0.00%<br />
LEA<br />
Rate<br />
100.00%<br />
— —<br />
Indicator 10: Disproportionality-Child with a Disability<br />
Disproportionate representation of racial<br />
and ethnic groups in specific disability<br />
categories that is a result of inappropriate<br />
identification (e.g. monitoring data, review<br />
of policies, practices, and procedures under<br />
618(d), etc.).<br />
Indicator 11: Child Find<br />
Percent of children with<br />
parental consent to evaluate<br />
who are evaluated within<br />
the State established timeline<br />
of 60 days.<br />
Overall<br />
(3-21)<br />
Early Childhood<br />
(3-5)<br />
School Age<br />
(5-21)<br />
State<br />
Rate<br />
0.00%<br />
Indicator 12: Early Childhood Transition<br />
Percent of children referred by Part C prior to<br />
age 3, who are found eligible for Part B, and<br />
who have an IEP developed and implemented<br />
by their third birthday.<br />
Note: - - denotes not applicable<br />
State<br />
Rate<br />
99.41%<br />
99.70%<br />
98.97%<br />
State<br />
Rate<br />
State<br />
Target<br />
0.00%<br />
State<br />
Target<br />
100.00%<br />
100.00%<br />
100.00%<br />
State<br />
Target<br />
Target Met by<br />
LEA (Y/N)<br />
N/A<br />
Target Met by<br />
LEA (Y/N)<br />
N/A<br />
LEA<br />
Rate<br />
100.00%<br />
100.00%<br />
— —<br />
LEA<br />
Rate<br />
Target Met by<br />
LEA (Y/N)<br />
Y<br />
N/A<br />
Note: The target for Indicator 09 is to have zero percent<br />
(0%) of districts identified as having disproportionate<br />
representation as a result of inappropriate<br />
identification in eligibility.<br />
Note: The target for Indicator 10 is to have zero<br />
percent (0%) of districts identified as having<br />
disproportionate representation as a result of<br />
inappropriate identification in a disability<br />
category.<br />
Target Met by<br />
LEA (Y/N)<br />
Y<br />
N/A<br />
Target Met<br />
by LEA<br />
(Y/N)<br />
99.21% 100.00% 100.00% Y<br />
Y<br />
Note: * Indicates a zero reponse rate for the<br />
district.<br />
Page 4 of 5
LEA: 3820 - NORTHEAST <strong>ARKANSAS</strong> <strong>EDUCATION</strong> SERVICE CENTER<br />
Indicator 13: Secondary Transition<br />
Percent of youth with disabilities aged 16 and<br />
up with an IEP that includes coordinated,<br />
measurable, annual IEP goals and transition<br />
services that will reasonably enable the student<br />
to meet the post-secondary goals.<br />
Indicator 14: Post-School Outcomes<br />
A. Percent of youth enrolled in higher<br />
education within one year of leaving high<br />
school.<br />
State<br />
Rate<br />
State<br />
Target<br />
Note: Data for this Indicator is from the on-site monitoring of LEAs for the given year.<br />
B. Percent of youth enrolled in higher<br />
education or competitively employed<br />
within one year of leaving high school.<br />
C. Percent of youth enrolled in higher<br />
education or in some other postsecondary<br />
education or training program; or<br />
competitively employed or in some other<br />
employment within one year of leaving<br />
high school.<br />
State<br />
Rate<br />
Indicator 20: Reported Data-Timely and Accurate*<br />
District submitted<br />
required data elements<br />
on or before due dates;<br />
made revisions within<br />
the alloted reveiw<br />
periods.<br />
Accurate and Timely<br />
Data Submission<br />
Overall (3-21)<br />
Early Childhood (3-5)<br />
School Age (5-21)<br />
State<br />
Target<br />
100.00%<br />
100.00%<br />
100.00%<br />
State<br />
Target<br />
LEA<br />
Rate<br />
LEA<br />
Rate<br />
Target Met by<br />
LEA (Y/N)<br />
Target Met<br />
by LEA<br />
(Y/N)<br />
Target Met<br />
by LEA<br />
(Y/N)<br />
*Data reviewed for timely and accurate submissions included all APSCN cycle data except for personnel<br />
Note: - - denotes not applicable<br />
96.19 100.00 — — N/A<br />
14.53<br />
State<br />
Rate<br />
49.42<br />
State<br />
Rate<br />
54.07<br />
13.00<br />
State<br />
Target<br />
49.00<br />
State<br />
Target<br />
60.00<br />
Y<br />
Y<br />
N/A<br />
— —<br />
LEA<br />
Rate<br />
— —<br />
LEA<br />
Rate<br />
— —<br />
N/A<br />
Target Met<br />
by LEA<br />
(Y/N)<br />
N/A<br />
Target Met<br />
by LEA<br />
(Y/N)<br />
N/A<br />
Page 5 of 5
<strong>ARKANSAS</strong> <strong>SPECIAL</strong> <strong>EDUCATION</strong><br />
<strong>DISTRICT</strong> <strong>ANNUAL</strong> PERFORMANCE REPORT<br />
2010/11 School Year<br />
Publication Date: March 2012<br />
Each State must have in place a State Performance Plan (SPP) to evaluate the State's efforts to meet the requirements and<br />
purposes of the implementation of the Individuals with Disabilities Education Act (IDEA). The SPP is a six-year plan, which<br />
describes Arkansas's performance on 20 indicators. The Office of Special Education Programs in the U. S. Department of<br />
Education requires that States report annually to the public on the performance of each local education agency (LEA) on 14 of<br />
20 indicators as compared with targets established by the State in the SPP. Arkansas will report indicators 1 through 14 and<br />
20 for each LEA serving children with disabilities (CWD). Any LEA not meeting targets on compliance indicators (0% for<br />
Indicators 4B, 09 & 10 and 100% for Indicators 11, 12, 13, and 20) are non-compliant with IDEA.<br />
There are no report changes for the 2010/11 school year profile; However, it is important to recognize that: .<br />
1. Indicator 01 (Graduation) is reported a year in arrear (2009/10 graduates) and is based on a four-year cohort. This<br />
means the rate is a measure of students who entered in ninth grade and graduate in four years. The calculation is a<br />
requirement under Title I of the Elementary and Secondary Education Act (ESEA).<br />
2. Indicator 02 (Drop out) is reported a year in arrear. This means the rate is a measure of students who dropped out in<br />
the 2009/10 school year. The Indicator 02 data are aligned with the Common Core of Data (CCD) requirements for<br />
grades 7-12.<br />
3. Indicator 04A and 4B (Suspension/Expulsion) is reported a year in arrear. This means the rate is a measure of<br />
students who had out-of-school suspensions and/or expulsions totaling more than 10 days.<br />
For a complete description of all the Indicators, please visit the special education website at<br />
http://arksped.k12.ar.us/sections/policy.html<br />
LEA: 3840 - IMBODEN CHARTER SCHOOL DIST<br />
Indicator 01: Graduation Rates (2009/10 school year) Indicator 02: Dropout Rates (2009/10 school year)<br />
Percent of youth<br />
with IEPs<br />
graduating from<br />
high school with a<br />
regular diploma<br />
State<br />
Rate<br />
State<br />
Target<br />
75.76% 85.00%<br />
LEA<br />
Rate<br />
— —<br />
Target Met<br />
by LEA<br />
(Y/N)<br />
NA<br />
Percent of<br />
youth with<br />
IEPs dropping<br />
out of high<br />
school<br />
State<br />
Rate<br />
Indicator 03: Assessment on Statewide Benchmark Exam (grades 3-8, 11)<br />
A) Adequate Yearly Progress<br />
n=40<br />
Literacy<br />
Mathematics<br />
Met Disability Subgroup "n"<br />
for Reporting Purposes (Y/N)<br />
State Target for % of Districts Meeting<br />
AYP for Disability Subgroup<br />
State<br />
Target<br />
3.06% 4.20%<br />
LEA<br />
Rate<br />
0.00%<br />
% of Districts Meeting AYP<br />
for Disability Subgroup<br />
Target Met by<br />
LEA (Y/N)<br />
Y<br />
Target Met by<br />
LEA(Y/N)<br />
Overall N 17.15% 6.25%<br />
NA<br />
N<br />
N<br />
Note: For a district to qualify as having a disability subgroup it must have a minimum of 40 (n=40) students with disabilities in a school building.<br />
B) Participation<br />
Participation Rate: # of<br />
CWD Tested ÷ # of CWD<br />
Enrolled in grades tested.<br />
Participation Rate: Literacy<br />
Participation Rate: Math<br />
Note: - - denotes not applicable<br />
State<br />
Rate<br />
98.78%<br />
State<br />
Target<br />
95.00%<br />
LEA<br />
Rate<br />
100.00%<br />
Target Met<br />
by LEA (Y/N)<br />
98.61% 95.00% 100.00% Y<br />
Y<br />
C) Performance Proficiency<br />
Percent of CWD Scoring<br />
Proficient or Above<br />
Proficiency Rate: Literacy<br />
Proficiency Rate:<br />
Mathematics<br />
16.00%<br />
16.00%<br />
State<br />
Rate<br />
31.49%<br />
44.86%<br />
State<br />
Target<br />
45.22%<br />
51.14%<br />
LEA<br />
Rate<br />
50.00%<br />
30.00%<br />
NA<br />
NA<br />
Target<br />
Met by<br />
LEA (Y/N)<br />
Y<br />
N<br />
Page 1 of 5
LEA: 3840 - IMBODEN CHARTER SCHOOL DIST<br />
Indicator 04: Out-of-School Suspensions and Expulsions (2009/10 school year)<br />
A) Suspension/Expulsion<br />
Percent difference of CWD with out-of- school suspensions and<br />
expulsions totaling greater than 10 days in a school year as<br />
compared to the same data for general education students in<br />
the district.<br />
B) Suspension/Expulsion by Race and Ethnicity<br />
Percent of districts that have: (a) a significant discrepancy, by race or<br />
ethnicity, in the rate of suspensions and expulsions of greater than 10<br />
days in a school year for children with IEPs; and (b) policies,<br />
procedures or practices that contribute to the significant discrepancy<br />
and do not comply with requirements relating to the development<br />
and implementation of IEPs, the use of positive behavioral<br />
interventions and supports, and procedural safeguards.<br />
Indicator 05: School Age (5-21) Least Restrictive Environment<br />
A) In the Regular Class 80% or more of the day<br />
Percent of CWD with<br />
IEPs receiving instruction<br />
in the regular class 80%<br />
or more of the day.<br />
State<br />
Rate<br />
State<br />
Target<br />
LEA<br />
Rate<br />
B) In the Regular Class less than 40% of the day<br />
Percent of CWD with<br />
IEPs receiving instruction<br />
in the regular class less<br />
than 60% of the day.<br />
53.87% 59.77%<br />
State<br />
Rate<br />
State<br />
Target<br />
12.42% 12.51%<br />
52.94%<br />
LEA<br />
Rate<br />
0.00%<br />
C) Other Settings outside the regular class<br />
Percent of CWD with IEPs served in<br />
public or private separate schools,<br />
residential placements, or<br />
homebound/hospital placements.<br />
State<br />
Rate<br />
State<br />
Target<br />
2.80% 2.56%<br />
Target Met<br />
by LEA (Y/N)<br />
N<br />
Target Met<br />
by LEA (Y/N)<br />
Y<br />
LEA<br />
Rate<br />
0.00%<br />
Target Met<br />
by LEA(Y/N)<br />
Indicator 06: Early Childhood (3-5) Least Restrictive Environment<br />
A) Regular Early Childhood Program<br />
Percent of children (aged 3 through 5) with IEPs attending a regular<br />
early childhood program and receiving the majority of special<br />
education and related services in the regular early childhood program<br />
Allowable<br />
Difference<br />
LEA: 3840 - IMBODEN CHARTER SCHOOL DIST<br />
Indicator 07: Preschool (3-5) Outcomes<br />
a) Percent of preschool CWD<br />
children who did not<br />
improve functioning.<br />
b) Percent of preschool CWD<br />
who improved but whose<br />
functioning remained below<br />
same age peers.<br />
c) Percent of preschool CWD<br />
who improved at a level<br />
nearer to same aged peers.<br />
d) Percent of preschool CWD<br />
who improved functioning to<br />
reach a level comparable to<br />
same age peers.<br />
e) Percent of preschool CWD<br />
children who maintain<br />
functioning at a level<br />
comparable to same aged<br />
peers.<br />
Summary<br />
Statements<br />
1) Of those preschool<br />
children who entered<br />
the preschool program<br />
below age expectations<br />
in each Outcome, the<br />
percent who<br />
substantially increased<br />
their rate of growth by<br />
the time they turned 6<br />
years of age or exited<br />
the program.<br />
2) The percent of<br />
preschool children who<br />
were functioning<br />
within age expectations<br />
in each Outcome by the<br />
time they turned 6<br />
years of age or exited<br />
A) Positive Social -Emotional<br />
Skills*<br />
State<br />
Rate<br />
A) Positive Social -<br />
Emotional Skills<br />
(Including social<br />
relationships)<br />
State<br />
Rate<br />
2.14%<br />
5.31%<br />
25.97%<br />
38.22%<br />
28.36%<br />
State<br />
Target<br />
LEA<br />
Rate<br />
LEA<br />
Rate<br />
— —<br />
— —<br />
— —<br />
— —<br />
— —<br />
Target<br />
Met by<br />
LEA(Y/N)<br />
B) Acquisition and Use of<br />
Knowledge and Skills<br />
(Including early language/<br />
communication and early literacy)<br />
B) Acquisition and Use of<br />
Knowledge and Skills **<br />
State<br />
Rate<br />
1.75%<br />
6.59%<br />
34.23%<br />
43.51%<br />
13.92%<br />
State<br />
Target<br />
LEA<br />
Rate<br />
Target<br />
Met by<br />
LEA(Y/N)<br />
C) Use of Appropriate Behaviors<br />
to Meet Their Needs<br />
State<br />
Rate<br />
State<br />
Target<br />
LEA<br />
Rate<br />
Target<br />
Met by<br />
LEA(Y/N)<br />
89.61% 90.50% — — N/A 90.31% 90.50% — — N/A 90.82% 92.50% — — N/A<br />
66.58% 69.50% — — N/A 57.43% 60.50% — — N/A 76.69% 78.50% — — N/A<br />
NOTE: * Including social relationships ** Including early language/ communication and early literacy<br />
Note: - - denotes not applicable<br />
State<br />
Rate<br />
LEA<br />
Rate<br />
— —<br />
— —<br />
— —<br />
— —<br />
— —<br />
C) Use of<br />
Appropriate<br />
Behaviors to<br />
Meet Their Needs<br />
State<br />
Rate<br />
4.51%<br />
17.34%<br />
41.72%<br />
34.97%<br />
LEA<br />
Rate<br />
1.46% — —<br />
— —<br />
— —<br />
— —<br />
— —<br />
Page 3 of 5
LEA: 3840 - IMBODEN CHARTER SCHOOL DIST<br />
Indicator 08: Parent Involvement<br />
Percent of surveyed<br />
parents who reported<br />
school facilitated parent<br />
involvement as a means<br />
of improving services<br />
and results for children<br />
with disabilities.<br />
Early Childhood<br />
(3-5)<br />
School Age<br />
(5-21)<br />
State<br />
Rate<br />
90.47%<br />
95.05%<br />
Indicator 09: Disproportionality - Eligibility<br />
Disproportionate representation of racial<br />
and ethnic groups in special education and<br />
related services that is a result of<br />
inappropriate identification (e.g.<br />
monitoring data, review of policies,<br />
practices, and procedures under 618(d),<br />
etc.).<br />
State<br />
Rate<br />
State<br />
Target<br />
88.00%<br />
96.00%<br />
State<br />
Target<br />
0.00% 0.00%<br />
LEA<br />
Rate<br />
— —<br />
— —<br />
Indicator 10: Disproportionality-Child with a Disability<br />
Disproportionate representation of racial<br />
and ethnic groups in specific disability<br />
categories that is a result of inappropriate<br />
identification (e.g. monitoring data, review<br />
of policies, practices, and procedures under<br />
618(d), etc.).<br />
Indicator 11: Child Find<br />
Percent of children with<br />
parental consent to evaluate<br />
who are evaluated within<br />
the State established timeline<br />
of 60 days.<br />
Overall<br />
(3-21)<br />
Early Childhood<br />
(3-5)<br />
School Age<br />
(5-21)<br />
State<br />
Rate<br />
0.00%<br />
Indicator 12: Early Childhood Transition<br />
Percent of children referred by Part C prior to<br />
age 3, who are found eligible for Part B, and<br />
who have an IEP developed and implemented<br />
by their third birthday.<br />
Note: - - denotes not applicable<br />
State<br />
Rate<br />
99.41%<br />
99.70%<br />
98.97%<br />
State<br />
Rate<br />
State<br />
Target<br />
0.00%<br />
State<br />
Target<br />
100.00%<br />
100.00%<br />
100.00%<br />
State<br />
Target<br />
Target Met by<br />
LEA (Y/N)<br />
Y<br />
Target Met by<br />
LEA (Y/N)<br />
Y<br />
LEA<br />
Rate<br />
— —<br />
— —<br />
— —<br />
LEA<br />
Rate<br />
Target Met by<br />
LEA (Y/N)<br />
N/A<br />
N<br />
Note: The target for Indicator 09 is to have zero percent<br />
(0%) of districts identified as having disproportionate<br />
representation as a result of inappropriate<br />
identification in eligibility.<br />
Note: The target for Indicator 10 is to have zero<br />
percent (0%) of districts identified as having<br />
disproportionate representation as a result of<br />
inappropriate identification in a disability<br />
category.<br />
Target Met by<br />
LEA (Y/N)<br />
N/A<br />
N/A<br />
N/A<br />
Target Met<br />
by LEA<br />
(Y/N)<br />
99.21% 100.00% - - N/A<br />
Note: * Indicates a zero reponse rate for the<br />
district.<br />
Page 4 of 5
LEA: 3840 - IMBODEN CHARTER SCHOOL DIST<br />
Indicator 13: Secondary Transition<br />
Percent of youth with disabilities aged 16 and<br />
up with an IEP that includes coordinated,<br />
measurable, annual IEP goals and transition<br />
services that will reasonably enable the student<br />
to meet the post-secondary goals.<br />
Indicator 14: Post-School Outcomes<br />
A. Percent of youth enrolled in higher<br />
education within one year of leaving high<br />
school.<br />
State<br />
Rate<br />
State<br />
Target<br />
Note: Data for this Indicator is from the on-site monitoring of LEAs for the given year.<br />
B. Percent of youth enrolled in higher<br />
education or competitively employed<br />
within one year of leaving high school.<br />
C. Percent of youth enrolled in higher<br />
education or in some other postsecondary<br />
education or training program; or<br />
competitively employed or in some other<br />
employment within one year of leaving<br />
high school.<br />
State<br />
Rate<br />
Indicator 20: Reported Data-Timely and Accurate*<br />
District submitted<br />
required data elements<br />
on or before due dates;<br />
made revisions within<br />
the alloted reveiw<br />
periods.<br />
Accurate and Timely<br />
Data Submission<br />
Overall (3-21)<br />
Early Childhood (3-5)<br />
School Age (5-21)<br />
State<br />
Target<br />
100.00%<br />
100.00%<br />
100.00%<br />
State<br />
Target<br />
LEA<br />
Rate<br />
LEA<br />
Rate<br />
Target Met by<br />
LEA (Y/N)<br />
Target Met<br />
by LEA<br />
(Y/N)<br />
Target Met<br />
by LEA<br />
(Y/N)<br />
*Data reviewed for timely and accurate submissions included all APSCN cycle data except for personnel<br />
Note: - - denotes not applicable<br />
96.19 100.00 — — N/A<br />
14.53<br />
State<br />
Rate<br />
49.42<br />
State<br />
Rate<br />
54.07<br />
13.00<br />
State<br />
Target<br />
49.00<br />
State<br />
Target<br />
60.00<br />
Y<br />
N/A<br />
Y<br />
— —<br />
LEA<br />
Rate<br />
— —<br />
LEA<br />
Rate<br />
— —<br />
N/A<br />
Target Met<br />
by LEA<br />
(Y/N)<br />
N/A<br />
Target Met<br />
by LEA<br />
(Y/N)<br />
N/A<br />
Page 5 of 5
<strong>ARKANSAS</strong> <strong>SPECIAL</strong> <strong>EDUCATION</strong><br />
<strong>DISTRICT</strong> <strong>ANNUAL</strong> PERFORMANCE REPORT<br />
2010/11 School Year<br />
Publication Date: March 2012<br />
Each State must have in place a State Performance Plan (SPP) to evaluate the State's efforts to meet the requirements and<br />
purposes of the implementation of the Individuals with Disabilities Education Act (IDEA). The SPP is a six-year plan, which<br />
describes Arkansas's performance on 20 indicators. The Office of Special Education Programs in the U. S. Department of<br />
Education requires that States report annually to the public on the performance of each local education agency (LEA) on 14 of<br />
20 indicators as compared with targets established by the State in the SPP. Arkansas will report indicators 1 through 14 and<br />
20 for each LEA serving children with disabilities (CWD). Any LEA not meeting targets on compliance indicators (0% for<br />
Indicators 4B, 09 & 10 and 100% for Indicators 11, 12, 13, and 20) are non-compliant with IDEA.<br />
There are no report changes for the 2010/11 school year profile; However, it is important to recognize that: .<br />
1. Indicator 01 (Graduation) is reported a year in arrear (2009/10 graduates) and is based on a four-year cohort. This<br />
means the rate is a measure of students who entered in ninth grade and graduate in four years. The calculation is a<br />
requirement under Title I of the Elementary and Secondary Education Act (ESEA).<br />
2. Indicator 02 (Drop out) is reported a year in arrear. This means the rate is a measure of students who dropped out in<br />
the 2009/10 school year. The Indicator 02 data are aligned with the Common Core of Data (CCD) requirements for<br />
grades 7-12.<br />
3. Indicator 04A and 4B (Suspension/Expulsion) is reported a year in arrear. This means the rate is a measure of<br />
students who had out-of-school suspensions and/or expulsions totaling more than 10 days.<br />
For a complete description of all the Indicators, please visit the special education website at<br />
http://arksped.k12.ar.us/sections/policy.html<br />
LEA: 3904 - LEE COUNTY SCHOOL <strong>DISTRICT</strong><br />
Indicator 01: Graduation Rates (2009/10 school year) Indicator 02: Dropout Rates (2009/10 school year)<br />
Percent of youth<br />
with IEPs<br />
graduating from<br />
high school with a<br />
regular diploma<br />
State<br />
Rate<br />
State<br />
Target<br />
75.76% 85.00%<br />
LEA<br />
Rate<br />
78.26%<br />
Target Met<br />
by LEA<br />
(Y/N)<br />
N<br />
Percent of<br />
youth with<br />
IEPs dropping<br />
out of high<br />
school<br />
State<br />
Rate<br />
Indicator 03: Assessment on Statewide Benchmark Exam (grades 3-8, 11)<br />
A) Adequate Yearly Progress<br />
n=40<br />
Literacy<br />
Mathematics<br />
Met Disability Subgroup "n"<br />
for Reporting Purposes (Y/N)<br />
State Target for % of Districts Meeting<br />
AYP for Disability Subgroup<br />
State<br />
Target<br />
3.06% 4.20%<br />
LEA<br />
Rate<br />
2.06%<br />
% of Districts Meeting AYP<br />
for Disability Subgroup<br />
Target Met by<br />
LEA (Y/N)<br />
Y<br />
Target Met by<br />
LEA(Y/N)<br />
Overall N 17.15% 6.25%<br />
NA<br />
N<br />
N<br />
Note: For a district to qualify as having a disability subgroup it must have a minimum of 40 (n=40) students with disabilities in a school building.<br />
B) Participation<br />
Participation Rate: # of<br />
CWD Tested ÷ # of CWD<br />
Enrolled in grades tested.<br />
Participation Rate: Literacy<br />
Participation Rate: Math<br />
Note: - - denotes not applicable<br />
State<br />
Rate<br />
98.78%<br />
State<br />
Target<br />
95.00%<br />
LEA<br />
Rate<br />
100.00%<br />
Target Met<br />
by LEA (Y/N)<br />
98.61% 95.00% 98.39% Y<br />
Y<br />
C) Performance Proficiency<br />
Percent of CWD Scoring<br />
Proficient or Above<br />
Proficiency Rate: Literacy<br />
Proficiency Rate:<br />
Mathematics<br />
16.00%<br />
16.00%<br />
State<br />
Rate<br />
31.49%<br />
44.86%<br />
State<br />
Target<br />
45.22%<br />
51.14%<br />
LEA<br />
Rate<br />
7.14%<br />
22.22%<br />
NA<br />
NA<br />
Target<br />
Met by<br />
LEA (Y/N)<br />
N<br />
N<br />
Page 1 of 5
LEA: 3904 - LEE COUNTY SCHOOL <strong>DISTRICT</strong><br />
Indicator 04: Out-of-School Suspensions and Expulsions (2009/10 school year)<br />
A) Suspension/Expulsion<br />
Percent difference of CWD with out-of- school suspensions and<br />
expulsions totaling greater than 10 days in a school year as<br />
compared to the same data for general education students in<br />
the district.<br />
B) Suspension/Expulsion by Race and Ethnicity<br />
Percent of districts that have: (a) a significant discrepancy, by race or<br />
ethnicity, in the rate of suspensions and expulsions of greater than 10<br />
days in a school year for children with IEPs; and (b) policies,<br />
procedures or practices that contribute to the significant discrepancy<br />
and do not comply with requirements relating to the development<br />
and implementation of IEPs, the use of positive behavioral<br />
interventions and supports, and procedural safeguards.<br />
Indicator 05: School Age (5-21) Least Restrictive Environment<br />
A) In the Regular Class 80% or more of the day<br />
Percent of CWD with<br />
IEPs receiving instruction<br />
in the regular class 80%<br />
or more of the day.<br />
State<br />
Rate<br />
State<br />
Target<br />
LEA<br />
Rate<br />
B) In the Regular Class less than 40% of the day<br />
Percent of CWD with<br />
IEPs receiving instruction<br />
in the regular class less<br />
than 60% of the day.<br />
53.87% 59.77%<br />
State<br />
Rate<br />
State<br />
Target<br />
12.42% 12.51%<br />
61.24%<br />
LEA<br />
Rate<br />
10.08%<br />
C) Other Settings outside the regular class<br />
Percent of CWD with IEPs served in<br />
public or private separate schools,<br />
residential placements, or<br />
homebound/hospital placements.<br />
State<br />
Rate<br />
State<br />
Target<br />
2.80% 2.56%<br />
Target Met<br />
by LEA (Y/N)<br />
Y<br />
Target Met<br />
by LEA (Y/N)<br />
Y<br />
LEA<br />
Rate<br />
3.88%<br />
Target Met<br />
by LEA(Y/N)<br />
Indicator 06: Early Childhood (3-5) Least Restrictive Environment<br />
A) Regular Early Childhood Program<br />
Percent of children (aged 3 through 5) with IEPs attending a regular<br />
early childhood program and receiving the majority of special<br />
education and related services in the regular early childhood program<br />
Allowable<br />
Difference<br />
LEA: 3904 - LEE COUNTY SCHOOL <strong>DISTRICT</strong><br />
Indicator 07: Preschool (3-5) Outcomes<br />
a) Percent of preschool CWD<br />
children who did not<br />
improve functioning.<br />
b) Percent of preschool CWD<br />
who improved but whose<br />
functioning remained below<br />
same age peers.<br />
c) Percent of preschool CWD<br />
who improved at a level<br />
nearer to same aged peers.<br />
d) Percent of preschool CWD<br />
who improved functioning to<br />
reach a level comparable to<br />
same age peers.<br />
e) Percent of preschool CWD<br />
children who maintain<br />
functioning at a level<br />
comparable to same aged<br />
peers.<br />
Summary<br />
Statements<br />
1) Of those preschool<br />
children who entered<br />
the preschool program<br />
below age expectations<br />
in each Outcome, the<br />
percent who<br />
substantially increased<br />
their rate of growth by<br />
the time they turned 6<br />
years of age or exited<br />
the program.<br />
2) The percent of<br />
preschool children who<br />
were functioning<br />
within age expectations<br />
in each Outcome by the<br />
time they turned 6<br />
years of age or exited<br />
A) Positive Social -Emotional<br />
Skills*<br />
State<br />
Rate<br />
A) Positive Social -<br />
Emotional Skills<br />
(Including social<br />
relationships)<br />
State<br />
Rate<br />
2.14%<br />
5.31%<br />
25.97%<br />
38.22%<br />
28.36%<br />
State<br />
Target<br />
LEA<br />
Rate<br />
LEA<br />
Rate<br />
— —<br />
— —<br />
— —<br />
— —<br />
— —<br />
Target<br />
Met by<br />
LEA(Y/N)<br />
B) Acquisition and Use of<br />
Knowledge and Skills<br />
(Including early language/<br />
communication and early literacy)<br />
B) Acquisition and Use of<br />
Knowledge and Skills **<br />
State<br />
Rate<br />
1.75%<br />
6.59%<br />
34.23%<br />
43.51%<br />
13.92%<br />
State<br />
Target<br />
LEA<br />
Rate<br />
Target<br />
Met by<br />
LEA(Y/N)<br />
C) Use of Appropriate Behaviors<br />
to Meet Their Needs<br />
State<br />
Rate<br />
State<br />
Target<br />
LEA<br />
Rate<br />
Target<br />
Met by<br />
LEA(Y/N)<br />
89.61% 90.50% — — N/A 90.31% 90.50% — — N/A 90.82% 92.50% — — N/A<br />
66.58% 69.50% — — N/A 57.43% 60.50% — — N/A 76.69% 78.50% — — N/A<br />
NOTE: * Including social relationships ** Including early language/ communication and early literacy<br />
Note: - - denotes not applicable<br />
State<br />
Rate<br />
LEA<br />
Rate<br />
— —<br />
— —<br />
— —<br />
— —<br />
— —<br />
C) Use of<br />
Appropriate<br />
Behaviors to<br />
Meet Their Needs<br />
State<br />
Rate<br />
4.51%<br />
17.34%<br />
41.72%<br />
34.97%<br />
LEA<br />
Rate<br />
1.46% — —<br />
— —<br />
— —<br />
— —<br />
— —<br />
Page 3 of 5
LEA: 3904 - LEE COUNTY SCHOOL <strong>DISTRICT</strong><br />
Indicator 08: Parent Involvement<br />
Percent of surveyed<br />
parents who reported<br />
school facilitated parent<br />
involvement as a means<br />
of improving services<br />
and results for children<br />
with disabilities.<br />
Early Childhood<br />
(3-5)<br />
School Age<br />
(5-21)<br />
State<br />
Rate<br />
90.47%<br />
95.05%<br />
Indicator 09: Disproportionality - Eligibility<br />
Disproportionate representation of racial<br />
and ethnic groups in special education and<br />
related services that is a result of<br />
inappropriate identification (e.g.<br />
monitoring data, review of policies,<br />
practices, and procedures under 618(d),<br />
etc.).<br />
State<br />
Rate<br />
State<br />
Target<br />
88.00%<br />
96.00%<br />
State<br />
Target<br />
0.00% 0.00%<br />
LEA<br />
Rate<br />
— —<br />
1.64%<br />
Indicator 10: Disproportionality-Child with a Disability<br />
Disproportionate representation of racial<br />
and ethnic groups in specific disability<br />
categories that is a result of inappropriate<br />
identification (e.g. monitoring data, review<br />
of policies, practices, and procedures under<br />
618(d), etc.).<br />
Indicator 11: Child Find<br />
Percent of children with<br />
parental consent to evaluate<br />
who are evaluated within<br />
the State established timeline<br />
of 60 days.<br />
Overall<br />
(3-21)<br />
Early Childhood<br />
(3-5)<br />
School Age<br />
(5-21)<br />
State<br />
Rate<br />
0.00%<br />
Indicator 12: Early Childhood Transition<br />
Percent of children referred by Part C prior to<br />
age 3, who are found eligible for Part B, and<br />
who have an IEP developed and implemented<br />
by their third birthday.<br />
Note: - - denotes not applicable<br />
State<br />
Rate<br />
99.41%<br />
99.70%<br />
98.97%<br />
State<br />
Rate<br />
State<br />
Target<br />
0.00%<br />
State<br />
Target<br />
100.00%<br />
100.00%<br />
100.00%<br />
State<br />
Target<br />
Target Met by<br />
LEA (Y/N)<br />
Y<br />
Target Met by<br />
LEA (Y/N)<br />
Y<br />
LEA<br />
Rate<br />
100.00%<br />
— —<br />
100.00%<br />
LEA<br />
Rate<br />
Target Met by<br />
LEA (Y/N)<br />
N/A<br />
N<br />
Note: The target for Indicator 09 is to have zero percent<br />
(0%) of districts identified as having disproportionate<br />
representation as a result of inappropriate<br />
identification in eligibility.<br />
Note: The target for Indicator 10 is to have zero<br />
percent (0%) of districts identified as having<br />
disproportionate representation as a result of<br />
inappropriate identification in a disability<br />
category.<br />
Target Met by<br />
LEA (Y/N)<br />
N/A<br />
Y<br />
Target Met<br />
by LEA<br />
(Y/N)<br />
99.21% 100.00% - - N/A<br />
Y<br />
Note: * Indicates a zero reponse rate for the<br />
district.<br />
Page 4 of 5
LEA: 3904 - LEE COUNTY SCHOOL <strong>DISTRICT</strong><br />
Indicator 13: Secondary Transition<br />
Percent of youth with disabilities aged 16 and<br />
up with an IEP that includes coordinated,<br />
measurable, annual IEP goals and transition<br />
services that will reasonably enable the student<br />
to meet the post-secondary goals.<br />
Indicator 14: Post-School Outcomes<br />
A. Percent of youth enrolled in higher<br />
education within one year of leaving high<br />
school.<br />
State<br />
Rate<br />
State<br />
Target<br />
Note: Data for this Indicator is from the on-site monitoring of LEAs for the given year.<br />
B. Percent of youth enrolled in higher<br />
education or competitively employed<br />
within one year of leaving high school.<br />
C. Percent of youth enrolled in higher<br />
education or in some other postsecondary<br />
education or training program; or<br />
competitively employed or in some other<br />
employment within one year of leaving<br />
high school.<br />
State<br />
Rate<br />
Indicator 20: Reported Data-Timely and Accurate*<br />
District submitted<br />
required data elements<br />
on or before due dates;<br />
made revisions within<br />
the alloted reveiw<br />
periods.<br />
Accurate and Timely<br />
Data Submission<br />
Overall (3-21)<br />
Early Childhood (3-5)<br />
School Age (5-21)<br />
State<br />
Target<br />
100.00%<br />
100.00%<br />
100.00%<br />
State<br />
Target<br />
LEA<br />
Rate<br />
LEA<br />
Rate<br />
Target Met by<br />
LEA (Y/N)<br />
Target Met<br />
by LEA<br />
(Y/N)<br />
Target Met<br />
by LEA<br />
(Y/N)<br />
*Data reviewed for timely and accurate submissions included all APSCN cycle data except for personnel<br />
Note: - - denotes not applicable<br />
96.19 100.00 100.00% Y<br />
14.53<br />
State<br />
Rate<br />
49.42<br />
State<br />
Rate<br />
54.07<br />
13.00<br />
State<br />
Target<br />
49.00<br />
State<br />
Target<br />
60.00<br />
N<br />
N/A<br />
N<br />
— —<br />
LEA<br />
Rate<br />
— —<br />
LEA<br />
Rate<br />
— —<br />
N/A<br />
Target Met<br />
by LEA<br />
(Y/N)<br />
N/A<br />
Target Met<br />
by LEA<br />
(Y/N)<br />
N/A<br />
Page 5 of 5
LEA: 4003 - STAR CITY SCHOOL <strong>DISTRICT</strong><br />
<strong>ARKANSAS</strong> <strong>SPECIAL</strong> <strong>EDUCATION</strong><br />
<strong>DISTRICT</strong> <strong>ANNUAL</strong> PERFORMANCE REPORT<br />
2010/11 School Year<br />
Publication Date: March 2012<br />
Each State must have in place a State Performance Plan (SPP) to evaluate the State's efforts to meet the requirements and<br />
purposes of the implementation of the Individuals with Disabilities Education Act (IDEA). The SPP is a six-year plan, which<br />
describes Arkansas's performance on 20 indicators. The Office of Special Education Programs in the U. S. Department of<br />
Education requires that States report annually to the public on the performance of each local education agency (LEA) on 14 of<br />
20 indicators as compared with targets established by the State in the SPP. Arkansas will report indicators 1 through 14 and<br />
20 for each LEA serving children with disabilities (CWD). Any LEA not meeting targets on compliance indicators (0% for<br />
Indicators 4B, 09 & 10 and 100% for Indicators 11, 12, 13, and 20) are non-compliant with IDEA.<br />
There are no report changes for the 2010/11 school year profile; However, it is important to recognize that: .<br />
1. Indicator 01 (Graduation) is reported a year in arrear (2009/10 graduates) and is based on a four-year cohort. This<br />
means the rate is a measure of students who entered in ninth grade and graduate in four years. The calculation is a<br />
requirement under Title I of the Elementary and Secondary Education Act (ESEA).<br />
2. Indicator 02 (Drop out) is reported a year in arrear. This means the rate is a measure of students who dropped out in<br />
the 2009/10 school year. The Indicator 02 data are aligned with the Common Core of Data (CCD) requirements for<br />
grades 7-12.<br />
3. Indicator 04A and 4B (Suspension/Expulsion) is reported a year in arrear. This means the rate is a measure of<br />
students who had out-of-school suspensions and/or expulsions totaling more than 10 days.<br />
Percent of youth<br />
with IEPs<br />
graduating from<br />
high school with a<br />
regular diploma<br />
For a complete description of all the Indicators, please visit the special education website at<br />
http://arksped.k12.ar.us/sections/policy.html<br />
Indicator 01: Graduation Rates (2009/10 school year) Indicator 02: Dropout Rates (2009/10 school year)<br />
State<br />
Rate<br />
State<br />
Target<br />
75.76% 85.00%<br />
LEA<br />
Rate<br />
65.00%<br />
Target Met<br />
by LEA<br />
(Y/N)<br />
N<br />
Percent of<br />
youth with<br />
IEPs dropping<br />
out of high<br />
school<br />
State<br />
Rate<br />
Indicator 03: Assessment on Statewide Benchmark Exam (grades 3-8, 11)<br />
A) Adequate Yearly Progress<br />
n=40<br />
Literacy<br />
Mathematics<br />
Met Disability Subgroup "n"<br />
for Reporting Purposes (Y/N)<br />
State Target for % of Districts Meeting<br />
AYP for Disability Subgroup<br />
State<br />
Target<br />
3.06% 4.20%<br />
LEA<br />
Rate<br />
0.00%<br />
% of Districts Meeting AYP<br />
for Disability Subgroup<br />
Target Met by<br />
LEA (Y/N)<br />
Y<br />
Target Met by<br />
LEA(Y/N)<br />
Overall N 17.15% 6.25%<br />
NA<br />
N<br />
N<br />
Note: For a district to qualify as having a disability subgroup it must have a minimum of 40 (n=40) students with disabilities in a school building.<br />
B) Participation<br />
Participation Rate: # of<br />
CWD Tested ÷ # of CWD<br />
Enrolled in grades tested.<br />
Participation Rate: Literacy<br />
Participation Rate: Math<br />
Note: - - denotes not applicable<br />
State<br />
Rate<br />
98.78%<br />
State<br />
Target<br />
95.00%<br />
LEA<br />
Rate<br />
96.97%<br />
Target Met<br />
by LEA (Y/N)<br />
98.61% 95.00% 98.68% Y<br />
Y<br />
C) Performance Proficiency<br />
Percent of CWD Scoring<br />
Proficient or Above<br />
Proficiency Rate: Literacy<br />
Proficiency Rate:<br />
Mathematics<br />
16.00%<br />
16.00%<br />
State<br />
Rate<br />
31.49%<br />
44.86%<br />
State<br />
Target<br />
45.22%<br />
51.14%<br />
LEA<br />
Rate<br />
22.95%<br />
40.85%<br />
NA<br />
NA<br />
Target<br />
Met by<br />
LEA (Y/N)<br />
N<br />
N<br />
Page 1 of 5
LEA: 4003 - STAR CITY SCHOOL <strong>DISTRICT</strong><br />
Indicator 04: Out-of-School Suspensions and Expulsions (2009/10 school year)<br />
A) Suspension/Expulsion<br />
Percent difference of CWD with out-of- school suspensions and<br />
expulsions totaling greater than 10 days in a school year as<br />
compared to the same data for general education students in<br />
the district.<br />
B) Suspension/Expulsion by Race and Ethnicity<br />
Percent of districts that have: (a) a significant discrepancy, by race or<br />
ethnicity, in the rate of suspensions and expulsions of greater than 10<br />
days in a school year for children with IEPs; and (b) policies,<br />
procedures or practices that contribute to the significant discrepancy<br />
and do not comply with requirements relating to the development<br />
and implementation of IEPs, the use of positive behavioral<br />
interventions and supports, and procedural safeguards.<br />
Indicator 05: School Age (5-21) Least Restrictive Environment<br />
A) In the Regular Class 80% or more of the day<br />
Percent of CWD with<br />
IEPs receiving instruction<br />
in the regular class 80%<br />
or more of the day.<br />
State<br />
Rate<br />
State<br />
Target<br />
LEA<br />
Rate<br />
B) In the Regular Class less than 40% of the day<br />
Percent of CWD with<br />
IEPs receiving instruction<br />
in the regular class less<br />
than 60% of the day.<br />
53.87% 59.77%<br />
State<br />
Rate<br />
State<br />
Target<br />
12.42% 12.51%<br />
62.03%<br />
LEA<br />
Rate<br />
9.49%<br />
C) Other Settings outside the regular class<br />
Percent of CWD with IEPs served in<br />
public or private separate schools,<br />
residential placements, or<br />
homebound/hospital placements.<br />
State<br />
Rate<br />
State<br />
Target<br />
2.80% 2.56%<br />
Target Met<br />
by LEA (Y/N)<br />
Y<br />
Target Met<br />
by LEA (Y/N)<br />
Y<br />
LEA<br />
Rate<br />
0.63%<br />
Target Met<br />
by LEA(Y/N)<br />
Indicator 06: Early Childhood (3-5) Least Restrictive Environment<br />
A) Regular Early Childhood Program<br />
Percent of children (aged 3 through 5) with IEPs attending a regular<br />
early childhood program and receiving the majority of special<br />
education and related services in the regular early childhood program<br />
Allowable<br />
Difference<br />
LEA: 4003 - STAR CITY SCHOOL <strong>DISTRICT</strong><br />
Indicator 07: Preschool (3-5) Outcomes<br />
a) Percent of preschool CWD<br />
children who did not<br />
improve functioning.<br />
b) Percent of preschool CWD<br />
who improved but whose<br />
functioning remained below<br />
same age peers.<br />
c) Percent of preschool CWD<br />
who improved at a level<br />
nearer to same aged peers.<br />
d) Percent of preschool CWD<br />
who improved functioning to<br />
reach a level comparable to<br />
same age peers.<br />
e) Percent of preschool CWD<br />
children who maintain<br />
functioning at a level<br />
comparable to same aged<br />
peers.<br />
Summary<br />
Statements<br />
1) Of those preschool<br />
children who entered<br />
the preschool program<br />
below age expectations<br />
in each Outcome, the<br />
percent who<br />
substantially increased<br />
their rate of growth by<br />
the time they turned 6<br />
years of age or exited<br />
the program.<br />
2) The percent of<br />
preschool children who<br />
were functioning<br />
within age expectations<br />
in each Outcome by the<br />
time they turned 6<br />
years of age or exited<br />
A) Positive Social -Emotional<br />
Skills*<br />
State<br />
Rate<br />
A) Positive Social -<br />
Emotional Skills<br />
(Including social<br />
relationships)<br />
State<br />
Rate<br />
2.14%<br />
5.31%<br />
25.97%<br />
38.22%<br />
28.36%<br />
State<br />
Target<br />
LEA<br />
Rate<br />
LEA<br />
Rate<br />
— —<br />
— —<br />
— —<br />
— —<br />
— —<br />
Target<br />
Met by<br />
LEA(Y/N)<br />
B) Acquisition and Use of<br />
Knowledge and Skills<br />
(Including early language/<br />
communication and early literacy)<br />
B) Acquisition and Use of<br />
Knowledge and Skills **<br />
State<br />
Rate<br />
1.75%<br />
6.59%<br />
34.23%<br />
43.51%<br />
13.92%<br />
State<br />
Target<br />
LEA<br />
Rate<br />
Target<br />
Met by<br />
LEA(Y/N)<br />
C) Use of Appropriate Behaviors<br />
to Meet Their Needs<br />
State<br />
Rate<br />
State<br />
Target<br />
LEA<br />
Rate<br />
Target<br />
Met by<br />
LEA(Y/N)<br />
89.61% 90.50% — — N/A 90.31% 90.50% — — N/A 90.82% 92.50% — — N/A<br />
66.58% 69.50% — — N/A 57.43% 60.50% — — N/A 76.69% 78.50% — — N/A<br />
NOTE: * Including social relationships ** Including early language/ communication and early literacy<br />
Note: - - denotes not applicable<br />
State<br />
Rate<br />
LEA<br />
Rate<br />
— —<br />
— —<br />
— —<br />
— —<br />
— —<br />
C) Use of<br />
Appropriate<br />
Behaviors to<br />
Meet Their Needs<br />
State<br />
Rate<br />
4.51%<br />
17.34%<br />
41.72%<br />
34.97%<br />
LEA<br />
Rate<br />
1.46% — —<br />
— —<br />
— —<br />
— —<br />
— —<br />
Page 3 of 5
LEA: 4003 - STAR CITY SCHOOL <strong>DISTRICT</strong><br />
Indicator 08: Parent Involvement<br />
Percent of surveyed<br />
parents who reported<br />
school facilitated parent<br />
involvement as a means<br />
of improving services<br />
and results for children<br />
with disabilities.<br />
Early Childhood<br />
(3-5)<br />
School Age<br />
(5-21)<br />
State<br />
Rate<br />
90.47%<br />
95.05%<br />
Indicator 09: Disproportionality - Eligibility<br />
Disproportionate representation of racial<br />
and ethnic groups in special education and<br />
related services that is a result of<br />
inappropriate identification (e.g.<br />
monitoring data, review of policies,<br />
practices, and procedures under 618(d),<br />
etc.).<br />
State<br />
Rate<br />
State<br />
Target<br />
88.00%<br />
96.00%<br />
State<br />
Target<br />
0.00% 0.00%<br />
LEA<br />
Rate<br />
— —<br />
100.00%<br />
Indicator 10: Disproportionality-Child with a Disability<br />
Disproportionate representation of racial<br />
and ethnic groups in specific disability<br />
categories that is a result of inappropriate<br />
identification (e.g. monitoring data, review<br />
of policies, practices, and procedures under<br />
618(d), etc.).<br />
Indicator 11: Child Find<br />
Percent of children with<br />
parental consent to evaluate<br />
who are evaluated within<br />
the State established timeline<br />
of 60 days.<br />
Overall<br />
(3-21)<br />
Early Childhood<br />
(3-5)<br />
School Age<br />
(5-21)<br />
State<br />
Rate<br />
0.00%<br />
Indicator 12: Early Childhood Transition<br />
Percent of children referred by Part C prior to<br />
age 3, who are found eligible for Part B, and<br />
who have an IEP developed and implemented<br />
by their third birthday.<br />
Note: - - denotes not applicable<br />
State<br />
Rate<br />
99.41%<br />
99.70%<br />
98.97%<br />
State<br />
Rate<br />
State<br />
Target<br />
0.00%<br />
State<br />
Target<br />
100.00%<br />
100.00%<br />
100.00%<br />
State<br />
Target<br />
Target Met by<br />
LEA (Y/N)<br />
Y<br />
Target Met by<br />
LEA (Y/N)<br />
Y<br />
LEA<br />
Rate<br />
100.00%<br />
— —<br />
100.00%<br />
LEA<br />
Rate<br />
Target Met by<br />
LEA (Y/N)<br />
N/A<br />
Y<br />
Note: The target for Indicator 09 is to have zero percent<br />
(0%) of districts identified as having disproportionate<br />
representation as a result of inappropriate<br />
identification in eligibility.<br />
Note: The target for Indicator 10 is to have zero<br />
percent (0%) of districts identified as having<br />
disproportionate representation as a result of<br />
inappropriate identification in a disability<br />
category.<br />
Target Met by<br />
LEA (Y/N)<br />
N/A<br />
Y<br />
Target Met<br />
by LEA<br />
(Y/N)<br />
99.21% 100.00% - - N/A<br />
Y<br />
Note: * Indicates a zero reponse rate for the<br />
district.<br />
Page 4 of 5
LEA: 4003 - STAR CITY SCHOOL <strong>DISTRICT</strong><br />
Indicator 13: Secondary Transition<br />
Percent of youth with disabilities aged 16 and<br />
up with an IEP that includes coordinated,<br />
measurable, annual IEP goals and transition<br />
services that will reasonably enable the student<br />
to meet the post-secondary goals.<br />
Indicator 14: Post-School Outcomes<br />
A. Percent of youth enrolled in higher<br />
education within one year of leaving high<br />
school.<br />
State<br />
Rate<br />
State<br />
Target<br />
Note: Data for this Indicator is from the on-site monitoring of LEAs for the given year.<br />
B. Percent of youth enrolled in higher<br />
education or competitively employed<br />
within one year of leaving high school.<br />
C. Percent of youth enrolled in higher<br />
education or in some other postsecondary<br />
education or training program; or<br />
competitively employed or in some other<br />
employment within one year of leaving<br />
high school.<br />
State<br />
Rate<br />
Indicator 20: Reported Data-Timely and Accurate*<br />
District submitted<br />
required data elements<br />
on or before due dates;<br />
made revisions within<br />
the alloted reveiw<br />
periods.<br />
Accurate and Timely<br />
Data Submission<br />
Overall (3-21)<br />
Early Childhood (3-5)<br />
School Age (5-21)<br />
State<br />
Target<br />
100.00%<br />
100.00%<br />
100.00%<br />
State<br />
Target<br />
LEA<br />
Rate<br />
LEA<br />
Rate<br />
Target Met by<br />
LEA (Y/N)<br />
Target Met<br />
by LEA<br />
(Y/N)<br />
Target Met<br />
by LEA<br />
(Y/N)<br />
*Data reviewed for timely and accurate submissions included all APSCN cycle data except for personnel<br />
Note: - - denotes not applicable<br />
96.19 100.00 — — N/A<br />
14.53<br />
State<br />
Rate<br />
49.42<br />
State<br />
Rate<br />
54.07<br />
13.00<br />
State<br />
Target<br />
49.00<br />
State<br />
Target<br />
60.00<br />
Y<br />
N/A<br />
Y<br />
— —<br />
LEA<br />
Rate<br />
— —<br />
LEA<br />
Rate<br />
— —<br />
N/A<br />
Target Met<br />
by LEA<br />
(Y/N)<br />
N/A<br />
Target Met<br />
by LEA<br />
(Y/N)<br />
N/A<br />
Page 5 of 5
LEA: 4101 - ASHDOWN SCHOOL <strong>DISTRICT</strong><br />
<strong>ARKANSAS</strong> <strong>SPECIAL</strong> <strong>EDUCATION</strong><br />
<strong>DISTRICT</strong> <strong>ANNUAL</strong> PERFORMANCE REPORT<br />
2010/11 School Year<br />
Publication Date: March 2012<br />
Each State must have in place a State Performance Plan (SPP) to evaluate the State's efforts to meet the requirements and<br />
purposes of the implementation of the Individuals with Disabilities Education Act (IDEA). The SPP is a six-year plan, which<br />
describes Arkansas's performance on 20 indicators. The Office of Special Education Programs in the U. S. Department of<br />
Education requires that States report annually to the public on the performance of each local education agency (LEA) on 14 of<br />
20 indicators as compared with targets established by the State in the SPP. Arkansas will report indicators 1 through 14 and<br />
20 for each LEA serving children with disabilities (CWD). Any LEA not meeting targets on compliance indicators (0% for<br />
Indicators 4B, 09 & 10 and 100% for Indicators 11, 12, 13, and 20) are non-compliant with IDEA.<br />
There are no report changes for the 2010/11 school year profile; However, it is important to recognize that: .<br />
1. Indicator 01 (Graduation) is reported a year in arrear (2009/10 graduates) and is based on a four-year cohort. This<br />
means the rate is a measure of students who entered in ninth grade and graduate in four years. The calculation is a<br />
requirement under Title I of the Elementary and Secondary Education Act (ESEA).<br />
2. Indicator 02 (Drop out) is reported a year in arrear. This means the rate is a measure of students who dropped out in<br />
the 2009/10 school year. The Indicator 02 data are aligned with the Common Core of Data (CCD) requirements for<br />
grades 7-12.<br />
3. Indicator 04A and 4B (Suspension/Expulsion) is reported a year in arrear. This means the rate is a measure of<br />
students who had out-of-school suspensions and/or expulsions totaling more than 10 days.<br />
Percent of youth<br />
with IEPs<br />
graduating from<br />
high school with a<br />
regular diploma<br />
For a complete description of all the Indicators, please visit the special education website at<br />
http://arksped.k12.ar.us/sections/policy.html<br />
Indicator 01: Graduation Rates (2009/10 school year) Indicator 02: Dropout Rates (2009/10 school year)<br />
State<br />
Rate<br />
State<br />
Target<br />
75.76% 85.00%<br />
LEA<br />
Rate<br />
84.62%<br />
Target Met<br />
by LEA<br />
(Y/N)<br />
N<br />
Percent of<br />
youth with<br />
IEPs dropping<br />
out of high<br />
school<br />
State<br />
Rate<br />
Indicator 03: Assessment on Statewide Benchmark Exam (grades 3-8, 11)<br />
A) Adequate Yearly Progress<br />
n=40<br />
Literacy<br />
Mathematics<br />
Met Disability Subgroup "n"<br />
for Reporting Purposes (Y/N)<br />
State Target for % of Districts Meeting<br />
AYP for Disability Subgroup<br />
State<br />
Target<br />
3.06% 4.20%<br />
LEA<br />
Rate<br />
0.00%<br />
% of Districts Meeting AYP<br />
for Disability Subgroup<br />
Target Met by<br />
LEA (Y/N)<br />
Y<br />
Target Met by<br />
LEA(Y/N)<br />
Overall N 17.15% 6.25%<br />
NA<br />
N<br />
N<br />
Note: For a district to qualify as having a disability subgroup it must have a minimum of 40 (n=40) students with disabilities in a school building.<br />
B) Participation<br />
Participation Rate: # of<br />
CWD Tested ÷ # of CWD<br />
Enrolled in grades tested.<br />
Participation Rate: Literacy<br />
Participation Rate: Math<br />
Note: - - denotes not applicable<br />
State<br />
Rate<br />
98.78%<br />
State<br />
Target<br />
95.00%<br />
LEA<br />
Rate<br />
98.65%<br />
Target Met<br />
by LEA (Y/N)<br />
98.61% 95.00% 96.63% Y<br />
Y<br />
C) Performance Proficiency<br />
Percent of CWD Scoring<br />
Proficient or Above<br />
Proficiency Rate: Literacy<br />
Proficiency Rate:<br />
Mathematics<br />
16.00%<br />
16.00%<br />
State<br />
Rate<br />
31.49%<br />
44.86%<br />
State<br />
Target<br />
45.22%<br />
51.14%<br />
LEA<br />
Rate<br />
14.93%<br />
20.78%<br />
NA<br />
NA<br />
Target<br />
Met by<br />
LEA (Y/N)<br />
N<br />
N<br />
Page 1 of 5
LEA: 4101 - ASHDOWN SCHOOL <strong>DISTRICT</strong><br />
Indicator 04: Out-of-School Suspensions and Expulsions (2009/10 school year)<br />
A) Suspension/Expulsion<br />
Percent difference of CWD with out-of- school suspensions and<br />
expulsions totaling greater than 10 days in a school year as<br />
compared to the same data for general education students in<br />
the district.<br />
B) Suspension/Expulsion by Race and Ethnicity<br />
Percent of districts that have: (a) a significant discrepancy, by race or<br />
ethnicity, in the rate of suspensions and expulsions of greater than 10<br />
days in a school year for children with IEPs; and (b) policies,<br />
procedures or practices that contribute to the significant discrepancy<br />
and do not comply with requirements relating to the development<br />
and implementation of IEPs, the use of positive behavioral<br />
interventions and supports, and procedural safeguards.<br />
Indicator 05: School Age (5-21) Least Restrictive Environment<br />
A) In the Regular Class 80% or more of the day<br />
Percent of CWD with<br />
IEPs receiving instruction<br />
in the regular class 80%<br />
or more of the day.<br />
State<br />
Rate<br />
State<br />
Target<br />
LEA<br />
Rate<br />
B) In the Regular Class less than 40% of the day<br />
Percent of CWD with<br />
IEPs receiving instruction<br />
in the regular class less<br />
than 60% of the day.<br />
53.87% 59.77%<br />
State<br />
Rate<br />
State<br />
Target<br />
12.42% 12.51%<br />
52.94%<br />
LEA<br />
Rate<br />
7.84%<br />
C) Other Settings outside the regular class<br />
Percent of CWD with IEPs served in<br />
public or private separate schools,<br />
residential placements, or<br />
homebound/hospital placements.<br />
State<br />
Rate<br />
State<br />
Target<br />
2.80% 2.56%<br />
Target Met<br />
by LEA (Y/N)<br />
N<br />
Target Met<br />
by LEA (Y/N)<br />
Y<br />
LEA<br />
Rate<br />
1.31%<br />
Target Met<br />
by LEA(Y/N)<br />
Indicator 06: Early Childhood (3-5) Least Restrictive Environment<br />
A) Regular Early Childhood Program<br />
Percent of children (aged 3 through 5) with IEPs attending a regular<br />
early childhood program and receiving the majority of special<br />
education and related services in the regular early childhood program<br />
Allowable<br />
Difference<br />
LEA: 4101 - ASHDOWN SCHOOL <strong>DISTRICT</strong><br />
Indicator 07: Preschool (3-5) Outcomes<br />
a) Percent of preschool CWD<br />
children who did not<br />
improve functioning.<br />
b) Percent of preschool CWD<br />
who improved but whose<br />
functioning remained below<br />
same age peers.<br />
c) Percent of preschool CWD<br />
who improved at a level<br />
nearer to same aged peers.<br />
d) Percent of preschool CWD<br />
who improved functioning to<br />
reach a level comparable to<br />
same age peers.<br />
e) Percent of preschool CWD<br />
children who maintain<br />
functioning at a level<br />
comparable to same aged<br />
peers.<br />
Summary<br />
Statements<br />
1) Of those preschool<br />
children who entered<br />
the preschool program<br />
below age expectations<br />
in each Outcome, the<br />
percent who<br />
substantially increased<br />
their rate of growth by<br />
the time they turned 6<br />
years of age or exited<br />
the program.<br />
2) The percent of<br />
preschool children who<br />
were functioning<br />
within age expectations<br />
in each Outcome by the<br />
time they turned 6<br />
years of age or exited<br />
A) Positive Social -Emotional<br />
Skills*<br />
State<br />
Rate<br />
A) Positive Social -<br />
Emotional Skills<br />
(Including social<br />
relationships)<br />
State<br />
Rate<br />
2.14%<br />
5.31%<br />
25.97%<br />
38.22%<br />
28.36%<br />
State<br />
Target<br />
LEA<br />
Rate<br />
LEA<br />
Rate<br />
— —<br />
— —<br />
— —<br />
— —<br />
— —<br />
Target<br />
Met by<br />
LEA(Y/N)<br />
B) Acquisition and Use of<br />
Knowledge and Skills<br />
(Including early language/<br />
communication and early literacy)<br />
B) Acquisition and Use of<br />
Knowledge and Skills **<br />
State<br />
Rate<br />
1.75%<br />
6.59%<br />
34.23%<br />
43.51%<br />
13.92%<br />
State<br />
Target<br />
LEA<br />
Rate<br />
Target<br />
Met by<br />
LEA(Y/N)<br />
C) Use of Appropriate Behaviors<br />
to Meet Their Needs<br />
State<br />
Rate<br />
State<br />
Target<br />
LEA<br />
Rate<br />
Target<br />
Met by<br />
LEA(Y/N)<br />
89.61% 90.50% — — N/A 90.31% 90.50% — — N/A 90.82% 92.50% — — N/A<br />
66.58% 69.50% — — N/A 57.43% 60.50% — — N/A 76.69% 78.50% — — N/A<br />
NOTE: * Including social relationships ** Including early language/ communication and early literacy<br />
Note: - - denotes not applicable<br />
State<br />
Rate<br />
LEA<br />
Rate<br />
— —<br />
— —<br />
— —<br />
— —<br />
— —<br />
C) Use of<br />
Appropriate<br />
Behaviors to<br />
Meet Their Needs<br />
State<br />
Rate<br />
4.51%<br />
17.34%<br />
41.72%<br />
34.97%<br />
LEA<br />
Rate<br />
1.46% — —<br />
— —<br />
— —<br />
— —<br />
— —<br />
Page 3 of 5
LEA: 4101 - ASHDOWN SCHOOL <strong>DISTRICT</strong><br />
Indicator 08: Parent Involvement<br />
Percent of surveyed<br />
parents who reported<br />
school facilitated parent<br />
involvement as a means<br />
of improving services<br />
and results for children<br />
with disabilities.<br />
Early Childhood<br />
(3-5)<br />
School Age<br />
(5-21)<br />
State<br />
Rate<br />
90.47%<br />
95.05%<br />
Indicator 09: Disproportionality - Eligibility<br />
Disproportionate representation of racial<br />
and ethnic groups in special education and<br />
related services that is a result of<br />
inappropriate identification (e.g.<br />
monitoring data, review of policies,<br />
practices, and procedures under 618(d),<br />
etc.).<br />
State<br />
Rate<br />
State<br />
Target<br />
88.00%<br />
96.00%<br />
State<br />
Target<br />
0.00% 0.00%<br />
LEA<br />
Rate<br />
— —<br />
90.12%<br />
Indicator 10: Disproportionality-Child with a Disability<br />
Disproportionate representation of racial<br />
and ethnic groups in specific disability<br />
categories that is a result of inappropriate<br />
identification (e.g. monitoring data, review<br />
of policies, practices, and procedures under<br />
618(d), etc.).<br />
Indicator 11: Child Find<br />
Percent of children with<br />
parental consent to evaluate<br />
who are evaluated within<br />
the State established timeline<br />
of 60 days.<br />
Overall<br />
(3-21)<br />
Early Childhood<br />
(3-5)<br />
School Age<br />
(5-21)<br />
State<br />
Rate<br />
0.00%<br />
Indicator 12: Early Childhood Transition<br />
Percent of children referred by Part C prior to<br />
age 3, who are found eligible for Part B, and<br />
who have an IEP developed and implemented<br />
by their third birthday.<br />
Note: - - denotes not applicable<br />
State<br />
Rate<br />
99.41%<br />
99.70%<br />
98.97%<br />
State<br />
Rate<br />
State<br />
Target<br />
0.00%<br />
State<br />
Target<br />
100.00%<br />
100.00%<br />
100.00%<br />
State<br />
Target<br />
Target Met by<br />
LEA (Y/N)<br />
Y<br />
Target Met by<br />
LEA (Y/N)<br />
Y<br />
LEA<br />
Rate<br />
100.00%<br />
— —<br />
100.00%<br />
LEA<br />
Rate<br />
Target Met by<br />
LEA (Y/N)<br />
N/A<br />
N<br />
Note: The target for Indicator 09 is to have zero percent<br />
(0%) of districts identified as having disproportionate<br />
representation as a result of inappropriate<br />
identification in eligibility.<br />
Note: The target for Indicator 10 is to have zero<br />
percent (0%) of districts identified as having<br />
disproportionate representation as a result of<br />
inappropriate identification in a disability<br />
category.<br />
Target Met by<br />
LEA (Y/N)<br />
N/A<br />
Y<br />
Target Met<br />
by LEA<br />
(Y/N)<br />
99.21% 100.00% - - N/A<br />
Y<br />
Note: * Indicates a zero reponse rate for the<br />
district.<br />
Page 4 of 5
LEA: 4101 - ASHDOWN SCHOOL <strong>DISTRICT</strong><br />
Indicator 13: Secondary Transition<br />
Percent of youth with disabilities aged 16 and<br />
up with an IEP that includes coordinated,<br />
measurable, annual IEP goals and transition<br />
services that will reasonably enable the student<br />
to meet the post-secondary goals.<br />
Indicator 14: Post-School Outcomes<br />
A. Percent of youth enrolled in higher<br />
education within one year of leaving high<br />
school.<br />
State<br />
Rate<br />
State<br />
Target<br />
Note: Data for this Indicator is from the on-site monitoring of LEAs for the given year.<br />
B. Percent of youth enrolled in higher<br />
education or competitively employed<br />
within one year of leaving high school.<br />
C. Percent of youth enrolled in higher<br />
education or in some other postsecondary<br />
education or training program; or<br />
competitively employed or in some other<br />
employment within one year of leaving<br />
high school.<br />
State<br />
Rate<br />
Indicator 20: Reported Data-Timely and Accurate*<br />
District submitted<br />
required data elements<br />
on or before due dates;<br />
made revisions within<br />
the alloted reveiw<br />
periods.<br />
Accurate and Timely<br />
Data Submission<br />
Overall (3-21)<br />
Early Childhood (3-5)<br />
School Age (5-21)<br />
State<br />
Target<br />
100.00%<br />
100.00%<br />
100.00%<br />
State<br />
Target<br />
LEA<br />
Rate<br />
LEA<br />
Rate<br />
Target Met by<br />
LEA (Y/N)<br />
Target Met<br />
by LEA<br />
(Y/N)<br />
Target Met<br />
by LEA<br />
(Y/N)<br />
*Data reviewed for timely and accurate submissions included all APSCN cycle data except for personnel<br />
Note: - - denotes not applicable<br />
96.19 100.00 — — N/A<br />
14.53<br />
State<br />
Rate<br />
49.42<br />
State<br />
Rate<br />
54.07<br />
13.00<br />
State<br />
Target<br />
49.00<br />
State<br />
Target<br />
60.00<br />
Y<br />
N/A<br />
Y<br />
— —<br />
LEA<br />
Rate<br />
— —<br />
LEA<br />
Rate<br />
— —<br />
N/A<br />
Target Met<br />
by LEA<br />
(Y/N)<br />
N/A<br />
Target Met<br />
by LEA<br />
(Y/N)<br />
N/A<br />
Page 5 of 5
LEA: 4102 - FOREMAN SCHOOL <strong>DISTRICT</strong><br />
<strong>ARKANSAS</strong> <strong>SPECIAL</strong> <strong>EDUCATION</strong><br />
<strong>DISTRICT</strong> <strong>ANNUAL</strong> PERFORMANCE REPORT<br />
2010/11 School Year<br />
Publication Date: March 2012<br />
Each State must have in place a State Performance Plan (SPP) to evaluate the State's efforts to meet the requirements and<br />
purposes of the implementation of the Individuals with Disabilities Education Act (IDEA). The SPP is a six-year plan, which<br />
describes Arkansas's performance on 20 indicators. The Office of Special Education Programs in the U. S. Department of<br />
Education requires that States report annually to the public on the performance of each local education agency (LEA) on 14 of<br />
20 indicators as compared with targets established by the State in the SPP. Arkansas will report indicators 1 through 14 and<br />
20 for each LEA serving children with disabilities (CWD). Any LEA not meeting targets on compliance indicators (0% for<br />
Indicators 4B, 09 & 10 and 100% for Indicators 11, 12, 13, and 20) are non-compliant with IDEA.<br />
There are no report changes for the 2010/11 school year profile; However, it is important to recognize that: .<br />
1. Indicator 01 (Graduation) is reported a year in arrear (2009/10 graduates) and is based on a four-year cohort. This<br />
means the rate is a measure of students who entered in ninth grade and graduate in four years. The calculation is a<br />
requirement under Title I of the Elementary and Secondary Education Act (ESEA).<br />
2. Indicator 02 (Drop out) is reported a year in arrear. This means the rate is a measure of students who dropped out in<br />
the 2009/10 school year. The Indicator 02 data are aligned with the Common Core of Data (CCD) requirements for<br />
grades 7-12.<br />
3. Indicator 04A and 4B (Suspension/Expulsion) is reported a year in arrear. This means the rate is a measure of<br />
students who had out-of-school suspensions and/or expulsions totaling more than 10 days.<br />
Percent of youth<br />
with IEPs<br />
graduating from<br />
high school with a<br />
regular diploma<br />
For a complete description of all the Indicators, please visit the special education website at<br />
http://arksped.k12.ar.us/sections/policy.html<br />
Indicator 01: Graduation Rates (2009/10 school year) Indicator 02: Dropout Rates (2009/10 school year)<br />
State<br />
Rate<br />
State<br />
Target<br />
75.76% 85.00%<br />
LEA<br />
Rate<br />
— —<br />
Target Met<br />
by LEA<br />
(Y/N)<br />
NA<br />
Percent of<br />
youth with<br />
IEPs dropping<br />
out of high<br />
school<br />
State<br />
Rate<br />
Indicator 03: Assessment on Statewide Benchmark Exam (grades 3-8, 11)<br />
A) Adequate Yearly Progress<br />
n=40<br />
Literacy<br />
Mathematics<br />
Met Disability Subgroup "n"<br />
for Reporting Purposes (Y/N)<br />
State Target for % of Districts Meeting<br />
AYP for Disability Subgroup<br />
State<br />
Target<br />
3.06% 4.20%<br />
LEA<br />
Rate<br />
9.52%<br />
% of Districts Meeting AYP<br />
for Disability Subgroup<br />
Target Met by<br />
LEA (Y/N)<br />
N<br />
Target Met by<br />
LEA(Y/N)<br />
Overall N 17.15% 6.25%<br />
NA<br />
N<br />
N<br />
Note: For a district to qualify as having a disability subgroup it must have a minimum of 40 (n=40) students with disabilities in a school building.<br />
B) Participation<br />
Participation Rate: # of<br />
CWD Tested ÷ # of CWD<br />
Enrolled in grades tested.<br />
Participation Rate: Literacy<br />
Participation Rate: Math<br />
Note: - - denotes not applicable<br />
State<br />
Rate<br />
98.78%<br />
State<br />
Target<br />
95.00%<br />
LEA<br />
Rate<br />
100.00%<br />
Target Met<br />
by LEA (Y/N)<br />
98.61% 95.00% 100.00% Y<br />
Y<br />
C) Performance Proficiency<br />
Percent of CWD Scoring<br />
Proficient or Above<br />
Proficiency Rate: Literacy<br />
Proficiency Rate:<br />
Mathematics<br />
16.00%<br />
16.00%<br />
State<br />
Rate<br />
31.49%<br />
44.86%<br />
State<br />
Target<br />
45.22%<br />
51.14%<br />
LEA<br />
Rate<br />
9.68%<br />
42.86%<br />
NA<br />
NA<br />
Target<br />
Met by<br />
LEA (Y/N)<br />
N<br />
N<br />
Page 1 of 5
LEA: 4102 - FOREMAN SCHOOL <strong>DISTRICT</strong><br />
Indicator 04: Out-of-School Suspensions and Expulsions (2009/10 school year)<br />
A) Suspension/Expulsion<br />
Percent difference of CWD with out-of- school suspensions and<br />
expulsions totaling greater than 10 days in a school year as<br />
compared to the same data for general education students in<br />
the district.<br />
B) Suspension/Expulsion by Race and Ethnicity<br />
Percent of districts that have: (a) a significant discrepancy, by race or<br />
ethnicity, in the rate of suspensions and expulsions of greater than 10<br />
days in a school year for children with IEPs; and (b) policies,<br />
procedures or practices that contribute to the significant discrepancy<br />
and do not comply with requirements relating to the development<br />
and implementation of IEPs, the use of positive behavioral<br />
interventions and supports, and procedural safeguards.<br />
Indicator 05: School Age (5-21) Least Restrictive Environment<br />
A) In the Regular Class 80% or more of the day<br />
Percent of CWD with<br />
IEPs receiving instruction<br />
in the regular class 80%<br />
or more of the day.<br />
State<br />
Rate<br />
State<br />
Target<br />
LEA<br />
Rate<br />
B) In the Regular Class less than 40% of the day<br />
Percent of CWD with<br />
IEPs receiving instruction<br />
in the regular class less<br />
than 60% of the day.<br />
53.87% 59.77%<br />
State<br />
Rate<br />
State<br />
Target<br />
12.42% 12.51%<br />
63.64%<br />
LEA<br />
Rate<br />
3.03%<br />
C) Other Settings outside the regular class<br />
Percent of CWD with IEPs served in<br />
public or private separate schools,<br />
residential placements, or<br />
homebound/hospital placements.<br />
State<br />
Rate<br />
State<br />
Target<br />
2.80% 2.56%<br />
Target Met<br />
by LEA (Y/N)<br />
Y<br />
Target Met<br />
by LEA (Y/N)<br />
Y<br />
LEA<br />
Rate<br />
1.52%<br />
Target Met<br />
by LEA(Y/N)<br />
Indicator 06: Early Childhood (3-5) Least Restrictive Environment<br />
A) Regular Early Childhood Program<br />
Percent of children (aged 3 through 5) with IEPs attending a regular<br />
early childhood program and receiving the majority of special<br />
education and related services in the regular early childhood program<br />
Allowable<br />
Difference<br />
LEA: 4102 - FOREMAN SCHOOL <strong>DISTRICT</strong><br />
Indicator 07: Preschool (3-5) Outcomes<br />
a) Percent of preschool CWD<br />
children who did not<br />
improve functioning.<br />
b) Percent of preschool CWD<br />
who improved but whose<br />
functioning remained below<br />
same age peers.<br />
c) Percent of preschool CWD<br />
who improved at a level<br />
nearer to same aged peers.<br />
d) Percent of preschool CWD<br />
who improved functioning to<br />
reach a level comparable to<br />
same age peers.<br />
e) Percent of preschool CWD<br />
children who maintain<br />
functioning at a level<br />
comparable to same aged<br />
peers.<br />
Summary<br />
Statements<br />
1) Of those preschool<br />
children who entered<br />
the preschool program<br />
below age expectations<br />
in each Outcome, the<br />
percent who<br />
substantially increased<br />
their rate of growth by<br />
the time they turned 6<br />
years of age or exited<br />
the program.<br />
2) The percent of<br />
preschool children who<br />
were functioning<br />
within age expectations<br />
in each Outcome by the<br />
time they turned 6<br />
years of age or exited<br />
A) Positive Social -Emotional<br />
Skills*<br />
State<br />
Rate<br />
A) Positive Social -<br />
Emotional Skills<br />
(Including social<br />
relationships)<br />
State<br />
Rate<br />
2.14%<br />
5.31%<br />
25.97%<br />
38.22%<br />
28.36%<br />
State<br />
Target<br />
LEA<br />
Rate<br />
LEA<br />
Rate<br />
— —<br />
— —<br />
— —<br />
— —<br />
— —<br />
Target<br />
Met by<br />
LEA(Y/N)<br />
B) Acquisition and Use of<br />
Knowledge and Skills<br />
(Including early language/<br />
communication and early literacy)<br />
B) Acquisition and Use of<br />
Knowledge and Skills **<br />
State<br />
Rate<br />
1.75%<br />
6.59%<br />
34.23%<br />
43.51%<br />
13.92%<br />
State<br />
Target<br />
LEA<br />
Rate<br />
Target<br />
Met by<br />
LEA(Y/N)<br />
C) Use of Appropriate Behaviors<br />
to Meet Their Needs<br />
State<br />
Rate<br />
State<br />
Target<br />
LEA<br />
Rate<br />
Target<br />
Met by<br />
LEA(Y/N)<br />
89.61% 90.50% — — N/A 90.31% 90.50% — — N/A 90.82% 92.50% — — N/A<br />
66.58% 69.50% — — N/A 57.43% 60.50% — — N/A 76.69% 78.50% — — N/A<br />
NOTE: * Including social relationships ** Including early language/ communication and early literacy<br />
Note: - - denotes not applicable<br />
State<br />
Rate<br />
LEA<br />
Rate<br />
— —<br />
— —<br />
— —<br />
— —<br />
— —<br />
C) Use of<br />
Appropriate<br />
Behaviors to<br />
Meet Their Needs<br />
State<br />
Rate<br />
4.51%<br />
17.34%<br />
41.72%<br />
34.97%<br />
LEA<br />
Rate<br />
1.46% — —<br />
— —<br />
— —<br />
— —<br />
— —<br />
Page 3 of 5
LEA: 4102 - FOREMAN SCHOOL <strong>DISTRICT</strong><br />
Indicator 08: Parent Involvement<br />
Percent of surveyed<br />
parents who reported<br />
school facilitated parent<br />
involvement as a means<br />
of improving services<br />
and results for children<br />
with disabilities.<br />
Early Childhood<br />
(3-5)<br />
School Age<br />
(5-21)<br />
State<br />
Rate<br />
90.47%<br />
95.05%<br />
Indicator 09: Disproportionality - Eligibility<br />
Disproportionate representation of racial<br />
and ethnic groups in special education and<br />
related services that is a result of<br />
inappropriate identification (e.g.<br />
monitoring data, review of policies,<br />
practices, and procedures under 618(d),<br />
etc.).<br />
State<br />
Rate<br />
State<br />
Target<br />
88.00%<br />
96.00%<br />
State<br />
Target<br />
0.00% 0.00%<br />
LEA<br />
Rate<br />
— —<br />
97.22%<br />
Indicator 10: Disproportionality-Child with a Disability<br />
Disproportionate representation of racial<br />
and ethnic groups in specific disability<br />
categories that is a result of inappropriate<br />
identification (e.g. monitoring data, review<br />
of policies, practices, and procedures under<br />
618(d), etc.).<br />
Indicator 11: Child Find<br />
Percent of children with<br />
parental consent to evaluate<br />
who are evaluated within<br />
the State established timeline<br />
of 60 days.<br />
Overall<br />
(3-21)<br />
Early Childhood<br />
(3-5)<br />
School Age<br />
(5-21)<br />
State<br />
Rate<br />
0.00%<br />
Indicator 12: Early Childhood Transition<br />
Percent of children referred by Part C prior to<br />
age 3, who are found eligible for Part B, and<br />
who have an IEP developed and implemented<br />
by their third birthday.<br />
Note: - - denotes not applicable<br />
State<br />
Rate<br />
99.41%<br />
99.70%<br />
98.97%<br />
State<br />
Rate<br />
State<br />
Target<br />
0.00%<br />
State<br />
Target<br />
100.00%<br />
100.00%<br />
100.00%<br />
State<br />
Target<br />
Target Met by<br />
LEA (Y/N)<br />
Y<br />
Target Met by<br />
LEA (Y/N)<br />
Y<br />
LEA<br />
Rate<br />
100.00%<br />
— —<br />
100.00%<br />
LEA<br />
Rate<br />
Target Met by<br />
LEA (Y/N)<br />
N/A<br />
Y<br />
Note: The target for Indicator 09 is to have zero percent<br />
(0%) of districts identified as having disproportionate<br />
representation as a result of inappropriate<br />
identification in eligibility.<br />
Note: The target for Indicator 10 is to have zero<br />
percent (0%) of districts identified as having<br />
disproportionate representation as a result of<br />
inappropriate identification in a disability<br />
category.<br />
Target Met by<br />
LEA (Y/N)<br />
N/A<br />
Y<br />
Target Met<br />
by LEA<br />
(Y/N)<br />
99.21% 100.00% - - N/A<br />
Y<br />
Note: * Indicates a zero reponse rate for the<br />
district.<br />
Page 4 of 5
LEA: 4102 - FOREMAN SCHOOL <strong>DISTRICT</strong><br />
Indicator 13: Secondary Transition<br />
Percent of youth with disabilities aged 16 and<br />
up with an IEP that includes coordinated,<br />
measurable, annual IEP goals and transition<br />
services that will reasonably enable the student<br />
to meet the post-secondary goals.<br />
Indicator 14: Post-School Outcomes<br />
A. Percent of youth enrolled in higher<br />
education within one year of leaving high<br />
school.<br />
State<br />
Rate<br />
State<br />
Target<br />
Note: Data for this Indicator is from the on-site monitoring of LEAs for the given year.<br />
B. Percent of youth enrolled in higher<br />
education or competitively employed<br />
within one year of leaving high school.<br />
C. Percent of youth enrolled in higher<br />
education or in some other postsecondary<br />
education or training program; or<br />
competitively employed or in some other<br />
employment within one year of leaving<br />
high school.<br />
State<br />
Rate<br />
Indicator 20: Reported Data-Timely and Accurate*<br />
District submitted<br />
required data elements<br />
on or before due dates;<br />
made revisions within<br />
the alloted reveiw<br />
periods.<br />
Accurate and Timely<br />
Data Submission<br />
Overall (3-21)<br />
Early Childhood (3-5)<br />
School Age (5-21)<br />
State<br />
Target<br />
100.00%<br />
100.00%<br />
100.00%<br />
State<br />
Target<br />
LEA<br />
Rate<br />
LEA<br />
Rate<br />
Target Met by<br />
LEA (Y/N)<br />
Target Met<br />
by LEA<br />
(Y/N)<br />
Target Met<br />
by LEA<br />
(Y/N)<br />
*Data reviewed for timely and accurate submissions included all APSCN cycle data except for personnel<br />
Note: - - denotes not applicable<br />
96.19 100.00 — — N/A<br />
14.53<br />
State<br />
Rate<br />
49.42<br />
State<br />
Rate<br />
54.07<br />
13.00<br />
State<br />
Target<br />
49.00<br />
State<br />
Target<br />
60.00<br />
Y<br />
N/A<br />
Y<br />
— —<br />
LEA<br />
Rate<br />
— —<br />
LEA<br />
Rate<br />
— —<br />
N/A<br />
Target Met<br />
by LEA<br />
(Y/N)<br />
N/A<br />
Target Met<br />
by LEA<br />
(Y/N)<br />
N/A<br />
Page 5 of 5
<strong>ARKANSAS</strong> <strong>SPECIAL</strong> <strong>EDUCATION</strong><br />
<strong>DISTRICT</strong> <strong>ANNUAL</strong> PERFORMANCE REPORT<br />
2010/11 School Year<br />
Publication Date: March 2012<br />
Each State must have in place a State Performance Plan (SPP) to evaluate the State's efforts to meet the requirements and<br />
purposes of the implementation of the Individuals with Disabilities Education Act (IDEA). The SPP is a six-year plan, which<br />
describes Arkansas's performance on 20 indicators. The Office of Special Education Programs in the U. S. Department of<br />
Education requires that States report annually to the public on the performance of each local education agency (LEA) on 14 of<br />
20 indicators as compared with targets established by the State in the SPP. Arkansas will report indicators 1 through 14 and<br />
20 for each LEA serving children with disabilities (CWD). Any LEA not meeting targets on compliance indicators (0% for<br />
Indicators 4B, 09 & 10 and 100% for Indicators 11, 12, 13, and 20) are non-compliant with IDEA.<br />
There are no report changes for the 2010/11 school year profile; However, it is important to recognize that: .<br />
1. Indicator 01 (Graduation) is reported a year in arrear (2009/10 graduates) and is based on a four-year cohort. This<br />
means the rate is a measure of students who entered in ninth grade and graduate in four years. The calculation is a<br />
requirement under Title I of the Elementary and Secondary Education Act (ESEA).<br />
2. Indicator 02 (Drop out) is reported a year in arrear. This means the rate is a measure of students who dropped out in<br />
the 2009/10 school year. The Indicator 02 data are aligned with the Common Core of Data (CCD) requirements for<br />
grades 7-12.<br />
3. Indicator 04A and 4B (Suspension/Expulsion) is reported a year in arrear. This means the rate is a measure of<br />
students who had out-of-school suspensions and/or expulsions totaling more than 10 days.<br />
For a complete description of all the Indicators, please visit the special education website at<br />
http://arksped.k12.ar.us/sections/policy.html<br />
LEA: 4201 - BOONEVILLE SCHOOL <strong>DISTRICT</strong><br />
Indicator 01: Graduation Rates (2009/10 school year) Indicator 02: Dropout Rates (2009/10 school year)<br />
Percent of youth<br />
with IEPs<br />
graduating from<br />
high school with a<br />
regular diploma<br />
State<br />
Rate<br />
State<br />
Target<br />
75.76% 85.00%<br />
LEA<br />
Rate<br />
78.57%<br />
Target Met<br />
by LEA<br />
(Y/N)<br />
N<br />
Percent of<br />
youth with<br />
IEPs dropping<br />
out of high<br />
school<br />
State<br />
Rate<br />
Indicator 03: Assessment on Statewide Benchmark Exam (grades 3-8, 11)<br />
A) Adequate Yearly Progress<br />
n=40<br />
Literacy<br />
Mathematics<br />
Met Disability Subgroup "n"<br />
for Reporting Purposes (Y/N)<br />
State Target for % of Districts Meeting<br />
AYP for Disability Subgroup<br />
State<br />
Target<br />
3.06% 4.20%<br />
LEA<br />
Rate<br />
2.47%<br />
% of Districts Meeting AYP<br />
for Disability Subgroup<br />
Target Met by<br />
LEA (Y/N)<br />
Y<br />
Target Met by<br />
LEA(Y/N)<br />
Overall Y 17.15% 6.25%<br />
Y<br />
Y<br />
Y<br />
Note: For a district to qualify as having a disability subgroup it must have a minimum of 40 (n=40) students with disabilities in a school building.<br />
B) Participation<br />
Participation Rate: # of<br />
CWD Tested ÷ # of CWD<br />
Enrolled in grades tested.<br />
Participation Rate: Literacy<br />
Participation Rate: Math<br />
Note: - - denotes not applicable<br />
State<br />
Rate<br />
98.78%<br />
State<br />
Target<br />
95.00%<br />
LEA<br />
Rate<br />
99.12%<br />
Target Met<br />
by LEA (Y/N)<br />
98.61% 95.00% 100.00% Y<br />
Y<br />
C) Performance Proficiency<br />
Percent of CWD Scoring<br />
Proficient or Above<br />
Proficiency Rate: Literacy<br />
Proficiency Rate:<br />
Mathematics<br />
16.00%<br />
16.00%<br />
State<br />
Rate<br />
31.49%<br />
44.86%<br />
State<br />
Target<br />
45.22%<br />
51.14%<br />
LEA<br />
Rate<br />
25.47%<br />
39.83%<br />
Y<br />
Y<br />
Target<br />
Met by<br />
LEA (Y/N)<br />
N<br />
N<br />
Page 1 of 5
LEA: 4201 - BOONEVILLE SCHOOL <strong>DISTRICT</strong><br />
Indicator 04: Out-of-School Suspensions and Expulsions (2009/10 school year)<br />
A) Suspension/Expulsion<br />
Percent difference of CWD with out-of- school suspensions and<br />
expulsions totaling greater than 10 days in a school year as<br />
compared to the same data for general education students in<br />
the district.<br />
B) Suspension/Expulsion by Race and Ethnicity<br />
Percent of districts that have: (a) a significant discrepancy, by race or<br />
ethnicity, in the rate of suspensions and expulsions of greater than 10<br />
days in a school year for children with IEPs; and (b) policies,<br />
procedures or practices that contribute to the significant discrepancy<br />
and do not comply with requirements relating to the development<br />
and implementation of IEPs, the use of positive behavioral<br />
interventions and supports, and procedural safeguards.<br />
Indicator 05: School Age (5-21) Least Restrictive Environment<br />
A) In the Regular Class 80% or more of the day<br />
Percent of CWD with<br />
IEPs receiving instruction<br />
in the regular class 80%<br />
or more of the day.<br />
State<br />
Rate<br />
State<br />
Target<br />
LEA<br />
Rate<br />
B) In the Regular Class less than 40% of the day<br />
Percent of CWD with<br />
IEPs receiving instruction<br />
in the regular class less<br />
than 60% of the day.<br />
53.87% 59.77%<br />
State<br />
Rate<br />
State<br />
Target<br />
12.42% 12.51%<br />
56.57%<br />
LEA<br />
Rate<br />
9.60%<br />
C) Other Settings outside the regular class<br />
Percent of CWD with IEPs served in<br />
public or private separate schools,<br />
residential placements, or<br />
homebound/hospital placements.<br />
State<br />
Rate<br />
State<br />
Target<br />
2.80% 2.56%<br />
Target Met<br />
by LEA (Y/N)<br />
N<br />
Target Met<br />
by LEA (Y/N)<br />
Y<br />
LEA<br />
Rate<br />
0.00%<br />
Target Met<br />
by LEA(Y/N)<br />
Indicator 06: Early Childhood (3-5) Least Restrictive Environment<br />
A) Regular Early Childhood Program<br />
Percent of children (aged 3 through 5) with IEPs attending a regular<br />
early childhood program and receiving the majority of special<br />
education and related services in the regular early childhood program<br />
Allowable<br />
Difference<br />
LEA: 4201 - BOONEVILLE SCHOOL <strong>DISTRICT</strong><br />
Indicator 07: Preschool (3-5) Outcomes<br />
a) Percent of preschool CWD<br />
children who did not<br />
improve functioning.<br />
b) Percent of preschool CWD<br />
who improved but whose<br />
functioning remained below<br />
same age peers.<br />
c) Percent of preschool CWD<br />
who improved at a level<br />
nearer to same aged peers.<br />
d) Percent of preschool CWD<br />
who improved functioning to<br />
reach a level comparable to<br />
same age peers.<br />
e) Percent of preschool CWD<br />
children who maintain<br />
functioning at a level<br />
comparable to same aged<br />
peers.<br />
Summary<br />
Statements<br />
1) Of those preschool<br />
children who entered<br />
the preschool program<br />
below age expectations<br />
in each Outcome, the<br />
percent who<br />
substantially increased<br />
their rate of growth by<br />
the time they turned 6<br />
years of age or exited<br />
the program.<br />
2) The percent of<br />
preschool children who<br />
were functioning<br />
within age expectations<br />
in each Outcome by the<br />
time they turned 6<br />
years of age or exited<br />
A) Positive Social -Emotional<br />
Skills*<br />
State<br />
Rate<br />
A) Positive Social -<br />
Emotional Skills<br />
(Including social<br />
relationships)<br />
State<br />
Rate<br />
2.14%<br />
5.31%<br />
25.97%<br />
38.22%<br />
28.36%<br />
State<br />
Target<br />
LEA<br />
Rate<br />
LEA<br />
Rate<br />
— —<br />
— —<br />
— —<br />
— —<br />
— —<br />
Target<br />
Met by<br />
LEA(Y/N)<br />
B) Acquisition and Use of<br />
Knowledge and Skills<br />
(Including early language/<br />
communication and early literacy)<br />
B) Acquisition and Use of<br />
Knowledge and Skills **<br />
State<br />
Rate<br />
1.75%<br />
6.59%<br />
34.23%<br />
43.51%<br />
13.92%<br />
State<br />
Target<br />
LEA<br />
Rate<br />
Target<br />
Met by<br />
LEA(Y/N)<br />
C) Use of Appropriate Behaviors<br />
to Meet Their Needs<br />
State<br />
Rate<br />
State<br />
Target<br />
LEA<br />
Rate<br />
Target<br />
Met by<br />
LEA(Y/N)<br />
89.61% 90.50% — — N/A 90.31% 90.50% — — N/A 90.82% 92.50% — — N/A<br />
66.58% 69.50% — — N/A 57.43% 60.50% — — N/A 76.69% 78.50% — — N/A<br />
NOTE: * Including social relationships ** Including early language/ communication and early literacy<br />
Note: - - denotes not applicable<br />
State<br />
Rate<br />
LEA<br />
Rate<br />
— —<br />
— —<br />
— —<br />
— —<br />
— —<br />
C) Use of<br />
Appropriate<br />
Behaviors to<br />
Meet Their Needs<br />
State<br />
Rate<br />
4.51%<br />
17.34%<br />
41.72%<br />
34.97%<br />
LEA<br />
Rate<br />
1.46% — —<br />
— —<br />
— —<br />
— —<br />
— —<br />
Page 3 of 5
LEA: 4201 - BOONEVILLE SCHOOL <strong>DISTRICT</strong><br />
Indicator 08: Parent Involvement<br />
Percent of surveyed<br />
parents who reported<br />
school facilitated parent<br />
involvement as a means<br />
of improving services<br />
and results for children<br />
with disabilities.<br />
Early Childhood<br />
(3-5)<br />
School Age<br />
(5-21)<br />
State<br />
Rate<br />
90.47%<br />
95.05%<br />
Indicator 09: Disproportionality - Eligibility<br />
Disproportionate representation of racial<br />
and ethnic groups in special education and<br />
related services that is a result of<br />
inappropriate identification (e.g.<br />
monitoring data, review of policies,<br />
practices, and procedures under 618(d),<br />
etc.).<br />
State<br />
Rate<br />
State<br />
Target<br />
88.00%<br />
96.00%<br />
State<br />
Target<br />
0.00% 0.00%<br />
LEA<br />
Rate<br />
— —<br />
97.56%<br />
Indicator 10: Disproportionality-Child with a Disability<br />
Disproportionate representation of racial<br />
and ethnic groups in specific disability<br />
categories that is a result of inappropriate<br />
identification (e.g. monitoring data, review<br />
of policies, practices, and procedures under<br />
618(d), etc.).<br />
Indicator 11: Child Find<br />
Percent of children with<br />
parental consent to evaluate<br />
who are evaluated within<br />
the State established timeline<br />
of 60 days.<br />
Overall<br />
(3-21)<br />
Early Childhood<br />
(3-5)<br />
School Age<br />
(5-21)<br />
State<br />
Rate<br />
0.00%<br />
Indicator 12: Early Childhood Transition<br />
Percent of children referred by Part C prior to<br />
age 3, who are found eligible for Part B, and<br />
who have an IEP developed and implemented<br />
by their third birthday.<br />
Note: - - denotes not applicable<br />
State<br />
Rate<br />
99.41%<br />
99.70%<br />
98.97%<br />
State<br />
Rate<br />
State<br />
Target<br />
0.00%<br />
State<br />
Target<br />
100.00%<br />
100.00%<br />
100.00%<br />
State<br />
Target<br />
Target Met by<br />
LEA (Y/N)<br />
Y<br />
Target Met by<br />
LEA (Y/N)<br />
Y<br />
LEA<br />
Rate<br />
100.00%<br />
— —<br />
100.00%<br />
LEA<br />
Rate<br />
Target Met by<br />
LEA (Y/N)<br />
N/A<br />
Y<br />
Note: The target for Indicator 09 is to have zero percent<br />
(0%) of districts identified as having disproportionate<br />
representation as a result of inappropriate<br />
identification in eligibility.<br />
Note: The target for Indicator 10 is to have zero<br />
percent (0%) of districts identified as having<br />
disproportionate representation as a result of<br />
inappropriate identification in a disability<br />
category.<br />
Target Met by<br />
LEA (Y/N)<br />
N/A<br />
Y<br />
Target Met<br />
by LEA<br />
(Y/N)<br />
99.21% 100.00% - - N/A<br />
Y<br />
Note: * Indicates a zero reponse rate for the<br />
district.<br />
Page 4 of 5
LEA: 4201 - BOONEVILLE SCHOOL <strong>DISTRICT</strong><br />
Indicator 13: Secondary Transition<br />
Percent of youth with disabilities aged 16 and<br />
up with an IEP that includes coordinated,<br />
measurable, annual IEP goals and transition<br />
services that will reasonably enable the student<br />
to meet the post-secondary goals.<br />
Indicator 14: Post-School Outcomes<br />
A. Percent of youth enrolled in higher<br />
education within one year of leaving high<br />
school.<br />
State<br />
Rate<br />
State<br />
Target<br />
Note: Data for this Indicator is from the on-site monitoring of LEAs for the given year.<br />
B. Percent of youth enrolled in higher<br />
education or competitively employed<br />
within one year of leaving high school.<br />
C. Percent of youth enrolled in higher<br />
education or in some other postsecondary<br />
education or training program; or<br />
competitively employed or in some other<br />
employment within one year of leaving<br />
high school.<br />
State<br />
Rate<br />
Indicator 20: Reported Data-Timely and Accurate*<br />
District submitted<br />
required data elements<br />
on or before due dates;<br />
made revisions within<br />
the alloted reveiw<br />
periods.<br />
Accurate and Timely<br />
Data Submission<br />
Overall (3-21)<br />
Early Childhood (3-5)<br />
School Age (5-21)<br />
State<br />
Target<br />
100.00%<br />
100.00%<br />
100.00%<br />
State<br />
Target<br />
LEA<br />
Rate<br />
LEA<br />
Rate<br />
Target Met by<br />
LEA (Y/N)<br />
Target Met<br />
by LEA<br />
(Y/N)<br />
Target Met<br />
by LEA<br />
(Y/N)<br />
*Data reviewed for timely and accurate submissions included all APSCN cycle data except for personnel<br />
Note: - - denotes not applicable<br />
96.19 100.00 — — N/A<br />
14.53<br />
State<br />
Rate<br />
49.42<br />
State<br />
Rate<br />
54.07<br />
13.00<br />
State<br />
Target<br />
49.00<br />
State<br />
Target<br />
60.00<br />
Y<br />
N/A<br />
Y<br />
— —<br />
LEA<br />
Rate<br />
— —<br />
LEA<br />
Rate<br />
— —<br />
N/A<br />
Target Met<br />
by LEA<br />
(Y/N)<br />
N/A<br />
Target Met<br />
by LEA<br />
(Y/N)<br />
N/A<br />
Page 5 of 5
LEA: 4202 - MAGAZINE SCHOOL <strong>DISTRICT</strong><br />
<strong>ARKANSAS</strong> <strong>SPECIAL</strong> <strong>EDUCATION</strong><br />
<strong>DISTRICT</strong> <strong>ANNUAL</strong> PERFORMANCE REPORT<br />
2010/11 School Year<br />
Publication Date: March 2012<br />
Each State must have in place a State Performance Plan (SPP) to evaluate the State's efforts to meet the requirements and<br />
purposes of the implementation of the Individuals with Disabilities Education Act (IDEA). The SPP is a six-year plan, which<br />
describes Arkansas's performance on 20 indicators. The Office of Special Education Programs in the U. S. Department of<br />
Education requires that States report annually to the public on the performance of each local education agency (LEA) on 14 of<br />
20 indicators as compared with targets established by the State in the SPP. Arkansas will report indicators 1 through 14 and<br />
20 for each LEA serving children with disabilities (CWD). Any LEA not meeting targets on compliance indicators (0% for<br />
Indicators 4B, 09 & 10 and 100% for Indicators 11, 12, 13, and 20) are non-compliant with IDEA.<br />
There are no report changes for the 2010/11 school year profile; However, it is important to recognize that: .<br />
1. Indicator 01 (Graduation) is reported a year in arrear (2009/10 graduates) and is based on a four-year cohort. This<br />
means the rate is a measure of students who entered in ninth grade and graduate in four years. The calculation is a<br />
requirement under Title I of the Elementary and Secondary Education Act (ESEA).<br />
2. Indicator 02 (Drop out) is reported a year in arrear. This means the rate is a measure of students who dropped out in<br />
the 2009/10 school year. The Indicator 02 data are aligned with the Common Core of Data (CCD) requirements for<br />
grades 7-12.<br />
3. Indicator 04A and 4B (Suspension/Expulsion) is reported a year in arrear. This means the rate is a measure of<br />
students who had out-of-school suspensions and/or expulsions totaling more than 10 days.<br />
Percent of youth<br />
with IEPs<br />
graduating from<br />
high school with a<br />
regular diploma<br />
For a complete description of all the Indicators, please visit the special education website at<br />
http://arksped.k12.ar.us/sections/policy.html<br />
Indicator 01: Graduation Rates (2009/10 school year) Indicator 02: Dropout Rates (2009/10 school year)<br />
State<br />
Rate<br />
State<br />
Target<br />
75.76% 85.00%<br />
LEA<br />
Rate<br />
50.00%<br />
Target Met<br />
by LEA<br />
(Y/N)<br />
N<br />
Percent of<br />
youth with<br />
IEPs dropping<br />
out of high<br />
school<br />
State<br />
Rate<br />
Indicator 03: Assessment on Statewide Benchmark Exam (grades 3-8, 11)<br />
A) Adequate Yearly Progress<br />
n=40<br />
Literacy<br />
Mathematics<br />
Met Disability Subgroup "n"<br />
for Reporting Purposes (Y/N)<br />
State Target for % of Districts Meeting<br />
AYP for Disability Subgroup<br />
State<br />
Target<br />
3.06% 4.20%<br />
LEA<br />
Rate<br />
6.25%<br />
% of Districts Meeting AYP<br />
for Disability Subgroup<br />
Target Met by<br />
LEA (Y/N)<br />
N<br />
Target Met by<br />
LEA(Y/N)<br />
Overall N 17.15% 6.25%<br />
NA<br />
N<br />
N<br />
Note: For a district to qualify as having a disability subgroup it must have a minimum of 40 (n=40) students with disabilities in a school building.<br />
B) Participation<br />
Participation Rate: # of<br />
CWD Tested ÷ # of CWD<br />
Enrolled in grades tested.<br />
Participation Rate: Literacy<br />
Participation Rate: Math<br />
Note: - - denotes not applicable<br />
State<br />
Rate<br />
98.78%<br />
State<br />
Target<br />
95.00%<br />
LEA<br />
Rate<br />
100.00%<br />
Target Met<br />
by LEA (Y/N)<br />
98.61% 95.00% 97.56% Y<br />
Y<br />
C) Performance Proficiency<br />
Percent of CWD Scoring<br />
Proficient or Above<br />
Proficiency Rate: Literacy<br />
Proficiency Rate:<br />
Mathematics<br />
16.00%<br />
16.00%<br />
State<br />
Rate<br />
31.49%<br />
44.86%<br />
State<br />
Target<br />
45.22%<br />
51.14%<br />
LEA<br />
Rate<br />
17.14%<br />
44.44%<br />
NA<br />
NA<br />
Target<br />
Met by<br />
LEA (Y/N)<br />
N<br />
N<br />
Page 1 of 5
LEA: 4202 - MAGAZINE SCHOOL <strong>DISTRICT</strong><br />
Indicator 04: Out-of-School Suspensions and Expulsions (2009/10 school year)<br />
A) Suspension/Expulsion<br />
Percent difference of CWD with out-of- school suspensions and<br />
expulsions totaling greater than 10 days in a school year as<br />
compared to the same data for general education students in<br />
the district.<br />
B) Suspension/Expulsion by Race and Ethnicity<br />
Percent of districts that have: (a) a significant discrepancy, by race or<br />
ethnicity, in the rate of suspensions and expulsions of greater than 10<br />
days in a school year for children with IEPs; and (b) policies,<br />
procedures or practices that contribute to the significant discrepancy<br />
and do not comply with requirements relating to the development<br />
and implementation of IEPs, the use of positive behavioral<br />
interventions and supports, and procedural safeguards.<br />
Indicator 05: School Age (5-21) Least Restrictive Environment<br />
A) In the Regular Class 80% or more of the day<br />
Percent of CWD with<br />
IEPs receiving instruction<br />
in the regular class 80%<br />
or more of the day.<br />
State<br />
Rate<br />
State<br />
Target<br />
LEA<br />
Rate<br />
B) In the Regular Class less than 40% of the day<br />
Percent of CWD with<br />
IEPs receiving instruction<br />
in the regular class less<br />
than 60% of the day.<br />
53.87% 59.77%<br />
State<br />
Rate<br />
State<br />
Target<br />
12.42% 12.51%<br />
61.40%<br />
LEA<br />
Rate<br />
5.26%<br />
C) Other Settings outside the regular class<br />
Percent of CWD with IEPs served in<br />
public or private separate schools,<br />
residential placements, or<br />
homebound/hospital placements.<br />
State<br />
Rate<br />
State<br />
Target<br />
2.80% 2.56%<br />
Target Met<br />
by LEA (Y/N)<br />
Y<br />
Target Met<br />
by LEA (Y/N)<br />
Y<br />
LEA<br />
Rate<br />
0.00%<br />
Target Met<br />
by LEA(Y/N)<br />
Indicator 06: Early Childhood (3-5) Least Restrictive Environment<br />
A) Regular Early Childhood Program<br />
Percent of children (aged 3 through 5) with IEPs attending a regular<br />
early childhood program and receiving the majority of special<br />
education and related services in the regular early childhood program<br />
Allowable<br />
Difference<br />
LEA: 4202 - MAGAZINE SCHOOL <strong>DISTRICT</strong><br />
Indicator 07: Preschool (3-5) Outcomes<br />
a) Percent of preschool CWD<br />
children who did not<br />
improve functioning.<br />
b) Percent of preschool CWD<br />
who improved but whose<br />
functioning remained below<br />
same age peers.<br />
c) Percent of preschool CWD<br />
who improved at a level<br />
nearer to same aged peers.<br />
d) Percent of preschool CWD<br />
who improved functioning to<br />
reach a level comparable to<br />
same age peers.<br />
e) Percent of preschool CWD<br />
children who maintain<br />
functioning at a level<br />
comparable to same aged<br />
peers.<br />
Summary<br />
Statements<br />
1) Of those preschool<br />
children who entered<br />
the preschool program<br />
below age expectations<br />
in each Outcome, the<br />
percent who<br />
substantially increased<br />
their rate of growth by<br />
the time they turned 6<br />
years of age or exited<br />
the program.<br />
2) The percent of<br />
preschool children who<br />
were functioning<br />
within age expectations<br />
in each Outcome by the<br />
time they turned 6<br />
years of age or exited<br />
A) Positive Social -Emotional<br />
Skills*<br />
State<br />
Rate<br />
A) Positive Social -<br />
Emotional Skills<br />
(Including social<br />
relationships)<br />
State<br />
Rate<br />
2.14%<br />
5.31%<br />
25.97%<br />
38.22%<br />
28.36%<br />
State<br />
Target<br />
LEA<br />
Rate<br />
LEA<br />
Rate<br />
— —<br />
— —<br />
— —<br />
— —<br />
— —<br />
Target<br />
Met by<br />
LEA(Y/N)<br />
B) Acquisition and Use of<br />
Knowledge and Skills<br />
(Including early language/<br />
communication and early literacy)<br />
B) Acquisition and Use of<br />
Knowledge and Skills **<br />
State<br />
Rate<br />
1.75%<br />
6.59%<br />
34.23%<br />
43.51%<br />
13.92%<br />
State<br />
Target<br />
LEA<br />
Rate<br />
Target<br />
Met by<br />
LEA(Y/N)<br />
C) Use of Appropriate Behaviors<br />
to Meet Their Needs<br />
State<br />
Rate<br />
State<br />
Target<br />
LEA<br />
Rate<br />
Target<br />
Met by<br />
LEA(Y/N)<br />
89.61% 90.50% — — N/A 90.31% 90.50% — — N/A 90.82% 92.50% — — N/A<br />
66.58% 69.50% — — N/A 57.43% 60.50% — — N/A 76.69% 78.50% — — N/A<br />
NOTE: * Including social relationships ** Including early language/ communication and early literacy<br />
Note: - - denotes not applicable<br />
State<br />
Rate<br />
LEA<br />
Rate<br />
— —<br />
— —<br />
— —<br />
— —<br />
— —<br />
C) Use of<br />
Appropriate<br />
Behaviors to<br />
Meet Their Needs<br />
State<br />
Rate<br />
4.51%<br />
17.34%<br />
41.72%<br />
34.97%<br />
LEA<br />
Rate<br />
1.46% — —<br />
— —<br />
— —<br />
— —<br />
— —<br />
Page 3 of 5
LEA: 4202 - MAGAZINE SCHOOL <strong>DISTRICT</strong><br />
Indicator 08: Parent Involvement<br />
Percent of surveyed<br />
parents who reported<br />
school facilitated parent<br />
involvement as a means<br />
of improving services<br />
and results for children<br />
with disabilities.<br />
Early Childhood<br />
(3-5)<br />
School Age<br />
(5-21)<br />
State<br />
Rate<br />
90.47%<br />
95.05%<br />
Indicator 09: Disproportionality - Eligibility<br />
Disproportionate representation of racial<br />
and ethnic groups in special education and<br />
related services that is a result of<br />
inappropriate identification (e.g.<br />
monitoring data, review of policies,<br />
practices, and procedures under 618(d),<br />
etc.).<br />
State<br />
Rate<br />
State<br />
Target<br />
88.00%<br />
96.00%<br />
State<br />
Target<br />
0.00% 0.00%<br />
LEA<br />
Rate<br />
— —<br />
95.31%<br />
Indicator 10: Disproportionality-Child with a Disability<br />
Disproportionate representation of racial<br />
and ethnic groups in specific disability<br />
categories that is a result of inappropriate<br />
identification (e.g. monitoring data, review<br />
of policies, practices, and procedures under<br />
618(d), etc.).<br />
Indicator 11: Child Find<br />
Percent of children with<br />
parental consent to evaluate<br />
who are evaluated within<br />
the State established timeline<br />
of 60 days.<br />
Overall<br />
(3-21)<br />
Early Childhood<br />
(3-5)<br />
School Age<br />
(5-21)<br />
State<br />
Rate<br />
0.00%<br />
Indicator 12: Early Childhood Transition<br />
Percent of children referred by Part C prior to<br />
age 3, who are found eligible for Part B, and<br />
who have an IEP developed and implemented<br />
by their third birthday.<br />
Note: - - denotes not applicable<br />
State<br />
Rate<br />
99.41%<br />
99.70%<br />
98.97%<br />
State<br />
Rate<br />
State<br />
Target<br />
0.00%<br />
State<br />
Target<br />
100.00%<br />
100.00%<br />
100.00%<br />
State<br />
Target<br />
Target Met by<br />
LEA (Y/N)<br />
Y<br />
Target Met by<br />
LEA (Y/N)<br />
Y<br />
LEA<br />
Rate<br />
100.00%<br />
— —<br />
100.00%<br />
LEA<br />
Rate<br />
Target Met by<br />
LEA (Y/N)<br />
N/A<br />
N<br />
Note: The target for Indicator 09 is to have zero percent<br />
(0%) of districts identified as having disproportionate<br />
representation as a result of inappropriate<br />
identification in eligibility.<br />
Note: The target for Indicator 10 is to have zero<br />
percent (0%) of districts identified as having<br />
disproportionate representation as a result of<br />
inappropriate identification in a disability<br />
category.<br />
Target Met by<br />
LEA (Y/N)<br />
N/A<br />
Y<br />
Target Met<br />
by LEA<br />
(Y/N)<br />
99.21% 100.00% - - N/A<br />
Y<br />
Note: * Indicates a zero reponse rate for the<br />
district.<br />
Page 4 of 5
LEA: 4202 - MAGAZINE SCHOOL <strong>DISTRICT</strong><br />
Indicator 13: Secondary Transition<br />
Percent of youth with disabilities aged 16 and<br />
up with an IEP that includes coordinated,<br />
measurable, annual IEP goals and transition<br />
services that will reasonably enable the student<br />
to meet the post-secondary goals.<br />
Indicator 14: Post-School Outcomes<br />
A. Percent of youth enrolled in higher<br />
education within one year of leaving high<br />
school.<br />
State<br />
Rate<br />
State<br />
Target<br />
Note: Data for this Indicator is from the on-site monitoring of LEAs for the given year.<br />
B. Percent of youth enrolled in higher<br />
education or competitively employed<br />
within one year of leaving high school.<br />
C. Percent of youth enrolled in higher<br />
education or in some other postsecondary<br />
education or training program; or<br />
competitively employed or in some other<br />
employment within one year of leaving<br />
high school.<br />
State<br />
Rate<br />
Indicator 20: Reported Data-Timely and Accurate*<br />
District submitted<br />
required data elements<br />
on or before due dates;<br />
made revisions within<br />
the alloted reveiw<br />
periods.<br />
Accurate and Timely<br />
Data Submission<br />
Overall (3-21)<br />
Early Childhood (3-5)<br />
School Age (5-21)<br />
State<br />
Target<br />
100.00%<br />
100.00%<br />
100.00%<br />
State<br />
Target<br />
LEA<br />
Rate<br />
LEA<br />
Rate<br />
Target Met by<br />
LEA (Y/N)<br />
Target Met<br />
by LEA<br />
(Y/N)<br />
Target Met<br />
by LEA<br />
(Y/N)<br />
*Data reviewed for timely and accurate submissions included all APSCN cycle data except for personnel<br />
Note: - - denotes not applicable<br />
96.19 100.00 — — N/A<br />
14.53<br />
State<br />
Rate<br />
49.42<br />
State<br />
Rate<br />
54.07<br />
13.00<br />
State<br />
Target<br />
49.00<br />
State<br />
Target<br />
60.00<br />
Y<br />
N/A<br />
Y<br />
— —<br />
LEA<br />
Rate<br />
— —<br />
LEA<br />
Rate<br />
— —<br />
N/A<br />
Target Met<br />
by LEA<br />
(Y/N)<br />
N/A<br />
Target Met<br />
by LEA<br />
(Y/N)<br />
N/A<br />
Page 5 of 5
LEA: 4203 - PARIS SCHOOL <strong>DISTRICT</strong><br />
<strong>ARKANSAS</strong> <strong>SPECIAL</strong> <strong>EDUCATION</strong><br />
<strong>DISTRICT</strong> <strong>ANNUAL</strong> PERFORMANCE REPORT<br />
2010/11 School Year<br />
Publication Date: March 2012<br />
Each State must have in place a State Performance Plan (SPP) to evaluate the State's efforts to meet the requirements and<br />
purposes of the implementation of the Individuals with Disabilities Education Act (IDEA). The SPP is a six-year plan, which<br />
describes Arkansas's performance on 20 indicators. The Office of Special Education Programs in the U. S. Department of<br />
Education requires that States report annually to the public on the performance of each local education agency (LEA) on 14 of<br />
20 indicators as compared with targets established by the State in the SPP. Arkansas will report indicators 1 through 14 and<br />
20 for each LEA serving children with disabilities (CWD). Any LEA not meeting targets on compliance indicators (0% for<br />
Indicators 4B, 09 & 10 and 100% for Indicators 11, 12, 13, and 20) are non-compliant with IDEA.<br />
There are no report changes for the 2010/11 school year profile; However, it is important to recognize that: .<br />
1. Indicator 01 (Graduation) is reported a year in arrear (2009/10 graduates) and is based on a four-year cohort. This<br />
means the rate is a measure of students who entered in ninth grade and graduate in four years. The calculation is a<br />
requirement under Title I of the Elementary and Secondary Education Act (ESEA).<br />
2. Indicator 02 (Drop out) is reported a year in arrear. This means the rate is a measure of students who dropped out in<br />
the 2009/10 school year. The Indicator 02 data are aligned with the Common Core of Data (CCD) requirements for<br />
grades 7-12.<br />
3. Indicator 04A and 4B (Suspension/Expulsion) is reported a year in arrear. This means the rate is a measure of<br />
students who had out-of-school suspensions and/or expulsions totaling more than 10 days.<br />
Percent of youth<br />
with IEPs<br />
graduating from<br />
high school with a<br />
regular diploma<br />
For a complete description of all the Indicators, please visit the special education website at<br />
http://arksped.k12.ar.us/sections/policy.html<br />
Indicator 01: Graduation Rates (2009/10 school year) Indicator 02: Dropout Rates (2009/10 school year)<br />
State<br />
Rate<br />
State<br />
Target<br />
75.76% 85.00%<br />
LEA<br />
Rate<br />
60.00%<br />
Target Met<br />
by LEA<br />
(Y/N)<br />
N<br />
Percent of<br />
youth with<br />
IEPs dropping<br />
out of high<br />
school<br />
State<br />
Rate<br />
Indicator 03: Assessment on Statewide Benchmark Exam (grades 3-8, 11)<br />
A) Adequate Yearly Progress<br />
n=40<br />
Literacy<br />
Mathematics<br />
Met Disability Subgroup "n"<br />
for Reporting Purposes (Y/N)<br />
State Target for % of Districts Meeting<br />
AYP for Disability Subgroup<br />
State<br />
Target<br />
3.06% 4.20%<br />
LEA<br />
Rate<br />
4.76%<br />
% of Districts Meeting AYP<br />
for Disability Subgroup<br />
Target Met by<br />
LEA (Y/N)<br />
N<br />
Target Met by<br />
LEA(Y/N)<br />
Overall N 17.15% 6.25%<br />
NA<br />
N<br />
N<br />
Note: For a district to qualify as having a disability subgroup it must have a minimum of 40 (n=40) students with disabilities in a school building.<br />
B) Participation<br />
Participation Rate: # of<br />
CWD Tested ÷ # of CWD<br />
Enrolled in grades tested.<br />
Participation Rate: Literacy<br />
Participation Rate: Math<br />
Note: - - denotes not applicable<br />
State<br />
Rate<br />
98.78%<br />
State<br />
Target<br />
95.00%<br />
LEA<br />
Rate<br />
100.00%<br />
Target Met<br />
by LEA (Y/N)<br />
98.61% 95.00% 98.67% Y<br />
Y<br />
C) Performance Proficiency<br />
Percent of CWD Scoring<br />
Proficient or Above<br />
Proficiency Rate: Literacy<br />
Proficiency Rate:<br />
Mathematics<br />
16.00%<br />
16.00%<br />
State<br />
Rate<br />
31.49%<br />
44.86%<br />
State<br />
Target<br />
45.22%<br />
51.14%<br />
LEA<br />
Rate<br />
30.65%<br />
51.47%<br />
NA<br />
NA<br />
Target<br />
Met by<br />
LEA (Y/N)<br />
N<br />
Y<br />
Page 1 of 5
LEA: 4203 - PARIS SCHOOL <strong>DISTRICT</strong><br />
Indicator 04: Out-of-School Suspensions and Expulsions (2009/10 school year)<br />
A) Suspension/Expulsion<br />
Percent difference of CWD with out-of- school suspensions and<br />
expulsions totaling greater than 10 days in a school year as<br />
compared to the same data for general education students in<br />
the district.<br />
B) Suspension/Expulsion by Race and Ethnicity<br />
Percent of districts that have: (a) a significant discrepancy, by race or<br />
ethnicity, in the rate of suspensions and expulsions of greater than 10<br />
days in a school year for children with IEPs; and (b) policies,<br />
procedures or practices that contribute to the significant discrepancy<br />
and do not comply with requirements relating to the development<br />
and implementation of IEPs, the use of positive behavioral<br />
interventions and supports, and procedural safeguards.<br />
Indicator 05: School Age (5-21) Least Restrictive Environment<br />
A) In the Regular Class 80% or more of the day<br />
Percent of CWD with<br />
IEPs receiving instruction<br />
in the regular class 80%<br />
or more of the day.<br />
State<br />
Rate<br />
State<br />
Target<br />
LEA<br />
Rate<br />
B) In the Regular Class less than 40% of the day<br />
Percent of CWD with<br />
IEPs receiving instruction<br />
in the regular class less<br />
than 60% of the day.<br />
53.87% 59.77%<br />
State<br />
Rate<br />
State<br />
Target<br />
12.42% 12.51%<br />
77.39%<br />
LEA<br />
Rate<br />
3.48%<br />
C) Other Settings outside the regular class<br />
Percent of CWD with IEPs served in<br />
public or private separate schools,<br />
residential placements, or<br />
homebound/hospital placements.<br />
State<br />
Rate<br />
State<br />
Target<br />
2.80% 2.56%<br />
Target Met<br />
by LEA (Y/N)<br />
Y<br />
Target Met<br />
by LEA (Y/N)<br />
Y<br />
LEA<br />
Rate<br />
0.87%<br />
Target Met<br />
by LEA(Y/N)<br />
Indicator 06: Early Childhood (3-5) Least Restrictive Environment<br />
A) Regular Early Childhood Program<br />
Percent of children (aged 3 through 5) with IEPs attending a regular<br />
early childhood program and receiving the majority of special<br />
education and related services in the regular early childhood program<br />
Allowable<br />
Difference<br />
LEA: 4203 - PARIS SCHOOL <strong>DISTRICT</strong><br />
Indicator 07: Preschool (3-5) Outcomes<br />
a) Percent of preschool CWD<br />
children who did not<br />
improve functioning.<br />
b) Percent of preschool CWD<br />
who improved but whose<br />
functioning remained below<br />
same age peers.<br />
c) Percent of preschool CWD<br />
who improved at a level<br />
nearer to same aged peers.<br />
d) Percent of preschool CWD<br />
who improved functioning to<br />
reach a level comparable to<br />
same age peers.<br />
e) Percent of preschool CWD<br />
children who maintain<br />
functioning at a level<br />
comparable to same aged<br />
peers.<br />
Summary<br />
Statements<br />
1) Of those preschool<br />
children who entered<br />
the preschool program<br />
below age expectations<br />
in each Outcome, the<br />
percent who<br />
substantially increased<br />
their rate of growth by<br />
the time they turned 6<br />
years of age or exited<br />
the program.<br />
2) The percent of<br />
preschool children who<br />
were functioning<br />
within age expectations<br />
in each Outcome by the<br />
time they turned 6<br />
years of age or exited<br />
A) Positive Social -Emotional<br />
Skills*<br />
State<br />
Rate<br />
A) Positive Social -<br />
Emotional Skills<br />
(Including social<br />
relationships)<br />
State<br />
Rate<br />
2.14%<br />
5.31%<br />
25.97%<br />
38.22%<br />
28.36%<br />
State<br />
Target<br />
LEA<br />
Rate<br />
LEA<br />
Rate<br />
— —<br />
— —<br />
— —<br />
— —<br />
— —<br />
Target<br />
Met by<br />
LEA(Y/N)<br />
B) Acquisition and Use of<br />
Knowledge and Skills<br />
(Including early language/<br />
communication and early literacy)<br />
B) Acquisition and Use of<br />
Knowledge and Skills **<br />
State<br />
Rate<br />
1.75%<br />
6.59%<br />
34.23%<br />
43.51%<br />
13.92%<br />
State<br />
Target<br />
LEA<br />
Rate<br />
Target<br />
Met by<br />
LEA(Y/N)<br />
C) Use of Appropriate Behaviors<br />
to Meet Their Needs<br />
State<br />
Rate<br />
State<br />
Target<br />
LEA<br />
Rate<br />
Target<br />
Met by<br />
LEA(Y/N)<br />
89.61% 90.50% — — N/A 90.31% 90.50% — — N/A 90.82% 92.50% — — N/A<br />
66.58% 69.50% — — N/A 57.43% 60.50% — — N/A 76.69% 78.50% — — N/A<br />
NOTE: * Including social relationships ** Including early language/ communication and early literacy<br />
Note: - - denotes not applicable<br />
State<br />
Rate<br />
LEA<br />
Rate<br />
— —<br />
— —<br />
— —<br />
— —<br />
— —<br />
C) Use of<br />
Appropriate<br />
Behaviors to<br />
Meet Their Needs<br />
State<br />
Rate<br />
4.51%<br />
17.34%<br />
41.72%<br />
34.97%<br />
LEA<br />
Rate<br />
1.46% — —<br />
— —<br />
— —<br />
— —<br />
— —<br />
Page 3 of 5
LEA: 4203 - PARIS SCHOOL <strong>DISTRICT</strong><br />
Indicator 08: Parent Involvement<br />
Percent of surveyed<br />
parents who reported<br />
school facilitated parent<br />
involvement as a means<br />
of improving services<br />
and results for children<br />
with disabilities.<br />
Early Childhood<br />
(3-5)<br />
School Age<br />
(5-21)<br />
State<br />
Rate<br />
90.47%<br />
95.05%<br />
Indicator 09: Disproportionality - Eligibility<br />
Disproportionate representation of racial<br />
and ethnic groups in special education and<br />
related services that is a result of<br />
inappropriate identification (e.g.<br />
monitoring data, review of policies,<br />
practices, and procedures under 618(d),<br />
etc.).<br />
State<br />
Rate<br />
State<br />
Target<br />
88.00%<br />
96.00%<br />
State<br />
Target<br />
0.00% 0.00%<br />
LEA<br />
Rate<br />
— —<br />
— —<br />
Indicator 10: Disproportionality-Child with a Disability<br />
Disproportionate representation of racial<br />
and ethnic groups in specific disability<br />
categories that is a result of inappropriate<br />
identification (e.g. monitoring data, review<br />
of policies, practices, and procedures under<br />
618(d), etc.).<br />
Indicator 11: Child Find<br />
Percent of children with<br />
parental consent to evaluate<br />
who are evaluated within<br />
the State established timeline<br />
of 60 days.<br />
Overall<br />
(3-21)<br />
Early Childhood<br />
(3-5)<br />
School Age<br />
(5-21)<br />
State<br />
Rate<br />
0.00%<br />
Indicator 12: Early Childhood Transition<br />
Percent of children referred by Part C prior to<br />
age 3, who are found eligible for Part B, and<br />
who have an IEP developed and implemented<br />
by their third birthday.<br />
Note: - - denotes not applicable<br />
State<br />
Rate<br />
99.41%<br />
99.70%<br />
98.97%<br />
State<br />
Rate<br />
State<br />
Target<br />
0.00%<br />
State<br />
Target<br />
100.00%<br />
100.00%<br />
100.00%<br />
State<br />
Target<br />
Target Met by<br />
LEA (Y/N)<br />
Y<br />
Target Met by<br />
LEA (Y/N)<br />
Y<br />
LEA<br />
Rate<br />
100.00%<br />
— —<br />
100.00%<br />
LEA<br />
Rate<br />
Target Met by<br />
LEA (Y/N)<br />
N/A<br />
N<br />
Note: The target for Indicator 09 is to have zero percent<br />
(0%) of districts identified as having disproportionate<br />
representation as a result of inappropriate<br />
identification in eligibility.<br />
Note: The target for Indicator 10 is to have zero<br />
percent (0%) of districts identified as having<br />
disproportionate representation as a result of<br />
inappropriate identification in a disability<br />
category.<br />
Target Met by<br />
LEA (Y/N)<br />
N/A<br />
Y<br />
Target Met<br />
by LEA<br />
(Y/N)<br />
99.21% 100.00% - - N/A<br />
Y<br />
Note: * Indicates a zero reponse rate for the<br />
district.<br />
Page 4 of 5
LEA: 4203 - PARIS SCHOOL <strong>DISTRICT</strong><br />
Indicator 13: Secondary Transition<br />
Percent of youth with disabilities aged 16 and<br />
up with an IEP that includes coordinated,<br />
measurable, annual IEP goals and transition<br />
services that will reasonably enable the student<br />
to meet the post-secondary goals.<br />
Indicator 14: Post-School Outcomes<br />
A. Percent of youth enrolled in higher<br />
education within one year of leaving high<br />
school.<br />
State<br />
Rate<br />
State<br />
Target<br />
Note: Data for this Indicator is from the on-site monitoring of LEAs for the given year.<br />
B. Percent of youth enrolled in higher<br />
education or competitively employed<br />
within one year of leaving high school.<br />
C. Percent of youth enrolled in higher<br />
education or in some other postsecondary<br />
education or training program; or<br />
competitively employed or in some other<br />
employment within one year of leaving<br />
high school.<br />
State<br />
Rate<br />
Indicator 20: Reported Data-Timely and Accurate*<br />
District submitted<br />
required data elements<br />
on or before due dates;<br />
made revisions within<br />
the alloted reveiw<br />
periods.<br />
Accurate and Timely<br />
Data Submission<br />
Overall (3-21)<br />
Early Childhood (3-5)<br />
School Age (5-21)<br />
State<br />
Target<br />
100.00%<br />
100.00%<br />
100.00%<br />
State<br />
Target<br />
LEA<br />
Rate<br />
LEA<br />
Rate<br />
Target Met by<br />
LEA (Y/N)<br />
Target Met<br />
by LEA<br />
(Y/N)<br />
Target Met<br />
by LEA<br />
(Y/N)<br />
*Data reviewed for timely and accurate submissions included all APSCN cycle data except for personnel<br />
Note: - - denotes not applicable<br />
96.19 100.00 — — N/A<br />
14.53<br />
State<br />
Rate<br />
49.42<br />
State<br />
Rate<br />
54.07<br />
13.00<br />
State<br />
Target<br />
49.00<br />
State<br />
Target<br />
60.00<br />
Y<br />
N/A<br />
Y<br />
— —<br />
LEA<br />
Rate<br />
— —<br />
LEA<br />
Rate<br />
— —<br />
N/A<br />
Target Met<br />
by LEA<br />
(Y/N)<br />
N/A<br />
Target Met<br />
by LEA<br />
(Y/N)<br />
N/A<br />
Page 5 of 5
LEA: 4204 - SCRANTON SCHOOL <strong>DISTRICT</strong><br />
<strong>ARKANSAS</strong> <strong>SPECIAL</strong> <strong>EDUCATION</strong><br />
<strong>DISTRICT</strong> <strong>ANNUAL</strong> PERFORMANCE REPORT<br />
2010/11 School Year<br />
Publication Date: March 2012<br />
Each State must have in place a State Performance Plan (SPP) to evaluate the State's efforts to meet the requirements and<br />
purposes of the implementation of the Individuals with Disabilities Education Act (IDEA). The SPP is a six-year plan, which<br />
describes Arkansas's performance on 20 indicators. The Office of Special Education Programs in the U. S. Department of<br />
Education requires that States report annually to the public on the performance of each local education agency (LEA) on 14 of<br />
20 indicators as compared with targets established by the State in the SPP. Arkansas will report indicators 1 through 14 and<br />
20 for each LEA serving children with disabilities (CWD). Any LEA not meeting targets on compliance indicators (0% for<br />
Indicators 4B, 09 & 10 and 100% for Indicators 11, 12, 13, and 20) are non-compliant with IDEA.<br />
There are no report changes for the 2010/11 school year profile; However, it is important to recognize that: .<br />
1. Indicator 01 (Graduation) is reported a year in arrear (2009/10 graduates) and is based on a four-year cohort. This<br />
means the rate is a measure of students who entered in ninth grade and graduate in four years. The calculation is a<br />
requirement under Title I of the Elementary and Secondary Education Act (ESEA).<br />
2. Indicator 02 (Drop out) is reported a year in arrear. This means the rate is a measure of students who dropped out in<br />
the 2009/10 school year. The Indicator 02 data are aligned with the Common Core of Data (CCD) requirements for<br />
grades 7-12.<br />
3. Indicator 04A and 4B (Suspension/Expulsion) is reported a year in arrear. This means the rate is a measure of<br />
students who had out-of-school suspensions and/or expulsions totaling more than 10 days.<br />
Percent of youth<br />
with IEPs<br />
graduating from<br />
high school with a<br />
regular diploma<br />
For a complete description of all the Indicators, please visit the special education website at<br />
http://arksped.k12.ar.us/sections/policy.html<br />
Indicator 01: Graduation Rates (2009/10 school year) Indicator 02: Dropout Rates (2009/10 school year)<br />
State<br />
Rate<br />
State<br />
Target<br />
75.76% 85.00%<br />
LEA<br />
Rate<br />
100.00%<br />
Target Met<br />
by LEA<br />
(Y/N)<br />
Y<br />
Percent of<br />
youth with<br />
IEPs dropping<br />
out of high<br />
school<br />
State<br />
Rate<br />
Indicator 03: Assessment on Statewide Benchmark Exam (grades 3-8, 11)<br />
A) Adequate Yearly Progress<br />
n=40<br />
Literacy<br />
Mathematics<br />
Met Disability Subgroup "n"<br />
for Reporting Purposes (Y/N)<br />
State Target for % of Districts Meeting<br />
AYP for Disability Subgroup<br />
State<br />
Target<br />
3.06% 4.20%<br />
LEA<br />
Rate<br />
0.00%<br />
% of Districts Meeting AYP<br />
for Disability Subgroup<br />
Target Met by<br />
LEA (Y/N)<br />
Y<br />
Target Met by<br />
LEA(Y/N)<br />
Overall N 17.15% 6.25%<br />
NA<br />
N<br />
N<br />
Note: For a district to qualify as having a disability subgroup it must have a minimum of 40 (n=40) students with disabilities in a school building.<br />
B) Participation<br />
Participation Rate: # of<br />
CWD Tested ÷ # of CWD<br />
Enrolled in grades tested.<br />
Participation Rate: Literacy<br />
Participation Rate: Math<br />
Note: - - denotes not applicable<br />
State<br />
Rate<br />
98.78%<br />
State<br />
Target<br />
95.00%<br />
LEA<br />
Rate<br />
100.00%<br />
Target Met<br />
by LEA (Y/N)<br />
98.61% 95.00% 100.00% Y<br />
Y<br />
C) Performance Proficiency<br />
Percent of CWD Scoring<br />
Proficient or Above<br />
Proficiency Rate: Literacy<br />
Proficiency Rate:<br />
Mathematics<br />
16.00%<br />
16.00%<br />
State<br />
Rate<br />
31.49%<br />
44.86%<br />
State<br />
Target<br />
45.22%<br />
51.14%<br />
LEA<br />
Rate<br />
21.05%<br />
36.84%<br />
NA<br />
NA<br />
Target<br />
Met by<br />
LEA (Y/N)<br />
N<br />
N<br />
Page 1 of 5
LEA: 4204 - SCRANTON SCHOOL <strong>DISTRICT</strong><br />
Indicator 04: Out-of-School Suspensions and Expulsions (2009/10 school year)<br />
A) Suspension/Expulsion<br />
Percent difference of CWD with out-of- school suspensions and<br />
expulsions totaling greater than 10 days in a school year as<br />
compared to the same data for general education students in<br />
the district.<br />
B) Suspension/Expulsion by Race and Ethnicity<br />
Percent of districts that have: (a) a significant discrepancy, by race or<br />
ethnicity, in the rate of suspensions and expulsions of greater than 10<br />
days in a school year for children with IEPs; and (b) policies,<br />
procedures or practices that contribute to the significant discrepancy<br />
and do not comply with requirements relating to the development<br />
and implementation of IEPs, the use of positive behavioral<br />
interventions and supports, and procedural safeguards.<br />
Indicator 05: School Age (5-21) Least Restrictive Environment<br />
A) In the Regular Class 80% or more of the day<br />
Percent of CWD with<br />
IEPs receiving instruction<br />
in the regular class 80%<br />
or more of the day.<br />
State<br />
Rate<br />
State<br />
Target<br />
LEA<br />
Rate<br />
B) In the Regular Class less than 40% of the day<br />
Percent of CWD with<br />
IEPs receiving instruction<br />
in the regular class less<br />
than 60% of the day.<br />
53.87% 59.77%<br />
State<br />
Rate<br />
State<br />
Target<br />
12.42% 12.51%<br />
75.56%<br />
LEA<br />
Rate<br />
2.22%<br />
C) Other Settings outside the regular class<br />
Percent of CWD with IEPs served in<br />
public or private separate schools,<br />
residential placements, or<br />
homebound/hospital placements.<br />
State<br />
Rate<br />
State<br />
Target<br />
2.80% 2.56%<br />
Target Met<br />
by LEA (Y/N)<br />
Y<br />
Target Met<br />
by LEA (Y/N)<br />
Y<br />
LEA<br />
Rate<br />
0.00%<br />
Target Met<br />
by LEA(Y/N)<br />
Indicator 06: Early Childhood (3-5) Least Restrictive Environment<br />
A) Regular Early Childhood Program<br />
Percent of children (aged 3 through 5) with IEPs attending a regular<br />
early childhood program and receiving the majority of special<br />
education and related services in the regular early childhood program<br />
Allowable<br />
Difference<br />
LEA: 4204 - SCRANTON SCHOOL <strong>DISTRICT</strong><br />
Indicator 07: Preschool (3-5) Outcomes<br />
a) Percent of preschool CWD<br />
children who did not<br />
improve functioning.<br />
b) Percent of preschool CWD<br />
who improved but whose<br />
functioning remained below<br />
same age peers.<br />
c) Percent of preschool CWD<br />
who improved at a level<br />
nearer to same aged peers.<br />
d) Percent of preschool CWD<br />
who improved functioning to<br />
reach a level comparable to<br />
same age peers.<br />
e) Percent of preschool CWD<br />
children who maintain<br />
functioning at a level<br />
comparable to same aged<br />
peers.<br />
Summary<br />
Statements<br />
1) Of those preschool<br />
children who entered<br />
the preschool program<br />
below age expectations<br />
in each Outcome, the<br />
percent who<br />
substantially increased<br />
their rate of growth by<br />
the time they turned 6<br />
years of age or exited<br />
the program.<br />
2) The percent of<br />
preschool children who<br />
were functioning<br />
within age expectations<br />
in each Outcome by the<br />
time they turned 6<br />
years of age or exited<br />
A) Positive Social -Emotional<br />
Skills*<br />
State<br />
Rate<br />
A) Positive Social -<br />
Emotional Skills<br />
(Including social<br />
relationships)<br />
State<br />
Rate<br />
2.14%<br />
5.31%<br />
25.97%<br />
38.22%<br />
28.36%<br />
State<br />
Target<br />
LEA<br />
Rate<br />
LEA<br />
Rate<br />
— —<br />
— —<br />
— —<br />
— —<br />
— —<br />
Target<br />
Met by<br />
LEA(Y/N)<br />
B) Acquisition and Use of<br />
Knowledge and Skills<br />
(Including early language/<br />
communication and early literacy)<br />
B) Acquisition and Use of<br />
Knowledge and Skills **<br />
State<br />
Rate<br />
1.75%<br />
6.59%<br />
34.23%<br />
43.51%<br />
13.92%<br />
State<br />
Target<br />
LEA<br />
Rate<br />
Target<br />
Met by<br />
LEA(Y/N)<br />
C) Use of Appropriate Behaviors<br />
to Meet Their Needs<br />
State<br />
Rate<br />
State<br />
Target<br />
LEA<br />
Rate<br />
Target<br />
Met by<br />
LEA(Y/N)<br />
89.61% 90.50% — — N/A 90.31% 90.50% — — N/A 90.82% 92.50% — — N/A<br />
66.58% 69.50% — — N/A 57.43% 60.50% — — N/A 76.69% 78.50% — — N/A<br />
NOTE: * Including social relationships ** Including early language/ communication and early literacy<br />
Note: - - denotes not applicable<br />
State<br />
Rate<br />
LEA<br />
Rate<br />
— —<br />
— —<br />
— —<br />
— —<br />
— —<br />
C) Use of<br />
Appropriate<br />
Behaviors to<br />
Meet Their Needs<br />
State<br />
Rate<br />
4.51%<br />
17.34%<br />
41.72%<br />
34.97%<br />
LEA<br />
Rate<br />
1.46% — —<br />
— —<br />
— —<br />
— —<br />
— —<br />
Page 3 of 5
LEA: 4204 - SCRANTON SCHOOL <strong>DISTRICT</strong><br />
Indicator 08: Parent Involvement<br />
Percent of surveyed<br />
parents who reported<br />
school facilitated parent<br />
involvement as a means<br />
of improving services<br />
and results for children<br />
with disabilities.<br />
Early Childhood<br />
(3-5)<br />
School Age<br />
(5-21)<br />
State<br />
Rate<br />
90.47%<br />
95.05%<br />
Indicator 09: Disproportionality - Eligibility<br />
Disproportionate representation of racial<br />
and ethnic groups in special education and<br />
related services that is a result of<br />
inappropriate identification (e.g.<br />
monitoring data, review of policies,<br />
practices, and procedures under 618(d),<br />
etc.).<br />
State<br />
Rate<br />
State<br />
Target<br />
88.00%<br />
96.00%<br />
State<br />
Target<br />
0.00% 0.00%<br />
LEA<br />
Rate<br />
— —<br />
93.10%<br />
Indicator 10: Disproportionality-Child with a Disability<br />
Disproportionate representation of racial<br />
and ethnic groups in specific disability<br />
categories that is a result of inappropriate<br />
identification (e.g. monitoring data, review<br />
of policies, practices, and procedures under<br />
618(d), etc.).<br />
Indicator 11: Child Find<br />
Percent of children with<br />
parental consent to evaluate<br />
who are evaluated within<br />
the State established timeline<br />
of 60 days.<br />
Overall<br />
(3-21)<br />
Early Childhood<br />
(3-5)<br />
School Age<br />
(5-21)<br />
State<br />
Rate<br />
0.00%<br />
Indicator 12: Early Childhood Transition<br />
Percent of children referred by Part C prior to<br />
age 3, who are found eligible for Part B, and<br />
who have an IEP developed and implemented<br />
by their third birthday.<br />
Note: - - denotes not applicable<br />
State<br />
Rate<br />
99.41%<br />
99.70%<br />
98.97%<br />
State<br />
Rate<br />
State<br />
Target<br />
0.00%<br />
State<br />
Target<br />
100.00%<br />
100.00%<br />
100.00%<br />
State<br />
Target<br />
Target Met by<br />
LEA (Y/N)<br />
Y<br />
Target Met by<br />
LEA (Y/N)<br />
Y<br />
LEA<br />
Rate<br />
100.00%<br />
— —<br />
100.00%<br />
LEA<br />
Rate<br />
Target Met by<br />
LEA (Y/N)<br />
N/A<br />
N<br />
Note: The target for Indicator 09 is to have zero percent<br />
(0%) of districts identified as having disproportionate<br />
representation as a result of inappropriate<br />
identification in eligibility.<br />
Note: The target for Indicator 10 is to have zero<br />
percent (0%) of districts identified as having<br />
disproportionate representation as a result of<br />
inappropriate identification in a disability<br />
category.<br />
Target Met by<br />
LEA (Y/N)<br />
N/A<br />
Y<br />
Target Met<br />
by LEA<br />
(Y/N)<br />
99.21% 100.00% - - N/A<br />
Y<br />
Note: * Indicates a zero reponse rate for the<br />
district.<br />
Page 4 of 5
LEA: 4204 - SCRANTON SCHOOL <strong>DISTRICT</strong><br />
Indicator 13: Secondary Transition<br />
Percent of youth with disabilities aged 16 and<br />
up with an IEP that includes coordinated,<br />
measurable, annual IEP goals and transition<br />
services that will reasonably enable the student<br />
to meet the post-secondary goals.<br />
Indicator 14: Post-School Outcomes<br />
A. Percent of youth enrolled in higher<br />
education within one year of leaving high<br />
school.<br />
State<br />
Rate<br />
State<br />
Target<br />
Note: Data for this Indicator is from the on-site monitoring of LEAs for the given year.<br />
B. Percent of youth enrolled in higher<br />
education or competitively employed<br />
within one year of leaving high school.<br />
C. Percent of youth enrolled in higher<br />
education or in some other postsecondary<br />
education or training program; or<br />
competitively employed or in some other<br />
employment within one year of leaving<br />
high school.<br />
State<br />
Rate<br />
Indicator 20: Reported Data-Timely and Accurate*<br />
District submitted<br />
required data elements<br />
on or before due dates;<br />
made revisions within<br />
the alloted reveiw<br />
periods.<br />
Accurate and Timely<br />
Data Submission<br />
Overall (3-21)<br />
Early Childhood (3-5)<br />
School Age (5-21)<br />
State<br />
Target<br />
100.00%<br />
100.00%<br />
100.00%<br />
State<br />
Target<br />
LEA<br />
Rate<br />
LEA<br />
Rate<br />
Target Met by<br />
LEA (Y/N)<br />
Target Met<br />
by LEA<br />
(Y/N)<br />
Target Met<br />
by LEA<br />
(Y/N)<br />
*Data reviewed for timely and accurate submissions included all APSCN cycle data except for personnel<br />
Note: - - denotes not applicable<br />
96.19 100.00 — — N/A<br />
14.53<br />
State<br />
Rate<br />
49.42<br />
State<br />
Rate<br />
54.07<br />
13.00<br />
State<br />
Target<br />
49.00<br />
State<br />
Target<br />
60.00<br />
Y<br />
N/A<br />
Y<br />
— —<br />
LEA<br />
Rate<br />
— —<br />
LEA<br />
Rate<br />
— —<br />
N/A<br />
Target Met<br />
by LEA<br />
(Y/N)<br />
N/A<br />
Target Met<br />
by LEA<br />
(Y/N)<br />
N/A<br />
Page 5 of 5
LEA: 4301 - LONOKE SCHOOL <strong>DISTRICT</strong><br />
<strong>ARKANSAS</strong> <strong>SPECIAL</strong> <strong>EDUCATION</strong><br />
<strong>DISTRICT</strong> <strong>ANNUAL</strong> PERFORMANCE REPORT<br />
2010/11 School Year<br />
Publication Date: March 2012<br />
Each State must have in place a State Performance Plan (SPP) to evaluate the State's efforts to meet the requirements and<br />
purposes of the implementation of the Individuals with Disabilities Education Act (IDEA). The SPP is a six-year plan, which<br />
describes Arkansas's performance on 20 indicators. The Office of Special Education Programs in the U. S. Department of<br />
Education requires that States report annually to the public on the performance of each local education agency (LEA) on 14 of<br />
20 indicators as compared with targets established by the State in the SPP. Arkansas will report indicators 1 through 14 and<br />
20 for each LEA serving children with disabilities (CWD). Any LEA not meeting targets on compliance indicators (0% for<br />
Indicators 4B, 09 & 10 and 100% for Indicators 11, 12, 13, and 20) are non-compliant with IDEA.<br />
There are no report changes for the 2010/11 school year profile; However, it is important to recognize that: .<br />
1. Indicator 01 (Graduation) is reported a year in arrear (2009/10 graduates) and is based on a four-year cohort. This<br />
means the rate is a measure of students who entered in ninth grade and graduate in four years. The calculation is a<br />
requirement under Title I of the Elementary and Secondary Education Act (ESEA).<br />
2. Indicator 02 (Drop out) is reported a year in arrear. This means the rate is a measure of students who dropped out in<br />
the 2009/10 school year. The Indicator 02 data are aligned with the Common Core of Data (CCD) requirements for<br />
grades 7-12.<br />
3. Indicator 04A and 4B (Suspension/Expulsion) is reported a year in arrear. This means the rate is a measure of<br />
students who had out-of-school suspensions and/or expulsions totaling more than 10 days.<br />
Percent of youth<br />
with IEPs<br />
graduating from<br />
high school with a<br />
regular diploma<br />
For a complete description of all the Indicators, please visit the special education website at<br />
http://arksped.k12.ar.us/sections/policy.html<br />
Indicator 01: Graduation Rates (2009/10 school year) Indicator 02: Dropout Rates (2009/10 school year)<br />
State<br />
Rate<br />
State<br />
Target<br />
75.76% 85.00%<br />
LEA<br />
Rate<br />
81.25%<br />
Target Met<br />
by LEA<br />
(Y/N)<br />
N<br />
Percent of<br />
youth with<br />
IEPs dropping<br />
out of high<br />
school<br />
State<br />
Rate<br />
Indicator 03: Assessment on Statewide Benchmark Exam (grades 3-8, 11)<br />
A) Adequate Yearly Progress<br />
n=40<br />
Literacy<br />
Mathematics<br />
Met Disability Subgroup "n"<br />
for Reporting Purposes (Y/N)<br />
State Target for % of Districts Meeting<br />
AYP for Disability Subgroup<br />
State<br />
Target<br />
3.06% 4.20%<br />
LEA<br />
Rate<br />
5.77%<br />
% of Districts Meeting AYP<br />
for Disability Subgroup<br />
Target Met by<br />
LEA (Y/N)<br />
N<br />
Target Met by<br />
LEA(Y/N)<br />
Overall N 17.15% 6.25%<br />
NA<br />
N<br />
N<br />
Note: For a district to qualify as having a disability subgroup it must have a minimum of 40 (n=40) students with disabilities in a school building.<br />
B) Participation<br />
Participation Rate: # of<br />
CWD Tested ÷ # of CWD<br />
Enrolled in grades tested.<br />
Participation Rate: Literacy<br />
Participation Rate: Math<br />
Note: - - denotes not applicable<br />
State<br />
Rate<br />
98.78%<br />
State<br />
Target<br />
95.00%<br />
LEA<br />
Rate<br />
98.85%<br />
Target Met<br />
by LEA (Y/N)<br />
98.61% 95.00% 97.62% Y<br />
Y<br />
C) Performance Proficiency<br />
Percent of CWD Scoring<br />
Proficient or Above<br />
Proficiency Rate: Literacy<br />
Proficiency Rate:<br />
Mathematics<br />
16.00%<br />
16.00%<br />
State<br />
Rate<br />
31.49%<br />
44.86%<br />
State<br />
Target<br />
45.22%<br />
51.14%<br />
LEA<br />
Rate<br />
21.79%<br />
42.67%<br />
NA<br />
NA<br />
Target<br />
Met by<br />
LEA (Y/N)<br />
N<br />
N<br />
Page 1 of 5
LEA: 4301 - LONOKE SCHOOL <strong>DISTRICT</strong><br />
Indicator 04: Out-of-School Suspensions and Expulsions (2009/10 school year)<br />
A) Suspension/Expulsion<br />
Percent difference of CWD with out-of- school suspensions and<br />
expulsions totaling greater than 10 days in a school year as<br />
compared to the same data for general education students in<br />
the district.<br />
B) Suspension/Expulsion by Race and Ethnicity<br />
Percent of districts that have: (a) a significant discrepancy, by race or<br />
ethnicity, in the rate of suspensions and expulsions of greater than 10<br />
days in a school year for children with IEPs; and (b) policies,<br />
procedures or practices that contribute to the significant discrepancy<br />
and do not comply with requirements relating to the development<br />
and implementation of IEPs, the use of positive behavioral<br />
interventions and supports, and procedural safeguards.<br />
Indicator 05: School Age (5-21) Least Restrictive Environment<br />
A) In the Regular Class 80% or more of the day<br />
Percent of CWD with<br />
IEPs receiving instruction<br />
in the regular class 80%<br />
or more of the day.<br />
State<br />
Rate<br />
State<br />
Target<br />
LEA<br />
Rate<br />
B) In the Regular Class less than 40% of the day<br />
Percent of CWD with<br />
IEPs receiving instruction<br />
in the regular class less<br />
than 60% of the day.<br />
53.87% 59.77%<br />
State<br />
Rate<br />
State<br />
Target<br />
12.42% 12.51%<br />
51.05%<br />
LEA<br />
Rate<br />
11.58%<br />
C) Other Settings outside the regular class<br />
Percent of CWD with IEPs served in<br />
public or private separate schools,<br />
residential placements, or<br />
homebound/hospital placements.<br />
State<br />
Rate<br />
State<br />
Target<br />
2.80% 2.56%<br />
Target Met<br />
by LEA (Y/N)<br />
N<br />
Target Met<br />
by LEA (Y/N)<br />
Y<br />
LEA<br />
Rate<br />
2.11%<br />
Target Met<br />
by LEA(Y/N)<br />
Indicator 06: Early Childhood (3-5) Least Restrictive Environment<br />
A) Regular Early Childhood Program<br />
Percent of children (aged 3 through 5) with IEPs attending a regular<br />
early childhood program and receiving the majority of special<br />
education and related services in the regular early childhood program<br />
Allowable<br />
Difference<br />
LEA: 4301 - LONOKE SCHOOL <strong>DISTRICT</strong><br />
Indicator 07: Preschool (3-5) Outcomes<br />
a) Percent of preschool CWD<br />
children who did not<br />
improve functioning.<br />
b) Percent of preschool CWD<br />
who improved but whose<br />
functioning remained below<br />
same age peers.<br />
c) Percent of preschool CWD<br />
who improved at a level<br />
nearer to same aged peers.<br />
d) Percent of preschool CWD<br />
who improved functioning to<br />
reach a level comparable to<br />
same age peers.<br />
e) Percent of preschool CWD<br />
children who maintain<br />
functioning at a level<br />
comparable to same aged<br />
peers.<br />
Summary<br />
Statements<br />
1) Of those preschool<br />
children who entered<br />
the preschool program<br />
below age expectations<br />
in each Outcome, the<br />
percent who<br />
substantially increased<br />
their rate of growth by<br />
the time they turned 6<br />
years of age or exited<br />
the program.<br />
2) The percent of<br />
preschool children who<br />
were functioning<br />
within age expectations<br />
in each Outcome by the<br />
time they turned 6<br />
years of age or exited<br />
A) Positive Social -Emotional<br />
Skills*<br />
State<br />
Rate<br />
A) Positive Social -<br />
Emotional Skills<br />
(Including social<br />
relationships)<br />
State<br />
Rate<br />
2.14%<br />
5.31%<br />
25.97%<br />
38.22%<br />
28.36%<br />
State<br />
Target<br />
LEA<br />
Rate<br />
LEA<br />
Rate<br />
— —<br />
— —<br />
— —<br />
— —<br />
— —<br />
Target<br />
Met by<br />
LEA(Y/N)<br />
B) Acquisition and Use of<br />
Knowledge and Skills<br />
(Including early language/<br />
communication and early literacy)<br />
B) Acquisition and Use of<br />
Knowledge and Skills **<br />
State<br />
Rate<br />
1.75%<br />
6.59%<br />
34.23%<br />
43.51%<br />
13.92%<br />
State<br />
Target<br />
LEA<br />
Rate<br />
Target<br />
Met by<br />
LEA(Y/N)<br />
C) Use of Appropriate Behaviors<br />
to Meet Their Needs<br />
State<br />
Rate<br />
State<br />
Target<br />
LEA<br />
Rate<br />
Target<br />
Met by<br />
LEA(Y/N)<br />
89.61% 90.50% — — N/A 90.31% 90.50% — — N/A 90.82% 92.50% — — N/A<br />
66.58% 69.50% — — N/A 57.43% 60.50% — — N/A 76.69% 78.50% — — N/A<br />
NOTE: * Including social relationships ** Including early language/ communication and early literacy<br />
Note: - - denotes not applicable<br />
State<br />
Rate<br />
LEA<br />
Rate<br />
— —<br />
— —<br />
— —<br />
— —<br />
— —<br />
C) Use of<br />
Appropriate<br />
Behaviors to<br />
Meet Their Needs<br />
State<br />
Rate<br />
4.51%<br />
17.34%<br />
41.72%<br />
34.97%<br />
LEA<br />
Rate<br />
1.46% — —<br />
— —<br />
— —<br />
— —<br />
— —<br />
Page 3 of 5
LEA: 4301 - LONOKE SCHOOL <strong>DISTRICT</strong><br />
Indicator 08: Parent Involvement<br />
Percent of surveyed<br />
parents who reported<br />
school facilitated parent<br />
involvement as a means<br />
of improving services<br />
and results for children<br />
with disabilities.<br />
Early Childhood<br />
(3-5)<br />
School Age<br />
(5-21)<br />
State<br />
Rate<br />
90.47%<br />
95.05%<br />
Indicator 09: Disproportionality - Eligibility<br />
Disproportionate representation of racial<br />
and ethnic groups in special education and<br />
related services that is a result of<br />
inappropriate identification (e.g.<br />
monitoring data, review of policies,<br />
practices, and procedures under 618(d),<br />
etc.).<br />
State<br />
Rate<br />
State<br />
Target<br />
88.00%<br />
96.00%<br />
State<br />
Target<br />
0.00% 0.00%<br />
LEA<br />
Rate<br />
— —<br />
— —<br />
Indicator 10: Disproportionality-Child with a Disability<br />
Disproportionate representation of racial<br />
and ethnic groups in specific disability<br />
categories that is a result of inappropriate<br />
identification (e.g. monitoring data, review<br />
of policies, practices, and procedures under<br />
618(d), etc.).<br />
Indicator 11: Child Find<br />
Percent of children with<br />
parental consent to evaluate<br />
who are evaluated within<br />
the State established timeline<br />
of 60 days.<br />
Overall<br />
(3-21)<br />
Early Childhood<br />
(3-5)<br />
School Age<br />
(5-21)<br />
State<br />
Rate<br />
0.00%<br />
Indicator 12: Early Childhood Transition<br />
Percent of children referred by Part C prior to<br />
age 3, who are found eligible for Part B, and<br />
who have an IEP developed and implemented<br />
by their third birthday.<br />
Note: - - denotes not applicable<br />
State<br />
Rate<br />
99.41%<br />
99.70%<br />
98.97%<br />
State<br />
Rate<br />
State<br />
Target<br />
0.00%<br />
State<br />
Target<br />
100.00%<br />
100.00%<br />
100.00%<br />
State<br />
Target<br />
Target Met by<br />
LEA (Y/N)<br />
Y<br />
Target Met by<br />
LEA (Y/N)<br />
Y<br />
LEA<br />
Rate<br />
100.00%<br />
— —<br />
100.00%<br />
LEA<br />
Rate<br />
Target Met by<br />
LEA (Y/N)<br />
N/A<br />
N<br />
Note: The target for Indicator 09 is to have zero percent<br />
(0%) of districts identified as having disproportionate<br />
representation as a result of inappropriate<br />
identification in eligibility.<br />
Note: The target for Indicator 10 is to have zero<br />
percent (0%) of districts identified as having<br />
disproportionate representation as a result of<br />
inappropriate identification in a disability<br />
category.<br />
Target Met by<br />
LEA (Y/N)<br />
N/A<br />
Y<br />
Target Met<br />
by LEA<br />
(Y/N)<br />
99.21% 100.00% - - N/A<br />
Y<br />
Note: * Indicates a zero reponse rate for the<br />
district.<br />
Page 4 of 5
LEA: 4301 - LONOKE SCHOOL <strong>DISTRICT</strong><br />
Indicator 13: Secondary Transition<br />
Percent of youth with disabilities aged 16 and<br />
up with an IEP that includes coordinated,<br />
measurable, annual IEP goals and transition<br />
services that will reasonably enable the student<br />
to meet the post-secondary goals.<br />
Indicator 14: Post-School Outcomes<br />
A. Percent of youth enrolled in higher<br />
education within one year of leaving high<br />
school.<br />
State<br />
Rate<br />
State<br />
Target<br />
Note: Data for this Indicator is from the on-site monitoring of LEAs for the given year.<br />
B. Percent of youth enrolled in higher<br />
education or competitively employed<br />
within one year of leaving high school.<br />
C. Percent of youth enrolled in higher<br />
education or in some other postsecondary<br />
education or training program; or<br />
competitively employed or in some other<br />
employment within one year of leaving<br />
high school.<br />
State<br />
Rate<br />
Indicator 20: Reported Data-Timely and Accurate*<br />
District submitted<br />
required data elements<br />
on or before due dates;<br />
made revisions within<br />
the alloted reveiw<br />
periods.<br />
Accurate and Timely<br />
Data Submission<br />
Overall (3-21)<br />
Early Childhood (3-5)<br />
School Age (5-21)<br />
State<br />
Target<br />
100.00%<br />
100.00%<br />
100.00%<br />
State<br />
Target<br />
LEA<br />
Rate<br />
LEA<br />
Rate<br />
Target Met by<br />
LEA (Y/N)<br />
Target Met<br />
by LEA<br />
(Y/N)<br />
Target Met<br />
by LEA<br />
(Y/N)<br />
*Data reviewed for timely and accurate submissions included all APSCN cycle data except for personnel<br />
Note: - - denotes not applicable<br />
96.19 100.00 — — N/A<br />
14.53<br />
State<br />
Rate<br />
49.42<br />
State<br />
Rate<br />
54.07<br />
13.00<br />
State<br />
Target<br />
49.00<br />
State<br />
Target<br />
60.00<br />
Y<br />
N/A<br />
Y<br />
— —<br />
LEA<br />
Rate<br />
— —<br />
LEA<br />
Rate<br />
— —<br />
N/A<br />
Target Met<br />
by LEA<br />
(Y/N)<br />
N/A<br />
Target Met<br />
by LEA<br />
(Y/N)<br />
N/A<br />
Page 5 of 5
LEA: 4302 - ENGLAND SCHOOL <strong>DISTRICT</strong><br />
<strong>ARKANSAS</strong> <strong>SPECIAL</strong> <strong>EDUCATION</strong><br />
<strong>DISTRICT</strong> <strong>ANNUAL</strong> PERFORMANCE REPORT<br />
2010/11 School Year<br />
Publication Date: March 2012<br />
Each State must have in place a State Performance Plan (SPP) to evaluate the State's efforts to meet the requirements and<br />
purposes of the implementation of the Individuals with Disabilities Education Act (IDEA). The SPP is a six-year plan, which<br />
describes Arkansas's performance on 20 indicators. The Office of Special Education Programs in the U. S. Department of<br />
Education requires that States report annually to the public on the performance of each local education agency (LEA) on 14 of<br />
20 indicators as compared with targets established by the State in the SPP. Arkansas will report indicators 1 through 14 and<br />
20 for each LEA serving children with disabilities (CWD). Any LEA not meeting targets on compliance indicators (0% for<br />
Indicators 4B, 09 & 10 and 100% for Indicators 11, 12, 13, and 20) are non-compliant with IDEA.<br />
There are no report changes for the 2010/11 school year profile; However, it is important to recognize that: .<br />
1. Indicator 01 (Graduation) is reported a year in arrear (2009/10 graduates) and is based on a four-year cohort. This<br />
means the rate is a measure of students who entered in ninth grade and graduate in four years. The calculation is a<br />
requirement under Title I of the Elementary and Secondary Education Act (ESEA).<br />
2. Indicator 02 (Drop out) is reported a year in arrear. This means the rate is a measure of students who dropped out in<br />
the 2009/10 school year. The Indicator 02 data are aligned with the Common Core of Data (CCD) requirements for<br />
grades 7-12.<br />
3. Indicator 04A and 4B (Suspension/Expulsion) is reported a year in arrear. This means the rate is a measure of<br />
students who had out-of-school suspensions and/or expulsions totaling more than 10 days.<br />
Percent of youth<br />
with IEPs<br />
graduating from<br />
high school with a<br />
regular diploma<br />
For a complete description of all the Indicators, please visit the special education website at<br />
http://arksped.k12.ar.us/sections/policy.html<br />
Indicator 01: Graduation Rates (2009/10 school year) Indicator 02: Dropout Rates (2009/10 school year)<br />
State<br />
Rate<br />
State<br />
Target<br />
75.76% 85.00%<br />
LEA<br />
Rate<br />
81.82%<br />
Target Met<br />
by LEA<br />
(Y/N)<br />
N<br />
Percent of<br />
youth with<br />
IEPs dropping<br />
out of high<br />
school<br />
State<br />
Rate<br />
Indicator 03: Assessment on Statewide Benchmark Exam (grades 3-8, 11)<br />
A) Adequate Yearly Progress<br />
n=40<br />
Literacy<br />
Mathematics<br />
Met Disability Subgroup "n"<br />
for Reporting Purposes (Y/N)<br />
State Target for % of Districts Meeting<br />
AYP for Disability Subgroup<br />
State<br />
Target<br />
3.06% 4.20%<br />
LEA<br />
Rate<br />
6.67%<br />
% of Districts Meeting AYP<br />
for Disability Subgroup<br />
Target Met by<br />
LEA (Y/N)<br />
N<br />
Target Met by<br />
LEA(Y/N)<br />
Overall N 17.15% 6.25%<br />
NA<br />
N<br />
N<br />
Note: For a district to qualify as having a disability subgroup it must have a minimum of 40 (n=40) students with disabilities in a school building.<br />
B) Participation<br />
Participation Rate: # of<br />
CWD Tested ÷ # of CWD<br />
Enrolled in grades tested.<br />
Participation Rate: Literacy<br />
Participation Rate: Math<br />
Note: - - denotes not applicable<br />
State<br />
Rate<br />
98.78%<br />
State<br />
Target<br />
95.00%<br />
LEA<br />
Rate<br />
98.75%<br />
Target Met<br />
by LEA (Y/N)<br />
98.61% 95.00% 98.72% Y<br />
Y<br />
C) Performance Proficiency<br />
Percent of CWD Scoring<br />
Proficient or Above<br />
Proficiency Rate: Literacy<br />
Proficiency Rate:<br />
Mathematics<br />
16.00%<br />
16.00%<br />
State<br />
Rate<br />
31.49%<br />
44.86%<br />
State<br />
Target<br />
45.22%<br />
51.14%<br />
LEA<br />
Rate<br />
29.33%<br />
38.36%<br />
NA<br />
NA<br />
Target<br />
Met by<br />
LEA (Y/N)<br />
N<br />
N<br />
Page 1 of 5
LEA: 4302 - ENGLAND SCHOOL <strong>DISTRICT</strong><br />
Indicator 04: Out-of-School Suspensions and Expulsions (2009/10 school year)<br />
A) Suspension/Expulsion<br />
Percent difference of CWD with out-of- school suspensions and<br />
expulsions totaling greater than 10 days in a school year as<br />
compared to the same data for general education students in<br />
the district.<br />
B) Suspension/Expulsion by Race and Ethnicity<br />
Percent of districts that have: (a) a significant discrepancy, by race or<br />
ethnicity, in the rate of suspensions and expulsions of greater than 10<br />
days in a school year for children with IEPs; and (b) policies,<br />
procedures or practices that contribute to the significant discrepancy<br />
and do not comply with requirements relating to the development<br />
and implementation of IEPs, the use of positive behavioral<br />
interventions and supports, and procedural safeguards.<br />
Indicator 05: School Age (5-21) Least Restrictive Environment<br />
A) In the Regular Class 80% or more of the day<br />
Percent of CWD with<br />
IEPs receiving instruction<br />
in the regular class 80%<br />
or more of the day.<br />
State<br />
Rate<br />
State<br />
Target<br />
LEA<br />
Rate<br />
B) In the Regular Class less than 40% of the day<br />
Percent of CWD with<br />
IEPs receiving instruction<br />
in the regular class less<br />
than 60% of the day.<br />
53.87% 59.77%<br />
State<br />
Rate<br />
State<br />
Target<br />
12.42% 12.51%<br />
40.16%<br />
LEA<br />
Rate<br />
17.32%<br />
C) Other Settings outside the regular class<br />
Percent of CWD with IEPs served in<br />
public or private separate schools,<br />
residential placements, or<br />
homebound/hospital placements.<br />
State<br />
Rate<br />
State<br />
Target<br />
2.80% 2.56%<br />
Target Met<br />
by LEA (Y/N)<br />
N<br />
Target Met<br />
by LEA (Y/N)<br />
N<br />
LEA<br />
Rate<br />
0.00%<br />
Target Met<br />
by LEA(Y/N)<br />
Indicator 06: Early Childhood (3-5) Least Restrictive Environment<br />
A) Regular Early Childhood Program<br />
Percent of children (aged 3 through 5) with IEPs attending a regular<br />
early childhood program and receiving the majority of special<br />
education and related services in the regular early childhood program<br />
Allowable<br />
Difference<br />
LEA: 4302 - ENGLAND SCHOOL <strong>DISTRICT</strong><br />
Indicator 07: Preschool (3-5) Outcomes<br />
a) Percent of preschool CWD<br />
children who did not<br />
improve functioning.<br />
b) Percent of preschool CWD<br />
who improved but whose<br />
functioning remained below<br />
same age peers.<br />
c) Percent of preschool CWD<br />
who improved at a level<br />
nearer to same aged peers.<br />
d) Percent of preschool CWD<br />
who improved functioning to<br />
reach a level comparable to<br />
same age peers.<br />
e) Percent of preschool CWD<br />
children who maintain<br />
functioning at a level<br />
comparable to same aged<br />
peers.<br />
Summary<br />
Statements<br />
1) Of those preschool<br />
children who entered<br />
the preschool program<br />
below age expectations<br />
in each Outcome, the<br />
percent who<br />
substantially increased<br />
their rate of growth by<br />
the time they turned 6<br />
years of age or exited<br />
the program.<br />
2) The percent of<br />
preschool children who<br />
were functioning<br />
within age expectations<br />
in each Outcome by the<br />
time they turned 6<br />
years of age or exited<br />
A) Positive Social -Emotional<br />
Skills*<br />
State<br />
Rate<br />
A) Positive Social -<br />
Emotional Skills<br />
(Including social<br />
relationships)<br />
State<br />
Rate<br />
2.14%<br />
5.31%<br />
25.97%<br />
38.22%<br />
28.36%<br />
State<br />
Target<br />
LEA<br />
Rate<br />
LEA<br />
Rate<br />
— —<br />
— —<br />
— —<br />
— —<br />
— —<br />
Target<br />
Met by<br />
LEA(Y/N)<br />
B) Acquisition and Use of<br />
Knowledge and Skills<br />
(Including early language/<br />
communication and early literacy)<br />
B) Acquisition and Use of<br />
Knowledge and Skills **<br />
State<br />
Rate<br />
1.75%<br />
6.59%<br />
34.23%<br />
43.51%<br />
13.92%<br />
State<br />
Target<br />
LEA<br />
Rate<br />
Target<br />
Met by<br />
LEA(Y/N)<br />
C) Use of Appropriate Behaviors<br />
to Meet Their Needs<br />
State<br />
Rate<br />
State<br />
Target<br />
LEA<br />
Rate<br />
Target<br />
Met by<br />
LEA(Y/N)<br />
89.61% 90.50% — — N/A 90.31% 90.50% — — N/A 90.82% 92.50% — — N/A<br />
66.58% 69.50% — — N/A 57.43% 60.50% — — N/A 76.69% 78.50% — — N/A<br />
NOTE: * Including social relationships ** Including early language/ communication and early literacy<br />
Note: - - denotes not applicable<br />
State<br />
Rate<br />
LEA<br />
Rate<br />
— —<br />
— —<br />
— —<br />
— —<br />
— —<br />
C) Use of<br />
Appropriate<br />
Behaviors to<br />
Meet Their Needs<br />
State<br />
Rate<br />
4.51%<br />
17.34%<br />
41.72%<br />
34.97%<br />
LEA<br />
Rate<br />
1.46% — —<br />
— —<br />
— —<br />
— —<br />
— —<br />
Page 3 of 5
LEA: 4302 - ENGLAND SCHOOL <strong>DISTRICT</strong><br />
Indicator 08: Parent Involvement<br />
Percent of surveyed<br />
parents who reported<br />
school facilitated parent<br />
involvement as a means<br />
of improving services<br />
and results for children<br />
with disabilities.<br />
Early Childhood<br />
(3-5)<br />
School Age<br />
(5-21)<br />
State<br />
Rate<br />
90.47%<br />
95.05%<br />
Indicator 09: Disproportionality - Eligibility<br />
Disproportionate representation of racial<br />
and ethnic groups in special education and<br />
related services that is a result of<br />
inappropriate identification (e.g.<br />
monitoring data, review of policies,<br />
practices, and procedures under 618(d),<br />
etc.).<br />
State<br />
Rate<br />
State<br />
Target<br />
88.00%<br />
96.00%<br />
State<br />
Target<br />
0.00% 0.00%<br />
LEA<br />
Rate<br />
— —<br />
100.00%<br />
Indicator 10: Disproportionality-Child with a Disability<br />
Disproportionate representation of racial<br />
and ethnic groups in specific disability<br />
categories that is a result of inappropriate<br />
identification (e.g. monitoring data, review<br />
of policies, practices, and procedures under<br />
618(d), etc.).<br />
Indicator 11: Child Find<br />
Percent of children with<br />
parental consent to evaluate<br />
who are evaluated within<br />
the State established timeline<br />
of 60 days.<br />
Overall<br />
(3-21)<br />
Early Childhood<br />
(3-5)<br />
School Age<br />
(5-21)<br />
State<br />
Rate<br />
0.00%<br />
Indicator 12: Early Childhood Transition<br />
Percent of children referred by Part C prior to<br />
age 3, who are found eligible for Part B, and<br />
who have an IEP developed and implemented<br />
by their third birthday.<br />
Note: - - denotes not applicable<br />
State<br />
Rate<br />
99.41%<br />
99.70%<br />
98.97%<br />
State<br />
Rate<br />
State<br />
Target<br />
0.00%<br />
State<br />
Target<br />
100.00%<br />
100.00%<br />
100.00%<br />
State<br />
Target<br />
Target Met by<br />
LEA (Y/N)<br />
Y<br />
Target Met by<br />
LEA (Y/N)<br />
Y<br />
LEA<br />
Rate<br />
100.00%<br />
— —<br />
100.00%<br />
LEA<br />
Rate<br />
Target Met by<br />
LEA (Y/N)<br />
N/A<br />
Y<br />
Note: The target for Indicator 09 is to have zero percent<br />
(0%) of districts identified as having disproportionate<br />
representation as a result of inappropriate<br />
identification in eligibility.<br />
Note: The target for Indicator 10 is to have zero<br />
percent (0%) of districts identified as having<br />
disproportionate representation as a result of<br />
inappropriate identification in a disability<br />
category.<br />
Target Met by<br />
LEA (Y/N)<br />
N/A<br />
Y<br />
Target Met<br />
by LEA<br />
(Y/N)<br />
99.21% 100.00% - - N/A<br />
Y<br />
Note: * Indicates a zero reponse rate for the<br />
district.<br />
Page 4 of 5
LEA: 4302 - ENGLAND SCHOOL <strong>DISTRICT</strong><br />
Indicator 13: Secondary Transition<br />
Percent of youth with disabilities aged 16 and<br />
up with an IEP that includes coordinated,<br />
measurable, annual IEP goals and transition<br />
services that will reasonably enable the student<br />
to meet the post-secondary goals.<br />
Indicator 14: Post-School Outcomes<br />
A. Percent of youth enrolled in higher<br />
education within one year of leaving high<br />
school.<br />
State<br />
Rate<br />
State<br />
Target<br />
Note: Data for this Indicator is from the on-site monitoring of LEAs for the given year.<br />
B. Percent of youth enrolled in higher<br />
education or competitively employed<br />
within one year of leaving high school.<br />
C. Percent of youth enrolled in higher<br />
education or in some other postsecondary<br />
education or training program; or<br />
competitively employed or in some other<br />
employment within one year of leaving<br />
high school.<br />
State<br />
Rate<br />
Indicator 20: Reported Data-Timely and Accurate*<br />
District submitted<br />
required data elements<br />
on or before due dates;<br />
made revisions within<br />
the alloted reveiw<br />
periods.<br />
Accurate and Timely<br />
Data Submission<br />
Overall (3-21)<br />
Early Childhood (3-5)<br />
School Age (5-21)<br />
State<br />
Target<br />
100.00%<br />
100.00%<br />
100.00%<br />
State<br />
Target<br />
LEA<br />
Rate<br />
LEA<br />
Rate<br />
Target Met by<br />
LEA (Y/N)<br />
Target Met<br />
by LEA<br />
(Y/N)<br />
Target Met<br />
by LEA<br />
(Y/N)<br />
*Data reviewed for timely and accurate submissions included all APSCN cycle data except for personnel<br />
Note: - - denotes not applicable<br />
96.19 100.00 100.00% Y<br />
14.53<br />
State<br />
Rate<br />
49.42<br />
State<br />
Rate<br />
54.07<br />
13.00<br />
State<br />
Target<br />
49.00<br />
State<br />
Target<br />
60.00<br />
Y<br />
N/A<br />
Y<br />
— —<br />
LEA<br />
Rate<br />
— —<br />
LEA<br />
Rate<br />
— —<br />
N/A<br />
Target Met<br />
by LEA<br />
(Y/N)<br />
N/A<br />
Target Met<br />
by LEA<br />
(Y/N)<br />
N/A<br />
Page 5 of 5
LEA: 4303 - CARLISLE SCHOOL <strong>DISTRICT</strong><br />
<strong>ARKANSAS</strong> <strong>SPECIAL</strong> <strong>EDUCATION</strong><br />
<strong>DISTRICT</strong> <strong>ANNUAL</strong> PERFORMANCE REPORT<br />
2010/11 School Year<br />
Publication Date: March 2012<br />
Each State must have in place a State Performance Plan (SPP) to evaluate the State's efforts to meet the requirements and<br />
purposes of the implementation of the Individuals with Disabilities Education Act (IDEA). The SPP is a six-year plan, which<br />
describes Arkansas's performance on 20 indicators. The Office of Special Education Programs in the U. S. Department of<br />
Education requires that States report annually to the public on the performance of each local education agency (LEA) on 14 of<br />
20 indicators as compared with targets established by the State in the SPP. Arkansas will report indicators 1 through 14 and<br />
20 for each LEA serving children with disabilities (CWD). Any LEA not meeting targets on compliance indicators (0% for<br />
Indicators 4B, 09 & 10 and 100% for Indicators 11, 12, 13, and 20) are non-compliant with IDEA.<br />
There are no report changes for the 2010/11 school year profile; However, it is important to recognize that: .<br />
1. Indicator 01 (Graduation) is reported a year in arrear (2009/10 graduates) and is based on a four-year cohort. This<br />
means the rate is a measure of students who entered in ninth grade and graduate in four years. The calculation is a<br />
requirement under Title I of the Elementary and Secondary Education Act (ESEA).<br />
2. Indicator 02 (Drop out) is reported a year in arrear. This means the rate is a measure of students who dropped out in<br />
the 2009/10 school year. The Indicator 02 data are aligned with the Common Core of Data (CCD) requirements for<br />
grades 7-12.<br />
3. Indicator 04A and 4B (Suspension/Expulsion) is reported a year in arrear. This means the rate is a measure of<br />
students who had out-of-school suspensions and/or expulsions totaling more than 10 days.<br />
Percent of youth<br />
with IEPs<br />
graduating from<br />
high school with a<br />
regular diploma<br />
For a complete description of all the Indicators, please visit the special education website at<br />
http://arksped.k12.ar.us/sections/policy.html<br />
Indicator 01: Graduation Rates (2009/10 school year) Indicator 02: Dropout Rates (2009/10 school year)<br />
State<br />
Rate<br />
State<br />
Target<br />
75.76% 85.00%<br />
LEA<br />
Rate<br />
75.00%<br />
Target Met<br />
by LEA<br />
(Y/N)<br />
N<br />
Percent of<br />
youth with<br />
IEPs dropping<br />
out of high<br />
school<br />
State<br />
Rate<br />
Indicator 03: Assessment on Statewide Benchmark Exam (grades 3-8, 11)<br />
A) Adequate Yearly Progress<br />
n=40<br />
Literacy<br />
Mathematics<br />
Met Disability Subgroup "n"<br />
for Reporting Purposes (Y/N)<br />
State Target for % of Districts Meeting<br />
AYP for Disability Subgroup<br />
State<br />
Target<br />
3.06% 4.20%<br />
LEA<br />
Rate<br />
3.70%<br />
% of Districts Meeting AYP<br />
for Disability Subgroup<br />
Target Met by<br />
LEA (Y/N)<br />
Y<br />
Target Met by<br />
LEA(Y/N)<br />
Overall N 17.15% 6.25%<br />
NA<br />
N<br />
N<br />
Note: For a district to qualify as having a disability subgroup it must have a minimum of 40 (n=40) students with disabilities in a school building.<br />
B) Participation<br />
Participation Rate: # of<br />
CWD Tested ÷ # of CWD<br />
Enrolled in grades tested.<br />
Participation Rate: Literacy<br />
Participation Rate: Math<br />
Note: - - denotes not applicable<br />
State<br />
Rate<br />
98.78%<br />
State<br />
Target<br />
95.00%<br />
LEA<br />
Rate<br />
97.83%<br />
Target Met<br />
by LEA (Y/N)<br />
98.61% 95.00% 97.92% Y<br />
Y<br />
C) Performance Proficiency<br />
Percent of CWD Scoring<br />
Proficient or Above<br />
Proficiency Rate: Literacy<br />
Proficiency Rate:<br />
Mathematics<br />
16.00%<br />
16.00%<br />
State<br />
Rate<br />
31.49%<br />
44.86%<br />
State<br />
Target<br />
45.22%<br />
51.14%<br />
LEA<br />
Rate<br />
22.50%<br />
47.62%<br />
NA<br />
NA<br />
Target<br />
Met by<br />
LEA (Y/N)<br />
N<br />
N<br />
Page 1 of 5
LEA: 4303 - CARLISLE SCHOOL <strong>DISTRICT</strong><br />
Indicator 04: Out-of-School Suspensions and Expulsions (2009/10 school year)<br />
A) Suspension/Expulsion<br />
Percent difference of CWD with out-of- school suspensions and<br />
expulsions totaling greater than 10 days in a school year as<br />
compared to the same data for general education students in<br />
the district.<br />
B) Suspension/Expulsion by Race and Ethnicity<br />
Percent of districts that have: (a) a significant discrepancy, by race or<br />
ethnicity, in the rate of suspensions and expulsions of greater than 10<br />
days in a school year for children with IEPs; and (b) policies,<br />
procedures or practices that contribute to the significant discrepancy<br />
and do not comply with requirements relating to the development<br />
and implementation of IEPs, the use of positive behavioral<br />
interventions and supports, and procedural safeguards.<br />
Indicator 05: School Age (5-21) Least Restrictive Environment<br />
A) In the Regular Class 80% or more of the day<br />
Percent of CWD with<br />
IEPs receiving instruction<br />
in the regular class 80%<br />
or more of the day.<br />
State<br />
Rate<br />
State<br />
Target<br />
LEA<br />
Rate<br />
B) In the Regular Class less than 40% of the day<br />
Percent of CWD with<br />
IEPs receiving instruction<br />
in the regular class less<br />
than 60% of the day.<br />
53.87% 59.77%<br />
State<br />
Rate<br />
State<br />
Target<br />
12.42% 12.51%<br />
76.74%<br />
LEA<br />
Rate<br />
2.33%<br />
C) Other Settings outside the regular class<br />
Percent of CWD with IEPs served in<br />
public or private separate schools,<br />
residential placements, or<br />
homebound/hospital placements.<br />
State<br />
Rate<br />
State<br />
Target<br />
2.80% 2.56%<br />
Target Met<br />
by LEA (Y/N)<br />
Y<br />
Target Met<br />
by LEA (Y/N)<br />
Y<br />
LEA<br />
Rate<br />
0.00%<br />
Target Met<br />
by LEA(Y/N)<br />
Indicator 06: Early Childhood (3-5) Least Restrictive Environment<br />
A) Regular Early Childhood Program<br />
Percent of children (aged 3 through 5) with IEPs attending a regular<br />
early childhood program and receiving the majority of special<br />
education and related services in the regular early childhood program<br />
Allowable<br />
Difference<br />
LEA: 4303 - CARLISLE SCHOOL <strong>DISTRICT</strong><br />
Indicator 07: Preschool (3-5) Outcomes<br />
a) Percent of preschool CWD<br />
children who did not<br />
improve functioning.<br />
b) Percent of preschool CWD<br />
who improved but whose<br />
functioning remained below<br />
same age peers.<br />
c) Percent of preschool CWD<br />
who improved at a level<br />
nearer to same aged peers.<br />
d) Percent of preschool CWD<br />
who improved functioning to<br />
reach a level comparable to<br />
same age peers.<br />
e) Percent of preschool CWD<br />
children who maintain<br />
functioning at a level<br />
comparable to same aged<br />
peers.<br />
Summary<br />
Statements<br />
1) Of those preschool<br />
children who entered<br />
the preschool program<br />
below age expectations<br />
in each Outcome, the<br />
percent who<br />
substantially increased<br />
their rate of growth by<br />
the time they turned 6<br />
years of age or exited<br />
the program.<br />
2) The percent of<br />
preschool children who<br />
were functioning<br />
within age expectations<br />
in each Outcome by the<br />
time they turned 6<br />
years of age or exited<br />
A) Positive Social -Emotional<br />
Skills*<br />
State<br />
Rate<br />
A) Positive Social -<br />
Emotional Skills<br />
(Including social<br />
relationships)<br />
State<br />
Rate<br />
2.14%<br />
5.31%<br />
25.97%<br />
38.22%<br />
28.36%<br />
State<br />
Target<br />
LEA<br />
Rate<br />
LEA<br />
Rate<br />
— —<br />
— —<br />
— —<br />
— —<br />
— —<br />
Target<br />
Met by<br />
LEA(Y/N)<br />
B) Acquisition and Use of<br />
Knowledge and Skills<br />
(Including early language/<br />
communication and early literacy)<br />
B) Acquisition and Use of<br />
Knowledge and Skills **<br />
State<br />
Rate<br />
1.75%<br />
6.59%<br />
34.23%<br />
43.51%<br />
13.92%<br />
State<br />
Target<br />
LEA<br />
Rate<br />
Target<br />
Met by<br />
LEA(Y/N)<br />
C) Use of Appropriate Behaviors<br />
to Meet Their Needs<br />
State<br />
Rate<br />
State<br />
Target<br />
LEA<br />
Rate<br />
Target<br />
Met by<br />
LEA(Y/N)<br />
89.61% 90.50% — — N/A 90.31% 90.50% — — N/A 90.82% 92.50% — — N/A<br />
66.58% 69.50% — — N/A 57.43% 60.50% — — N/A 76.69% 78.50% — — N/A<br />
NOTE: * Including social relationships ** Including early language/ communication and early literacy<br />
Note: - - denotes not applicable<br />
State<br />
Rate<br />
LEA<br />
Rate<br />
— —<br />
— —<br />
— —<br />
— —<br />
— —<br />
C) Use of<br />
Appropriate<br />
Behaviors to<br />
Meet Their Needs<br />
State<br />
Rate<br />
4.51%<br />
17.34%<br />
41.72%<br />
34.97%<br />
LEA<br />
Rate<br />
1.46% — —<br />
— —<br />
— —<br />
— —<br />
— —<br />
Page 3 of 5
LEA: 4303 - CARLISLE SCHOOL <strong>DISTRICT</strong><br />
Indicator 08: Parent Involvement<br />
Percent of surveyed<br />
parents who reported<br />
school facilitated parent<br />
involvement as a means<br />
of improving services<br />
and results for children<br />
with disabilities.<br />
Early Childhood<br />
(3-5)<br />
School Age<br />
(5-21)<br />
State<br />
Rate<br />
90.47%<br />
95.05%<br />
Indicator 09: Disproportionality - Eligibility<br />
Disproportionate representation of racial<br />
and ethnic groups in special education and<br />
related services that is a result of<br />
inappropriate identification (e.g.<br />
monitoring data, review of policies,<br />
practices, and procedures under 618(d),<br />
etc.).<br />
State<br />
Rate<br />
State<br />
Target<br />
88.00%<br />
96.00%<br />
State<br />
Target<br />
0.00% 0.00%<br />
LEA<br />
Rate<br />
— —<br />
100.00%<br />
Indicator 10: Disproportionality-Child with a Disability<br />
Disproportionate representation of racial<br />
and ethnic groups in specific disability<br />
categories that is a result of inappropriate<br />
identification (e.g. monitoring data, review<br />
of policies, practices, and procedures under<br />
618(d), etc.).<br />
Indicator 11: Child Find<br />
Percent of children with<br />
parental consent to evaluate<br />
who are evaluated within<br />
the State established timeline<br />
of 60 days.<br />
Overall<br />
(3-21)<br />
Early Childhood<br />
(3-5)<br />
School Age<br />
(5-21)<br />
State<br />
Rate<br />
0.00%<br />
Indicator 12: Early Childhood Transition<br />
Percent of children referred by Part C prior to<br />
age 3, who are found eligible for Part B, and<br />
who have an IEP developed and implemented<br />
by their third birthday.<br />
Note: - - denotes not applicable<br />
State<br />
Rate<br />
99.41%<br />
99.70%<br />
98.97%<br />
State<br />
Rate<br />
State<br />
Target<br />
0.00%<br />
State<br />
Target<br />
100.00%<br />
100.00%<br />
100.00%<br />
State<br />
Target<br />
Target Met by<br />
LEA (Y/N)<br />
Y<br />
Target Met by<br />
LEA (Y/N)<br />
Y<br />
LEA<br />
Rate<br />
100.00%<br />
— —<br />
100.00%<br />
LEA<br />
Rate<br />
Target Met by<br />
LEA (Y/N)<br />
N/A<br />
Y<br />
Note: The target for Indicator 09 is to have zero percent<br />
(0%) of districts identified as having disproportionate<br />
representation as a result of inappropriate<br />
identification in eligibility.<br />
Note: The target for Indicator 10 is to have zero<br />
percent (0%) of districts identified as having<br />
disproportionate representation as a result of<br />
inappropriate identification in a disability<br />
category.<br />
Target Met by<br />
LEA (Y/N)<br />
N/A<br />
Y<br />
Target Met<br />
by LEA<br />
(Y/N)<br />
99.21% 100.00% - - N/A<br />
Y<br />
Note: * Indicates a zero reponse rate for the<br />
district.<br />
Page 4 of 5
LEA: 4303 - CARLISLE SCHOOL <strong>DISTRICT</strong><br />
Indicator 13: Secondary Transition<br />
Percent of youth with disabilities aged 16 and<br />
up with an IEP that includes coordinated,<br />
measurable, annual IEP goals and transition<br />
services that will reasonably enable the student<br />
to meet the post-secondary goals.<br />
Indicator 14: Post-School Outcomes<br />
A. Percent of youth enrolled in higher<br />
education within one year of leaving high<br />
school.<br />
State<br />
Rate<br />
State<br />
Target<br />
Note: Data for this Indicator is from the on-site monitoring of LEAs for the given year.<br />
B. Percent of youth enrolled in higher<br />
education or competitively employed<br />
within one year of leaving high school.<br />
C. Percent of youth enrolled in higher<br />
education or in some other postsecondary<br />
education or training program; or<br />
competitively employed or in some other<br />
employment within one year of leaving<br />
high school.<br />
State<br />
Rate<br />
Indicator 20: Reported Data-Timely and Accurate*<br />
District submitted<br />
required data elements<br />
on or before due dates;<br />
made revisions within<br />
the alloted reveiw<br />
periods.<br />
Accurate and Timely<br />
Data Submission<br />
Overall (3-21)<br />
Early Childhood (3-5)<br />
School Age (5-21)<br />
State<br />
Target<br />
100.00%<br />
100.00%<br />
100.00%<br />
State<br />
Target<br />
LEA<br />
Rate<br />
LEA<br />
Rate<br />
Target Met by<br />
LEA (Y/N)<br />
Target Met<br />
by LEA<br />
(Y/N)<br />
Target Met<br />
by LEA<br />
(Y/N)<br />
*Data reviewed for timely and accurate submissions included all APSCN cycle data except for personnel<br />
Note: - - denotes not applicable<br />
96.19 100.00 — — N/A<br />
14.53<br />
State<br />
Rate<br />
49.42<br />
State<br />
Rate<br />
54.07<br />
13.00<br />
State<br />
Target<br />
49.00<br />
State<br />
Target<br />
60.00<br />
Y<br />
N/A<br />
Y<br />
— —<br />
LEA<br />
Rate<br />
— —<br />
LEA<br />
Rate<br />
— —<br />
N/A<br />
Target Met<br />
by LEA<br />
(Y/N)<br />
N/A<br />
Target Met<br />
by LEA<br />
(Y/N)<br />
N/A<br />
Page 5 of 5
LEA: 4304 - CABOT SCHOOL <strong>DISTRICT</strong><br />
<strong>ARKANSAS</strong> <strong>SPECIAL</strong> <strong>EDUCATION</strong><br />
<strong>DISTRICT</strong> <strong>ANNUAL</strong> PERFORMANCE REPORT<br />
2010/11 School Year<br />
Publication Date: March 2012<br />
Each State must have in place a State Performance Plan (SPP) to evaluate the State's efforts to meet the requirements and<br />
purposes of the implementation of the Individuals with Disabilities Education Act (IDEA). The SPP is a six-year plan, which<br />
describes Arkansas's performance on 20 indicators. The Office of Special Education Programs in the U. S. Department of<br />
Education requires that States report annually to the public on the performance of each local education agency (LEA) on 14 of<br />
20 indicators as compared with targets established by the State in the SPP. Arkansas will report indicators 1 through 14 and<br />
20 for each LEA serving children with disabilities (CWD). Any LEA not meeting targets on compliance indicators (0% for<br />
Indicators 4B, 09 & 10 and 100% for Indicators 11, 12, 13, and 20) are non-compliant with IDEA.<br />
There are no report changes for the 2010/11 school year profile; However, it is important to recognize that: .<br />
1. Indicator 01 (Graduation) is reported a year in arrear (2009/10 graduates) and is based on a four-year cohort. This<br />
means the rate is a measure of students who entered in ninth grade and graduate in four years. The calculation is a<br />
requirement under Title I of the Elementary and Secondary Education Act (ESEA).<br />
2. Indicator 02 (Drop out) is reported a year in arrear. This means the rate is a measure of students who dropped out in<br />
the 2009/10 school year. The Indicator 02 data are aligned with the Common Core of Data (CCD) requirements for<br />
grades 7-12.<br />
3. Indicator 04A and 4B (Suspension/Expulsion) is reported a year in arrear. This means the rate is a measure of<br />
students who had out-of-school suspensions and/or expulsions totaling more than 10 days.<br />
Percent of youth<br />
with IEPs<br />
graduating from<br />
high school with a<br />
regular diploma<br />
For a complete description of all the Indicators, please visit the special education website at<br />
http://arksped.k12.ar.us/sections/policy.html<br />
Indicator 01: Graduation Rates (2009/10 school year) Indicator 02: Dropout Rates (2009/10 school year)<br />
State<br />
Rate<br />
State<br />
Target<br />
75.76% 85.00%<br />
LEA<br />
Rate<br />
74.39%<br />
Target Met<br />
by LEA<br />
(Y/N)<br />
N<br />
Percent of<br />
youth with<br />
IEPs dropping<br />
out of high<br />
school<br />
State<br />
Rate<br />
Indicator 03: Assessment on Statewide Benchmark Exam (grades 3-8, 11)<br />
A) Adequate Yearly Progress<br />
n=40<br />
Literacy<br />
Mathematics<br />
Met Disability Subgroup "n"<br />
for Reporting Purposes (Y/N)<br />
State Target for % of Districts Meeting<br />
AYP for Disability Subgroup<br />
State<br />
Target<br />
3.06% 4.20%<br />
LEA<br />
Rate<br />
3.52%<br />
% of Districts Meeting AYP<br />
for Disability Subgroup<br />
Target Met by<br />
LEA (Y/N)<br />
Y<br />
Target Met by<br />
LEA(Y/N)<br />
Overall Y 17.15% 6.25%<br />
N<br />
Y<br />
Y<br />
Note: For a district to qualify as having a disability subgroup it must have a minimum of 40 (n=40) students with disabilities in a school building.<br />
B) Participation<br />
Participation Rate: # of<br />
CWD Tested ÷ # of CWD<br />
Enrolled in grades tested.<br />
Participation Rate: Literacy<br />
Participation Rate: Math<br />
Note: - - denotes not applicable<br />
State<br />
Rate<br />
98.78%<br />
State<br />
Target<br />
95.00%<br />
LEA<br />
Rate<br />
99.36%<br />
Target Met<br />
by LEA (Y/N)<br />
98.61% 95.00% 99.41% Y<br />
Y<br />
C) Performance Proficiency<br />
Percent of CWD Scoring<br />
Proficient or Above<br />
Proficiency Rate: Literacy<br />
Proficiency Rate:<br />
Mathematics<br />
16.00%<br />
16.00%<br />
State<br />
Rate<br />
31.49%<br />
44.86%<br />
State<br />
Target<br />
45.22%<br />
51.14%<br />
LEA<br />
Rate<br />
41.84%<br />
53.21%<br />
N<br />
N<br />
Target<br />
Met by<br />
LEA (Y/N)<br />
N<br />
Y<br />
Page 1 of 5
LEA: 4304 - CABOT SCHOOL <strong>DISTRICT</strong><br />
Indicator 04: Out-of-School Suspensions and Expulsions (2009/10 school year)<br />
A) Suspension/Expulsion<br />
Percent difference of CWD with out-of- school suspensions and<br />
expulsions totaling greater than 10 days in a school year as<br />
compared to the same data for general education students in<br />
the district.<br />
B) Suspension/Expulsion by Race and Ethnicity<br />
Percent of districts that have: (a) a significant discrepancy, by race or<br />
ethnicity, in the rate of suspensions and expulsions of greater than 10<br />
days in a school year for children with IEPs; and (b) policies,<br />
procedures or practices that contribute to the significant discrepancy<br />
and do not comply with requirements relating to the development<br />
and implementation of IEPs, the use of positive behavioral<br />
interventions and supports, and procedural safeguards.<br />
Indicator 05: School Age (5-21) Least Restrictive Environment<br />
A) In the Regular Class 80% or more of the day<br />
Percent of CWD with<br />
IEPs receiving instruction<br />
in the regular class 80%<br />
or more of the day.<br />
State<br />
Rate<br />
State<br />
Target<br />
LEA<br />
Rate<br />
B) In the Regular Class less than 40% of the day<br />
Percent of CWD with<br />
IEPs receiving instruction<br />
in the regular class less<br />
than 60% of the day.<br />
53.87% 59.77%<br />
State<br />
Rate<br />
State<br />
Target<br />
12.42% 12.51%<br />
50.21%<br />
LEA<br />
Rate<br />
21.08%<br />
C) Other Settings outside the regular class<br />
Percent of CWD with IEPs served in<br />
public or private separate schools,<br />
residential placements, or<br />
homebound/hospital placements.<br />
State<br />
Rate<br />
State<br />
Target<br />
2.80% 2.56%<br />
Target Met<br />
by LEA (Y/N)<br />
N<br />
Target Met<br />
by LEA (Y/N)<br />
N<br />
LEA<br />
Rate<br />
0.68%<br />
Target Met<br />
by LEA(Y/N)<br />
Indicator 06: Early Childhood (3-5) Least Restrictive Environment<br />
A) Regular Early Childhood Program<br />
Percent of children (aged 3 through 5) with IEPs attending a regular<br />
early childhood program and receiving the majority of special<br />
education and related services in the regular early childhood program<br />
Allowable<br />
Difference<br />
LEA: 4304 - CABOT SCHOOL <strong>DISTRICT</strong><br />
Indicator 07: Preschool (3-5) Outcomes<br />
a) Percent of preschool CWD<br />
children who did not<br />
improve functioning.<br />
b) Percent of preschool CWD<br />
who improved but whose<br />
functioning remained below<br />
same age peers.<br />
c) Percent of preschool CWD<br />
who improved at a level<br />
nearer to same aged peers.<br />
d) Percent of preschool CWD<br />
who improved functioning to<br />
reach a level comparable to<br />
same age peers.<br />
e) Percent of preschool CWD<br />
children who maintain<br />
functioning at a level<br />
comparable to same aged<br />
peers.<br />
Summary<br />
Statements<br />
1) Of those preschool<br />
children who entered<br />
the preschool program<br />
below age expectations<br />
in each Outcome, the<br />
percent who<br />
substantially increased<br />
their rate of growth by<br />
the time they turned 6<br />
years of age or exited<br />
the program.<br />
2) The percent of<br />
preschool children who<br />
were functioning<br />
within age expectations<br />
in each Outcome by the<br />
time they turned 6<br />
years of age or exited<br />
A) Positive Social -Emotional<br />
Skills*<br />
State<br />
Rate<br />
A) Positive Social -<br />
Emotional Skills<br />
(Including social<br />
relationships)<br />
State<br />
Rate<br />
2.14%<br />
5.31%<br />
25.97%<br />
38.22%<br />
28.36%<br />
State<br />
Target<br />
LEA<br />
Rate<br />
LEA<br />
Rate<br />
— —<br />
— —<br />
— —<br />
— —<br />
— —<br />
Target<br />
Met by<br />
LEA(Y/N)<br />
B) Acquisition and Use of<br />
Knowledge and Skills<br />
(Including early language/<br />
communication and early literacy)<br />
B) Acquisition and Use of<br />
Knowledge and Skills **<br />
State<br />
Rate<br />
1.75%<br />
6.59%<br />
34.23%<br />
43.51%<br />
13.92%<br />
State<br />
Target<br />
LEA<br />
Rate<br />
Target<br />
Met by<br />
LEA(Y/N)<br />
C) Use of Appropriate Behaviors<br />
to Meet Their Needs<br />
State<br />
Rate<br />
State<br />
Target<br />
LEA<br />
Rate<br />
Target<br />
Met by<br />
LEA(Y/N)<br />
89.61% 90.50% — — N/A 90.31% 90.50% — — N/A 90.82% 92.50% — — N/A<br />
66.58% 69.50% — — N/A 57.43% 60.50% — — N/A 76.69% 78.50% — — N/A<br />
NOTE: * Including social relationships ** Including early language/ communication and early literacy<br />
Note: - - denotes not applicable<br />
State<br />
Rate<br />
LEA<br />
Rate<br />
— —<br />
— —<br />
— —<br />
— —<br />
— —<br />
C) Use of<br />
Appropriate<br />
Behaviors to<br />
Meet Their Needs<br />
State<br />
Rate<br />
4.51%<br />
17.34%<br />
41.72%<br />
34.97%<br />
LEA<br />
Rate<br />
1.46% — —<br />
— —<br />
— —<br />
— —<br />
— —<br />
Page 3 of 5
LEA: 4304 - CABOT SCHOOL <strong>DISTRICT</strong><br />
Indicator 08: Parent Involvement<br />
Percent of surveyed<br />
parents who reported<br />
school facilitated parent<br />
involvement as a means<br />
of improving services<br />
and results for children<br />
with disabilities.<br />
Early Childhood<br />
(3-5)<br />
School Age<br />
(5-21)<br />
State<br />
Rate<br />
90.47%<br />
95.05%<br />
Indicator 09: Disproportionality - Eligibility<br />
Disproportionate representation of racial<br />
and ethnic groups in special education and<br />
related services that is a result of<br />
inappropriate identification (e.g.<br />
monitoring data, review of policies,<br />
practices, and procedures under 618(d),<br />
etc.).<br />
State<br />
Rate<br />
State<br />
Target<br />
88.00%<br />
96.00%<br />
State<br />
Target<br />
0.00% 0.00%<br />
LEA<br />
Rate<br />
— —<br />
94.86%<br />
Indicator 10: Disproportionality-Child with a Disability<br />
Disproportionate representation of racial<br />
and ethnic groups in specific disability<br />
categories that is a result of inappropriate<br />
identification (e.g. monitoring data, review<br />
of policies, practices, and procedures under<br />
618(d), etc.).<br />
Indicator 11: Child Find<br />
Percent of children with<br />
parental consent to evaluate<br />
who are evaluated within<br />
the State established timeline<br />
of 60 days.<br />
Overall<br />
(3-21)<br />
Early Childhood<br />
(3-5)<br />
School Age<br />
(5-21)<br />
State<br />
Rate<br />
0.00%<br />
Indicator 12: Early Childhood Transition<br />
Percent of children referred by Part C prior to<br />
age 3, who are found eligible for Part B, and<br />
who have an IEP developed and implemented<br />
by their third birthday.<br />
Note: - - denotes not applicable<br />
State<br />
Rate<br />
99.41%<br />
99.70%<br />
98.97%<br />
State<br />
Rate<br />
State<br />
Target<br />
0.00%<br />
State<br />
Target<br />
100.00%<br />
100.00%<br />
100.00%<br />
State<br />
Target<br />
Target Met by<br />
LEA (Y/N)<br />
Y<br />
Target Met by<br />
LEA (Y/N)<br />
Y<br />
LEA<br />
Rate<br />
100.00%<br />
— —<br />
100.00%<br />
LEA<br />
Rate<br />
Target Met by<br />
LEA (Y/N)<br />
N/A<br />
N<br />
Note: The target for Indicator 09 is to have zero percent<br />
(0%) of districts identified as having disproportionate<br />
representation as a result of inappropriate<br />
identification in eligibility.<br />
Note: The target for Indicator 10 is to have zero<br />
percent (0%) of districts identified as having<br />
disproportionate representation as a result of<br />
inappropriate identification in a disability<br />
category.<br />
Target Met by<br />
LEA (Y/N)<br />
N/A<br />
Y<br />
Target Met<br />
by LEA<br />
(Y/N)<br />
99.21% 100.00% - - N/A<br />
Y<br />
Note: * Indicates a zero reponse rate for the<br />
district.<br />
Page 4 of 5
LEA: 4304 - CABOT SCHOOL <strong>DISTRICT</strong><br />
Indicator 13: Secondary Transition<br />
Percent of youth with disabilities aged 16 and<br />
up with an IEP that includes coordinated,<br />
measurable, annual IEP goals and transition<br />
services that will reasonably enable the student<br />
to meet the post-secondary goals.<br />
Indicator 14: Post-School Outcomes<br />
A. Percent of youth enrolled in higher<br />
education within one year of leaving high<br />
school.<br />
State<br />
Rate<br />
State<br />
Target<br />
Note: Data for this Indicator is from the on-site monitoring of LEAs for the given year.<br />
B. Percent of youth enrolled in higher<br />
education or competitively employed<br />
within one year of leaving high school.<br />
C. Percent of youth enrolled in higher<br />
education or in some other postsecondary<br />
education or training program; or<br />
competitively employed or in some other<br />
employment within one year of leaving<br />
high school.<br />
State<br />
Rate<br />
Indicator 20: Reported Data-Timely and Accurate*<br />
District submitted<br />
required data elements<br />
on or before due dates;<br />
made revisions within<br />
the alloted reveiw<br />
periods.<br />
Accurate and Timely<br />
Data Submission<br />
Overall (3-21)<br />
Early Childhood (3-5)<br />
School Age (5-21)<br />
State<br />
Target<br />
100.00%<br />
100.00%<br />
100.00%<br />
State<br />
Target<br />
LEA<br />
Rate<br />
LEA<br />
Rate<br />
Target Met by<br />
LEA (Y/N)<br />
Target Met<br />
by LEA<br />
(Y/N)<br />
Target Met<br />
by LEA<br />
(Y/N)<br />
*Data reviewed for timely and accurate submissions included all APSCN cycle data except for personnel<br />
Note: - - denotes not applicable<br />
96.19 100.00 — — N/A<br />
14.53<br />
State<br />
Rate<br />
49.42<br />
State<br />
Rate<br />
54.07<br />
13.00<br />
State<br />
Target<br />
49.00<br />
State<br />
Target<br />
60.00<br />
Y<br />
N/A<br />
Y<br />
— —<br />
LEA<br />
Rate<br />
— —<br />
LEA<br />
Rate<br />
— —<br />
N/A<br />
Target Met<br />
by LEA<br />
(Y/N)<br />
N/A<br />
Target Met<br />
by LEA<br />
(Y/N)<br />
N/A<br />
Page 5 of 5
<strong>ARKANSAS</strong> <strong>SPECIAL</strong> <strong>EDUCATION</strong><br />
<strong>DISTRICT</strong> <strong>ANNUAL</strong> PERFORMANCE REPORT<br />
2010/11 School Year<br />
Publication Date: March 2012<br />
Each State must have in place a State Performance Plan (SPP) to evaluate the State's efforts to meet the requirements and<br />
purposes of the implementation of the Individuals with Disabilities Education Act (IDEA). The SPP is a six-year plan, which<br />
describes Arkansas's performance on 20 indicators. The Office of Special Education Programs in the U. S. Department of<br />
Education requires that States report annually to the public on the performance of each local education agency (LEA) on 14 of<br />
20 indicators as compared with targets established by the State in the SPP. Arkansas will report indicators 1 through 14 and<br />
20 for each LEA serving children with disabilities (CWD). Any LEA not meeting targets on compliance indicators (0% for<br />
Indicators 4B, 09 & 10 and 100% for Indicators 11, 12, 13, and 20) are non-compliant with IDEA.<br />
There are no report changes for the 2010/11 school year profile; However, it is important to recognize that: .<br />
1. Indicator 01 (Graduation) is reported a year in arrear (2009/10 graduates) and is based on a four-year cohort. This<br />
means the rate is a measure of students who entered in ninth grade and graduate in four years. The calculation is a<br />
requirement under Title I of the Elementary and Secondary Education Act (ESEA).<br />
2. Indicator 02 (Drop out) is reported a year in arrear. This means the rate is a measure of students who dropped out in<br />
the 2009/10 school year. The Indicator 02 data are aligned with the Common Core of Data (CCD) requirements for<br />
grades 7-12.<br />
3. Indicator 04A and 4B (Suspension/Expulsion) is reported a year in arrear. This means the rate is a measure of<br />
students who had out-of-school suspensions and/or expulsions totaling more than 10 days.<br />
For a complete description of all the Indicators, please visit the special education website at<br />
http://arksped.k12.ar.us/sections/policy.html<br />
LEA: 4401 - HUNTSVILLE SCHOOL <strong>DISTRICT</strong><br />
Indicator 01: Graduation Rates (2009/10 school year) Indicator 02: Dropout Rates (2009/10 school year)<br />
Percent of youth<br />
with IEPs<br />
graduating from<br />
high school with a<br />
regular diploma<br />
State<br />
Rate<br />
State<br />
Target<br />
75.76% 85.00%<br />
LEA<br />
Rate<br />
81.82%<br />
Target Met<br />
by LEA<br />
(Y/N)<br />
N<br />
Percent of<br />
youth with<br />
IEPs dropping<br />
out of high<br />
school<br />
State<br />
Rate<br />
Indicator 03: Assessment on Statewide Benchmark Exam (grades 3-8, 11)<br />
A) Adequate Yearly Progress<br />
n=40<br />
Literacy<br />
Mathematics<br />
Met Disability Subgroup "n"<br />
for Reporting Purposes (Y/N)<br />
State Target for % of Districts Meeting<br />
AYP for Disability Subgroup<br />
State<br />
Target<br />
3.06% 4.20%<br />
LEA<br />
Rate<br />
2.46%<br />
% of Districts Meeting AYP<br />
for Disability Subgroup<br />
Target Met by<br />
LEA (Y/N)<br />
Y<br />
Target Met by<br />
LEA(Y/N)<br />
Overall N 17.15% 6.25%<br />
NA<br />
N<br />
N<br />
Note: For a district to qualify as having a disability subgroup it must have a minimum of 40 (n=40) students with disabilities in a school building.<br />
B) Participation<br />
Participation Rate: # of<br />
CWD Tested ÷ # of CWD<br />
Enrolled in grades tested.<br />
Participation Rate: Literacy<br />
Participation Rate: Math<br />
Note: - - denotes not applicable<br />
State<br />
Rate<br />
98.78%<br />
State<br />
Target<br />
95.00%<br />
LEA<br />
Rate<br />
100.00%<br />
Target Met<br />
by LEA (Y/N)<br />
98.61% 95.00% 100.00% Y<br />
Y<br />
C) Performance Proficiency<br />
Percent of CWD Scoring<br />
Proficient or Above<br />
Proficiency Rate: Literacy<br />
Proficiency Rate:<br />
Mathematics<br />
16.00%<br />
16.00%<br />
State<br />
Rate<br />
31.49%<br />
44.86%<br />
State<br />
Target<br />
45.22%<br />
51.14%<br />
LEA<br />
Rate<br />
38.68%<br />
44.14%<br />
NA<br />
NA<br />
Target<br />
Met by<br />
LEA (Y/N)<br />
N<br />
N<br />
Page 1 of 5
LEA: 4401 - HUNTSVILLE SCHOOL <strong>DISTRICT</strong><br />
Indicator 04: Out-of-School Suspensions and Expulsions (2009/10 school year)<br />
A) Suspension/Expulsion<br />
Percent difference of CWD with out-of- school suspensions and<br />
expulsions totaling greater than 10 days in a school year as<br />
compared to the same data for general education students in<br />
the district.<br />
B) Suspension/Expulsion by Race and Ethnicity<br />
Percent of districts that have: (a) a significant discrepancy, by race or<br />
ethnicity, in the rate of suspensions and expulsions of greater than 10<br />
days in a school year for children with IEPs; and (b) policies,<br />
procedures or practices that contribute to the significant discrepancy<br />
and do not comply with requirements relating to the development<br />
and implementation of IEPs, the use of positive behavioral<br />
interventions and supports, and procedural safeguards.<br />
Indicator 05: School Age (5-21) Least Restrictive Environment<br />
A) In the Regular Class 80% or more of the day<br />
Percent of CWD with<br />
IEPs receiving instruction<br />
in the regular class 80%<br />
or more of the day.<br />
State<br />
Rate<br />
State<br />
Target<br />
LEA<br />
Rate<br />
B) In the Regular Class less than 40% of the day<br />
Percent of CWD with<br />
IEPs receiving instruction<br />
in the regular class less<br />
than 60% of the day.<br />
53.87% 59.77%<br />
State<br />
Rate<br />
State<br />
Target<br />
12.42% 12.51%<br />
64.00%<br />
LEA<br />
Rate<br />
13.33%<br />
C) Other Settings outside the regular class<br />
Percent of CWD with IEPs served in<br />
public or private separate schools,<br />
residential placements, or<br />
homebound/hospital placements.<br />
State<br />
Rate<br />
State<br />
Target<br />
2.80% 2.56%<br />
Target Met<br />
by LEA (Y/N)<br />
Y<br />
Target Met<br />
by LEA (Y/N)<br />
N<br />
LEA<br />
Rate<br />
2.67%<br />
Target Met<br />
by LEA(Y/N)<br />
Indicator 06: Early Childhood (3-5) Least Restrictive Environment<br />
A) Regular Early Childhood Program<br />
Percent of children (aged 3 through 5) with IEPs attending a regular<br />
early childhood program and receiving the majority of special<br />
education and related services in the regular early childhood program<br />
Allowable<br />
Difference<br />
LEA: 4401 - HUNTSVILLE SCHOOL <strong>DISTRICT</strong><br />
Indicator 07: Preschool (3-5) Outcomes<br />
a) Percent of preschool CWD<br />
children who did not<br />
improve functioning.<br />
b) Percent of preschool CWD<br />
who improved but whose<br />
functioning remained below<br />
same age peers.<br />
c) Percent of preschool CWD<br />
who improved at a level<br />
nearer to same aged peers.<br />
d) Percent of preschool CWD<br />
who improved functioning to<br />
reach a level comparable to<br />
same age peers.<br />
e) Percent of preschool CWD<br />
children who maintain<br />
functioning at a level<br />
comparable to same aged<br />
peers.<br />
Summary<br />
Statements<br />
1) Of those preschool<br />
children who entered<br />
the preschool program<br />
below age expectations<br />
in each Outcome, the<br />
percent who<br />
substantially increased<br />
their rate of growth by<br />
the time they turned 6<br />
years of age or exited<br />
the program.<br />
2) The percent of<br />
preschool children who<br />
were functioning<br />
within age expectations<br />
in each Outcome by the<br />
time they turned 6<br />
years of age or exited<br />
A) Positive Social -Emotional<br />
Skills*<br />
State<br />
Rate<br />
A) Positive Social -<br />
Emotional Skills<br />
(Including social<br />
relationships)<br />
State<br />
Rate<br />
2.14%<br />
5.31%<br />
25.97%<br />
38.22%<br />
28.36%<br />
State<br />
Target<br />
LEA<br />
Rate<br />
LEA<br />
Rate<br />
— —<br />
— —<br />
— —<br />
— —<br />
— —<br />
Target<br />
Met by<br />
LEA(Y/N)<br />
B) Acquisition and Use of<br />
Knowledge and Skills<br />
(Including early language/<br />
communication and early literacy)<br />
B) Acquisition and Use of<br />
Knowledge and Skills **<br />
State<br />
Rate<br />
1.75%<br />
6.59%<br />
34.23%<br />
43.51%<br />
13.92%<br />
State<br />
Target<br />
LEA<br />
Rate<br />
Target<br />
Met by<br />
LEA(Y/N)<br />
C) Use of Appropriate Behaviors<br />
to Meet Their Needs<br />
State<br />
Rate<br />
State<br />
Target<br />
LEA<br />
Rate<br />
Target<br />
Met by<br />
LEA(Y/N)<br />
89.61% 90.50% — — N/A 90.31% 90.50% — — N/A 90.82% 92.50% — — N/A<br />
66.58% 69.50% — — N/A 57.43% 60.50% — — N/A 76.69% 78.50% — — N/A<br />
NOTE: * Including social relationships ** Including early language/ communication and early literacy<br />
Note: - - denotes not applicable<br />
State<br />
Rate<br />
LEA<br />
Rate<br />
— —<br />
— —<br />
— —<br />
— —<br />
— —<br />
C) Use of<br />
Appropriate<br />
Behaviors to<br />
Meet Their Needs<br />
State<br />
Rate<br />
4.51%<br />
17.34%<br />
41.72%<br />
34.97%<br />
LEA<br />
Rate<br />
1.46% — —<br />
— —<br />
— —<br />
— —<br />
— —<br />
Page 3 of 5
LEA: 4401 - HUNTSVILLE SCHOOL <strong>DISTRICT</strong><br />
Indicator 08: Parent Involvement<br />
Percent of surveyed<br />
parents who reported<br />
school facilitated parent<br />
involvement as a means<br />
of improving services<br />
and results for children<br />
with disabilities.<br />
Early Childhood<br />
(3-5)<br />
School Age<br />
(5-21)<br />
State<br />
Rate<br />
90.47%<br />
95.05%<br />
Indicator 09: Disproportionality - Eligibility<br />
Disproportionate representation of racial<br />
and ethnic groups in special education and<br />
related services that is a result of<br />
inappropriate identification (e.g.<br />
monitoring data, review of policies,<br />
practices, and procedures under 618(d),<br />
etc.).<br />
State<br />
Rate<br />
State<br />
Target<br />
88.00%<br />
96.00%<br />
State<br />
Target<br />
0.00% 0.00%<br />
LEA<br />
Rate<br />
— —<br />
— —<br />
Indicator 10: Disproportionality-Child with a Disability<br />
Disproportionate representation of racial<br />
and ethnic groups in specific disability<br />
categories that is a result of inappropriate<br />
identification (e.g. monitoring data, review<br />
of policies, practices, and procedures under<br />
618(d), etc.).<br />
Indicator 11: Child Find<br />
Percent of children with<br />
parental consent to evaluate<br />
who are evaluated within<br />
the State established timeline<br />
of 60 days.<br />
Overall<br />
(3-21)<br />
Early Childhood<br />
(3-5)<br />
School Age<br />
(5-21)<br />
State<br />
Rate<br />
0.00%<br />
Indicator 12: Early Childhood Transition<br />
Percent of children referred by Part C prior to<br />
age 3, who are found eligible for Part B, and<br />
who have an IEP developed and implemented<br />
by their third birthday.<br />
Note: - - denotes not applicable<br />
State<br />
Rate<br />
99.41%<br />
99.70%<br />
98.97%<br />
State<br />
Rate<br />
State<br />
Target<br />
0.00%<br />
State<br />
Target<br />
100.00%<br />
100.00%<br />
100.00%<br />
State<br />
Target<br />
Target Met by<br />
LEA (Y/N)<br />
Y<br />
Target Met by<br />
LEA (Y/N)<br />
Y<br />
LEA<br />
Rate<br />
100.00%<br />
— —<br />
100.00%<br />
LEA<br />
Rate<br />
Target Met by<br />
LEA (Y/N)<br />
N/A<br />
N<br />
Note: The target for Indicator 09 is to have zero percent<br />
(0%) of districts identified as having disproportionate<br />
representation as a result of inappropriate<br />
identification in eligibility.<br />
Note: The target for Indicator 10 is to have zero<br />
percent (0%) of districts identified as having<br />
disproportionate representation as a result of<br />
inappropriate identification in a disability<br />
category.<br />
Target Met by<br />
LEA (Y/N)<br />
N/A<br />
Y<br />
Target Met<br />
by LEA<br />
(Y/N)<br />
99.21% 100.00% - - N/A<br />
Y<br />
Note: * Indicates a zero reponse rate for the<br />
district.<br />
Page 4 of 5
LEA: 4401 - HUNTSVILLE SCHOOL <strong>DISTRICT</strong><br />
Indicator 13: Secondary Transition<br />
Percent of youth with disabilities aged 16 and<br />
up with an IEP that includes coordinated,<br />
measurable, annual IEP goals and transition<br />
services that will reasonably enable the student<br />
to meet the post-secondary goals.<br />
Indicator 14: Post-School Outcomes<br />
A. Percent of youth enrolled in higher<br />
education within one year of leaving high<br />
school.<br />
State<br />
Rate<br />
State<br />
Target<br />
Note: Data for this Indicator is from the on-site monitoring of LEAs for the given year.<br />
B. Percent of youth enrolled in higher<br />
education or competitively employed<br />
within one year of leaving high school.<br />
C. Percent of youth enrolled in higher<br />
education or in some other postsecondary<br />
education or training program; or<br />
competitively employed or in some other<br />
employment within one year of leaving<br />
high school.<br />
State<br />
Rate<br />
Indicator 20: Reported Data-Timely and Accurate*<br />
District submitted<br />
required data elements<br />
on or before due dates;<br />
made revisions within<br />
the alloted reveiw<br />
periods.<br />
Accurate and Timely<br />
Data Submission<br />
Overall (3-21)<br />
Early Childhood (3-5)<br />
School Age (5-21)<br />
State<br />
Target<br />
100.00%<br />
100.00%<br />
100.00%<br />
State<br />
Target<br />
LEA<br />
Rate<br />
LEA<br />
Rate<br />
Target Met by<br />
LEA (Y/N)<br />
Target Met<br />
by LEA<br />
(Y/N)<br />
Target Met<br />
by LEA<br />
(Y/N)<br />
*Data reviewed for timely and accurate submissions included all APSCN cycle data except for personnel<br />
Note: - - denotes not applicable<br />
96.19 100.00 — — N/A<br />
14.53<br />
State<br />
Rate<br />
49.42<br />
State<br />
Rate<br />
54.07<br />
13.00<br />
State<br />
Target<br />
49.00<br />
State<br />
Target<br />
60.00<br />
Y<br />
N/A<br />
Y<br />
0.00%<br />
LEA<br />
Rate<br />
41.67%<br />
LEA<br />
Rate<br />
41.67%<br />
N<br />
Target Met<br />
by LEA<br />
(Y/N)<br />
N<br />
Target Met<br />
by LEA<br />
(Y/N)<br />
N<br />
Page 5 of 5
LEA: 4501 - FLIPPIN SCHOOL <strong>DISTRICT</strong><br />
<strong>ARKANSAS</strong> <strong>SPECIAL</strong> <strong>EDUCATION</strong><br />
<strong>DISTRICT</strong> <strong>ANNUAL</strong> PERFORMANCE REPORT<br />
2010/11 School Year<br />
Publication Date: March 2012<br />
Each State must have in place a State Performance Plan (SPP) to evaluate the State's efforts to meet the requirements and<br />
purposes of the implementation of the Individuals with Disabilities Education Act (IDEA). The SPP is a six-year plan, which<br />
describes Arkansas's performance on 20 indicators. The Office of Special Education Programs in the U. S. Department of<br />
Education requires that States report annually to the public on the performance of each local education agency (LEA) on 14 of<br />
20 indicators as compared with targets established by the State in the SPP. Arkansas will report indicators 1 through 14 and<br />
20 for each LEA serving children with disabilities (CWD). Any LEA not meeting targets on compliance indicators (0% for<br />
Indicators 4B, 09 & 10 and 100% for Indicators 11, 12, 13, and 20) are non-compliant with IDEA.<br />
There are no report changes for the 2010/11 school year profile; However, it is important to recognize that: .<br />
1. Indicator 01 (Graduation) is reported a year in arrear (2009/10 graduates) and is based on a four-year cohort. This<br />
means the rate is a measure of students who entered in ninth grade and graduate in four years. The calculation is a<br />
requirement under Title I of the Elementary and Secondary Education Act (ESEA).<br />
2. Indicator 02 (Drop out) is reported a year in arrear. This means the rate is a measure of students who dropped out in<br />
the 2009/10 school year. The Indicator 02 data are aligned with the Common Core of Data (CCD) requirements for<br />
grades 7-12.<br />
3. Indicator 04A and 4B (Suspension/Expulsion) is reported a year in arrear. This means the rate is a measure of<br />
students who had out-of-school suspensions and/or expulsions totaling more than 10 days.<br />
Percent of youth<br />
with IEPs<br />
graduating from<br />
high school with a<br />
regular diploma<br />
For a complete description of all the Indicators, please visit the special education website at<br />
http://arksped.k12.ar.us/sections/policy.html<br />
Indicator 01: Graduation Rates (2009/10 school year) Indicator 02: Dropout Rates (2009/10 school year)<br />
State<br />
Rate<br />
State<br />
Target<br />
75.76% 85.00%<br />
LEA<br />
Rate<br />
80.00%<br />
Target Met<br />
by LEA<br />
(Y/N)<br />
N<br />
Percent of<br />
youth with<br />
IEPs dropping<br />
out of high<br />
school<br />
State<br />
Rate<br />
Indicator 03: Assessment on Statewide Benchmark Exam (grades 3-8, 11)<br />
A) Adequate Yearly Progress<br />
n=40<br />
Literacy<br />
Mathematics<br />
Met Disability Subgroup "n"<br />
for Reporting Purposes (Y/N)<br />
State Target for % of Districts Meeting<br />
AYP for Disability Subgroup<br />
State<br />
Target<br />
3.06% 4.20%<br />
LEA<br />
Rate<br />
4.17%<br />
% of Districts Meeting AYP<br />
for Disability Subgroup<br />
Target Met by<br />
LEA (Y/N)<br />
Y<br />
Target Met by<br />
LEA(Y/N)<br />
Overall N 17.15% 6.25%<br />
NA<br />
N<br />
N<br />
Note: For a district to qualify as having a disability subgroup it must have a minimum of 40 (n=40) students with disabilities in a school building.<br />
B) Participation<br />
Participation Rate: # of<br />
CWD Tested ÷ # of CWD<br />
Enrolled in grades tested.<br />
Participation Rate: Literacy<br />
Participation Rate: Math<br />
Note: - - denotes not applicable<br />
State<br />
Rate<br />
98.78%<br />
State<br />
Target<br />
95.00%<br />
LEA<br />
Rate<br />
96.00%<br />
Target Met<br />
by LEA (Y/N)<br />
98.61% 95.00% 98.08% Y<br />
Y<br />
C) Performance Proficiency<br />
Percent of CWD Scoring<br />
Proficient or Above<br />
Proficiency Rate: Literacy<br />
Proficiency Rate:<br />
Mathematics<br />
16.00%<br />
16.00%<br />
State<br />
Rate<br />
31.49%<br />
44.86%<br />
State<br />
Target<br />
45.22%<br />
51.14%<br />
LEA<br />
Rate<br />
40.43%<br />
57.14%<br />
NA<br />
NA<br />
Target<br />
Met by<br />
LEA (Y/N)<br />
N<br />
Y<br />
Page 1 of 5
LEA: 4501 - FLIPPIN SCHOOL <strong>DISTRICT</strong><br />
Indicator 04: Out-of-School Suspensions and Expulsions (2009/10 school year)<br />
A) Suspension/Expulsion<br />
Percent difference of CWD with out-of- school suspensions and<br />
expulsions totaling greater than 10 days in a school year as<br />
compared to the same data for general education students in<br />
the district.<br />
B) Suspension/Expulsion by Race and Ethnicity<br />
Percent of districts that have: (a) a significant discrepancy, by race or<br />
ethnicity, in the rate of suspensions and expulsions of greater than 10<br />
days in a school year for children with IEPs; and (b) policies,<br />
procedures or practices that contribute to the significant discrepancy<br />
and do not comply with requirements relating to the development<br />
and implementation of IEPs, the use of positive behavioral<br />
interventions and supports, and procedural safeguards.<br />
Indicator 05: School Age (5-21) Least Restrictive Environment<br />
A) In the Regular Class 80% or more of the day<br />
Percent of CWD with<br />
IEPs receiving instruction<br />
in the regular class 80%<br />
or more of the day.<br />
State<br />
Rate<br />
State<br />
Target<br />
LEA<br />
Rate<br />
B) In the Regular Class less than 40% of the day<br />
Percent of CWD with<br />
IEPs receiving instruction<br />
in the regular class less<br />
than 60% of the day.<br />
53.87% 59.77%<br />
State<br />
Rate<br />
State<br />
Target<br />
12.42% 12.51%<br />
70.75%<br />
LEA<br />
Rate<br />
13.21%<br />
C) Other Settings outside the regular class<br />
Percent of CWD with IEPs served in<br />
public or private separate schools,<br />
residential placements, or<br />
homebound/hospital placements.<br />
State<br />
Rate<br />
State<br />
Target<br />
2.80% 2.56%<br />
Target Met<br />
by LEA (Y/N)<br />
Y<br />
Target Met<br />
by LEA (Y/N)<br />
N<br />
LEA<br />
Rate<br />
0.94%<br />
Target Met<br />
by LEA(Y/N)<br />
Indicator 06: Early Childhood (3-5) Least Restrictive Environment<br />
A) Regular Early Childhood Program<br />
Percent of children (aged 3 through 5) with IEPs attending a regular<br />
early childhood program and receiving the majority of special<br />
education and related services in the regular early childhood program<br />
Allowable<br />
Difference<br />
LEA: 4501 - FLIPPIN SCHOOL <strong>DISTRICT</strong><br />
Indicator 07: Preschool (3-5) Outcomes<br />
a) Percent of preschool CWD<br />
children who did not<br />
improve functioning.<br />
b) Percent of preschool CWD<br />
who improved but whose<br />
functioning remained below<br />
same age peers.<br />
c) Percent of preschool CWD<br />
who improved at a level<br />
nearer to same aged peers.<br />
d) Percent of preschool CWD<br />
who improved functioning to<br />
reach a level comparable to<br />
same age peers.<br />
e) Percent of preschool CWD<br />
children who maintain<br />
functioning at a level<br />
comparable to same aged<br />
peers.<br />
Summary<br />
Statements<br />
1) Of those preschool<br />
children who entered<br />
the preschool program<br />
below age expectations<br />
in each Outcome, the<br />
percent who<br />
substantially increased<br />
their rate of growth by<br />
the time they turned 6<br />
years of age or exited<br />
the program.<br />
2) The percent of<br />
preschool children who<br />
were functioning<br />
within age expectations<br />
in each Outcome by the<br />
time they turned 6<br />
years of age or exited<br />
A) Positive Social -Emotional<br />
Skills*<br />
State<br />
Rate<br />
A) Positive Social -<br />
Emotional Skills<br />
(Including social<br />
relationships)<br />
State<br />
Rate<br />
2.14%<br />
5.31%<br />
25.97%<br />
38.22%<br />
28.36%<br />
State<br />
Target<br />
LEA<br />
Rate<br />
LEA<br />
Rate<br />
— —<br />
— —<br />
40.00%<br />
40.00%<br />
20.00%<br />
Target<br />
Met by<br />
LEA(Y/N)<br />
B) Acquisition and Use of<br />
Knowledge and Skills<br />
(Including early language/<br />
communication and early literacy)<br />
B) Acquisition and Use of<br />
Knowledge and Skills **<br />
State<br />
Rate<br />
1.75%<br />
6.59%<br />
34.23%<br />
43.51%<br />
13.92%<br />
State<br />
Target<br />
LEA<br />
Rate<br />
Target<br />
Met by<br />
LEA(Y/N)<br />
C) Use of Appropriate Behaviors<br />
to Meet Their Needs<br />
State<br />
Rate<br />
State<br />
Target<br />
LEA<br />
Rate<br />
Target<br />
Met by<br />
LEA(Y/N)<br />
89.61% 90.50% 100.00% Y 90.31% 90.50% 75.00% N 90.82% 92.50% 75.00% N<br />
66.58% 69.50% 60.00% N 57.43% 60.50% 60.00% N 76.69% 78.50% 60.00% N<br />
NOTE: * Including social relationships ** Including early language/ communication and early literacy<br />
Note: - - denotes not applicable<br />
State<br />
Rate<br />
LEA<br />
Rate<br />
— —<br />
20.00%<br />
20.00%<br />
40.00%<br />
20.00%<br />
C) Use of<br />
Appropriate<br />
Behaviors to<br />
Meet Their Needs<br />
State<br />
Rate<br />
4.51%<br />
17.34%<br />
41.72%<br />
34.97%<br />
LEA<br />
Rate<br />
1.46% — —<br />
20.00%<br />
20.00%<br />
40.00%<br />
20.00%<br />
Page 3 of 5
LEA: 4501 - FLIPPIN SCHOOL <strong>DISTRICT</strong><br />
Indicator 08: Parent Involvement<br />
Percent of surveyed<br />
parents who reported<br />
school facilitated parent<br />
involvement as a means<br />
of improving services<br />
and results for children<br />
with disabilities.<br />
Early Childhood<br />
(3-5)<br />
School Age<br />
(5-21)<br />
State<br />
Rate<br />
90.47%<br />
95.05%<br />
Indicator 09: Disproportionality - Eligibility<br />
Disproportionate representation of racial<br />
and ethnic groups in special education and<br />
related services that is a result of<br />
inappropriate identification (e.g.<br />
monitoring data, review of policies,<br />
practices, and procedures under 618(d),<br />
etc.).<br />
State<br />
Rate<br />
State<br />
Target<br />
88.00%<br />
96.00%<br />
State<br />
Target<br />
0.00% 0.00%<br />
LEA<br />
Rate<br />
100.00%<br />
97.22%<br />
Indicator 10: Disproportionality-Child with a Disability<br />
Disproportionate representation of racial<br />
and ethnic groups in specific disability<br />
categories that is a result of inappropriate<br />
identification (e.g. monitoring data, review<br />
of policies, practices, and procedures under<br />
618(d), etc.).<br />
Indicator 11: Child Find<br />
Percent of children with<br />
parental consent to evaluate<br />
who are evaluated within<br />
the State established timeline<br />
of 60 days.<br />
Overall<br />
(3-21)<br />
Early Childhood<br />
(3-5)<br />
School Age<br />
(5-21)<br />
State<br />
Rate<br />
0.00%<br />
Indicator 12: Early Childhood Transition<br />
Percent of children referred by Part C prior to<br />
age 3, who are found eligible for Part B, and<br />
who have an IEP developed and implemented<br />
by their third birthday.<br />
Note: - - denotes not applicable<br />
State<br />
Rate<br />
99.41%<br />
99.70%<br />
98.97%<br />
State<br />
Rate<br />
State<br />
Target<br />
0.00%<br />
State<br />
Target<br />
100.00%<br />
100.00%<br />
100.00%<br />
State<br />
Target<br />
Target Met by<br />
LEA (Y/N)<br />
Y<br />
Target Met by<br />
LEA (Y/N)<br />
Y<br />
LEA<br />
Rate<br />
100.00%<br />
100.00%<br />
100.00%<br />
LEA<br />
Rate<br />
Target Met by<br />
LEA (Y/N)<br />
Y<br />
Y<br />
Note: The target for Indicator 09 is to have zero percent<br />
(0%) of districts identified as having disproportionate<br />
representation as a result of inappropriate<br />
identification in eligibility.<br />
Note: The target for Indicator 10 is to have zero<br />
percent (0%) of districts identified as having<br />
disproportionate representation as a result of<br />
inappropriate identification in a disability<br />
category.<br />
Target Met by<br />
LEA (Y/N)<br />
Y<br />
Y<br />
Target Met<br />
by LEA<br />
(Y/N)<br />
99.21% 100.00% - - N/A<br />
Y<br />
Note: * Indicates a zero reponse rate for the<br />
district.<br />
Page 4 of 5
LEA: 4501 - FLIPPIN SCHOOL <strong>DISTRICT</strong><br />
Indicator 13: Secondary Transition<br />
Percent of youth with disabilities aged 16 and<br />
up with an IEP that includes coordinated,<br />
measurable, annual IEP goals and transition<br />
services that will reasonably enable the student<br />
to meet the post-secondary goals.<br />
Indicator 14: Post-School Outcomes<br />
A. Percent of youth enrolled in higher<br />
education within one year of leaving high<br />
school.<br />
State<br />
Rate<br />
State<br />
Target<br />
Note: Data for this Indicator is from the on-site monitoring of LEAs for the given year.<br />
B. Percent of youth enrolled in higher<br />
education or competitively employed<br />
within one year of leaving high school.<br />
C. Percent of youth enrolled in higher<br />
education or in some other postsecondary<br />
education or training program; or<br />
competitively employed or in some other<br />
employment within one year of leaving<br />
high school.<br />
State<br />
Rate<br />
Indicator 20: Reported Data-Timely and Accurate*<br />
District submitted<br />
required data elements<br />
on or before due dates;<br />
made revisions within<br />
the alloted reveiw<br />
periods.<br />
Accurate and Timely<br />
Data Submission<br />
Overall (3-21)<br />
Early Childhood (3-5)<br />
School Age (5-21)<br />
State<br />
Target<br />
100.00%<br />
100.00%<br />
100.00%<br />
State<br />
Target<br />
LEA<br />
Rate<br />
LEA<br />
Rate<br />
Target Met by<br />
LEA (Y/N)<br />
Target Met<br />
by LEA<br />
(Y/N)<br />
Target Met<br />
by LEA<br />
(Y/N)<br />
*Data reviewed for timely and accurate submissions included all APSCN cycle data except for personnel<br />
Note: - - denotes not applicable<br />
96.19 100.00 100.00% Y<br />
14.53<br />
State<br />
Rate<br />
49.42<br />
State<br />
Rate<br />
54.07<br />
13.00<br />
State<br />
Target<br />
49.00<br />
State<br />
Target<br />
60.00<br />
Y<br />
Y<br />
Y<br />
— —<br />
LEA<br />
Rate<br />
— —<br />
LEA<br />
Rate<br />
— —<br />
N/A<br />
Target Met<br />
by LEA<br />
(Y/N)<br />
N/A<br />
Target Met<br />
by LEA<br />
(Y/N)<br />
N/A<br />
Page 5 of 5
<strong>ARKANSAS</strong> <strong>SPECIAL</strong> <strong>EDUCATION</strong><br />
<strong>DISTRICT</strong> <strong>ANNUAL</strong> PERFORMANCE REPORT<br />
2010/11 School Year<br />
Publication Date: March 2012<br />
Each State must have in place a State Performance Plan (SPP) to evaluate the State's efforts to meet the requirements and<br />
purposes of the implementation of the Individuals with Disabilities Education Act (IDEA). The SPP is a six-year plan, which<br />
describes Arkansas's performance on 20 indicators. The Office of Special Education Programs in the U. S. Department of<br />
Education requires that States report annually to the public on the performance of each local education agency (LEA) on 14 of<br />
20 indicators as compared with targets established by the State in the SPP. Arkansas will report indicators 1 through 14 and<br />
20 for each LEA serving children with disabilities (CWD). Any LEA not meeting targets on compliance indicators (0% for<br />
Indicators 4B, 09 & 10 and 100% for Indicators 11, 12, 13, and 20) are non-compliant with IDEA.<br />
There are no report changes for the 2010/11 school year profile; However, it is important to recognize that: .<br />
1. Indicator 01 (Graduation) is reported a year in arrear (2009/10 graduates) and is based on a four-year cohort. This<br />
means the rate is a measure of students who entered in ninth grade and graduate in four years. The calculation is a<br />
requirement under Title I of the Elementary and Secondary Education Act (ESEA).<br />
2. Indicator 02 (Drop out) is reported a year in arrear. This means the rate is a measure of students who dropped out in<br />
the 2009/10 school year. The Indicator 02 data are aligned with the Common Core of Data (CCD) requirements for<br />
grades 7-12.<br />
3. Indicator 04A and 4B (Suspension/Expulsion) is reported a year in arrear. This means the rate is a measure of<br />
students who had out-of-school suspensions and/or expulsions totaling more than 10 days.<br />
For a complete description of all the Indicators, please visit the special education website at<br />
http://arksped.k12.ar.us/sections/policy.html<br />
LEA: 4502 - YELLVILLE-SUMMIT SCHOOL <strong>DISTRICT</strong><br />
Indicator 01: Graduation Rates (2009/10 school year) Indicator 02: Dropout Rates (2009/10 school year)<br />
Percent of youth<br />
with IEPs<br />
graduating from<br />
high school with a<br />
regular diploma<br />
State<br />
Rate<br />
State<br />
Target<br />
75.76% 85.00%<br />
LEA<br />
Rate<br />
100.00%<br />
Target Met<br />
by LEA<br />
(Y/N)<br />
Y<br />
Percent of<br />
youth with<br />
IEPs dropping<br />
out of high<br />
school<br />
State<br />
Rate<br />
Indicator 03: Assessment on Statewide Benchmark Exam (grades 3-8, 11)<br />
A) Adequate Yearly Progress<br />
n=40<br />
Literacy<br />
Mathematics<br />
Met Disability Subgroup "n"<br />
for Reporting Purposes (Y/N)<br />
State Target for % of Districts Meeting<br />
AYP for Disability Subgroup<br />
State<br />
Target<br />
3.06% 4.20%<br />
LEA<br />
Rate<br />
0.00%<br />
% of Districts Meeting AYP<br />
for Disability Subgroup<br />
Target Met by<br />
LEA (Y/N)<br />
Y<br />
Target Met by<br />
LEA(Y/N)<br />
Overall N 17.15% 6.25%<br />
NA<br />
N<br />
N<br />
Note: For a district to qualify as having a disability subgroup it must have a minimum of 40 (n=40) students with disabilities in a school building.<br />
B) Participation<br />
Participation Rate: # of<br />
CWD Tested ÷ # of CWD<br />
Enrolled in grades tested.<br />
Participation Rate: Literacy<br />
Participation Rate: Math<br />
Note: - - denotes not applicable<br />
State<br />
Rate<br />
98.78%<br />
State<br />
Target<br />
95.00%<br />
LEA<br />
Rate<br />
100.00%<br />
Target Met<br />
by LEA (Y/N)<br />
98.61% 95.00% 100.00% Y<br />
Y<br />
C) Performance Proficiency<br />
Percent of CWD Scoring<br />
Proficient or Above<br />
Proficiency Rate: Literacy<br />
Proficiency Rate:<br />
Mathematics<br />
16.00%<br />
16.00%<br />
State<br />
Rate<br />
31.49%<br />
44.86%<br />
State<br />
Target<br />
45.22%<br />
51.14%<br />
LEA<br />
Rate<br />
25.40%<br />
31.51%<br />
NA<br />
NA<br />
Target<br />
Met by<br />
LEA (Y/N)<br />
N<br />
N<br />
Page 1 of 5
LEA: 4502 - YELLVILLE-SUMMIT SCHOOL <strong>DISTRICT</strong><br />
Indicator 04: Out-of-School Suspensions and Expulsions (2009/10 school year)<br />
A) Suspension/Expulsion<br />
Percent difference of CWD with out-of- school suspensions and<br />
expulsions totaling greater than 10 days in a school year as<br />
compared to the same data for general education students in<br />
the district.<br />
B) Suspension/Expulsion by Race and Ethnicity<br />
Percent of districts that have: (a) a significant discrepancy, by race or<br />
ethnicity, in the rate of suspensions and expulsions of greater than 10<br />
days in a school year for children with IEPs; and (b) policies,<br />
procedures or practices that contribute to the significant discrepancy<br />
and do not comply with requirements relating to the development<br />
and implementation of IEPs, the use of positive behavioral<br />
interventions and supports, and procedural safeguards.<br />
Indicator 05: School Age (5-21) Least Restrictive Environment<br />
A) In the Regular Class 80% or more of the day<br />
Percent of CWD with<br />
IEPs receiving instruction<br />
in the regular class 80%<br />
or more of the day.<br />
State<br />
Rate<br />
State<br />
Target<br />
LEA<br />
Rate<br />
B) In the Regular Class less than 40% of the day<br />
Percent of CWD with<br />
IEPs receiving instruction<br />
in the regular class less<br />
than 60% of the day.<br />
53.87% 59.77%<br />
State<br />
Rate<br />
State<br />
Target<br />
12.42% 12.51%<br />
45.45%<br />
LEA<br />
Rate<br />
6.82%<br />
C) Other Settings outside the regular class<br />
Percent of CWD with IEPs served in<br />
public or private separate schools,<br />
residential placements, or<br />
homebound/hospital placements.<br />
State<br />
Rate<br />
State<br />
Target<br />
2.80% 2.56%<br />
Target Met<br />
by LEA (Y/N)<br />
N<br />
Target Met<br />
by LEA (Y/N)<br />
Y<br />
LEA<br />
Rate<br />
0.00%<br />
Target Met<br />
by LEA(Y/N)<br />
Indicator 06: Early Childhood (3-5) Least Restrictive Environment<br />
A) Regular Early Childhood Program<br />
Percent of children (aged 3 through 5) with IEPs attending a regular<br />
early childhood program and receiving the majority of special<br />
education and related services in the regular early childhood program<br />
Allowable<br />
Difference<br />
LEA: 4502 - YELLVILLE-SUMMIT SCHOOL <strong>DISTRICT</strong><br />
Indicator 07: Preschool (3-5) Outcomes<br />
a) Percent of preschool CWD<br />
children who did not<br />
improve functioning.<br />
b) Percent of preschool CWD<br />
who improved but whose<br />
functioning remained below<br />
same age peers.<br />
c) Percent of preschool CWD<br />
who improved at a level<br />
nearer to same aged peers.<br />
d) Percent of preschool CWD<br />
who improved functioning to<br />
reach a level comparable to<br />
same age peers.<br />
e) Percent of preschool CWD<br />
children who maintain<br />
functioning at a level<br />
comparable to same aged<br />
peers.<br />
Summary<br />
Statements<br />
1) Of those preschool<br />
children who entered<br />
the preschool program<br />
below age expectations<br />
in each Outcome, the<br />
percent who<br />
substantially increased<br />
their rate of growth by<br />
the time they turned 6<br />
years of age or exited<br />
the program.<br />
2) The percent of<br />
preschool children who<br />
were functioning<br />
within age expectations<br />
in each Outcome by the<br />
time they turned 6<br />
years of age or exited<br />
A) Positive Social -Emotional<br />
Skills*<br />
State<br />
Rate<br />
A) Positive Social -<br />
Emotional Skills<br />
(Including social<br />
relationships)<br />
State<br />
Rate<br />
2.14%<br />
5.31%<br />
25.97%<br />
38.22%<br />
28.36%<br />
State<br />
Target<br />
LEA<br />
Rate<br />
LEA<br />
Rate<br />
— —<br />
— —<br />
— —<br />
— —<br />
— —<br />
Target<br />
Met by<br />
LEA(Y/N)<br />
B) Acquisition and Use of<br />
Knowledge and Skills<br />
(Including early language/<br />
communication and early literacy)<br />
B) Acquisition and Use of<br />
Knowledge and Skills **<br />
State<br />
Rate<br />
1.75%<br />
6.59%<br />
34.23%<br />
43.51%<br />
13.92%<br />
State<br />
Target<br />
LEA<br />
Rate<br />
Target<br />
Met by<br />
LEA(Y/N)<br />
C) Use of Appropriate Behaviors<br />
to Meet Their Needs<br />
State<br />
Rate<br />
State<br />
Target<br />
LEA<br />
Rate<br />
Target<br />
Met by<br />
LEA(Y/N)<br />
89.61% 90.50% — — N/A 90.31% 90.50% — — N/A 90.82% 92.50% — — N/A<br />
66.58% 69.50% — — N/A 57.43% 60.50% — — N/A 76.69% 78.50% — — N/A<br />
NOTE: * Including social relationships ** Including early language/ communication and early literacy<br />
Note: - - denotes not applicable<br />
State<br />
Rate<br />
LEA<br />
Rate<br />
— —<br />
— —<br />
— —<br />
— —<br />
— —<br />
C) Use of<br />
Appropriate<br />
Behaviors to<br />
Meet Their Needs<br />
State<br />
Rate<br />
4.51%<br />
17.34%<br />
41.72%<br />
34.97%<br />
LEA<br />
Rate<br />
1.46% — —<br />
— —<br />
— —<br />
— —<br />
— —<br />
Page 3 of 5
LEA: 4502 - YELLVILLE-SUMMIT SCHOOL <strong>DISTRICT</strong><br />
Indicator 08: Parent Involvement<br />
Percent of surveyed<br />
parents who reported<br />
school facilitated parent<br />
involvement as a means<br />
of improving services<br />
and results for children<br />
with disabilities.<br />
Early Childhood<br />
(3-5)<br />
School Age<br />
(5-21)<br />
State<br />
Rate<br />
90.47%<br />
95.05%<br />
Indicator 09: Disproportionality - Eligibility<br />
Disproportionate representation of racial<br />
and ethnic groups in special education and<br />
related services that is a result of<br />
inappropriate identification (e.g.<br />
monitoring data, review of policies,<br />
practices, and procedures under 618(d),<br />
etc.).<br />
State<br />
Rate<br />
State<br />
Target<br />
88.00%<br />
96.00%<br />
State<br />
Target<br />
0.00% 0.00%<br />
LEA<br />
Rate<br />
— —<br />
99.20%<br />
Indicator 10: Disproportionality-Child with a Disability<br />
Disproportionate representation of racial<br />
and ethnic groups in specific disability<br />
categories that is a result of inappropriate<br />
identification (e.g. monitoring data, review<br />
of policies, practices, and procedures under<br />
618(d), etc.).<br />
Indicator 11: Child Find<br />
Percent of children with<br />
parental consent to evaluate<br />
who are evaluated within<br />
the State established timeline<br />
of 60 days.<br />
Overall<br />
(3-21)<br />
Early Childhood<br />
(3-5)<br />
School Age<br />
(5-21)<br />
State<br />
Rate<br />
0.00%<br />
Indicator 12: Early Childhood Transition<br />
Percent of children referred by Part C prior to<br />
age 3, who are found eligible for Part B, and<br />
who have an IEP developed and implemented<br />
by their third birthday.<br />
Note: - - denotes not applicable<br />
State<br />
Rate<br />
99.41%<br />
99.70%<br />
98.97%<br />
State<br />
Rate<br />
State<br />
Target<br />
0.00%<br />
State<br />
Target<br />
100.00%<br />
100.00%<br />
100.00%<br />
State<br />
Target<br />
Target Met by<br />
LEA (Y/N)<br />
Y<br />
Target Met by<br />
LEA (Y/N)<br />
Y<br />
LEA<br />
Rate<br />
100.00%<br />
— —<br />
100.00%<br />
LEA<br />
Rate<br />
Target Met by<br />
LEA (Y/N)<br />
N/A<br />
Y<br />
Note: The target for Indicator 09 is to have zero percent<br />
(0%) of districts identified as having disproportionate<br />
representation as a result of inappropriate<br />
identification in eligibility.<br />
Note: The target for Indicator 10 is to have zero<br />
percent (0%) of districts identified as having<br />
disproportionate representation as a result of<br />
inappropriate identification in a disability<br />
category.<br />
Target Met by<br />
LEA (Y/N)<br />
N/A<br />
Y<br />
Target Met<br />
by LEA<br />
(Y/N)<br />
99.21% 100.00% - - N/A<br />
Y<br />
Note: * Indicates a zero reponse rate for the<br />
district.<br />
Page 4 of 5
LEA: 4502 - YELLVILLE-SUMMIT SCHOOL <strong>DISTRICT</strong><br />
Indicator 13: Secondary Transition<br />
Percent of youth with disabilities aged 16 and<br />
up with an IEP that includes coordinated,<br />
measurable, annual IEP goals and transition<br />
services that will reasonably enable the student<br />
to meet the post-secondary goals.<br />
Indicator 14: Post-School Outcomes<br />
A. Percent of youth enrolled in higher<br />
education within one year of leaving high<br />
school.<br />
State<br />
Rate<br />
State<br />
Target<br />
Note: Data for this Indicator is from the on-site monitoring of LEAs for the given year.<br />
B. Percent of youth enrolled in higher<br />
education or competitively employed<br />
within one year of leaving high school.<br />
C. Percent of youth enrolled in higher<br />
education or in some other postsecondary<br />
education or training program; or<br />
competitively employed or in some other<br />
employment within one year of leaving<br />
high school.<br />
State<br />
Rate<br />
Indicator 20: Reported Data-Timely and Accurate*<br />
District submitted<br />
required data elements<br />
on or before due dates;<br />
made revisions within<br />
the alloted reveiw<br />
periods.<br />
Accurate and Timely<br />
Data Submission<br />
Overall (3-21)<br />
Early Childhood (3-5)<br />
School Age (5-21)<br />
State<br />
Target<br />
100.00%<br />
100.00%<br />
100.00%<br />
State<br />
Target<br />
LEA<br />
Rate<br />
LEA<br />
Rate<br />
Target Met by<br />
LEA (Y/N)<br />
Target Met<br />
by LEA<br />
(Y/N)<br />
Target Met<br />
by LEA<br />
(Y/N)<br />
*Data reviewed for timely and accurate submissions included all APSCN cycle data except for personnel<br />
Note: - - denotes not applicable<br />
96.19 100.00 — — N/A<br />
14.53<br />
State<br />
Rate<br />
49.42<br />
State<br />
Rate<br />
54.07<br />
13.00<br />
State<br />
Target<br />
49.00<br />
State<br />
Target<br />
60.00<br />
Y<br />
N/A<br />
Y<br />
— —<br />
LEA<br />
Rate<br />
— —<br />
LEA<br />
Rate<br />
— —<br />
N/A<br />
Target Met<br />
by LEA<br />
(Y/N)<br />
N/A<br />
Target Met<br />
by LEA<br />
(Y/N)<br />
N/A<br />
Page 5 of 5
<strong>ARKANSAS</strong> <strong>SPECIAL</strong> <strong>EDUCATION</strong><br />
<strong>DISTRICT</strong> <strong>ANNUAL</strong> PERFORMANCE REPORT<br />
2010/11 School Year<br />
Publication Date: March 2012<br />
Each State must have in place a State Performance Plan (SPP) to evaluate the State's efforts to meet the requirements and<br />
purposes of the implementation of the Individuals with Disabilities Education Act (IDEA). The SPP is a six-year plan, which<br />
describes Arkansas's performance on 20 indicators. The Office of Special Education Programs in the U. S. Department of<br />
Education requires that States report annually to the public on the performance of each local education agency (LEA) on 14 of<br />
20 indicators as compared with targets established by the State in the SPP. Arkansas will report indicators 1 through 14 and<br />
20 for each LEA serving children with disabilities (CWD). Any LEA not meeting targets on compliance indicators (0% for<br />
Indicators 4B, 09 & 10 and 100% for Indicators 11, 12, 13, and 20) are non-compliant with IDEA.<br />
There are no report changes for the 2010/11 school year profile; However, it is important to recognize that: .<br />
1. Indicator 01 (Graduation) is reported a year in arrear (2009/10 graduates) and is based on a four-year cohort. This<br />
means the rate is a measure of students who entered in ninth grade and graduate in four years. The calculation is a<br />
requirement under Title I of the Elementary and Secondary Education Act (ESEA).<br />
2. Indicator 02 (Drop out) is reported a year in arrear. This means the rate is a measure of students who dropped out in<br />
the 2009/10 school year. The Indicator 02 data are aligned with the Common Core of Data (CCD) requirements for<br />
grades 7-12.<br />
3. Indicator 04A and 4B (Suspension/Expulsion) is reported a year in arrear. This means the rate is a measure of<br />
students who had out-of-school suspensions and/or expulsions totaling more than 10 days.<br />
For a complete description of all the Indicators, please visit the special education website at<br />
http://arksped.k12.ar.us/sections/policy.html<br />
LEA: 4602 - GENOA CENTRAL SCHOOL <strong>DISTRICT</strong><br />
Indicator 01: Graduation Rates (2009/10 school year) Indicator 02: Dropout Rates (2009/10 school year)<br />
Percent of youth<br />
with IEPs<br />
graduating from<br />
high school with a<br />
regular diploma<br />
State<br />
Rate<br />
State<br />
Target<br />
75.76% 85.00%<br />
LEA<br />
Rate<br />
75.00%<br />
Target Met<br />
by LEA<br />
(Y/N)<br />
N<br />
Percent of<br />
youth with<br />
IEPs dropping<br />
out of high<br />
school<br />
State<br />
Rate<br />
Indicator 03: Assessment on Statewide Benchmark Exam (grades 3-8, 11)<br />
A) Adequate Yearly Progress<br />
n=40<br />
Literacy<br />
Mathematics<br />
Met Disability Subgroup "n"<br />
for Reporting Purposes (Y/N)<br />
State Target for % of Districts Meeting<br />
AYP for Disability Subgroup<br />
State<br />
Target<br />
3.06% 4.20%<br />
LEA<br />
Rate<br />
3.23%<br />
% of Districts Meeting AYP<br />
for Disability Subgroup<br />
Target Met by<br />
LEA (Y/N)<br />
Y<br />
Target Met by<br />
LEA(Y/N)<br />
Overall N 17.15% 6.25%<br />
NA<br />
N<br />
N<br />
Note: For a district to qualify as having a disability subgroup it must have a minimum of 40 (n=40) students with disabilities in a school building.<br />
B) Participation<br />
Participation Rate: # of<br />
CWD Tested ÷ # of CWD<br />
Enrolled in grades tested.<br />
Participation Rate: Literacy<br />
Participation Rate: Math<br />
Note: - - denotes not applicable<br />
State<br />
Rate<br />
98.78%<br />
State<br />
Target<br />
95.00%<br />
LEA<br />
Rate<br />
100.00%<br />
Target Met<br />
by LEA (Y/N)<br />
98.61% 95.00% 100.00% Y<br />
Y<br />
C) Performance Proficiency<br />
Percent of CWD Scoring<br />
Proficient or Above<br />
Proficiency Rate: Literacy<br />
Proficiency Rate:<br />
Mathematics<br />
16.00%<br />
16.00%<br />
State<br />
Rate<br />
31.49%<br />
44.86%<br />
State<br />
Target<br />
45.22%<br />
51.14%<br />
LEA<br />
Rate<br />
29.03%<br />
52.94%<br />
NA<br />
NA<br />
Target<br />
Met by<br />
LEA (Y/N)<br />
N<br />
Y<br />
Page 1 of 5
LEA: 4602 - GENOA CENTRAL SCHOOL <strong>DISTRICT</strong><br />
Indicator 04: Out-of-School Suspensions and Expulsions (2009/10 school year)<br />
A) Suspension/Expulsion<br />
Percent difference of CWD with out-of- school suspensions and<br />
expulsions totaling greater than 10 days in a school year as<br />
compared to the same data for general education students in<br />
the district.<br />
B) Suspension/Expulsion by Race and Ethnicity<br />
Percent of districts that have: (a) a significant discrepancy, by race or<br />
ethnicity, in the rate of suspensions and expulsions of greater than 10<br />
days in a school year for children with IEPs; and (b) policies,<br />
procedures or practices that contribute to the significant discrepancy<br />
and do not comply with requirements relating to the development<br />
and implementation of IEPs, the use of positive behavioral<br />
interventions and supports, and procedural safeguards.<br />
Indicator 05: School Age (5-21) Least Restrictive Environment<br />
A) In the Regular Class 80% or more of the day<br />
Percent of CWD with<br />
IEPs receiving instruction<br />
in the regular class 80%<br />
or more of the day.<br />
State<br />
Rate<br />
State<br />
Target<br />
LEA<br />
Rate<br />
B) In the Regular Class less than 40% of the day<br />
Percent of CWD with<br />
IEPs receiving instruction<br />
in the regular class less<br />
than 60% of the day.<br />
53.87% 59.77%<br />
State<br />
Rate<br />
State<br />
Target<br />
12.42% 12.51%<br />
68.85%<br />
LEA<br />
Rate<br />
8.20%<br />
C) Other Settings outside the regular class<br />
Percent of CWD with IEPs served in<br />
public or private separate schools,<br />
residential placements, or<br />
homebound/hospital placements.<br />
State<br />
Rate<br />
State<br />
Target<br />
2.80% 2.56%<br />
Target Met<br />
by LEA (Y/N)<br />
Y<br />
Target Met<br />
by LEA (Y/N)<br />
Y<br />
LEA<br />
Rate<br />
0.00%<br />
Target Met<br />
by LEA(Y/N)<br />
Indicator 06: Early Childhood (3-5) Least Restrictive Environment<br />
A) Regular Early Childhood Program<br />
Percent of children (aged 3 through 5) with IEPs attending a regular<br />
early childhood program and receiving the majority of special<br />
education and related services in the regular early childhood program<br />
Allowable<br />
Difference<br />
LEA: 4602 - GENOA CENTRAL SCHOOL <strong>DISTRICT</strong><br />
Indicator 07: Preschool (3-5) Outcomes<br />
a) Percent of preschool CWD<br />
children who did not<br />
improve functioning.<br />
b) Percent of preschool CWD<br />
who improved but whose<br />
functioning remained below<br />
same age peers.<br />
c) Percent of preschool CWD<br />
who improved at a level<br />
nearer to same aged peers.<br />
d) Percent of preschool CWD<br />
who improved functioning to<br />
reach a level comparable to<br />
same age peers.<br />
e) Percent of preschool CWD<br />
children who maintain<br />
functioning at a level<br />
comparable to same aged<br />
peers.<br />
Summary<br />
Statements<br />
1) Of those preschool<br />
children who entered<br />
the preschool program<br />
below age expectations<br />
in each Outcome, the<br />
percent who<br />
substantially increased<br />
their rate of growth by<br />
the time they turned 6<br />
years of age or exited<br />
the program.<br />
2) The percent of<br />
preschool children who<br />
were functioning<br />
within age expectations<br />
in each Outcome by the<br />
time they turned 6<br />
years of age or exited<br />
A) Positive Social -Emotional<br />
Skills*<br />
State<br />
Rate<br />
A) Positive Social -<br />
Emotional Skills<br />
(Including social<br />
relationships)<br />
State<br />
Rate<br />
2.14%<br />
5.31%<br />
25.97%<br />
38.22%<br />
28.36%<br />
State<br />
Target<br />
LEA<br />
Rate<br />
LEA<br />
Rate<br />
— —<br />
— —<br />
— —<br />
— —<br />
— —<br />
Target<br />
Met by<br />
LEA(Y/N)<br />
B) Acquisition and Use of<br />
Knowledge and Skills<br />
(Including early language/<br />
communication and early literacy)<br />
B) Acquisition and Use of<br />
Knowledge and Skills **<br />
State<br />
Rate<br />
1.75%<br />
6.59%<br />
34.23%<br />
43.51%<br />
13.92%<br />
State<br />
Target<br />
LEA<br />
Rate<br />
Target<br />
Met by<br />
LEA(Y/N)<br />
C) Use of Appropriate Behaviors<br />
to Meet Their Needs<br />
State<br />
Rate<br />
State<br />
Target<br />
LEA<br />
Rate<br />
Target<br />
Met by<br />
LEA(Y/N)<br />
89.61% 90.50% — — N/A 90.31% 90.50% — — N/A 90.82% 92.50% — — N/A<br />
66.58% 69.50% — — N/A 57.43% 60.50% — — N/A 76.69% 78.50% — — N/A<br />
NOTE: * Including social relationships ** Including early language/ communication and early literacy<br />
Note: - - denotes not applicable<br />
State<br />
Rate<br />
LEA<br />
Rate<br />
— —<br />
— —<br />
— —<br />
— —<br />
— —<br />
C) Use of<br />
Appropriate<br />
Behaviors to<br />
Meet Their Needs<br />
State<br />
Rate<br />
4.51%<br />
17.34%<br />
41.72%<br />
34.97%<br />
LEA<br />
Rate<br />
1.46% — —<br />
— —<br />
— —<br />
— —<br />
— —<br />
Page 3 of 5
LEA: 4602 - GENOA CENTRAL SCHOOL <strong>DISTRICT</strong><br />
Indicator 08: Parent Involvement<br />
Percent of surveyed<br />
parents who reported<br />
school facilitated parent<br />
involvement as a means<br />
of improving services<br />
and results for children<br />
with disabilities.<br />
Early Childhood<br />
(3-5)<br />
School Age<br />
(5-21)<br />
State<br />
Rate<br />
90.47%<br />
95.05%<br />
Indicator 09: Disproportionality - Eligibility<br />
Disproportionate representation of racial<br />
and ethnic groups in special education and<br />
related services that is a result of<br />
inappropriate identification (e.g.<br />
monitoring data, review of policies,<br />
practices, and procedures under 618(d),<br />
etc.).<br />
State<br />
Rate<br />
State<br />
Target<br />
88.00%<br />
96.00%<br />
State<br />
Target<br />
0.00% 0.00%<br />
LEA<br />
Rate<br />
— —<br />
100.00%<br />
Indicator 10: Disproportionality-Child with a Disability<br />
Disproportionate representation of racial<br />
and ethnic groups in specific disability<br />
categories that is a result of inappropriate<br />
identification (e.g. monitoring data, review<br />
of policies, practices, and procedures under<br />
618(d), etc.).<br />
Indicator 11: Child Find<br />
Percent of children with<br />
parental consent to evaluate<br />
who are evaluated within<br />
the State established timeline<br />
of 60 days.<br />
Overall<br />
(3-21)<br />
Early Childhood<br />
(3-5)<br />
School Age<br />
(5-21)<br />
State<br />
Rate<br />
0.00%<br />
Indicator 12: Early Childhood Transition<br />
Percent of children referred by Part C prior to<br />
age 3, who are found eligible for Part B, and<br />
who have an IEP developed and implemented<br />
by their third birthday.<br />
Note: - - denotes not applicable<br />
State<br />
Rate<br />
99.41%<br />
99.70%<br />
98.97%<br />
State<br />
Rate<br />
State<br />
Target<br />
0.00%<br />
State<br />
Target<br />
100.00%<br />
100.00%<br />
100.00%<br />
State<br />
Target<br />
Target Met by<br />
LEA (Y/N)<br />
Y<br />
Target Met by<br />
LEA (Y/N)<br />
Y<br />
LEA<br />
Rate<br />
100.00%<br />
— —<br />
100.00%<br />
LEA<br />
Rate<br />
Target Met by<br />
LEA (Y/N)<br />
N/A<br />
Y<br />
Note: The target for Indicator 09 is to have zero percent<br />
(0%) of districts identified as having disproportionate<br />
representation as a result of inappropriate<br />
identification in eligibility.<br />
Note: The target for Indicator 10 is to have zero<br />
percent (0%) of districts identified as having<br />
disproportionate representation as a result of<br />
inappropriate identification in a disability<br />
category.<br />
Target Met by<br />
LEA (Y/N)<br />
N/A<br />
Y<br />
Target Met<br />
by LEA<br />
(Y/N)<br />
99.21% 100.00% - - N/A<br />
Y<br />
Note: * Indicates a zero reponse rate for the<br />
district.<br />
Page 4 of 5
LEA: 4602 - GENOA CENTRAL SCHOOL <strong>DISTRICT</strong><br />
Indicator 13: Secondary Transition<br />
Percent of youth with disabilities aged 16 and<br />
up with an IEP that includes coordinated,<br />
measurable, annual IEP goals and transition<br />
services that will reasonably enable the student<br />
to meet the post-secondary goals.<br />
Indicator 14: Post-School Outcomes<br />
A. Percent of youth enrolled in higher<br />
education within one year of leaving high<br />
school.<br />
State<br />
Rate<br />
State<br />
Target<br />
Note: Data for this Indicator is from the on-site monitoring of LEAs for the given year.<br />
B. Percent of youth enrolled in higher<br />
education or competitively employed<br />
within one year of leaving high school.<br />
C. Percent of youth enrolled in higher<br />
education or in some other postsecondary<br />
education or training program; or<br />
competitively employed or in some other<br />
employment within one year of leaving<br />
high school.<br />
State<br />
Rate<br />
Indicator 20: Reported Data-Timely and Accurate*<br />
District submitted<br />
required data elements<br />
on or before due dates;<br />
made revisions within<br />
the alloted reveiw<br />
periods.<br />
Accurate and Timely<br />
Data Submission<br />
Overall (3-21)<br />
Early Childhood (3-5)<br />
School Age (5-21)<br />
State<br />
Target<br />
100.00%<br />
100.00%<br />
100.00%<br />
State<br />
Target<br />
LEA<br />
Rate<br />
LEA<br />
Rate<br />
Target Met by<br />
LEA (Y/N)<br />
Target Met<br />
by LEA<br />
(Y/N)<br />
Target Met<br />
by LEA<br />
(Y/N)<br />
*Data reviewed for timely and accurate submissions included all APSCN cycle data except for personnel<br />
Note: - - denotes not applicable<br />
96.19 100.00 — — N/A<br />
14.53<br />
State<br />
Rate<br />
49.42<br />
State<br />
Rate<br />
54.07<br />
13.00<br />
State<br />
Target<br />
49.00<br />
State<br />
Target<br />
60.00<br />
Y<br />
N/A<br />
Y<br />
— —<br />
LEA<br />
Rate<br />
— —<br />
LEA<br />
Rate<br />
— —<br />
N/A<br />
Target Met<br />
by LEA<br />
(Y/N)<br />
N/A<br />
Target Met<br />
by LEA<br />
(Y/N)<br />
N/A<br />
Page 5 of 5
LEA: 4603 - FOUKE SCHOOL <strong>DISTRICT</strong><br />
<strong>ARKANSAS</strong> <strong>SPECIAL</strong> <strong>EDUCATION</strong><br />
<strong>DISTRICT</strong> <strong>ANNUAL</strong> PERFORMANCE REPORT<br />
2010/11 School Year<br />
Publication Date: March 2012<br />
Each State must have in place a State Performance Plan (SPP) to evaluate the State's efforts to meet the requirements and<br />
purposes of the implementation of the Individuals with Disabilities Education Act (IDEA). The SPP is a six-year plan, which<br />
describes Arkansas's performance on 20 indicators. The Office of Special Education Programs in the U. S. Department of<br />
Education requires that States report annually to the public on the performance of each local education agency (LEA) on 14 of<br />
20 indicators as compared with targets established by the State in the SPP. Arkansas will report indicators 1 through 14 and<br />
20 for each LEA serving children with disabilities (CWD). Any LEA not meeting targets on compliance indicators (0% for<br />
Indicators 4B, 09 & 10 and 100% for Indicators 11, 12, 13, and 20) are non-compliant with IDEA.<br />
There are no report changes for the 2010/11 school year profile; However, it is important to recognize that: .<br />
1. Indicator 01 (Graduation) is reported a year in arrear (2009/10 graduates) and is based on a four-year cohort. This<br />
means the rate is a measure of students who entered in ninth grade and graduate in four years. The calculation is a<br />
requirement under Title I of the Elementary and Secondary Education Act (ESEA).<br />
2. Indicator 02 (Drop out) is reported a year in arrear. This means the rate is a measure of students who dropped out in<br />
the 2009/10 school year. The Indicator 02 data are aligned with the Common Core of Data (CCD) requirements for<br />
grades 7-12.<br />
3. Indicator 04A and 4B (Suspension/Expulsion) is reported a year in arrear. This means the rate is a measure of<br />
students who had out-of-school suspensions and/or expulsions totaling more than 10 days.<br />
Percent of youth<br />
with IEPs<br />
graduating from<br />
high school with a<br />
regular diploma<br />
For a complete description of all the Indicators, please visit the special education website at<br />
http://arksped.k12.ar.us/sections/policy.html<br />
Indicator 01: Graduation Rates (2009/10 school year) Indicator 02: Dropout Rates (2009/10 school year)<br />
State<br />
Rate<br />
State<br />
Target<br />
75.76% 85.00%<br />
LEA<br />
Rate<br />
66.67%<br />
Target Met<br />
by LEA<br />
(Y/N)<br />
N<br />
Percent of<br />
youth with<br />
IEPs dropping<br />
out of high<br />
school<br />
State<br />
Rate<br />
Indicator 03: Assessment on Statewide Benchmark Exam (grades 3-8, 11)<br />
A) Adequate Yearly Progress<br />
n=40<br />
Literacy<br />
Mathematics<br />
Met Disability Subgroup "n"<br />
for Reporting Purposes (Y/N)<br />
State Target for % of Districts Meeting<br />
AYP for Disability Subgroup<br />
State<br />
Target<br />
3.06% 4.20%<br />
LEA<br />
Rate<br />
0.00%<br />
% of Districts Meeting AYP<br />
for Disability Subgroup<br />
Target Met by<br />
LEA (Y/N)<br />
Y<br />
Target Met by<br />
LEA(Y/N)<br />
Overall N 17.15% 6.25%<br />
NA<br />
N<br />
N<br />
Note: For a district to qualify as having a disability subgroup it must have a minimum of 40 (n=40) students with disabilities in a school building.<br />
B) Participation<br />
Participation Rate: # of<br />
CWD Tested ÷ # of CWD<br />
Enrolled in grades tested.<br />
Participation Rate: Literacy<br />
Participation Rate: Math<br />
Note: - - denotes not applicable<br />
State<br />
Rate<br />
98.78%<br />
State<br />
Target<br />
95.00%<br />
LEA<br />
Rate<br />
100.00%<br />
Target Met<br />
by LEA (Y/N)<br />
98.61% 95.00% 98.48% Y<br />
Y<br />
C) Performance Proficiency<br />
Percent of CWD Scoring<br />
Proficient or Above<br />
Proficiency Rate: Literacy<br />
Proficiency Rate:<br />
Mathematics<br />
16.00%<br />
16.00%<br />
State<br />
Rate<br />
31.49%<br />
44.86%<br />
State<br />
Target<br />
45.22%<br />
51.14%<br />
LEA<br />
Rate<br />
35.19%<br />
40.63%<br />
NA<br />
NA<br />
Target<br />
Met by<br />
LEA (Y/N)<br />
N<br />
N<br />
Page 1 of 5
LEA: 4603 - FOUKE SCHOOL <strong>DISTRICT</strong><br />
Indicator 04: Out-of-School Suspensions and Expulsions (2009/10 school year)<br />
A) Suspension/Expulsion<br />
Percent difference of CWD with out-of- school suspensions and<br />
expulsions totaling greater than 10 days in a school year as<br />
compared to the same data for general education students in<br />
the district.<br />
B) Suspension/Expulsion by Race and Ethnicity<br />
Percent of districts that have: (a) a significant discrepancy, by race or<br />
ethnicity, in the rate of suspensions and expulsions of greater than 10<br />
days in a school year for children with IEPs; and (b) policies,<br />
procedures or practices that contribute to the significant discrepancy<br />
and do not comply with requirements relating to the development<br />
and implementation of IEPs, the use of positive behavioral<br />
interventions and supports, and procedural safeguards.<br />
Indicator 05: School Age (5-21) Least Restrictive Environment<br />
A) In the Regular Class 80% or more of the day<br />
Percent of CWD with<br />
IEPs receiving instruction<br />
in the regular class 80%<br />
or more of the day.<br />
State<br />
Rate<br />
State<br />
Target<br />
LEA<br />
Rate<br />
B) In the Regular Class less than 40% of the day<br />
Percent of CWD with<br />
IEPs receiving instruction<br />
in the regular class less<br />
than 60% of the day.<br />
53.87% 59.77%<br />
State<br />
Rate<br />
State<br />
Target<br />
12.42% 12.51%<br />
69.64%<br />
LEA<br />
Rate<br />
5.36%<br />
C) Other Settings outside the regular class<br />
Percent of CWD with IEPs served in<br />
public or private separate schools,<br />
residential placements, or<br />
homebound/hospital placements.<br />
State<br />
Rate<br />
State<br />
Target<br />
2.80% 2.56%<br />
Target Met<br />
by LEA (Y/N)<br />
Y<br />
Target Met<br />
by LEA (Y/N)<br />
Y<br />
LEA<br />
Rate<br />
0.00%<br />
Target Met<br />
by LEA(Y/N)<br />
Indicator 06: Early Childhood (3-5) Least Restrictive Environment<br />
A) Regular Early Childhood Program<br />
Percent of children (aged 3 through 5) with IEPs attending a regular<br />
early childhood program and receiving the majority of special<br />
education and related services in the regular early childhood program<br />
Allowable<br />
Difference<br />
LEA: 4603 - FOUKE SCHOOL <strong>DISTRICT</strong><br />
Indicator 07: Preschool (3-5) Outcomes<br />
a) Percent of preschool CWD<br />
children who did not<br />
improve functioning.<br />
b) Percent of preschool CWD<br />
who improved but whose<br />
functioning remained below<br />
same age peers.<br />
c) Percent of preschool CWD<br />
who improved at a level<br />
nearer to same aged peers.<br />
d) Percent of preschool CWD<br />
who improved functioning to<br />
reach a level comparable to<br />
same age peers.<br />
e) Percent of preschool CWD<br />
children who maintain<br />
functioning at a level<br />
comparable to same aged<br />
peers.<br />
Summary<br />
Statements<br />
1) Of those preschool<br />
children who entered<br />
the preschool program<br />
below age expectations<br />
in each Outcome, the<br />
percent who<br />
substantially increased<br />
their rate of growth by<br />
the time they turned 6<br />
years of age or exited<br />
the program.<br />
2) The percent of<br />
preschool children who<br />
were functioning<br />
within age expectations<br />
in each Outcome by the<br />
time they turned 6<br />
years of age or exited<br />
A) Positive Social -Emotional<br />
Skills*<br />
State<br />
Rate<br />
A) Positive Social -<br />
Emotional Skills<br />
(Including social<br />
relationships)<br />
State<br />
Rate<br />
2.14%<br />
5.31%<br />
25.97%<br />
38.22%<br />
28.36%<br />
State<br />
Target<br />
LEA<br />
Rate<br />
LEA<br />
Rate<br />
— —<br />
— —<br />
— —<br />
— —<br />
— —<br />
Target<br />
Met by<br />
LEA(Y/N)<br />
B) Acquisition and Use of<br />
Knowledge and Skills<br />
(Including early language/<br />
communication and early literacy)<br />
B) Acquisition and Use of<br />
Knowledge and Skills **<br />
State<br />
Rate<br />
1.75%<br />
6.59%<br />
34.23%<br />
43.51%<br />
13.92%<br />
State<br />
Target<br />
LEA<br />
Rate<br />
Target<br />
Met by<br />
LEA(Y/N)<br />
C) Use of Appropriate Behaviors<br />
to Meet Their Needs<br />
State<br />
Rate<br />
State<br />
Target<br />
LEA<br />
Rate<br />
Target<br />
Met by<br />
LEA(Y/N)<br />
89.61% 90.50% — — N/A 90.31% 90.50% — — N/A 90.82% 92.50% — — N/A<br />
66.58% 69.50% — — N/A 57.43% 60.50% — — N/A 76.69% 78.50% — — N/A<br />
NOTE: * Including social relationships ** Including early language/ communication and early literacy<br />
Note: - - denotes not applicable<br />
State<br />
Rate<br />
LEA<br />
Rate<br />
— —<br />
— —<br />
— —<br />
— —<br />
— —<br />
C) Use of<br />
Appropriate<br />
Behaviors to<br />
Meet Their Needs<br />
State<br />
Rate<br />
4.51%<br />
17.34%<br />
41.72%<br />
34.97%<br />
LEA<br />
Rate<br />
1.46% — —<br />
— —<br />
— —<br />
— —<br />
— —<br />
Page 3 of 5
LEA: 4603 - FOUKE SCHOOL <strong>DISTRICT</strong><br />
Indicator 08: Parent Involvement<br />
Percent of surveyed<br />
parents who reported<br />
school facilitated parent<br />
involvement as a means<br />
of improving services<br />
and results for children<br />
with disabilities.<br />
Early Childhood<br />
(3-5)<br />
School Age<br />
(5-21)<br />
State<br />
Rate<br />
90.47%<br />
95.05%<br />
Indicator 09: Disproportionality - Eligibility<br />
Disproportionate representation of racial<br />
and ethnic groups in special education and<br />
related services that is a result of<br />
inappropriate identification (e.g.<br />
monitoring data, review of policies,<br />
practices, and procedures under 618(d),<br />
etc.).<br />
State<br />
Rate<br />
State<br />
Target<br />
88.00%<br />
96.00%<br />
State<br />
Target<br />
0.00% 0.00%<br />
LEA<br />
Rate<br />
— —<br />
100.00%<br />
Indicator 10: Disproportionality-Child with a Disability<br />
Disproportionate representation of racial<br />
and ethnic groups in specific disability<br />
categories that is a result of inappropriate<br />
identification (e.g. monitoring data, review<br />
of policies, practices, and procedures under<br />
618(d), etc.).<br />
Indicator 11: Child Find<br />
Percent of children with<br />
parental consent to evaluate<br />
who are evaluated within<br />
the State established timeline<br />
of 60 days.<br />
Overall<br />
(3-21)<br />
Early Childhood<br />
(3-5)<br />
School Age<br />
(5-21)<br />
State<br />
Rate<br />
0.00%<br />
Indicator 12: Early Childhood Transition<br />
Percent of children referred by Part C prior to<br />
age 3, who are found eligible for Part B, and<br />
who have an IEP developed and implemented<br />
by their third birthday.<br />
Note: - - denotes not applicable<br />
State<br />
Rate<br />
99.41%<br />
99.70%<br />
98.97%<br />
State<br />
Rate<br />
State<br />
Target<br />
0.00%<br />
State<br />
Target<br />
100.00%<br />
100.00%<br />
100.00%<br />
State<br />
Target<br />
Target Met by<br />
LEA (Y/N)<br />
Y<br />
Target Met by<br />
LEA (Y/N)<br />
Y<br />
LEA<br />
Rate<br />
100.00%<br />
— —<br />
100.00%<br />
LEA<br />
Rate<br />
Target Met by<br />
LEA (Y/N)<br />
N/A<br />
Y<br />
Note: The target for Indicator 09 is to have zero percent<br />
(0%) of districts identified as having disproportionate<br />
representation as a result of inappropriate<br />
identification in eligibility.<br />
Note: The target for Indicator 10 is to have zero<br />
percent (0%) of districts identified as having<br />
disproportionate representation as a result of<br />
inappropriate identification in a disability<br />
category.<br />
Target Met by<br />
LEA (Y/N)<br />
N/A<br />
Y<br />
Target Met<br />
by LEA<br />
(Y/N)<br />
99.21% 100.00% - - N/A<br />
Y<br />
Note: * Indicates a zero reponse rate for the<br />
district.<br />
Page 4 of 5
LEA: 4603 - FOUKE SCHOOL <strong>DISTRICT</strong><br />
Indicator 13: Secondary Transition<br />
Percent of youth with disabilities aged 16 and<br />
up with an IEP that includes coordinated,<br />
measurable, annual IEP goals and transition<br />
services that will reasonably enable the student<br />
to meet the post-secondary goals.<br />
Indicator 14: Post-School Outcomes<br />
A. Percent of youth enrolled in higher<br />
education within one year of leaving high<br />
school.<br />
State<br />
Rate<br />
State<br />
Target<br />
Note: Data for this Indicator is from the on-site monitoring of LEAs for the given year.<br />
B. Percent of youth enrolled in higher<br />
education or competitively employed<br />
within one year of leaving high school.<br />
C. Percent of youth enrolled in higher<br />
education or in some other postsecondary<br />
education or training program; or<br />
competitively employed or in some other<br />
employment within one year of leaving<br />
high school.<br />
State<br />
Rate<br />
Indicator 20: Reported Data-Timely and Accurate*<br />
District submitted<br />
required data elements<br />
on or before due dates;<br />
made revisions within<br />
the alloted reveiw<br />
periods.<br />
Accurate and Timely<br />
Data Submission<br />
Overall (3-21)<br />
Early Childhood (3-5)<br />
School Age (5-21)<br />
State<br />
Target<br />
100.00%<br />
100.00%<br />
100.00%<br />
State<br />
Target<br />
LEA<br />
Rate<br />
LEA<br />
Rate<br />
Target Met by<br />
LEA (Y/N)<br />
Target Met<br />
by LEA<br />
(Y/N)<br />
Target Met<br />
by LEA<br />
(Y/N)<br />
*Data reviewed for timely and accurate submissions included all APSCN cycle data except for personnel<br />
Note: - - denotes not applicable<br />
96.19 100.00 100.00% Y<br />
14.53<br />
State<br />
Rate<br />
49.42<br />
State<br />
Rate<br />
54.07<br />
13.00<br />
State<br />
Target<br />
49.00<br />
State<br />
Target<br />
60.00<br />
Y<br />
N/A<br />
Y<br />
— —<br />
LEA<br />
Rate<br />
— —<br />
LEA<br />
Rate<br />
— —<br />
N/A<br />
Target Met<br />
by LEA<br />
(Y/N)<br />
N/A<br />
Target Met<br />
by LEA<br />
(Y/N)<br />
N/A<br />
Page 5 of 5
<strong>ARKANSAS</strong> <strong>SPECIAL</strong> <strong>EDUCATION</strong><br />
<strong>DISTRICT</strong> <strong>ANNUAL</strong> PERFORMANCE REPORT<br />
2010/11 School Year<br />
Publication Date: March 2012<br />
Each State must have in place a State Performance Plan (SPP) to evaluate the State's efforts to meet the requirements and<br />
purposes of the implementation of the Individuals with Disabilities Education Act (IDEA). The SPP is a six-year plan, which<br />
describes Arkansas's performance on 20 indicators. The Office of Special Education Programs in the U. S. Department of<br />
Education requires that States report annually to the public on the performance of each local education agency (LEA) on 14 of<br />
20 indicators as compared with targets established by the State in the SPP. Arkansas will report indicators 1 through 14 and<br />
20 for each LEA serving children with disabilities (CWD). Any LEA not meeting targets on compliance indicators (0% for<br />
Indicators 4B, 09 & 10 and 100% for Indicators 11, 12, 13, and 20) are non-compliant with IDEA.<br />
There are no report changes for the 2010/11 school year profile; However, it is important to recognize that: .<br />
1. Indicator 01 (Graduation) is reported a year in arrear (2009/10 graduates) and is based on a four-year cohort. This<br />
means the rate is a measure of students who entered in ninth grade and graduate in four years. The calculation is a<br />
requirement under Title I of the Elementary and Secondary Education Act (ESEA).<br />
2. Indicator 02 (Drop out) is reported a year in arrear. This means the rate is a measure of students who dropped out in<br />
the 2009/10 school year. The Indicator 02 data are aligned with the Common Core of Data (CCD) requirements for<br />
grades 7-12.<br />
3. Indicator 04A and 4B (Suspension/Expulsion) is reported a year in arrear. This means the rate is a measure of<br />
students who had out-of-school suspensions and/or expulsions totaling more than 10 days.<br />
For a complete description of all the Indicators, please visit the special education website at<br />
http://arksped.k12.ar.us/sections/policy.html<br />
LEA: 4605 - TEXARKANA SCHOOL <strong>DISTRICT</strong><br />
Indicator 01: Graduation Rates (2009/10 school year) Indicator 02: Dropout Rates (2009/10 school year)<br />
Percent of youth<br />
with IEPs<br />
graduating from<br />
high school with a<br />
regular diploma<br />
State<br />
Rate<br />
State<br />
Target<br />
75.76% 85.00%<br />
LEA<br />
Rate<br />
66.67%<br />
Target Met<br />
by LEA<br />
(Y/N)<br />
N<br />
Percent of<br />
youth with<br />
IEPs dropping<br />
out of high<br />
school<br />
State<br />
Rate<br />
Indicator 03: Assessment on Statewide Benchmark Exam (grades 3-8, 11)<br />
A) Adequate Yearly Progress<br />
n=40<br />
Literacy<br />
Mathematics<br />
Met Disability Subgroup "n"<br />
for Reporting Purposes (Y/N)<br />
State Target for % of Districts Meeting<br />
AYP for Disability Subgroup<br />
State<br />
Target<br />
3.06% 4.20%<br />
LEA<br />
Rate<br />
4.78%<br />
% of Districts Meeting AYP<br />
for Disability Subgroup<br />
Target Met by<br />
LEA (Y/N)<br />
N<br />
Target Met by<br />
LEA(Y/N)<br />
Overall N 17.15% 6.25%<br />
NA<br />
N<br />
N<br />
Note: For a district to qualify as having a disability subgroup it must have a minimum of 40 (n=40) students with disabilities in a school building.<br />
B) Participation<br />
Participation Rate: # of<br />
CWD Tested ÷ # of CWD<br />
Enrolled in grades tested.<br />
Participation Rate: Literacy<br />
Participation Rate: Math<br />
Note: - - denotes not applicable<br />
State<br />
Rate<br />
98.78%<br />
State<br />
Target<br />
95.00%<br />
LEA<br />
Rate<br />
97.52%<br />
Target Met<br />
by LEA (Y/N)<br />
98.61% 95.00% 98.09% Y<br />
Y<br />
C) Performance Proficiency<br />
Percent of CWD Scoring<br />
Proficient or Above<br />
Proficiency Rate: Literacy<br />
Proficiency Rate:<br />
Mathematics<br />
16.00%<br />
16.00%<br />
State<br />
Rate<br />
31.49%<br />
44.86%<br />
State<br />
Target<br />
45.22%<br />
51.14%<br />
LEA<br />
Rate<br />
22.87%<br />
35.68%<br />
NA<br />
NA<br />
Target<br />
Met by<br />
LEA (Y/N)<br />
N<br />
N<br />
Page 1 of 5
LEA: 4605 - TEXARKANA SCHOOL <strong>DISTRICT</strong><br />
Indicator 04: Out-of-School Suspensions and Expulsions (2009/10 school year)<br />
A) Suspension/Expulsion<br />
Percent difference of CWD with out-of- school suspensions and<br />
expulsions totaling greater than 10 days in a school year as<br />
compared to the same data for general education students in<br />
the district.<br />
B) Suspension/Expulsion by Race and Ethnicity<br />
Percent of districts that have: (a) a significant discrepancy, by race or<br />
ethnicity, in the rate of suspensions and expulsions of greater than 10<br />
days in a school year for children with IEPs; and (b) policies,<br />
procedures or practices that contribute to the significant discrepancy<br />
and do not comply with requirements relating to the development<br />
and implementation of IEPs, the use of positive behavioral<br />
interventions and supports, and procedural safeguards.<br />
Indicator 05: School Age (5-21) Least Restrictive Environment<br />
A) In the Regular Class 80% or more of the day<br />
Percent of CWD with<br />
IEPs receiving instruction<br />
in the regular class 80%<br />
or more of the day.<br />
State<br />
Rate<br />
State<br />
Target<br />
LEA<br />
Rate<br />
B) In the Regular Class less than 40% of the day<br />
Percent of CWD with<br />
IEPs receiving instruction<br />
in the regular class less<br />
than 60% of the day.<br />
53.87% 59.77%<br />
State<br />
Rate<br />
State<br />
Target<br />
12.42% 12.51%<br />
53.62%<br />
LEA<br />
Rate<br />
15.96%<br />
C) Other Settings outside the regular class<br />
Percent of CWD with IEPs served in<br />
public or private separate schools,<br />
residential placements, or<br />
homebound/hospital placements.<br />
State<br />
Rate<br />
State<br />
Target<br />
2.80% 2.56%<br />
Target Met<br />
by LEA (Y/N)<br />
N<br />
Target Met<br />
by LEA (Y/N)<br />
N<br />
LEA<br />
Rate<br />
1.06%<br />
Target Met<br />
by LEA(Y/N)<br />
Indicator 06: Early Childhood (3-5) Least Restrictive Environment<br />
A) Regular Early Childhood Program<br />
Percent of children (aged 3 through 5) with IEPs attending a regular<br />
early childhood program and receiving the majority of special<br />
education and related services in the regular early childhood program<br />
Allowable<br />
Difference<br />
LEA: 4605 - TEXARKANA SCHOOL <strong>DISTRICT</strong><br />
Indicator 07: Preschool (3-5) Outcomes<br />
a) Percent of preschool CWD<br />
children who did not<br />
improve functioning.<br />
b) Percent of preschool CWD<br />
who improved but whose<br />
functioning remained below<br />
same age peers.<br />
c) Percent of preschool CWD<br />
who improved at a level<br />
nearer to same aged peers.<br />
d) Percent of preschool CWD<br />
who improved functioning to<br />
reach a level comparable to<br />
same age peers.<br />
e) Percent of preschool CWD<br />
children who maintain<br />
functioning at a level<br />
comparable to same aged<br />
peers.<br />
Summary<br />
Statements<br />
1) Of those preschool<br />
children who entered<br />
the preschool program<br />
below age expectations<br />
in each Outcome, the<br />
percent who<br />
substantially increased<br />
their rate of growth by<br />
the time they turned 6<br />
years of age or exited<br />
the program.<br />
2) The percent of<br />
preschool children who<br />
were functioning<br />
within age expectations<br />
in each Outcome by the<br />
time they turned 6<br />
years of age or exited<br />
A) Positive Social -Emotional<br />
Skills*<br />
State<br />
Rate<br />
A) Positive Social -<br />
Emotional Skills<br />
(Including social<br />
relationships)<br />
State<br />
Rate<br />
2.14%<br />
5.31%<br />
25.97%<br />
38.22%<br />
28.36%<br />
State<br />
Target<br />
LEA<br />
Rate<br />
LEA<br />
Rate<br />
— —<br />
— —<br />
— —<br />
— —<br />
— —<br />
Target<br />
Met by<br />
LEA(Y/N)<br />
B) Acquisition and Use of<br />
Knowledge and Skills<br />
(Including early language/<br />
communication and early literacy)<br />
B) Acquisition and Use of<br />
Knowledge and Skills **<br />
State<br />
Rate<br />
1.75%<br />
6.59%<br />
34.23%<br />
43.51%<br />
13.92%<br />
State<br />
Target<br />
LEA<br />
Rate<br />
Target<br />
Met by<br />
LEA(Y/N)<br />
C) Use of Appropriate Behaviors<br />
to Meet Their Needs<br />
State<br />
Rate<br />
State<br />
Target<br />
LEA<br />
Rate<br />
Target<br />
Met by<br />
LEA(Y/N)<br />
89.61% 90.50% — — N/A 90.31% 90.50% — — N/A 90.82% 92.50% — — N/A<br />
66.58% 69.50% — — N/A 57.43% 60.50% — — N/A 76.69% 78.50% — — N/A<br />
NOTE: * Including social relationships ** Including early language/ communication and early literacy<br />
Note: - - denotes not applicable<br />
State<br />
Rate<br />
LEA<br />
Rate<br />
— —<br />
— —<br />
— —<br />
— —<br />
— —<br />
C) Use of<br />
Appropriate<br />
Behaviors to<br />
Meet Their Needs<br />
State<br />
Rate<br />
4.51%<br />
17.34%<br />
41.72%<br />
34.97%<br />
LEA<br />
Rate<br />
1.46% — —<br />
— —<br />
— —<br />
— —<br />
— —<br />
Page 3 of 5
LEA: 4605 - TEXARKANA SCHOOL <strong>DISTRICT</strong><br />
Indicator 08: Parent Involvement<br />
Percent of surveyed<br />
parents who reported<br />
school facilitated parent<br />
involvement as a means<br />
of improving services<br />
and results for children<br />
with disabilities.<br />
Early Childhood<br />
(3-5)<br />
School Age<br />
(5-21)<br />
State<br />
Rate<br />
90.47%<br />
95.05%<br />
Indicator 09: Disproportionality - Eligibility<br />
Disproportionate representation of racial<br />
and ethnic groups in special education and<br />
related services that is a result of<br />
inappropriate identification (e.g.<br />
monitoring data, review of policies,<br />
practices, and procedures under 618(d),<br />
etc.).<br />
State<br />
Rate<br />
State<br />
Target<br />
88.00%<br />
96.00%<br />
State<br />
Target<br />
0.00% 0.00%<br />
LEA<br />
Rate<br />
— —<br />
92.00%<br />
Indicator 10: Disproportionality-Child with a Disability<br />
Disproportionate representation of racial<br />
and ethnic groups in specific disability<br />
categories that is a result of inappropriate<br />
identification (e.g. monitoring data, review<br />
of policies, practices, and procedures under<br />
618(d), etc.).<br />
Indicator 11: Child Find<br />
Percent of children with<br />
parental consent to evaluate<br />
who are evaluated within<br />
the State established timeline<br />
of 60 days.<br />
Overall<br />
(3-21)<br />
Early Childhood<br />
(3-5)<br />
School Age<br />
(5-21)<br />
State<br />
Rate<br />
0.00%<br />
Indicator 12: Early Childhood Transition<br />
Percent of children referred by Part C prior to<br />
age 3, who are found eligible for Part B, and<br />
who have an IEP developed and implemented<br />
by their third birthday.<br />
Note: - - denotes not applicable<br />
State<br />
Rate<br />
99.41%<br />
99.70%<br />
98.97%<br />
State<br />
Rate<br />
State<br />
Target<br />
0.00%<br />
State<br />
Target<br />
100.00%<br />
100.00%<br />
100.00%<br />
State<br />
Target<br />
Target Met by<br />
LEA (Y/N)<br />
Y<br />
Target Met by<br />
LEA (Y/N)<br />
Y<br />
LEA<br />
Rate<br />
98.21%<br />
— —<br />
98.21%<br />
LEA<br />
Rate<br />
Target Met by<br />
LEA (Y/N)<br />
N/A<br />
N<br />
Note: The target for Indicator 09 is to have zero percent<br />
(0%) of districts identified as having disproportionate<br />
representation as a result of inappropriate<br />
identification in eligibility.<br />
Note: The target for Indicator 10 is to have zero<br />
percent (0%) of districts identified as having<br />
disproportionate representation as a result of<br />
inappropriate identification in a disability<br />
category.<br />
Target Met by<br />
LEA (Y/N)<br />
N/A<br />
N<br />
Target Met<br />
by LEA<br />
(Y/N)<br />
99.21% 100.00% - - N/A<br />
N<br />
Note: * Indicates a zero reponse rate for the<br />
district.<br />
Page 4 of 5
LEA: 4605 - TEXARKANA SCHOOL <strong>DISTRICT</strong><br />
Indicator 13: Secondary Transition<br />
Percent of youth with disabilities aged 16 and<br />
up with an IEP that includes coordinated,<br />
measurable, annual IEP goals and transition<br />
services that will reasonably enable the student<br />
to meet the post-secondary goals.<br />
Indicator 14: Post-School Outcomes<br />
A. Percent of youth enrolled in higher<br />
education within one year of leaving high<br />
school.<br />
State<br />
Rate<br />
State<br />
Target<br />
Note: Data for this Indicator is from the on-site monitoring of LEAs for the given year.<br />
B. Percent of youth enrolled in higher<br />
education or competitively employed<br />
within one year of leaving high school.<br />
C. Percent of youth enrolled in higher<br />
education or in some other postsecondary<br />
education or training program; or<br />
competitively employed or in some other<br />
employment within one year of leaving<br />
high school.<br />
State<br />
Rate<br />
Indicator 20: Reported Data-Timely and Accurate*<br />
District submitted<br />
required data elements<br />
on or before due dates;<br />
made revisions within<br />
the alloted reveiw<br />
periods.<br />
Accurate and Timely<br />
Data Submission<br />
Overall (3-21)<br />
Early Childhood (3-5)<br />
School Age (5-21)<br />
State<br />
Target<br />
100.00%<br />
100.00%<br />
100.00%<br />
State<br />
Target<br />
LEA<br />
Rate<br />
LEA<br />
Rate<br />
Target Met by<br />
LEA (Y/N)<br />
Target Met<br />
by LEA<br />
(Y/N)<br />
Target Met<br />
by LEA<br />
(Y/N)<br />
*Data reviewed for timely and accurate submissions included all APSCN cycle data except for personnel<br />
Note: - - denotes not applicable<br />
96.19 100.00 100.00% Y<br />
14.53<br />
State<br />
Rate<br />
49.42<br />
State<br />
Rate<br />
54.07<br />
13.00<br />
State<br />
Target<br />
49.00<br />
State<br />
Target<br />
60.00<br />
Y<br />
N/A<br />
Y<br />
— —<br />
LEA<br />
Rate<br />
— —<br />
LEA<br />
Rate<br />
— —<br />
N/A<br />
Target Met<br />
by LEA<br />
(Y/N)<br />
N/A<br />
Target Met<br />
by LEA<br />
(Y/N)<br />
N/A<br />
Page 5 of 5
LEA: 4701 - ARMOREL SCHOOL <strong>DISTRICT</strong><br />
<strong>ARKANSAS</strong> <strong>SPECIAL</strong> <strong>EDUCATION</strong><br />
<strong>DISTRICT</strong> <strong>ANNUAL</strong> PERFORMANCE REPORT<br />
2010/11 School Year<br />
Publication Date: March 2012<br />
Each State must have in place a State Performance Plan (SPP) to evaluate the State's efforts to meet the requirements and<br />
purposes of the implementation of the Individuals with Disabilities Education Act (IDEA). The SPP is a six-year plan, which<br />
describes Arkansas's performance on 20 indicators. The Office of Special Education Programs in the U. S. Department of<br />
Education requires that States report annually to the public on the performance of each local education agency (LEA) on 14 of<br />
20 indicators as compared with targets established by the State in the SPP. Arkansas will report indicators 1 through 14 and<br />
20 for each LEA serving children with disabilities (CWD). Any LEA not meeting targets on compliance indicators (0% for<br />
Indicators 4B, 09 & 10 and 100% for Indicators 11, 12, 13, and 20) are non-compliant with IDEA.<br />
There are no report changes for the 2010/11 school year profile; However, it is important to recognize that: .<br />
1. Indicator 01 (Graduation) is reported a year in arrear (2009/10 graduates) and is based on a four-year cohort. This<br />
means the rate is a measure of students who entered in ninth grade and graduate in four years. The calculation is a<br />
requirement under Title I of the Elementary and Secondary Education Act (ESEA).<br />
2. Indicator 02 (Drop out) is reported a year in arrear. This means the rate is a measure of students who dropped out in<br />
the 2009/10 school year. The Indicator 02 data are aligned with the Common Core of Data (CCD) requirements for<br />
grades 7-12.<br />
3. Indicator 04A and 4B (Suspension/Expulsion) is reported a year in arrear. This means the rate is a measure of<br />
students who had out-of-school suspensions and/or expulsions totaling more than 10 days.<br />
Percent of youth<br />
with IEPs<br />
graduating from<br />
high school with a<br />
regular diploma<br />
For a complete description of all the Indicators, please visit the special education website at<br />
http://arksped.k12.ar.us/sections/policy.html<br />
Indicator 01: Graduation Rates (2009/10 school year) Indicator 02: Dropout Rates (2009/10 school year)<br />
State<br />
Rate<br />
State<br />
Target<br />
75.76% 85.00%<br />
LEA<br />
Rate<br />
100.00%<br />
Target Met<br />
by LEA<br />
(Y/N)<br />
Y<br />
Percent of<br />
youth with<br />
IEPs dropping<br />
out of high<br />
school<br />
State<br />
Rate<br />
Indicator 03: Assessment on Statewide Benchmark Exam (grades 3-8, 11)<br />
A) Adequate Yearly Progress<br />
n=40<br />
Literacy<br />
Mathematics<br />
Met Disability Subgroup "n"<br />
for Reporting Purposes (Y/N)<br />
State Target for % of Districts Meeting<br />
AYP for Disability Subgroup<br />
State<br />
Target<br />
3.06% 4.20%<br />
LEA<br />
Rate<br />
0.00%<br />
% of Districts Meeting AYP<br />
for Disability Subgroup<br />
Target Met by<br />
LEA (Y/N)<br />
Y<br />
Target Met by<br />
LEA(Y/N)<br />
Overall N 17.15% 6.25%<br />
NA<br />
N<br />
N<br />
Note: For a district to qualify as having a disability subgroup it must have a minimum of 40 (n=40) students with disabilities in a school building.<br />
B) Participation<br />
Participation Rate: # of<br />
CWD Tested ÷ # of CWD<br />
Enrolled in grades tested.<br />
Participation Rate: Literacy<br />
Participation Rate: Math<br />
Note: - - denotes not applicable<br />
State<br />
Rate<br />
98.78%<br />
State<br />
Target<br />
95.00%<br />
LEA<br />
Rate<br />
100.00%<br />
Target Met<br />
by LEA (Y/N)<br />
98.61% 95.00% 100.00% Y<br />
Y<br />
C) Performance Proficiency<br />
Percent of CWD Scoring<br />
Proficient or Above<br />
Proficiency Rate: Literacy<br />
Proficiency Rate:<br />
Mathematics<br />
16.00%<br />
16.00%<br />
State<br />
Rate<br />
31.49%<br />
44.86%<br />
State<br />
Target<br />
45.22%<br />
51.14%<br />
LEA<br />
Rate<br />
17.86%<br />
29.03%<br />
NA<br />
NA<br />
Target<br />
Met by<br />
LEA (Y/N)<br />
N<br />
N<br />
Page 1 of 5
LEA: 4701 - ARMOREL SCHOOL <strong>DISTRICT</strong><br />
Indicator 04: Out-of-School Suspensions and Expulsions (2009/10 school year)<br />
A) Suspension/Expulsion<br />
Percent difference of CWD with out-of- school suspensions and<br />
expulsions totaling greater than 10 days in a school year as<br />
compared to the same data for general education students in<br />
the district.<br />
B) Suspension/Expulsion by Race and Ethnicity<br />
Percent of districts that have: (a) a significant discrepancy, by race or<br />
ethnicity, in the rate of suspensions and expulsions of greater than 10<br />
days in a school year for children with IEPs; and (b) policies,<br />
procedures or practices that contribute to the significant discrepancy<br />
and do not comply with requirements relating to the development<br />
and implementation of IEPs, the use of positive behavioral<br />
interventions and supports, and procedural safeguards.<br />
Indicator 05: School Age (5-21) Least Restrictive Environment<br />
A) In the Regular Class 80% or more of the day<br />
Percent of CWD with<br />
IEPs receiving instruction<br />
in the regular class 80%<br />
or more of the day.<br />
State<br />
Rate<br />
State<br />
Target<br />
LEA<br />
Rate<br />
B) In the Regular Class less than 40% of the day<br />
Percent of CWD with<br />
IEPs receiving instruction<br />
in the regular class less<br />
than 60% of the day.<br />
53.87% 59.77%<br />
State<br />
Rate<br />
State<br />
Target<br />
12.42% 12.51%<br />
70.83%<br />
LEA<br />
Rate<br />
0.00%<br />
C) Other Settings outside the regular class<br />
Percent of CWD with IEPs served in<br />
public or private separate schools,<br />
residential placements, or<br />
homebound/hospital placements.<br />
State<br />
Rate<br />
State<br />
Target<br />
2.80% 2.56%<br />
Target Met<br />
by LEA (Y/N)<br />
Y<br />
Target Met<br />
by LEA (Y/N)<br />
Y<br />
LEA<br />
Rate<br />
0.00%<br />
Target Met<br />
by LEA(Y/N)<br />
Indicator 06: Early Childhood (3-5) Least Restrictive Environment<br />
A) Regular Early Childhood Program<br />
Percent of children (aged 3 through 5) with IEPs attending a regular<br />
early childhood program and receiving the majority of special<br />
education and related services in the regular early childhood program<br />
Allowable<br />
Difference<br />
LEA: 4701 - ARMOREL SCHOOL <strong>DISTRICT</strong><br />
Indicator 07: Preschool (3-5) Outcomes<br />
a) Percent of preschool CWD<br />
children who did not<br />
improve functioning.<br />
b) Percent of preschool CWD<br />
who improved but whose<br />
functioning remained below<br />
same age peers.<br />
c) Percent of preschool CWD<br />
who improved at a level<br />
nearer to same aged peers.<br />
d) Percent of preschool CWD<br />
who improved functioning to<br />
reach a level comparable to<br />
same age peers.<br />
e) Percent of preschool CWD<br />
children who maintain<br />
functioning at a level<br />
comparable to same aged<br />
peers.<br />
Summary<br />
Statements<br />
1) Of those preschool<br />
children who entered<br />
the preschool program<br />
below age expectations<br />
in each Outcome, the<br />
percent who<br />
substantially increased<br />
their rate of growth by<br />
the time they turned 6<br />
years of age or exited<br />
the program.<br />
2) The percent of<br />
preschool children who<br />
were functioning<br />
within age expectations<br />
in each Outcome by the<br />
time they turned 6<br />
years of age or exited<br />
A) Positive Social -Emotional<br />
Skills*<br />
State<br />
Rate<br />
A) Positive Social -<br />
Emotional Skills<br />
(Including social<br />
relationships)<br />
State<br />
Rate<br />
2.14%<br />
5.31%<br />
25.97%<br />
38.22%<br />
28.36%<br />
State<br />
Target<br />
LEA<br />
Rate<br />
LEA<br />
Rate<br />
— —<br />
— —<br />
— —<br />
— —<br />
— —<br />
Target<br />
Met by<br />
LEA(Y/N)<br />
B) Acquisition and Use of<br />
Knowledge and Skills<br />
(Including early language/<br />
communication and early literacy)<br />
B) Acquisition and Use of<br />
Knowledge and Skills **<br />
State<br />
Rate<br />
1.75%<br />
6.59%<br />
34.23%<br />
43.51%<br />
13.92%<br />
State<br />
Target<br />
LEA<br />
Rate<br />
Target<br />
Met by<br />
LEA(Y/N)<br />
C) Use of Appropriate Behaviors<br />
to Meet Their Needs<br />
State<br />
Rate<br />
State<br />
Target<br />
LEA<br />
Rate<br />
Target<br />
Met by<br />
LEA(Y/N)<br />
89.61% 90.50% — — N/A 90.31% 90.50% — — N/A 90.82% 92.50% — — N/A<br />
66.58% 69.50% — — N/A 57.43% 60.50% — — N/A 76.69% 78.50% — — N/A<br />
NOTE: * Including social relationships ** Including early language/ communication and early literacy<br />
Note: - - denotes not applicable<br />
State<br />
Rate<br />
LEA<br />
Rate<br />
— —<br />
— —<br />
— —<br />
— —<br />
— —<br />
C) Use of<br />
Appropriate<br />
Behaviors to<br />
Meet Their Needs<br />
State<br />
Rate<br />
4.51%<br />
17.34%<br />
41.72%<br />
34.97%<br />
LEA<br />
Rate<br />
1.46% — —<br />
— —<br />
— —<br />
— —<br />
— —<br />
Page 3 of 5
LEA: 4701 - ARMOREL SCHOOL <strong>DISTRICT</strong><br />
Indicator 08: Parent Involvement<br />
Percent of surveyed<br />
parents who reported<br />
school facilitated parent<br />
involvement as a means<br />
of improving services<br />
and results for children<br />
with disabilities.<br />
Early Childhood<br />
(3-5)<br />
School Age<br />
(5-21)<br />
State<br />
Rate<br />
90.47%<br />
95.05%<br />
Indicator 09: Disproportionality - Eligibility<br />
Disproportionate representation of racial<br />
and ethnic groups in special education and<br />
related services that is a result of<br />
inappropriate identification (e.g.<br />
monitoring data, review of policies,<br />
practices, and procedures under 618(d),<br />
etc.).<br />
State<br />
Rate<br />
State<br />
Target<br />
88.00%<br />
96.00%<br />
State<br />
Target<br />
0.00% 0.00%<br />
LEA<br />
Rate<br />
— —<br />
100.00%<br />
Indicator 10: Disproportionality-Child with a Disability<br />
Disproportionate representation of racial<br />
and ethnic groups in specific disability<br />
categories that is a result of inappropriate<br />
identification (e.g. monitoring data, review<br />
of policies, practices, and procedures under<br />
618(d), etc.).<br />
Indicator 11: Child Find<br />
Percent of children with<br />
parental consent to evaluate<br />
who are evaluated within<br />
the State established timeline<br />
of 60 days.<br />
Overall<br />
(3-21)<br />
Early Childhood<br />
(3-5)<br />
School Age<br />
(5-21)<br />
State<br />
Rate<br />
0.00%<br />
Indicator 12: Early Childhood Transition<br />
Percent of children referred by Part C prior to<br />
age 3, who are found eligible for Part B, and<br />
who have an IEP developed and implemented<br />
by their third birthday.<br />
Note: - - denotes not applicable<br />
State<br />
Rate<br />
99.41%<br />
99.70%<br />
98.97%<br />
State<br />
Rate<br />
State<br />
Target<br />
0.00%<br />
State<br />
Target<br />
100.00%<br />
100.00%<br />
100.00%<br />
State<br />
Target<br />
Target Met by<br />
LEA (Y/N)<br />
Y<br />
Target Met by<br />
LEA (Y/N)<br />
Y<br />
LEA<br />
Rate<br />
100.00%<br />
— —<br />
100.00%<br />
LEA<br />
Rate<br />
Target Met by<br />
LEA (Y/N)<br />
N/A<br />
Y<br />
Note: The target for Indicator 09 is to have zero percent<br />
(0%) of districts identified as having disproportionate<br />
representation as a result of inappropriate<br />
identification in eligibility.<br />
Note: The target for Indicator 10 is to have zero<br />
percent (0%) of districts identified as having<br />
disproportionate representation as a result of<br />
inappropriate identification in a disability<br />
category.<br />
Target Met by<br />
LEA (Y/N)<br />
N/A<br />
Y<br />
Target Met<br />
by LEA<br />
(Y/N)<br />
99.21% 100.00% - - N/A<br />
Y<br />
Note: * Indicates a zero reponse rate for the<br />
district.<br />
Page 4 of 5
LEA: 4701 - ARMOREL SCHOOL <strong>DISTRICT</strong><br />
Indicator 13: Secondary Transition<br />
Percent of youth with disabilities aged 16 and<br />
up with an IEP that includes coordinated,<br />
measurable, annual IEP goals and transition<br />
services that will reasonably enable the student<br />
to meet the post-secondary goals.<br />
Indicator 14: Post-School Outcomes<br />
A. Percent of youth enrolled in higher<br />
education within one year of leaving high<br />
school.<br />
State<br />
Rate<br />
State<br />
Target<br />
Note: Data for this Indicator is from the on-site monitoring of LEAs for the given year.<br />
B. Percent of youth enrolled in higher<br />
education or competitively employed<br />
within one year of leaving high school.<br />
C. Percent of youth enrolled in higher<br />
education or in some other postsecondary<br />
education or training program; or<br />
competitively employed or in some other<br />
employment within one year of leaving<br />
high school.<br />
State<br />
Rate<br />
Indicator 20: Reported Data-Timely and Accurate*<br />
District submitted<br />
required data elements<br />
on or before due dates;<br />
made revisions within<br />
the alloted reveiw<br />
periods.<br />
Accurate and Timely<br />
Data Submission<br />
Overall (3-21)<br />
Early Childhood (3-5)<br />
School Age (5-21)<br />
State<br />
Target<br />
100.00%<br />
100.00%<br />
100.00%<br />
State<br />
Target<br />
LEA<br />
Rate<br />
LEA<br />
Rate<br />
Target Met by<br />
LEA (Y/N)<br />
Target Met<br />
by LEA<br />
(Y/N)<br />
Target Met<br />
by LEA<br />
(Y/N)<br />
*Data reviewed for timely and accurate submissions included all APSCN cycle data except for personnel<br />
Note: - - denotes not applicable<br />
96.19 100.00 — — N/A<br />
14.53<br />
State<br />
Rate<br />
49.42<br />
State<br />
Rate<br />
54.07<br />
13.00<br />
State<br />
Target<br />
49.00<br />
State<br />
Target<br />
60.00<br />
Y<br />
N/A<br />
Y<br />
— —<br />
LEA<br />
Rate<br />
— —<br />
LEA<br />
Rate<br />
— —<br />
N/A<br />
Target Met<br />
by LEA<br />
(Y/N)<br />
N/A<br />
Target Met<br />
by LEA<br />
(Y/N)<br />
N/A<br />
Page 5 of 5
<strong>ARKANSAS</strong> <strong>SPECIAL</strong> <strong>EDUCATION</strong><br />
<strong>DISTRICT</strong> <strong>ANNUAL</strong> PERFORMANCE REPORT<br />
2010/11 School Year<br />
Publication Date: March 2012<br />
Each State must have in place a State Performance Plan (SPP) to evaluate the State's efforts to meet the requirements and<br />
purposes of the implementation of the Individuals with Disabilities Education Act (IDEA). The SPP is a six-year plan, which<br />
describes Arkansas's performance on 20 indicators. The Office of Special Education Programs in the U. S. Department of<br />
Education requires that States report annually to the public on the performance of each local education agency (LEA) on 14 of<br />
20 indicators as compared with targets established by the State in the SPP. Arkansas will report indicators 1 through 14 and<br />
20 for each LEA serving children with disabilities (CWD). Any LEA not meeting targets on compliance indicators (0% for<br />
Indicators 4B, 09 & 10 and 100% for Indicators 11, 12, 13, and 20) are non-compliant with IDEA.<br />
There are no report changes for the 2010/11 school year profile; However, it is important to recognize that: .<br />
1. Indicator 01 (Graduation) is reported a year in arrear (2009/10 graduates) and is based on a four-year cohort. This<br />
means the rate is a measure of students who entered in ninth grade and graduate in four years. The calculation is a<br />
requirement under Title I of the Elementary and Secondary Education Act (ESEA).<br />
2. Indicator 02 (Drop out) is reported a year in arrear. This means the rate is a measure of students who dropped out in<br />
the 2009/10 school year. The Indicator 02 data are aligned with the Common Core of Data (CCD) requirements for<br />
grades 7-12.<br />
3. Indicator 04A and 4B (Suspension/Expulsion) is reported a year in arrear. This means the rate is a measure of<br />
students who had out-of-school suspensions and/or expulsions totaling more than 10 days.<br />
For a complete description of all the Indicators, please visit the special education website at<br />
http://arksped.k12.ar.us/sections/policy.html<br />
LEA: 4702 - BLYTHEVILLE SCHOOL <strong>DISTRICT</strong><br />
Indicator 01: Graduation Rates (2009/10 school year) Indicator 02: Dropout Rates (2009/10 school year)<br />
Percent of youth<br />
with IEPs<br />
graduating from<br />
high school with a<br />
regular diploma<br />
State<br />
Rate<br />
State<br />
Target<br />
75.76% 85.00%<br />
LEA<br />
Rate<br />
47.73%<br />
Target Met<br />
by LEA<br />
(Y/N)<br />
N<br />
Percent of<br />
youth with<br />
IEPs dropping<br />
out of high<br />
school<br />
State<br />
Rate<br />
Indicator 03: Assessment on Statewide Benchmark Exam (grades 3-8, 11)<br />
A) Adequate Yearly Progress<br />
n=40<br />
Literacy<br />
Mathematics<br />
Met Disability Subgroup "n"<br />
for Reporting Purposes (Y/N)<br />
State Target for % of Districts Meeting<br />
AYP for Disability Subgroup<br />
State<br />
Target<br />
3.06% 4.20%<br />
LEA<br />
Rate<br />
6.38%<br />
% of Districts Meeting AYP<br />
for Disability Subgroup<br />
Target Met by<br />
LEA (Y/N)<br />
N<br />
Target Met by<br />
LEA(Y/N)<br />
Overall N 17.15% 6.25%<br />
NA<br />
N<br />
N<br />
Note: For a district to qualify as having a disability subgroup it must have a minimum of 40 (n=40) students with disabilities in a school building.<br />
B) Participation<br />
Participation Rate: # of<br />
CWD Tested ÷ # of CWD<br />
Enrolled in grades tested.<br />
Participation Rate: Literacy<br />
Participation Rate: Math<br />
Note: - - denotes not applicable<br />
State<br />
Rate<br />
98.78%<br />
State<br />
Target<br />
95.00%<br />
LEA<br />
Rate<br />
98.88%<br />
Target Met<br />
by LEA (Y/N)<br />
98.61% 95.00% 98.91% Y<br />
Y<br />
C) Performance Proficiency<br />
Percent of CWD Scoring<br />
Proficient or Above<br />
Proficiency Rate: Literacy<br />
Proficiency Rate:<br />
Mathematics<br />
16.00%<br />
16.00%<br />
State<br />
Rate<br />
31.49%<br />
44.86%<br />
State<br />
Target<br />
45.22%<br />
51.14%<br />
LEA<br />
Rate<br />
10.65%<br />
23.56%<br />
NA<br />
NA<br />
Target<br />
Met by<br />
LEA (Y/N)<br />
N<br />
N<br />
Page 1 of 5
LEA: 4702 - BLYTHEVILLE SCHOOL <strong>DISTRICT</strong><br />
Indicator 04: Out-of-School Suspensions and Expulsions (2009/10 school year)<br />
A) Suspension/Expulsion<br />
Percent difference of CWD with out-of- school suspensions and<br />
expulsions totaling greater than 10 days in a school year as<br />
compared to the same data for general education students in<br />
the district.<br />
B) Suspension/Expulsion by Race and Ethnicity<br />
Percent of districts that have: (a) a significant discrepancy, by race or<br />
ethnicity, in the rate of suspensions and expulsions of greater than 10<br />
days in a school year for children with IEPs; and (b) policies,<br />
procedures or practices that contribute to the significant discrepancy<br />
and do not comply with requirements relating to the development<br />
and implementation of IEPs, the use of positive behavioral<br />
interventions and supports, and procedural safeguards.<br />
Indicator 05: School Age (5-21) Least Restrictive Environment<br />
A) In the Regular Class 80% or more of the day<br />
Percent of CWD with<br />
IEPs receiving instruction<br />
in the regular class 80%<br />
or more of the day.<br />
State<br />
Rate<br />
State<br />
Target<br />
LEA<br />
Rate<br />
B) In the Regular Class less than 40% of the day<br />
Percent of CWD with<br />
IEPs receiving instruction<br />
in the regular class less<br />
than 60% of the day.<br />
53.87% 59.77%<br />
State<br />
Rate<br />
State<br />
Target<br />
12.42% 12.51%<br />
36.59%<br />
LEA<br />
Rate<br />
10.89%<br />
C) Other Settings outside the regular class<br />
Percent of CWD with IEPs served in<br />
public or private separate schools,<br />
residential placements, or<br />
homebound/hospital placements.<br />
State<br />
Rate<br />
State<br />
Target<br />
2.80% 2.56%<br />
Target Met<br />
by LEA (Y/N)<br />
N<br />
Target Met<br />
by LEA (Y/N)<br />
Y<br />
LEA<br />
Rate<br />
0.84%<br />
Target Met<br />
by LEA(Y/N)<br />
Indicator 06: Early Childhood (3-5) Least Restrictive Environment<br />
A) Regular Early Childhood Program<br />
Percent of children (aged 3 through 5) with IEPs attending a regular<br />
early childhood program and receiving the majority of special<br />
education and related services in the regular early childhood program<br />
Allowable<br />
Difference<br />
LEA: 4702 - BLYTHEVILLE SCHOOL <strong>DISTRICT</strong><br />
Indicator 07: Preschool (3-5) Outcomes<br />
a) Percent of preschool CWD<br />
children who did not<br />
improve functioning.<br />
b) Percent of preschool CWD<br />
who improved but whose<br />
functioning remained below<br />
same age peers.<br />
c) Percent of preschool CWD<br />
who improved at a level<br />
nearer to same aged peers.<br />
d) Percent of preschool CWD<br />
who improved functioning to<br />
reach a level comparable to<br />
same age peers.<br />
e) Percent of preschool CWD<br />
children who maintain<br />
functioning at a level<br />
comparable to same aged<br />
peers.<br />
Summary<br />
Statements<br />
1) Of those preschool<br />
children who entered<br />
the preschool program<br />
below age expectations<br />
in each Outcome, the<br />
percent who<br />
substantially increased<br />
their rate of growth by<br />
the time they turned 6<br />
years of age or exited<br />
the program.<br />
2) The percent of<br />
preschool children who<br />
were functioning<br />
within age expectations<br />
in each Outcome by the<br />
time they turned 6<br />
years of age or exited<br />
A) Positive Social -Emotional<br />
Skills*<br />
State<br />
Rate<br />
A) Positive Social -<br />
Emotional Skills<br />
(Including social<br />
relationships)<br />
State<br />
Rate<br />
2.14%<br />
5.31%<br />
25.97%<br />
38.22%<br />
28.36%<br />
State<br />
Target<br />
LEA<br />
Rate<br />
LEA<br />
Rate<br />
— —<br />
— —<br />
— —<br />
— —<br />
— —<br />
Target<br />
Met by<br />
LEA(Y/N)<br />
B) Acquisition and Use of<br />
Knowledge and Skills<br />
(Including early language/<br />
communication and early literacy)<br />
B) Acquisition and Use of<br />
Knowledge and Skills **<br />
State<br />
Rate<br />
1.75%<br />
6.59%<br />
34.23%<br />
43.51%<br />
13.92%<br />
State<br />
Target<br />
LEA<br />
Rate<br />
Target<br />
Met by<br />
LEA(Y/N)<br />
C) Use of Appropriate Behaviors<br />
to Meet Their Needs<br />
State<br />
Rate<br />
State<br />
Target<br />
LEA<br />
Rate<br />
Target<br />
Met by<br />
LEA(Y/N)<br />
89.61% 90.50% — — N/A 90.31% 90.50% — — N/A 90.82% 92.50% — — N/A<br />
66.58% 69.50% — — N/A 57.43% 60.50% — — N/A 76.69% 78.50% — — N/A<br />
NOTE: * Including social relationships ** Including early language/ communication and early literacy<br />
Note: - - denotes not applicable<br />
State<br />
Rate<br />
LEA<br />
Rate<br />
— —<br />
— —<br />
— —<br />
— —<br />
— —<br />
C) Use of<br />
Appropriate<br />
Behaviors to<br />
Meet Their Needs<br />
State<br />
Rate<br />
4.51%<br />
17.34%<br />
41.72%<br />
34.97%<br />
LEA<br />
Rate<br />
1.46% — —<br />
— —<br />
— —<br />
— —<br />
— —<br />
Page 3 of 5
LEA: 4702 - BLYTHEVILLE SCHOOL <strong>DISTRICT</strong><br />
Indicator 08: Parent Involvement<br />
Percent of surveyed<br />
parents who reported<br />
school facilitated parent<br />
involvement as a means<br />
of improving services<br />
and results for children<br />
with disabilities.<br />
Early Childhood<br />
(3-5)<br />
School Age<br />
(5-21)<br />
State<br />
Rate<br />
90.47%<br />
95.05%<br />
Indicator 09: Disproportionality - Eligibility<br />
Disproportionate representation of racial<br />
and ethnic groups in special education and<br />
related services that is a result of<br />
inappropriate identification (e.g.<br />
monitoring data, review of policies,<br />
practices, and procedures under 618(d),<br />
etc.).<br />
State<br />
Rate<br />
State<br />
Target<br />
88.00%<br />
96.00%<br />
State<br />
Target<br />
0.00% 0.00%<br />
LEA<br />
Rate<br />
— —<br />
97.04%<br />
Indicator 10: Disproportionality-Child with a Disability<br />
Disproportionate representation of racial<br />
and ethnic groups in specific disability<br />
categories that is a result of inappropriate<br />
identification (e.g. monitoring data, review<br />
of policies, practices, and procedures under<br />
618(d), etc.).<br />
Indicator 11: Child Find<br />
Percent of children with<br />
parental consent to evaluate<br />
who are evaluated within<br />
the State established timeline<br />
of 60 days.<br />
Overall<br />
(3-21)<br />
Early Childhood<br />
(3-5)<br />
School Age<br />
(5-21)<br />
State<br />
Rate<br />
0.00%<br />
Indicator 12: Early Childhood Transition<br />
Percent of children referred by Part C prior to<br />
age 3, who are found eligible for Part B, and<br />
who have an IEP developed and implemented<br />
by their third birthday.<br />
Note: - - denotes not applicable<br />
State<br />
Rate<br />
99.41%<br />
99.70%<br />
98.97%<br />
State<br />
Rate<br />
State<br />
Target<br />
0.00%<br />
State<br />
Target<br />
100.00%<br />
100.00%<br />
100.00%<br />
State<br />
Target<br />
Target Met by<br />
LEA (Y/N)<br />
Y<br />
Target Met by<br />
LEA (Y/N)<br />
Y<br />
LEA<br />
Rate<br />
100.00%<br />
— —<br />
100.00%<br />
LEA<br />
Rate<br />
Target Met by<br />
LEA (Y/N)<br />
N/A<br />
Y<br />
Note: The target for Indicator 09 is to have zero percent<br />
(0%) of districts identified as having disproportionate<br />
representation as a result of inappropriate<br />
identification in eligibility.<br />
Note: The target for Indicator 10 is to have zero<br />
percent (0%) of districts identified as having<br />
disproportionate representation as a result of<br />
inappropriate identification in a disability<br />
category.<br />
Target Met by<br />
LEA (Y/N)<br />
N/A<br />
Y<br />
Target Met<br />
by LEA<br />
(Y/N)<br />
99.21% 100.00% - - N/A<br />
Y<br />
Note: * Indicates a zero reponse rate for the<br />
district.<br />
Page 4 of 5
LEA: 4702 - BLYTHEVILLE SCHOOL <strong>DISTRICT</strong><br />
Indicator 13: Secondary Transition<br />
Percent of youth with disabilities aged 16 and<br />
up with an IEP that includes coordinated,<br />
measurable, annual IEP goals and transition<br />
services that will reasonably enable the student<br />
to meet the post-secondary goals.<br />
Indicator 14: Post-School Outcomes<br />
A. Percent of youth enrolled in higher<br />
education within one year of leaving high<br />
school.<br />
State<br />
Rate<br />
State<br />
Target<br />
Note: Data for this Indicator is from the on-site monitoring of LEAs for the given year.<br />
B. Percent of youth enrolled in higher<br />
education or competitively employed<br />
within one year of leaving high school.<br />
C. Percent of youth enrolled in higher<br />
education or in some other postsecondary<br />
education or training program; or<br />
competitively employed or in some other<br />
employment within one year of leaving<br />
high school.<br />
State<br />
Rate<br />
Indicator 20: Reported Data-Timely and Accurate*<br />
District submitted<br />
required data elements<br />
on or before due dates;<br />
made revisions within<br />
the alloted reveiw<br />
periods.<br />
Accurate and Timely<br />
Data Submission<br />
Overall (3-21)<br />
Early Childhood (3-5)<br />
School Age (5-21)<br />
State<br />
Target<br />
100.00%<br />
100.00%<br />
100.00%<br />
State<br />
Target<br />
LEA<br />
Rate<br />
LEA<br />
Rate<br />
Target Met by<br />
LEA (Y/N)<br />
Target Met<br />
by LEA<br />
(Y/N)<br />
Target Met<br />
by LEA<br />
(Y/N)<br />
*Data reviewed for timely and accurate submissions included all APSCN cycle data except for personnel<br />
Note: - - denotes not applicable<br />
96.19 100.00 — — N/A<br />
14.53<br />
State<br />
Rate<br />
49.42<br />
State<br />
Rate<br />
54.07<br />
13.00<br />
State<br />
Target<br />
49.00<br />
State<br />
Target<br />
60.00<br />
Y<br />
N/A<br />
Y<br />
0.00%<br />
LEA<br />
Rate<br />
33.33%<br />
LEA<br />
Rate<br />
33.33%<br />
N<br />
Target Met<br />
by LEA<br />
(Y/N)<br />
N<br />
Target Met<br />
by LEA<br />
(Y/N)<br />
N<br />
Page 5 of 5
<strong>ARKANSAS</strong> <strong>SPECIAL</strong> <strong>EDUCATION</strong><br />
<strong>DISTRICT</strong> <strong>ANNUAL</strong> PERFORMANCE REPORT<br />
2010/11 School Year<br />
Publication Date: March 2012<br />
Each State must have in place a State Performance Plan (SPP) to evaluate the State's efforts to meet the requirements and<br />
purposes of the implementation of the Individuals with Disabilities Education Act (IDEA). The SPP is a six-year plan, which<br />
describes Arkansas's performance on 20 indicators. The Office of Special Education Programs in the U. S. Department of<br />
Education requires that States report annually to the public on the performance of each local education agency (LEA) on 14 of<br />
20 indicators as compared with targets established by the State in the SPP. Arkansas will report indicators 1 through 14 and<br />
20 for each LEA serving children with disabilities (CWD). Any LEA not meeting targets on compliance indicators (0% for<br />
Indicators 4B, 09 & 10 and 100% for Indicators 11, 12, 13, and 20) are non-compliant with IDEA.<br />
There are no report changes for the 2010/11 school year profile; However, it is important to recognize that: .<br />
1. Indicator 01 (Graduation) is reported a year in arrear (2009/10 graduates) and is based on a four-year cohort. This<br />
means the rate is a measure of students who entered in ninth grade and graduate in four years. The calculation is a<br />
requirement under Title I of the Elementary and Secondary Education Act (ESEA).<br />
2. Indicator 02 (Drop out) is reported a year in arrear. This means the rate is a measure of students who dropped out in<br />
the 2009/10 school year. The Indicator 02 data are aligned with the Common Core of Data (CCD) requirements for<br />
grades 7-12.<br />
3. Indicator 04A and 4B (Suspension/Expulsion) is reported a year in arrear. This means the rate is a measure of<br />
students who had out-of-school suspensions and/or expulsions totaling more than 10 days.<br />
For a complete description of all the Indicators, please visit the special education website at<br />
http://arksped.k12.ar.us/sections/policy.html<br />
LEA: 4706 - SO. MISS. COUNTY SCHOOL <strong>DISTRICT</strong><br />
Indicator 01: Graduation Rates (2009/10 school year) Indicator 02: Dropout Rates (2009/10 school year)<br />
Percent of youth<br />
with IEPs<br />
graduating from<br />
high school with a<br />
regular diploma<br />
State<br />
Rate<br />
State<br />
Target<br />
75.76% 85.00%<br />
LEA<br />
Rate<br />
66.67%<br />
Target Met<br />
by LEA<br />
(Y/N)<br />
N<br />
Percent of<br />
youth with<br />
IEPs dropping<br />
out of high<br />
school<br />
State<br />
Rate<br />
Indicator 03: Assessment on Statewide Benchmark Exam (grades 3-8, 11)<br />
A) Adequate Yearly Progress<br />
n=40<br />
Literacy<br />
Mathematics<br />
Met Disability Subgroup "n"<br />
for Reporting Purposes (Y/N)<br />
State Target for % of Districts Meeting<br />
AYP for Disability Subgroup<br />
State<br />
Target<br />
3.06% 4.20%<br />
LEA<br />
Rate<br />
0.00%<br />
% of Districts Meeting AYP<br />
for Disability Subgroup<br />
Target Met by<br />
LEA (Y/N)<br />
Y<br />
Target Met by<br />
LEA(Y/N)<br />
Overall N 17.15% 6.25%<br />
NA<br />
N<br />
N<br />
Note: For a district to qualify as having a disability subgroup it must have a minimum of 40 (n=40) students with disabilities in a school building.<br />
B) Participation<br />
Participation Rate: # of<br />
CWD Tested ÷ # of CWD<br />
Enrolled in grades tested.<br />
Participation Rate: Literacy<br />
Participation Rate: Math<br />
Note: - - denotes not applicable<br />
State<br />
Rate<br />
98.78%<br />
State<br />
Target<br />
95.00%<br />
LEA<br />
Rate<br />
96.92%<br />
Target Met<br />
by LEA (Y/N)<br />
98.61% 95.00% 96.92% Y<br />
Y<br />
C) Performance Proficiency<br />
Percent of CWD Scoring<br />
Proficient or Above<br />
Proficiency Rate: Literacy<br />
Proficiency Rate:<br />
Mathematics<br />
16.00%<br />
16.00%<br />
State<br />
Rate<br />
31.49%<br />
44.86%<br />
State<br />
Target<br />
45.22%<br />
51.14%<br />
LEA<br />
Rate<br />
18.97%<br />
32.76%<br />
NA<br />
NA<br />
Target<br />
Met by<br />
LEA (Y/N)<br />
N<br />
N<br />
Page 1 of 5
LEA: 4706 - SO. MISS. COUNTY SCHOOL <strong>DISTRICT</strong><br />
Indicator 04: Out-of-School Suspensions and Expulsions (2009/10 school year)<br />
A) Suspension/Expulsion<br />
Percent difference of CWD with out-of- school suspensions and<br />
expulsions totaling greater than 10 days in a school year as<br />
compared to the same data for general education students in<br />
the district.<br />
B) Suspension/Expulsion by Race and Ethnicity<br />
Percent of districts that have: (a) a significant discrepancy, by race or<br />
ethnicity, in the rate of suspensions and expulsions of greater than 10<br />
days in a school year for children with IEPs; and (b) policies,<br />
procedures or practices that contribute to the significant discrepancy<br />
and do not comply with requirements relating to the development<br />
and implementation of IEPs, the use of positive behavioral<br />
interventions and supports, and procedural safeguards.<br />
Indicator 05: School Age (5-21) Least Restrictive Environment<br />
A) In the Regular Class 80% or more of the day<br />
Percent of CWD with<br />
IEPs receiving instruction<br />
in the regular class 80%<br />
or more of the day.<br />
State<br />
Rate<br />
State<br />
Target<br />
LEA<br />
Rate<br />
B) In the Regular Class less than 40% of the day<br />
Percent of CWD with<br />
IEPs receiving instruction<br />
in the regular class less<br />
than 60% of the day.<br />
53.87% 59.77%<br />
State<br />
Rate<br />
State<br />
Target<br />
12.42% 12.51%<br />
70.63%<br />
LEA<br />
Rate<br />
7.14%<br />
C) Other Settings outside the regular class<br />
Percent of CWD with IEPs served in<br />
public or private separate schools,<br />
residential placements, or<br />
homebound/hospital placements.<br />
State<br />
Rate<br />
State<br />
Target<br />
2.80% 2.56%<br />
Target Met<br />
by LEA (Y/N)<br />
Y<br />
Target Met<br />
by LEA (Y/N)<br />
Y<br />
LEA<br />
Rate<br />
0.79%<br />
Target Met<br />
by LEA(Y/N)<br />
Indicator 06: Early Childhood (3-5) Least Restrictive Environment<br />
A) Regular Early Childhood Program<br />
Percent of children (aged 3 through 5) with IEPs attending a regular<br />
early childhood program and receiving the majority of special<br />
education and related services in the regular early childhood program<br />
Allowable<br />
Difference<br />
LEA: 4706 - SO. MISS. COUNTY SCHOOL <strong>DISTRICT</strong><br />
Indicator 07: Preschool (3-5) Outcomes<br />
a) Percent of preschool CWD<br />
children who did not<br />
improve functioning.<br />
b) Percent of preschool CWD<br />
who improved but whose<br />
functioning remained below<br />
same age peers.<br />
c) Percent of preschool CWD<br />
who improved at a level<br />
nearer to same aged peers.<br />
d) Percent of preschool CWD<br />
who improved functioning to<br />
reach a level comparable to<br />
same age peers.<br />
e) Percent of preschool CWD<br />
children who maintain<br />
functioning at a level<br />
comparable to same aged<br />
peers.<br />
Summary<br />
Statements<br />
1) Of those preschool<br />
children who entered<br />
the preschool program<br />
below age expectations<br />
in each Outcome, the<br />
percent who<br />
substantially increased<br />
their rate of growth by<br />
the time they turned 6<br />
years of age or exited<br />
the program.<br />
2) The percent of<br />
preschool children who<br />
were functioning<br />
within age expectations<br />
in each Outcome by the<br />
time they turned 6<br />
years of age or exited<br />
A) Positive Social -Emotional<br />
Skills*<br />
State<br />
Rate<br />
A) Positive Social -<br />
Emotional Skills<br />
(Including social<br />
relationships)<br />
State<br />
Rate<br />
2.14%<br />
5.31%<br />
25.97%<br />
38.22%<br />
28.36%<br />
State<br />
Target<br />
LEA<br />
Rate<br />
LEA<br />
Rate<br />
— —<br />
— —<br />
— —<br />
— —<br />
— —<br />
Target<br />
Met by<br />
LEA(Y/N)<br />
B) Acquisition and Use of<br />
Knowledge and Skills<br />
(Including early language/<br />
communication and early literacy)<br />
B) Acquisition and Use of<br />
Knowledge and Skills **<br />
State<br />
Rate<br />
1.75%<br />
6.59%<br />
34.23%<br />
43.51%<br />
13.92%<br />
State<br />
Target<br />
LEA<br />
Rate<br />
Target<br />
Met by<br />
LEA(Y/N)<br />
C) Use of Appropriate Behaviors<br />
to Meet Their Needs<br />
State<br />
Rate<br />
State<br />
Target<br />
LEA<br />
Rate<br />
Target<br />
Met by<br />
LEA(Y/N)<br />
89.61% 90.50% — — N/A 90.31% 90.50% — — N/A 90.82% 92.50% — — N/A<br />
66.58% 69.50% — — N/A 57.43% 60.50% — — N/A 76.69% 78.50% — — N/A<br />
NOTE: * Including social relationships ** Including early language/ communication and early literacy<br />
Note: - - denotes not applicable<br />
State<br />
Rate<br />
LEA<br />
Rate<br />
— —<br />
— —<br />
— —<br />
— —<br />
— —<br />
C) Use of<br />
Appropriate<br />
Behaviors to<br />
Meet Their Needs<br />
State<br />
Rate<br />
4.51%<br />
17.34%<br />
41.72%<br />
34.97%<br />
LEA<br />
Rate<br />
1.46% — —<br />
— —<br />
— —<br />
— —<br />
— —<br />
Page 3 of 5
LEA: 4706 - SO. MISS. COUNTY SCHOOL <strong>DISTRICT</strong><br />
Indicator 08: Parent Involvement<br />
Percent of surveyed<br />
parents who reported<br />
school facilitated parent<br />
involvement as a means<br />
of improving services<br />
and results for children<br />
with disabilities.<br />
Early Childhood<br />
(3-5)<br />
School Age<br />
(5-21)<br />
State<br />
Rate<br />
90.47%<br />
95.05%<br />
Indicator 09: Disproportionality - Eligibility<br />
Disproportionate representation of racial<br />
and ethnic groups in special education and<br />
related services that is a result of<br />
inappropriate identification (e.g.<br />
monitoring data, review of policies,<br />
practices, and procedures under 618(d),<br />
etc.).<br />
State<br />
Rate<br />
State<br />
Target<br />
88.00%<br />
96.00%<br />
State<br />
Target<br />
0.00% 0.00%<br />
LEA<br />
Rate<br />
— —<br />
100.00%<br />
Indicator 10: Disproportionality-Child with a Disability<br />
Disproportionate representation of racial<br />
and ethnic groups in specific disability<br />
categories that is a result of inappropriate<br />
identification (e.g. monitoring data, review<br />
of policies, practices, and procedures under<br />
618(d), etc.).<br />
Indicator 11: Child Find<br />
Percent of children with<br />
parental consent to evaluate<br />
who are evaluated within<br />
the State established timeline<br />
of 60 days.<br />
Overall<br />
(3-21)<br />
Early Childhood<br />
(3-5)<br />
School Age<br />
(5-21)<br />
State<br />
Rate<br />
0.00%<br />
Indicator 12: Early Childhood Transition<br />
Percent of children referred by Part C prior to<br />
age 3, who are found eligible for Part B, and<br />
who have an IEP developed and implemented<br />
by their third birthday.<br />
Note: - - denotes not applicable<br />
State<br />
Rate<br />
99.41%<br />
99.70%<br />
98.97%<br />
State<br />
Rate<br />
State<br />
Target<br />
0.00%<br />
State<br />
Target<br />
100.00%<br />
100.00%<br />
100.00%<br />
State<br />
Target<br />
Target Met by<br />
LEA (Y/N)<br />
Y<br />
Target Met by<br />
LEA (Y/N)<br />
Y<br />
LEA<br />
Rate<br />
100.00%<br />
— —<br />
100.00%<br />
LEA<br />
Rate<br />
Target Met by<br />
LEA (Y/N)<br />
N/A<br />
Y<br />
Note: The target for Indicator 09 is to have zero percent<br />
(0%) of districts identified as having disproportionate<br />
representation as a result of inappropriate<br />
identification in eligibility.<br />
Note: The target for Indicator 10 is to have zero<br />
percent (0%) of districts identified as having<br />
disproportionate representation as a result of<br />
inappropriate identification in a disability<br />
category.<br />
Target Met by<br />
LEA (Y/N)<br />
N/A<br />
Y<br />
Target Met<br />
by LEA<br />
(Y/N)<br />
99.21% 100.00% - - N/A<br />
Y<br />
Note: * Indicates a zero reponse rate for the<br />
district.<br />
Page 4 of 5
LEA: 4706 - SO. MISS. COUNTY SCHOOL <strong>DISTRICT</strong><br />
Indicator 13: Secondary Transition<br />
Percent of youth with disabilities aged 16 and<br />
up with an IEP that includes coordinated,<br />
measurable, annual IEP goals and transition<br />
services that will reasonably enable the student<br />
to meet the post-secondary goals.<br />
Indicator 14: Post-School Outcomes<br />
A. Percent of youth enrolled in higher<br />
education within one year of leaving high<br />
school.<br />
State<br />
Rate<br />
State<br />
Target<br />
Note: Data for this Indicator is from the on-site monitoring of LEAs for the given year.<br />
B. Percent of youth enrolled in higher<br />
education or competitively employed<br />
within one year of leaving high school.<br />
C. Percent of youth enrolled in higher<br />
education or in some other postsecondary<br />
education or training program; or<br />
competitively employed or in some other<br />
employment within one year of leaving<br />
high school.<br />
State<br />
Rate<br />
Indicator 20: Reported Data-Timely and Accurate*<br />
District submitted<br />
required data elements<br />
on or before due dates;<br />
made revisions within<br />
the alloted reveiw<br />
periods.<br />
Accurate and Timely<br />
Data Submission<br />
Overall (3-21)<br />
Early Childhood (3-5)<br />
School Age (5-21)<br />
State<br />
Target<br />
100.00%<br />
100.00%<br />
100.00%<br />
State<br />
Target<br />
LEA<br />
Rate<br />
LEA<br />
Rate<br />
Target Met by<br />
LEA (Y/N)<br />
Target Met<br />
by LEA<br />
(Y/N)<br />
Target Met<br />
by LEA<br />
(Y/N)<br />
*Data reviewed for timely and accurate submissions included all APSCN cycle data except for personnel<br />
Note: - - denotes not applicable<br />
96.19 100.00 — — N/A<br />
14.53<br />
State<br />
Rate<br />
49.42<br />
State<br />
Rate<br />
54.07<br />
13.00<br />
State<br />
Target<br />
49.00<br />
State<br />
Target<br />
60.00<br />
Y<br />
N/A<br />
Y<br />
0.00%<br />
LEA<br />
Rate<br />
33.33%<br />
LEA<br />
Rate<br />
33.33%<br />
N<br />
Target Met<br />
by LEA<br />
(Y/N)<br />
N<br />
Target Met<br />
by LEA<br />
(Y/N)<br />
N<br />
Page 5 of 5
LEA: 4708 - GOSNELL SCHOOL <strong>DISTRICT</strong><br />
<strong>ARKANSAS</strong> <strong>SPECIAL</strong> <strong>EDUCATION</strong><br />
<strong>DISTRICT</strong> <strong>ANNUAL</strong> PERFORMANCE REPORT<br />
2010/11 School Year<br />
Publication Date: March 2012<br />
Each State must have in place a State Performance Plan (SPP) to evaluate the State's efforts to meet the requirements and<br />
purposes of the implementation of the Individuals with Disabilities Education Act (IDEA). The SPP is a six-year plan, which<br />
describes Arkansas's performance on 20 indicators. The Office of Special Education Programs in the U. S. Department of<br />
Education requires that States report annually to the public on the performance of each local education agency (LEA) on 14 of<br />
20 indicators as compared with targets established by the State in the SPP. Arkansas will report indicators 1 through 14 and<br />
20 for each LEA serving children with disabilities (CWD). Any LEA not meeting targets on compliance indicators (0% for<br />
Indicators 4B, 09 & 10 and 100% for Indicators 11, 12, 13, and 20) are non-compliant with IDEA.<br />
There are no report changes for the 2010/11 school year profile; However, it is important to recognize that: .<br />
1. Indicator 01 (Graduation) is reported a year in arrear (2009/10 graduates) and is based on a four-year cohort. This<br />
means the rate is a measure of students who entered in ninth grade and graduate in four years. The calculation is a<br />
requirement under Title I of the Elementary and Secondary Education Act (ESEA).<br />
2. Indicator 02 (Drop out) is reported a year in arrear. This means the rate is a measure of students who dropped out in<br />
the 2009/10 school year. The Indicator 02 data are aligned with the Common Core of Data (CCD) requirements for<br />
grades 7-12.<br />
3. Indicator 04A and 4B (Suspension/Expulsion) is reported a year in arrear. This means the rate is a measure of<br />
students who had out-of-school suspensions and/or expulsions totaling more than 10 days.<br />
Percent of youth<br />
with IEPs<br />
graduating from<br />
high school with a<br />
regular diploma<br />
For a complete description of all the Indicators, please visit the special education website at<br />
http://arksped.k12.ar.us/sections/policy.html<br />
Indicator 01: Graduation Rates (2009/10 school year) Indicator 02: Dropout Rates (2009/10 school year)<br />
State<br />
Rate<br />
State<br />
Target<br />
75.76% 85.00%<br />
LEA<br />
Rate<br />
60.00%<br />
Target Met<br />
by LEA<br />
(Y/N)<br />
N<br />
Percent of<br />
youth with<br />
IEPs dropping<br />
out of high<br />
school<br />
State<br />
Rate<br />
Indicator 03: Assessment on Statewide Benchmark Exam (grades 3-8, 11)<br />
A) Adequate Yearly Progress<br />
n=40<br />
Literacy<br />
Mathematics<br />
Met Disability Subgroup "n"<br />
for Reporting Purposes (Y/N)<br />
State Target for % of Districts Meeting<br />
AYP for Disability Subgroup<br />
State<br />
Target<br />
3.06% 4.20%<br />
LEA<br />
Rate<br />
8.82%<br />
% of Districts Meeting AYP<br />
for Disability Subgroup<br />
Target Met by<br />
LEA (Y/N)<br />
N<br />
Target Met by<br />
LEA(Y/N)<br />
Overall N 17.15% 6.25%<br />
NA<br />
N<br />
N<br />
Note: For a district to qualify as having a disability subgroup it must have a minimum of 40 (n=40) students with disabilities in a school building.<br />
B) Participation<br />
Participation Rate: # of<br />
CWD Tested ÷ # of CWD<br />
Enrolled in grades tested.<br />
Participation Rate: Literacy<br />
Participation Rate: Math<br />
Note: - - denotes not applicable<br />
State<br />
Rate<br />
98.78%<br />
State<br />
Target<br />
95.00%<br />
LEA<br />
Rate<br />
100.00%<br />
Target Met<br />
by LEA (Y/N)<br />
98.61% 95.00% 100.00% Y<br />
Y<br />
C) Performance Proficiency<br />
Percent of CWD Scoring<br />
Proficient or Above<br />
Proficiency Rate: Literacy<br />
Proficiency Rate:<br />
Mathematics<br />
16.00%<br />
16.00%<br />
State<br />
Rate<br />
31.49%<br />
44.86%<br />
State<br />
Target<br />
45.22%<br />
51.14%<br />
LEA<br />
Rate<br />
44.29%<br />
51.39%<br />
NA<br />
NA<br />
Target<br />
Met by<br />
LEA (Y/N)<br />
N<br />
Y<br />
Page 1 of 5
LEA: 4708 - GOSNELL SCHOOL <strong>DISTRICT</strong><br />
Indicator 04: Out-of-School Suspensions and Expulsions (2009/10 school year)<br />
A) Suspension/Expulsion<br />
Percent difference of CWD with out-of- school suspensions and<br />
expulsions totaling greater than 10 days in a school year as<br />
compared to the same data for general education students in<br />
the district.<br />
B) Suspension/Expulsion by Race and Ethnicity<br />
Percent of districts that have: (a) a significant discrepancy, by race or<br />
ethnicity, in the rate of suspensions and expulsions of greater than 10<br />
days in a school year for children with IEPs; and (b) policies,<br />
procedures or practices that contribute to the significant discrepancy<br />
and do not comply with requirements relating to the development<br />
and implementation of IEPs, the use of positive behavioral<br />
interventions and supports, and procedural safeguards.<br />
Indicator 05: School Age (5-21) Least Restrictive Environment<br />
A) In the Regular Class 80% or more of the day<br />
Percent of CWD with<br />
IEPs receiving instruction<br />
in the regular class 80%<br />
or more of the day.<br />
State<br />
Rate<br />
State<br />
Target<br />
LEA<br />
Rate<br />
B) In the Regular Class less than 40% of the day<br />
Percent of CWD with<br />
IEPs receiving instruction<br />
in the regular class less<br />
than 60% of the day.<br />
53.87% 59.77%<br />
State<br />
Rate<br />
State<br />
Target<br />
12.42% 12.51%<br />
48.98%<br />
LEA<br />
Rate<br />
15.65%<br />
C) Other Settings outside the regular class<br />
Percent of CWD with IEPs served in<br />
public or private separate schools,<br />
residential placements, or<br />
homebound/hospital placements.<br />
State<br />
Rate<br />
State<br />
Target<br />
2.80% 2.56%<br />
Target Met<br />
by LEA (Y/N)<br />
N<br />
Target Met<br />
by LEA (Y/N)<br />
N<br />
LEA<br />
Rate<br />
2.72%<br />
Target Met<br />
by LEA(Y/N)<br />
Indicator 06: Early Childhood (3-5) Least Restrictive Environment<br />
A) Regular Early Childhood Program<br />
Percent of children (aged 3 through 5) with IEPs attending a regular<br />
early childhood program and receiving the majority of special<br />
education and related services in the regular early childhood program<br />
Allowable<br />
Difference<br />
LEA: 4708 - GOSNELL SCHOOL <strong>DISTRICT</strong><br />
Indicator 07: Preschool (3-5) Outcomes<br />
a) Percent of preschool CWD<br />
children who did not<br />
improve functioning.<br />
b) Percent of preschool CWD<br />
who improved but whose<br />
functioning remained below<br />
same age peers.<br />
c) Percent of preschool CWD<br />
who improved at a level<br />
nearer to same aged peers.<br />
d) Percent of preschool CWD<br />
who improved functioning to<br />
reach a level comparable to<br />
same age peers.<br />
e) Percent of preschool CWD<br />
children who maintain<br />
functioning at a level<br />
comparable to same aged<br />
peers.<br />
Summary<br />
Statements<br />
1) Of those preschool<br />
children who entered<br />
the preschool program<br />
below age expectations<br />
in each Outcome, the<br />
percent who<br />
substantially increased<br />
their rate of growth by<br />
the time they turned 6<br />
years of age or exited<br />
the program.<br />
2) The percent of<br />
preschool children who<br />
were functioning<br />
within age expectations<br />
in each Outcome by the<br />
time they turned 6<br />
years of age or exited<br />
A) Positive Social -Emotional<br />
Skills*<br />
State<br />
Rate<br />
A) Positive Social -<br />
Emotional Skills<br />
(Including social<br />
relationships)<br />
State<br />
Rate<br />
2.14%<br />
5.31%<br />
25.97%<br />
38.22%<br />
28.36%<br />
State<br />
Target<br />
LEA<br />
Rate<br />
LEA<br />
Rate<br />
— —<br />
— —<br />
— —<br />
— —<br />
— —<br />
Target<br />
Met by<br />
LEA(Y/N)<br />
B) Acquisition and Use of<br />
Knowledge and Skills<br />
(Including early language/<br />
communication and early literacy)<br />
B) Acquisition and Use of<br />
Knowledge and Skills **<br />
State<br />
Rate<br />
1.75%<br />
6.59%<br />
34.23%<br />
43.51%<br />
13.92%<br />
State<br />
Target<br />
LEA<br />
Rate<br />
Target<br />
Met by<br />
LEA(Y/N)<br />
C) Use of Appropriate Behaviors<br />
to Meet Their Needs<br />
State<br />
Rate<br />
State<br />
Target<br />
LEA<br />
Rate<br />
Target<br />
Met by<br />
LEA(Y/N)<br />
89.61% 90.50% — — N/A 90.31% 90.50% — — N/A 90.82% 92.50% — — N/A<br />
66.58% 69.50% — — N/A 57.43% 60.50% — — N/A 76.69% 78.50% — — N/A<br />
NOTE: * Including social relationships ** Including early language/ communication and early literacy<br />
Note: - - denotes not applicable<br />
State<br />
Rate<br />
LEA<br />
Rate<br />
— —<br />
— —<br />
— —<br />
— —<br />
— —<br />
C) Use of<br />
Appropriate<br />
Behaviors to<br />
Meet Their Needs<br />
State<br />
Rate<br />
4.51%<br />
17.34%<br />
41.72%<br />
34.97%<br />
LEA<br />
Rate<br />
1.46% — —<br />
— —<br />
— —<br />
— —<br />
— —<br />
Page 3 of 5
LEA: 4708 - GOSNELL SCHOOL <strong>DISTRICT</strong><br />
Indicator 08: Parent Involvement<br />
Percent of surveyed<br />
parents who reported<br />
school facilitated parent<br />
involvement as a means<br />
of improving services<br />
and results for children<br />
with disabilities.<br />
Early Childhood<br />
(3-5)<br />
School Age<br />
(5-21)<br />
State<br />
Rate<br />
90.47%<br />
95.05%<br />
Indicator 09: Disproportionality - Eligibility<br />
Disproportionate representation of racial<br />
and ethnic groups in special education and<br />
related services that is a result of<br />
inappropriate identification (e.g.<br />
monitoring data, review of policies,<br />
practices, and procedures under 618(d),<br />
etc.).<br />
State<br />
Rate<br />
State<br />
Target<br />
88.00%<br />
96.00%<br />
State<br />
Target<br />
0.00% 0.00%<br />
LEA<br />
Rate<br />
— —<br />
97.52%<br />
Indicator 10: Disproportionality-Child with a Disability<br />
Disproportionate representation of racial<br />
and ethnic groups in specific disability<br />
categories that is a result of inappropriate<br />
identification (e.g. monitoring data, review<br />
of policies, practices, and procedures under<br />
618(d), etc.).<br />
Indicator 11: Child Find<br />
Percent of children with<br />
parental consent to evaluate<br />
who are evaluated within<br />
the State established timeline<br />
of 60 days.<br />
Overall<br />
(3-21)<br />
Early Childhood<br />
(3-5)<br />
School Age<br />
(5-21)<br />
State<br />
Rate<br />
0.00%<br />
Indicator 12: Early Childhood Transition<br />
Percent of children referred by Part C prior to<br />
age 3, who are found eligible for Part B, and<br />
who have an IEP developed and implemented<br />
by their third birthday.<br />
Note: - - denotes not applicable<br />
State<br />
Rate<br />
99.41%<br />
99.70%<br />
98.97%<br />
State<br />
Rate<br />
State<br />
Target<br />
0.00%<br />
State<br />
Target<br />
100.00%<br />
100.00%<br />
100.00%<br />
State<br />
Target<br />
Target Met by<br />
LEA (Y/N)<br />
Y<br />
Target Met by<br />
LEA (Y/N)<br />
Y<br />
LEA<br />
Rate<br />
100.00%<br />
— —<br />
100.00%<br />
LEA<br />
Rate<br />
Target Met by<br />
LEA (Y/N)<br />
N/A<br />
Y<br />
Note: The target for Indicator 09 is to have zero percent<br />
(0%) of districts identified as having disproportionate<br />
representation as a result of inappropriate<br />
identification in eligibility.<br />
Note: The target for Indicator 10 is to have zero<br />
percent (0%) of districts identified as having<br />
disproportionate representation as a result of<br />
inappropriate identification in a disability<br />
category.<br />
Target Met by<br />
LEA (Y/N)<br />
N/A<br />
Y<br />
Target Met<br />
by LEA<br />
(Y/N)<br />
99.21% 100.00% - - N/A<br />
Y<br />
Note: * Indicates a zero reponse rate for the<br />
district.<br />
Page 4 of 5
LEA: 4708 - GOSNELL SCHOOL <strong>DISTRICT</strong><br />
Indicator 13: Secondary Transition<br />
Percent of youth with disabilities aged 16 and<br />
up with an IEP that includes coordinated,<br />
measurable, annual IEP goals and transition<br />
services that will reasonably enable the student<br />
to meet the post-secondary goals.<br />
Indicator 14: Post-School Outcomes<br />
A. Percent of youth enrolled in higher<br />
education within one year of leaving high<br />
school.<br />
State<br />
Rate<br />
State<br />
Target<br />
Note: Data for this Indicator is from the on-site monitoring of LEAs for the given year.<br />
B. Percent of youth enrolled in higher<br />
education or competitively employed<br />
within one year of leaving high school.<br />
C. Percent of youth enrolled in higher<br />
education or in some other postsecondary<br />
education or training program; or<br />
competitively employed or in some other<br />
employment within one year of leaving<br />
high school.<br />
State<br />
Rate<br />
Indicator 20: Reported Data-Timely and Accurate*<br />
District submitted<br />
required data elements<br />
on or before due dates;<br />
made revisions within<br />
the alloted reveiw<br />
periods.<br />
Accurate and Timely<br />
Data Submission<br />
Overall (3-21)<br />
Early Childhood (3-5)<br />
School Age (5-21)<br />
State<br />
Target<br />
100.00%<br />
100.00%<br />
100.00%<br />
State<br />
Target<br />
LEA<br />
Rate<br />
LEA<br />
Rate<br />
Target Met by<br />
LEA (Y/N)<br />
Target Met<br />
by LEA<br />
(Y/N)<br />
Target Met<br />
by LEA<br />
(Y/N)<br />
*Data reviewed for timely and accurate submissions included all APSCN cycle data except for personnel<br />
Note: - - denotes not applicable<br />
96.19 100.00 — — N/A<br />
14.53<br />
State<br />
Rate<br />
49.42<br />
State<br />
Rate<br />
54.07<br />
13.00<br />
State<br />
Target<br />
49.00<br />
State<br />
Target<br />
60.00<br />
Y<br />
N/A<br />
Y<br />
— —<br />
LEA<br />
Rate<br />
— —<br />
LEA<br />
Rate<br />
— —<br />
N/A<br />
Target Met<br />
by LEA<br />
(Y/N)<br />
N/A<br />
Target Met<br />
by LEA<br />
(Y/N)<br />
N/A<br />
Page 5 of 5
LEA: 4712 - MANILA SCHOOL <strong>DISTRICT</strong><br />
<strong>ARKANSAS</strong> <strong>SPECIAL</strong> <strong>EDUCATION</strong><br />
<strong>DISTRICT</strong> <strong>ANNUAL</strong> PERFORMANCE REPORT<br />
2010/11 School Year<br />
Publication Date: March 2012<br />
Each State must have in place a State Performance Plan (SPP) to evaluate the State's efforts to meet the requirements and<br />
purposes of the implementation of the Individuals with Disabilities Education Act (IDEA). The SPP is a six-year plan, which<br />
describes Arkansas's performance on 20 indicators. The Office of Special Education Programs in the U. S. Department of<br />
Education requires that States report annually to the public on the performance of each local education agency (LEA) on 14 of<br />
20 indicators as compared with targets established by the State in the SPP. Arkansas will report indicators 1 through 14 and<br />
20 for each LEA serving children with disabilities (CWD). Any LEA not meeting targets on compliance indicators (0% for<br />
Indicators 4B, 09 & 10 and 100% for Indicators 11, 12, 13, and 20) are non-compliant with IDEA.<br />
There are no report changes for the 2010/11 school year profile; However, it is important to recognize that: .<br />
1. Indicator 01 (Graduation) is reported a year in arrear (2009/10 graduates) and is based on a four-year cohort. This<br />
means the rate is a measure of students who entered in ninth grade and graduate in four years. The calculation is a<br />
requirement under Title I of the Elementary and Secondary Education Act (ESEA).<br />
2. Indicator 02 (Drop out) is reported a year in arrear. This means the rate is a measure of students who dropped out in<br />
the 2009/10 school year. The Indicator 02 data are aligned with the Common Core of Data (CCD) requirements for<br />
grades 7-12.<br />
3. Indicator 04A and 4B (Suspension/Expulsion) is reported a year in arrear. This means the rate is a measure of<br />
students who had out-of-school suspensions and/or expulsions totaling more than 10 days.<br />
Percent of youth<br />
with IEPs<br />
graduating from<br />
high school with a<br />
regular diploma<br />
For a complete description of all the Indicators, please visit the special education website at<br />
http://arksped.k12.ar.us/sections/policy.html<br />
Indicator 01: Graduation Rates (2009/10 school year) Indicator 02: Dropout Rates (2009/10 school year)<br />
State<br />
Rate<br />
State<br />
Target<br />
75.76% 85.00%<br />
LEA<br />
Rate<br />
100.00%<br />
Target Met<br />
by LEA<br />
(Y/N)<br />
Y<br />
Percent of<br />
youth with<br />
IEPs dropping<br />
out of high<br />
school<br />
State<br />
Rate<br />
Indicator 03: Assessment on Statewide Benchmark Exam (grades 3-8, 11)<br />
A) Adequate Yearly Progress<br />
n=40<br />
Literacy<br />
Mathematics<br />
Met Disability Subgroup "n"<br />
for Reporting Purposes (Y/N)<br />
State Target for % of Districts Meeting<br />
AYP for Disability Subgroup<br />
State<br />
Target<br />
3.06% 4.20%<br />
LEA<br />
Rate<br />
1.92%<br />
% of Districts Meeting AYP<br />
for Disability Subgroup<br />
Target Met by<br />
LEA (Y/N)<br />
Y<br />
Target Met by<br />
LEA(Y/N)<br />
Overall N 17.15% 6.25%<br />
NA<br />
N<br />
N<br />
Note: For a district to qualify as having a disability subgroup it must have a minimum of 40 (n=40) students with disabilities in a school building.<br />
B) Participation<br />
Participation Rate: # of<br />
CWD Tested ÷ # of CWD<br />
Enrolled in grades tested.<br />
Participation Rate: Literacy<br />
Participation Rate: Math<br />
Note: - - denotes not applicable<br />
State<br />
Rate<br />
98.78%<br />
State<br />
Target<br />
95.00%<br />
LEA<br />
Rate<br />
98.72%<br />
Target Met<br />
by LEA (Y/N)<br />
98.61% 95.00% 98.82% Y<br />
Y<br />
C) Performance Proficiency<br />
Percent of CWD Scoring<br />
Proficient or Above<br />
Proficiency Rate: Literacy<br />
Proficiency Rate:<br />
Mathematics<br />
16.00%<br />
16.00%<br />
State<br />
Rate<br />
31.49%<br />
44.86%<br />
State<br />
Target<br />
45.22%<br />
51.14%<br />
LEA<br />
Rate<br />
34.72%<br />
39.24%<br />
NA<br />
NA<br />
Target<br />
Met by<br />
LEA (Y/N)<br />
N<br />
N<br />
Page 1 of 5
LEA: 4712 - MANILA SCHOOL <strong>DISTRICT</strong><br />
Indicator 04: Out-of-School Suspensions and Expulsions (2009/10 school year)<br />
A) Suspension/Expulsion<br />
Percent difference of CWD with out-of- school suspensions and<br />
expulsions totaling greater than 10 days in a school year as<br />
compared to the same data for general education students in<br />
the district.<br />
B) Suspension/Expulsion by Race and Ethnicity<br />
Percent of districts that have: (a) a significant discrepancy, by race or<br />
ethnicity, in the rate of suspensions and expulsions of greater than 10<br />
days in a school year for children with IEPs; and (b) policies,<br />
procedures or practices that contribute to the significant discrepancy<br />
and do not comply with requirements relating to the development<br />
and implementation of IEPs, the use of positive behavioral<br />
interventions and supports, and procedural safeguards.<br />
Indicator 05: School Age (5-21) Least Restrictive Environment<br />
A) In the Regular Class 80% or more of the day<br />
Percent of CWD with<br />
IEPs receiving instruction<br />
in the regular class 80%<br />
or more of the day.<br />
State<br />
Rate<br />
State<br />
Target<br />
LEA<br />
Rate<br />
B) In the Regular Class less than 40% of the day<br />
Percent of CWD with<br />
IEPs receiving instruction<br />
in the regular class less<br />
than 60% of the day.<br />
53.87% 59.77%<br />
State<br />
Rate<br />
State<br />
Target<br />
12.42% 12.51%<br />
59.87%<br />
LEA<br />
Rate<br />
5.92%<br />
C) Other Settings outside the regular class<br />
Percent of CWD with IEPs served in<br />
public or private separate schools,<br />
residential placements, or<br />
homebound/hospital placements.<br />
State<br />
Rate<br />
State<br />
Target<br />
2.80% 2.56%<br />
Target Met<br />
by LEA (Y/N)<br />
Y<br />
Target Met<br />
by LEA (Y/N)<br />
Y<br />
LEA<br />
Rate<br />
0.00%<br />
Target Met<br />
by LEA(Y/N)<br />
Indicator 06: Early Childhood (3-5) Least Restrictive Environment<br />
A) Regular Early Childhood Program<br />
Percent of children (aged 3 through 5) with IEPs attending a regular<br />
early childhood program and receiving the majority of special<br />
education and related services in the regular early childhood program<br />
Allowable<br />
Difference<br />
LEA: 4712 - MANILA SCHOOL <strong>DISTRICT</strong><br />
Indicator 07: Preschool (3-5) Outcomes<br />
a) Percent of preschool CWD<br />
children who did not<br />
improve functioning.<br />
b) Percent of preschool CWD<br />
who improved but whose<br />
functioning remained below<br />
same age peers.<br />
c) Percent of preschool CWD<br />
who improved at a level<br />
nearer to same aged peers.<br />
d) Percent of preschool CWD<br />
who improved functioning to<br />
reach a level comparable to<br />
same age peers.<br />
e) Percent of preschool CWD<br />
children who maintain<br />
functioning at a level<br />
comparable to same aged<br />
peers.<br />
Summary<br />
Statements<br />
1) Of those preschool<br />
children who entered<br />
the preschool program<br />
below age expectations<br />
in each Outcome, the<br />
percent who<br />
substantially increased<br />
their rate of growth by<br />
the time they turned 6<br />
years of age or exited<br />
the program.<br />
2) The percent of<br />
preschool children who<br />
were functioning<br />
within age expectations<br />
in each Outcome by the<br />
time they turned 6<br />
years of age or exited<br />
A) Positive Social -Emotional<br />
Skills*<br />
State<br />
Rate<br />
A) Positive Social -<br />
Emotional Skills<br />
(Including social<br />
relationships)<br />
State<br />
Rate<br />
2.14%<br />
5.31%<br />
25.97%<br />
38.22%<br />
28.36%<br />
State<br />
Target<br />
LEA<br />
Rate<br />
LEA<br />
Rate<br />
— —<br />
— —<br />
— —<br />
— —<br />
— —<br />
Target<br />
Met by<br />
LEA(Y/N)<br />
B) Acquisition and Use of<br />
Knowledge and Skills<br />
(Including early language/<br />
communication and early literacy)<br />
B) Acquisition and Use of<br />
Knowledge and Skills **<br />
State<br />
Rate<br />
1.75%<br />
6.59%<br />
34.23%<br />
43.51%<br />
13.92%<br />
State<br />
Target<br />
LEA<br />
Rate<br />
Target<br />
Met by<br />
LEA(Y/N)<br />
C) Use of Appropriate Behaviors<br />
to Meet Their Needs<br />
State<br />
Rate<br />
State<br />
Target<br />
LEA<br />
Rate<br />
Target<br />
Met by<br />
LEA(Y/N)<br />
89.61% 90.50% — — N/A 90.31% 90.50% — — N/A 90.82% 92.50% — — N/A<br />
66.58% 69.50% — — N/A 57.43% 60.50% — — N/A 76.69% 78.50% — — N/A<br />
NOTE: * Including social relationships ** Including early language/ communication and early literacy<br />
Note: - - denotes not applicable<br />
State<br />
Rate<br />
LEA<br />
Rate<br />
— —<br />
— —<br />
— —<br />
— —<br />
— —<br />
C) Use of<br />
Appropriate<br />
Behaviors to<br />
Meet Their Needs<br />
State<br />
Rate<br />
4.51%<br />
17.34%<br />
41.72%<br />
34.97%<br />
LEA<br />
Rate<br />
1.46% — —<br />
— —<br />
— —<br />
— —<br />
— —<br />
Page 3 of 5
LEA: 4712 - MANILA SCHOOL <strong>DISTRICT</strong><br />
Indicator 08: Parent Involvement<br />
Percent of surveyed<br />
parents who reported<br />
school facilitated parent<br />
involvement as a means<br />
of improving services<br />
and results for children<br />
with disabilities.<br />
Early Childhood<br />
(3-5)<br />
School Age<br />
(5-21)<br />
State<br />
Rate<br />
90.47%<br />
95.05%<br />
Indicator 09: Disproportionality - Eligibility<br />
Disproportionate representation of racial<br />
and ethnic groups in special education and<br />
related services that is a result of<br />
inappropriate identification (e.g.<br />
monitoring data, review of policies,<br />
practices, and procedures under 618(d),<br />
etc.).<br />
State<br />
Rate<br />
State<br />
Target<br />
88.00%<br />
96.00%<br />
State<br />
Target<br />
0.00% 0.00%<br />
LEA<br />
Rate<br />
— —<br />
96.72%<br />
Indicator 10: Disproportionality-Child with a Disability<br />
Disproportionate representation of racial<br />
and ethnic groups in specific disability<br />
categories that is a result of inappropriate<br />
identification (e.g. monitoring data, review<br />
of policies, practices, and procedures under<br />
618(d), etc.).<br />
Indicator 11: Child Find<br />
Percent of children with<br />
parental consent to evaluate<br />
who are evaluated within<br />
the State established timeline<br />
of 60 days.<br />
Overall<br />
(3-21)<br />
Early Childhood<br />
(3-5)<br />
School Age<br />
(5-21)<br />
State<br />
Rate<br />
0.00%<br />
Indicator 12: Early Childhood Transition<br />
Percent of children referred by Part C prior to<br />
age 3, who are found eligible for Part B, and<br />
who have an IEP developed and implemented<br />
by their third birthday.<br />
Note: - - denotes not applicable<br />
State<br />
Rate<br />
99.41%<br />
99.70%<br />
98.97%<br />
State<br />
Rate<br />
State<br />
Target<br />
0.00%<br />
State<br />
Target<br />
100.00%<br />
100.00%<br />
100.00%<br />
State<br />
Target<br />
Target Met by<br />
LEA (Y/N)<br />
Y<br />
Target Met by<br />
LEA (Y/N)<br />
Y<br />
LEA<br />
Rate<br />
100.00%<br />
— —<br />
100.00%<br />
LEA<br />
Rate<br />
Target Met by<br />
LEA (Y/N)<br />
N/A<br />
Y<br />
Note: The target for Indicator 09 is to have zero percent<br />
(0%) of districts identified as having disproportionate<br />
representation as a result of inappropriate<br />
identification in eligibility.<br />
Note: The target for Indicator 10 is to have zero<br />
percent (0%) of districts identified as having<br />
disproportionate representation as a result of<br />
inappropriate identification in a disability<br />
category.<br />
Target Met by<br />
LEA (Y/N)<br />
N/A<br />
Y<br />
Target Met<br />
by LEA<br />
(Y/N)<br />
99.21% 100.00% - - N/A<br />
Y<br />
Note: * Indicates a zero reponse rate for the<br />
district.<br />
Page 4 of 5
LEA: 4712 - MANILA SCHOOL <strong>DISTRICT</strong><br />
Indicator 13: Secondary Transition<br />
Percent of youth with disabilities aged 16 and<br />
up with an IEP that includes coordinated,<br />
measurable, annual IEP goals and transition<br />
services that will reasonably enable the student<br />
to meet the post-secondary goals.<br />
Indicator 14: Post-School Outcomes<br />
A. Percent of youth enrolled in higher<br />
education within one year of leaving high<br />
school.<br />
State<br />
Rate<br />
State<br />
Target<br />
Note: Data for this Indicator is from the on-site monitoring of LEAs for the given year.<br />
B. Percent of youth enrolled in higher<br />
education or competitively employed<br />
within one year of leaving high school.<br />
C. Percent of youth enrolled in higher<br />
education or in some other postsecondary<br />
education or training program; or<br />
competitively employed or in some other<br />
employment within one year of leaving<br />
high school.<br />
State<br />
Rate<br />
Indicator 20: Reported Data-Timely and Accurate*<br />
District submitted<br />
required data elements<br />
on or before due dates;<br />
made revisions within<br />
the alloted reveiw<br />
periods.<br />
Accurate and Timely<br />
Data Submission<br />
Overall (3-21)<br />
Early Childhood (3-5)<br />
School Age (5-21)<br />
State<br />
Target<br />
100.00%<br />
100.00%<br />
100.00%<br />
State<br />
Target<br />
LEA<br />
Rate<br />
LEA<br />
Rate<br />
Target Met by<br />
LEA (Y/N)<br />
Target Met<br />
by LEA<br />
(Y/N)<br />
Target Met<br />
by LEA<br />
(Y/N)<br />
*Data reviewed for timely and accurate submissions included all APSCN cycle data except for personnel<br />
Note: - - denotes not applicable<br />
96.19 100.00 — — N/A<br />
14.53<br />
State<br />
Rate<br />
49.42<br />
State<br />
Rate<br />
54.07<br />
13.00<br />
State<br />
Target<br />
49.00<br />
State<br />
Target<br />
60.00<br />
Y<br />
N/A<br />
Y<br />
40.00%<br />
LEA<br />
Rate<br />
60.00%<br />
LEA<br />
Rate<br />
60.00%<br />
Y<br />
Target Met<br />
by LEA<br />
(Y/N)<br />
Y<br />
Target Met<br />
by LEA<br />
(Y/N)<br />
Y<br />
Page 5 of 5
LEA: 4713 - OSCEOLA SCHOOL <strong>DISTRICT</strong><br />
<strong>ARKANSAS</strong> <strong>SPECIAL</strong> <strong>EDUCATION</strong><br />
<strong>DISTRICT</strong> <strong>ANNUAL</strong> PERFORMANCE REPORT<br />
2010/11 School Year<br />
Publication Date: March 2012<br />
Each State must have in place a State Performance Plan (SPP) to evaluate the State's efforts to meet the requirements and<br />
purposes of the implementation of the Individuals with Disabilities Education Act (IDEA). The SPP is a six-year plan, which<br />
describes Arkansas's performance on 20 indicators. The Office of Special Education Programs in the U. S. Department of<br />
Education requires that States report annually to the public on the performance of each local education agency (LEA) on 14 of<br />
20 indicators as compared with targets established by the State in the SPP. Arkansas will report indicators 1 through 14 and<br />
20 for each LEA serving children with disabilities (CWD). Any LEA not meeting targets on compliance indicators (0% for<br />
Indicators 4B, 09 & 10 and 100% for Indicators 11, 12, 13, and 20) are non-compliant with IDEA.<br />
There are no report changes for the 2010/11 school year profile; However, it is important to recognize that: .<br />
1. Indicator 01 (Graduation) is reported a year in arrear (2009/10 graduates) and is based on a four-year cohort. This<br />
means the rate is a measure of students who entered in ninth grade and graduate in four years. The calculation is a<br />
requirement under Title I of the Elementary and Secondary Education Act (ESEA).<br />
2. Indicator 02 (Drop out) is reported a year in arrear. This means the rate is a measure of students who dropped out in<br />
the 2009/10 school year. The Indicator 02 data are aligned with the Common Core of Data (CCD) requirements for<br />
grades 7-12.<br />
3. Indicator 04A and 4B (Suspension/Expulsion) is reported a year in arrear. This means the rate is a measure of<br />
students who had out-of-school suspensions and/or expulsions totaling more than 10 days.<br />
Percent of youth<br />
with IEPs<br />
graduating from<br />
high school with a<br />
regular diploma<br />
For a complete description of all the Indicators, please visit the special education website at<br />
http://arksped.k12.ar.us/sections/policy.html<br />
Indicator 01: Graduation Rates (2009/10 school year) Indicator 02: Dropout Rates (2009/10 school year)<br />
State<br />
Rate<br />
State<br />
Target<br />
75.76% 85.00%<br />
LEA<br />
Rate<br />
27.78%<br />
Target Met<br />
by LEA<br />
(Y/N)<br />
N<br />
Percent of<br />
youth with<br />
IEPs dropping<br />
out of high<br />
school<br />
State<br />
Rate<br />
Indicator 03: Assessment on Statewide Benchmark Exam (grades 3-8, 11)<br />
A) Adequate Yearly Progress<br />
n=40<br />
Literacy<br />
Mathematics<br />
Met Disability Subgroup "n"<br />
for Reporting Purposes (Y/N)<br />
State Target for % of Districts Meeting<br />
AYP for Disability Subgroup<br />
State<br />
Target<br />
3.06% 4.20%<br />
LEA<br />
Rate<br />
4.88%<br />
% of Districts Meeting AYP<br />
for Disability Subgroup<br />
Target Met by<br />
LEA (Y/N)<br />
N<br />
Target Met by<br />
LEA(Y/N)<br />
Overall N 17.15% 6.25%<br />
NA<br />
N<br />
N<br />
Note: For a district to qualify as having a disability subgroup it must have a minimum of 40 (n=40) students with disabilities in a school building.<br />
B) Participation<br />
Participation Rate: # of<br />
CWD Tested ÷ # of CWD<br />
Enrolled in grades tested.<br />
Participation Rate: Literacy<br />
Participation Rate: Math<br />
Note: - - denotes not applicable<br />
State<br />
Rate<br />
98.78%<br />
State<br />
Target<br />
95.00%<br />
LEA<br />
Rate<br />
93.68%<br />
Target Met<br />
by LEA (Y/N)<br />
N<br />
98.61% 95.00% 94.78% N<br />
C) Performance Proficiency<br />
Percent of CWD Scoring<br />
Proficient or Above<br />
Proficiency Rate: Literacy<br />
Proficiency Rate:<br />
Mathematics<br />
16.00%<br />
16.00%<br />
State<br />
Rate<br />
31.49%<br />
44.86%<br />
State<br />
Target<br />
45.22%<br />
51.14%<br />
LEA<br />
Rate<br />
24.14%<br />
23.58%<br />
NA<br />
NA<br />
Target<br />
Met by<br />
LEA (Y/N)<br />
N<br />
N<br />
Page 1 of 5
LEA: 4713 - OSCEOLA SCHOOL <strong>DISTRICT</strong><br />
Indicator 04: Out-of-School Suspensions and Expulsions (2009/10 school year)<br />
A) Suspension/Expulsion<br />
Percent difference of CWD with out-of- school suspensions and<br />
expulsions totaling greater than 10 days in a school year as<br />
compared to the same data for general education students in<br />
the district.<br />
B) Suspension/Expulsion by Race and Ethnicity<br />
Percent of districts that have: (a) a significant discrepancy, by race or<br />
ethnicity, in the rate of suspensions and expulsions of greater than 10<br />
days in a school year for children with IEPs; and (b) policies,<br />
procedures or practices that contribute to the significant discrepancy<br />
and do not comply with requirements relating to the development<br />
and implementation of IEPs, the use of positive behavioral<br />
interventions and supports, and procedural safeguards.<br />
Indicator 05: School Age (5-21) Least Restrictive Environment<br />
A) In the Regular Class 80% or more of the day<br />
Percent of CWD with<br />
IEPs receiving instruction<br />
in the regular class 80%<br />
or more of the day.<br />
State<br />
Rate<br />
State<br />
Target<br />
LEA<br />
Rate<br />
B) In the Regular Class less than 40% of the day<br />
Percent of CWD with<br />
IEPs receiving instruction<br />
in the regular class less<br />
than 60% of the day.<br />
53.87% 59.77%<br />
State<br />
Rate<br />
State<br />
Target<br />
12.42% 12.51%<br />
42.20%<br />
LEA<br />
Rate<br />
22.54%<br />
C) Other Settings outside the regular class<br />
Percent of CWD with IEPs served in<br />
public or private separate schools,<br />
residential placements, or<br />
homebound/hospital placements.<br />
State<br />
Rate<br />
State<br />
Target<br />
2.80% 2.56%<br />
Target Met<br />
by LEA (Y/N)<br />
N<br />
Target Met<br />
by LEA (Y/N)<br />
N<br />
LEA<br />
Rate<br />
2.31%<br />
Target Met<br />
by LEA(Y/N)<br />
Indicator 06: Early Childhood (3-5) Least Restrictive Environment<br />
A) Regular Early Childhood Program<br />
Percent of children (aged 3 through 5) with IEPs attending a regular<br />
early childhood program and receiving the majority of special<br />
education and related services in the regular early childhood program<br />
Allowable<br />
Difference<br />
LEA: 4713 - OSCEOLA SCHOOL <strong>DISTRICT</strong><br />
Indicator 07: Preschool (3-5) Outcomes<br />
a) Percent of preschool CWD<br />
children who did not<br />
improve functioning.<br />
b) Percent of preschool CWD<br />
who improved but whose<br />
functioning remained below<br />
same age peers.<br />
c) Percent of preschool CWD<br />
who improved at a level<br />
nearer to same aged peers.<br />
d) Percent of preschool CWD<br />
who improved functioning to<br />
reach a level comparable to<br />
same age peers.<br />
e) Percent of preschool CWD<br />
children who maintain<br />
functioning at a level<br />
comparable to same aged<br />
peers.<br />
Summary<br />
Statements<br />
1) Of those preschool<br />
children who entered<br />
the preschool program<br />
below age expectations<br />
in each Outcome, the<br />
percent who<br />
substantially increased<br />
their rate of growth by<br />
the time they turned 6<br />
years of age or exited<br />
the program.<br />
2) The percent of<br />
preschool children who<br />
were functioning<br />
within age expectations<br />
in each Outcome by the<br />
time they turned 6<br />
years of age or exited<br />
A) Positive Social -Emotional<br />
Skills*<br />
State<br />
Rate<br />
A) Positive Social -<br />
Emotional Skills<br />
(Including social<br />
relationships)<br />
State<br />
Rate<br />
2.14%<br />
5.31%<br />
25.97%<br />
38.22%<br />
28.36%<br />
State<br />
Target<br />
LEA<br />
Rate<br />
LEA<br />
Rate<br />
— —<br />
— —<br />
— —<br />
— —<br />
— —<br />
Target<br />
Met by<br />
LEA(Y/N)<br />
B) Acquisition and Use of<br />
Knowledge and Skills<br />
(Including early language/<br />
communication and early literacy)<br />
B) Acquisition and Use of<br />
Knowledge and Skills **<br />
State<br />
Rate<br />
1.75%<br />
6.59%<br />
34.23%<br />
43.51%<br />
13.92%<br />
State<br />
Target<br />
LEA<br />
Rate<br />
Target<br />
Met by<br />
LEA(Y/N)<br />
C) Use of Appropriate Behaviors<br />
to Meet Their Needs<br />
State<br />
Rate<br />
State<br />
Target<br />
LEA<br />
Rate<br />
Target<br />
Met by<br />
LEA(Y/N)<br />
89.61% 90.50% — — N/A 90.31% 90.50% — — N/A 90.82% 92.50% — — N/A<br />
66.58% 69.50% — — N/A 57.43% 60.50% — — N/A 76.69% 78.50% — — N/A<br />
NOTE: * Including social relationships ** Including early language/ communication and early literacy<br />
Note: - - denotes not applicable<br />
State<br />
Rate<br />
LEA<br />
Rate<br />
— —<br />
— —<br />
— —<br />
— —<br />
— —<br />
C) Use of<br />
Appropriate<br />
Behaviors to<br />
Meet Their Needs<br />
State<br />
Rate<br />
4.51%<br />
17.34%<br />
41.72%<br />
34.97%<br />
LEA<br />
Rate<br />
1.46% — —<br />
— —<br />
— —<br />
— —<br />
— —<br />
Page 3 of 5
LEA: 4713 - OSCEOLA SCHOOL <strong>DISTRICT</strong><br />
Indicator 08: Parent Involvement<br />
Percent of surveyed<br />
parents who reported<br />
school facilitated parent<br />
involvement as a means<br />
of improving services<br />
and results for children<br />
with disabilities.<br />
Early Childhood<br />
(3-5)<br />
School Age<br />
(5-21)<br />
State<br />
Rate<br />
90.47%<br />
95.05%<br />
Indicator 09: Disproportionality - Eligibility<br />
Disproportionate representation of racial<br />
and ethnic groups in special education and<br />
related services that is a result of<br />
inappropriate identification (e.g.<br />
monitoring data, review of policies,<br />
practices, and procedures under 618(d),<br />
etc.).<br />
State<br />
Rate<br />
State<br />
Target<br />
88.00%<br />
96.00%<br />
State<br />
Target<br />
0.00% 0.00%<br />
LEA<br />
Rate<br />
— —<br />
— —<br />
Indicator 10: Disproportionality-Child with a Disability<br />
Disproportionate representation of racial<br />
and ethnic groups in specific disability<br />
categories that is a result of inappropriate<br />
identification (e.g. monitoring data, review<br />
of policies, practices, and procedures under<br />
618(d), etc.).<br />
Indicator 11: Child Find<br />
Percent of children with<br />
parental consent to evaluate<br />
who are evaluated within<br />
the State established timeline<br />
of 60 days.<br />
Overall<br />
(3-21)<br />
Early Childhood<br />
(3-5)<br />
School Age<br />
(5-21)<br />
State<br />
Rate<br />
0.00%<br />
Indicator 12: Early Childhood Transition<br />
Percent of children referred by Part C prior to<br />
age 3, who are found eligible for Part B, and<br />
who have an IEP developed and implemented<br />
by their third birthday.<br />
Note: - - denotes not applicable<br />
State<br />
Rate<br />
99.41%<br />
99.70%<br />
98.97%<br />
State<br />
Rate<br />
State<br />
Target<br />
0.00%<br />
State<br />
Target<br />
100.00%<br />
100.00%<br />
100.00%<br />
State<br />
Target<br />
Target Met by<br />
LEA (Y/N)<br />
Y<br />
Target Met by<br />
LEA (Y/N)<br />
Y<br />
LEA<br />
Rate<br />
100.00%<br />
— —<br />
100.00%<br />
LEA<br />
Rate<br />
Target Met by<br />
LEA (Y/N)<br />
N/A<br />
N<br />
Note: The target for Indicator 09 is to have zero percent<br />
(0%) of districts identified as having disproportionate<br />
representation as a result of inappropriate<br />
identification in eligibility.<br />
Note: The target for Indicator 10 is to have zero<br />
percent (0%) of districts identified as having<br />
disproportionate representation as a result of<br />
inappropriate identification in a disability<br />
category.<br />
Target Met by<br />
LEA (Y/N)<br />
N/A<br />
Y<br />
Target Met<br />
by LEA<br />
(Y/N)<br />
99.21% 100.00% - - N/A<br />
Y<br />
Note: * Indicates a zero reponse rate for the<br />
district.<br />
Page 4 of 5
LEA: 4713 - OSCEOLA SCHOOL <strong>DISTRICT</strong><br />
Indicator 13: Secondary Transition<br />
Percent of youth with disabilities aged 16 and<br />
up with an IEP that includes coordinated,<br />
measurable, annual IEP goals and transition<br />
services that will reasonably enable the student<br />
to meet the post-secondary goals.<br />
Indicator 14: Post-School Outcomes<br />
A. Percent of youth enrolled in higher<br />
education within one year of leaving high<br />
school.<br />
State<br />
Rate<br />
State<br />
Target<br />
Note: Data for this Indicator is from the on-site monitoring of LEAs for the given year.<br />
B. Percent of youth enrolled in higher<br />
education or competitively employed<br />
within one year of leaving high school.<br />
C. Percent of youth enrolled in higher<br />
education or in some other postsecondary<br />
education or training program; or<br />
competitively employed or in some other<br />
employment within one year of leaving<br />
high school.<br />
State<br />
Rate<br />
Indicator 20: Reported Data-Timely and Accurate*<br />
District submitted<br />
required data elements<br />
on or before due dates;<br />
made revisions within<br />
the alloted reveiw<br />
periods.<br />
Accurate and Timely<br />
Data Submission<br />
Overall (3-21)<br />
Early Childhood (3-5)<br />
School Age (5-21)<br />
State<br />
Target<br />
100.00%<br />
100.00%<br />
100.00%<br />
State<br />
Target<br />
LEA<br />
Rate<br />
LEA<br />
Rate<br />
Target Met by<br />
LEA (Y/N)<br />
Target Met<br />
by LEA<br />
(Y/N)<br />
Target Met<br />
by LEA<br />
(Y/N)<br />
*Data reviewed for timely and accurate submissions included all APSCN cycle data except for personnel<br />
Note: - - denotes not applicable<br />
96.19 100.00 — — N/A<br />
14.53<br />
State<br />
Rate<br />
49.42<br />
State<br />
Rate<br />
54.07<br />
13.00<br />
State<br />
Target<br />
49.00<br />
State<br />
Target<br />
60.00<br />
Y<br />
N/A<br />
Y<br />
— —<br />
LEA<br />
Rate<br />
— —<br />
LEA<br />
Rate<br />
— —<br />
N/A<br />
Target Met<br />
by LEA<br />
(Y/N)<br />
N/A<br />
Target Met<br />
by LEA<br />
(Y/N)<br />
N/A<br />
Page 5 of 5
<strong>ARKANSAS</strong> <strong>SPECIAL</strong> <strong>EDUCATION</strong><br />
<strong>DISTRICT</strong> <strong>ANNUAL</strong> PERFORMANCE REPORT<br />
2010/11 School Year<br />
Publication Date: March 2012<br />
Each State must have in place a State Performance Plan (SPP) to evaluate the State's efforts to meet the requirements and<br />
purposes of the implementation of the Individuals with Disabilities Education Act (IDEA). The SPP is a six-year plan, which<br />
describes Arkansas's performance on 20 indicators. The Office of Special Education Programs in the U. S. Department of<br />
Education requires that States report annually to the public on the performance of each local education agency (LEA) on 14 of<br />
20 indicators as compared with targets established by the State in the SPP. Arkansas will report indicators 1 through 14 and<br />
20 for each LEA serving children with disabilities (CWD). Any LEA not meeting targets on compliance indicators (0% for<br />
Indicators 4B, 09 & 10 and 100% for Indicators 11, 12, 13, and 20) are non-compliant with IDEA.<br />
There are no report changes for the 2010/11 school year profile; However, it is important to recognize that: .<br />
1. Indicator 01 (Graduation) is reported a year in arrear (2009/10 graduates) and is based on a four-year cohort. This<br />
means the rate is a measure of students who entered in ninth grade and graduate in four years. The calculation is a<br />
requirement under Title I of the Elementary and Secondary Education Act (ESEA).<br />
2. Indicator 02 (Drop out) is reported a year in arrear. This means the rate is a measure of students who dropped out in<br />
the 2009/10 school year. The Indicator 02 data are aligned with the Common Core of Data (CCD) requirements for<br />
grades 7-12.<br />
3. Indicator 04A and 4B (Suspension/Expulsion) is reported a year in arrear. This means the rate is a measure of<br />
students who had out-of-school suspensions and/or expulsions totaling more than 10 days.<br />
For a complete description of all the Indicators, please visit the special education website at<br />
http://arksped.k12.ar.us/sections/policy.html<br />
LEA: 4740 - OSCEOLA COMMUNICATION BUSINESS<br />
Indicator 01: Graduation Rates (2009/10 school year) Indicator 02: Dropout Rates (2009/10 school year)<br />
Percent of youth<br />
with IEPs<br />
graduating from<br />
high school with a<br />
regular diploma<br />
State<br />
Rate<br />
State<br />
Target<br />
75.76% 85.00%<br />
LEA<br />
Rate<br />
66.67%<br />
Target Met<br />
by LEA<br />
(Y/N)<br />
N<br />
Percent of<br />
youth with<br />
IEPs dropping<br />
out of high<br />
school<br />
State<br />
Rate<br />
Indicator 03: Assessment on Statewide Benchmark Exam (grades 3-8, 11)<br />
A) Adequate Yearly Progress<br />
n=40<br />
Literacy<br />
Mathematics<br />
Met Disability Subgroup "n"<br />
for Reporting Purposes (Y/N)<br />
State Target for % of Districts Meeting<br />
AYP for Disability Subgroup<br />
State<br />
Target<br />
3.06% 4.20%<br />
LEA<br />
Rate<br />
50.00%<br />
% of Districts Meeting AYP<br />
for Disability Subgroup<br />
Target Met by<br />
LEA (Y/N)<br />
N<br />
Target Met by<br />
LEA(Y/N)<br />
Overall N 17.15% 6.25%<br />
NA<br />
N<br />
N<br />
Note: For a district to qualify as having a disability subgroup it must have a minimum of 40 (n=40) students with disabilities in a school building.<br />
B) Participation<br />
Participation Rate: # of<br />
CWD Tested ÷ # of CWD<br />
Enrolled in grades tested.<br />
Participation Rate: Literacy<br />
Participation Rate: Math<br />
Note: - - denotes not applicable<br />
State<br />
Rate<br />
98.78%<br />
State<br />
Target<br />
95.00%<br />
LEA<br />
Rate<br />
— —<br />
Target Met<br />
by LEA (Y/N)<br />
N/A<br />
98.61% 95.00% 66.67% N<br />
C) Performance Proficiency<br />
Percent of CWD Scoring<br />
Proficient or Above<br />
Proficiency Rate: Literacy<br />
Proficiency Rate:<br />
Mathematics<br />
16.00%<br />
16.00%<br />
State<br />
Rate<br />
31.49%<br />
44.86%<br />
State<br />
Target<br />
45.22%<br />
51.14%<br />
LEA<br />
Rate<br />
— —<br />
— —<br />
NA<br />
NA<br />
Target<br />
Met by<br />
LEA (Y/N)<br />
N/A<br />
N/A<br />
Page 1 of 5
LEA: 4740 - OSCEOLA COMMUNICATION BUSINESS<br />
Indicator 04: Out-of-School Suspensions and Expulsions (2009/10 school year)<br />
A) Suspension/Expulsion<br />
Percent difference of CWD with out-of- school suspensions and<br />
expulsions totaling greater than 10 days in a school year as<br />
compared to the same data for general education students in<br />
the district.<br />
B) Suspension/Expulsion by Race and Ethnicity<br />
Percent of districts that have: (a) a significant discrepancy, by race or<br />
ethnicity, in the rate of suspensions and expulsions of greater than 10<br />
days in a school year for children with IEPs; and (b) policies,<br />
procedures or practices that contribute to the significant discrepancy<br />
and do not comply with requirements relating to the development<br />
and implementation of IEPs, the use of positive behavioral<br />
interventions and supports, and procedural safeguards.<br />
Indicator 05: School Age (5-21) Least Restrictive Environment<br />
A) In the Regular Class 80% or more of the day<br />
Percent of CWD with<br />
IEPs receiving instruction<br />
in the regular class 80%<br />
or more of the day.<br />
State<br />
Rate<br />
State<br />
Target<br />
LEA<br />
Rate<br />
B) In the Regular Class less than 40% of the day<br />
Percent of CWD with<br />
IEPs receiving instruction<br />
in the regular class less<br />
than 60% of the day.<br />
53.87% 59.77%<br />
State<br />
Rate<br />
State<br />
Target<br />
12.42% 12.51%<br />
100.00%<br />
LEA<br />
Rate<br />
0.00%<br />
C) Other Settings outside the regular class<br />
Percent of CWD with IEPs served in<br />
public or private separate schools,<br />
residential placements, or<br />
homebound/hospital placements.<br />
State<br />
Rate<br />
State<br />
Target<br />
2.80% 2.56%<br />
Target Met<br />
by LEA (Y/N)<br />
Y<br />
Target Met<br />
by LEA (Y/N)<br />
Y<br />
LEA<br />
Rate<br />
0.00%<br />
Target Met<br />
by LEA(Y/N)<br />
Indicator 06: Early Childhood (3-5) Least Restrictive Environment<br />
A) Regular Early Childhood Program<br />
Percent of children (aged 3 through 5) with IEPs attending a regular<br />
early childhood program and receiving the majority of special<br />
education and related services in the regular early childhood program<br />
Allowable<br />
Difference<br />
LEA: 4740 - OSCEOLA COMMUNICATION BUSINESS<br />
Indicator 07: Preschool (3-5) Outcomes<br />
a) Percent of preschool CWD<br />
children who did not<br />
improve functioning.<br />
b) Percent of preschool CWD<br />
who improved but whose<br />
functioning remained below<br />
same age peers.<br />
c) Percent of preschool CWD<br />
who improved at a level<br />
nearer to same aged peers.<br />
d) Percent of preschool CWD<br />
who improved functioning to<br />
reach a level comparable to<br />
same age peers.<br />
e) Percent of preschool CWD<br />
children who maintain<br />
functioning at a level<br />
comparable to same aged<br />
peers.<br />
Summary<br />
Statements<br />
1) Of those preschool<br />
children who entered<br />
the preschool program<br />
below age expectations<br />
in each Outcome, the<br />
percent who<br />
substantially increased<br />
their rate of growth by<br />
the time they turned 6<br />
years of age or exited<br />
the program.<br />
2) The percent of<br />
preschool children who<br />
were functioning<br />
within age expectations<br />
in each Outcome by the<br />
time they turned 6<br />
years of age or exited<br />
A) Positive Social -Emotional<br />
Skills*<br />
State<br />
Rate<br />
A) Positive Social -<br />
Emotional Skills<br />
(Including social<br />
relationships)<br />
State<br />
Rate<br />
2.14%<br />
5.31%<br />
25.97%<br />
38.22%<br />
28.36%<br />
State<br />
Target<br />
LEA<br />
Rate<br />
LEA<br />
Rate<br />
— —<br />
— —<br />
— —<br />
— —<br />
— —<br />
Target<br />
Met by<br />
LEA(Y/N)<br />
B) Acquisition and Use of<br />
Knowledge and Skills<br />
(Including early language/<br />
communication and early literacy)<br />
B) Acquisition and Use of<br />
Knowledge and Skills **<br />
State<br />
Rate<br />
1.75%<br />
6.59%<br />
34.23%<br />
43.51%<br />
13.92%<br />
State<br />
Target<br />
LEA<br />
Rate<br />
Target<br />
Met by<br />
LEA(Y/N)<br />
C) Use of Appropriate Behaviors<br />
to Meet Their Needs<br />
State<br />
Rate<br />
State<br />
Target<br />
LEA<br />
Rate<br />
Target<br />
Met by<br />
LEA(Y/N)<br />
89.61% 90.50% — — N/A 90.31% 90.50% — — N/A 90.82% 92.50% — — N/A<br />
66.58% 69.50% — — N/A 57.43% 60.50% — — N/A 76.69% 78.50% — — N/A<br />
NOTE: * Including social relationships ** Including early language/ communication and early literacy<br />
Note: - - denotes not applicable<br />
State<br />
Rate<br />
LEA<br />
Rate<br />
— —<br />
— —<br />
— —<br />
— —<br />
— —<br />
C) Use of<br />
Appropriate<br />
Behaviors to<br />
Meet Their Needs<br />
State<br />
Rate<br />
4.51%<br />
17.34%<br />
41.72%<br />
34.97%<br />
LEA<br />
Rate<br />
1.46% — —<br />
— —<br />
— —<br />
— —<br />
— —<br />
Page 3 of 5
LEA: 4740 - OSCEOLA COMMUNICATION BUSINESS<br />
Indicator 08: Parent Involvement<br />
Percent of surveyed<br />
parents who reported<br />
school facilitated parent<br />
involvement as a means<br />
of improving services<br />
and results for children<br />
with disabilities.<br />
Early Childhood<br />
(3-5)<br />
School Age<br />
(5-21)<br />
State<br />
Rate<br />
90.47%<br />
95.05%<br />
Indicator 09: Disproportionality - Eligibility<br />
Disproportionate representation of racial<br />
and ethnic groups in special education and<br />
related services that is a result of<br />
inappropriate identification (e.g.<br />
monitoring data, review of policies,<br />
practices, and procedures under 618(d),<br />
etc.).<br />
State<br />
Rate<br />
State<br />
Target<br />
88.00%<br />
96.00%<br />
State<br />
Target<br />
0.00% 0.00%<br />
LEA<br />
Rate<br />
— —<br />
— —<br />
Indicator 10: Disproportionality-Child with a Disability<br />
Disproportionate representation of racial<br />
and ethnic groups in specific disability<br />
categories that is a result of inappropriate<br />
identification (e.g. monitoring data, review<br />
of policies, practices, and procedures under<br />
618(d), etc.).<br />
Indicator 11: Child Find<br />
Percent of children with<br />
parental consent to evaluate<br />
who are evaluated within<br />
the State established timeline<br />
of 60 days.<br />
Overall<br />
(3-21)<br />
Early Childhood<br />
(3-5)<br />
School Age<br />
(5-21)<br />
State<br />
Rate<br />
0.00%<br />
Indicator 12: Early Childhood Transition<br />
Percent of children referred by Part C prior to<br />
age 3, who are found eligible for Part B, and<br />
who have an IEP developed and implemented<br />
by their third birthday.<br />
Note: - - denotes not applicable<br />
State<br />
Rate<br />
99.41%<br />
99.70%<br />
98.97%<br />
State<br />
Rate<br />
State<br />
Target<br />
0.00%<br />
State<br />
Target<br />
100.00%<br />
100.00%<br />
100.00%<br />
State<br />
Target<br />
Target Met by<br />
LEA (Y/N)<br />
Y<br />
Target Met by<br />
LEA (Y/N)<br />
Y<br />
LEA<br />
Rate<br />
— —<br />
— —<br />
— —<br />
LEA<br />
Rate<br />
Target Met by<br />
LEA (Y/N)<br />
N/A<br />
N<br />
Note: The target for Indicator 09 is to have zero percent<br />
(0%) of districts identified as having disproportionate<br />
representation as a result of inappropriate<br />
identification in eligibility.<br />
Note: The target for Indicator 10 is to have zero<br />
percent (0%) of districts identified as having<br />
disproportionate representation as a result of<br />
inappropriate identification in a disability<br />
category.<br />
Target Met by<br />
LEA (Y/N)<br />
N/A<br />
N/A<br />
N/A<br />
Target Met<br />
by LEA<br />
(Y/N)<br />
99.21% 100.00% - - N/A<br />
Note: * Indicates a zero reponse rate for the<br />
district.<br />
Page 4 of 5
LEA: 4740 - OSCEOLA COMMUNICATION BUSINESS<br />
Indicator 13: Secondary Transition<br />
Percent of youth with disabilities aged 16 and<br />
up with an IEP that includes coordinated,<br />
measurable, annual IEP goals and transition<br />
services that will reasonably enable the student<br />
to meet the post-secondary goals.<br />
Indicator 14: Post-School Outcomes<br />
A. Percent of youth enrolled in higher<br />
education within one year of leaving high<br />
school.<br />
State<br />
Rate<br />
State<br />
Target<br />
Note: Data for this Indicator is from the on-site monitoring of LEAs for the given year.<br />
B. Percent of youth enrolled in higher<br />
education or competitively employed<br />
within one year of leaving high school.<br />
C. Percent of youth enrolled in higher<br />
education or in some other postsecondary<br />
education or training program; or<br />
competitively employed or in some other<br />
employment within one year of leaving<br />
high school.<br />
State<br />
Rate<br />
Indicator 20: Reported Data-Timely and Accurate*<br />
District submitted<br />
required data elements<br />
on or before due dates;<br />
made revisions within<br />
the alloted reveiw<br />
periods.<br />
Accurate and Timely<br />
Data Submission<br />
Overall (3-21)<br />
Early Childhood (3-5)<br />
School Age (5-21)<br />
State<br />
Target<br />
100.00%<br />
100.00%<br />
100.00%<br />
State<br />
Target<br />
LEA<br />
Rate<br />
LEA<br />
Rate<br />
Target Met by<br />
LEA (Y/N)<br />
Target Met<br />
by LEA<br />
(Y/N)<br />
Target Met<br />
by LEA<br />
(Y/N)<br />
*Data reviewed for timely and accurate submissions included all APSCN cycle data except for personnel<br />
Note: - - denotes not applicable<br />
96.19 100.00 — — N/A<br />
14.53<br />
State<br />
Rate<br />
49.42<br />
State<br />
Rate<br />
54.07<br />
13.00<br />
State<br />
Target<br />
49.00<br />
State<br />
Target<br />
60.00<br />
Y<br />
N/A<br />
Y<br />
— —<br />
LEA<br />
Rate<br />
— —<br />
LEA<br />
Rate<br />
— —<br />
N/A<br />
Target Met<br />
by LEA<br />
(Y/N)<br />
N/A<br />
Target Met<br />
by LEA<br />
(Y/N)<br />
N/A<br />
Page 5 of 5
LEA: 4801 - BRINKLEY SCHOOL <strong>DISTRICT</strong><br />
<strong>ARKANSAS</strong> <strong>SPECIAL</strong> <strong>EDUCATION</strong><br />
<strong>DISTRICT</strong> <strong>ANNUAL</strong> PERFORMANCE REPORT<br />
2010/11 School Year<br />
Publication Date: March 2012<br />
Each State must have in place a State Performance Plan (SPP) to evaluate the State's efforts to meet the requirements and<br />
purposes of the implementation of the Individuals with Disabilities Education Act (IDEA). The SPP is a six-year plan, which<br />
describes Arkansas's performance on 20 indicators. The Office of Special Education Programs in the U. S. Department of<br />
Education requires that States report annually to the public on the performance of each local education agency (LEA) on 14 of<br />
20 indicators as compared with targets established by the State in the SPP. Arkansas will report indicators 1 through 14 and<br />
20 for each LEA serving children with disabilities (CWD). Any LEA not meeting targets on compliance indicators (0% for<br />
Indicators 4B, 09 & 10 and 100% for Indicators 11, 12, 13, and 20) are non-compliant with IDEA.<br />
There are no report changes for the 2010/11 school year profile; However, it is important to recognize that: .<br />
1. Indicator 01 (Graduation) is reported a year in arrear (2009/10 graduates) and is based on a four-year cohort. This<br />
means the rate is a measure of students who entered in ninth grade and graduate in four years. The calculation is a<br />
requirement under Title I of the Elementary and Secondary Education Act (ESEA).<br />
2. Indicator 02 (Drop out) is reported a year in arrear. This means the rate is a measure of students who dropped out in<br />
the 2009/10 school year. The Indicator 02 data are aligned with the Common Core of Data (CCD) requirements for<br />
grades 7-12.<br />
3. Indicator 04A and 4B (Suspension/Expulsion) is reported a year in arrear. This means the rate is a measure of<br />
students who had out-of-school suspensions and/or expulsions totaling more than 10 days.<br />
Percent of youth<br />
with IEPs<br />
graduating from<br />
high school with a<br />
regular diploma<br />
For a complete description of all the Indicators, please visit the special education website at<br />
http://arksped.k12.ar.us/sections/policy.html<br />
Indicator 01: Graduation Rates (2009/10 school year) Indicator 02: Dropout Rates (2009/10 school year)<br />
State<br />
Rate<br />
State<br />
Target<br />
75.76% 85.00%<br />
LEA<br />
Rate<br />
57.14%<br />
Target Met<br />
by LEA<br />
(Y/N)<br />
N<br />
Percent of<br />
youth with<br />
IEPs dropping<br />
out of high<br />
school<br />
State<br />
Rate<br />
Indicator 03: Assessment on Statewide Benchmark Exam (grades 3-8, 11)<br />
A) Adequate Yearly Progress<br />
n=40<br />
Literacy<br />
Mathematics<br />
Met Disability Subgroup "n"<br />
for Reporting Purposes (Y/N)<br />
State Target for % of Districts Meeting<br />
AYP for Disability Subgroup<br />
State<br />
Target<br />
3.06% 4.20%<br />
LEA<br />
Rate<br />
2.50%<br />
% of Districts Meeting AYP<br />
for Disability Subgroup<br />
Target Met by<br />
LEA (Y/N)<br />
Y<br />
Target Met by<br />
LEA(Y/N)<br />
Overall N 17.15% 6.25%<br />
NA<br />
N<br />
N<br />
Note: For a district to qualify as having a disability subgroup it must have a minimum of 40 (n=40) students with disabilities in a school building.<br />
B) Participation<br />
Participation Rate: # of<br />
CWD Tested ÷ # of CWD<br />
Enrolled in grades tested.<br />
Participation Rate: Literacy<br />
Participation Rate: Math<br />
Note: - - denotes not applicable<br />
State<br />
Rate<br />
98.78%<br />
State<br />
Target<br />
95.00%<br />
LEA<br />
Rate<br />
100.00%<br />
Target Met<br />
by LEA (Y/N)<br />
98.61% 95.00% 100.00% Y<br />
Y<br />
C) Performance Proficiency<br />
Percent of CWD Scoring<br />
Proficient or Above<br />
Proficiency Rate: Literacy<br />
Proficiency Rate:<br />
Mathematics<br />
16.00%<br />
16.00%<br />
State<br />
Rate<br />
31.49%<br />
44.86%<br />
State<br />
Target<br />
45.22%<br />
51.14%<br />
LEA<br />
Rate<br />
31.91%<br />
28.85%<br />
NA<br />
NA<br />
Target<br />
Met by<br />
LEA (Y/N)<br />
N<br />
N<br />
Page 1 of 5
LEA: 4801 - BRINKLEY SCHOOL <strong>DISTRICT</strong><br />
Indicator 04: Out-of-School Suspensions and Expulsions (2009/10 school year)<br />
A) Suspension/Expulsion<br />
Percent difference of CWD with out-of- school suspensions and<br />
expulsions totaling greater than 10 days in a school year as<br />
compared to the same data for general education students in<br />
the district.<br />
B) Suspension/Expulsion by Race and Ethnicity<br />
Percent of districts that have: (a) a significant discrepancy, by race or<br />
ethnicity, in the rate of suspensions and expulsions of greater than 10<br />
days in a school year for children with IEPs; and (b) policies,<br />
procedures or practices that contribute to the significant discrepancy<br />
and do not comply with requirements relating to the development<br />
and implementation of IEPs, the use of positive behavioral<br />
interventions and supports, and procedural safeguards.<br />
Indicator 05: School Age (5-21) Least Restrictive Environment<br />
A) In the Regular Class 80% or more of the day<br />
Percent of CWD with<br />
IEPs receiving instruction<br />
in the regular class 80%<br />
or more of the day.<br />
State<br />
Rate<br />
State<br />
Target<br />
LEA<br />
Rate<br />
B) In the Regular Class less than 40% of the day<br />
Percent of CWD with<br />
IEPs receiving instruction<br />
in the regular class less<br />
than 60% of the day.<br />
53.87% 59.77%<br />
State<br />
Rate<br />
State<br />
Target<br />
12.42% 12.51%<br />
36.46%<br />
LEA<br />
Rate<br />
2.08%<br />
C) Other Settings outside the regular class<br />
Percent of CWD with IEPs served in<br />
public or private separate schools,<br />
residential placements, or<br />
homebound/hospital placements.<br />
State<br />
Rate<br />
State<br />
Target<br />
2.80% 2.56%<br />
Target Met<br />
by LEA (Y/N)<br />
N<br />
Target Met<br />
by LEA (Y/N)<br />
Y<br />
LEA<br />
Rate<br />
8.33%<br />
Target Met<br />
by LEA(Y/N)<br />
Indicator 06: Early Childhood (3-5) Least Restrictive Environment<br />
A) Regular Early Childhood Program<br />
Percent of children (aged 3 through 5) with IEPs attending a regular<br />
early childhood program and receiving the majority of special<br />
education and related services in the regular early childhood program<br />
Allowable<br />
Difference<br />
LEA: 4801 - BRINKLEY SCHOOL <strong>DISTRICT</strong><br />
Indicator 07: Preschool (3-5) Outcomes<br />
a) Percent of preschool CWD<br />
children who did not<br />
improve functioning.<br />
b) Percent of preschool CWD<br />
who improved but whose<br />
functioning remained below<br />
same age peers.<br />
c) Percent of preschool CWD<br />
who improved at a level<br />
nearer to same aged peers.<br />
d) Percent of preschool CWD<br />
who improved functioning to<br />
reach a level comparable to<br />
same age peers.<br />
e) Percent of preschool CWD<br />
children who maintain<br />
functioning at a level<br />
comparable to same aged<br />
peers.<br />
Summary<br />
Statements<br />
1) Of those preschool<br />
children who entered<br />
the preschool program<br />
below age expectations<br />
in each Outcome, the<br />
percent who<br />
substantially increased<br />
their rate of growth by<br />
the time they turned 6<br />
years of age or exited<br />
the program.<br />
2) The percent of<br />
preschool children who<br />
were functioning<br />
within age expectations<br />
in each Outcome by the<br />
time they turned 6<br />
years of age or exited<br />
A) Positive Social -Emotional<br />
Skills*<br />
State<br />
Rate<br />
A) Positive Social -<br />
Emotional Skills<br />
(Including social<br />
relationships)<br />
State<br />
Rate<br />
2.14%<br />
5.31%<br />
25.97%<br />
38.22%<br />
28.36%<br />
State<br />
Target<br />
LEA<br />
Rate<br />
LEA<br />
Rate<br />
— —<br />
— —<br />
— —<br />
— —<br />
— —<br />
Target<br />
Met by<br />
LEA(Y/N)<br />
B) Acquisition and Use of<br />
Knowledge and Skills<br />
(Including early language/<br />
communication and early literacy)<br />
B) Acquisition and Use of<br />
Knowledge and Skills **<br />
State<br />
Rate<br />
1.75%<br />
6.59%<br />
34.23%<br />
43.51%<br />
13.92%<br />
State<br />
Target<br />
LEA<br />
Rate<br />
Target<br />
Met by<br />
LEA(Y/N)<br />
C) Use of Appropriate Behaviors<br />
to Meet Their Needs<br />
State<br />
Rate<br />
State<br />
Target<br />
LEA<br />
Rate<br />
Target<br />
Met by<br />
LEA(Y/N)<br />
89.61% 90.50% — — N/A 90.31% 90.50% — — N/A 90.82% 92.50% — — N/A<br />
66.58% 69.50% — — N/A 57.43% 60.50% — — N/A 76.69% 78.50% — — N/A<br />
NOTE: * Including social relationships ** Including early language/ communication and early literacy<br />
Note: - - denotes not applicable<br />
State<br />
Rate<br />
LEA<br />
Rate<br />
— —<br />
— —<br />
— —<br />
— —<br />
— —<br />
C) Use of<br />
Appropriate<br />
Behaviors to<br />
Meet Their Needs<br />
State<br />
Rate<br />
4.51%<br />
17.34%<br />
41.72%<br />
34.97%<br />
LEA<br />
Rate<br />
1.46% — —<br />
— —<br />
— —<br />
— —<br />
— —<br />
Page 3 of 5
LEA: 4801 - BRINKLEY SCHOOL <strong>DISTRICT</strong><br />
Indicator 08: Parent Involvement<br />
Percent of surveyed<br />
parents who reported<br />
school facilitated parent<br />
involvement as a means<br />
of improving services<br />
and results for children<br />
with disabilities.<br />
Early Childhood<br />
(3-5)<br />
School Age<br />
(5-21)<br />
State<br />
Rate<br />
90.47%<br />
95.05%<br />
Indicator 09: Disproportionality - Eligibility<br />
Disproportionate representation of racial<br />
and ethnic groups in special education and<br />
related services that is a result of<br />
inappropriate identification (e.g.<br />
monitoring data, review of policies,<br />
practices, and procedures under 618(d),<br />
etc.).<br />
State<br />
Rate<br />
State<br />
Target<br />
88.00%<br />
96.00%<br />
State<br />
Target<br />
0.00% 0.00%<br />
LEA<br />
Rate<br />
— —<br />
97.06%<br />
Indicator 10: Disproportionality-Child with a Disability<br />
Disproportionate representation of racial<br />
and ethnic groups in specific disability<br />
categories that is a result of inappropriate<br />
identification (e.g. monitoring data, review<br />
of policies, practices, and procedures under<br />
618(d), etc.).<br />
Indicator 11: Child Find<br />
Percent of children with<br />
parental consent to evaluate<br />
who are evaluated within<br />
the State established timeline<br />
of 60 days.<br />
Overall<br />
(3-21)<br />
Early Childhood<br />
(3-5)<br />
School Age<br />
(5-21)<br />
State<br />
Rate<br />
0.00%<br />
Indicator 12: Early Childhood Transition<br />
Percent of children referred by Part C prior to<br />
age 3, who are found eligible for Part B, and<br />
who have an IEP developed and implemented<br />
by their third birthday.<br />
Note: - - denotes not applicable<br />
State<br />
Rate<br />
99.41%<br />
99.70%<br />
98.97%<br />
State<br />
Rate<br />
State<br />
Target<br />
0.00%<br />
State<br />
Target<br />
100.00%<br />
100.00%<br />
100.00%<br />
State<br />
Target<br />
Target Met by<br />
LEA (Y/N)<br />
Y<br />
Target Met by<br />
LEA (Y/N)<br />
Y<br />
LEA<br />
Rate<br />
100.00%<br />
— —<br />
100.00%<br />
LEA<br />
Rate<br />
Target Met by<br />
LEA (Y/N)<br />
N/A<br />
Y<br />
Note: The target for Indicator 09 is to have zero percent<br />
(0%) of districts identified as having disproportionate<br />
representation as a result of inappropriate<br />
identification in eligibility.<br />
Note: The target for Indicator 10 is to have zero<br />
percent (0%) of districts identified as having<br />
disproportionate representation as a result of<br />
inappropriate identification in a disability<br />
category.<br />
Target Met by<br />
LEA (Y/N)<br />
N/A<br />
Y<br />
Target Met<br />
by LEA<br />
(Y/N)<br />
99.21% 100.00% - - N/A<br />
Y<br />
Note: * Indicates a zero reponse rate for the<br />
district.<br />
Page 4 of 5
LEA: 4801 - BRINKLEY SCHOOL <strong>DISTRICT</strong><br />
Indicator 13: Secondary Transition<br />
Percent of youth with disabilities aged 16 and<br />
up with an IEP that includes coordinated,<br />
measurable, annual IEP goals and transition<br />
services that will reasonably enable the student<br />
to meet the post-secondary goals.<br />
Indicator 14: Post-School Outcomes<br />
A. Percent of youth enrolled in higher<br />
education within one year of leaving high<br />
school.<br />
State<br />
Rate<br />
State<br />
Target<br />
Note: Data for this Indicator is from the on-site monitoring of LEAs for the given year.<br />
B. Percent of youth enrolled in higher<br />
education or competitively employed<br />
within one year of leaving high school.<br />
C. Percent of youth enrolled in higher<br />
education or in some other postsecondary<br />
education or training program; or<br />
competitively employed or in some other<br />
employment within one year of leaving<br />
high school.<br />
State<br />
Rate<br />
Indicator 20: Reported Data-Timely and Accurate*<br />
District submitted<br />
required data elements<br />
on or before due dates;<br />
made revisions within<br />
the alloted reveiw<br />
periods.<br />
Accurate and Timely<br />
Data Submission<br />
Overall (3-21)<br />
Early Childhood (3-5)<br />
School Age (5-21)<br />
State<br />
Target<br />
100.00%<br />
100.00%<br />
100.00%<br />
State<br />
Target<br />
LEA<br />
Rate<br />
LEA<br />
Rate<br />
Target Met by<br />
LEA (Y/N)<br />
Target Met<br />
by LEA<br />
(Y/N)<br />
Target Met<br />
by LEA<br />
(Y/N)<br />
*Data reviewed for timely and accurate submissions included all APSCN cycle data except for personnel<br />
Note: - - denotes not applicable<br />
96.19 100.00 100.00% Y<br />
14.53<br />
State<br />
Rate<br />
49.42<br />
State<br />
Rate<br />
54.07<br />
13.00<br />
State<br />
Target<br />
49.00<br />
State<br />
Target<br />
60.00<br />
Y<br />
N/A<br />
Y<br />
— —<br />
LEA<br />
Rate<br />
— —<br />
LEA<br />
Rate<br />
— —<br />
N/A<br />
Target Met<br />
by LEA<br />
(Y/N)<br />
N/A<br />
Target Met<br />
by LEA<br />
(Y/N)<br />
N/A<br />
Page 5 of 5
<strong>ARKANSAS</strong> <strong>SPECIAL</strong> <strong>EDUCATION</strong><br />
<strong>DISTRICT</strong> <strong>ANNUAL</strong> PERFORMANCE REPORT<br />
2010/11 School Year<br />
Publication Date: March 2012<br />
Each State must have in place a State Performance Plan (SPP) to evaluate the State's efforts to meet the requirements and<br />
purposes of the implementation of the Individuals with Disabilities Education Act (IDEA). The SPP is a six-year plan, which<br />
describes Arkansas's performance on 20 indicators. The Office of Special Education Programs in the U. S. Department of<br />
Education requires that States report annually to the public on the performance of each local education agency (LEA) on 14 of<br />
20 indicators as compared with targets established by the State in the SPP. Arkansas will report indicators 1 through 14 and<br />
20 for each LEA serving children with disabilities (CWD). Any LEA not meeting targets on compliance indicators (0% for<br />
Indicators 4B, 09 & 10 and 100% for Indicators 11, 12, 13, and 20) are non-compliant with IDEA.<br />
There are no report changes for the 2010/11 school year profile; However, it is important to recognize that: .<br />
1. Indicator 01 (Graduation) is reported a year in arrear (2009/10 graduates) and is based on a four-year cohort. This<br />
means the rate is a measure of students who entered in ninth grade and graduate in four years. The calculation is a<br />
requirement under Title I of the Elementary and Secondary Education Act (ESEA).<br />
2. Indicator 02 (Drop out) is reported a year in arrear. This means the rate is a measure of students who dropped out in<br />
the 2009/10 school year. The Indicator 02 data are aligned with the Common Core of Data (CCD) requirements for<br />
grades 7-12.<br />
3. Indicator 04A and 4B (Suspension/Expulsion) is reported a year in arrear. This means the rate is a measure of<br />
students who had out-of-school suspensions and/or expulsions totaling more than 10 days.<br />
For a complete description of all the Indicators, please visit the special education website at<br />
http://arksped.k12.ar.us/sections/policy.html<br />
LEA: 4802 - CLARENDON SCHOOL <strong>DISTRICT</strong><br />
Indicator 01: Graduation Rates (2009/10 school year) Indicator 02: Dropout Rates (2009/10 school year)<br />
Percent of youth<br />
with IEPs<br />
graduating from<br />
high school with a<br />
regular diploma<br />
State<br />
Rate<br />
State<br />
Target<br />
75.76% 85.00%<br />
LEA<br />
Rate<br />
44.44%<br />
Target Met<br />
by LEA<br />
(Y/N)<br />
N<br />
Percent of<br />
youth with<br />
IEPs dropping<br />
out of high<br />
school<br />
State<br />
Rate<br />
Indicator 03: Assessment on Statewide Benchmark Exam (grades 3-8, 11)<br />
A) Adequate Yearly Progress<br />
n=40<br />
Literacy<br />
Mathematics<br />
Met Disability Subgroup "n"<br />
for Reporting Purposes (Y/N)<br />
State Target for % of Districts Meeting<br />
AYP for Disability Subgroup<br />
State<br />
Target<br />
3.06% 4.20%<br />
LEA<br />
Rate<br />
5.71%<br />
% of Districts Meeting AYP<br />
for Disability Subgroup<br />
Target Met by<br />
LEA (Y/N)<br />
N<br />
Target Met by<br />
LEA(Y/N)<br />
Overall N 17.15% 6.25%<br />
NA<br />
N<br />
N<br />
Note: For a district to qualify as having a disability subgroup it must have a minimum of 40 (n=40) students with disabilities in a school building.<br />
B) Participation<br />
Participation Rate: # of<br />
CWD Tested ÷ # of CWD<br />
Enrolled in grades tested.<br />
Participation Rate: Literacy<br />
Participation Rate: Math<br />
Note: - - denotes not applicable<br />
State<br />
Rate<br />
98.78%<br />
State<br />
Target<br />
95.00%<br />
LEA<br />
Rate<br />
97.73%<br />
Target Met<br />
by LEA (Y/N)<br />
98.61% 95.00% 100.00% Y<br />
Y<br />
C) Performance Proficiency<br />
Percent of CWD Scoring<br />
Proficient or Above<br />
Proficiency Rate: Literacy<br />
Proficiency Rate:<br />
Mathematics<br />
16.00%<br />
16.00%<br />
State<br />
Rate<br />
31.49%<br />
44.86%<br />
State<br />
Target<br />
45.22%<br />
51.14%<br />
LEA<br />
Rate<br />
2.50%<br />
11.90%<br />
NA<br />
NA<br />
Target<br />
Met by<br />
LEA (Y/N)<br />
N<br />
N<br />
Page 1 of 5
LEA: 4802 - CLARENDON SCHOOL <strong>DISTRICT</strong><br />
Indicator 04: Out-of-School Suspensions and Expulsions (2009/10 school year)<br />
A) Suspension/Expulsion<br />
Percent difference of CWD with out-of- school suspensions and<br />
expulsions totaling greater than 10 days in a school year as<br />
compared to the same data for general education students in<br />
the district.<br />
B) Suspension/Expulsion by Race and Ethnicity<br />
Percent of districts that have: (a) a significant discrepancy, by race or<br />
ethnicity, in the rate of suspensions and expulsions of greater than 10<br />
days in a school year for children with IEPs; and (b) policies,<br />
procedures or practices that contribute to the significant discrepancy<br />
and do not comply with requirements relating to the development<br />
and implementation of IEPs, the use of positive behavioral<br />
interventions and supports, and procedural safeguards.<br />
Indicator 05: School Age (5-21) Least Restrictive Environment<br />
A) In the Regular Class 80% or more of the day<br />
Percent of CWD with<br />
IEPs receiving instruction<br />
in the regular class 80%<br />
or more of the day.<br />
State<br />
Rate<br />
State<br />
Target<br />
LEA<br />
Rate<br />
B) In the Regular Class less than 40% of the day<br />
Percent of CWD with<br />
IEPs receiving instruction<br />
in the regular class less<br />
than 60% of the day.<br />
53.87% 59.77%<br />
State<br />
Rate<br />
State<br />
Target<br />
12.42% 12.51%<br />
36.84%<br />
LEA<br />
Rate<br />
10.53%<br />
C) Other Settings outside the regular class<br />
Percent of CWD with IEPs served in<br />
public or private separate schools,<br />
residential placements, or<br />
homebound/hospital placements.<br />
State<br />
Rate<br />
State<br />
Target<br />
2.80% 2.56%<br />
Target Met<br />
by LEA (Y/N)<br />
N<br />
Target Met<br />
by LEA (Y/N)<br />
Y<br />
LEA<br />
Rate<br />
3.95%<br />
Target Met<br />
by LEA(Y/N)<br />
Indicator 06: Early Childhood (3-5) Least Restrictive Environment<br />
A) Regular Early Childhood Program<br />
Percent of children (aged 3 through 5) with IEPs attending a regular<br />
early childhood program and receiving the majority of special<br />
education and related services in the regular early childhood program<br />
Allowable<br />
Difference<br />
LEA: 4802 - CLARENDON SCHOOL <strong>DISTRICT</strong><br />
Indicator 07: Preschool (3-5) Outcomes<br />
a) Percent of preschool CWD<br />
children who did not<br />
improve functioning.<br />
b) Percent of preschool CWD<br />
who improved but whose<br />
functioning remained below<br />
same age peers.<br />
c) Percent of preschool CWD<br />
who improved at a level<br />
nearer to same aged peers.<br />
d) Percent of preschool CWD<br />
who improved functioning to<br />
reach a level comparable to<br />
same age peers.<br />
e) Percent of preschool CWD<br />
children who maintain<br />
functioning at a level<br />
comparable to same aged<br />
peers.<br />
Summary<br />
Statements<br />
1) Of those preschool<br />
children who entered<br />
the preschool program<br />
below age expectations<br />
in each Outcome, the<br />
percent who<br />
substantially increased<br />
their rate of growth by<br />
the time they turned 6<br />
years of age or exited<br />
the program.<br />
2) The percent of<br />
preschool children who<br />
were functioning<br />
within age expectations<br />
in each Outcome by the<br />
time they turned 6<br />
years of age or exited<br />
A) Positive Social -Emotional<br />
Skills*<br />
State<br />
Rate<br />
A) Positive Social -<br />
Emotional Skills<br />
(Including social<br />
relationships)<br />
State<br />
Rate<br />
2.14%<br />
5.31%<br />
25.97%<br />
38.22%<br />
28.36%<br />
State<br />
Target<br />
LEA<br />
Rate<br />
LEA<br />
Rate<br />
— —<br />
— —<br />
— —<br />
— —<br />
— —<br />
Target<br />
Met by<br />
LEA(Y/N)<br />
B) Acquisition and Use of<br />
Knowledge and Skills<br />
(Including early language/<br />
communication and early literacy)<br />
B) Acquisition and Use of<br />
Knowledge and Skills **<br />
State<br />
Rate<br />
1.75%<br />
6.59%<br />
34.23%<br />
43.51%<br />
13.92%<br />
State<br />
Target<br />
LEA<br />
Rate<br />
Target<br />
Met by<br />
LEA(Y/N)<br />
C) Use of Appropriate Behaviors<br />
to Meet Their Needs<br />
State<br />
Rate<br />
State<br />
Target<br />
LEA<br />
Rate<br />
Target<br />
Met by<br />
LEA(Y/N)<br />
89.61% 90.50% — — N/A 90.31% 90.50% — — N/A 90.82% 92.50% — — N/A<br />
66.58% 69.50% — — N/A 57.43% 60.50% — — N/A 76.69% 78.50% — — N/A<br />
NOTE: * Including social relationships ** Including early language/ communication and early literacy<br />
Note: - - denotes not applicable<br />
State<br />
Rate<br />
LEA<br />
Rate<br />
— —<br />
— —<br />
— —<br />
— —<br />
— —<br />
C) Use of<br />
Appropriate<br />
Behaviors to<br />
Meet Their Needs<br />
State<br />
Rate<br />
4.51%<br />
17.34%<br />
41.72%<br />
34.97%<br />
LEA<br />
Rate<br />
1.46% — —<br />
— —<br />
— —<br />
— —<br />
— —<br />
Page 3 of 5
LEA: 4802 - CLARENDON SCHOOL <strong>DISTRICT</strong><br />
Indicator 08: Parent Involvement<br />
Percent of surveyed<br />
parents who reported<br />
school facilitated parent<br />
involvement as a means<br />
of improving services<br />
and results for children<br />
with disabilities.<br />
Early Childhood<br />
(3-5)<br />
School Age<br />
(5-21)<br />
State<br />
Rate<br />
90.47%<br />
95.05%<br />
Indicator 09: Disproportionality - Eligibility<br />
Disproportionate representation of racial<br />
and ethnic groups in special education and<br />
related services that is a result of<br />
inappropriate identification (e.g.<br />
monitoring data, review of policies,<br />
practices, and procedures under 618(d),<br />
etc.).<br />
State<br />
Rate<br />
State<br />
Target<br />
88.00%<br />
96.00%<br />
State<br />
Target<br />
0.00% 0.00%<br />
LEA<br />
Rate<br />
— —<br />
— —<br />
Indicator 10: Disproportionality-Child with a Disability<br />
Disproportionate representation of racial<br />
and ethnic groups in specific disability<br />
categories that is a result of inappropriate<br />
identification (e.g. monitoring data, review<br />
of policies, practices, and procedures under<br />
618(d), etc.).<br />
Indicator 11: Child Find<br />
Percent of children with<br />
parental consent to evaluate<br />
who are evaluated within<br />
the State established timeline<br />
of 60 days.<br />
Overall<br />
(3-21)<br />
Early Childhood<br />
(3-5)<br />
School Age<br />
(5-21)<br />
State<br />
Rate<br />
0.00%<br />
Indicator 12: Early Childhood Transition<br />
Percent of children referred by Part C prior to<br />
age 3, who are found eligible for Part B, and<br />
who have an IEP developed and implemented<br />
by their third birthday.<br />
Note: - - denotes not applicable<br />
State<br />
Rate<br />
99.41%<br />
99.70%<br />
98.97%<br />
State<br />
Rate<br />
State<br />
Target<br />
0.00%<br />
State<br />
Target<br />
100.00%<br />
100.00%<br />
100.00%<br />
State<br />
Target<br />
Target Met by<br />
LEA (Y/N)<br />
Y<br />
Target Met by<br />
LEA (Y/N)<br />
Y<br />
LEA<br />
Rate<br />
100.00%<br />
— —<br />
100.00%<br />
LEA<br />
Rate<br />
Target Met by<br />
LEA (Y/N)<br />
N/A<br />
N<br />
Note: The target for Indicator 09 is to have zero percent<br />
(0%) of districts identified as having disproportionate<br />
representation as a result of inappropriate<br />
identification in eligibility.<br />
Note: The target for Indicator 10 is to have zero<br />
percent (0%) of districts identified as having<br />
disproportionate representation as a result of<br />
inappropriate identification in a disability<br />
category.<br />
Target Met by<br />
LEA (Y/N)<br />
N/A<br />
Y<br />
Target Met<br />
by LEA<br />
(Y/N)<br />
99.21% 100.00% - - N/A<br />
Y<br />
Note: * Indicates a zero reponse rate for the<br />
district.<br />
Page 4 of 5
LEA: 4802 - CLARENDON SCHOOL <strong>DISTRICT</strong><br />
Indicator 13: Secondary Transition<br />
Percent of youth with disabilities aged 16 and<br />
up with an IEP that includes coordinated,<br />
measurable, annual IEP goals and transition<br />
services that will reasonably enable the student<br />
to meet the post-secondary goals.<br />
Indicator 14: Post-School Outcomes<br />
A. Percent of youth enrolled in higher<br />
education within one year of leaving high<br />
school.<br />
State<br />
Rate<br />
State<br />
Target<br />
Note: Data for this Indicator is from the on-site monitoring of LEAs for the given year.<br />
B. Percent of youth enrolled in higher<br />
education or competitively employed<br />
within one year of leaving high school.<br />
C. Percent of youth enrolled in higher<br />
education or in some other postsecondary<br />
education or training program; or<br />
competitively employed or in some other<br />
employment within one year of leaving<br />
high school.<br />
State<br />
Rate<br />
Indicator 20: Reported Data-Timely and Accurate*<br />
District submitted<br />
required data elements<br />
on or before due dates;<br />
made revisions within<br />
the alloted reveiw<br />
periods.<br />
Accurate and Timely<br />
Data Submission<br />
Overall (3-21)<br />
Early Childhood (3-5)<br />
School Age (5-21)<br />
State<br />
Target<br />
100.00%<br />
100.00%<br />
100.00%<br />
State<br />
Target<br />
LEA<br />
Rate<br />
LEA<br />
Rate<br />
Target Met by<br />
LEA (Y/N)<br />
Target Met<br />
by LEA<br />
(Y/N)<br />
Target Met<br />
by LEA<br />
(Y/N)<br />
*Data reviewed for timely and accurate submissions included all APSCN cycle data except for personnel<br />
Note: - - denotes not applicable<br />
96.19 100.00 — — N/A<br />
14.53<br />
State<br />
Rate<br />
49.42<br />
State<br />
Rate<br />
54.07<br />
13.00<br />
State<br />
Target<br />
49.00<br />
State<br />
Target<br />
60.00<br />
Y<br />
N/A<br />
Y<br />
— —<br />
LEA<br />
Rate<br />
— —<br />
LEA<br />
Rate<br />
— —<br />
N/A<br />
Target Met<br />
by LEA<br />
(Y/N)<br />
N/A<br />
Target Met<br />
by LEA<br />
(Y/N)<br />
N/A<br />
Page 5 of 5
<strong>ARKANSAS</strong> <strong>SPECIAL</strong> <strong>EDUCATION</strong><br />
<strong>DISTRICT</strong> <strong>ANNUAL</strong> PERFORMANCE REPORT<br />
2010/11 School Year<br />
Publication Date: March 2012<br />
Each State must have in place a State Performance Plan (SPP) to evaluate the State's efforts to meet the requirements and<br />
purposes of the implementation of the Individuals with Disabilities Education Act (IDEA). The SPP is a six-year plan, which<br />
describes Arkansas's performance on 20 indicators. The Office of Special Education Programs in the U. S. Department of<br />
Education requires that States report annually to the public on the performance of each local education agency (LEA) on 14 of<br />
20 indicators as compared with targets established by the State in the SPP. Arkansas will report indicators 1 through 14 and<br />
20 for each LEA serving children with disabilities (CWD). Any LEA not meeting targets on compliance indicators (0% for<br />
Indicators 4B, 09 & 10 and 100% for Indicators 11, 12, 13, and 20) are non-compliant with IDEA.<br />
There are no report changes for the 2010/11 school year profile; However, it is important to recognize that: .<br />
1. Indicator 01 (Graduation) is reported a year in arrear (2009/10 graduates) and is based on a four-year cohort. This<br />
means the rate is a measure of students who entered in ninth grade and graduate in four years. The calculation is a<br />
requirement under Title I of the Elementary and Secondary Education Act (ESEA).<br />
2. Indicator 02 (Drop out) is reported a year in arrear. This means the rate is a measure of students who dropped out in<br />
the 2009/10 school year. The Indicator 02 data are aligned with the Common Core of Data (CCD) requirements for<br />
grades 7-12.<br />
3. Indicator 04A and 4B (Suspension/Expulsion) is reported a year in arrear. This means the rate is a measure of<br />
students who had out-of-school suspensions and/or expulsions totaling more than 10 days.<br />
For a complete description of all the Indicators, please visit the special education website at<br />
http://arksped.k12.ar.us/sections/policy.html<br />
LEA: 4901 - CADDO HILLS SCHOOL <strong>DISTRICT</strong><br />
Indicator 01: Graduation Rates (2009/10 school year) Indicator 02: Dropout Rates (2009/10 school year)<br />
Percent of youth<br />
with IEPs<br />
graduating from<br />
high school with a<br />
regular diploma<br />
State<br />
Rate<br />
State<br />
Target<br />
75.76% 85.00%<br />
LEA<br />
Rate<br />
66.67%<br />
Target Met<br />
by LEA<br />
(Y/N)<br />
N<br />
Percent of<br />
youth with<br />
IEPs dropping<br />
out of high<br />
school<br />
State<br />
Rate<br />
Indicator 03: Assessment on Statewide Benchmark Exam (grades 3-8, 11)<br />
A) Adequate Yearly Progress<br />
n=40<br />
Literacy<br />
Mathematics<br />
Met Disability Subgroup "n"<br />
for Reporting Purposes (Y/N)<br />
State Target for % of Districts Meeting<br />
AYP for Disability Subgroup<br />
State<br />
Target<br />
3.06% 4.20%<br />
LEA<br />
Rate<br />
0.00%<br />
% of Districts Meeting AYP<br />
for Disability Subgroup<br />
Target Met by<br />
LEA (Y/N)<br />
Y<br />
Target Met by<br />
LEA(Y/N)<br />
Overall N 17.15% 6.25%<br />
NA<br />
N<br />
N<br />
Note: For a district to qualify as having a disability subgroup it must have a minimum of 40 (n=40) students with disabilities in a school building.<br />
B) Participation<br />
Participation Rate: # of<br />
CWD Tested ÷ # of CWD<br />
Enrolled in grades tested.<br />
Participation Rate: Literacy<br />
Participation Rate: Math<br />
Note: - - denotes not applicable<br />
State<br />
Rate<br />
98.78%<br />
State<br />
Target<br />
95.00%<br />
LEA<br />
Rate<br />
100.00%<br />
Target Met<br />
by LEA (Y/N)<br />
98.61% 95.00% 100.00% Y<br />
Y<br />
C) Performance Proficiency<br />
Percent of CWD Scoring<br />
Proficient or Above<br />
Proficiency Rate: Literacy<br />
Proficiency Rate:<br />
Mathematics<br />
16.00%<br />
16.00%<br />
State<br />
Rate<br />
31.49%<br />
44.86%<br />
State<br />
Target<br />
45.22%<br />
51.14%<br />
LEA<br />
Rate<br />
16.67%<br />
41.18%<br />
NA<br />
NA<br />
Target<br />
Met by<br />
LEA (Y/N)<br />
N<br />
N<br />
Page 1 of 5
LEA: 4901 - CADDO HILLS SCHOOL <strong>DISTRICT</strong><br />
Indicator 04: Out-of-School Suspensions and Expulsions (2009/10 school year)<br />
A) Suspension/Expulsion<br />
Percent difference of CWD with out-of- school suspensions and<br />
expulsions totaling greater than 10 days in a school year as<br />
compared to the same data for general education students in<br />
the district.<br />
B) Suspension/Expulsion by Race and Ethnicity<br />
Percent of districts that have: (a) a significant discrepancy, by race or<br />
ethnicity, in the rate of suspensions and expulsions of greater than 10<br />
days in a school year for children with IEPs; and (b) policies,<br />
procedures or practices that contribute to the significant discrepancy<br />
and do not comply with requirements relating to the development<br />
and implementation of IEPs, the use of positive behavioral<br />
interventions and supports, and procedural safeguards.<br />
Indicator 05: School Age (5-21) Least Restrictive Environment<br />
A) In the Regular Class 80% or more of the day<br />
Percent of CWD with<br />
IEPs receiving instruction<br />
in the regular class 80%<br />
or more of the day.<br />
State<br />
Rate<br />
State<br />
Target<br />
LEA<br />
Rate<br />
B) In the Regular Class less than 40% of the day<br />
Percent of CWD with<br />
IEPs receiving instruction<br />
in the regular class less<br />
than 60% of the day.<br />
53.87% 59.77%<br />
State<br />
Rate<br />
State<br />
Target<br />
12.42% 12.51%<br />
41.67%<br />
LEA<br />
Rate<br />
5.95%<br />
C) Other Settings outside the regular class<br />
Percent of CWD with IEPs served in<br />
public or private separate schools,<br />
residential placements, or<br />
homebound/hospital placements.<br />
State<br />
Rate<br />
State<br />
Target<br />
2.80% 2.56%<br />
Target Met<br />
by LEA (Y/N)<br />
N<br />
Target Met<br />
by LEA (Y/N)<br />
Y<br />
LEA<br />
Rate<br />
1.19%<br />
Target Met<br />
by LEA(Y/N)<br />
Indicator 06: Early Childhood (3-5) Least Restrictive Environment<br />
A) Regular Early Childhood Program<br />
Percent of children (aged 3 through 5) with IEPs attending a regular<br />
early childhood program and receiving the majority of special<br />
education and related services in the regular early childhood program<br />
Allowable<br />
Difference<br />
LEA: 4901 - CADDO HILLS SCHOOL <strong>DISTRICT</strong><br />
Indicator 07: Preschool (3-5) Outcomes<br />
a) Percent of preschool CWD<br />
children who did not<br />
improve functioning.<br />
b) Percent of preschool CWD<br />
who improved but whose<br />
functioning remained below<br />
same age peers.<br />
c) Percent of preschool CWD<br />
who improved at a level<br />
nearer to same aged peers.<br />
d) Percent of preschool CWD<br />
who improved functioning to<br />
reach a level comparable to<br />
same age peers.<br />
e) Percent of preschool CWD<br />
children who maintain<br />
functioning at a level<br />
comparable to same aged<br />
peers.<br />
Summary<br />
Statements<br />
1) Of those preschool<br />
children who entered<br />
the preschool program<br />
below age expectations<br />
in each Outcome, the<br />
percent who<br />
substantially increased<br />
their rate of growth by<br />
the time they turned 6<br />
years of age or exited<br />
the program.<br />
2) The percent of<br />
preschool children who<br />
were functioning<br />
within age expectations<br />
in each Outcome by the<br />
time they turned 6<br />
years of age or exited<br />
A) Positive Social -Emotional<br />
Skills*<br />
State<br />
Rate<br />
A) Positive Social -<br />
Emotional Skills<br />
(Including social<br />
relationships)<br />
State<br />
Rate<br />
2.14%<br />
5.31%<br />
25.97%<br />
38.22%<br />
28.36%<br />
State<br />
Target<br />
LEA<br />
Rate<br />
LEA<br />
Rate<br />
— —<br />
— —<br />
— —<br />
— —<br />
— —<br />
Target<br />
Met by<br />
LEA(Y/N)<br />
B) Acquisition and Use of<br />
Knowledge and Skills<br />
(Including early language/<br />
communication and early literacy)<br />
B) Acquisition and Use of<br />
Knowledge and Skills **<br />
State<br />
Rate<br />
1.75%<br />
6.59%<br />
34.23%<br />
43.51%<br />
13.92%<br />
State<br />
Target<br />
LEA<br />
Rate<br />
Target<br />
Met by<br />
LEA(Y/N)<br />
C) Use of Appropriate Behaviors<br />
to Meet Their Needs<br />
State<br />
Rate<br />
State<br />
Target<br />
LEA<br />
Rate<br />
Target<br />
Met by<br />
LEA(Y/N)<br />
89.61% 90.50% — — N/A 90.31% 90.50% — — N/A 90.82% 92.50% — — N/A<br />
66.58% 69.50% — — N/A 57.43% 60.50% — — N/A 76.69% 78.50% — — N/A<br />
NOTE: * Including social relationships ** Including early language/ communication and early literacy<br />
Note: - - denotes not applicable<br />
State<br />
Rate<br />
LEA<br />
Rate<br />
— —<br />
— —<br />
— —<br />
— —<br />
— —<br />
C) Use of<br />
Appropriate<br />
Behaviors to<br />
Meet Their Needs<br />
State<br />
Rate<br />
4.51%<br />
17.34%<br />
41.72%<br />
34.97%<br />
LEA<br />
Rate<br />
1.46% — —<br />
— —<br />
— —<br />
— —<br />
— —<br />
Page 3 of 5
LEA: 4901 - CADDO HILLS SCHOOL <strong>DISTRICT</strong><br />
Indicator 08: Parent Involvement<br />
Percent of surveyed<br />
parents who reported<br />
school facilitated parent<br />
involvement as a means<br />
of improving services<br />
and results for children<br />
with disabilities.<br />
Early Childhood<br />
(3-5)<br />
School Age<br />
(5-21)<br />
State<br />
Rate<br />
90.47%<br />
95.05%<br />
Indicator 09: Disproportionality - Eligibility<br />
Disproportionate representation of racial<br />
and ethnic groups in special education and<br />
related services that is a result of<br />
inappropriate identification (e.g.<br />
monitoring data, review of policies,<br />
practices, and procedures under 618(d),<br />
etc.).<br />
State<br />
Rate<br />
State<br />
Target<br />
88.00%<br />
96.00%<br />
State<br />
Target<br />
0.00% 0.00%<br />
LEA<br />
Rate<br />
— —<br />
100.00%<br />
Indicator 10: Disproportionality-Child with a Disability<br />
Disproportionate representation of racial<br />
and ethnic groups in specific disability<br />
categories that is a result of inappropriate<br />
identification (e.g. monitoring data, review<br />
of policies, practices, and procedures under<br />
618(d), etc.).<br />
Indicator 11: Child Find<br />
Percent of children with<br />
parental consent to evaluate<br />
who are evaluated within<br />
the State established timeline<br />
of 60 days.<br />
Overall<br />
(3-21)<br />
Early Childhood<br />
(3-5)<br />
School Age<br />
(5-21)<br />
State<br />
Rate<br />
0.00%<br />
Indicator 12: Early Childhood Transition<br />
Percent of children referred by Part C prior to<br />
age 3, who are found eligible for Part B, and<br />
who have an IEP developed and implemented<br />
by their third birthday.<br />
Note: - - denotes not applicable<br />
State<br />
Rate<br />
99.41%<br />
99.70%<br />
98.97%<br />
State<br />
Rate<br />
State<br />
Target<br />
0.00%<br />
State<br />
Target<br />
100.00%<br />
100.00%<br />
100.00%<br />
State<br />
Target<br />
Target Met by<br />
LEA (Y/N)<br />
Y<br />
Target Met by<br />
LEA (Y/N)<br />
Y<br />
LEA<br />
Rate<br />
100.00%<br />
— —<br />
100.00%<br />
LEA<br />
Rate<br />
Target Met by<br />
LEA (Y/N)<br />
N/A<br />
Y<br />
Note: The target for Indicator 09 is to have zero percent<br />
(0%) of districts identified as having disproportionate<br />
representation as a result of inappropriate<br />
identification in eligibility.<br />
Note: The target for Indicator 10 is to have zero<br />
percent (0%) of districts identified as having<br />
disproportionate representation as a result of<br />
inappropriate identification in a disability<br />
category.<br />
Target Met by<br />
LEA (Y/N)<br />
N/A<br />
Y<br />
Target Met<br />
by LEA<br />
(Y/N)<br />
99.21% 100.00% - - N/A<br />
Y<br />
Note: * Indicates a zero reponse rate for the<br />
district.<br />
Page 4 of 5
LEA: 4901 - CADDO HILLS SCHOOL <strong>DISTRICT</strong><br />
Indicator 13: Secondary Transition<br />
Percent of youth with disabilities aged 16 and<br />
up with an IEP that includes coordinated,<br />
measurable, annual IEP goals and transition<br />
services that will reasonably enable the student<br />
to meet the post-secondary goals.<br />
Indicator 14: Post-School Outcomes<br />
A. Percent of youth enrolled in higher<br />
education within one year of leaving high<br />
school.<br />
State<br />
Rate<br />
State<br />
Target<br />
Note: Data for this Indicator is from the on-site monitoring of LEAs for the given year.<br />
B. Percent of youth enrolled in higher<br />
education or competitively employed<br />
within one year of leaving high school.<br />
C. Percent of youth enrolled in higher<br />
education or in some other postsecondary<br />
education or training program; or<br />
competitively employed or in some other<br />
employment within one year of leaving<br />
high school.<br />
State<br />
Rate<br />
Indicator 20: Reported Data-Timely and Accurate*<br />
District submitted<br />
required data elements<br />
on or before due dates;<br />
made revisions within<br />
the alloted reveiw<br />
periods.<br />
Accurate and Timely<br />
Data Submission<br />
Overall (3-21)<br />
Early Childhood (3-5)<br />
School Age (5-21)<br />
State<br />
Target<br />
100.00%<br />
100.00%<br />
100.00%<br />
State<br />
Target<br />
LEA<br />
Rate<br />
LEA<br />
Rate<br />
Target Met by<br />
LEA (Y/N)<br />
Target Met<br />
by LEA<br />
(Y/N)<br />
Target Met<br />
by LEA<br />
(Y/N)<br />
*Data reviewed for timely and accurate submissions included all APSCN cycle data except for personnel<br />
Note: - - denotes not applicable<br />
96.19 100.00 — — N/A<br />
14.53<br />
State<br />
Rate<br />
49.42<br />
State<br />
Rate<br />
54.07<br />
13.00<br />
State<br />
Target<br />
49.00<br />
State<br />
Target<br />
60.00<br />
Y<br />
N/A<br />
Y<br />
— —<br />
LEA<br />
Rate<br />
— —<br />
LEA<br />
Rate<br />
— —<br />
N/A<br />
Target Met<br />
by LEA<br />
(Y/N)<br />
N/A<br />
Target Met<br />
by LEA<br />
(Y/N)<br />
N/A<br />
Page 5 of 5
LEA: 4902 - MOUNT IDA SCHOOL <strong>DISTRICT</strong><br />
<strong>ARKANSAS</strong> <strong>SPECIAL</strong> <strong>EDUCATION</strong><br />
<strong>DISTRICT</strong> <strong>ANNUAL</strong> PERFORMANCE REPORT<br />
2010/11 School Year<br />
Publication Date: March 2012<br />
Each State must have in place a State Performance Plan (SPP) to evaluate the State's efforts to meet the requirements and<br />
purposes of the implementation of the Individuals with Disabilities Education Act (IDEA). The SPP is a six-year plan, which<br />
describes Arkansas's performance on 20 indicators. The Office of Special Education Programs in the U. S. Department of<br />
Education requires that States report annually to the public on the performance of each local education agency (LEA) on 14 of<br />
20 indicators as compared with targets established by the State in the SPP. Arkansas will report indicators 1 through 14 and<br />
20 for each LEA serving children with disabilities (CWD). Any LEA not meeting targets on compliance indicators (0% for<br />
Indicators 4B, 09 & 10 and 100% for Indicators 11, 12, 13, and 20) are non-compliant with IDEA.<br />
There are no report changes for the 2010/11 school year profile; However, it is important to recognize that: .<br />
1. Indicator 01 (Graduation) is reported a year in arrear (2009/10 graduates) and is based on a four-year cohort. This<br />
means the rate is a measure of students who entered in ninth grade and graduate in four years. The calculation is a<br />
requirement under Title I of the Elementary and Secondary Education Act (ESEA).<br />
2. Indicator 02 (Drop out) is reported a year in arrear. This means the rate is a measure of students who dropped out in<br />
the 2009/10 school year. The Indicator 02 data are aligned with the Common Core of Data (CCD) requirements for<br />
grades 7-12.<br />
3. Indicator 04A and 4B (Suspension/Expulsion) is reported a year in arrear. This means the rate is a measure of<br />
students who had out-of-school suspensions and/or expulsions totaling more than 10 days.<br />
Percent of youth<br />
with IEPs<br />
graduating from<br />
high school with a<br />
regular diploma<br />
For a complete description of all the Indicators, please visit the special education website at<br />
http://arksped.k12.ar.us/sections/policy.html<br />
Indicator 01: Graduation Rates (2009/10 school year) Indicator 02: Dropout Rates (2009/10 school year)<br />
State<br />
Rate<br />
State<br />
Target<br />
75.76% 85.00%<br />
LEA<br />
Rate<br />
100.00%<br />
Target Met<br />
by LEA<br />
(Y/N)<br />
Y<br />
Percent of<br />
youth with<br />
IEPs dropping<br />
out of high<br />
school<br />
State<br />
Rate<br />
Indicator 03: Assessment on Statewide Benchmark Exam (grades 3-8, 11)<br />
A) Adequate Yearly Progress<br />
n=40<br />
Literacy<br />
Mathematics<br />
Met Disability Subgroup "n"<br />
for Reporting Purposes (Y/N)<br />
State Target for % of Districts Meeting<br />
AYP for Disability Subgroup<br />
State<br />
Target<br />
3.06% 4.20%<br />
LEA<br />
Rate<br />
0.00%<br />
% of Districts Meeting AYP<br />
for Disability Subgroup<br />
Target Met by<br />
LEA (Y/N)<br />
Y<br />
Target Met by<br />
LEA(Y/N)<br />
Overall N 17.15% 6.25%<br />
NA<br />
N<br />
N<br />
Note: For a district to qualify as having a disability subgroup it must have a minimum of 40 (n=40) students with disabilities in a school building.<br />
B) Participation<br />
Participation Rate: # of<br />
CWD Tested ÷ # of CWD<br />
Enrolled in grades tested.<br />
Participation Rate: Literacy<br />
Participation Rate: Math<br />
Note: - - denotes not applicable<br />
State<br />
Rate<br />
98.78%<br />
State<br />
Target<br />
95.00%<br />
LEA<br />
Rate<br />
100.00%<br />
Target Met<br />
by LEA (Y/N)<br />
98.61% 95.00% 100.00% Y<br />
Y<br />
C) Performance Proficiency<br />
Percent of CWD Scoring<br />
Proficient or Above<br />
Proficiency Rate: Literacy<br />
Proficiency Rate:<br />
Mathematics<br />
16.00%<br />
16.00%<br />
State<br />
Rate<br />
31.49%<br />
44.86%<br />
State<br />
Target<br />
45.22%<br />
51.14%<br />
LEA<br />
Rate<br />
27.27%<br />
39.39%<br />
NA<br />
NA<br />
Target<br />
Met by<br />
LEA (Y/N)<br />
N<br />
N<br />
Page 1 of 5
LEA: 4902 - MOUNT IDA SCHOOL <strong>DISTRICT</strong><br />
Indicator 04: Out-of-School Suspensions and Expulsions (2009/10 school year)<br />
A) Suspension/Expulsion<br />
Percent difference of CWD with out-of- school suspensions and<br />
expulsions totaling greater than 10 days in a school year as<br />
compared to the same data for general education students in<br />
the district.<br />
B) Suspension/Expulsion by Race and Ethnicity<br />
Percent of districts that have: (a) a significant discrepancy, by race or<br />
ethnicity, in the rate of suspensions and expulsions of greater than 10<br />
days in a school year for children with IEPs; and (b) policies,<br />
procedures or practices that contribute to the significant discrepancy<br />
and do not comply with requirements relating to the development<br />
and implementation of IEPs, the use of positive behavioral<br />
interventions and supports, and procedural safeguards.<br />
Indicator 05: School Age (5-21) Least Restrictive Environment<br />
A) In the Regular Class 80% or more of the day<br />
Percent of CWD with<br />
IEPs receiving instruction<br />
in the regular class 80%<br />
or more of the day.<br />
State<br />
Rate<br />
State<br />
Target<br />
LEA<br />
Rate<br />
B) In the Regular Class less than 40% of the day<br />
Percent of CWD with<br />
IEPs receiving instruction<br />
in the regular class less<br />
than 60% of the day.<br />
53.87% 59.77%<br />
State<br />
Rate<br />
State<br />
Target<br />
12.42% 12.51%<br />
80.95%<br />
LEA<br />
Rate<br />
6.35%<br />
C) Other Settings outside the regular class<br />
Percent of CWD with IEPs served in<br />
public or private separate schools,<br />
residential placements, or<br />
homebound/hospital placements.<br />
State<br />
Rate<br />
State<br />
Target<br />
2.80% 2.56%<br />
Target Met<br />
by LEA (Y/N)<br />
Y<br />
Target Met<br />
by LEA (Y/N)<br />
Y<br />
LEA<br />
Rate<br />
1.59%<br />
Target Met<br />
by LEA(Y/N)<br />
Indicator 06: Early Childhood (3-5) Least Restrictive Environment<br />
A) Regular Early Childhood Program<br />
Percent of children (aged 3 through 5) with IEPs attending a regular<br />
early childhood program and receiving the majority of special<br />
education and related services in the regular early childhood program<br />
Allowable<br />
Difference<br />
LEA: 4902 - MOUNT IDA SCHOOL <strong>DISTRICT</strong><br />
Indicator 07: Preschool (3-5) Outcomes<br />
a) Percent of preschool CWD<br />
children who did not<br />
improve functioning.<br />
b) Percent of preschool CWD<br />
who improved but whose<br />
functioning remained below<br />
same age peers.<br />
c) Percent of preschool CWD<br />
who improved at a level<br />
nearer to same aged peers.<br />
d) Percent of preschool CWD<br />
who improved functioning to<br />
reach a level comparable to<br />
same age peers.<br />
e) Percent of preschool CWD<br />
children who maintain<br />
functioning at a level<br />
comparable to same aged<br />
peers.<br />
Summary<br />
Statements<br />
1) Of those preschool<br />
children who entered<br />
the preschool program<br />
below age expectations<br />
in each Outcome, the<br />
percent who<br />
substantially increased<br />
their rate of growth by<br />
the time they turned 6<br />
years of age or exited<br />
the program.<br />
2) The percent of<br />
preschool children who<br />
were functioning<br />
within age expectations<br />
in each Outcome by the<br />
time they turned 6<br />
years of age or exited<br />
A) Positive Social -Emotional<br />
Skills*<br />
State<br />
Rate<br />
A) Positive Social -<br />
Emotional Skills<br />
(Including social<br />
relationships)<br />
State<br />
Rate<br />
2.14%<br />
5.31%<br />
25.97%<br />
38.22%<br />
28.36%<br />
State<br />
Target<br />
LEA<br />
Rate<br />
LEA<br />
Rate<br />
— —<br />
— —<br />
— —<br />
— —<br />
— —<br />
Target<br />
Met by<br />
LEA(Y/N)<br />
B) Acquisition and Use of<br />
Knowledge and Skills<br />
(Including early language/<br />
communication and early literacy)<br />
B) Acquisition and Use of<br />
Knowledge and Skills **<br />
State<br />
Rate<br />
1.75%<br />
6.59%<br />
34.23%<br />
43.51%<br />
13.92%<br />
State<br />
Target<br />
LEA<br />
Rate<br />
Target<br />
Met by<br />
LEA(Y/N)<br />
C) Use of Appropriate Behaviors<br />
to Meet Their Needs<br />
State<br />
Rate<br />
State<br />
Target<br />
LEA<br />
Rate<br />
Target<br />
Met by<br />
LEA(Y/N)<br />
89.61% 90.50% — — N/A 90.31% 90.50% — — N/A 90.82% 92.50% — — N/A<br />
66.58% 69.50% — — N/A 57.43% 60.50% — — N/A 76.69% 78.50% — — N/A<br />
NOTE: * Including social relationships ** Including early language/ communication and early literacy<br />
Note: - - denotes not applicable<br />
State<br />
Rate<br />
LEA<br />
Rate<br />
— —<br />
— —<br />
— —<br />
— —<br />
— —<br />
C) Use of<br />
Appropriate<br />
Behaviors to<br />
Meet Their Needs<br />
State<br />
Rate<br />
4.51%<br />
17.34%<br />
41.72%<br />
34.97%<br />
LEA<br />
Rate<br />
1.46% — —<br />
— —<br />
— —<br />
— —<br />
— —<br />
Page 3 of 5
LEA: 4902 - MOUNT IDA SCHOOL <strong>DISTRICT</strong><br />
Indicator 08: Parent Involvement<br />
Percent of surveyed<br />
parents who reported<br />
school facilitated parent<br />
involvement as a means<br />
of improving services<br />
and results for children<br />
with disabilities.<br />
Early Childhood<br />
(3-5)<br />
School Age<br />
(5-21)<br />
State<br />
Rate<br />
90.47%<br />
95.05%<br />
Indicator 09: Disproportionality - Eligibility<br />
Disproportionate representation of racial<br />
and ethnic groups in special education and<br />
related services that is a result of<br />
inappropriate identification (e.g.<br />
monitoring data, review of policies,<br />
practices, and procedures under 618(d),<br />
etc.).<br />
State<br />
Rate<br />
State<br />
Target<br />
88.00%<br />
96.00%<br />
State<br />
Target<br />
0.00% 0.00%<br />
LEA<br />
Rate<br />
— —<br />
100.00%<br />
Indicator 10: Disproportionality-Child with a Disability<br />
Disproportionate representation of racial<br />
and ethnic groups in specific disability<br />
categories that is a result of inappropriate<br />
identification (e.g. monitoring data, review<br />
of policies, practices, and procedures under<br />
618(d), etc.).<br />
Indicator 11: Child Find<br />
Percent of children with<br />
parental consent to evaluate<br />
who are evaluated within<br />
the State established timeline<br />
of 60 days.<br />
Overall<br />
(3-21)<br />
Early Childhood<br />
(3-5)<br />
School Age<br />
(5-21)<br />
State<br />
Rate<br />
0.00%<br />
Indicator 12: Early Childhood Transition<br />
Percent of children referred by Part C prior to<br />
age 3, who are found eligible for Part B, and<br />
who have an IEP developed and implemented<br />
by their third birthday.<br />
Note: - - denotes not applicable<br />
State<br />
Rate<br />
99.41%<br />
99.70%<br />
98.97%<br />
State<br />
Rate<br />
State<br />
Target<br />
0.00%<br />
State<br />
Target<br />
100.00%<br />
100.00%<br />
100.00%<br />
State<br />
Target<br />
Target Met by<br />
LEA (Y/N)<br />
Y<br />
Target Met by<br />
LEA (Y/N)<br />
Y<br />
LEA<br />
Rate<br />
100.00%<br />
— —<br />
100.00%<br />
LEA<br />
Rate<br />
Target Met by<br />
LEA (Y/N)<br />
N/A<br />
Y<br />
Note: The target for Indicator 09 is to have zero percent<br />
(0%) of districts identified as having disproportionate<br />
representation as a result of inappropriate<br />
identification in eligibility.<br />
Note: The target for Indicator 10 is to have zero<br />
percent (0%) of districts identified as having<br />
disproportionate representation as a result of<br />
inappropriate identification in a disability<br />
category.<br />
Target Met by<br />
LEA (Y/N)<br />
N/A<br />
Y<br />
Target Met<br />
by LEA<br />
(Y/N)<br />
99.21% 100.00% - - N/A<br />
Y<br />
Note: * Indicates a zero reponse rate for the<br />
district.<br />
Page 4 of 5
LEA: 4902 - MOUNT IDA SCHOOL <strong>DISTRICT</strong><br />
Indicator 13: Secondary Transition<br />
Percent of youth with disabilities aged 16 and<br />
up with an IEP that includes coordinated,<br />
measurable, annual IEP goals and transition<br />
services that will reasonably enable the student<br />
to meet the post-secondary goals.<br />
Indicator 14: Post-School Outcomes<br />
A. Percent of youth enrolled in higher<br />
education within one year of leaving high<br />
school.<br />
State<br />
Rate<br />
State<br />
Target<br />
Note: Data for this Indicator is from the on-site monitoring of LEAs for the given year.<br />
B. Percent of youth enrolled in higher<br />
education or competitively employed<br />
within one year of leaving high school.<br />
C. Percent of youth enrolled in higher<br />
education or in some other postsecondary<br />
education or training program; or<br />
competitively employed or in some other<br />
employment within one year of leaving<br />
high school.<br />
State<br />
Rate<br />
Indicator 20: Reported Data-Timely and Accurate*<br />
District submitted<br />
required data elements<br />
on or before due dates;<br />
made revisions within<br />
the alloted reveiw<br />
periods.<br />
Accurate and Timely<br />
Data Submission<br />
Overall (3-21)<br />
Early Childhood (3-5)<br />
School Age (5-21)<br />
State<br />
Target<br />
100.00%<br />
100.00%<br />
100.00%<br />
State<br />
Target<br />
LEA<br />
Rate<br />
LEA<br />
Rate<br />
Target Met by<br />
LEA (Y/N)<br />
Target Met<br />
by LEA<br />
(Y/N)<br />
Target Met<br />
by LEA<br />
(Y/N)<br />
*Data reviewed for timely and accurate submissions included all APSCN cycle data except for personnel<br />
Note: - - denotes not applicable<br />
96.19 100.00 — — N/A<br />
14.53<br />
State<br />
Rate<br />
49.42<br />
State<br />
Rate<br />
54.07<br />
13.00<br />
State<br />
Target<br />
49.00<br />
State<br />
Target<br />
60.00<br />
Y<br />
N/A<br />
Y<br />
— —<br />
LEA<br />
Rate<br />
— —<br />
LEA<br />
Rate<br />
— —<br />
N/A<br />
Target Met<br />
by LEA<br />
(Y/N)<br />
N/A<br />
Target Met<br />
by LEA<br />
(Y/N)<br />
N/A<br />
Page 5 of 5
LEA: 5006 - PRESCOTT SCHOOL <strong>DISTRICT</strong><br />
<strong>ARKANSAS</strong> <strong>SPECIAL</strong> <strong>EDUCATION</strong><br />
<strong>DISTRICT</strong> <strong>ANNUAL</strong> PERFORMANCE REPORT<br />
2010/11 School Year<br />
Publication Date: March 2012<br />
Each State must have in place a State Performance Plan (SPP) to evaluate the State's efforts to meet the requirements and<br />
purposes of the implementation of the Individuals with Disabilities Education Act (IDEA). The SPP is a six-year plan, which<br />
describes Arkansas's performance on 20 indicators. The Office of Special Education Programs in the U. S. Department of<br />
Education requires that States report annually to the public on the performance of each local education agency (LEA) on 14 of<br />
20 indicators as compared with targets established by the State in the SPP. Arkansas will report indicators 1 through 14 and<br />
20 for each LEA serving children with disabilities (CWD). Any LEA not meeting targets on compliance indicators (0% for<br />
Indicators 4B, 09 & 10 and 100% for Indicators 11, 12, 13, and 20) are non-compliant with IDEA.<br />
There are no report changes for the 2010/11 school year profile; However, it is important to recognize that: .<br />
1. Indicator 01 (Graduation) is reported a year in arrear (2009/10 graduates) and is based on a four-year cohort. This<br />
means the rate is a measure of students who entered in ninth grade and graduate in four years. The calculation is a<br />
requirement under Title I of the Elementary and Secondary Education Act (ESEA).<br />
2. Indicator 02 (Drop out) is reported a year in arrear. This means the rate is a measure of students who dropped out in<br />
the 2009/10 school year. The Indicator 02 data are aligned with the Common Core of Data (CCD) requirements for<br />
grades 7-12.<br />
3. Indicator 04A and 4B (Suspension/Expulsion) is reported a year in arrear. This means the rate is a measure of<br />
students who had out-of-school suspensions and/or expulsions totaling more than 10 days.<br />
Percent of youth<br />
with IEPs<br />
graduating from<br />
high school with a<br />
regular diploma<br />
For a complete description of all the Indicators, please visit the special education website at<br />
http://arksped.k12.ar.us/sections/policy.html<br />
Indicator 01: Graduation Rates (2009/10 school year) Indicator 02: Dropout Rates (2009/10 school year)<br />
State<br />
Rate<br />
State<br />
Target<br />
75.76% 85.00%<br />
LEA<br />
Rate<br />
66.67%<br />
Target Met<br />
by LEA<br />
(Y/N)<br />
N<br />
Percent of<br />
youth with<br />
IEPs dropping<br />
out of high<br />
school<br />
State<br />
Rate<br />
Indicator 03: Assessment on Statewide Benchmark Exam (grades 3-8, 11)<br />
A) Adequate Yearly Progress<br />
n=40<br />
Literacy<br />
Mathematics<br />
Met Disability Subgroup "n"<br />
for Reporting Purposes (Y/N)<br />
State Target for % of Districts Meeting<br />
AYP for Disability Subgroup<br />
State<br />
Target<br />
3.06% 4.20%<br />
LEA<br />
Rate<br />
0.00%<br />
% of Districts Meeting AYP<br />
for Disability Subgroup<br />
Target Met by<br />
LEA (Y/N)<br />
Y<br />
Target Met by<br />
LEA(Y/N)<br />
Overall N 17.15% 6.25%<br />
NA<br />
N<br />
N<br />
Note: For a district to qualify as having a disability subgroup it must have a minimum of 40 (n=40) students with disabilities in a school building.<br />
B) Participation<br />
Participation Rate: # of<br />
CWD Tested ÷ # of CWD<br />
Enrolled in grades tested.<br />
Participation Rate: Literacy<br />
Participation Rate: Math<br />
Note: - - denotes not applicable<br />
State<br />
Rate<br />
98.78%<br />
State<br />
Target<br />
95.00%<br />
LEA<br />
Rate<br />
97.22%<br />
Target Met<br />
by LEA (Y/N)<br />
98.61% 95.00% 95.00% Y<br />
Y<br />
C) Performance Proficiency<br />
Percent of CWD Scoring<br />
Proficient or Above<br />
Proficiency Rate: Literacy<br />
Proficiency Rate:<br />
Mathematics<br />
16.00%<br />
16.00%<br />
State<br />
Rate<br />
31.49%<br />
44.86%<br />
State<br />
Target<br />
45.22%<br />
51.14%<br />
LEA<br />
Rate<br />
24.24%<br />
28.17%<br />
NA<br />
NA<br />
Target<br />
Met by<br />
LEA (Y/N)<br />
N<br />
N<br />
Page 1 of 5
LEA: 5006 - PRESCOTT SCHOOL <strong>DISTRICT</strong><br />
Indicator 04: Out-of-School Suspensions and Expulsions (2009/10 school year)<br />
A) Suspension/Expulsion<br />
Percent difference of CWD with out-of- school suspensions and<br />
expulsions totaling greater than 10 days in a school year as<br />
compared to the same data for general education students in<br />
the district.<br />
B) Suspension/Expulsion by Race and Ethnicity<br />
Percent of districts that have: (a) a significant discrepancy, by race or<br />
ethnicity, in the rate of suspensions and expulsions of greater than 10<br />
days in a school year for children with IEPs; and (b) policies,<br />
procedures or practices that contribute to the significant discrepancy<br />
and do not comply with requirements relating to the development<br />
and implementation of IEPs, the use of positive behavioral<br />
interventions and supports, and procedural safeguards.<br />
Indicator 05: School Age (5-21) Least Restrictive Environment<br />
A) In the Regular Class 80% or more of the day<br />
Percent of CWD with<br />
IEPs receiving instruction<br />
in the regular class 80%<br />
or more of the day.<br />
State<br />
Rate<br />
State<br />
Target<br />
LEA<br />
Rate<br />
B) In the Regular Class less than 40% of the day<br />
Percent of CWD with<br />
IEPs receiving instruction<br />
in the regular class less<br />
than 60% of the day.<br />
53.87% 59.77%<br />
State<br />
Rate<br />
State<br />
Target<br />
12.42% 12.51%<br />
62.59%<br />
LEA<br />
Rate<br />
2.16%<br />
C) Other Settings outside the regular class<br />
Percent of CWD with IEPs served in<br />
public or private separate schools,<br />
residential placements, or<br />
homebound/hospital placements.<br />
State<br />
Rate<br />
State<br />
Target<br />
2.80% 2.56%<br />
Target Met<br />
by LEA (Y/N)<br />
Y<br />
Target Met<br />
by LEA (Y/N)<br />
Y<br />
LEA<br />
Rate<br />
1.44%<br />
Target Met<br />
by LEA(Y/N)<br />
Indicator 06: Early Childhood (3-5) Least Restrictive Environment<br />
A) Regular Early Childhood Program<br />
Percent of children (aged 3 through 5) with IEPs attending a regular<br />
early childhood program and receiving the majority of special<br />
education and related services in the regular early childhood program<br />
Allowable<br />
Difference<br />
LEA: 5006 - PRESCOTT SCHOOL <strong>DISTRICT</strong><br />
Indicator 07: Preschool (3-5) Outcomes<br />
a) Percent of preschool CWD<br />
children who did not<br />
improve functioning.<br />
b) Percent of preschool CWD<br />
who improved but whose<br />
functioning remained below<br />
same age peers.<br />
c) Percent of preschool CWD<br />
who improved at a level<br />
nearer to same aged peers.<br />
d) Percent of preschool CWD<br />
who improved functioning to<br />
reach a level comparable to<br />
same age peers.<br />
e) Percent of preschool CWD<br />
children who maintain<br />
functioning at a level<br />
comparable to same aged<br />
peers.<br />
Summary<br />
Statements<br />
1) Of those preschool<br />
children who entered<br />
the preschool program<br />
below age expectations<br />
in each Outcome, the<br />
percent who<br />
substantially increased<br />
their rate of growth by<br />
the time they turned 6<br />
years of age or exited<br />
the program.<br />
2) The percent of<br />
preschool children who<br />
were functioning<br />
within age expectations<br />
in each Outcome by the<br />
time they turned 6<br />
years of age or exited<br />
A) Positive Social -Emotional<br />
Skills*<br />
State<br />
Rate<br />
A) Positive Social -<br />
Emotional Skills<br />
(Including social<br />
relationships)<br />
State<br />
Rate<br />
2.14%<br />
5.31%<br />
25.97%<br />
38.22%<br />
28.36%<br />
State<br />
Target<br />
LEA<br />
Rate<br />
LEA<br />
Rate<br />
— —<br />
— —<br />
— —<br />
— —<br />
— —<br />
Target<br />
Met by<br />
LEA(Y/N)<br />
B) Acquisition and Use of<br />
Knowledge and Skills<br />
(Including early language/<br />
communication and early literacy)<br />
B) Acquisition and Use of<br />
Knowledge and Skills **<br />
State<br />
Rate<br />
1.75%<br />
6.59%<br />
34.23%<br />
43.51%<br />
13.92%<br />
State<br />
Target<br />
LEA<br />
Rate<br />
Target<br />
Met by<br />
LEA(Y/N)<br />
C) Use of Appropriate Behaviors<br />
to Meet Their Needs<br />
State<br />
Rate<br />
State<br />
Target<br />
LEA<br />
Rate<br />
Target<br />
Met by<br />
LEA(Y/N)<br />
89.61% 90.50% — — N/A 90.31% 90.50% — — N/A 90.82% 92.50% — — N/A<br />
66.58% 69.50% — — N/A 57.43% 60.50% — — N/A 76.69% 78.50% — — N/A<br />
NOTE: * Including social relationships ** Including early language/ communication and early literacy<br />
Note: - - denotes not applicable<br />
State<br />
Rate<br />
LEA<br />
Rate<br />
— —<br />
— —<br />
— —<br />
— —<br />
— —<br />
C) Use of<br />
Appropriate<br />
Behaviors to<br />
Meet Their Needs<br />
State<br />
Rate<br />
4.51%<br />
17.34%<br />
41.72%<br />
34.97%<br />
LEA<br />
Rate<br />
1.46% — —<br />
— —<br />
— —<br />
— —<br />
— —<br />
Page 3 of 5
LEA: 5006 - PRESCOTT SCHOOL <strong>DISTRICT</strong><br />
Indicator 08: Parent Involvement<br />
Percent of surveyed<br />
parents who reported<br />
school facilitated parent<br />
involvement as a means<br />
of improving services<br />
and results for children<br />
with disabilities.<br />
Early Childhood<br />
(3-5)<br />
School Age<br />
(5-21)<br />
State<br />
Rate<br />
90.47%<br />
95.05%<br />
Indicator 09: Disproportionality - Eligibility<br />
Disproportionate representation of racial<br />
and ethnic groups in special education and<br />
related services that is a result of<br />
inappropriate identification (e.g.<br />
monitoring data, review of policies,<br />
practices, and procedures under 618(d),<br />
etc.).<br />
State<br />
Rate<br />
State<br />
Target<br />
88.00%<br />
96.00%<br />
State<br />
Target<br />
0.00% 0.00%<br />
LEA<br />
Rate<br />
— —<br />
100.00%<br />
Indicator 10: Disproportionality-Child with a Disability<br />
Disproportionate representation of racial<br />
and ethnic groups in specific disability<br />
categories that is a result of inappropriate<br />
identification (e.g. monitoring data, review<br />
of policies, practices, and procedures under<br />
618(d), etc.).<br />
Indicator 11: Child Find<br />
Percent of children with<br />
parental consent to evaluate<br />
who are evaluated within<br />
the State established timeline<br />
of 60 days.<br />
Overall<br />
(3-21)<br />
Early Childhood<br />
(3-5)<br />
School Age<br />
(5-21)<br />
State<br />
Rate<br />
0.00%<br />
Indicator 12: Early Childhood Transition<br />
Percent of children referred by Part C prior to<br />
age 3, who are found eligible for Part B, and<br />
who have an IEP developed and implemented<br />
by their third birthday.<br />
Note: - - denotes not applicable<br />
State<br />
Rate<br />
99.41%<br />
99.70%<br />
98.97%<br />
State<br />
Rate<br />
State<br />
Target<br />
0.00%<br />
State<br />
Target<br />
100.00%<br />
100.00%<br />
100.00%<br />
State<br />
Target<br />
Target Met by<br />
LEA (Y/N)<br />
Y<br />
Target Met by<br />
LEA (Y/N)<br />
Y<br />
LEA<br />
Rate<br />
100.00%<br />
— —<br />
100.00%<br />
LEA<br />
Rate<br />
Target Met by<br />
LEA (Y/N)<br />
N/A<br />
Y<br />
Note: The target for Indicator 09 is to have zero percent<br />
(0%) of districts identified as having disproportionate<br />
representation as a result of inappropriate<br />
identification in eligibility.<br />
Note: The target for Indicator 10 is to have zero<br />
percent (0%) of districts identified as having<br />
disproportionate representation as a result of<br />
inappropriate identification in a disability<br />
category.<br />
Target Met by<br />
LEA (Y/N)<br />
N/A<br />
Y<br />
Target Met<br />
by LEA<br />
(Y/N)<br />
99.21% 100.00% - - N/A<br />
Y<br />
Note: * Indicates a zero reponse rate for the<br />
district.<br />
Page 4 of 5
LEA: 5006 - PRESCOTT SCHOOL <strong>DISTRICT</strong><br />
Indicator 13: Secondary Transition<br />
Percent of youth with disabilities aged 16 and<br />
up with an IEP that includes coordinated,<br />
measurable, annual IEP goals and transition<br />
services that will reasonably enable the student<br />
to meet the post-secondary goals.<br />
Indicator 14: Post-School Outcomes<br />
A. Percent of youth enrolled in higher<br />
education within one year of leaving high<br />
school.<br />
State<br />
Rate<br />
State<br />
Target<br />
Note: Data for this Indicator is from the on-site monitoring of LEAs for the given year.<br />
B. Percent of youth enrolled in higher<br />
education or competitively employed<br />
within one year of leaving high school.<br />
C. Percent of youth enrolled in higher<br />
education or in some other postsecondary<br />
education or training program; or<br />
competitively employed or in some other<br />
employment within one year of leaving<br />
high school.<br />
State<br />
Rate<br />
Indicator 20: Reported Data-Timely and Accurate*<br />
District submitted<br />
required data elements<br />
on or before due dates;<br />
made revisions within<br />
the alloted reveiw<br />
periods.<br />
Accurate and Timely<br />
Data Submission<br />
Overall (3-21)<br />
Early Childhood (3-5)<br />
School Age (5-21)<br />
State<br />
Target<br />
100.00%<br />
100.00%<br />
100.00%<br />
State<br />
Target<br />
LEA<br />
Rate<br />
LEA<br />
Rate<br />
Target Met by<br />
LEA (Y/N)<br />
Target Met<br />
by LEA<br />
(Y/N)<br />
Target Met<br />
by LEA<br />
(Y/N)<br />
*Data reviewed for timely and accurate submissions included all APSCN cycle data except for personnel<br />
Note: - - denotes not applicable<br />
96.19 100.00 — — N/A<br />
14.53<br />
State<br />
Rate<br />
49.42<br />
State<br />
Rate<br />
54.07<br />
13.00<br />
State<br />
Target<br />
49.00<br />
State<br />
Target<br />
60.00<br />
Y<br />
N/A<br />
Y<br />
100.00%<br />
LEA<br />
Rate<br />
100.00%<br />
LEA<br />
Rate<br />
100.00%<br />
Y<br />
Target Met<br />
by LEA<br />
(Y/N)<br />
Y<br />
Target Met<br />
by LEA<br />
(Y/N)<br />
Y<br />
Page 5 of 5
LEA: 5008 - NEVADA SCHOOL <strong>DISTRICT</strong><br />
<strong>ARKANSAS</strong> <strong>SPECIAL</strong> <strong>EDUCATION</strong><br />
<strong>DISTRICT</strong> <strong>ANNUAL</strong> PERFORMANCE REPORT<br />
2010/11 School Year<br />
Publication Date: March 2012<br />
Each State must have in place a State Performance Plan (SPP) to evaluate the State's efforts to meet the requirements and<br />
purposes of the implementation of the Individuals with Disabilities Education Act (IDEA). The SPP is a six-year plan, which<br />
describes Arkansas's performance on 20 indicators. The Office of Special Education Programs in the U. S. Department of<br />
Education requires that States report annually to the public on the performance of each local education agency (LEA) on 14 of<br />
20 indicators as compared with targets established by the State in the SPP. Arkansas will report indicators 1 through 14 and<br />
20 for each LEA serving children with disabilities (CWD). Any LEA not meeting targets on compliance indicators (0% for<br />
Indicators 4B, 09 & 10 and 100% for Indicators 11, 12, 13, and 20) are non-compliant with IDEA.<br />
There are no report changes for the 2010/11 school year profile; However, it is important to recognize that: .<br />
1. Indicator 01 (Graduation) is reported a year in arrear (2009/10 graduates) and is based on a four-year cohort. This<br />
means the rate is a measure of students who entered in ninth grade and graduate in four years. The calculation is a<br />
requirement under Title I of the Elementary and Secondary Education Act (ESEA).<br />
2. Indicator 02 (Drop out) is reported a year in arrear. This means the rate is a measure of students who dropped out in<br />
the 2009/10 school year. The Indicator 02 data are aligned with the Common Core of Data (CCD) requirements for<br />
grades 7-12.<br />
3. Indicator 04A and 4B (Suspension/Expulsion) is reported a year in arrear. This means the rate is a measure of<br />
students who had out-of-school suspensions and/or expulsions totaling more than 10 days.<br />
Percent of youth<br />
with IEPs<br />
graduating from<br />
high school with a<br />
regular diploma<br />
For a complete description of all the Indicators, please visit the special education website at<br />
http://arksped.k12.ar.us/sections/policy.html<br />
Indicator 01: Graduation Rates (2009/10 school year) Indicator 02: Dropout Rates (2009/10 school year)<br />
State<br />
Rate<br />
State<br />
Target<br />
75.76% 85.00%<br />
LEA<br />
Rate<br />
100.00%<br />
Target Met<br />
by LEA<br />
(Y/N)<br />
Y<br />
Percent of<br />
youth with<br />
IEPs dropping<br />
out of high<br />
school<br />
State<br />
Rate<br />
Indicator 03: Assessment on Statewide Benchmark Exam (grades 3-8, 11)<br />
A) Adequate Yearly Progress<br />
n=40<br />
Literacy<br />
Mathematics<br />
Met Disability Subgroup "n"<br />
for Reporting Purposes (Y/N)<br />
State Target for % of Districts Meeting<br />
AYP for Disability Subgroup<br />
State<br />
Target<br />
3.06% 4.20%<br />
LEA<br />
Rate<br />
0.00%<br />
% of Districts Meeting AYP<br />
for Disability Subgroup<br />
Target Met by<br />
LEA (Y/N)<br />
Y<br />
Target Met by<br />
LEA(Y/N)<br />
Overall N 17.15% 6.25%<br />
NA<br />
N<br />
N<br />
Note: For a district to qualify as having a disability subgroup it must have a minimum of 40 (n=40) students with disabilities in a school building.<br />
B) Participation<br />
Participation Rate: # of<br />
CWD Tested ÷ # of CWD<br />
Enrolled in grades tested.<br />
Participation Rate: Literacy<br />
Participation Rate: Math<br />
Note: - - denotes not applicable<br />
State<br />
Rate<br />
98.78%<br />
State<br />
Target<br />
95.00%<br />
LEA<br />
Rate<br />
100.00%<br />
Target Met<br />
by LEA (Y/N)<br />
98.61% 95.00% 100.00% Y<br />
Y<br />
C) Performance Proficiency<br />
Percent of CWD Scoring<br />
Proficient or Above<br />
Proficiency Rate: Literacy<br />
Proficiency Rate:<br />
Mathematics<br />
16.00%<br />
16.00%<br />
State<br />
Rate<br />
31.49%<br />
44.86%<br />
State<br />
Target<br />
45.22%<br />
51.14%<br />
LEA<br />
Rate<br />
9.52%<br />
36.00%<br />
NA<br />
NA<br />
Target<br />
Met by<br />
LEA (Y/N)<br />
N<br />
N<br />
Page 1 of 5
LEA: 5008 - NEVADA SCHOOL <strong>DISTRICT</strong><br />
Indicator 04: Out-of-School Suspensions and Expulsions (2009/10 school year)<br />
A) Suspension/Expulsion<br />
Percent difference of CWD with out-of- school suspensions and<br />
expulsions totaling greater than 10 days in a school year as<br />
compared to the same data for general education students in<br />
the district.<br />
B) Suspension/Expulsion by Race and Ethnicity<br />
Percent of districts that have: (a) a significant discrepancy, by race or<br />
ethnicity, in the rate of suspensions and expulsions of greater than 10<br />
days in a school year for children with IEPs; and (b) policies,<br />
procedures or practices that contribute to the significant discrepancy<br />
and do not comply with requirements relating to the development<br />
and implementation of IEPs, the use of positive behavioral<br />
interventions and supports, and procedural safeguards.<br />
Indicator 05: School Age (5-21) Least Restrictive Environment<br />
A) In the Regular Class 80% or more of the day<br />
Percent of CWD with<br />
IEPs receiving instruction<br />
in the regular class 80%<br />
or more of the day.<br />
State<br />
Rate<br />
State<br />
Target<br />
LEA<br />
Rate<br />
B) In the Regular Class less than 40% of the day<br />
Percent of CWD with<br />
IEPs receiving instruction<br />
in the regular class less<br />
than 60% of the day.<br />
53.87% 59.77%<br />
State<br />
Rate<br />
State<br />
Target<br />
12.42% 12.51%<br />
48.89%<br />
LEA<br />
Rate<br />
6.67%<br />
C) Other Settings outside the regular class<br />
Percent of CWD with IEPs served in<br />
public or private separate schools,<br />
residential placements, or<br />
homebound/hospital placements.<br />
State<br />
Rate<br />
State<br />
Target<br />
2.80% 2.56%<br />
Target Met<br />
by LEA (Y/N)<br />
N<br />
Target Met<br />
by LEA (Y/N)<br />
Y<br />
LEA<br />
Rate<br />
2.22%<br />
Target Met<br />
by LEA(Y/N)<br />
Indicator 06: Early Childhood (3-5) Least Restrictive Environment<br />
A) Regular Early Childhood Program<br />
Percent of children (aged 3 through 5) with IEPs attending a regular<br />
early childhood program and receiving the majority of special<br />
education and related services in the regular early childhood program<br />
Allowable<br />
Difference<br />
LEA: 5008 - NEVADA SCHOOL <strong>DISTRICT</strong><br />
Indicator 07: Preschool (3-5) Outcomes<br />
a) Percent of preschool CWD<br />
children who did not<br />
improve functioning.<br />
b) Percent of preschool CWD<br />
who improved but whose<br />
functioning remained below<br />
same age peers.<br />
c) Percent of preschool CWD<br />
who improved at a level<br />
nearer to same aged peers.<br />
d) Percent of preschool CWD<br />
who improved functioning to<br />
reach a level comparable to<br />
same age peers.<br />
e) Percent of preschool CWD<br />
children who maintain<br />
functioning at a level<br />
comparable to same aged<br />
peers.<br />
Summary<br />
Statements<br />
1) Of those preschool<br />
children who entered<br />
the preschool program<br />
below age expectations<br />
in each Outcome, the<br />
percent who<br />
substantially increased<br />
their rate of growth by<br />
the time they turned 6<br />
years of age or exited<br />
the program.<br />
2) The percent of<br />
preschool children who<br />
were functioning<br />
within age expectations<br />
in each Outcome by the<br />
time they turned 6<br />
years of age or exited<br />
A) Positive Social -Emotional<br />
Skills*<br />
State<br />
Rate<br />
A) Positive Social -<br />
Emotional Skills<br />
(Including social<br />
relationships)<br />
State<br />
Rate<br />
2.14%<br />
5.31%<br />
25.97%<br />
38.22%<br />
28.36%<br />
State<br />
Target<br />
LEA<br />
Rate<br />
LEA<br />
Rate<br />
— —<br />
— —<br />
— —<br />
— —<br />
— —<br />
Target<br />
Met by<br />
LEA(Y/N)<br />
B) Acquisition and Use of<br />
Knowledge and Skills<br />
(Including early language/<br />
communication and early literacy)<br />
B) Acquisition and Use of<br />
Knowledge and Skills **<br />
State<br />
Rate<br />
1.75%<br />
6.59%<br />
34.23%<br />
43.51%<br />
13.92%<br />
State<br />
Target<br />
LEA<br />
Rate<br />
Target<br />
Met by<br />
LEA(Y/N)<br />
C) Use of Appropriate Behaviors<br />
to Meet Their Needs<br />
State<br />
Rate<br />
State<br />
Target<br />
LEA<br />
Rate<br />
Target<br />
Met by<br />
LEA(Y/N)<br />
89.61% 90.50% — — N/A 90.31% 90.50% — — N/A 90.82% 92.50% — — N/A<br />
66.58% 69.50% — — N/A 57.43% 60.50% — — N/A 76.69% 78.50% — — N/A<br />
NOTE: * Including social relationships ** Including early language/ communication and early literacy<br />
Note: - - denotes not applicable<br />
State<br />
Rate<br />
LEA<br />
Rate<br />
— —<br />
— —<br />
— —<br />
— —<br />
— —<br />
C) Use of<br />
Appropriate<br />
Behaviors to<br />
Meet Their Needs<br />
State<br />
Rate<br />
4.51%<br />
17.34%<br />
41.72%<br />
34.97%<br />
LEA<br />
Rate<br />
1.46% — —<br />
— —<br />
— —<br />
— —<br />
— —<br />
Page 3 of 5
LEA: 5008 - NEVADA SCHOOL <strong>DISTRICT</strong><br />
Indicator 08: Parent Involvement<br />
Percent of surveyed<br />
parents who reported<br />
school facilitated parent<br />
involvement as a means<br />
of improving services<br />
and results for children<br />
with disabilities.<br />
Early Childhood<br />
(3-5)<br />
School Age<br />
(5-21)<br />
State<br />
Rate<br />
90.47%<br />
95.05%<br />
Indicator 09: Disproportionality - Eligibility<br />
Disproportionate representation of racial<br />
and ethnic groups in special education and<br />
related services that is a result of<br />
inappropriate identification (e.g.<br />
monitoring data, review of policies,<br />
practices, and procedures under 618(d),<br />
etc.).<br />
State<br />
Rate<br />
State<br />
Target<br />
88.00%<br />
96.00%<br />
State<br />
Target<br />
0.00% 0.00%<br />
LEA<br />
Rate<br />
— —<br />
97.50%<br />
Indicator 10: Disproportionality-Child with a Disability<br />
Disproportionate representation of racial<br />
and ethnic groups in specific disability<br />
categories that is a result of inappropriate<br />
identification (e.g. monitoring data, review<br />
of policies, practices, and procedures under<br />
618(d), etc.).<br />
Indicator 11: Child Find<br />
Percent of children with<br />
parental consent to evaluate<br />
who are evaluated within<br />
the State established timeline<br />
of 60 days.<br />
Overall<br />
(3-21)<br />
Early Childhood<br />
(3-5)<br />
School Age<br />
(5-21)<br />
State<br />
Rate<br />
0.00%<br />
Indicator 12: Early Childhood Transition<br />
Percent of children referred by Part C prior to<br />
age 3, who are found eligible for Part B, and<br />
who have an IEP developed and implemented<br />
by their third birthday.<br />
Note: - - denotes not applicable<br />
State<br />
Rate<br />
99.41%<br />
99.70%<br />
98.97%<br />
State<br />
Rate<br />
State<br />
Target<br />
0.00%<br />
State<br />
Target<br />
100.00%<br />
100.00%<br />
100.00%<br />
State<br />
Target<br />
Target Met by<br />
LEA (Y/N)<br />
Y<br />
Target Met by<br />
LEA (Y/N)<br />
Y<br />
LEA<br />
Rate<br />
100.00%<br />
— —<br />
100.00%<br />
LEA<br />
Rate<br />
Target Met by<br />
LEA (Y/N)<br />
N/A<br />
Y<br />
Note: The target for Indicator 09 is to have zero percent<br />
(0%) of districts identified as having disproportionate<br />
representation as a result of inappropriate<br />
identification in eligibility.<br />
Note: The target for Indicator 10 is to have zero<br />
percent (0%) of districts identified as having<br />
disproportionate representation as a result of<br />
inappropriate identification in a disability<br />
category.<br />
Target Met by<br />
LEA (Y/N)<br />
N/A<br />
Y<br />
Target Met<br />
by LEA<br />
(Y/N)<br />
99.21% 100.00% - - N/A<br />
Y<br />
Note: * Indicates a zero reponse rate for the<br />
district.<br />
Page 4 of 5
LEA: 5008 - NEVADA SCHOOL <strong>DISTRICT</strong><br />
Indicator 13: Secondary Transition<br />
Percent of youth with disabilities aged 16 and<br />
up with an IEP that includes coordinated,<br />
measurable, annual IEP goals and transition<br />
services that will reasonably enable the student<br />
to meet the post-secondary goals.<br />
Indicator 14: Post-School Outcomes<br />
A. Percent of youth enrolled in higher<br />
education within one year of leaving high<br />
school.<br />
State<br />
Rate<br />
State<br />
Target<br />
Note: Data for this Indicator is from the on-site monitoring of LEAs for the given year.<br />
B. Percent of youth enrolled in higher<br />
education or competitively employed<br />
within one year of leaving high school.<br />
C. Percent of youth enrolled in higher<br />
education or in some other postsecondary<br />
education or training program; or<br />
competitively employed or in some other<br />
employment within one year of leaving<br />
high school.<br />
State<br />
Rate<br />
Indicator 20: Reported Data-Timely and Accurate*<br />
District submitted<br />
required data elements<br />
on or before due dates;<br />
made revisions within<br />
the alloted reveiw<br />
periods.<br />
Accurate and Timely<br />
Data Submission<br />
Overall (3-21)<br />
Early Childhood (3-5)<br />
School Age (5-21)<br />
State<br />
Target<br />
100.00%<br />
100.00%<br />
100.00%<br />
State<br />
Target<br />
LEA<br />
Rate<br />
LEA<br />
Rate<br />
Target Met by<br />
LEA (Y/N)<br />
Target Met<br />
by LEA<br />
(Y/N)<br />
Target Met<br />
by LEA<br />
(Y/N)<br />
*Data reviewed for timely and accurate submissions included all APSCN cycle data except for personnel<br />
Note: - - denotes not applicable<br />
96.19 100.00 — — N/A<br />
14.53<br />
State<br />
Rate<br />
49.42<br />
State<br />
Rate<br />
54.07<br />
13.00<br />
State<br />
Target<br />
49.00<br />
State<br />
Target<br />
60.00<br />
Y<br />
N/A<br />
Y<br />
— —<br />
LEA<br />
Rate<br />
— —<br />
LEA<br />
Rate<br />
— —<br />
N/A<br />
Target Met<br />
by LEA<br />
(Y/N)<br />
N/A<br />
Target Met<br />
by LEA<br />
(Y/N)<br />
N/A<br />
Page 5 of 5
LEA: 5102 - JASPER SCHOOL <strong>DISTRICT</strong><br />
<strong>ARKANSAS</strong> <strong>SPECIAL</strong> <strong>EDUCATION</strong><br />
<strong>DISTRICT</strong> <strong>ANNUAL</strong> PERFORMANCE REPORT<br />
2010/11 School Year<br />
Publication Date: March 2012<br />
Each State must have in place a State Performance Plan (SPP) to evaluate the State's efforts to meet the requirements and<br />
purposes of the implementation of the Individuals with Disabilities Education Act (IDEA). The SPP is a six-year plan, which<br />
describes Arkansas's performance on 20 indicators. The Office of Special Education Programs in the U. S. Department of<br />
Education requires that States report annually to the public on the performance of each local education agency (LEA) on 14 of<br />
20 indicators as compared with targets established by the State in the SPP. Arkansas will report indicators 1 through 14 and<br />
20 for each LEA serving children with disabilities (CWD). Any LEA not meeting targets on compliance indicators (0% for<br />
Indicators 4B, 09 & 10 and 100% for Indicators 11, 12, 13, and 20) are non-compliant with IDEA.<br />
There are no report changes for the 2010/11 school year profile; However, it is important to recognize that: .<br />
1. Indicator 01 (Graduation) is reported a year in arrear (2009/10 graduates) and is based on a four-year cohort. This<br />
means the rate is a measure of students who entered in ninth grade and graduate in four years. The calculation is a<br />
requirement under Title I of the Elementary and Secondary Education Act (ESEA).<br />
2. Indicator 02 (Drop out) is reported a year in arrear. This means the rate is a measure of students who dropped out in<br />
the 2009/10 school year. The Indicator 02 data are aligned with the Common Core of Data (CCD) requirements for<br />
grades 7-12.<br />
3. Indicator 04A and 4B (Suspension/Expulsion) is reported a year in arrear. This means the rate is a measure of<br />
students who had out-of-school suspensions and/or expulsions totaling more than 10 days.<br />
Percent of youth<br />
with IEPs<br />
graduating from<br />
high school with a<br />
regular diploma<br />
For a complete description of all the Indicators, please visit the special education website at<br />
http://arksped.k12.ar.us/sections/policy.html<br />
Indicator 01: Graduation Rates (2009/10 school year) Indicator 02: Dropout Rates (2009/10 school year)<br />
State<br />
Rate<br />
State<br />
Target<br />
75.76% 85.00%<br />
LEA<br />
Rate<br />
100.00%<br />
Target Met<br />
by LEA<br />
(Y/N)<br />
Y<br />
Percent of<br />
youth with<br />
IEPs dropping<br />
out of high<br />
school<br />
State<br />
Rate<br />
Indicator 03: Assessment on Statewide Benchmark Exam (grades 3-8, 11)<br />
A) Adequate Yearly Progress<br />
n=40<br />
Literacy<br />
Mathematics<br />
Met Disability Subgroup "n"<br />
for Reporting Purposes (Y/N)<br />
State Target for % of Districts Meeting<br />
AYP for Disability Subgroup<br />
State<br />
Target<br />
3.06% 4.20%<br />
LEA<br />
Rate<br />
2.67%<br />
% of Districts Meeting AYP<br />
for Disability Subgroup<br />
Target Met by<br />
LEA (Y/N)<br />
Y<br />
Target Met by<br />
LEA(Y/N)<br />
Overall N 17.15% 6.25%<br />
NA<br />
N<br />
N<br />
Note: For a district to qualify as having a disability subgroup it must have a minimum of 40 (n=40) students with disabilities in a school building.<br />
B) Participation<br />
Participation Rate: # of<br />
CWD Tested ÷ # of CWD<br />
Enrolled in grades tested.<br />
Participation Rate: Literacy<br />
Participation Rate: Math<br />
Note: - - denotes not applicable<br />
State<br />
Rate<br />
98.78%<br />
State<br />
Target<br />
95.00%<br />
LEA<br />
Rate<br />
98.21%<br />
Target Met<br />
by LEA (Y/N)<br />
98.61% 95.00% 98.25% Y<br />
Y<br />
C) Performance Proficiency<br />
Percent of CWD Scoring<br />
Proficient or Above<br />
Proficiency Rate: Literacy<br />
Proficiency Rate:<br />
Mathematics<br />
16.00%<br />
16.00%<br />
State<br />
Rate<br />
31.49%<br />
44.86%<br />
State<br />
Target<br />
45.22%<br />
51.14%<br />
LEA<br />
Rate<br />
30.77%<br />
42.59%<br />
NA<br />
NA<br />
Target<br />
Met by<br />
LEA (Y/N)<br />
N<br />
N<br />
Page 1 of 5
LEA: 5102 - JASPER SCHOOL <strong>DISTRICT</strong><br />
Indicator 04: Out-of-School Suspensions and Expulsions (2009/10 school year)<br />
A) Suspension/Expulsion<br />
Percent difference of CWD with out-of- school suspensions and<br />
expulsions totaling greater than 10 days in a school year as<br />
compared to the same data for general education students in<br />
the district.<br />
B) Suspension/Expulsion by Race and Ethnicity<br />
Percent of districts that have: (a) a significant discrepancy, by race or<br />
ethnicity, in the rate of suspensions and expulsions of greater than 10<br />
days in a school year for children with IEPs; and (b) policies,<br />
procedures or practices that contribute to the significant discrepancy<br />
and do not comply with requirements relating to the development<br />
and implementation of IEPs, the use of positive behavioral<br />
interventions and supports, and procedural safeguards.<br />
Indicator 05: School Age (5-21) Least Restrictive Environment<br />
A) In the Regular Class 80% or more of the day<br />
Percent of CWD with<br />
IEPs receiving instruction<br />
in the regular class 80%<br />
or more of the day.<br />
State<br />
Rate<br />
State<br />
Target<br />
LEA<br />
Rate<br />
B) In the Regular Class less than 40% of the day<br />
Percent of CWD with<br />
IEPs receiving instruction<br />
in the regular class less<br />
than 60% of the day.<br />
53.87% 59.77%<br />
State<br />
Rate<br />
State<br />
Target<br />
12.42% 12.51%<br />
75.83%<br />
LEA<br />
Rate<br />
5.00%<br />
C) Other Settings outside the regular class<br />
Percent of CWD with IEPs served in<br />
public or private separate schools,<br />
residential placements, or<br />
homebound/hospital placements.<br />
State<br />
Rate<br />
State<br />
Target<br />
2.80% 2.56%<br />
Target Met<br />
by LEA (Y/N)<br />
Y<br />
Target Met<br />
by LEA (Y/N)<br />
Y<br />
LEA<br />
Rate<br />
3.33%<br />
Target Met<br />
by LEA(Y/N)<br />
Indicator 06: Early Childhood (3-5) Least Restrictive Environment<br />
A) Regular Early Childhood Program<br />
Percent of children (aged 3 through 5) with IEPs attending a regular<br />
early childhood program and receiving the majority of special<br />
education and related services in the regular early childhood program<br />
Allowable<br />
Difference<br />
LEA: 5102 - JASPER SCHOOL <strong>DISTRICT</strong><br />
Indicator 07: Preschool (3-5) Outcomes<br />
a) Percent of preschool CWD<br />
children who did not<br />
improve functioning.<br />
b) Percent of preschool CWD<br />
who improved but whose<br />
functioning remained below<br />
same age peers.<br />
c) Percent of preschool CWD<br />
who improved at a level<br />
nearer to same aged peers.<br />
d) Percent of preschool CWD<br />
who improved functioning to<br />
reach a level comparable to<br />
same age peers.<br />
e) Percent of preschool CWD<br />
children who maintain<br />
functioning at a level<br />
comparable to same aged<br />
peers.<br />
Summary<br />
Statements<br />
1) Of those preschool<br />
children who entered<br />
the preschool program<br />
below age expectations<br />
in each Outcome, the<br />
percent who<br />
substantially increased<br />
their rate of growth by<br />
the time they turned 6<br />
years of age or exited<br />
the program.<br />
2) The percent of<br />
preschool children who<br />
were functioning<br />
within age expectations<br />
in each Outcome by the<br />
time they turned 6<br />
years of age or exited<br />
A) Positive Social -Emotional<br />
Skills*<br />
State<br />
Rate<br />
A) Positive Social -<br />
Emotional Skills<br />
(Including social<br />
relationships)<br />
State<br />
Rate<br />
2.14%<br />
5.31%<br />
25.97%<br />
38.22%<br />
28.36%<br />
State<br />
Target<br />
LEA<br />
Rate<br />
LEA<br />
Rate<br />
— —<br />
— —<br />
— —<br />
— —<br />
— —<br />
Target<br />
Met by<br />
LEA(Y/N)<br />
B) Acquisition and Use of<br />
Knowledge and Skills<br />
(Including early language/<br />
communication and early literacy)<br />
B) Acquisition and Use of<br />
Knowledge and Skills **<br />
State<br />
Rate<br />
1.75%<br />
6.59%<br />
34.23%<br />
43.51%<br />
13.92%<br />
State<br />
Target<br />
LEA<br />
Rate<br />
Target<br />
Met by<br />
LEA(Y/N)<br />
C) Use of Appropriate Behaviors<br />
to Meet Their Needs<br />
State<br />
Rate<br />
State<br />
Target<br />
LEA<br />
Rate<br />
Target<br />
Met by<br />
LEA(Y/N)<br />
89.61% 90.50% — — N/A 90.31% 90.50% — — N/A 90.82% 92.50% — — N/A<br />
66.58% 69.50% — — N/A 57.43% 60.50% — — N/A 76.69% 78.50% — — N/A<br />
NOTE: * Including social relationships ** Including early language/ communication and early literacy<br />
Note: - - denotes not applicable<br />
State<br />
Rate<br />
LEA<br />
Rate<br />
— —<br />
— —<br />
— —<br />
— —<br />
— —<br />
C) Use of<br />
Appropriate<br />
Behaviors to<br />
Meet Their Needs<br />
State<br />
Rate<br />
4.51%<br />
17.34%<br />
41.72%<br />
34.97%<br />
LEA<br />
Rate<br />
1.46% — —<br />
— —<br />
— —<br />
— —<br />
— —<br />
Page 3 of 5
LEA: 5102 - JASPER SCHOOL <strong>DISTRICT</strong><br />
Indicator 08: Parent Involvement<br />
Percent of surveyed<br />
parents who reported<br />
school facilitated parent<br />
involvement as a means<br />
of improving services<br />
and results for children<br />
with disabilities.<br />
Early Childhood<br />
(3-5)<br />
School Age<br />
(5-21)<br />
State<br />
Rate<br />
90.47%<br />
95.05%<br />
Indicator 09: Disproportionality - Eligibility<br />
Disproportionate representation of racial<br />
and ethnic groups in special education and<br />
related services that is a result of<br />
inappropriate identification (e.g.<br />
monitoring data, review of policies,<br />
practices, and procedures under 618(d),<br />
etc.).<br />
State<br />
Rate<br />
State<br />
Target<br />
88.00%<br />
96.00%<br />
State<br />
Target<br />
0.00% 0.00%<br />
LEA<br />
Rate<br />
— —<br />
87.04%<br />
Indicator 10: Disproportionality-Child with a Disability<br />
Disproportionate representation of racial<br />
and ethnic groups in specific disability<br />
categories that is a result of inappropriate<br />
identification (e.g. monitoring data, review<br />
of policies, practices, and procedures under<br />
618(d), etc.).<br />
Indicator 11: Child Find<br />
Percent of children with<br />
parental consent to evaluate<br />
who are evaluated within<br />
the State established timeline<br />
of 60 days.<br />
Overall<br />
(3-21)<br />
Early Childhood<br />
(3-5)<br />
School Age<br />
(5-21)<br />
State<br />
Rate<br />
0.00%<br />
Indicator 12: Early Childhood Transition<br />
Percent of children referred by Part C prior to<br />
age 3, who are found eligible for Part B, and<br />
who have an IEP developed and implemented<br />
by their third birthday.<br />
Note: - - denotes not applicable<br />
State<br />
Rate<br />
99.41%<br />
99.70%<br />
98.97%<br />
State<br />
Rate<br />
State<br />
Target<br />
0.00%<br />
State<br />
Target<br />
100.00%<br />
100.00%<br />
100.00%<br />
State<br />
Target<br />
Target Met by<br />
LEA (Y/N)<br />
Y<br />
Target Met by<br />
LEA (Y/N)<br />
Y<br />
LEA<br />
Rate<br />
100.00%<br />
— —<br />
100.00%<br />
LEA<br />
Rate<br />
Target Met by<br />
LEA (Y/N)<br />
N/A<br />
N<br />
Note: The target for Indicator 09 is to have zero percent<br />
(0%) of districts identified as having disproportionate<br />
representation as a result of inappropriate<br />
identification in eligibility.<br />
Note: The target for Indicator 10 is to have zero<br />
percent (0%) of districts identified as having<br />
disproportionate representation as a result of<br />
inappropriate identification in a disability<br />
category.<br />
Target Met by<br />
LEA (Y/N)<br />
N/A<br />
Y<br />
Target Met<br />
by LEA<br />
(Y/N)<br />
99.21% 100.00% - - N/A<br />
Y<br />
Note: * Indicates a zero reponse rate for the<br />
district.<br />
Page 4 of 5
LEA: 5102 - JASPER SCHOOL <strong>DISTRICT</strong><br />
Indicator 13: Secondary Transition<br />
Percent of youth with disabilities aged 16 and<br />
up with an IEP that includes coordinated,<br />
measurable, annual IEP goals and transition<br />
services that will reasonably enable the student<br />
to meet the post-secondary goals.<br />
Indicator 14: Post-School Outcomes<br />
A. Percent of youth enrolled in higher<br />
education within one year of leaving high<br />
school.<br />
State<br />
Rate<br />
State<br />
Target<br />
Note: Data for this Indicator is from the on-site monitoring of LEAs for the given year.<br />
B. Percent of youth enrolled in higher<br />
education or competitively employed<br />
within one year of leaving high school.<br />
C. Percent of youth enrolled in higher<br />
education or in some other postsecondary<br />
education or training program; or<br />
competitively employed or in some other<br />
employment within one year of leaving<br />
high school.<br />
State<br />
Rate<br />
Indicator 20: Reported Data-Timely and Accurate*<br />
District submitted<br />
required data elements<br />
on or before due dates;<br />
made revisions within<br />
the alloted reveiw<br />
periods.<br />
Accurate and Timely<br />
Data Submission<br />
Overall (3-21)<br />
Early Childhood (3-5)<br />
School Age (5-21)<br />
State<br />
Target<br />
100.00%<br />
100.00%<br />
100.00%<br />
State<br />
Target<br />
LEA<br />
Rate<br />
LEA<br />
Rate<br />
Target Met by<br />
LEA (Y/N)<br />
Target Met<br />
by LEA<br />
(Y/N)<br />
Target Met<br />
by LEA<br />
(Y/N)<br />
*Data reviewed for timely and accurate submissions included all APSCN cycle data except for personnel<br />
Note: - - denotes not applicable<br />
96.19 100.00 — — N/A<br />
14.53<br />
State<br />
Rate<br />
49.42<br />
State<br />
Rate<br />
54.07<br />
13.00<br />
State<br />
Target<br />
49.00<br />
State<br />
Target<br />
60.00<br />
Y<br />
N/A<br />
Y<br />
— —<br />
LEA<br />
Rate<br />
— —<br />
LEA<br />
Rate<br />
— —<br />
N/A<br />
Target Met<br />
by LEA<br />
(Y/N)<br />
N/A<br />
Target Met<br />
by LEA<br />
(Y/N)<br />
N/A<br />
Page 5 of 5
<strong>ARKANSAS</strong> <strong>SPECIAL</strong> <strong>EDUCATION</strong><br />
<strong>DISTRICT</strong> <strong>ANNUAL</strong> PERFORMANCE REPORT<br />
2010/11 School Year<br />
Publication Date: March 2012<br />
Each State must have in place a State Performance Plan (SPP) to evaluate the State's efforts to meet the requirements and<br />
purposes of the implementation of the Individuals with Disabilities Education Act (IDEA). The SPP is a six-year plan, which<br />
describes Arkansas's performance on 20 indicators. The Office of Special Education Programs in the U. S. Department of<br />
Education requires that States report annually to the public on the performance of each local education agency (LEA) on 14 of<br />
20 indicators as compared with targets established by the State in the SPP. Arkansas will report indicators 1 through 14 and<br />
20 for each LEA serving children with disabilities (CWD). Any LEA not meeting targets on compliance indicators (0% for<br />
Indicators 4B, 09 & 10 and 100% for Indicators 11, 12, 13, and 20) are non-compliant with IDEA.<br />
There are no report changes for the 2010/11 school year profile; However, it is important to recognize that: .<br />
1. Indicator 01 (Graduation) is reported a year in arrear (2009/10 graduates) and is based on a four-year cohort. This<br />
means the rate is a measure of students who entered in ninth grade and graduate in four years. The calculation is a<br />
requirement under Title I of the Elementary and Secondary Education Act (ESEA).<br />
2. Indicator 02 (Drop out) is reported a year in arrear. This means the rate is a measure of students who dropped out in<br />
the 2009/10 school year. The Indicator 02 data are aligned with the Common Core of Data (CCD) requirements for<br />
grades 7-12.<br />
3. Indicator 04A and 4B (Suspension/Expulsion) is reported a year in arrear. This means the rate is a measure of<br />
students who had out-of-school suspensions and/or expulsions totaling more than 10 days.<br />
For a complete description of all the Indicators, please visit the special education website at<br />
http://arksped.k12.ar.us/sections/policy.html<br />
LEA: 5106 - DEER/MT. JUDEA SCHOOL <strong>DISTRICT</strong><br />
Indicator 01: Graduation Rates (2009/10 school year) Indicator 02: Dropout Rates (2009/10 school year)<br />
Percent of youth<br />
with IEPs<br />
graduating from<br />
high school with a<br />
regular diploma<br />
State<br />
Rate<br />
State<br />
Target<br />
75.76% 85.00%<br />
LEA<br />
Rate<br />
100.00%<br />
Target Met<br />
by LEA<br />
(Y/N)<br />
Y<br />
Percent of<br />
youth with<br />
IEPs dropping<br />
out of high<br />
school<br />
State<br />
Rate<br />
Indicator 03: Assessment on Statewide Benchmark Exam (grades 3-8, 11)<br />
A) Adequate Yearly Progress<br />
n=40<br />
Literacy<br />
Mathematics<br />
Met Disability Subgroup "n"<br />
for Reporting Purposes (Y/N)<br />
State Target for % of Districts Meeting<br />
AYP for Disability Subgroup<br />
State<br />
Target<br />
3.06% 4.20%<br />
LEA<br />
Rate<br />
0.00%<br />
% of Districts Meeting AYP<br />
for Disability Subgroup<br />
Target Met by<br />
LEA (Y/N)<br />
Y<br />
Target Met by<br />
LEA(Y/N)<br />
Overall N 17.15% 6.25%<br />
NA<br />
N<br />
N<br />
Note: For a district to qualify as having a disability subgroup it must have a minimum of 40 (n=40) students with disabilities in a school building.<br />
B) Participation<br />
Participation Rate: # of<br />
CWD Tested ÷ # of CWD<br />
Enrolled in grades tested.<br />
Participation Rate: Literacy<br />
Participation Rate: Math<br />
Note: - - denotes not applicable<br />
State<br />
Rate<br />
98.78%<br />
State<br />
Target<br />
95.00%<br />
LEA<br />
Rate<br />
100.00%<br />
Target Met<br />
by LEA (Y/N)<br />
98.61% 95.00% 100.00% Y<br />
Y<br />
C) Performance Proficiency<br />
Percent of CWD Scoring<br />
Proficient or Above<br />
Proficiency Rate: Literacy<br />
Proficiency Rate:<br />
Mathematics<br />
16.00%<br />
16.00%<br />
State<br />
Rate<br />
31.49%<br />
44.86%<br />
State<br />
Target<br />
45.22%<br />
51.14%<br />
LEA<br />
Rate<br />
22.22%<br />
38.71%<br />
NA<br />
NA<br />
Target<br />
Met by<br />
LEA (Y/N)<br />
N<br />
N<br />
Page 1 of 5
LEA: 5106 - DEER/MT. JUDEA SCHOOL <strong>DISTRICT</strong><br />
Indicator 04: Out-of-School Suspensions and Expulsions (2009/10 school year)<br />
A) Suspension/Expulsion<br />
Percent difference of CWD with out-of- school suspensions and<br />
expulsions totaling greater than 10 days in a school year as<br />
compared to the same data for general education students in<br />
the district.<br />
B) Suspension/Expulsion by Race and Ethnicity<br />
Percent of districts that have: (a) a significant discrepancy, by race or<br />
ethnicity, in the rate of suspensions and expulsions of greater than 10<br />
days in a school year for children with IEPs; and (b) policies,<br />
procedures or practices that contribute to the significant discrepancy<br />
and do not comply with requirements relating to the development<br />
and implementation of IEPs, the use of positive behavioral<br />
interventions and supports, and procedural safeguards.<br />
Indicator 05: School Age (5-21) Least Restrictive Environment<br />
A) In the Regular Class 80% or more of the day<br />
Percent of CWD with<br />
IEPs receiving instruction<br />
in the regular class 80%<br />
or more of the day.<br />
State<br />
Rate<br />
State<br />
Target<br />
LEA<br />
Rate<br />
B) In the Regular Class less than 40% of the day<br />
Percent of CWD with<br />
IEPs receiving instruction<br />
in the regular class less<br />
than 60% of the day.<br />
53.87% 59.77%<br />
State<br />
Rate<br />
State<br />
Target<br />
12.42% 12.51%<br />
78.57%<br />
LEA<br />
Rate<br />
1.43%<br />
C) Other Settings outside the regular class<br />
Percent of CWD with IEPs served in<br />
public or private separate schools,<br />
residential placements, or<br />
homebound/hospital placements.<br />
State<br />
Rate<br />
State<br />
Target<br />
2.80% 2.56%<br />
Target Met<br />
by LEA (Y/N)<br />
Y<br />
Target Met<br />
by LEA (Y/N)<br />
Y<br />
LEA<br />
Rate<br />
1.43%<br />
Target Met<br />
by LEA(Y/N)<br />
Indicator 06: Early Childhood (3-5) Least Restrictive Environment<br />
A) Regular Early Childhood Program<br />
Percent of children (aged 3 through 5) with IEPs attending a regular<br />
early childhood program and receiving the majority of special<br />
education and related services in the regular early childhood program<br />
Allowable<br />
Difference<br />
LEA: 5106 - DEER/MT. JUDEA SCHOOL <strong>DISTRICT</strong><br />
Indicator 07: Preschool (3-5) Outcomes<br />
a) Percent of preschool CWD<br />
children who did not<br />
improve functioning.<br />
b) Percent of preschool CWD<br />
who improved but whose<br />
functioning remained below<br />
same age peers.<br />
c) Percent of preschool CWD<br />
who improved at a level<br />
nearer to same aged peers.<br />
d) Percent of preschool CWD<br />
who improved functioning to<br />
reach a level comparable to<br />
same age peers.<br />
e) Percent of preschool CWD<br />
children who maintain<br />
functioning at a level<br />
comparable to same aged<br />
peers.<br />
Summary<br />
Statements<br />
1) Of those preschool<br />
children who entered<br />
the preschool program<br />
below age expectations<br />
in each Outcome, the<br />
percent who<br />
substantially increased<br />
their rate of growth by<br />
the time they turned 6<br />
years of age or exited<br />
the program.<br />
2) The percent of<br />
preschool children who<br />
were functioning<br />
within age expectations<br />
in each Outcome by the<br />
time they turned 6<br />
years of age or exited<br />
A) Positive Social -Emotional<br />
Skills*<br />
State<br />
Rate<br />
A) Positive Social -<br />
Emotional Skills<br />
(Including social<br />
relationships)<br />
State<br />
Rate<br />
2.14%<br />
5.31%<br />
25.97%<br />
38.22%<br />
28.36%<br />
State<br />
Target<br />
LEA<br />
Rate<br />
LEA<br />
Rate<br />
— —<br />
— —<br />
— —<br />
— —<br />
— —<br />
Target<br />
Met by<br />
LEA(Y/N)<br />
B) Acquisition and Use of<br />
Knowledge and Skills<br />
(Including early language/<br />
communication and early literacy)<br />
B) Acquisition and Use of<br />
Knowledge and Skills **<br />
State<br />
Rate<br />
1.75%<br />
6.59%<br />
34.23%<br />
43.51%<br />
13.92%<br />
State<br />
Target<br />
LEA<br />
Rate<br />
Target<br />
Met by<br />
LEA(Y/N)<br />
C) Use of Appropriate Behaviors<br />
to Meet Their Needs<br />
State<br />
Rate<br />
State<br />
Target<br />
LEA<br />
Rate<br />
Target<br />
Met by<br />
LEA(Y/N)<br />
89.61% 90.50% — — N/A 90.31% 90.50% — — N/A 90.82% 92.50% — — N/A<br />
66.58% 69.50% — — N/A 57.43% 60.50% — — N/A 76.69% 78.50% — — N/A<br />
NOTE: * Including social relationships ** Including early language/ communication and early literacy<br />
Note: - - denotes not applicable<br />
State<br />
Rate<br />
LEA<br />
Rate<br />
— —<br />
— —<br />
— —<br />
— —<br />
— —<br />
C) Use of<br />
Appropriate<br />
Behaviors to<br />
Meet Their Needs<br />
State<br />
Rate<br />
4.51%<br />
17.34%<br />
41.72%<br />
34.97%<br />
LEA<br />
Rate<br />
1.46% — —<br />
— —<br />
— —<br />
— —<br />
— —<br />
Page 3 of 5
LEA: 5106 - DEER/MT. JUDEA SCHOOL <strong>DISTRICT</strong><br />
Indicator 08: Parent Involvement<br />
Percent of surveyed<br />
parents who reported<br />
school facilitated parent<br />
involvement as a means<br />
of improving services<br />
and results for children<br />
with disabilities.<br />
Early Childhood<br />
(3-5)<br />
School Age<br />
(5-21)<br />
State<br />
Rate<br />
90.47%<br />
95.05%<br />
Indicator 09: Disproportionality - Eligibility<br />
Disproportionate representation of racial<br />
and ethnic groups in special education and<br />
related services that is a result of<br />
inappropriate identification (e.g.<br />
monitoring data, review of policies,<br />
practices, and procedures under 618(d),<br />
etc.).<br />
State<br />
Rate<br />
State<br />
Target<br />
88.00%<br />
96.00%<br />
State<br />
Target<br />
0.00% 0.00%<br />
LEA<br />
Rate<br />
— —<br />
98.15%<br />
Indicator 10: Disproportionality-Child with a Disability<br />
Disproportionate representation of racial<br />
and ethnic groups in specific disability<br />
categories that is a result of inappropriate<br />
identification (e.g. monitoring data, review<br />
of policies, practices, and procedures under<br />
618(d), etc.).<br />
Indicator 11: Child Find<br />
Percent of children with<br />
parental consent to evaluate<br />
who are evaluated within<br />
the State established timeline<br />
of 60 days.<br />
Overall<br />
(3-21)<br />
Early Childhood<br />
(3-5)<br />
School Age<br />
(5-21)<br />
State<br />
Rate<br />
0.00%<br />
Indicator 12: Early Childhood Transition<br />
Percent of children referred by Part C prior to<br />
age 3, who are found eligible for Part B, and<br />
who have an IEP developed and implemented<br />
by their third birthday.<br />
Note: - - denotes not applicable<br />
State<br />
Rate<br />
99.41%<br />
99.70%<br />
98.97%<br />
State<br />
Rate<br />
State<br />
Target<br />
0.00%<br />
State<br />
Target<br />
100.00%<br />
100.00%<br />
100.00%<br />
State<br />
Target<br />
Target Met by<br />
LEA (Y/N)<br />
Y<br />
Target Met by<br />
LEA (Y/N)<br />
Y<br />
LEA<br />
Rate<br />
100.00%<br />
— —<br />
100.00%<br />
LEA<br />
Rate<br />
Target Met by<br />
LEA (Y/N)<br />
N/A<br />
Y<br />
Note: The target for Indicator 09 is to have zero percent<br />
(0%) of districts identified as having disproportionate<br />
representation as a result of inappropriate<br />
identification in eligibility.<br />
Note: The target for Indicator 10 is to have zero<br />
percent (0%) of districts identified as having<br />
disproportionate representation as a result of<br />
inappropriate identification in a disability<br />
category.<br />
Target Met by<br />
LEA (Y/N)<br />
N/A<br />
Y<br />
Target Met<br />
by LEA<br />
(Y/N)<br />
99.21% 100.00% - - N/A<br />
Y<br />
Note: * Indicates a zero reponse rate for the<br />
district.<br />
Page 4 of 5
LEA: 5106 - DEER/MT. JUDEA SCHOOL <strong>DISTRICT</strong><br />
Indicator 13: Secondary Transition<br />
Percent of youth with disabilities aged 16 and<br />
up with an IEP that includes coordinated,<br />
measurable, annual IEP goals and transition<br />
services that will reasonably enable the student<br />
to meet the post-secondary goals.<br />
Indicator 14: Post-School Outcomes<br />
A. Percent of youth enrolled in higher<br />
education within one year of leaving high<br />
school.<br />
State<br />
Rate<br />
State<br />
Target<br />
Note: Data for this Indicator is from the on-site monitoring of LEAs for the given year.<br />
B. Percent of youth enrolled in higher<br />
education or competitively employed<br />
within one year of leaving high school.<br />
C. Percent of youth enrolled in higher<br />
education or in some other postsecondary<br />
education or training program; or<br />
competitively employed or in some other<br />
employment within one year of leaving<br />
high school.<br />
State<br />
Rate<br />
Indicator 20: Reported Data-Timely and Accurate*<br />
District submitted<br />
required data elements<br />
on or before due dates;<br />
made revisions within<br />
the alloted reveiw<br />
periods.<br />
Accurate and Timely<br />
Data Submission<br />
Overall (3-21)<br />
Early Childhood (3-5)<br />
School Age (5-21)<br />
State<br />
Target<br />
100.00%<br />
100.00%<br />
100.00%<br />
State<br />
Target<br />
LEA<br />
Rate<br />
LEA<br />
Rate<br />
Target Met by<br />
LEA (Y/N)<br />
Target Met<br />
by LEA<br />
(Y/N)<br />
Target Met<br />
by LEA<br />
(Y/N)<br />
*Data reviewed for timely and accurate submissions included all APSCN cycle data except for personnel<br />
Note: - - denotes not applicable<br />
96.19 100.00 — — N/A<br />
14.53<br />
State<br />
Rate<br />
49.42<br />
State<br />
Rate<br />
54.07<br />
13.00<br />
State<br />
Target<br />
49.00<br />
State<br />
Target<br />
60.00<br />
Y<br />
N/A<br />
Y<br />
0.00%<br />
LEA<br />
Rate<br />
100.00%<br />
LEA<br />
Rate<br />
100.00%<br />
N<br />
Target Met<br />
by LEA<br />
(Y/N)<br />
Y<br />
Target Met<br />
by LEA<br />
(Y/N)<br />
Y<br />
Page 5 of 5
LEA: 5201 - BEARDEN SCHOOL <strong>DISTRICT</strong><br />
<strong>ARKANSAS</strong> <strong>SPECIAL</strong> <strong>EDUCATION</strong><br />
<strong>DISTRICT</strong> <strong>ANNUAL</strong> PERFORMANCE REPORT<br />
2010/11 School Year<br />
Publication Date: March 2012<br />
Each State must have in place a State Performance Plan (SPP) to evaluate the State's efforts to meet the requirements and<br />
purposes of the implementation of the Individuals with Disabilities Education Act (IDEA). The SPP is a six-year plan, which<br />
describes Arkansas's performance on 20 indicators. The Office of Special Education Programs in the U. S. Department of<br />
Education requires that States report annually to the public on the performance of each local education agency (LEA) on 14 of<br />
20 indicators as compared with targets established by the State in the SPP. Arkansas will report indicators 1 through 14 and<br />
20 for each LEA serving children with disabilities (CWD). Any LEA not meeting targets on compliance indicators (0% for<br />
Indicators 4B, 09 & 10 and 100% for Indicators 11, 12, 13, and 20) are non-compliant with IDEA.<br />
There are no report changes for the 2010/11 school year profile; However, it is important to recognize that: .<br />
1. Indicator 01 (Graduation) is reported a year in arrear (2009/10 graduates) and is based on a four-year cohort. This<br />
means the rate is a measure of students who entered in ninth grade and graduate in four years. The calculation is a<br />
requirement under Title I of the Elementary and Secondary Education Act (ESEA).<br />
2. Indicator 02 (Drop out) is reported a year in arrear. This means the rate is a measure of students who dropped out in<br />
the 2009/10 school year. The Indicator 02 data are aligned with the Common Core of Data (CCD) requirements for<br />
grades 7-12.<br />
3. Indicator 04A and 4B (Suspension/Expulsion) is reported a year in arrear. This means the rate is a measure of<br />
students who had out-of-school suspensions and/or expulsions totaling more than 10 days.<br />
Percent of youth<br />
with IEPs<br />
graduating from<br />
high school with a<br />
regular diploma<br />
For a complete description of all the Indicators, please visit the special education website at<br />
http://arksped.k12.ar.us/sections/policy.html<br />
Indicator 01: Graduation Rates (2009/10 school year) Indicator 02: Dropout Rates (2009/10 school year)<br />
State<br />
Rate<br />
State<br />
Target<br />
75.76% 85.00%<br />
LEA<br />
Rate<br />
80.00%<br />
Target Met<br />
by LEA<br />
(Y/N)<br />
N<br />
Percent of<br />
youth with<br />
IEPs dropping<br />
out of high<br />
school<br />
State<br />
Rate<br />
Indicator 03: Assessment on Statewide Benchmark Exam (grades 3-8, 11)<br />
A) Adequate Yearly Progress<br />
n=40<br />
Literacy<br />
Mathematics<br />
Met Disability Subgroup "n"<br />
for Reporting Purposes (Y/N)<br />
State Target for % of Districts Meeting<br />
AYP for Disability Subgroup<br />
State<br />
Target<br />
3.06% 4.20%<br />
LEA<br />
Rate<br />
6.67%<br />
% of Districts Meeting AYP<br />
for Disability Subgroup<br />
Target Met by<br />
LEA (Y/N)<br />
N<br />
Target Met by<br />
LEA(Y/N)<br />
Overall N 17.15% 6.25%<br />
NA<br />
N<br />
N<br />
Note: For a district to qualify as having a disability subgroup it must have a minimum of 40 (n=40) students with disabilities in a school building.<br />
B) Participation<br />
Participation Rate: # of<br />
CWD Tested ÷ # of CWD<br />
Enrolled in grades tested.<br />
Participation Rate: Literacy<br />
Participation Rate: Math<br />
Note: - - denotes not applicable<br />
State<br />
Rate<br />
98.78%<br />
State<br />
Target<br />
95.00%<br />
LEA<br />
Rate<br />
100.00%<br />
Target Met<br />
by LEA (Y/N)<br />
98.61% 95.00% 100.00% Y<br />
Y<br />
C) Performance Proficiency<br />
Percent of CWD Scoring<br />
Proficient or Above<br />
Proficiency Rate: Literacy<br />
Proficiency Rate:<br />
Mathematics<br />
16.00%<br />
16.00%<br />
State<br />
Rate<br />
31.49%<br />
44.86%<br />
State<br />
Target<br />
45.22%<br />
51.14%<br />
LEA<br />
Rate<br />
11.54%<br />
25.93%<br />
NA<br />
NA<br />
Target<br />
Met by<br />
LEA (Y/N)<br />
N<br />
N<br />
Page 1 of 5
LEA: 5201 - BEARDEN SCHOOL <strong>DISTRICT</strong><br />
Indicator 04: Out-of-School Suspensions and Expulsions (2009/10 school year)<br />
A) Suspension/Expulsion<br />
Percent difference of CWD with out-of- school suspensions and<br />
expulsions totaling greater than 10 days in a school year as<br />
compared to the same data for general education students in<br />
the district.<br />
B) Suspension/Expulsion by Race and Ethnicity<br />
Percent of districts that have: (a) a significant discrepancy, by race or<br />
ethnicity, in the rate of suspensions and expulsions of greater than 10<br />
days in a school year for children with IEPs; and (b) policies,<br />
procedures or practices that contribute to the significant discrepancy<br />
and do not comply with requirements relating to the development<br />
and implementation of IEPs, the use of positive behavioral<br />
interventions and supports, and procedural safeguards.<br />
Indicator 05: School Age (5-21) Least Restrictive Environment<br />
A) In the Regular Class 80% or more of the day<br />
Percent of CWD with<br />
IEPs receiving instruction<br />
in the regular class 80%<br />
or more of the day.<br />
State<br />
Rate<br />
State<br />
Target<br />
LEA<br />
Rate<br />
B) In the Regular Class less than 40% of the day<br />
Percent of CWD with<br />
IEPs receiving instruction<br />
in the regular class less<br />
than 60% of the day.<br />
53.87% 59.77%<br />
State<br />
Rate<br />
State<br />
Target<br />
12.42% 12.51%<br />
70.37%<br />
LEA<br />
Rate<br />
11.11%<br />
C) Other Settings outside the regular class<br />
Percent of CWD with IEPs served in<br />
public or private separate schools,<br />
residential placements, or<br />
homebound/hospital placements.<br />
State<br />
Rate<br />
State<br />
Target<br />
2.80% 2.56%<br />
Target Met<br />
by LEA (Y/N)<br />
Y<br />
Target Met<br />
by LEA (Y/N)<br />
Y<br />
LEA<br />
Rate<br />
0.00%<br />
Target Met<br />
by LEA(Y/N)<br />
Indicator 06: Early Childhood (3-5) Least Restrictive Environment<br />
A) Regular Early Childhood Program<br />
Percent of children (aged 3 through 5) with IEPs attending a regular<br />
early childhood program and receiving the majority of special<br />
education and related services in the regular early childhood program<br />
Allowable<br />
Difference<br />
LEA: 5201 - BEARDEN SCHOOL <strong>DISTRICT</strong><br />
Indicator 07: Preschool (3-5) Outcomes<br />
a) Percent of preschool CWD<br />
children who did not<br />
improve functioning.<br />
b) Percent of preschool CWD<br />
who improved but whose<br />
functioning remained below<br />
same age peers.<br />
c) Percent of preschool CWD<br />
who improved at a level<br />
nearer to same aged peers.<br />
d) Percent of preschool CWD<br />
who improved functioning to<br />
reach a level comparable to<br />
same age peers.<br />
e) Percent of preschool CWD<br />
children who maintain<br />
functioning at a level<br />
comparable to same aged<br />
peers.<br />
Summary<br />
Statements<br />
1) Of those preschool<br />
children who entered<br />
the preschool program<br />
below age expectations<br />
in each Outcome, the<br />
percent who<br />
substantially increased<br />
their rate of growth by<br />
the time they turned 6<br />
years of age or exited<br />
the program.<br />
2) The percent of<br />
preschool children who<br />
were functioning<br />
within age expectations<br />
in each Outcome by the<br />
time they turned 6<br />
years of age or exited<br />
A) Positive Social -Emotional<br />
Skills*<br />
State<br />
Rate<br />
A) Positive Social -<br />
Emotional Skills<br />
(Including social<br />
relationships)<br />
State<br />
Rate<br />
2.14%<br />
5.31%<br />
25.97%<br />
38.22%<br />
28.36%<br />
State<br />
Target<br />
LEA<br />
Rate<br />
LEA<br />
Rate<br />
— —<br />
— —<br />
— —<br />
— —<br />
— —<br />
Target<br />
Met by<br />
LEA(Y/N)<br />
B) Acquisition and Use of<br />
Knowledge and Skills<br />
(Including early language/<br />
communication and early literacy)<br />
B) Acquisition and Use of<br />
Knowledge and Skills **<br />
State<br />
Rate<br />
1.75%<br />
6.59%<br />
34.23%<br />
43.51%<br />
13.92%<br />
State<br />
Target<br />
LEA<br />
Rate<br />
Target<br />
Met by<br />
LEA(Y/N)<br />
C) Use of Appropriate Behaviors<br />
to Meet Their Needs<br />
State<br />
Rate<br />
State<br />
Target<br />
LEA<br />
Rate<br />
Target<br />
Met by<br />
LEA(Y/N)<br />
89.61% 90.50% — — N/A 90.31% 90.50% — — N/A 90.82% 92.50% — — N/A<br />
66.58% 69.50% — — N/A 57.43% 60.50% — — N/A 76.69% 78.50% — — N/A<br />
NOTE: * Including social relationships ** Including early language/ communication and early literacy<br />
Note: - - denotes not applicable<br />
State<br />
Rate<br />
LEA<br />
Rate<br />
— —<br />
— —<br />
— —<br />
— —<br />
— —<br />
C) Use of<br />
Appropriate<br />
Behaviors to<br />
Meet Their Needs<br />
State<br />
Rate<br />
4.51%<br />
17.34%<br />
41.72%<br />
34.97%<br />
LEA<br />
Rate<br />
1.46% — —<br />
— —<br />
— —<br />
— —<br />
— —<br />
Page 3 of 5
LEA: 5201 - BEARDEN SCHOOL <strong>DISTRICT</strong><br />
Indicator 08: Parent Involvement<br />
Percent of surveyed<br />
parents who reported<br />
school facilitated parent<br />
involvement as a means<br />
of improving services<br />
and results for children<br />
with disabilities.<br />
Early Childhood<br />
(3-5)<br />
School Age<br />
(5-21)<br />
State<br />
Rate<br />
90.47%<br />
95.05%<br />
Indicator 09: Disproportionality - Eligibility<br />
Disproportionate representation of racial<br />
and ethnic groups in special education and<br />
related services that is a result of<br />
inappropriate identification (e.g.<br />
monitoring data, review of policies,<br />
practices, and procedures under 618(d),<br />
etc.).<br />
State<br />
Rate<br />
State<br />
Target<br />
88.00%<br />
96.00%<br />
State<br />
Target<br />
0.00% 0.00%<br />
LEA<br />
Rate<br />
— —<br />
93.75%<br />
Indicator 10: Disproportionality-Child with a Disability<br />
Disproportionate representation of racial<br />
and ethnic groups in specific disability<br />
categories that is a result of inappropriate<br />
identification (e.g. monitoring data, review<br />
of policies, practices, and procedures under<br />
618(d), etc.).<br />
Indicator 11: Child Find<br />
Percent of children with<br />
parental consent to evaluate<br />
who are evaluated within<br />
the State established timeline<br />
of 60 days.<br />
Overall<br />
(3-21)<br />
Early Childhood<br />
(3-5)<br />
School Age<br />
(5-21)<br />
State<br />
Rate<br />
0.00%<br />
Indicator 12: Early Childhood Transition<br />
Percent of children referred by Part C prior to<br />
age 3, who are found eligible for Part B, and<br />
who have an IEP developed and implemented<br />
by their third birthday.<br />
Note: - - denotes not applicable<br />
State<br />
Rate<br />
99.41%<br />
99.70%<br />
98.97%<br />
State<br />
Rate<br />
State<br />
Target<br />
0.00%<br />
State<br />
Target<br />
100.00%<br />
100.00%<br />
100.00%<br />
State<br />
Target<br />
Target Met by<br />
LEA (Y/N)<br />
Y<br />
Target Met by<br />
LEA (Y/N)<br />
Y<br />
LEA<br />
Rate<br />
100.00%<br />
— —<br />
100.00%<br />
LEA<br />
Rate<br />
Target Met by<br />
LEA (Y/N)<br />
N/A<br />
N<br />
Note: The target for Indicator 09 is to have zero percent<br />
(0%) of districts identified as having disproportionate<br />
representation as a result of inappropriate<br />
identification in eligibility.<br />
Note: The target for Indicator 10 is to have zero<br />
percent (0%) of districts identified as having<br />
disproportionate representation as a result of<br />
inappropriate identification in a disability<br />
category.<br />
Target Met by<br />
LEA (Y/N)<br />
N/A<br />
Y<br />
Target Met<br />
by LEA<br />
(Y/N)<br />
99.21% 100.00% - - N/A<br />
Y<br />
Note: * Indicates a zero reponse rate for the<br />
district.<br />
Page 4 of 5
LEA: 5201 - BEARDEN SCHOOL <strong>DISTRICT</strong><br />
Indicator 13: Secondary Transition<br />
Percent of youth with disabilities aged 16 and<br />
up with an IEP that includes coordinated,<br />
measurable, annual IEP goals and transition<br />
services that will reasonably enable the student<br />
to meet the post-secondary goals.<br />
Indicator 14: Post-School Outcomes<br />
A. Percent of youth enrolled in higher<br />
education within one year of leaving high<br />
school.<br />
State<br />
Rate<br />
State<br />
Target<br />
Note: Data for this Indicator is from the on-site monitoring of LEAs for the given year.<br />
B. Percent of youth enrolled in higher<br />
education or competitively employed<br />
within one year of leaving high school.<br />
C. Percent of youth enrolled in higher<br />
education or in some other postsecondary<br />
education or training program; or<br />
competitively employed or in some other<br />
employment within one year of leaving<br />
high school.<br />
State<br />
Rate<br />
Indicator 20: Reported Data-Timely and Accurate*<br />
District submitted<br />
required data elements<br />
on or before due dates;<br />
made revisions within<br />
the alloted reveiw<br />
periods.<br />
Accurate and Timely<br />
Data Submission<br />
Overall (3-21)<br />
Early Childhood (3-5)<br />
School Age (5-21)<br />
State<br />
Target<br />
100.00%<br />
100.00%<br />
100.00%<br />
State<br />
Target<br />
LEA<br />
Rate<br />
LEA<br />
Rate<br />
Target Met by<br />
LEA (Y/N)<br />
Target Met<br />
by LEA<br />
(Y/N)<br />
Target Met<br />
by LEA<br />
(Y/N)<br />
*Data reviewed for timely and accurate submissions included all APSCN cycle data except for personnel<br />
Note: - - denotes not applicable<br />
96.19 100.00 100.00% Y<br />
14.53<br />
State<br />
Rate<br />
49.42<br />
State<br />
Rate<br />
54.07<br />
13.00<br />
State<br />
Target<br />
49.00<br />
State<br />
Target<br />
60.00<br />
Y<br />
N/A<br />
Y<br />
— —<br />
LEA<br />
Rate<br />
— —<br />
LEA<br />
Rate<br />
— —<br />
N/A<br />
Target Met<br />
by LEA<br />
(Y/N)<br />
N/A<br />
Target Met<br />
by LEA<br />
(Y/N)<br />
N/A<br />
Page 5 of 5
<strong>ARKANSAS</strong> <strong>SPECIAL</strong> <strong>EDUCATION</strong><br />
<strong>DISTRICT</strong> <strong>ANNUAL</strong> PERFORMANCE REPORT<br />
2010/11 School Year<br />
Publication Date: March 2012<br />
Each State must have in place a State Performance Plan (SPP) to evaluate the State's efforts to meet the requirements and<br />
purposes of the implementation of the Individuals with Disabilities Education Act (IDEA). The SPP is a six-year plan, which<br />
describes Arkansas's performance on 20 indicators. The Office of Special Education Programs in the U. S. Department of<br />
Education requires that States report annually to the public on the performance of each local education agency (LEA) on 14 of<br />
20 indicators as compared with targets established by the State in the SPP. Arkansas will report indicators 1 through 14 and<br />
20 for each LEA serving children with disabilities (CWD). Any LEA not meeting targets on compliance indicators (0% for<br />
Indicators 4B, 09 & 10 and 100% for Indicators 11, 12, 13, and 20) are non-compliant with IDEA.<br />
There are no report changes for the 2010/11 school year profile; However, it is important to recognize that: .<br />
1. Indicator 01 (Graduation) is reported a year in arrear (2009/10 graduates) and is based on a four-year cohort. This<br />
means the rate is a measure of students who entered in ninth grade and graduate in four years. The calculation is a<br />
requirement under Title I of the Elementary and Secondary Education Act (ESEA).<br />
2. Indicator 02 (Drop out) is reported a year in arrear. This means the rate is a measure of students who dropped out in<br />
the 2009/10 school year. The Indicator 02 data are aligned with the Common Core of Data (CCD) requirements for<br />
grades 7-12.<br />
3. Indicator 04A and 4B (Suspension/Expulsion) is reported a year in arrear. This means the rate is a measure of<br />
students who had out-of-school suspensions and/or expulsions totaling more than 10 days.<br />
For a complete description of all the Indicators, please visit the special education website at<br />
http://arksped.k12.ar.us/sections/policy.html<br />
LEA: 5204 - CAMDEN FAIRVIEW SCHOOL <strong>DISTRICT</strong><br />
Indicator 01: Graduation Rates (2009/10 school year) Indicator 02: Dropout Rates (2009/10 school year)<br />
Percent of youth<br />
with IEPs<br />
graduating from<br />
high school with a<br />
regular diploma<br />
State<br />
Rate<br />
State<br />
Target<br />
75.76% 85.00%<br />
LEA<br />
Rate<br />
84.62%<br />
Target Met<br />
by LEA<br />
(Y/N)<br />
N<br />
Percent of<br />
youth with<br />
IEPs dropping<br />
out of high<br />
school<br />
State<br />
Rate<br />
Indicator 03: Assessment on Statewide Benchmark Exam (grades 3-8, 11)<br />
A) Adequate Yearly Progress<br />
n=40<br />
Literacy<br />
Mathematics<br />
Met Disability Subgroup "n"<br />
for Reporting Purposes (Y/N)<br />
State Target for % of Districts Meeting<br />
AYP for Disability Subgroup<br />
State<br />
Target<br />
3.06% 4.20%<br />
LEA<br />
Rate<br />
2.88%<br />
% of Districts Meeting AYP<br />
for Disability Subgroup<br />
Target Met by<br />
LEA (Y/N)<br />
Y<br />
Target Met by<br />
LEA(Y/N)<br />
Overall N 17.15% 6.25%<br />
NA<br />
N<br />
N<br />
Note: For a district to qualify as having a disability subgroup it must have a minimum of 40 (n=40) students with disabilities in a school building.<br />
B) Participation<br />
Participation Rate: # of<br />
CWD Tested ÷ # of CWD<br />
Enrolled in grades tested.<br />
Participation Rate: Literacy<br />
Participation Rate: Math<br />
Note: - - denotes not applicable<br />
State<br />
Rate<br />
98.78%<br />
State<br />
Target<br />
95.00%<br />
LEA<br />
Rate<br />
97.50%<br />
Target Met<br />
by LEA (Y/N)<br />
98.61% 95.00% 98.28% Y<br />
Y<br />
C) Performance Proficiency<br />
Percent of CWD Scoring<br />
Proficient or Above<br />
Proficiency Rate: Literacy<br />
Proficiency Rate:<br />
Mathematics<br />
16.00%<br />
16.00%<br />
State<br />
Rate<br />
31.49%<br />
44.86%<br />
State<br />
Target<br />
45.22%<br />
51.14%<br />
LEA<br />
Rate<br />
32.08%<br />
46.08%<br />
NA<br />
NA<br />
Target<br />
Met by<br />
LEA (Y/N)<br />
N<br />
N<br />
Page 1 of 5
LEA: 5204 - CAMDEN FAIRVIEW SCHOOL <strong>DISTRICT</strong><br />
Indicator 04: Out-of-School Suspensions and Expulsions (2009/10 school year)<br />
A) Suspension/Expulsion<br />
Percent difference of CWD with out-of- school suspensions and<br />
expulsions totaling greater than 10 days in a school year as<br />
compared to the same data for general education students in<br />
the district.<br />
B) Suspension/Expulsion by Race and Ethnicity<br />
Percent of districts that have: (a) a significant discrepancy, by race or<br />
ethnicity, in the rate of suspensions and expulsions of greater than 10<br />
days in a school year for children with IEPs; and (b) policies,<br />
procedures or practices that contribute to the significant discrepancy<br />
and do not comply with requirements relating to the development<br />
and implementation of IEPs, the use of positive behavioral<br />
interventions and supports, and procedural safeguards.<br />
Indicator 05: School Age (5-21) Least Restrictive Environment<br />
A) In the Regular Class 80% or more of the day<br />
Percent of CWD with<br />
IEPs receiving instruction<br />
in the regular class 80%<br />
or more of the day.<br />
State<br />
Rate<br />
State<br />
Target<br />
LEA<br />
Rate<br />
B) In the Regular Class less than 40% of the day<br />
Percent of CWD with<br />
IEPs receiving instruction<br />
in the regular class less<br />
than 60% of the day.<br />
53.87% 59.77%<br />
State<br />
Rate<br />
State<br />
Target<br />
12.42% 12.51%<br />
42.69%<br />
LEA<br />
Rate<br />
16.21%<br />
C) Other Settings outside the regular class<br />
Percent of CWD with IEPs served in<br />
public or private separate schools,<br />
residential placements, or<br />
homebound/hospital placements.<br />
State<br />
Rate<br />
State<br />
Target<br />
2.80% 2.56%<br />
Target Met<br />
by LEA (Y/N)<br />
N<br />
Target Met<br />
by LEA (Y/N)<br />
N<br />
LEA<br />
Rate<br />
0.00%<br />
Target Met<br />
by LEA(Y/N)<br />
Indicator 06: Early Childhood (3-5) Least Restrictive Environment<br />
A) Regular Early Childhood Program<br />
Percent of children (aged 3 through 5) with IEPs attending a regular<br />
early childhood program and receiving the majority of special<br />
education and related services in the regular early childhood program<br />
Allowable<br />
Difference<br />
LEA: 5204 - CAMDEN FAIRVIEW SCHOOL <strong>DISTRICT</strong><br />
Indicator 07: Preschool (3-5) Outcomes<br />
a) Percent of preschool CWD<br />
children who did not<br />
improve functioning.<br />
b) Percent of preschool CWD<br />
who improved but whose<br />
functioning remained below<br />
same age peers.<br />
c) Percent of preschool CWD<br />
who improved at a level<br />
nearer to same aged peers.<br />
d) Percent of preschool CWD<br />
who improved functioning to<br />
reach a level comparable to<br />
same age peers.<br />
e) Percent of preschool CWD<br />
children who maintain<br />
functioning at a level<br />
comparable to same aged<br />
peers.<br />
Summary<br />
Statements<br />
1) Of those preschool<br />
children who entered<br />
the preschool program<br />
below age expectations<br />
in each Outcome, the<br />
percent who<br />
substantially increased<br />
their rate of growth by<br />
the time they turned 6<br />
years of age or exited<br />
the program.<br />
2) The percent of<br />
preschool children who<br />
were functioning<br />
within age expectations<br />
in each Outcome by the<br />
time they turned 6<br />
years of age or exited<br />
A) Positive Social -Emotional<br />
Skills*<br />
State<br />
Rate<br />
A) Positive Social -<br />
Emotional Skills<br />
(Including social<br />
relationships)<br />
State<br />
Rate<br />
2.14%<br />
5.31%<br />
25.97%<br />
38.22%<br />
28.36%<br />
State<br />
Target<br />
LEA<br />
Rate<br />
LEA<br />
Rate<br />
— —<br />
— —<br />
— —<br />
— —<br />
— —<br />
Target<br />
Met by<br />
LEA(Y/N)<br />
B) Acquisition and Use of<br />
Knowledge and Skills<br />
(Including early language/<br />
communication and early literacy)<br />
B) Acquisition and Use of<br />
Knowledge and Skills **<br />
State<br />
Rate<br />
1.75%<br />
6.59%<br />
34.23%<br />
43.51%<br />
13.92%<br />
State<br />
Target<br />
LEA<br />
Rate<br />
Target<br />
Met by<br />
LEA(Y/N)<br />
C) Use of Appropriate Behaviors<br />
to Meet Their Needs<br />
State<br />
Rate<br />
State<br />
Target<br />
LEA<br />
Rate<br />
Target<br />
Met by<br />
LEA(Y/N)<br />
89.61% 90.50% — — N/A 90.31% 90.50% — — N/A 90.82% 92.50% — — N/A<br />
66.58% 69.50% — — N/A 57.43% 60.50% — — N/A 76.69% 78.50% — — N/A<br />
NOTE: * Including social relationships ** Including early language/ communication and early literacy<br />
Note: - - denotes not applicable<br />
State<br />
Rate<br />
LEA<br />
Rate<br />
— —<br />
— —<br />
— —<br />
— —<br />
— —<br />
C) Use of<br />
Appropriate<br />
Behaviors to<br />
Meet Their Needs<br />
State<br />
Rate<br />
4.51%<br />
17.34%<br />
41.72%<br />
34.97%<br />
LEA<br />
Rate<br />
1.46% — —<br />
— —<br />
— —<br />
— —<br />
— —<br />
Page 3 of 5
LEA: 5204 - CAMDEN FAIRVIEW SCHOOL <strong>DISTRICT</strong><br />
Indicator 08: Parent Involvement<br />
Percent of surveyed<br />
parents who reported<br />
school facilitated parent<br />
involvement as a means<br />
of improving services<br />
and results for children<br />
with disabilities.<br />
Early Childhood<br />
(3-5)<br />
School Age<br />
(5-21)<br />
State<br />
Rate<br />
90.47%<br />
95.05%<br />
Indicator 09: Disproportionality - Eligibility<br />
Disproportionate representation of racial<br />
and ethnic groups in special education and<br />
related services that is a result of<br />
inappropriate identification (e.g.<br />
monitoring data, review of policies,<br />
practices, and procedures under 618(d),<br />
etc.).<br />
State<br />
Rate<br />
State<br />
Target<br />
88.00%<br />
96.00%<br />
State<br />
Target<br />
0.00% 0.00%<br />
LEA<br />
Rate<br />
— —<br />
93.06%<br />
Indicator 10: Disproportionality-Child with a Disability<br />
Disproportionate representation of racial<br />
and ethnic groups in specific disability<br />
categories that is a result of inappropriate<br />
identification (e.g. monitoring data, review<br />
of policies, practices, and procedures under<br />
618(d), etc.).<br />
Indicator 11: Child Find<br />
Percent of children with<br />
parental consent to evaluate<br />
who are evaluated within<br />
the State established timeline<br />
of 60 days.<br />
Overall<br />
(3-21)<br />
Early Childhood<br />
(3-5)<br />
School Age<br />
(5-21)<br />
State<br />
Rate<br />
0.00%<br />
Indicator 12: Early Childhood Transition<br />
Percent of children referred by Part C prior to<br />
age 3, who are found eligible for Part B, and<br />
who have an IEP developed and implemented<br />
by their third birthday.<br />
Note: - - denotes not applicable<br />
State<br />
Rate<br />
99.41%<br />
99.70%<br />
98.97%<br />
State<br />
Rate<br />
State<br />
Target<br />
0.00%<br />
State<br />
Target<br />
100.00%<br />
100.00%<br />
100.00%<br />
State<br />
Target<br />
Target Met by<br />
LEA (Y/N)<br />
Y<br />
Target Met by<br />
LEA (Y/N)<br />
Y<br />
LEA<br />
Rate<br />
100.00%<br />
— —<br />
100.00%<br />
LEA<br />
Rate<br />
Target Met by<br />
LEA (Y/N)<br />
N/A<br />
N<br />
Note: The target for Indicator 09 is to have zero percent<br />
(0%) of districts identified as having disproportionate<br />
representation as a result of inappropriate<br />
identification in eligibility.<br />
Note: The target for Indicator 10 is to have zero<br />
percent (0%) of districts identified as having<br />
disproportionate representation as a result of<br />
inappropriate identification in a disability<br />
category.<br />
Target Met by<br />
LEA (Y/N)<br />
N/A<br />
Y<br />
Target Met<br />
by LEA<br />
(Y/N)<br />
99.21% 100.00% - - N/A<br />
Y<br />
Note: * Indicates a zero reponse rate for the<br />
district.<br />
Page 4 of 5
LEA: 5204 - CAMDEN FAIRVIEW SCHOOL <strong>DISTRICT</strong><br />
Indicator 13: Secondary Transition<br />
Percent of youth with disabilities aged 16 and<br />
up with an IEP that includes coordinated,<br />
measurable, annual IEP goals and transition<br />
services that will reasonably enable the student<br />
to meet the post-secondary goals.<br />
Indicator 14: Post-School Outcomes<br />
A. Percent of youth enrolled in higher<br />
education within one year of leaving high<br />
school.<br />
State<br />
Rate<br />
State<br />
Target<br />
Note: Data for this Indicator is from the on-site monitoring of LEAs for the given year.<br />
B. Percent of youth enrolled in higher<br />
education or competitively employed<br />
within one year of leaving high school.<br />
C. Percent of youth enrolled in higher<br />
education or in some other postsecondary<br />
education or training program; or<br />
competitively employed or in some other<br />
employment within one year of leaving<br />
high school.<br />
State<br />
Rate<br />
Indicator 20: Reported Data-Timely and Accurate*<br />
District submitted<br />
required data elements<br />
on or before due dates;<br />
made revisions within<br />
the alloted reveiw<br />
periods.<br />
Accurate and Timely<br />
Data Submission<br />
Overall (3-21)<br />
Early Childhood (3-5)<br />
School Age (5-21)<br />
State<br />
Target<br />
100.00%<br />
100.00%<br />
100.00%<br />
State<br />
Target<br />
LEA<br />
Rate<br />
LEA<br />
Rate<br />
Target Met by<br />
LEA (Y/N)<br />
Target Met<br />
by LEA<br />
(Y/N)<br />
Target Met<br />
by LEA<br />
(Y/N)<br />
*Data reviewed for timely and accurate submissions included all APSCN cycle data except for personnel<br />
Note: - - denotes not applicable<br />
96.19 100.00 — — N/A<br />
14.53<br />
State<br />
Rate<br />
49.42<br />
State<br />
Rate<br />
54.07<br />
13.00<br />
State<br />
Target<br />
49.00<br />
State<br />
Target<br />
60.00<br />
Y<br />
N/A<br />
Y<br />
— —<br />
LEA<br />
Rate<br />
— —<br />
LEA<br />
Rate<br />
— —<br />
N/A<br />
Target Met<br />
by LEA<br />
(Y/N)<br />
N/A<br />
Target Met<br />
by LEA<br />
(Y/N)<br />
N/A<br />
Page 5 of 5
<strong>ARKANSAS</strong> <strong>SPECIAL</strong> <strong>EDUCATION</strong><br />
<strong>DISTRICT</strong> <strong>ANNUAL</strong> PERFORMANCE REPORT<br />
2010/11 School Year<br />
Publication Date: March 2012<br />
Each State must have in place a State Performance Plan (SPP) to evaluate the State's efforts to meet the requirements and<br />
purposes of the implementation of the Individuals with Disabilities Education Act (IDEA). The SPP is a six-year plan, which<br />
describes Arkansas's performance on 20 indicators. The Office of Special Education Programs in the U. S. Department of<br />
Education requires that States report annually to the public on the performance of each local education agency (LEA) on 14 of<br />
20 indicators as compared with targets established by the State in the SPP. Arkansas will report indicators 1 through 14 and<br />
20 for each LEA serving children with disabilities (CWD). Any LEA not meeting targets on compliance indicators (0% for<br />
Indicators 4B, 09 & 10 and 100% for Indicators 11, 12, 13, and 20) are non-compliant with IDEA.<br />
There are no report changes for the 2010/11 school year profile; However, it is important to recognize that: .<br />
1. Indicator 01 (Graduation) is reported a year in arrear (2009/10 graduates) and is based on a four-year cohort. This<br />
means the rate is a measure of students who entered in ninth grade and graduate in four years. The calculation is a<br />
requirement under Title I of the Elementary and Secondary Education Act (ESEA).<br />
2. Indicator 02 (Drop out) is reported a year in arrear. This means the rate is a measure of students who dropped out in<br />
the 2009/10 school year. The Indicator 02 data are aligned with the Common Core of Data (CCD) requirements for<br />
grades 7-12.<br />
3. Indicator 04A and 4B (Suspension/Expulsion) is reported a year in arrear. This means the rate is a measure of<br />
students who had out-of-school suspensions and/or expulsions totaling more than 10 days.<br />
For a complete description of all the Indicators, please visit the special education website at<br />
http://arksped.k12.ar.us/sections/policy.html<br />
LEA: 5205 - HARMONY GROVE SCHOOL <strong>DISTRICT</strong><br />
Indicator 01: Graduation Rates (2009/10 school year) Indicator 02: Dropout Rates (2009/10 school year)<br />
Percent of youth<br />
with IEPs<br />
graduating from<br />
high school with a<br />
regular diploma<br />
State<br />
Rate<br />
State<br />
Target<br />
75.76% 85.00%<br />
LEA<br />
Rate<br />
80.00%<br />
Target Met<br />
by LEA<br />
(Y/N)<br />
N<br />
Percent of<br />
youth with<br />
IEPs dropping<br />
out of high<br />
school<br />
State<br />
Rate<br />
Indicator 03: Assessment on Statewide Benchmark Exam (grades 3-8, 11)<br />
A) Adequate Yearly Progress<br />
n=40<br />
Literacy<br />
Mathematics<br />
Met Disability Subgroup "n"<br />
for Reporting Purposes (Y/N)<br />
State Target for % of Districts Meeting<br />
AYP for Disability Subgroup<br />
State<br />
Target<br />
3.06% 4.20%<br />
LEA<br />
Rate<br />
0.00%<br />
% of Districts Meeting AYP<br />
for Disability Subgroup<br />
Target Met by<br />
LEA (Y/N)<br />
Y<br />
Target Met by<br />
LEA(Y/N)<br />
Overall N 17.15% 6.25%<br />
NA<br />
N<br />
N<br />
Note: For a district to qualify as having a disability subgroup it must have a minimum of 40 (n=40) students with disabilities in a school building.<br />
B) Participation<br />
Participation Rate: # of<br />
CWD Tested ÷ # of CWD<br />
Enrolled in grades tested.<br />
Participation Rate: Literacy<br />
Participation Rate: Math<br />
Note: - - denotes not applicable<br />
State<br />
Rate<br />
98.78%<br />
State<br />
Target<br />
95.00%<br />
LEA<br />
Rate<br />
98.00%<br />
Target Met<br />
by LEA (Y/N)<br />
98.61% 95.00% 98.36% Y<br />
Y<br />
C) Performance Proficiency<br />
Percent of CWD Scoring<br />
Proficient or Above<br />
Proficiency Rate: Literacy<br />
Proficiency Rate:<br />
Mathematics<br />
16.00%<br />
16.00%<br />
State<br />
Rate<br />
31.49%<br />
44.86%<br />
State<br />
Target<br />
45.22%<br />
51.14%<br />
LEA<br />
Rate<br />
16.33%<br />
31.03%<br />
NA<br />
NA<br />
Target<br />
Met by<br />
LEA (Y/N)<br />
N<br />
N<br />
Page 1 of 5
LEA: 5205 - HARMONY GROVE SCHOOL <strong>DISTRICT</strong><br />
Indicator 04: Out-of-School Suspensions and Expulsions (2009/10 school year)<br />
A) Suspension/Expulsion<br />
Percent difference of CWD with out-of- school suspensions and<br />
expulsions totaling greater than 10 days in a school year as<br />
compared to the same data for general education students in<br />
the district.<br />
B) Suspension/Expulsion by Race and Ethnicity<br />
Percent of districts that have: (a) a significant discrepancy, by race or<br />
ethnicity, in the rate of suspensions and expulsions of greater than 10<br />
days in a school year for children with IEPs; and (b) policies,<br />
procedures or practices that contribute to the significant discrepancy<br />
and do not comply with requirements relating to the development<br />
and implementation of IEPs, the use of positive behavioral<br />
interventions and supports, and procedural safeguards.<br />
Indicator 05: School Age (5-21) Least Restrictive Environment<br />
A) In the Regular Class 80% or more of the day<br />
Percent of CWD with<br />
IEPs receiving instruction<br />
in the regular class 80%<br />
or more of the day.<br />
State<br />
Rate<br />
State<br />
Target<br />
LEA<br />
Rate<br />
B) In the Regular Class less than 40% of the day<br />
Percent of CWD with<br />
IEPs receiving instruction<br />
in the regular class less<br />
than 60% of the day.<br />
53.87% 59.77%<br />
State<br />
Rate<br />
State<br />
Target<br />
12.42% 12.51%<br />
93.26%<br />
LEA<br />
Rate<br />
2.25%<br />
C) Other Settings outside the regular class<br />
Percent of CWD with IEPs served in<br />
public or private separate schools,<br />
residential placements, or<br />
homebound/hospital placements.<br />
State<br />
Rate<br />
State<br />
Target<br />
2.80% 2.56%<br />
Target Met<br />
by LEA (Y/N)<br />
Y<br />
Target Met<br />
by LEA (Y/N)<br />
Y<br />
LEA<br />
Rate<br />
0.00%<br />
Target Met<br />
by LEA(Y/N)<br />
Indicator 06: Early Childhood (3-5) Least Restrictive Environment<br />
A) Regular Early Childhood Program<br />
Percent of children (aged 3 through 5) with IEPs attending a regular<br />
early childhood program and receiving the majority of special<br />
education and related services in the regular early childhood program<br />
Allowable<br />
Difference<br />
LEA: 5205 - HARMONY GROVE SCHOOL <strong>DISTRICT</strong><br />
Indicator 07: Preschool (3-5) Outcomes<br />
a) Percent of preschool CWD<br />
children who did not<br />
improve functioning.<br />
b) Percent of preschool CWD<br />
who improved but whose<br />
functioning remained below<br />
same age peers.<br />
c) Percent of preschool CWD<br />
who improved at a level<br />
nearer to same aged peers.<br />
d) Percent of preschool CWD<br />
who improved functioning to<br />
reach a level comparable to<br />
same age peers.<br />
e) Percent of preschool CWD<br />
children who maintain<br />
functioning at a level<br />
comparable to same aged<br />
peers.<br />
Summary<br />
Statements<br />
1) Of those preschool<br />
children who entered<br />
the preschool program<br />
below age expectations<br />
in each Outcome, the<br />
percent who<br />
substantially increased<br />
their rate of growth by<br />
the time they turned 6<br />
years of age or exited<br />
the program.<br />
2) The percent of<br />
preschool children who<br />
were functioning<br />
within age expectations<br />
in each Outcome by the<br />
time they turned 6<br />
years of age or exited<br />
A) Positive Social -Emotional<br />
Skills*<br />
State<br />
Rate<br />
A) Positive Social -<br />
Emotional Skills<br />
(Including social<br />
relationships)<br />
State<br />
Rate<br />
2.14%<br />
5.31%<br />
25.97%<br />
38.22%<br />
28.36%<br />
State<br />
Target<br />
LEA<br />
Rate<br />
LEA<br />
Rate<br />
— —<br />
— —<br />
— —<br />
— —<br />
— —<br />
Target<br />
Met by<br />
LEA(Y/N)<br />
B) Acquisition and Use of<br />
Knowledge and Skills<br />
(Including early language/<br />
communication and early literacy)<br />
B) Acquisition and Use of<br />
Knowledge and Skills **<br />
State<br />
Rate<br />
1.75%<br />
6.59%<br />
34.23%<br />
43.51%<br />
13.92%<br />
State<br />
Target<br />
LEA<br />
Rate<br />
Target<br />
Met by<br />
LEA(Y/N)<br />
C) Use of Appropriate Behaviors<br />
to Meet Their Needs<br />
State<br />
Rate<br />
State<br />
Target<br />
LEA<br />
Rate<br />
Target<br />
Met by<br />
LEA(Y/N)<br />
89.61% 90.50% — — N/A 90.31% 90.50% — — N/A 90.82% 92.50% — — N/A<br />
66.58% 69.50% — — N/A 57.43% 60.50% — — N/A 76.69% 78.50% — — N/A<br />
NOTE: * Including social relationships ** Including early language/ communication and early literacy<br />
Note: - - denotes not applicable<br />
State<br />
Rate<br />
LEA<br />
Rate<br />
— —<br />
— —<br />
— —<br />
— —<br />
— —<br />
C) Use of<br />
Appropriate<br />
Behaviors to<br />
Meet Their Needs<br />
State<br />
Rate<br />
4.51%<br />
17.34%<br />
41.72%<br />
34.97%<br />
LEA<br />
Rate<br />
1.46% — —<br />
— —<br />
— —<br />
— —<br />
— —<br />
Page 3 of 5
LEA: 5205 - HARMONY GROVE SCHOOL <strong>DISTRICT</strong><br />
Indicator 08: Parent Involvement<br />
Percent of surveyed<br />
parents who reported<br />
school facilitated parent<br />
involvement as a means<br />
of improving services<br />
and results for children<br />
with disabilities.<br />
Early Childhood<br />
(3-5)<br />
School Age<br />
(5-21)<br />
State<br />
Rate<br />
90.47%<br />
95.05%<br />
Indicator 09: Disproportionality - Eligibility<br />
Disproportionate representation of racial<br />
and ethnic groups in special education and<br />
related services that is a result of<br />
inappropriate identification (e.g.<br />
monitoring data, review of policies,<br />
practices, and procedures under 618(d),<br />
etc.).<br />
State<br />
Rate<br />
State<br />
Target<br />
88.00%<br />
96.00%<br />
State<br />
Target<br />
0.00% 0.00%<br />
LEA<br />
Rate<br />
— —<br />
98.81%<br />
Indicator 10: Disproportionality-Child with a Disability<br />
Disproportionate representation of racial<br />
and ethnic groups in specific disability<br />
categories that is a result of inappropriate<br />
identification (e.g. monitoring data, review<br />
of policies, practices, and procedures under<br />
618(d), etc.).<br />
Indicator 11: Child Find<br />
Percent of children with<br />
parental consent to evaluate<br />
who are evaluated within<br />
the State established timeline<br />
of 60 days.<br />
Overall<br />
(3-21)<br />
Early Childhood<br />
(3-5)<br />
School Age<br />
(5-21)<br />
State<br />
Rate<br />
0.00%<br />
Indicator 12: Early Childhood Transition<br />
Percent of children referred by Part C prior to<br />
age 3, who are found eligible for Part B, and<br />
who have an IEP developed and implemented<br />
by their third birthday.<br />
Note: - - denotes not applicable<br />
State<br />
Rate<br />
99.41%<br />
99.70%<br />
98.97%<br />
State<br />
Rate<br />
State<br />
Target<br />
0.00%<br />
State<br />
Target<br />
100.00%<br />
100.00%<br />
100.00%<br />
State<br />
Target<br />
Target Met by<br />
LEA (Y/N)<br />
Y<br />
Target Met by<br />
LEA (Y/N)<br />
Y<br />
LEA<br />
Rate<br />
100.00%<br />
— —<br />
100.00%<br />
LEA<br />
Rate<br />
Target Met by<br />
LEA (Y/N)<br />
N/A<br />
Y<br />
Note: The target for Indicator 09 is to have zero percent<br />
(0%) of districts identified as having disproportionate<br />
representation as a result of inappropriate<br />
identification in eligibility.<br />
Note: The target for Indicator 10 is to have zero<br />
percent (0%) of districts identified as having<br />
disproportionate representation as a result of<br />
inappropriate identification in a disability<br />
category.<br />
Target Met by<br />
LEA (Y/N)<br />
N/A<br />
Y<br />
Target Met<br />
by LEA<br />
(Y/N)<br />
99.21% 100.00% - - N/A<br />
Y<br />
Note: * Indicates a zero reponse rate for the<br />
district.<br />
Page 4 of 5
LEA: 5205 - HARMONY GROVE SCHOOL <strong>DISTRICT</strong><br />
Indicator 13: Secondary Transition<br />
Percent of youth with disabilities aged 16 and<br />
up with an IEP that includes coordinated,<br />
measurable, annual IEP goals and transition<br />
services that will reasonably enable the student<br />
to meet the post-secondary goals.<br />
Indicator 14: Post-School Outcomes<br />
A. Percent of youth enrolled in higher<br />
education within one year of leaving high<br />
school.<br />
State<br />
Rate<br />
State<br />
Target<br />
Note: Data for this Indicator is from the on-site monitoring of LEAs for the given year.<br />
B. Percent of youth enrolled in higher<br />
education or competitively employed<br />
within one year of leaving high school.<br />
C. Percent of youth enrolled in higher<br />
education or in some other postsecondary<br />
education or training program; or<br />
competitively employed or in some other<br />
employment within one year of leaving<br />
high school.<br />
State<br />
Rate<br />
Indicator 20: Reported Data-Timely and Accurate*<br />
District submitted<br />
required data elements<br />
on or before due dates;<br />
made revisions within<br />
the alloted reveiw<br />
periods.<br />
Accurate and Timely<br />
Data Submission<br />
Overall (3-21)<br />
Early Childhood (3-5)<br />
School Age (5-21)<br />
State<br />
Target<br />
100.00%<br />
100.00%<br />
100.00%<br />
State<br />
Target<br />
LEA<br />
Rate<br />
LEA<br />
Rate<br />
Target Met by<br />
LEA (Y/N)<br />
Target Met<br />
by LEA<br />
(Y/N)<br />
Target Met<br />
by LEA<br />
(Y/N)<br />
*Data reviewed for timely and accurate submissions included all APSCN cycle data except for personnel<br />
Note: - - denotes not applicable<br />
96.19 100.00 — — N/A<br />
14.53<br />
State<br />
Rate<br />
49.42<br />
State<br />
Rate<br />
54.07<br />
13.00<br />
State<br />
Target<br />
49.00<br />
State<br />
Target<br />
60.00<br />
Y<br />
N/A<br />
Y<br />
— —<br />
LEA<br />
Rate<br />
— —<br />
LEA<br />
Rate<br />
— —<br />
N/A<br />
Target Met<br />
by LEA<br />
(Y/N)<br />
N/A<br />
Target Met<br />
by LEA<br />
(Y/N)<br />
N/A<br />
Page 5 of 5
LEA: 5206 - STEPHENS SCHOOL <strong>DISTRICT</strong><br />
<strong>ARKANSAS</strong> <strong>SPECIAL</strong> <strong>EDUCATION</strong><br />
<strong>DISTRICT</strong> <strong>ANNUAL</strong> PERFORMANCE REPORT<br />
2010/11 School Year<br />
Publication Date: March 2012<br />
Each State must have in place a State Performance Plan (SPP) to evaluate the State's efforts to meet the requirements and<br />
purposes of the implementation of the Individuals with Disabilities Education Act (IDEA). The SPP is a six-year plan, which<br />
describes Arkansas's performance on 20 indicators. The Office of Special Education Programs in the U. S. Department of<br />
Education requires that States report annually to the public on the performance of each local education agency (LEA) on 14 of<br />
20 indicators as compared with targets established by the State in the SPP. Arkansas will report indicators 1 through 14 and<br />
20 for each LEA serving children with disabilities (CWD). Any LEA not meeting targets on compliance indicators (0% for<br />
Indicators 4B, 09 & 10 and 100% for Indicators 11, 12, 13, and 20) are non-compliant with IDEA.<br />
There are no report changes for the 2010/11 school year profile; However, it is important to recognize that: .<br />
1. Indicator 01 (Graduation) is reported a year in arrear (2009/10 graduates) and is based on a four-year cohort. This<br />
means the rate is a measure of students who entered in ninth grade and graduate in four years. The calculation is a<br />
requirement under Title I of the Elementary and Secondary Education Act (ESEA).<br />
2. Indicator 02 (Drop out) is reported a year in arrear. This means the rate is a measure of students who dropped out in<br />
the 2009/10 school year. The Indicator 02 data are aligned with the Common Core of Data (CCD) requirements for<br />
grades 7-12.<br />
3. Indicator 04A and 4B (Suspension/Expulsion) is reported a year in arrear. This means the rate is a measure of<br />
students who had out-of-school suspensions and/or expulsions totaling more than 10 days.<br />
Percent of youth<br />
with IEPs<br />
graduating from<br />
high school with a<br />
regular diploma<br />
For a complete description of all the Indicators, please visit the special education website at<br />
http://arksped.k12.ar.us/sections/policy.html<br />
Indicator 01: Graduation Rates (2009/10 school year) Indicator 02: Dropout Rates (2009/10 school year)<br />
State<br />
Rate<br />
State<br />
Target<br />
75.76% 85.00%<br />
LEA<br />
Rate<br />
88.89%<br />
Target Met<br />
by LEA<br />
(Y/N)<br />
Y<br />
Percent of<br />
youth with<br />
IEPs dropping<br />
out of high<br />
school<br />
State<br />
Rate<br />
Indicator 03: Assessment on Statewide Benchmark Exam (grades 3-8, 11)<br />
A) Adequate Yearly Progress<br />
n=40<br />
Literacy<br />
Mathematics<br />
Met Disability Subgroup "n"<br />
for Reporting Purposes (Y/N)<br />
State Target for % of Districts Meeting<br />
AYP for Disability Subgroup<br />
State<br />
Target<br />
3.06% 4.20%<br />
LEA<br />
Rate<br />
0.00%<br />
% of Districts Meeting AYP<br />
for Disability Subgroup<br />
Target Met by<br />
LEA (Y/N)<br />
Y<br />
Target Met by<br />
LEA(Y/N)<br />
Overall N 17.15% 6.25%<br />
NA<br />
N<br />
N<br />
Note: For a district to qualify as having a disability subgroup it must have a minimum of 40 (n=40) students with disabilities in a school building.<br />
B) Participation<br />
Participation Rate: # of<br />
CWD Tested ÷ # of CWD<br />
Enrolled in grades tested.<br />
Participation Rate: Literacy<br />
Participation Rate: Math<br />
Note: - - denotes not applicable<br />
State<br />
Rate<br />
98.78%<br />
State<br />
Target<br />
95.00%<br />
LEA<br />
Rate<br />
100.00%<br />
Target Met<br />
by LEA (Y/N)<br />
98.61% 95.00% 95.83% Y<br />
Y<br />
C) Performance Proficiency<br />
Percent of CWD Scoring<br />
Proficient or Above<br />
Proficiency Rate: Literacy<br />
Proficiency Rate:<br />
Mathematics<br />
16.00%<br />
16.00%<br />
State<br />
Rate<br />
31.49%<br />
44.86%<br />
State<br />
Target<br />
45.22%<br />
51.14%<br />
LEA<br />
Rate<br />
4.17%<br />
13.04%<br />
NA<br />
NA<br />
Target<br />
Met by<br />
LEA (Y/N)<br />
N<br />
N<br />
Page 1 of 5
LEA: 5206 - STEPHENS SCHOOL <strong>DISTRICT</strong><br />
Indicator 04: Out-of-School Suspensions and Expulsions (2009/10 school year)<br />
A) Suspension/Expulsion<br />
Percent difference of CWD with out-of- school suspensions and<br />
expulsions totaling greater than 10 days in a school year as<br />
compared to the same data for general education students in<br />
the district.<br />
B) Suspension/Expulsion by Race and Ethnicity<br />
Percent of districts that have: (a) a significant discrepancy, by race or<br />
ethnicity, in the rate of suspensions and expulsions of greater than 10<br />
days in a school year for children with IEPs; and (b) policies,<br />
procedures or practices that contribute to the significant discrepancy<br />
and do not comply with requirements relating to the development<br />
and implementation of IEPs, the use of positive behavioral<br />
interventions and supports, and procedural safeguards.<br />
Indicator 05: School Age (5-21) Least Restrictive Environment<br />
A) In the Regular Class 80% or more of the day<br />
Percent of CWD with<br />
IEPs receiving instruction<br />
in the regular class 80%<br />
or more of the day.<br />
State<br />
Rate<br />
State<br />
Target<br />
LEA<br />
Rate<br />
B) In the Regular Class less than 40% of the day<br />
Percent of CWD with<br />
IEPs receiving instruction<br />
in the regular class less<br />
than 60% of the day.<br />
53.87% 59.77%<br />
State<br />
Rate<br />
State<br />
Target<br />
12.42% 12.51%<br />
81.82%<br />
LEA<br />
Rate<br />
3.03%<br />
C) Other Settings outside the regular class<br />
Percent of CWD with IEPs served in<br />
public or private separate schools,<br />
residential placements, or<br />
homebound/hospital placements.<br />
State<br />
Rate<br />
State<br />
Target<br />
2.80% 2.56%<br />
Target Met<br />
by LEA (Y/N)<br />
Y<br />
Target Met<br />
by LEA (Y/N)<br />
Y<br />
LEA<br />
Rate<br />
0.00%<br />
Target Met<br />
by LEA(Y/N)<br />
Indicator 06: Early Childhood (3-5) Least Restrictive Environment<br />
A) Regular Early Childhood Program<br />
Percent of children (aged 3 through 5) with IEPs attending a regular<br />
early childhood program and receiving the majority of special<br />
education and related services in the regular early childhood program<br />
Allowable<br />
Difference<br />
LEA: 5206 - STEPHENS SCHOOL <strong>DISTRICT</strong><br />
Indicator 07: Preschool (3-5) Outcomes<br />
a) Percent of preschool CWD<br />
children who did not<br />
improve functioning.<br />
b) Percent of preschool CWD<br />
who improved but whose<br />
functioning remained below<br />
same age peers.<br />
c) Percent of preschool CWD<br />
who improved at a level<br />
nearer to same aged peers.<br />
d) Percent of preschool CWD<br />
who improved functioning to<br />
reach a level comparable to<br />
same age peers.<br />
e) Percent of preschool CWD<br />
children who maintain<br />
functioning at a level<br />
comparable to same aged<br />
peers.<br />
Summary<br />
Statements<br />
1) Of those preschool<br />
children who entered<br />
the preschool program<br />
below age expectations<br />
in each Outcome, the<br />
percent who<br />
substantially increased<br />
their rate of growth by<br />
the time they turned 6<br />
years of age or exited<br />
the program.<br />
2) The percent of<br />
preschool children who<br />
were functioning<br />
within age expectations<br />
in each Outcome by the<br />
time they turned 6<br />
years of age or exited<br />
A) Positive Social -Emotional<br />
Skills*<br />
State<br />
Rate<br />
A) Positive Social -<br />
Emotional Skills<br />
(Including social<br />
relationships)<br />
State<br />
Rate<br />
2.14%<br />
5.31%<br />
25.97%<br />
38.22%<br />
28.36%<br />
State<br />
Target<br />
LEA<br />
Rate<br />
LEA<br />
Rate<br />
— —<br />
— —<br />
— —<br />
— —<br />
— —<br />
Target<br />
Met by<br />
LEA(Y/N)<br />
B) Acquisition and Use of<br />
Knowledge and Skills<br />
(Including early language/<br />
communication and early literacy)<br />
B) Acquisition and Use of<br />
Knowledge and Skills **<br />
State<br />
Rate<br />
1.75%<br />
6.59%<br />
34.23%<br />
43.51%<br />
13.92%<br />
State<br />
Target<br />
LEA<br />
Rate<br />
Target<br />
Met by<br />
LEA(Y/N)<br />
C) Use of Appropriate Behaviors<br />
to Meet Their Needs<br />
State<br />
Rate<br />
State<br />
Target<br />
LEA<br />
Rate<br />
Target<br />
Met by<br />
LEA(Y/N)<br />
89.61% 90.50% — — N/A 90.31% 90.50% — — N/A 90.82% 92.50% — — N/A<br />
66.58% 69.50% — — N/A 57.43% 60.50% — — N/A 76.69% 78.50% — — N/A<br />
NOTE: * Including social relationships ** Including early language/ communication and early literacy<br />
Note: - - denotes not applicable<br />
State<br />
Rate<br />
LEA<br />
Rate<br />
— —<br />
— —<br />
— —<br />
— —<br />
— —<br />
C) Use of<br />
Appropriate<br />
Behaviors to<br />
Meet Their Needs<br />
State<br />
Rate<br />
4.51%<br />
17.34%<br />
41.72%<br />
34.97%<br />
LEA<br />
Rate<br />
1.46% — —<br />
— —<br />
— —<br />
— —<br />
— —<br />
Page 3 of 5
LEA: 5206 - STEPHENS SCHOOL <strong>DISTRICT</strong><br />
Indicator 08: Parent Involvement<br />
Percent of surveyed<br />
parents who reported<br />
school facilitated parent<br />
involvement as a means<br />
of improving services<br />
and results for children<br />
with disabilities.<br />
Early Childhood<br />
(3-5)<br />
School Age<br />
(5-21)<br />
State<br />
Rate<br />
90.47%<br />
95.05%<br />
Indicator 09: Disproportionality - Eligibility<br />
Disproportionate representation of racial<br />
and ethnic groups in special education and<br />
related services that is a result of<br />
inappropriate identification (e.g.<br />
monitoring data, review of policies,<br />
practices, and procedures under 618(d),<br />
etc.).<br />
State<br />
Rate<br />
State<br />
Target<br />
88.00%<br />
96.00%<br />
State<br />
Target<br />
0.00% 0.00%<br />
LEA<br />
Rate<br />
— —<br />
97.22%<br />
Indicator 10: Disproportionality-Child with a Disability<br />
Disproportionate representation of racial<br />
and ethnic groups in specific disability<br />
categories that is a result of inappropriate<br />
identification (e.g. monitoring data, review<br />
of policies, practices, and procedures under<br />
618(d), etc.).<br />
Indicator 11: Child Find<br />
Percent of children with<br />
parental consent to evaluate<br />
who are evaluated within<br />
the State established timeline<br />
of 60 days.<br />
Overall<br />
(3-21)<br />
Early Childhood<br />
(3-5)<br />
School Age<br />
(5-21)<br />
State<br />
Rate<br />
0.00%<br />
Indicator 12: Early Childhood Transition<br />
Percent of children referred by Part C prior to<br />
age 3, who are found eligible for Part B, and<br />
who have an IEP developed and implemented<br />
by their third birthday.<br />
Note: - - denotes not applicable<br />
State<br />
Rate<br />
99.41%<br />
99.70%<br />
98.97%<br />
State<br />
Rate<br />
State<br />
Target<br />
0.00%<br />
State<br />
Target<br />
100.00%<br />
100.00%<br />
100.00%<br />
State<br />
Target<br />
Target Met by<br />
LEA (Y/N)<br />
Y<br />
Target Met by<br />
LEA (Y/N)<br />
Y<br />
LEA<br />
Rate<br />
100.00%<br />
— —<br />
100.00%<br />
LEA<br />
Rate<br />
Target Met by<br />
LEA (Y/N)<br />
N/A<br />
Y<br />
Note: The target for Indicator 09 is to have zero percent<br />
(0%) of districts identified as having disproportionate<br />
representation as a result of inappropriate<br />
identification in eligibility.<br />
Note: The target for Indicator 10 is to have zero<br />
percent (0%) of districts identified as having<br />
disproportionate representation as a result of<br />
inappropriate identification in a disability<br />
category.<br />
Target Met by<br />
LEA (Y/N)<br />
N/A<br />
Y<br />
Target Met<br />
by LEA<br />
(Y/N)<br />
99.21% 100.00% - - N/A<br />
Y<br />
Note: * Indicates a zero reponse rate for the<br />
district.<br />
Page 4 of 5
LEA: 5206 - STEPHENS SCHOOL <strong>DISTRICT</strong><br />
Indicator 13: Secondary Transition<br />
Percent of youth with disabilities aged 16 and<br />
up with an IEP that includes coordinated,<br />
measurable, annual IEP goals and transition<br />
services that will reasonably enable the student<br />
to meet the post-secondary goals.<br />
Indicator 14: Post-School Outcomes<br />
A. Percent of youth enrolled in higher<br />
education within one year of leaving high<br />
school.<br />
State<br />
Rate<br />
State<br />
Target<br />
Note: Data for this Indicator is from the on-site monitoring of LEAs for the given year.<br />
B. Percent of youth enrolled in higher<br />
education or competitively employed<br />
within one year of leaving high school.<br />
C. Percent of youth enrolled in higher<br />
education or in some other postsecondary<br />
education or training program; or<br />
competitively employed or in some other<br />
employment within one year of leaving<br />
high school.<br />
State<br />
Rate<br />
Indicator 20: Reported Data-Timely and Accurate*<br />
District submitted<br />
required data elements<br />
on or before due dates;<br />
made revisions within<br />
the alloted reveiw<br />
periods.<br />
Accurate and Timely<br />
Data Submission<br />
Overall (3-21)<br />
Early Childhood (3-5)<br />
School Age (5-21)<br />
State<br />
Target<br />
100.00%<br />
100.00%<br />
100.00%<br />
State<br />
Target<br />
LEA<br />
Rate<br />
LEA<br />
Rate<br />
Target Met by<br />
LEA (Y/N)<br />
Target Met<br />
by LEA<br />
(Y/N)<br />
Target Met<br />
by LEA<br />
(Y/N)<br />
*Data reviewed for timely and accurate submissions included all APSCN cycle data except for personnel<br />
Note: - - denotes not applicable<br />
96.19 100.00 — — N/A<br />
14.53<br />
State<br />
Rate<br />
49.42<br />
State<br />
Rate<br />
54.07<br />
13.00<br />
State<br />
Target<br />
49.00<br />
State<br />
Target<br />
60.00<br />
Y<br />
N/A<br />
Y<br />
0.00%<br />
LEA<br />
Rate<br />
0.00%<br />
LEA<br />
Rate<br />
0.00%<br />
N<br />
Target Met<br />
by LEA<br />
(Y/N)<br />
N<br />
Target Met<br />
by LEA<br />
(Y/N)<br />
N<br />
Page 5 of 5
<strong>ARKANSAS</strong> <strong>SPECIAL</strong> <strong>EDUCATION</strong><br />
<strong>DISTRICT</strong> <strong>ANNUAL</strong> PERFORMANCE REPORT<br />
2010/11 School Year<br />
Publication Date: March 2012<br />
Each State must have in place a State Performance Plan (SPP) to evaluate the State's efforts to meet the requirements and<br />
purposes of the implementation of the Individuals with Disabilities Education Act (IDEA). The SPP is a six-year plan, which<br />
describes Arkansas's performance on 20 indicators. The Office of Special Education Programs in the U. S. Department of<br />
Education requires that States report annually to the public on the performance of each local education agency (LEA) on 14 of<br />
20 indicators as compared with targets established by the State in the SPP. Arkansas will report indicators 1 through 14 and<br />
20 for each LEA serving children with disabilities (CWD). Any LEA not meeting targets on compliance indicators (0% for<br />
Indicators 4B, 09 & 10 and 100% for Indicators 11, 12, 13, and 20) are non-compliant with IDEA.<br />
There are no report changes for the 2010/11 school year profile; However, it is important to recognize that: .<br />
1. Indicator 01 (Graduation) is reported a year in arrear (2009/10 graduates) and is based on a four-year cohort. This<br />
means the rate is a measure of students who entered in ninth grade and graduate in four years. The calculation is a<br />
requirement under Title I of the Elementary and Secondary Education Act (ESEA).<br />
2. Indicator 02 (Drop out) is reported a year in arrear. This means the rate is a measure of students who dropped out in<br />
the 2009/10 school year. The Indicator 02 data are aligned with the Common Core of Data (CCD) requirements for<br />
grades 7-12.<br />
3. Indicator 04A and 4B (Suspension/Expulsion) is reported a year in arrear. This means the rate is a measure of<br />
students who had out-of-school suspensions and/or expulsions totaling more than 10 days.<br />
For a complete description of all the Indicators, please visit the special education website at<br />
http://arksped.k12.ar.us/sections/policy.html<br />
LEA: 5220 - SOUTH CENTRAL SERVICE CO-OP<br />
Indicator 01: Graduation Rates (2009/10 school year) Indicator 02: Dropout Rates (2009/10 school year)<br />
Percent of youth<br />
with IEPs<br />
graduating from<br />
high school with a<br />
regular diploma<br />
State<br />
Rate<br />
State<br />
Target<br />
75.76% 85.00%<br />
LEA<br />
Rate<br />
— —<br />
Target Met<br />
by LEA<br />
(Y/N)<br />
NA<br />
Percent of<br />
youth with<br />
IEPs dropping<br />
out of high<br />
school<br />
State<br />
Rate<br />
Indicator 03: Assessment on Statewide Benchmark Exam (grades 3-8, 11)<br />
A) Adequate Yearly Progress<br />
n=40<br />
Literacy<br />
Mathematics<br />
Met Disability Subgroup "n"<br />
for Reporting Purposes (Y/N)<br />
State Target for % of Districts Meeting<br />
AYP for Disability Subgroup<br />
State<br />
Target<br />
3.06% 4.20%<br />
LEA<br />
Rate<br />
— —<br />
% of Districts Meeting AYP<br />
for Disability Subgroup<br />
Target Met by<br />
LEA (Y/N)<br />
N/A<br />
Target Met by<br />
LEA(Y/N)<br />
Overall N/A 17.15% 6.25%<br />
N/A<br />
N/A<br />
N/A<br />
Note: For a district to qualify as having a disability subgroup it must have a minimum of 40 (n=40) students with disabilities in a school building.<br />
B) Participation<br />
Participation Rate: # of<br />
CWD Tested ÷ # of CWD<br />
Enrolled in grades tested.<br />
Participation Rate: Literacy<br />
Participation Rate: Math<br />
Note: - - denotes not applicable<br />
State<br />
Rate<br />
98.78%<br />
State<br />
Target<br />
95.00%<br />
LEA<br />
Rate<br />
— —<br />
Target Met<br />
by LEA (Y/N)<br />
N/A<br />
98.61% 95.00% — — N/A<br />
C) Performance Proficiency<br />
Percent of CWD Scoring<br />
Proficient or Above<br />
Proficiency Rate: Literacy<br />
Proficiency Rate:<br />
Mathematics<br />
16.00%<br />
16.00%<br />
State<br />
Rate<br />
31.49%<br />
44.86%<br />
State<br />
Target<br />
45.22%<br />
51.14%<br />
LEA<br />
Rate<br />
— —<br />
— —<br />
N/A<br />
N/A<br />
Target<br />
Met by<br />
LEA (Y/N)<br />
N/A<br />
N/A<br />
Page 1 of 5
LEA: 5220 - SOUTH CENTRAL SERVICE CO-OP<br />
Indicator 04: Out-of-School Suspensions and Expulsions (2009/10 school year)<br />
A) Suspension/Expulsion<br />
Percent difference of CWD with out-of- school suspensions and<br />
expulsions totaling greater than 10 days in a school year as<br />
compared to the same data for general education students in<br />
the district.<br />
B) Suspension/Expulsion by Race and Ethnicity<br />
Percent of districts that have: (a) a significant discrepancy, by race or<br />
ethnicity, in the rate of suspensions and expulsions of greater than 10<br />
days in a school year for children with IEPs; and (b) policies,<br />
procedures or practices that contribute to the significant discrepancy<br />
and do not comply with requirements relating to the development<br />
and implementation of IEPs, the use of positive behavioral<br />
interventions and supports, and procedural safeguards.<br />
Indicator 05: School Age (5-21) Least Restrictive Environment<br />
A) In the Regular Class 80% or more of the day<br />
Percent of CWD with<br />
IEPs receiving instruction<br />
in the regular class 80%<br />
or more of the day.<br />
State<br />
Rate<br />
State<br />
Target<br />
LEA<br />
Rate<br />
B) In the Regular Class less than 40% of the day<br />
Percent of CWD with<br />
IEPs receiving instruction<br />
in the regular class less<br />
than 60% of the day.<br />
53.87% 59.77%<br />
State<br />
Rate<br />
State<br />
Target<br />
12.42% 12.51%<br />
— —<br />
LEA<br />
Rate<br />
— —<br />
C) Other Settings outside the regular class<br />
Percent of CWD with IEPs served in<br />
public or private separate schools,<br />
residential placements, or<br />
homebound/hospital placements.<br />
State<br />
Rate<br />
State<br />
Target<br />
2.80% 2.56%<br />
Target Met<br />
by LEA (Y/N)<br />
N/A<br />
Target Met<br />
by LEA (Y/N)<br />
N/A<br />
LEA<br />
Rate<br />
— —<br />
Target Met<br />
by LEA(Y/N)<br />
N/A<br />
Indicator 06: Early Childhood (3-5) Least Restrictive Environment<br />
A) Regular Early Childhood Program<br />
Percent of children (aged 3 through 5) with IEPs attending a regular<br />
early childhood program and receiving the majority of special<br />
education and related services in the regular early childhood program<br />
Allowable<br />
Difference<br />
LEA: 5220 - SOUTH CENTRAL SERVICE CO-OP<br />
Indicator 07: Preschool (3-5) Outcomes<br />
a) Percent of preschool CWD<br />
children who did not<br />
improve functioning.<br />
b) Percent of preschool CWD<br />
who improved but whose<br />
functioning remained below<br />
same age peers.<br />
c) Percent of preschool CWD<br />
who improved at a level<br />
nearer to same aged peers.<br />
d) Percent of preschool CWD<br />
who improved functioning to<br />
reach a level comparable to<br />
same age peers.<br />
e) Percent of preschool CWD<br />
children who maintain<br />
functioning at a level<br />
comparable to same aged<br />
peers.<br />
Summary<br />
Statements<br />
1) Of those preschool<br />
children who entered<br />
the preschool program<br />
below age expectations<br />
in each Outcome, the<br />
percent who<br />
substantially increased<br />
their rate of growth by<br />
the time they turned 6<br />
years of age or exited<br />
the program.<br />
2) The percent of<br />
preschool children who<br />
were functioning<br />
within age expectations<br />
in each Outcome by the<br />
time they turned 6<br />
years of age or exited<br />
A) Positive Social -Emotional<br />
Skills*<br />
State<br />
Rate<br />
A) Positive Social -<br />
Emotional Skills<br />
(Including social<br />
relationships)<br />
State<br />
Rate<br />
2.14%<br />
5.31%<br />
25.97%<br />
38.22%<br />
28.36%<br />
State<br />
Target<br />
LEA<br />
Rate<br />
LEA<br />
Rate<br />
— —<br />
2.91%<br />
14.53%<br />
36.63%<br />
45.93%<br />
Target<br />
Met by<br />
LEA(Y/N)<br />
B) Acquisition and Use of<br />
Knowledge and Skills<br />
(Including early language/<br />
communication and early literacy)<br />
B) Acquisition and Use of<br />
Knowledge and Skills **<br />
State<br />
Rate<br />
1.75%<br />
6.59%<br />
34.23%<br />
43.51%<br />
13.92%<br />
State<br />
Target<br />
LEA<br />
Rate<br />
Target<br />
Met by<br />
LEA(Y/N)<br />
C) Use of Appropriate Behaviors<br />
to Meet Their Needs<br />
State<br />
Rate<br />
State<br />
Target<br />
LEA<br />
Rate<br />
Target<br />
Met by<br />
LEA(Y/N)<br />
89.61% 90.50% 94.62% Y 90.31% 90.50% 88.55% N 90.82% 92.50% 90.10% N<br />
66.58% 69.50% 82.56% Y 57.43% 60.50% 55.81% N 76.69% 78.50% 85.47% Y<br />
NOTE: * Including social relationships ** Including early language/ communication and early literacy<br />
Note: - - denotes not applicable<br />
State<br />
Rate<br />
LEA<br />
Rate<br />
— —<br />
11.05%<br />
33.14%<br />
52.33%<br />
3.49%<br />
C) Use of<br />
Appropriate<br />
Behaviors to<br />
Meet Their Needs<br />
State<br />
Rate<br />
4.51%<br />
17.34%<br />
41.72%<br />
34.97%<br />
LEA<br />
Rate<br />
1.46% — —<br />
5.81%<br />
8.72%<br />
44.19%<br />
41.28%<br />
Page 3 of 5
LEA: 5220 - SOUTH CENTRAL SERVICE CO-OP<br />
Indicator 08: Parent Involvement<br />
Percent of surveyed<br />
parents who reported<br />
school facilitated parent<br />
involvement as a means<br />
of improving services<br />
and results for children<br />
with disabilities.<br />
Early Childhood<br />
(3-5)<br />
School Age<br />
(5-21)<br />
State<br />
Rate<br />
90.47%<br />
95.05%<br />
Indicator 09: Disproportionality - Eligibility<br />
Disproportionate representation of racial<br />
and ethnic groups in special education and<br />
related services that is a result of<br />
inappropriate identification (e.g.<br />
monitoring data, review of policies,<br />
practices, and procedures under 618(d),<br />
etc.).<br />
State<br />
Rate<br />
State<br />
Target<br />
88.00%<br />
96.00%<br />
State<br />
Target<br />
0.00% 0.00%<br />
LEA<br />
Rate<br />
88.51%<br />
— —<br />
Indicator 10: Disproportionality-Child with a Disability<br />
Disproportionate representation of racial<br />
and ethnic groups in specific disability<br />
categories that is a result of inappropriate<br />
identification (e.g. monitoring data, review<br />
of policies, practices, and procedures under<br />
618(d), etc.).<br />
Indicator 11: Child Find<br />
Percent of children with<br />
parental consent to evaluate<br />
who are evaluated within<br />
the State established timeline<br />
of 60 days.<br />
Overall<br />
(3-21)<br />
Early Childhood<br />
(3-5)<br />
School Age<br />
(5-21)<br />
State<br />
Rate<br />
0.00%<br />
Indicator 12: Early Childhood Transition<br />
Percent of children referred by Part C prior to<br />
age 3, who are found eligible for Part B, and<br />
who have an IEP developed and implemented<br />
by their third birthday.<br />
Note: - - denotes not applicable<br />
State<br />
Rate<br />
99.41%<br />
99.70%<br />
98.97%<br />
State<br />
Rate<br />
State<br />
Target<br />
0.00%<br />
State<br />
Target<br />
100.00%<br />
100.00%<br />
100.00%<br />
State<br />
Target<br />
Target Met by<br />
LEA (Y/N)<br />
N/A<br />
Target Met by<br />
LEA (Y/N)<br />
N/A<br />
LEA<br />
Rate<br />
100.00%<br />
100.00%<br />
— —<br />
LEA<br />
Rate<br />
Target Met by<br />
LEA (Y/N)<br />
Y<br />
N/A<br />
Note: The target for Indicator 09 is to have zero percent<br />
(0%) of districts identified as having disproportionate<br />
representation as a result of inappropriate<br />
identification in eligibility.<br />
Note: The target for Indicator 10 is to have zero<br />
percent (0%) of districts identified as having<br />
disproportionate representation as a result of<br />
inappropriate identification in a disability<br />
category.<br />
Target Met by<br />
LEA (Y/N)<br />
Y<br />
N/A<br />
Target Met<br />
by LEA<br />
(Y/N)<br />
99.21% 100.00% 100.00% Y<br />
Y<br />
Note: * Indicates a zero reponse rate for the<br />
district.<br />
Page 4 of 5
LEA: 5220 - SOUTH CENTRAL SERVICE CO-OP<br />
Indicator 13: Secondary Transition<br />
Percent of youth with disabilities aged 16 and<br />
up with an IEP that includes coordinated,<br />
measurable, annual IEP goals and transition<br />
services that will reasonably enable the student<br />
to meet the post-secondary goals.<br />
Indicator 14: Post-School Outcomes<br />
A. Percent of youth enrolled in higher<br />
education within one year of leaving high<br />
school.<br />
State<br />
Rate<br />
State<br />
Target<br />
Note: Data for this Indicator is from the on-site monitoring of LEAs for the given year.<br />
B. Percent of youth enrolled in higher<br />
education or competitively employed<br />
within one year of leaving high school.<br />
C. Percent of youth enrolled in higher<br />
education or in some other postsecondary<br />
education or training program; or<br />
competitively employed or in some other<br />
employment within one year of leaving<br />
high school.<br />
State<br />
Rate<br />
Indicator 20: Reported Data-Timely and Accurate*<br />
District submitted<br />
required data elements<br />
on or before due dates;<br />
made revisions within<br />
the alloted reveiw<br />
periods.<br />
Accurate and Timely<br />
Data Submission<br />
Overall (3-21)<br />
Early Childhood (3-5)<br />
School Age (5-21)<br />
State<br />
Target<br />
100.00%<br />
100.00%<br />
100.00%<br />
State<br />
Target<br />
LEA<br />
Rate<br />
LEA<br />
Rate<br />
Target Met by<br />
LEA (Y/N)<br />
Target Met<br />
by LEA<br />
(Y/N)<br />
Target Met<br />
by LEA<br />
(Y/N)<br />
*Data reviewed for timely and accurate submissions included all APSCN cycle data except for personnel<br />
Note: - - denotes not applicable<br />
96.19 100.00 — — N/A<br />
14.53<br />
State<br />
Rate<br />
49.42<br />
State<br />
Rate<br />
54.07<br />
13.00<br />
State<br />
Target<br />
49.00<br />
State<br />
Target<br />
60.00<br />
Y<br />
Y<br />
N/A<br />
— —<br />
LEA<br />
Rate<br />
— —<br />
LEA<br />
Rate<br />
— —<br />
N/A<br />
Target Met<br />
by LEA<br />
(Y/N)<br />
N/A<br />
Target Met<br />
by LEA<br />
(Y/N)<br />
N/A<br />
Page 5 of 5
LEA: 5301 - EAST END SCHOOL <strong>DISTRICT</strong><br />
<strong>ARKANSAS</strong> <strong>SPECIAL</strong> <strong>EDUCATION</strong><br />
<strong>DISTRICT</strong> <strong>ANNUAL</strong> PERFORMANCE REPORT<br />
2010/11 School Year<br />
Publication Date: March 2012<br />
Each State must have in place a State Performance Plan (SPP) to evaluate the State's efforts to meet the requirements and<br />
purposes of the implementation of the Individuals with Disabilities Education Act (IDEA). The SPP is a six-year plan, which<br />
describes Arkansas's performance on 20 indicators. The Office of Special Education Programs in the U. S. Department of<br />
Education requires that States report annually to the public on the performance of each local education agency (LEA) on 14 of<br />
20 indicators as compared with targets established by the State in the SPP. Arkansas will report indicators 1 through 14 and<br />
20 for each LEA serving children with disabilities (CWD). Any LEA not meeting targets on compliance indicators (0% for<br />
Indicators 4B, 09 & 10 and 100% for Indicators 11, 12, 13, and 20) are non-compliant with IDEA.<br />
There are no report changes for the 2010/11 school year profile; However, it is important to recognize that: .<br />
1. Indicator 01 (Graduation) is reported a year in arrear (2009/10 graduates) and is based on a four-year cohort. This<br />
means the rate is a measure of students who entered in ninth grade and graduate in four years. The calculation is a<br />
requirement under Title I of the Elementary and Secondary Education Act (ESEA).<br />
2. Indicator 02 (Drop out) is reported a year in arrear. This means the rate is a measure of students who dropped out in<br />
the 2009/10 school year. The Indicator 02 data are aligned with the Common Core of Data (CCD) requirements for<br />
grades 7-12.<br />
3. Indicator 04A and 4B (Suspension/Expulsion) is reported a year in arrear. This means the rate is a measure of<br />
students who had out-of-school suspensions and/or expulsions totaling more than 10 days.<br />
Percent of youth<br />
with IEPs<br />
graduating from<br />
high school with a<br />
regular diploma<br />
For a complete description of all the Indicators, please visit the special education website at<br />
http://arksped.k12.ar.us/sections/policy.html<br />
Indicator 01: Graduation Rates (2009/10 school year) Indicator 02: Dropout Rates (2009/10 school year)<br />
State<br />
Rate<br />
State<br />
Target<br />
75.76% 85.00%<br />
LEA<br />
Rate<br />
87.50%<br />
Target Met<br />
by LEA<br />
(Y/N)<br />
Y<br />
Percent of<br />
youth with<br />
IEPs dropping<br />
out of high<br />
school<br />
State<br />
Rate<br />
Indicator 03: Assessment on Statewide Benchmark Exam (grades 3-8, 11)<br />
A) Adequate Yearly Progress<br />
n=40<br />
Literacy<br />
Mathematics<br />
Met Disability Subgroup "n"<br />
for Reporting Purposes (Y/N)<br />
State Target for % of Districts Meeting<br />
AYP for Disability Subgroup<br />
State<br />
Target<br />
3.06% 4.20%<br />
LEA<br />
Rate<br />
3.13%<br />
% of Districts Meeting AYP<br />
for Disability Subgroup<br />
Target Met by<br />
LEA (Y/N)<br />
Y<br />
Target Met by<br />
LEA(Y/N)<br />
Overall N 17.15% 6.25%<br />
NA<br />
N<br />
N<br />
Note: For a district to qualify as having a disability subgroup it must have a minimum of 40 (n=40) students with disabilities in a school building.<br />
B) Participation<br />
Participation Rate: # of<br />
CWD Tested ÷ # of CWD<br />
Enrolled in grades tested.<br />
Participation Rate: Literacy<br />
Participation Rate: Math<br />
Note: - - denotes not applicable<br />
State<br />
Rate<br />
98.78%<br />
State<br />
Target<br />
95.00%<br />
LEA<br />
Rate<br />
98.33%<br />
Target Met<br />
by LEA (Y/N)<br />
98.61% 95.00% 98.36% Y<br />
Y<br />
C) Performance Proficiency<br />
Percent of CWD Scoring<br />
Proficient or Above<br />
Proficiency Rate: Literacy<br />
Proficiency Rate:<br />
Mathematics<br />
16.00%<br />
16.00%<br />
State<br />
Rate<br />
31.49%<br />
44.86%<br />
State<br />
Target<br />
45.22%<br />
51.14%<br />
LEA<br />
Rate<br />
23.64%<br />
35.71%<br />
NA<br />
NA<br />
Target<br />
Met by<br />
LEA (Y/N)<br />
N<br />
N<br />
Page 1 of 5
LEA: 5301 - EAST END SCHOOL <strong>DISTRICT</strong><br />
Indicator 04: Out-of-School Suspensions and Expulsions (2009/10 school year)<br />
A) Suspension/Expulsion<br />
Percent difference of CWD with out-of- school suspensions and<br />
expulsions totaling greater than 10 days in a school year as<br />
compared to the same data for general education students in<br />
the district.<br />
B) Suspension/Expulsion by Race and Ethnicity<br />
Percent of districts that have: (a) a significant discrepancy, by race or<br />
ethnicity, in the rate of suspensions and expulsions of greater than 10<br />
days in a school year for children with IEPs; and (b) policies,<br />
procedures or practices that contribute to the significant discrepancy<br />
and do not comply with requirements relating to the development<br />
and implementation of IEPs, the use of positive behavioral<br />
interventions and supports, and procedural safeguards.<br />
Indicator 05: School Age (5-21) Least Restrictive Environment<br />
A) In the Regular Class 80% or more of the day<br />
Percent of CWD with<br />
IEPs receiving instruction<br />
in the regular class 80%<br />
or more of the day.<br />
State<br />
Rate<br />
State<br />
Target<br />
LEA<br />
Rate<br />
B) In the Regular Class less than 40% of the day<br />
Percent of CWD with<br />
IEPs receiving instruction<br />
in the regular class less<br />
than 60% of the day.<br />
53.87% 59.77%<br />
State<br />
Rate<br />
State<br />
Target<br />
12.42% 12.51%<br />
48.28%<br />
LEA<br />
Rate<br />
6.03%<br />
C) Other Settings outside the regular class<br />
Percent of CWD with IEPs served in<br />
public or private separate schools,<br />
residential placements, or<br />
homebound/hospital placements.<br />
State<br />
Rate<br />
State<br />
Target<br />
2.80% 2.56%<br />
Target Met<br />
by LEA (Y/N)<br />
N<br />
Target Met<br />
by LEA (Y/N)<br />
Y<br />
LEA<br />
Rate<br />
0.86%<br />
Target Met<br />
by LEA(Y/N)<br />
Indicator 06: Early Childhood (3-5) Least Restrictive Environment<br />
A) Regular Early Childhood Program<br />
Percent of children (aged 3 through 5) with IEPs attending a regular<br />
early childhood program and receiving the majority of special<br />
education and related services in the regular early childhood program<br />
Allowable<br />
Difference<br />
LEA: 5301 - EAST END SCHOOL <strong>DISTRICT</strong><br />
Indicator 07: Preschool (3-5) Outcomes<br />
a) Percent of preschool CWD<br />
children who did not<br />
improve functioning.<br />
b) Percent of preschool CWD<br />
who improved but whose<br />
functioning remained below<br />
same age peers.<br />
c) Percent of preschool CWD<br />
who improved at a level<br />
nearer to same aged peers.<br />
d) Percent of preschool CWD<br />
who improved functioning to<br />
reach a level comparable to<br />
same age peers.<br />
e) Percent of preschool CWD<br />
children who maintain<br />
functioning at a level<br />
comparable to same aged<br />
peers.<br />
Summary<br />
Statements<br />
1) Of those preschool<br />
children who entered<br />
the preschool program<br />
below age expectations<br />
in each Outcome, the<br />
percent who<br />
substantially increased<br />
their rate of growth by<br />
the time they turned 6<br />
years of age or exited<br />
the program.<br />
2) The percent of<br />
preschool children who<br />
were functioning<br />
within age expectations<br />
in each Outcome by the<br />
time they turned 6<br />
years of age or exited<br />
A) Positive Social -Emotional<br />
Skills*<br />
State<br />
Rate<br />
A) Positive Social -<br />
Emotional Skills<br />
(Including social<br />
relationships)<br />
State<br />
Rate<br />
2.14%<br />
5.31%<br />
25.97%<br />
38.22%<br />
28.36%<br />
State<br />
Target<br />
LEA<br />
Rate<br />
LEA<br />
Rate<br />
— —<br />
— —<br />
— —<br />
— —<br />
— —<br />
Target<br />
Met by<br />
LEA(Y/N)<br />
B) Acquisition and Use of<br />
Knowledge and Skills<br />
(Including early language/<br />
communication and early literacy)<br />
B) Acquisition and Use of<br />
Knowledge and Skills **<br />
State<br />
Rate<br />
1.75%<br />
6.59%<br />
34.23%<br />
43.51%<br />
13.92%<br />
State<br />
Target<br />
LEA<br />
Rate<br />
Target<br />
Met by<br />
LEA(Y/N)<br />
C) Use of Appropriate Behaviors<br />
to Meet Their Needs<br />
State<br />
Rate<br />
State<br />
Target<br />
LEA<br />
Rate<br />
Target<br />
Met by<br />
LEA(Y/N)<br />
89.61% 90.50% — — N/A 90.31% 90.50% — — N/A 90.82% 92.50% — — N/A<br />
66.58% 69.50% — — N/A 57.43% 60.50% — — N/A 76.69% 78.50% — — N/A<br />
NOTE: * Including social relationships ** Including early language/ communication and early literacy<br />
Note: - - denotes not applicable<br />
State<br />
Rate<br />
LEA<br />
Rate<br />
— —<br />
— —<br />
— —<br />
— —<br />
— —<br />
C) Use of<br />
Appropriate<br />
Behaviors to<br />
Meet Their Needs<br />
State<br />
Rate<br />
4.51%<br />
17.34%<br />
41.72%<br />
34.97%<br />
LEA<br />
Rate<br />
1.46% — —<br />
— —<br />
— —<br />
— —<br />
— —<br />
Page 3 of 5
LEA: 5301 - EAST END SCHOOL <strong>DISTRICT</strong><br />
Indicator 08: Parent Involvement<br />
Percent of surveyed<br />
parents who reported<br />
school facilitated parent<br />
involvement as a means<br />
of improving services<br />
and results for children<br />
with disabilities.<br />
Early Childhood<br />
(3-5)<br />
School Age<br />
(5-21)<br />
State<br />
Rate<br />
90.47%<br />
95.05%<br />
Indicator 09: Disproportionality - Eligibility<br />
Disproportionate representation of racial<br />
and ethnic groups in special education and<br />
related services that is a result of<br />
inappropriate identification (e.g.<br />
monitoring data, review of policies,<br />
practices, and procedures under 618(d),<br />
etc.).<br />
State<br />
Rate<br />
State<br />
Target<br />
88.00%<br />
96.00%<br />
State<br />
Target<br />
0.00% 0.00%<br />
LEA<br />
Rate<br />
— —<br />
96.77%<br />
Indicator 10: Disproportionality-Child with a Disability<br />
Disproportionate representation of racial<br />
and ethnic groups in specific disability<br />
categories that is a result of inappropriate<br />
identification (e.g. monitoring data, review<br />
of policies, practices, and procedures under<br />
618(d), etc.).<br />
Indicator 11: Child Find<br />
Percent of children with<br />
parental consent to evaluate<br />
who are evaluated within<br />
the State established timeline<br />
of 60 days.<br />
Overall<br />
(3-21)<br />
Early Childhood<br />
(3-5)<br />
School Age<br />
(5-21)<br />
State<br />
Rate<br />
0.00%<br />
Indicator 12: Early Childhood Transition<br />
Percent of children referred by Part C prior to<br />
age 3, who are found eligible for Part B, and<br />
who have an IEP developed and implemented<br />
by their third birthday.<br />
Note: - - denotes not applicable<br />
State<br />
Rate<br />
99.41%<br />
99.70%<br />
98.97%<br />
State<br />
Rate<br />
State<br />
Target<br />
0.00%<br />
State<br />
Target<br />
100.00%<br />
100.00%<br />
100.00%<br />
State<br />
Target<br />
Target Met by<br />
LEA (Y/N)<br />
Y<br />
Target Met by<br />
LEA (Y/N)<br />
Y<br />
LEA<br />
Rate<br />
100.00%<br />
— —<br />
100.00%<br />
LEA<br />
Rate<br />
Target Met by<br />
LEA (Y/N)<br />
N/A<br />
Y<br />
Note: The target for Indicator 09 is to have zero percent<br />
(0%) of districts identified as having disproportionate<br />
representation as a result of inappropriate<br />
identification in eligibility.<br />
Note: The target for Indicator 10 is to have zero<br />
percent (0%) of districts identified as having<br />
disproportionate representation as a result of<br />
inappropriate identification in a disability<br />
category.<br />
Target Met by<br />
LEA (Y/N)<br />
N/A<br />
Y<br />
Target Met<br />
by LEA<br />
(Y/N)<br />
99.21% 100.00% - - N/A<br />
Y<br />
Note: * Indicates a zero reponse rate for the<br />
district.<br />
Page 4 of 5
LEA: 5301 - EAST END SCHOOL <strong>DISTRICT</strong><br />
Indicator 13: Secondary Transition<br />
Percent of youth with disabilities aged 16 and<br />
up with an IEP that includes coordinated,<br />
measurable, annual IEP goals and transition<br />
services that will reasonably enable the student<br />
to meet the post-secondary goals.<br />
Indicator 14: Post-School Outcomes<br />
A. Percent of youth enrolled in higher<br />
education within one year of leaving high<br />
school.<br />
State<br />
Rate<br />
State<br />
Target<br />
Note: Data for this Indicator is from the on-site monitoring of LEAs for the given year.<br />
B. Percent of youth enrolled in higher<br />
education or competitively employed<br />
within one year of leaving high school.<br />
C. Percent of youth enrolled in higher<br />
education or in some other postsecondary<br />
education or training program; or<br />
competitively employed or in some other<br />
employment within one year of leaving<br />
high school.<br />
State<br />
Rate<br />
Indicator 20: Reported Data-Timely and Accurate*<br />
District submitted<br />
required data elements<br />
on or before due dates;<br />
made revisions within<br />
the alloted reveiw<br />
periods.<br />
Accurate and Timely<br />
Data Submission<br />
Overall (3-21)<br />
Early Childhood (3-5)<br />
School Age (5-21)<br />
State<br />
Target<br />
100.00%<br />
100.00%<br />
100.00%<br />
State<br />
Target<br />
LEA<br />
Rate<br />
LEA<br />
Rate<br />
Target Met by<br />
LEA (Y/N)<br />
Target Met<br />
by LEA<br />
(Y/N)<br />
Target Met<br />
by LEA<br />
(Y/N)<br />
*Data reviewed for timely and accurate submissions included all APSCN cycle data except for personnel<br />
Note: - - denotes not applicable<br />
96.19 100.00 100.00% Y<br />
14.53<br />
State<br />
Rate<br />
49.42<br />
State<br />
Rate<br />
54.07<br />
13.00<br />
State<br />
Target<br />
49.00<br />
State<br />
Target<br />
60.00<br />
Y<br />
N/A<br />
Y<br />
— —<br />
LEA<br />
Rate<br />
— —<br />
LEA<br />
Rate<br />
— —<br />
N/A<br />
Target Met<br />
by LEA<br />
(Y/N)<br />
N/A<br />
Target Met<br />
by LEA<br />
(Y/N)<br />
N/A<br />
Page 5 of 5
LEA: 5303 - PERRYVILLE SCHOOL <strong>DISTRICT</strong><br />
<strong>ARKANSAS</strong> <strong>SPECIAL</strong> <strong>EDUCATION</strong><br />
<strong>DISTRICT</strong> <strong>ANNUAL</strong> PERFORMANCE REPORT<br />
2010/11 School Year<br />
Publication Date: March 2012<br />
Each State must have in place a State Performance Plan (SPP) to evaluate the State's efforts to meet the requirements and<br />
purposes of the implementation of the Individuals with Disabilities Education Act (IDEA). The SPP is a six-year plan, which<br />
describes Arkansas's performance on 20 indicators. The Office of Special Education Programs in the U. S. Department of<br />
Education requires that States report annually to the public on the performance of each local education agency (LEA) on 14 of<br />
20 indicators as compared with targets established by the State in the SPP. Arkansas will report indicators 1 through 14 and<br />
20 for each LEA serving children with disabilities (CWD). Any LEA not meeting targets on compliance indicators (0% for<br />
Indicators 4B, 09 & 10 and 100% for Indicators 11, 12, 13, and 20) are non-compliant with IDEA.<br />
There are no report changes for the 2010/11 school year profile; However, it is important to recognize that: .<br />
1. Indicator 01 (Graduation) is reported a year in arrear (2009/10 graduates) and is based on a four-year cohort. This<br />
means the rate is a measure of students who entered in ninth grade and graduate in four years. The calculation is a<br />
requirement under Title I of the Elementary and Secondary Education Act (ESEA).<br />
2. Indicator 02 (Drop out) is reported a year in arrear. This means the rate is a measure of students who dropped out in<br />
the 2009/10 school year. The Indicator 02 data are aligned with the Common Core of Data (CCD) requirements for<br />
grades 7-12.<br />
3. Indicator 04A and 4B (Suspension/Expulsion) is reported a year in arrear. This means the rate is a measure of<br />
students who had out-of-school suspensions and/or expulsions totaling more than 10 days.<br />
Percent of youth<br />
with IEPs<br />
graduating from<br />
high school with a<br />
regular diploma<br />
For a complete description of all the Indicators, please visit the special education website at<br />
http://arksped.k12.ar.us/sections/policy.html<br />
Indicator 01: Graduation Rates (2009/10 school year) Indicator 02: Dropout Rates (2009/10 school year)<br />
State<br />
Rate<br />
State<br />
Target<br />
75.76% 85.00%<br />
LEA<br />
Rate<br />
81.82%<br />
Target Met<br />
by LEA<br />
(Y/N)<br />
N<br />
Percent of<br />
youth with<br />
IEPs dropping<br />
out of high<br />
school<br />
State<br />
Rate<br />
Indicator 03: Assessment on Statewide Benchmark Exam (grades 3-8, 11)<br />
A) Adequate Yearly Progress<br />
n=40<br />
Literacy<br />
Mathematics<br />
Met Disability Subgroup "n"<br />
for Reporting Purposes (Y/N)<br />
State Target for % of Districts Meeting<br />
AYP for Disability Subgroup<br />
State<br />
Target<br />
3.06% 4.20%<br />
LEA<br />
Rate<br />
1.28%<br />
% of Districts Meeting AYP<br />
for Disability Subgroup<br />
Target Met by<br />
LEA (Y/N)<br />
Y<br />
Target Met by<br />
LEA(Y/N)<br />
Overall N 17.15% 6.25%<br />
NA<br />
N<br />
N<br />
Note: For a district to qualify as having a disability subgroup it must have a minimum of 40 (n=40) students with disabilities in a school building.<br />
B) Participation<br />
Participation Rate: # of<br />
CWD Tested ÷ # of CWD<br />
Enrolled in grades tested.<br />
Participation Rate: Literacy<br />
Participation Rate: Math<br />
Note: - - denotes not applicable<br />
State<br />
Rate<br />
98.78%<br />
State<br />
Target<br />
95.00%<br />
LEA<br />
Rate<br />
100.00%<br />
Target Met<br />
by LEA (Y/N)<br />
98.61% 95.00% 98.81% Y<br />
Y<br />
C) Performance Proficiency<br />
Percent of CWD Scoring<br />
Proficient or Above<br />
Proficiency Rate: Literacy<br />
Proficiency Rate:<br />
Mathematics<br />
16.00%<br />
16.00%<br />
State<br />
Rate<br />
31.49%<br />
44.86%<br />
State<br />
Target<br />
45.22%<br />
51.14%<br />
LEA<br />
Rate<br />
42.47%<br />
37.50%<br />
NA<br />
NA<br />
Target<br />
Met by<br />
LEA (Y/N)<br />
N<br />
N<br />
Page 1 of 5
LEA: 5303 - PERRYVILLE SCHOOL <strong>DISTRICT</strong><br />
Indicator 04: Out-of-School Suspensions and Expulsions (2009/10 school year)<br />
A) Suspension/Expulsion<br />
Percent difference of CWD with out-of- school suspensions and<br />
expulsions totaling greater than 10 days in a school year as<br />
compared to the same data for general education students in<br />
the district.<br />
B) Suspension/Expulsion by Race and Ethnicity<br />
Percent of districts that have: (a) a significant discrepancy, by race or<br />
ethnicity, in the rate of suspensions and expulsions of greater than 10<br />
days in a school year for children with IEPs; and (b) policies,<br />
procedures or practices that contribute to the significant discrepancy<br />
and do not comply with requirements relating to the development<br />
and implementation of IEPs, the use of positive behavioral<br />
interventions and supports, and procedural safeguards.<br />
Indicator 05: School Age (5-21) Least Restrictive Environment<br />
A) In the Regular Class 80% or more of the day<br />
Percent of CWD with<br />
IEPs receiving instruction<br />
in the regular class 80%<br />
or more of the day.<br />
State<br />
Rate<br />
State<br />
Target<br />
LEA<br />
Rate<br />
B) In the Regular Class less than 40% of the day<br />
Percent of CWD with<br />
IEPs receiving instruction<br />
in the regular class less<br />
than 60% of the day.<br />
53.87% 59.77%<br />
State<br />
Rate<br />
State<br />
Target<br />
12.42% 12.51%<br />
50.00%<br />
LEA<br />
Rate<br />
10.56%<br />
C) Other Settings outside the regular class<br />
Percent of CWD with IEPs served in<br />
public or private separate schools,<br />
residential placements, or<br />
homebound/hospital placements.<br />
State<br />
Rate<br />
State<br />
Target<br />
2.80% 2.56%<br />
Target Met<br />
by LEA (Y/N)<br />
N<br />
Target Met<br />
by LEA (Y/N)<br />
Y<br />
LEA<br />
Rate<br />
2.82%<br />
Target Met<br />
by LEA(Y/N)<br />
Indicator 06: Early Childhood (3-5) Least Restrictive Environment<br />
A) Regular Early Childhood Program<br />
Percent of children (aged 3 through 5) with IEPs attending a regular<br />
early childhood program and receiving the majority of special<br />
education and related services in the regular early childhood program<br />
Allowable<br />
Difference<br />
LEA: 5303 - PERRYVILLE SCHOOL <strong>DISTRICT</strong><br />
Indicator 07: Preschool (3-5) Outcomes<br />
a) Percent of preschool CWD<br />
children who did not<br />
improve functioning.<br />
b) Percent of preschool CWD<br />
who improved but whose<br />
functioning remained below<br />
same age peers.<br />
c) Percent of preschool CWD<br />
who improved at a level<br />
nearer to same aged peers.<br />
d) Percent of preschool CWD<br />
who improved functioning to<br />
reach a level comparable to<br />
same age peers.<br />
e) Percent of preschool CWD<br />
children who maintain<br />
functioning at a level<br />
comparable to same aged<br />
peers.<br />
Summary<br />
Statements<br />
1) Of those preschool<br />
children who entered<br />
the preschool program<br />
below age expectations<br />
in each Outcome, the<br />
percent who<br />
substantially increased<br />
their rate of growth by<br />
the time they turned 6<br />
years of age or exited<br />
the program.<br />
2) The percent of<br />
preschool children who<br />
were functioning<br />
within age expectations<br />
in each Outcome by the<br />
time they turned 6<br />
years of age or exited<br />
A) Positive Social -Emotional<br />
Skills*<br />
State<br />
Rate<br />
A) Positive Social -<br />
Emotional Skills<br />
(Including social<br />
relationships)<br />
State<br />
Rate<br />
2.14%<br />
5.31%<br />
25.97%<br />
38.22%<br />
28.36%<br />
State<br />
Target<br />
LEA<br />
Rate<br />
LEA<br />
Rate<br />
— —<br />
— —<br />
— —<br />
— —<br />
— —<br />
Target<br />
Met by<br />
LEA(Y/N)<br />
B) Acquisition and Use of<br />
Knowledge and Skills<br />
(Including early language/<br />
communication and early literacy)<br />
B) Acquisition and Use of<br />
Knowledge and Skills **<br />
State<br />
Rate<br />
1.75%<br />
6.59%<br />
34.23%<br />
43.51%<br />
13.92%<br />
State<br />
Target<br />
LEA<br />
Rate<br />
Target<br />
Met by<br />
LEA(Y/N)<br />
C) Use of Appropriate Behaviors<br />
to Meet Their Needs<br />
State<br />
Rate<br />
State<br />
Target<br />
LEA<br />
Rate<br />
Target<br />
Met by<br />
LEA(Y/N)<br />
89.61% 90.50% — — N/A 90.31% 90.50% — — N/A 90.82% 92.50% — — N/A<br />
66.58% 69.50% — — N/A 57.43% 60.50% — — N/A 76.69% 78.50% — — N/A<br />
NOTE: * Including social relationships ** Including early language/ communication and early literacy<br />
Note: - - denotes not applicable<br />
State<br />
Rate<br />
LEA<br />
Rate<br />
— —<br />
— —<br />
— —<br />
— —<br />
— —<br />
C) Use of<br />
Appropriate<br />
Behaviors to<br />
Meet Their Needs<br />
State<br />
Rate<br />
4.51%<br />
17.34%<br />
41.72%<br />
34.97%<br />
LEA<br />
Rate<br />
1.46% — —<br />
— —<br />
— —<br />
— —<br />
— —<br />
Page 3 of 5
LEA: 5303 - PERRYVILLE SCHOOL <strong>DISTRICT</strong><br />
Indicator 08: Parent Involvement<br />
Percent of surveyed<br />
parents who reported<br />
school facilitated parent<br />
involvement as a means<br />
of improving services<br />
and results for children<br />
with disabilities.<br />
Early Childhood<br />
(3-5)<br />
School Age<br />
(5-21)<br />
State<br />
Rate<br />
90.47%<br />
95.05%<br />
Indicator 09: Disproportionality - Eligibility<br />
Disproportionate representation of racial<br />
and ethnic groups in special education and<br />
related services that is a result of<br />
inappropriate identification (e.g.<br />
monitoring data, review of policies,<br />
practices, and procedures under 618(d),<br />
etc.).<br />
State<br />
Rate<br />
State<br />
Target<br />
88.00%<br />
96.00%<br />
State<br />
Target<br />
0.00% 0.00%<br />
LEA<br />
Rate<br />
— —<br />
95.79%<br />
Indicator 10: Disproportionality-Child with a Disability<br />
Disproportionate representation of racial<br />
and ethnic groups in specific disability<br />
categories that is a result of inappropriate<br />
identification (e.g. monitoring data, review<br />
of policies, practices, and procedures under<br />
618(d), etc.).<br />
Indicator 11: Child Find<br />
Percent of children with<br />
parental consent to evaluate<br />
who are evaluated within<br />
the State established timeline<br />
of 60 days.<br />
Overall<br />
(3-21)<br />
Early Childhood<br />
(3-5)<br />
School Age<br />
(5-21)<br />
State<br />
Rate<br />
0.00%<br />
Indicator 12: Early Childhood Transition<br />
Percent of children referred by Part C prior to<br />
age 3, who are found eligible for Part B, and<br />
who have an IEP developed and implemented<br />
by their third birthday.<br />
Note: - - denotes not applicable<br />
State<br />
Rate<br />
99.41%<br />
99.70%<br />
98.97%<br />
State<br />
Rate<br />
State<br />
Target<br />
0.00%<br />
State<br />
Target<br />
100.00%<br />
100.00%<br />
100.00%<br />
State<br />
Target<br />
Target Met by<br />
LEA (Y/N)<br />
Y<br />
Target Met by<br />
LEA (Y/N)<br />
Y<br />
LEA<br />
Rate<br />
100.00%<br />
— —<br />
100.00%<br />
LEA<br />
Rate<br />
Target Met by<br />
LEA (Y/N)<br />
N/A<br />
N<br />
Note: The target for Indicator 09 is to have zero percent<br />
(0%) of districts identified as having disproportionate<br />
representation as a result of inappropriate<br />
identification in eligibility.<br />
Note: The target for Indicator 10 is to have zero<br />
percent (0%) of districts identified as having<br />
disproportionate representation as a result of<br />
inappropriate identification in a disability<br />
category.<br />
Target Met by<br />
LEA (Y/N)<br />
N/A<br />
Y<br />
Target Met<br />
by LEA<br />
(Y/N)<br />
99.21% 100.00% - - N/A<br />
Y<br />
Note: * Indicates a zero reponse rate for the<br />
district.<br />
Page 4 of 5
LEA: 5303 - PERRYVILLE SCHOOL <strong>DISTRICT</strong><br />
Indicator 13: Secondary Transition<br />
Percent of youth with disabilities aged 16 and<br />
up with an IEP that includes coordinated,<br />
measurable, annual IEP goals and transition<br />
services that will reasonably enable the student<br />
to meet the post-secondary goals.<br />
Indicator 14: Post-School Outcomes<br />
A. Percent of youth enrolled in higher<br />
education within one year of leaving high<br />
school.<br />
State<br />
Rate<br />
State<br />
Target<br />
Note: Data for this Indicator is from the on-site monitoring of LEAs for the given year.<br />
B. Percent of youth enrolled in higher<br />
education or competitively employed<br />
within one year of leaving high school.<br />
C. Percent of youth enrolled in higher<br />
education or in some other postsecondary<br />
education or training program; or<br />
competitively employed or in some other<br />
employment within one year of leaving<br />
high school.<br />
State<br />
Rate<br />
Indicator 20: Reported Data-Timely and Accurate*<br />
District submitted<br />
required data elements<br />
on or before due dates;<br />
made revisions within<br />
the alloted reveiw<br />
periods.<br />
Accurate and Timely<br />
Data Submission<br />
Overall (3-21)<br />
Early Childhood (3-5)<br />
School Age (5-21)<br />
State<br />
Target<br />
100.00%<br />
100.00%<br />
100.00%<br />
State<br />
Target<br />
LEA<br />
Rate<br />
LEA<br />
Rate<br />
Target Met by<br />
LEA (Y/N)<br />
Target Met<br />
by LEA<br />
(Y/N)<br />
Target Met<br />
by LEA<br />
(Y/N)<br />
*Data reviewed for timely and accurate submissions included all APSCN cycle data except for personnel<br />
Note: - - denotes not applicable<br />
96.19 100.00 — — N/A<br />
14.53<br />
State<br />
Rate<br />
49.42<br />
State<br />
Rate<br />
54.07<br />
13.00<br />
State<br />
Target<br />
49.00<br />
State<br />
Target<br />
60.00<br />
Y<br />
N/A<br />
Y<br />
— —<br />
LEA<br />
Rate<br />
— —<br />
LEA<br />
Rate<br />
— —<br />
N/A<br />
Target Met<br />
by LEA<br />
(Y/N)<br />
N/A<br />
Target Met<br />
by LEA<br />
(Y/N)<br />
N/A<br />
Page 5 of 5
<strong>ARKANSAS</strong> <strong>SPECIAL</strong> <strong>EDUCATION</strong><br />
<strong>DISTRICT</strong> <strong>ANNUAL</strong> PERFORMANCE REPORT<br />
2010/11 School Year<br />
Publication Date: March 2012<br />
Each State must have in place a State Performance Plan (SPP) to evaluate the State's efforts to meet the requirements and<br />
purposes of the implementation of the Individuals with Disabilities Education Act (IDEA). The SPP is a six-year plan, which<br />
describes Arkansas's performance on 20 indicators. The Office of Special Education Programs in the U. S. Department of<br />
Education requires that States report annually to the public on the performance of each local education agency (LEA) on 14 of<br />
20 indicators as compared with targets established by the State in the SPP. Arkansas will report indicators 1 through 14 and<br />
20 for each LEA serving children with disabilities (CWD). Any LEA not meeting targets on compliance indicators (0% for<br />
Indicators 4B, 09 & 10 and 100% for Indicators 11, 12, 13, and 20) are non-compliant with IDEA.<br />
There are no report changes for the 2010/11 school year profile; However, it is important to recognize that: .<br />
1. Indicator 01 (Graduation) is reported a year in arrear (2009/10 graduates) and is based on a four-year cohort. This<br />
means the rate is a measure of students who entered in ninth grade and graduate in four years. The calculation is a<br />
requirement under Title I of the Elementary and Secondary Education Act (ESEA).<br />
2. Indicator 02 (Drop out) is reported a year in arrear. This means the rate is a measure of students who dropped out in<br />
the 2009/10 school year. The Indicator 02 data are aligned with the Common Core of Data (CCD) requirements for<br />
grades 7-12.<br />
3. Indicator 04A and 4B (Suspension/Expulsion) is reported a year in arrear. This means the rate is a measure of<br />
students who had out-of-school suspensions and/or expulsions totaling more than 10 days.<br />
For a complete description of all the Indicators, please visit the special education website at<br />
http://arksped.k12.ar.us/sections/policy.html<br />
LEA: 5401 - BARTON-LEXA SCHOOL <strong>DISTRICT</strong><br />
Indicator 01: Graduation Rates (2009/10 school year) Indicator 02: Dropout Rates (2009/10 school year)<br />
Percent of youth<br />
with IEPs<br />
graduating from<br />
high school with a<br />
regular diploma<br />
State<br />
Rate<br />
State<br />
Target<br />
75.76% 85.00%<br />
LEA<br />
Rate<br />
42.86%<br />
Target Met<br />
by LEA<br />
(Y/N)<br />
N<br />
Percent of<br />
youth with<br />
IEPs dropping<br />
out of high<br />
school<br />
State<br />
Rate<br />
Indicator 03: Assessment on Statewide Benchmark Exam (grades 3-8, 11)<br />
A) Adequate Yearly Progress<br />
n=40<br />
Literacy<br />
Mathematics<br />
Met Disability Subgroup "n"<br />
for Reporting Purposes (Y/N)<br />
State Target for % of Districts Meeting<br />
AYP for Disability Subgroup<br />
State<br />
Target<br />
3.06% 4.20%<br />
LEA<br />
Rate<br />
0.00%<br />
% of Districts Meeting AYP<br />
for Disability Subgroup<br />
Target Met by<br />
LEA (Y/N)<br />
Y<br />
Target Met by<br />
LEA(Y/N)<br />
Overall N 17.15% 6.25%<br />
NA<br />
N<br />
N<br />
Note: For a district to qualify as having a disability subgroup it must have a minimum of 40 (n=40) students with disabilities in a school building.<br />
B) Participation<br />
Participation Rate: # of<br />
CWD Tested ÷ # of CWD<br />
Enrolled in grades tested.<br />
Participation Rate: Literacy<br />
Participation Rate: Math<br />
Note: - - denotes not applicable<br />
State<br />
Rate<br />
98.78%<br />
State<br />
Target<br />
95.00%<br />
LEA<br />
Rate<br />
96.36%<br />
Target Met<br />
by LEA (Y/N)<br />
98.61% 95.00% 94.74% N<br />
Y<br />
C) Performance Proficiency<br />
Percent of CWD Scoring<br />
Proficient or Above<br />
Proficiency Rate: Literacy<br />
Proficiency Rate:<br />
Mathematics<br />
16.00%<br />
16.00%<br />
State<br />
Rate<br />
31.49%<br />
44.86%<br />
State<br />
Target<br />
45.22%<br />
51.14%<br />
LEA<br />
Rate<br />
27.45%<br />
28.85%<br />
NA<br />
NA<br />
Target<br />
Met by<br />
LEA (Y/N)<br />
N<br />
N<br />
Page 1 of 5
LEA: 5401 - BARTON-LEXA SCHOOL <strong>DISTRICT</strong><br />
Indicator 04: Out-of-School Suspensions and Expulsions (2009/10 school year)<br />
A) Suspension/Expulsion<br />
Percent difference of CWD with out-of- school suspensions and<br />
expulsions totaling greater than 10 days in a school year as<br />
compared to the same data for general education students in<br />
the district.<br />
B) Suspension/Expulsion by Race and Ethnicity<br />
Percent of districts that have: (a) a significant discrepancy, by race or<br />
ethnicity, in the rate of suspensions and expulsions of greater than 10<br />
days in a school year for children with IEPs; and (b) policies,<br />
procedures or practices that contribute to the significant discrepancy<br />
and do not comply with requirements relating to the development<br />
and implementation of IEPs, the use of positive behavioral<br />
interventions and supports, and procedural safeguards.<br />
Indicator 05: School Age (5-21) Least Restrictive Environment<br />
A) In the Regular Class 80% or more of the day<br />
Percent of CWD with<br />
IEPs receiving instruction<br />
in the regular class 80%<br />
or more of the day.<br />
State<br />
Rate<br />
State<br />
Target<br />
LEA<br />
Rate<br />
B) In the Regular Class less than 40% of the day<br />
Percent of CWD with<br />
IEPs receiving instruction<br />
in the regular class less<br />
than 60% of the day.<br />
53.87% 59.77%<br />
State<br />
Rate<br />
State<br />
Target<br />
12.42% 12.51%<br />
26.97%<br />
LEA<br />
Rate<br />
3.37%<br />
C) Other Settings outside the regular class<br />
Percent of CWD with IEPs served in<br />
public or private separate schools,<br />
residential placements, or<br />
homebound/hospital placements.<br />
State<br />
Rate<br />
State<br />
Target<br />
2.80% 2.56%<br />
Target Met<br />
by LEA (Y/N)<br />
N<br />
Target Met<br />
by LEA (Y/N)<br />
Y<br />
LEA<br />
Rate<br />
1.12%<br />
Target Met<br />
by LEA(Y/N)<br />
Indicator 06: Early Childhood (3-5) Least Restrictive Environment<br />
A) Regular Early Childhood Program<br />
Percent of children (aged 3 through 5) with IEPs attending a regular<br />
early childhood program and receiving the majority of special<br />
education and related services in the regular early childhood program<br />
Allowable<br />
Difference<br />
LEA: 5401 - BARTON-LEXA SCHOOL <strong>DISTRICT</strong><br />
Indicator 07: Preschool (3-5) Outcomes<br />
a) Percent of preschool CWD<br />
children who did not<br />
improve functioning.<br />
b) Percent of preschool CWD<br />
who improved but whose<br />
functioning remained below<br />
same age peers.<br />
c) Percent of preschool CWD<br />
who improved at a level<br />
nearer to same aged peers.<br />
d) Percent of preschool CWD<br />
who improved functioning to<br />
reach a level comparable to<br />
same age peers.<br />
e) Percent of preschool CWD<br />
children who maintain<br />
functioning at a level<br />
comparable to same aged<br />
peers.<br />
Summary<br />
Statements<br />
1) Of those preschool<br />
children who entered<br />
the preschool program<br />
below age expectations<br />
in each Outcome, the<br />
percent who<br />
substantially increased<br />
their rate of growth by<br />
the time they turned 6<br />
years of age or exited<br />
the program.<br />
2) The percent of<br />
preschool children who<br />
were functioning<br />
within age expectations<br />
in each Outcome by the<br />
time they turned 6<br />
years of age or exited<br />
A) Positive Social -Emotional<br />
Skills*<br />
State<br />
Rate<br />
A) Positive Social -<br />
Emotional Skills<br />
(Including social<br />
relationships)<br />
State<br />
Rate<br />
2.14%<br />
5.31%<br />
25.97%<br />
38.22%<br />
28.36%<br />
State<br />
Target<br />
LEA<br />
Rate<br />
LEA<br />
Rate<br />
— —<br />
— —<br />
— —<br />
— —<br />
— —<br />
Target<br />
Met by<br />
LEA(Y/N)<br />
B) Acquisition and Use of<br />
Knowledge and Skills<br />
(Including early language/<br />
communication and early literacy)<br />
B) Acquisition and Use of<br />
Knowledge and Skills **<br />
State<br />
Rate<br />
1.75%<br />
6.59%<br />
34.23%<br />
43.51%<br />
13.92%<br />
State<br />
Target<br />
LEA<br />
Rate<br />
Target<br />
Met by<br />
LEA(Y/N)<br />
C) Use of Appropriate Behaviors<br />
to Meet Their Needs<br />
State<br />
Rate<br />
State<br />
Target<br />
LEA<br />
Rate<br />
Target<br />
Met by<br />
LEA(Y/N)<br />
89.61% 90.50% — — N/A 90.31% 90.50% — — N/A 90.82% 92.50% — — N/A<br />
66.58% 69.50% — — N/A 57.43% 60.50% — — N/A 76.69% 78.50% — — N/A<br />
NOTE: * Including social relationships ** Including early language/ communication and early literacy<br />
Note: - - denotes not applicable<br />
State<br />
Rate<br />
LEA<br />
Rate<br />
— —<br />
— —<br />
— —<br />
— —<br />
— —<br />
C) Use of<br />
Appropriate<br />
Behaviors to<br />
Meet Their Needs<br />
State<br />
Rate<br />
4.51%<br />
17.34%<br />
41.72%<br />
34.97%<br />
LEA<br />
Rate<br />
1.46% — —<br />
— —<br />
— —<br />
— —<br />
— —<br />
Page 3 of 5
LEA: 5401 - BARTON-LEXA SCHOOL <strong>DISTRICT</strong><br />
Indicator 08: Parent Involvement<br />
Percent of surveyed<br />
parents who reported<br />
school facilitated parent<br />
involvement as a means<br />
of improving services<br />
and results for children<br />
with disabilities.<br />
Early Childhood<br />
(3-5)<br />
School Age<br />
(5-21)<br />
State<br />
Rate<br />
90.47%<br />
95.05%<br />
Indicator 09: Disproportionality - Eligibility<br />
Disproportionate representation of racial<br />
and ethnic groups in special education and<br />
related services that is a result of<br />
inappropriate identification (e.g.<br />
monitoring data, review of policies,<br />
practices, and procedures under 618(d),<br />
etc.).<br />
State<br />
Rate<br />
State<br />
Target<br />
88.00%<br />
96.00%<br />
State<br />
Target<br />
0.00% 0.00%<br />
LEA<br />
Rate<br />
— —<br />
— —<br />
Indicator 10: Disproportionality-Child with a Disability<br />
Disproportionate representation of racial<br />
and ethnic groups in specific disability<br />
categories that is a result of inappropriate<br />
identification (e.g. monitoring data, review<br />
of policies, practices, and procedures under<br />
618(d), etc.).<br />
Indicator 11: Child Find<br />
Percent of children with<br />
parental consent to evaluate<br />
who are evaluated within<br />
the State established timeline<br />
of 60 days.<br />
Overall<br />
(3-21)<br />
Early Childhood<br />
(3-5)<br />
School Age<br />
(5-21)<br />
State<br />
Rate<br />
0.00%<br />
Indicator 12: Early Childhood Transition<br />
Percent of children referred by Part C prior to<br />
age 3, who are found eligible for Part B, and<br />
who have an IEP developed and implemented<br />
by their third birthday.<br />
Note: - - denotes not applicable<br />
State<br />
Rate<br />
99.41%<br />
99.70%<br />
98.97%<br />
State<br />
Rate<br />
State<br />
Target<br />
0.00%<br />
State<br />
Target<br />
100.00%<br />
100.00%<br />
100.00%<br />
State<br />
Target<br />
Target Met by<br />
LEA (Y/N)<br />
Y<br />
Target Met by<br />
LEA (Y/N)<br />
Y<br />
LEA<br />
Rate<br />
100.00%<br />
— —<br />
100.00%<br />
LEA<br />
Rate<br />
Target Met by<br />
LEA (Y/N)<br />
N/A<br />
N<br />
Note: The target for Indicator 09 is to have zero percent<br />
(0%) of districts identified as having disproportionate<br />
representation as a result of inappropriate<br />
identification in eligibility.<br />
Note: The target for Indicator 10 is to have zero<br />
percent (0%) of districts identified as having<br />
disproportionate representation as a result of<br />
inappropriate identification in a disability<br />
category.<br />
Target Met by<br />
LEA (Y/N)<br />
N/A<br />
Y<br />
Target Met<br />
by LEA<br />
(Y/N)<br />
99.21% 100.00% - - N/A<br />
Y<br />
Note: * Indicates a zero reponse rate for the<br />
district.<br />
Page 4 of 5
LEA: 5401 - BARTON-LEXA SCHOOL <strong>DISTRICT</strong><br />
Indicator 13: Secondary Transition<br />
Percent of youth with disabilities aged 16 and<br />
up with an IEP that includes coordinated,<br />
measurable, annual IEP goals and transition<br />
services that will reasonably enable the student<br />
to meet the post-secondary goals.<br />
Indicator 14: Post-School Outcomes<br />
A. Percent of youth enrolled in higher<br />
education within one year of leaving high<br />
school.<br />
State<br />
Rate<br />
State<br />
Target<br />
Note: Data for this Indicator is from the on-site monitoring of LEAs for the given year.<br />
B. Percent of youth enrolled in higher<br />
education or competitively employed<br />
within one year of leaving high school.<br />
C. Percent of youth enrolled in higher<br />
education or in some other postsecondary<br />
education or training program; or<br />
competitively employed or in some other<br />
employment within one year of leaving<br />
high school.<br />
State<br />
Rate<br />
Indicator 20: Reported Data-Timely and Accurate*<br />
District submitted<br />
required data elements<br />
on or before due dates;<br />
made revisions within<br />
the alloted reveiw<br />
periods.<br />
Accurate and Timely<br />
Data Submission<br />
Overall (3-21)<br />
Early Childhood (3-5)<br />
School Age (5-21)<br />
State<br />
Target<br />
100.00%<br />
100.00%<br />
100.00%<br />
State<br />
Target<br />
LEA<br />
Rate<br />
LEA<br />
Rate<br />
Target Met by<br />
LEA (Y/N)<br />
Target Met<br />
by LEA<br />
(Y/N)<br />
Target Met<br />
by LEA<br />
(Y/N)<br />
*Data reviewed for timely and accurate submissions included all APSCN cycle data except for personnel<br />
Note: - - denotes not applicable<br />
96.19 100.00 — — N/A<br />
14.53<br />
State<br />
Rate<br />
49.42<br />
State<br />
Rate<br />
54.07<br />
13.00<br />
State<br />
Target<br />
49.00<br />
State<br />
Target<br />
60.00<br />
Y<br />
N/A<br />
Y<br />
0.00%<br />
LEA<br />
Rate<br />
0.00%<br />
LEA<br />
Rate<br />
0.00%<br />
N<br />
Target Met<br />
by LEA<br />
(Y/N)<br />
N<br />
Target Met<br />
by LEA<br />
(Y/N)<br />
N<br />
Page 5 of 5
<strong>ARKANSAS</strong> <strong>SPECIAL</strong> <strong>EDUCATION</strong><br />
<strong>DISTRICT</strong> <strong>ANNUAL</strong> PERFORMANCE REPORT<br />
2010/11 School Year<br />
Publication Date: March 2012<br />
Each State must have in place a State Performance Plan (SPP) to evaluate the State's efforts to meet the requirements and<br />
purposes of the implementation of the Individuals with Disabilities Education Act (IDEA). The SPP is a six-year plan, which<br />
describes Arkansas's performance on 20 indicators. The Office of Special Education Programs in the U. S. Department of<br />
Education requires that States report annually to the public on the performance of each local education agency (LEA) on 14 of<br />
20 indicators as compared with targets established by the State in the SPP. Arkansas will report indicators 1 through 14 and<br />
20 for each LEA serving children with disabilities (CWD). Any LEA not meeting targets on compliance indicators (0% for<br />
Indicators 4B, 09 & 10 and 100% for Indicators 11, 12, 13, and 20) are non-compliant with IDEA.<br />
There are no report changes for the 2010/11 school year profile; However, it is important to recognize that: .<br />
1. Indicator 01 (Graduation) is reported a year in arrear (2009/10 graduates) and is based on a four-year cohort. This<br />
means the rate is a measure of students who entered in ninth grade and graduate in four years. The calculation is a<br />
requirement under Title I of the Elementary and Secondary Education Act (ESEA).<br />
2. Indicator 02 (Drop out) is reported a year in arrear. This means the rate is a measure of students who dropped out in<br />
the 2009/10 school year. The Indicator 02 data are aligned with the Common Core of Data (CCD) requirements for<br />
grades 7-12.<br />
3. Indicator 04A and 4B (Suspension/Expulsion) is reported a year in arrear. This means the rate is a measure of<br />
students who had out-of-school suspensions and/or expulsions totaling more than 10 days.<br />
For a complete description of all the Indicators, please visit the special education website at<br />
http://arksped.k12.ar.us/sections/policy.html<br />
LEA: 5403 - HELENA/ W.HELENA SCHOOL <strong>DISTRICT</strong><br />
Indicator 01: Graduation Rates (2009/10 school year) Indicator 02: Dropout Rates (2009/10 school year)<br />
Percent of youth<br />
with IEPs<br />
graduating from<br />
high school with a<br />
regular diploma<br />
State<br />
Rate<br />
State<br />
Target<br />
75.76% 85.00%<br />
LEA<br />
Rate<br />
60.00%<br />
Target Met<br />
by LEA<br />
(Y/N)<br />
N<br />
Percent of<br />
youth with<br />
IEPs dropping<br />
out of high<br />
school<br />
State<br />
Rate<br />
Indicator 03: Assessment on Statewide Benchmark Exam (grades 3-8, 11)<br />
A) Adequate Yearly Progress<br />
n=40<br />
Literacy<br />
Mathematics<br />
Met Disability Subgroup "n"<br />
for Reporting Purposes (Y/N)<br />
State Target for % of Districts Meeting<br />
AYP for Disability Subgroup<br />
State<br />
Target<br />
3.06% 4.20%<br />
LEA<br />
Rate<br />
6.35%<br />
% of Districts Meeting AYP<br />
for Disability Subgroup<br />
Target Met by<br />
LEA (Y/N)<br />
N<br />
Target Met by<br />
LEA(Y/N)<br />
Overall N 17.15% 6.25%<br />
NA<br />
N<br />
N<br />
Note: For a district to qualify as having a disability subgroup it must have a minimum of 40 (n=40) students with disabilities in a school building.<br />
B) Participation<br />
Participation Rate: # of<br />
CWD Tested ÷ # of CWD<br />
Enrolled in grades tested.<br />
Participation Rate: Literacy<br />
Participation Rate: Math<br />
Note: - - denotes not applicable<br />
State<br />
Rate<br />
98.78%<br />
State<br />
Target<br />
95.00%<br />
LEA<br />
Rate<br />
97.54%<br />
Target Met<br />
by LEA (Y/N)<br />
98.61% 95.00% 97.83% Y<br />
Y<br />
C) Performance Proficiency<br />
Percent of CWD Scoring<br />
Proficient or Above<br />
Proficiency Rate: Literacy<br />
Proficiency Rate:<br />
Mathematics<br />
16.00%<br />
16.00%<br />
State<br />
Rate<br />
31.49%<br />
44.86%<br />
State<br />
Target<br />
45.22%<br />
51.14%<br />
LEA<br />
Rate<br />
15.32%<br />
23.44%<br />
NA<br />
NA<br />
Target<br />
Met by<br />
LEA (Y/N)<br />
N<br />
N<br />
Page 1 of 5
LEA: 5403 - HELENA/ W.HELENA SCHOOL <strong>DISTRICT</strong><br />
Indicator 04: Out-of-School Suspensions and Expulsions (2009/10 school year)<br />
A) Suspension/Expulsion<br />
Percent difference of CWD with out-of- school suspensions and<br />
expulsions totaling greater than 10 days in a school year as<br />
compared to the same data for general education students in<br />
the district.<br />
B) Suspension/Expulsion by Race and Ethnicity<br />
Percent of districts that have: (a) a significant discrepancy, by race or<br />
ethnicity, in the rate of suspensions and expulsions of greater than 10<br />
days in a school year for children with IEPs; and (b) policies,<br />
procedures or practices that contribute to the significant discrepancy<br />
and do not comply with requirements relating to the development<br />
and implementation of IEPs, the use of positive behavioral<br />
interventions and supports, and procedural safeguards.<br />
Indicator 05: School Age (5-21) Least Restrictive Environment<br />
A) In the Regular Class 80% or more of the day<br />
Percent of CWD with<br />
IEPs receiving instruction<br />
in the regular class 80%<br />
or more of the day.<br />
State<br />
Rate<br />
State<br />
Target<br />
LEA<br />
Rate<br />
B) In the Regular Class less than 40% of the day<br />
Percent of CWD with<br />
IEPs receiving instruction<br />
in the regular class less<br />
than 60% of the day.<br />
53.87% 59.77%<br />
State<br />
Rate<br />
State<br />
Target<br />
12.42% 12.51%<br />
45.70%<br />
LEA<br />
Rate<br />
19.00%<br />
C) Other Settings outside the regular class<br />
Percent of CWD with IEPs served in<br />
public or private separate schools,<br />
residential placements, or<br />
homebound/hospital placements.<br />
State<br />
Rate<br />
State<br />
Target<br />
2.80% 2.56%<br />
Target Met<br />
by LEA (Y/N)<br />
N<br />
Target Met<br />
by LEA (Y/N)<br />
N<br />
LEA<br />
Rate<br />
0.45%<br />
Target Met<br />
by LEA(Y/N)<br />
Indicator 06: Early Childhood (3-5) Least Restrictive Environment<br />
A) Regular Early Childhood Program<br />
Percent of children (aged 3 through 5) with IEPs attending a regular<br />
early childhood program and receiving the majority of special<br />
education and related services in the regular early childhood program<br />
Allowable<br />
Difference<br />
LEA: 5403 - HELENA/ W.HELENA SCHOOL <strong>DISTRICT</strong><br />
Indicator 07: Preschool (3-5) Outcomes<br />
a) Percent of preschool CWD<br />
children who did not<br />
improve functioning.<br />
b) Percent of preschool CWD<br />
who improved but whose<br />
functioning remained below<br />
same age peers.<br />
c) Percent of preschool CWD<br />
who improved at a level<br />
nearer to same aged peers.<br />
d) Percent of preschool CWD<br />
who improved functioning to<br />
reach a level comparable to<br />
same age peers.<br />
e) Percent of preschool CWD<br />
children who maintain<br />
functioning at a level<br />
comparable to same aged<br />
peers.<br />
Summary<br />
Statements<br />
1) Of those preschool<br />
children who entered<br />
the preschool program<br />
below age expectations<br />
in each Outcome, the<br />
percent who<br />
substantially increased<br />
their rate of growth by<br />
the time they turned 6<br />
years of age or exited<br />
the program.<br />
2) The percent of<br />
preschool children who<br />
were functioning<br />
within age expectations<br />
in each Outcome by the<br />
time they turned 6<br />
years of age or exited<br />
A) Positive Social -Emotional<br />
Skills*<br />
State<br />
Rate<br />
A) Positive Social -<br />
Emotional Skills<br />
(Including social<br />
relationships)<br />
State<br />
Rate<br />
2.14%<br />
5.31%<br />
25.97%<br />
38.22%<br />
28.36%<br />
State<br />
Target<br />
LEA<br />
Rate<br />
LEA<br />
Rate<br />
— —<br />
— —<br />
— —<br />
— —<br />
— —<br />
Target<br />
Met by<br />
LEA(Y/N)<br />
B) Acquisition and Use of<br />
Knowledge and Skills<br />
(Including early language/<br />
communication and early literacy)<br />
B) Acquisition and Use of<br />
Knowledge and Skills **<br />
State<br />
Rate<br />
1.75%<br />
6.59%<br />
34.23%<br />
43.51%<br />
13.92%<br />
State<br />
Target<br />
LEA<br />
Rate<br />
Target<br />
Met by<br />
LEA(Y/N)<br />
C) Use of Appropriate Behaviors<br />
to Meet Their Needs<br />
State<br />
Rate<br />
State<br />
Target<br />
LEA<br />
Rate<br />
Target<br />
Met by<br />
LEA(Y/N)<br />
89.61% 90.50% — — N/A 90.31% 90.50% — — N/A 90.82% 92.50% — — N/A<br />
66.58% 69.50% — — N/A 57.43% 60.50% — — N/A 76.69% 78.50% — — N/A<br />
NOTE: * Including social relationships ** Including early language/ communication and early literacy<br />
Note: - - denotes not applicable<br />
State<br />
Rate<br />
LEA<br />
Rate<br />
— —<br />
— —<br />
— —<br />
— —<br />
— —<br />
C) Use of<br />
Appropriate<br />
Behaviors to<br />
Meet Their Needs<br />
State<br />
Rate<br />
4.51%<br />
17.34%<br />
41.72%<br />
34.97%<br />
LEA<br />
Rate<br />
1.46% — —<br />
— —<br />
— —<br />
— —<br />
— —<br />
Page 3 of 5
LEA: 5403 - HELENA/ W.HELENA SCHOOL <strong>DISTRICT</strong><br />
Indicator 08: Parent Involvement<br />
Percent of surveyed<br />
parents who reported<br />
school facilitated parent<br />
involvement as a means<br />
of improving services<br />
and results for children<br />
with disabilities.<br />
Early Childhood<br />
(3-5)<br />
School Age<br />
(5-21)<br />
State<br />
Rate<br />
90.47%<br />
95.05%<br />
Indicator 09: Disproportionality - Eligibility<br />
Disproportionate representation of racial<br />
and ethnic groups in special education and<br />
related services that is a result of<br />
inappropriate identification (e.g.<br />
monitoring data, review of policies,<br />
practices, and procedures under 618(d),<br />
etc.).<br />
State<br />
Rate<br />
State<br />
Target<br />
88.00%<br />
96.00%<br />
State<br />
Target<br />
0.00% 0.00%<br />
LEA<br />
Rate<br />
— —<br />
95.90%<br />
Indicator 10: Disproportionality-Child with a Disability<br />
Disproportionate representation of racial<br />
and ethnic groups in specific disability<br />
categories that is a result of inappropriate<br />
identification (e.g. monitoring data, review<br />
of policies, practices, and procedures under<br />
618(d), etc.).<br />
Indicator 11: Child Find<br />
Percent of children with<br />
parental consent to evaluate<br />
who are evaluated within<br />
the State established timeline<br />
of 60 days.<br />
Overall<br />
(3-21)<br />
Early Childhood<br />
(3-5)<br />
School Age<br />
(5-21)<br />
State<br />
Rate<br />
0.00%<br />
Indicator 12: Early Childhood Transition<br />
Percent of children referred by Part C prior to<br />
age 3, who are found eligible for Part B, and<br />
who have an IEP developed and implemented<br />
by their third birthday.<br />
Note: - - denotes not applicable<br />
State<br />
Rate<br />
99.41%<br />
99.70%<br />
98.97%<br />
State<br />
Rate<br />
State<br />
Target<br />
0.00%<br />
State<br />
Target<br />
100.00%<br />
100.00%<br />
100.00%<br />
State<br />
Target<br />
Target Met by<br />
LEA (Y/N)<br />
Y<br />
Target Met by<br />
LEA (Y/N)<br />
Y<br />
LEA<br />
Rate<br />
100.00%<br />
— —<br />
100.00%<br />
LEA<br />
Rate<br />
Target Met by<br />
LEA (Y/N)<br />
N/A<br />
N<br />
Note: The target for Indicator 09 is to have zero percent<br />
(0%) of districts identified as having disproportionate<br />
representation as a result of inappropriate<br />
identification in eligibility.<br />
Note: The target for Indicator 10 is to have zero<br />
percent (0%) of districts identified as having<br />
disproportionate representation as a result of<br />
inappropriate identification in a disability<br />
category.<br />
Target Met by<br />
LEA (Y/N)<br />
N/A<br />
Y<br />
Target Met<br />
by LEA<br />
(Y/N)<br />
99.21% 100.00% - - N/A<br />
Y<br />
Note: * Indicates a zero reponse rate for the<br />
district.<br />
Page 4 of 5
LEA: 5403 - HELENA/ W.HELENA SCHOOL <strong>DISTRICT</strong><br />
Indicator 13: Secondary Transition<br />
Percent of youth with disabilities aged 16 and<br />
up with an IEP that includes coordinated,<br />
measurable, annual IEP goals and transition<br />
services that will reasonably enable the student<br />
to meet the post-secondary goals.<br />
Indicator 14: Post-School Outcomes<br />
A. Percent of youth enrolled in higher<br />
education within one year of leaving high<br />
school.<br />
State<br />
Rate<br />
State<br />
Target<br />
Note: Data for this Indicator is from the on-site monitoring of LEAs for the given year.<br />
B. Percent of youth enrolled in higher<br />
education or competitively employed<br />
within one year of leaving high school.<br />
C. Percent of youth enrolled in higher<br />
education or in some other postsecondary<br />
education or training program; or<br />
competitively employed or in some other<br />
employment within one year of leaving<br />
high school.<br />
State<br />
Rate<br />
Indicator 20: Reported Data-Timely and Accurate*<br />
District submitted<br />
required data elements<br />
on or before due dates;<br />
made revisions within<br />
the alloted reveiw<br />
periods.<br />
Accurate and Timely<br />
Data Submission<br />
Overall (3-21)<br />
Early Childhood (3-5)<br />
School Age (5-21)<br />
State<br />
Target<br />
100.00%<br />
100.00%<br />
100.00%<br />
State<br />
Target<br />
LEA<br />
Rate<br />
LEA<br />
Rate<br />
Target Met by<br />
LEA (Y/N)<br />
Target Met<br />
by LEA<br />
(Y/N)<br />
Target Met<br />
by LEA<br />
(Y/N)<br />
*Data reviewed for timely and accurate submissions included all APSCN cycle data except for personnel<br />
Note: - - denotes not applicable<br />
96.19 100.00 100.00% Y<br />
14.53<br />
State<br />
Rate<br />
49.42<br />
State<br />
Rate<br />
54.07<br />
13.00<br />
State<br />
Target<br />
49.00<br />
State<br />
Target<br />
60.00<br />
Y<br />
N/A<br />
Y<br />
— —<br />
LEA<br />
Rate<br />
— —<br />
LEA<br />
Rate<br />
— —<br />
N/A<br />
Target Met<br />
by LEA<br />
(Y/N)<br />
N/A<br />
Target Met<br />
by LEA<br />
(Y/N)<br />
N/A<br />
Page 5 of 5
LEA: 5404 - MARVELL SCHOOL <strong>DISTRICT</strong><br />
<strong>ARKANSAS</strong> <strong>SPECIAL</strong> <strong>EDUCATION</strong><br />
<strong>DISTRICT</strong> <strong>ANNUAL</strong> PERFORMANCE REPORT<br />
2010/11 School Year<br />
Publication Date: March 2012<br />
Each State must have in place a State Performance Plan (SPP) to evaluate the State's efforts to meet the requirements and<br />
purposes of the implementation of the Individuals with Disabilities Education Act (IDEA). The SPP is a six-year plan, which<br />
describes Arkansas's performance on 20 indicators. The Office of Special Education Programs in the U. S. Department of<br />
Education requires that States report annually to the public on the performance of each local education agency (LEA) on 14 of<br />
20 indicators as compared with targets established by the State in the SPP. Arkansas will report indicators 1 through 14 and<br />
20 for each LEA serving children with disabilities (CWD). Any LEA not meeting targets on compliance indicators (0% for<br />
Indicators 4B, 09 & 10 and 100% for Indicators 11, 12, 13, and 20) are non-compliant with IDEA.<br />
There are no report changes for the 2010/11 school year profile; However, it is important to recognize that: .<br />
1. Indicator 01 (Graduation) is reported a year in arrear (2009/10 graduates) and is based on a four-year cohort. This<br />
means the rate is a measure of students who entered in ninth grade and graduate in four years. The calculation is a<br />
requirement under Title I of the Elementary and Secondary Education Act (ESEA).<br />
2. Indicator 02 (Drop out) is reported a year in arrear. This means the rate is a measure of students who dropped out in<br />
the 2009/10 school year. The Indicator 02 data are aligned with the Common Core of Data (CCD) requirements for<br />
grades 7-12.<br />
3. Indicator 04A and 4B (Suspension/Expulsion) is reported a year in arrear. This means the rate is a measure of<br />
students who had out-of-school suspensions and/or expulsions totaling more than 10 days.<br />
Percent of youth<br />
with IEPs<br />
graduating from<br />
high school with a<br />
regular diploma<br />
For a complete description of all the Indicators, please visit the special education website at<br />
http://arksped.k12.ar.us/sections/policy.html<br />
Indicator 01: Graduation Rates (2009/10 school year) Indicator 02: Dropout Rates (2009/10 school year)<br />
State<br />
Rate<br />
State<br />
Target<br />
75.76% 85.00%<br />
LEA<br />
Rate<br />
58.33%<br />
Target Met<br />
by LEA<br />
(Y/N)<br />
N<br />
Percent of<br />
youth with<br />
IEPs dropping<br />
out of high<br />
school<br />
State<br />
Rate<br />
Indicator 03: Assessment on Statewide Benchmark Exam (grades 3-8, 11)<br />
A) Adequate Yearly Progress<br />
n=40<br />
Literacy<br />
Mathematics<br />
Met Disability Subgroup "n"<br />
for Reporting Purposes (Y/N)<br />
State Target for % of Districts Meeting<br />
AYP for Disability Subgroup<br />
State<br />
Target<br />
3.06% 4.20%<br />
LEA<br />
Rate<br />
9.76%<br />
% of Districts Meeting AYP<br />
for Disability Subgroup<br />
Target Met by<br />
LEA (Y/N)<br />
N<br />
Target Met by<br />
LEA(Y/N)<br />
Overall N 17.15% 6.25%<br />
NA<br />
N<br />
N<br />
Note: For a district to qualify as having a disability subgroup it must have a minimum of 40 (n=40) students with disabilities in a school building.<br />
B) Participation<br />
Participation Rate: # of<br />
CWD Tested ÷ # of CWD<br />
Enrolled in grades tested.<br />
Participation Rate: Literacy<br />
Participation Rate: Math<br />
Note: - - denotes not applicable<br />
State<br />
Rate<br />
98.78%<br />
State<br />
Target<br />
95.00%<br />
LEA<br />
Rate<br />
100.00%<br />
Target Met<br />
by LEA (Y/N)<br />
98.61% 95.00% 97.22% Y<br />
Y<br />
C) Performance Proficiency<br />
Percent of CWD Scoring<br />
Proficient or Above<br />
Proficiency Rate: Literacy<br />
Proficiency Rate:<br />
Mathematics<br />
16.00%<br />
16.00%<br />
State<br />
Rate<br />
31.49%<br />
44.86%<br />
State<br />
Target<br />
45.22%<br />
51.14%<br />
LEA<br />
Rate<br />
0.00%<br />
23.53%<br />
NA<br />
NA<br />
Target<br />
Met by<br />
LEA (Y/N)<br />
N<br />
N<br />
Page 1 of 5
LEA: 5404 - MARVELL SCHOOL <strong>DISTRICT</strong><br />
Indicator 04: Out-of-School Suspensions and Expulsions (2009/10 school year)<br />
A) Suspension/Expulsion<br />
Percent difference of CWD with out-of- school suspensions and<br />
expulsions totaling greater than 10 days in a school year as<br />
compared to the same data for general education students in<br />
the district.<br />
B) Suspension/Expulsion by Race and Ethnicity<br />
Percent of districts that have: (a) a significant discrepancy, by race or<br />
ethnicity, in the rate of suspensions and expulsions of greater than 10<br />
days in a school year for children with IEPs; and (b) policies,<br />
procedures or practices that contribute to the significant discrepancy<br />
and do not comply with requirements relating to the development<br />
and implementation of IEPs, the use of positive behavioral<br />
interventions and supports, and procedural safeguards.<br />
Indicator 05: School Age (5-21) Least Restrictive Environment<br />
A) In the Regular Class 80% or more of the day<br />
Percent of CWD with<br />
IEPs receiving instruction<br />
in the regular class 80%<br />
or more of the day.<br />
State<br />
Rate<br />
State<br />
Target<br />
LEA<br />
Rate<br />
B) In the Regular Class less than 40% of the day<br />
Percent of CWD with<br />
IEPs receiving instruction<br />
in the regular class less<br />
than 60% of the day.<br />
53.87% 59.77%<br />
State<br />
Rate<br />
State<br />
Target<br />
12.42% 12.51%<br />
19.61%<br />
LEA<br />
Rate<br />
0.00%<br />
C) Other Settings outside the regular class<br />
Percent of CWD with IEPs served in<br />
public or private separate schools,<br />
residential placements, or<br />
homebound/hospital placements.<br />
State<br />
Rate<br />
State<br />
Target<br />
2.80% 2.56%<br />
Target Met<br />
by LEA (Y/N)<br />
N<br />
Target Met<br />
by LEA (Y/N)<br />
Y<br />
LEA<br />
Rate<br />
3.92%<br />
Target Met<br />
by LEA(Y/N)<br />
Indicator 06: Early Childhood (3-5) Least Restrictive Environment<br />
A) Regular Early Childhood Program<br />
Percent of children (aged 3 through 5) with IEPs attending a regular<br />
early childhood program and receiving the majority of special<br />
education and related services in the regular early childhood program<br />
Allowable<br />
Difference<br />
LEA: 5404 - MARVELL SCHOOL <strong>DISTRICT</strong><br />
Indicator 07: Preschool (3-5) Outcomes<br />
a) Percent of preschool CWD<br />
children who did not<br />
improve functioning.<br />
b) Percent of preschool CWD<br />
who improved but whose<br />
functioning remained below<br />
same age peers.<br />
c) Percent of preschool CWD<br />
who improved at a level<br />
nearer to same aged peers.<br />
d) Percent of preschool CWD<br />
who improved functioning to<br />
reach a level comparable to<br />
same age peers.<br />
e) Percent of preschool CWD<br />
children who maintain<br />
functioning at a level<br />
comparable to same aged<br />
peers.<br />
Summary<br />
Statements<br />
1) Of those preschool<br />
children who entered<br />
the preschool program<br />
below age expectations<br />
in each Outcome, the<br />
percent who<br />
substantially increased<br />
their rate of growth by<br />
the time they turned 6<br />
years of age or exited<br />
the program.<br />
2) The percent of<br />
preschool children who<br />
were functioning<br />
within age expectations<br />
in each Outcome by the<br />
time they turned 6<br />
years of age or exited<br />
A) Positive Social -Emotional<br />
Skills*<br />
State<br />
Rate<br />
A) Positive Social -<br />
Emotional Skills<br />
(Including social<br />
relationships)<br />
State<br />
Rate<br />
2.14%<br />
5.31%<br />
25.97%<br />
38.22%<br />
28.36%<br />
State<br />
Target<br />
LEA<br />
Rate<br />
LEA<br />
Rate<br />
— —<br />
— —<br />
— —<br />
— —<br />
— —<br />
Target<br />
Met by<br />
LEA(Y/N)<br />
B) Acquisition and Use of<br />
Knowledge and Skills<br />
(Including early language/<br />
communication and early literacy)<br />
B) Acquisition and Use of<br />
Knowledge and Skills **<br />
State<br />
Rate<br />
1.75%<br />
6.59%<br />
34.23%<br />
43.51%<br />
13.92%<br />
State<br />
Target<br />
LEA<br />
Rate<br />
Target<br />
Met by<br />
LEA(Y/N)<br />
C) Use of Appropriate Behaviors<br />
to Meet Their Needs<br />
State<br />
Rate<br />
State<br />
Target<br />
LEA<br />
Rate<br />
Target<br />
Met by<br />
LEA(Y/N)<br />
89.61% 90.50% — — N/A 90.31% 90.50% — — N/A 90.82% 92.50% — — N/A<br />
66.58% 69.50% — — N/A 57.43% 60.50% — — N/A 76.69% 78.50% — — N/A<br />
NOTE: * Including social relationships ** Including early language/ communication and early literacy<br />
Note: - - denotes not applicable<br />
State<br />
Rate<br />
LEA<br />
Rate<br />
— —<br />
— —<br />
— —<br />
— —<br />
— —<br />
C) Use of<br />
Appropriate<br />
Behaviors to<br />
Meet Their Needs<br />
State<br />
Rate<br />
4.51%<br />
17.34%<br />
41.72%<br />
34.97%<br />
LEA<br />
Rate<br />
1.46% — —<br />
— —<br />
— —<br />
— —<br />
— —<br />
Page 3 of 5
LEA: 5404 - MARVELL SCHOOL <strong>DISTRICT</strong><br />
Indicator 08: Parent Involvement<br />
Percent of surveyed<br />
parents who reported<br />
school facilitated parent<br />
involvement as a means<br />
of improving services<br />
and results for children<br />
with disabilities.<br />
Early Childhood<br />
(3-5)<br />
School Age<br />
(5-21)<br />
State<br />
Rate<br />
90.47%<br />
95.05%<br />
Indicator 09: Disproportionality - Eligibility<br />
Disproportionate representation of racial<br />
and ethnic groups in special education and<br />
related services that is a result of<br />
inappropriate identification (e.g.<br />
monitoring data, review of policies,<br />
practices, and procedures under 618(d),<br />
etc.).<br />
State<br />
Rate<br />
State<br />
Target<br />
88.00%<br />
96.00%<br />
State<br />
Target<br />
0.00% 0.00%<br />
LEA<br />
Rate<br />
— —<br />
100.00%<br />
Indicator 10: Disproportionality-Child with a Disability<br />
Disproportionate representation of racial<br />
and ethnic groups in specific disability<br />
categories that is a result of inappropriate<br />
identification (e.g. monitoring data, review<br />
of policies, practices, and procedures under<br />
618(d), etc.).<br />
Indicator 11: Child Find<br />
Percent of children with<br />
parental consent to evaluate<br />
who are evaluated within<br />
the State established timeline<br />
of 60 days.<br />
Overall<br />
(3-21)<br />
Early Childhood<br />
(3-5)<br />
School Age<br />
(5-21)<br />
State<br />
Rate<br />
0.00%<br />
Indicator 12: Early Childhood Transition<br />
Percent of children referred by Part C prior to<br />
age 3, who are found eligible for Part B, and<br />
who have an IEP developed and implemented<br />
by their third birthday.<br />
Note: - - denotes not applicable<br />
State<br />
Rate<br />
99.41%<br />
99.70%<br />
98.97%<br />
State<br />
Rate<br />
State<br />
Target<br />
0.00%<br />
State<br />
Target<br />
100.00%<br />
100.00%<br />
100.00%<br />
State<br />
Target<br />
Target Met by<br />
LEA (Y/N)<br />
Y<br />
Target Met by<br />
LEA (Y/N)<br />
Y<br />
LEA<br />
Rate<br />
100.00%<br />
— —<br />
100.00%<br />
LEA<br />
Rate<br />
Target Met by<br />
LEA (Y/N)<br />
N/A<br />
Y<br />
Note: The target for Indicator 09 is to have zero percent<br />
(0%) of districts identified as having disproportionate<br />
representation as a result of inappropriate<br />
identification in eligibility.<br />
Note: The target for Indicator 10 is to have zero<br />
percent (0%) of districts identified as having<br />
disproportionate representation as a result of<br />
inappropriate identification in a disability<br />
category.<br />
Target Met by<br />
LEA (Y/N)<br />
N/A<br />
Y<br />
Target Met<br />
by LEA<br />
(Y/N)<br />
99.21% 100.00% - - N/A<br />
Y<br />
Note: * Indicates a zero reponse rate for the<br />
district.<br />
Page 4 of 5
LEA: 5404 - MARVELL SCHOOL <strong>DISTRICT</strong><br />
Indicator 13: Secondary Transition<br />
Percent of youth with disabilities aged 16 and<br />
up with an IEP that includes coordinated,<br />
measurable, annual IEP goals and transition<br />
services that will reasonably enable the student<br />
to meet the post-secondary goals.<br />
Indicator 14: Post-School Outcomes<br />
A. Percent of youth enrolled in higher<br />
education within one year of leaving high<br />
school.<br />
State<br />
Rate<br />
State<br />
Target<br />
Note: Data for this Indicator is from the on-site monitoring of LEAs for the given year.<br />
B. Percent of youth enrolled in higher<br />
education or competitively employed<br />
within one year of leaving high school.<br />
C. Percent of youth enrolled in higher<br />
education or in some other postsecondary<br />
education or training program; or<br />
competitively employed or in some other<br />
employment within one year of leaving<br />
high school.<br />
State<br />
Rate<br />
Indicator 20: Reported Data-Timely and Accurate*<br />
District submitted<br />
required data elements<br />
on or before due dates;<br />
made revisions within<br />
the alloted reveiw<br />
periods.<br />
Accurate and Timely<br />
Data Submission<br />
Overall (3-21)<br />
Early Childhood (3-5)<br />
School Age (5-21)<br />
State<br />
Target<br />
100.00%<br />
100.00%<br />
100.00%<br />
State<br />
Target<br />
LEA<br />
Rate<br />
LEA<br />
Rate<br />
Target Met by<br />
LEA (Y/N)<br />
Target Met<br />
by LEA<br />
(Y/N)<br />
Target Met<br />
by LEA<br />
(Y/N)<br />
*Data reviewed for timely and accurate submissions included all APSCN cycle data except for personnel<br />
Note: - - denotes not applicable<br />
96.19 100.00 — — N/A<br />
14.53<br />
State<br />
Rate<br />
49.42<br />
State<br />
Rate<br />
54.07<br />
13.00<br />
State<br />
Target<br />
49.00<br />
State<br />
Target<br />
60.00<br />
Y<br />
N/A<br />
Y<br />
— —<br />
LEA<br />
Rate<br />
— —<br />
LEA<br />
Rate<br />
— —<br />
N/A<br />
Target Met<br />
by LEA<br />
(Y/N)<br />
N/A<br />
Target Met<br />
by LEA<br />
(Y/N)<br />
N/A<br />
Page 5 of 5
LEA: 5420 - GREAT RIVERS CO-OP<br />
<strong>ARKANSAS</strong> <strong>SPECIAL</strong> <strong>EDUCATION</strong><br />
<strong>DISTRICT</strong> <strong>ANNUAL</strong> PERFORMANCE REPORT<br />
2010/11 School Year<br />
Publication Date: March 2012<br />
Each State must have in place a State Performance Plan (SPP) to evaluate the State's efforts to meet the requirements and<br />
purposes of the implementation of the Individuals with Disabilities Education Act (IDEA). The SPP is a six-year plan, which<br />
describes Arkansas's performance on 20 indicators. The Office of Special Education Programs in the U. S. Department of<br />
Education requires that States report annually to the public on the performance of each local education agency (LEA) on 14 of<br />
20 indicators as compared with targets established by the State in the SPP. Arkansas will report indicators 1 through 14 and<br />
20 for each LEA serving children with disabilities (CWD). Any LEA not meeting targets on compliance indicators (0% for<br />
Indicators 4B, 09 & 10 and 100% for Indicators 11, 12, 13, and 20) are non-compliant with IDEA.<br />
There are no report changes for the 2010/11 school year profile; However, it is important to recognize that: .<br />
1. Indicator 01 (Graduation) is reported a year in arrear (2009/10 graduates) and is based on a four-year cohort. This<br />
means the rate is a measure of students who entered in ninth grade and graduate in four years. The calculation is a<br />
requirement under Title I of the Elementary and Secondary Education Act (ESEA).<br />
2. Indicator 02 (Drop out) is reported a year in arrear. This means the rate is a measure of students who dropped out in<br />
the 2009/10 school year. The Indicator 02 data are aligned with the Common Core of Data (CCD) requirements for<br />
grades 7-12.<br />
3. Indicator 04A and 4B (Suspension/Expulsion) is reported a year in arrear. This means the rate is a measure of<br />
students who had out-of-school suspensions and/or expulsions totaling more than 10 days.<br />
Percent of youth<br />
with IEPs<br />
graduating from<br />
high school with a<br />
regular diploma<br />
For a complete description of all the Indicators, please visit the special education website at<br />
http://arksped.k12.ar.us/sections/policy.html<br />
Indicator 01: Graduation Rates (2009/10 school year) Indicator 02: Dropout Rates (2009/10 school year)<br />
State<br />
Rate<br />
State<br />
Target<br />
75.76% 85.00%<br />
LEA<br />
Rate<br />
— —<br />
Target Met<br />
by LEA<br />
(Y/N)<br />
NA<br />
Percent of<br />
youth with<br />
IEPs dropping<br />
out of high<br />
school<br />
State<br />
Rate<br />
Indicator 03: Assessment on Statewide Benchmark Exam (grades 3-8, 11)<br />
A) Adequate Yearly Progress<br />
n=40<br />
Literacy<br />
Mathematics<br />
Met Disability Subgroup "n"<br />
for Reporting Purposes (Y/N)<br />
State Target for % of Districts Meeting<br />
AYP for Disability Subgroup<br />
State<br />
Target<br />
3.06% 4.20%<br />
LEA<br />
Rate<br />
— —<br />
% of Districts Meeting AYP<br />
for Disability Subgroup<br />
Target Met by<br />
LEA (Y/N)<br />
N/A<br />
Target Met by<br />
LEA(Y/N)<br />
Overall N/A 17.15% 6.25%<br />
N/A<br />
N/A<br />
N/A<br />
Note: For a district to qualify as having a disability subgroup it must have a minimum of 40 (n=40) students with disabilities in a school building.<br />
B) Participation<br />
Participation Rate: # of<br />
CWD Tested ÷ # of CWD<br />
Enrolled in grades tested.<br />
Participation Rate: Literacy<br />
Participation Rate: Math<br />
Note: - - denotes not applicable<br />
State<br />
Rate<br />
98.78%<br />
State<br />
Target<br />
95.00%<br />
LEA<br />
Rate<br />
— —<br />
Target Met<br />
by LEA (Y/N)<br />
N/A<br />
98.61% 95.00% — — N/A<br />
C) Performance Proficiency<br />
Percent of CWD Scoring<br />
Proficient or Above<br />
Proficiency Rate: Literacy<br />
Proficiency Rate:<br />
Mathematics<br />
16.00%<br />
16.00%<br />
State<br />
Rate<br />
31.49%<br />
44.86%<br />
State<br />
Target<br />
45.22%<br />
51.14%<br />
LEA<br />
Rate<br />
— —<br />
— —<br />
N/A<br />
N/A<br />
Target<br />
Met by<br />
LEA (Y/N)<br />
N/A<br />
N/A<br />
Page 1 of 5
LEA: 5420 - GREAT RIVERS CO-OP<br />
Indicator 04: Out-of-School Suspensions and Expulsions (2009/10 school year)<br />
A) Suspension/Expulsion<br />
Percent difference of CWD with out-of- school suspensions and<br />
expulsions totaling greater than 10 days in a school year as<br />
compared to the same data for general education students in<br />
the district.<br />
B) Suspension/Expulsion by Race and Ethnicity<br />
Percent of districts that have: (a) a significant discrepancy, by race or<br />
ethnicity, in the rate of suspensions and expulsions of greater than 10<br />
days in a school year for children with IEPs; and (b) policies,<br />
procedures or practices that contribute to the significant discrepancy<br />
and do not comply with requirements relating to the development<br />
and implementation of IEPs, the use of positive behavioral<br />
interventions and supports, and procedural safeguards.<br />
Indicator 05: School Age (5-21) Least Restrictive Environment<br />
A) In the Regular Class 80% or more of the day<br />
Percent of CWD with<br />
IEPs receiving instruction<br />
in the regular class 80%<br />
or more of the day.<br />
State<br />
Rate<br />
State<br />
Target<br />
LEA<br />
Rate<br />
B) In the Regular Class less than 40% of the day<br />
Percent of CWD with<br />
IEPs receiving instruction<br />
in the regular class less<br />
than 60% of the day.<br />
53.87% 59.77%<br />
State<br />
Rate<br />
State<br />
Target<br />
12.42% 12.51%<br />
— —<br />
LEA<br />
Rate<br />
— —<br />
C) Other Settings outside the regular class<br />
Percent of CWD with IEPs served in<br />
public or private separate schools,<br />
residential placements, or<br />
homebound/hospital placements.<br />
State<br />
Rate<br />
State<br />
Target<br />
2.80% 2.56%<br />
Target Met<br />
by LEA (Y/N)<br />
N/A<br />
Target Met<br />
by LEA (Y/N)<br />
N/A<br />
LEA<br />
Rate<br />
— —<br />
Target Met<br />
by LEA(Y/N)<br />
N/A<br />
Indicator 06: Early Childhood (3-5) Least Restrictive Environment<br />
A) Regular Early Childhood Program<br />
Percent of children (aged 3 through 5) with IEPs attending a regular<br />
early childhood program and receiving the majority of special<br />
education and related services in the regular early childhood program<br />
Allowable<br />
Difference<br />
LEA: 5420 - GREAT RIVERS CO-OP<br />
Indicator 07: Preschool (3-5) Outcomes<br />
a) Percent of preschool CWD<br />
children who did not<br />
improve functioning.<br />
b) Percent of preschool CWD<br />
who improved but whose<br />
functioning remained below<br />
same age peers.<br />
c) Percent of preschool CWD<br />
who improved at a level<br />
nearer to same aged peers.<br />
d) Percent of preschool CWD<br />
who improved functioning to<br />
reach a level comparable to<br />
same age peers.<br />
e) Percent of preschool CWD<br />
children who maintain<br />
functioning at a level<br />
comparable to same aged<br />
peers.<br />
Summary<br />
Statements<br />
1) Of those preschool<br />
children who entered<br />
the preschool program<br />
below age expectations<br />
in each Outcome, the<br />
percent who<br />
substantially increased<br />
their rate of growth by<br />
the time they turned 6<br />
years of age or exited<br />
the program.<br />
2) The percent of<br />
preschool children who<br />
were functioning<br />
within age expectations<br />
in each Outcome by the<br />
time they turned 6<br />
years of age or exited<br />
A) Positive Social -Emotional<br />
Skills*<br />
State<br />
Rate<br />
A) Positive Social -<br />
Emotional Skills<br />
(Including social<br />
relationships)<br />
State<br />
Rate<br />
2.14%<br />
5.31%<br />
25.97%<br />
38.22%<br />
28.36%<br />
State<br />
Target<br />
LEA<br />
Rate<br />
LEA<br />
Rate<br />
1.84%<br />
0.74%<br />
15.07%<br />
50.37%<br />
31.99%<br />
Target<br />
Met by<br />
LEA(Y/N)<br />
B) Acquisition and Use of<br />
Knowledge and Skills<br />
(Including early language/<br />
communication and early literacy)<br />
B) Acquisition and Use of<br />
Knowledge and Skills **<br />
State<br />
Rate<br />
1.75%<br />
6.59%<br />
34.23%<br />
43.51%<br />
13.92%<br />
State<br />
Target<br />
LEA<br />
Rate<br />
Target<br />
Met by<br />
LEA(Y/N)<br />
C) Use of Appropriate Behaviors<br />
to Meet Their Needs<br />
State<br />
Rate<br />
State<br />
Target<br />
LEA<br />
Rate<br />
Target<br />
Met by<br />
LEA(Y/N)<br />
89.61% 90.50% 96.22% Y 90.31% 90.50% 93.04% Y 90.82% 92.50% 96.45% Y<br />
66.58% 69.50% 82.35% Y 57.43% 60.50% 70.22% Y 76.69% 78.50% 92.28% Y<br />
NOTE: * Including social relationships ** Including early language/ communication and early literacy<br />
Note: - - denotes not applicable<br />
State<br />
Rate<br />
LEA<br />
Rate<br />
4.41%<br />
1.47%<br />
23.90%<br />
54.78%<br />
15.44%<br />
C) Use of<br />
Appropriate<br />
Behaviors to<br />
Meet Their Needs<br />
State<br />
Rate<br />
4.51%<br />
17.34%<br />
41.72%<br />
34.97%<br />
LEA<br />
Rate<br />
1.46% 1.84%<br />
0.37%<br />
5.51%<br />
54.41%<br />
37.87%<br />
Page 3 of 5
LEA: 5420 - GREAT RIVERS CO-OP<br />
Indicator 08: Parent Involvement<br />
Percent of surveyed<br />
parents who reported<br />
school facilitated parent<br />
involvement as a means<br />
of improving services<br />
and results for children<br />
with disabilities.<br />
Early Childhood<br />
(3-5)<br />
School Age<br />
(5-21)<br />
State<br />
Rate<br />
90.47%<br />
95.05%<br />
Indicator 09: Disproportionality - Eligibility<br />
Disproportionate representation of racial<br />
and ethnic groups in special education and<br />
related services that is a result of<br />
inappropriate identification (e.g.<br />
monitoring data, review of policies,<br />
practices, and procedures under 618(d),<br />
etc.).<br />
State<br />
Rate<br />
State<br />
Target<br />
88.00%<br />
96.00%<br />
State<br />
Target<br />
0.00% 0.00%<br />
LEA<br />
Rate<br />
68.42%<br />
— —<br />
Indicator 10: Disproportionality-Child with a Disability<br />
Disproportionate representation of racial<br />
and ethnic groups in specific disability<br />
categories that is a result of inappropriate<br />
identification (e.g. monitoring data, review<br />
of policies, practices, and procedures under<br />
618(d), etc.).<br />
Indicator 11: Child Find<br />
Percent of children with<br />
parental consent to evaluate<br />
who are evaluated within<br />
the State established timeline<br />
of 60 days.<br />
Overall<br />
(3-21)<br />
Early Childhood<br />
(3-5)<br />
School Age<br />
(5-21)<br />
State<br />
Rate<br />
0.00%<br />
Indicator 12: Early Childhood Transition<br />
Percent of children referred by Part C prior to<br />
age 3, who are found eligible for Part B, and<br />
who have an IEP developed and implemented<br />
by their third birthday.<br />
Note: - - denotes not applicable<br />
State<br />
Rate<br />
99.41%<br />
99.70%<br />
98.97%<br />
State<br />
Rate<br />
State<br />
Target<br />
0.00%<br />
State<br />
Target<br />
100.00%<br />
100.00%<br />
100.00%<br />
State<br />
Target<br />
Target Met by<br />
LEA (Y/N)<br />
N/A<br />
Target Met by<br />
LEA (Y/N)<br />
N/A<br />
LEA<br />
Rate<br />
99.84%<br />
99.84%<br />
— —<br />
LEA<br />
Rate<br />
Target Met by<br />
LEA (Y/N)<br />
N<br />
N/A<br />
Note: The target for Indicator 09 is to have zero percent<br />
(0%) of districts identified as having disproportionate<br />
representation as a result of inappropriate<br />
identification in eligibility.<br />
Note: The target for Indicator 10 is to have zero<br />
percent (0%) of districts identified as having<br />
disproportionate representation as a result of<br />
inappropriate identification in a disability<br />
category.<br />
Target Met by<br />
LEA (Y/N)<br />
N<br />
N/A<br />
Target Met<br />
by LEA<br />
(Y/N)<br />
99.21% 100.00% - - N/A<br />
N<br />
Note: * Indicates a zero reponse rate for the<br />
district.<br />
Page 4 of 5
LEA: 5420 - GREAT RIVERS CO-OP<br />
Indicator 13: Secondary Transition<br />
Percent of youth with disabilities aged 16 and<br />
up with an IEP that includes coordinated,<br />
measurable, annual IEP goals and transition<br />
services that will reasonably enable the student<br />
to meet the post-secondary goals.<br />
Indicator 14: Post-School Outcomes<br />
A. Percent of youth enrolled in higher<br />
education within one year of leaving high<br />
school.<br />
State<br />
Rate<br />
State<br />
Target<br />
Note: Data for this Indicator is from the on-site monitoring of LEAs for the given year.<br />
B. Percent of youth enrolled in higher<br />
education or competitively employed<br />
within one year of leaving high school.<br />
C. Percent of youth enrolled in higher<br />
education or in some other postsecondary<br />
education or training program; or<br />
competitively employed or in some other<br />
employment within one year of leaving<br />
high school.<br />
State<br />
Rate<br />
Indicator 20: Reported Data-Timely and Accurate*<br />
District submitted<br />
required data elements<br />
on or before due dates;<br />
made revisions within<br />
the alloted reveiw<br />
periods.<br />
Accurate and Timely<br />
Data Submission<br />
Overall (3-21)<br />
Early Childhood (3-5)<br />
School Age (5-21)<br />
State<br />
Target<br />
100.00%<br />
100.00%<br />
100.00%<br />
State<br />
Target<br />
LEA<br />
Rate<br />
LEA<br />
Rate<br />
Target Met by<br />
LEA (Y/N)<br />
Target Met<br />
by LEA<br />
(Y/N)<br />
Target Met<br />
by LEA<br />
(Y/N)<br />
*Data reviewed for timely and accurate submissions included all APSCN cycle data except for personnel<br />
Note: - - denotes not applicable<br />
96.19 100.00 — — N/A<br />
14.53<br />
State<br />
Rate<br />
49.42<br />
State<br />
Rate<br />
54.07<br />
13.00<br />
State<br />
Target<br />
49.00<br />
State<br />
Target<br />
60.00<br />
Y<br />
Y<br />
N/A<br />
— —<br />
LEA<br />
Rate<br />
— —<br />
LEA<br />
Rate<br />
— —<br />
N/A<br />
Target Met<br />
by LEA<br />
(Y/N)<br />
N/A<br />
Target Met<br />
by LEA<br />
(Y/N)<br />
N/A<br />
Page 5 of 5
<strong>ARKANSAS</strong> <strong>SPECIAL</strong> <strong>EDUCATION</strong><br />
<strong>DISTRICT</strong> <strong>ANNUAL</strong> PERFORMANCE REPORT<br />
2010/11 School Year<br />
Publication Date: March 2012<br />
Each State must have in place a State Performance Plan (SPP) to evaluate the State's efforts to meet the requirements and<br />
purposes of the implementation of the Individuals with Disabilities Education Act (IDEA). The SPP is a six-year plan, which<br />
describes Arkansas's performance on 20 indicators. The Office of Special Education Programs in the U. S. Department of<br />
Education requires that States report annually to the public on the performance of each local education agency (LEA) on 14 of<br />
20 indicators as compared with targets established by the State in the SPP. Arkansas will report indicators 1 through 14 and<br />
20 for each LEA serving children with disabilities (CWD). Any LEA not meeting targets on compliance indicators (0% for<br />
Indicators 4B, 09 & 10 and 100% for Indicators 11, 12, 13, and 20) are non-compliant with IDEA.<br />
There are no report changes for the 2010/11 school year profile; However, it is important to recognize that: .<br />
1. Indicator 01 (Graduation) is reported a year in arrear (2009/10 graduates) and is based on a four-year cohort. This<br />
means the rate is a measure of students who entered in ninth grade and graduate in four years. The calculation is a<br />
requirement under Title I of the Elementary and Secondary Education Act (ESEA).<br />
2. Indicator 02 (Drop out) is reported a year in arrear. This means the rate is a measure of students who dropped out in<br />
the 2009/10 school year. The Indicator 02 data are aligned with the Common Core of Data (CCD) requirements for<br />
grades 7-12.<br />
3. Indicator 04A and 4B (Suspension/Expulsion) is reported a year in arrear. This means the rate is a measure of<br />
students who had out-of-school suspensions and/or expulsions totaling more than 10 days.<br />
For a complete description of all the Indicators, please visit the special education website at<br />
http://arksped.k12.ar.us/sections/policy.html<br />
LEA: 5440 - KIPP: DELTA COLLEGE PREP SCHOOL<br />
Indicator 01: Graduation Rates (2009/10 school year) Indicator 02: Dropout Rates (2009/10 school year)<br />
Percent of youth<br />
with IEPs<br />
graduating from<br />
high school with a<br />
regular diploma<br />
State<br />
Rate<br />
State<br />
Target<br />
75.76% 85.00%<br />
LEA<br />
Rate<br />
100.00%<br />
Target Met<br />
by LEA<br />
(Y/N)<br />
Y<br />
Percent of<br />
youth with<br />
IEPs dropping<br />
out of high<br />
school<br />
State<br />
Rate<br />
Indicator 03: Assessment on Statewide Benchmark Exam (grades 3-8, 11)<br />
A) Adequate Yearly Progress<br />
n=40<br />
Literacy<br />
Mathematics<br />
Met Disability Subgroup "n"<br />
for Reporting Purposes (Y/N)<br />
State Target for % of Districts Meeting<br />
AYP for Disability Subgroup<br />
State<br />
Target<br />
3.06% 4.20%<br />
LEA<br />
Rate<br />
0.00%<br />
% of Districts Meeting AYP<br />
for Disability Subgroup<br />
Target Met by<br />
LEA (Y/N)<br />
Y<br />
Target Met by<br />
LEA(Y/N)<br />
Overall N 17.15% 6.25%<br />
NA<br />
N<br />
N<br />
Note: For a district to qualify as having a disability subgroup it must have a minimum of 40 (n=40) students with disabilities in a school building.<br />
B) Participation<br />
Participation Rate: # of<br />
CWD Tested ÷ # of CWD<br />
Enrolled in grades tested.<br />
Participation Rate: Literacy<br />
Participation Rate: Math<br />
Note: - - denotes not applicable<br />
State<br />
Rate<br />
98.78%<br />
State<br />
Target<br />
95.00%<br />
LEA<br />
Rate<br />
100.00%<br />
Target Met<br />
by LEA (Y/N)<br />
98.61% 95.00% 100.00% Y<br />
Y<br />
C) Performance Proficiency<br />
Percent of CWD Scoring<br />
Proficient or Above<br />
Proficiency Rate: Literacy<br />
Proficiency Rate:<br />
Mathematics<br />
16.00%<br />
16.00%<br />
State<br />
Rate<br />
31.49%<br />
44.86%<br />
State<br />
Target<br />
45.22%<br />
51.14%<br />
LEA<br />
Rate<br />
11.11%<br />
36.36%<br />
NA<br />
NA<br />
Target<br />
Met by<br />
LEA (Y/N)<br />
N<br />
N<br />
Page 1 of 5
LEA: 5440 - KIPP: DELTA COLLEGE PREP SCHOOL<br />
Indicator 04: Out-of-School Suspensions and Expulsions (2009/10 school year)<br />
A) Suspension/Expulsion<br />
Percent difference of CWD with out-of- school suspensions and<br />
expulsions totaling greater than 10 days in a school year as<br />
compared to the same data for general education students in<br />
the district.<br />
B) Suspension/Expulsion by Race and Ethnicity<br />
Percent of districts that have: (a) a significant discrepancy, by race or<br />
ethnicity, in the rate of suspensions and expulsions of greater than 10<br />
days in a school year for children with IEPs; and (b) policies,<br />
procedures or practices that contribute to the significant discrepancy<br />
and do not comply with requirements relating to the development<br />
and implementation of IEPs, the use of positive behavioral<br />
interventions and supports, and procedural safeguards.<br />
Indicator 05: School Age (5-21) Least Restrictive Environment<br />
A) In the Regular Class 80% or more of the day<br />
Percent of CWD with<br />
IEPs receiving instruction<br />
in the regular class 80%<br />
or more of the day.<br />
State<br />
Rate<br />
State<br />
Target<br />
LEA<br />
Rate<br />
B) In the Regular Class less than 40% of the day<br />
Percent of CWD with<br />
IEPs receiving instruction<br />
in the regular class less<br />
than 60% of the day.<br />
53.87% 59.77%<br />
State<br />
Rate<br />
State<br />
Target<br />
12.42% 12.51%<br />
82.35%<br />
LEA<br />
Rate<br />
0.00%<br />
C) Other Settings outside the regular class<br />
Percent of CWD with IEPs served in<br />
public or private separate schools,<br />
residential placements, or<br />
homebound/hospital placements.<br />
State<br />
Rate<br />
State<br />
Target<br />
2.80% 2.56%<br />
Target Met<br />
by LEA (Y/N)<br />
Y<br />
Target Met<br />
by LEA (Y/N)<br />
Y<br />
LEA<br />
Rate<br />
0.00%<br />
Target Met<br />
by LEA(Y/N)<br />
Indicator 06: Early Childhood (3-5) Least Restrictive Environment<br />
A) Regular Early Childhood Program<br />
Percent of children (aged 3 through 5) with IEPs attending a regular<br />
early childhood program and receiving the majority of special<br />
education and related services in the regular early childhood program<br />
Allowable<br />
Difference<br />
LEA: 5440 - KIPP: DELTA COLLEGE PREP SCHOOL<br />
Indicator 07: Preschool (3-5) Outcomes<br />
a) Percent of preschool CWD<br />
children who did not<br />
improve functioning.<br />
b) Percent of preschool CWD<br />
who improved but whose<br />
functioning remained below<br />
same age peers.<br />
c) Percent of preschool CWD<br />
who improved at a level<br />
nearer to same aged peers.<br />
d) Percent of preschool CWD<br />
who improved functioning to<br />
reach a level comparable to<br />
same age peers.<br />
e) Percent of preschool CWD<br />
children who maintain<br />
functioning at a level<br />
comparable to same aged<br />
peers.<br />
Summary<br />
Statements<br />
1) Of those preschool<br />
children who entered<br />
the preschool program<br />
below age expectations<br />
in each Outcome, the<br />
percent who<br />
substantially increased<br />
their rate of growth by<br />
the time they turned 6<br />
years of age or exited<br />
the program.<br />
2) The percent of<br />
preschool children who<br />
were functioning<br />
within age expectations<br />
in each Outcome by the<br />
time they turned 6<br />
years of age or exited<br />
A) Positive Social -Emotional<br />
Skills*<br />
State<br />
Rate<br />
A) Positive Social -<br />
Emotional Skills<br />
(Including social<br />
relationships)<br />
State<br />
Rate<br />
2.14%<br />
5.31%<br />
25.97%<br />
38.22%<br />
28.36%<br />
State<br />
Target<br />
LEA<br />
Rate<br />
LEA<br />
Rate<br />
— —<br />
— —<br />
— —<br />
— —<br />
— —<br />
Target<br />
Met by<br />
LEA(Y/N)<br />
B) Acquisition and Use of<br />
Knowledge and Skills<br />
(Including early language/<br />
communication and early literacy)<br />
B) Acquisition and Use of<br />
Knowledge and Skills **<br />
State<br />
Rate<br />
1.75%<br />
6.59%<br />
34.23%<br />
43.51%<br />
13.92%<br />
State<br />
Target<br />
LEA<br />
Rate<br />
Target<br />
Met by<br />
LEA(Y/N)<br />
C) Use of Appropriate Behaviors<br />
to Meet Their Needs<br />
State<br />
Rate<br />
State<br />
Target<br />
LEA<br />
Rate<br />
Target<br />
Met by<br />
LEA(Y/N)<br />
89.61% 90.50% — — N/A 90.31% 90.50% — — N/A 90.82% 92.50% — — N/A<br />
66.58% 69.50% — — N/A 57.43% 60.50% — — N/A 76.69% 78.50% — — N/A<br />
NOTE: * Including social relationships ** Including early language/ communication and early literacy<br />
Note: - - denotes not applicable<br />
State<br />
Rate<br />
LEA<br />
Rate<br />
— —<br />
— —<br />
— —<br />
— —<br />
— —<br />
C) Use of<br />
Appropriate<br />
Behaviors to<br />
Meet Their Needs<br />
State<br />
Rate<br />
4.51%<br />
17.34%<br />
41.72%<br />
34.97%<br />
LEA<br />
Rate<br />
1.46% — —<br />
— —<br />
— —<br />
— —<br />
— —<br />
Page 3 of 5
LEA: 5440 - KIPP: DELTA COLLEGE PREP SCHOOL<br />
Indicator 08: Parent Involvement<br />
Percent of surveyed<br />
parents who reported<br />
school facilitated parent<br />
involvement as a means<br />
of improving services<br />
and results for children<br />
with disabilities.<br />
Early Childhood<br />
(3-5)<br />
School Age<br />
(5-21)<br />
State<br />
Rate<br />
90.47%<br />
95.05%<br />
Indicator 09: Disproportionality - Eligibility<br />
Disproportionate representation of racial<br />
and ethnic groups in special education and<br />
related services that is a result of<br />
inappropriate identification (e.g.<br />
monitoring data, review of policies,<br />
practices, and procedures under 618(d),<br />
etc.).<br />
State<br />
Rate<br />
State<br />
Target<br />
88.00%<br />
96.00%<br />
State<br />
Target<br />
0.00% 0.00%<br />
LEA<br />
Rate<br />
— —<br />
100.00%<br />
Indicator 10: Disproportionality-Child with a Disability<br />
Disproportionate representation of racial<br />
and ethnic groups in specific disability<br />
categories that is a result of inappropriate<br />
identification (e.g. monitoring data, review<br />
of policies, practices, and procedures under<br />
618(d), etc.).<br />
Indicator 11: Child Find<br />
Percent of children with<br />
parental consent to evaluate<br />
who are evaluated within<br />
the State established timeline<br />
of 60 days.<br />
Overall<br />
(3-21)<br />
Early Childhood<br />
(3-5)<br />
School Age<br />
(5-21)<br />
State<br />
Rate<br />
0.00%<br />
Indicator 12: Early Childhood Transition<br />
Percent of children referred by Part C prior to<br />
age 3, who are found eligible for Part B, and<br />
who have an IEP developed and implemented<br />
by their third birthday.<br />
Note: - - denotes not applicable<br />
State<br />
Rate<br />
99.41%<br />
99.70%<br />
98.97%<br />
State<br />
Rate<br />
State<br />
Target<br />
0.00%<br />
State<br />
Target<br />
100.00%<br />
100.00%<br />
100.00%<br />
State<br />
Target<br />
Target Met by<br />
LEA (Y/N)<br />
Y<br />
Target Met by<br />
LEA (Y/N)<br />
Y<br />
LEA<br />
Rate<br />
100.00%<br />
— —<br />
100.00%<br />
LEA<br />
Rate<br />
Target Met by<br />
LEA (Y/N)<br />
N/A<br />
Y<br />
Note: The target for Indicator 09 is to have zero percent<br />
(0%) of districts identified as having disproportionate<br />
representation as a result of inappropriate<br />
identification in eligibility.<br />
Note: The target for Indicator 10 is to have zero<br />
percent (0%) of districts identified as having<br />
disproportionate representation as a result of<br />
inappropriate identification in a disability<br />
category.<br />
Target Met by<br />
LEA (Y/N)<br />
N/A<br />
Y<br />
Target Met<br />
by LEA<br />
(Y/N)<br />
99.21% 100.00% - - N/A<br />
Y<br />
Note: * Indicates a zero reponse rate for the<br />
district.<br />
Page 4 of 5
LEA: 5440 - KIPP: DELTA COLLEGE PREP SCHOOL<br />
Indicator 13: Secondary Transition<br />
Percent of youth with disabilities aged 16 and<br />
up with an IEP that includes coordinated,<br />
measurable, annual IEP goals and transition<br />
services that will reasonably enable the student<br />
to meet the post-secondary goals.<br />
Indicator 14: Post-School Outcomes<br />
A. Percent of youth enrolled in higher<br />
education within one year of leaving high<br />
school.<br />
State<br />
Rate<br />
State<br />
Target<br />
Note: Data for this Indicator is from the on-site monitoring of LEAs for the given year.<br />
B. Percent of youth enrolled in higher<br />
education or competitively employed<br />
within one year of leaving high school.<br />
C. Percent of youth enrolled in higher<br />
education or in some other postsecondary<br />
education or training program; or<br />
competitively employed or in some other<br />
employment within one year of leaving<br />
high school.<br />
State<br />
Rate<br />
Indicator 20: Reported Data-Timely and Accurate*<br />
District submitted<br />
required data elements<br />
on or before due dates;<br />
made revisions within<br />
the alloted reveiw<br />
periods.<br />
Accurate and Timely<br />
Data Submission<br />
Overall (3-21)<br />
Early Childhood (3-5)<br />
School Age (5-21)<br />
State<br />
Target<br />
100.00%<br />
100.00%<br />
100.00%<br />
State<br />
Target<br />
LEA<br />
Rate<br />
LEA<br />
Rate<br />
Target Met by<br />
LEA (Y/N)<br />
Target Met<br />
by LEA<br />
(Y/N)<br />
Target Met<br />
by LEA<br />
(Y/N)<br />
*Data reviewed for timely and accurate submissions included all APSCN cycle data except for personnel<br />
Note: - - denotes not applicable<br />
96.19 100.00 — — N/A<br />
14.53<br />
State<br />
Rate<br />
49.42<br />
State<br />
Rate<br />
54.07<br />
13.00<br />
State<br />
Target<br />
49.00<br />
State<br />
Target<br />
60.00<br />
Y<br />
N/A<br />
Y<br />
— —<br />
LEA<br />
Rate<br />
— —<br />
LEA<br />
Rate<br />
— —<br />
N/A<br />
Target Met<br />
by LEA<br />
(Y/N)<br />
N/A<br />
Target Met<br />
by LEA<br />
(Y/N)<br />
N/A<br />
Page 5 of 5
<strong>ARKANSAS</strong> <strong>SPECIAL</strong> <strong>EDUCATION</strong><br />
<strong>DISTRICT</strong> <strong>ANNUAL</strong> PERFORMANCE REPORT<br />
2010/11 School Year<br />
Publication Date: March 2012<br />
Each State must have in place a State Performance Plan (SPP) to evaluate the State's efforts to meet the requirements and<br />
purposes of the implementation of the Individuals with Disabilities Education Act (IDEA). The SPP is a six-year plan, which<br />
describes Arkansas's performance on 20 indicators. The Office of Special Education Programs in the U. S. Department of<br />
Education requires that States report annually to the public on the performance of each local education agency (LEA) on 14 of<br />
20 indicators as compared with targets established by the State in the SPP. Arkansas will report indicators 1 through 14 and<br />
20 for each LEA serving children with disabilities (CWD). Any LEA not meeting targets on compliance indicators (0% for<br />
Indicators 4B, 09 & 10 and 100% for Indicators 11, 12, 13, and 20) are non-compliant with IDEA.<br />
There are no report changes for the 2010/11 school year profile; However, it is important to recognize that: .<br />
1. Indicator 01 (Graduation) is reported a year in arrear (2009/10 graduates) and is based on a four-year cohort. This<br />
means the rate is a measure of students who entered in ninth grade and graduate in four years. The calculation is a<br />
requirement under Title I of the Elementary and Secondary Education Act (ESEA).<br />
2. Indicator 02 (Drop out) is reported a year in arrear. This means the rate is a measure of students who dropped out in<br />
the 2009/10 school year. The Indicator 02 data are aligned with the Common Core of Data (CCD) requirements for<br />
grades 7-12.<br />
3. Indicator 04A and 4B (Suspension/Expulsion) is reported a year in arrear. This means the rate is a measure of<br />
students who had out-of-school suspensions and/or expulsions totaling more than 10 days.<br />
For a complete description of all the Indicators, please visit the special education website at<br />
http://arksped.k12.ar.us/sections/policy.html<br />
LEA: 5502 - CENTERPOINT SCHOOL <strong>DISTRICT</strong><br />
Indicator 01: Graduation Rates (2009/10 school year) Indicator 02: Dropout Rates (2009/10 school year)<br />
Percent of youth<br />
with IEPs<br />
graduating from<br />
high school with a<br />
regular diploma<br />
State<br />
Rate<br />
State<br />
Target<br />
75.76% 85.00%<br />
LEA<br />
Rate<br />
100.00%<br />
Target Met<br />
by LEA<br />
(Y/N)<br />
Y<br />
Percent of<br />
youth with<br />
IEPs dropping<br />
out of high<br />
school<br />
State<br />
Rate<br />
Indicator 03: Assessment on Statewide Benchmark Exam (grades 3-8, 11)<br />
A) Adequate Yearly Progress<br />
n=40<br />
Literacy<br />
Mathematics<br />
Met Disability Subgroup "n"<br />
for Reporting Purposes (Y/N)<br />
State Target for % of Districts Meeting<br />
AYP for Disability Subgroup<br />
State<br />
Target<br />
3.06% 4.20%<br />
LEA<br />
Rate<br />
1.49%<br />
% of Districts Meeting AYP<br />
for Disability Subgroup<br />
Target Met by<br />
LEA (Y/N)<br />
Y<br />
Target Met by<br />
LEA(Y/N)<br />
Overall N 17.15% 6.25%<br />
NA<br />
N<br />
N<br />
Note: For a district to qualify as having a disability subgroup it must have a minimum of 40 (n=40) students with disabilities in a school building.<br />
B) Participation<br />
Participation Rate: # of<br />
CWD Tested ÷ # of CWD<br />
Enrolled in grades tested.<br />
Participation Rate: Literacy<br />
Participation Rate: Math<br />
Note: - - denotes not applicable<br />
State<br />
Rate<br />
98.78%<br />
State<br />
Target<br />
95.00%<br />
LEA<br />
Rate<br />
100.00%<br />
Target Met<br />
by LEA (Y/N)<br />
98.61% 95.00% 98.48% Y<br />
Y<br />
C) Performance Proficiency<br />
Percent of CWD Scoring<br />
Proficient or Above<br />
Proficiency Rate: Literacy<br />
Proficiency Rate:<br />
Mathematics<br />
16.00%<br />
16.00%<br />
State<br />
Rate<br />
31.49%<br />
44.86%<br />
State<br />
Target<br />
45.22%<br />
51.14%<br />
LEA<br />
Rate<br />
29.09%<br />
47.62%<br />
NA<br />
NA<br />
Target<br />
Met by<br />
LEA (Y/N)<br />
N<br />
N<br />
Page 1 of 5
LEA: 5502 - CENTERPOINT SCHOOL <strong>DISTRICT</strong><br />
Indicator 04: Out-of-School Suspensions and Expulsions (2009/10 school year)<br />
A) Suspension/Expulsion<br />
Percent difference of CWD with out-of- school suspensions and<br />
expulsions totaling greater than 10 days in a school year as<br />
compared to the same data for general education students in<br />
the district.<br />
B) Suspension/Expulsion by Race and Ethnicity<br />
Percent of districts that have: (a) a significant discrepancy, by race or<br />
ethnicity, in the rate of suspensions and expulsions of greater than 10<br />
days in a school year for children with IEPs; and (b) policies,<br />
procedures or practices that contribute to the significant discrepancy<br />
and do not comply with requirements relating to the development<br />
and implementation of IEPs, the use of positive behavioral<br />
interventions and supports, and procedural safeguards.<br />
Indicator 05: School Age (5-21) Least Restrictive Environment<br />
A) In the Regular Class 80% or more of the day<br />
Percent of CWD with<br />
IEPs receiving instruction<br />
in the regular class 80%<br />
or more of the day.<br />
State<br />
Rate<br />
State<br />
Target<br />
LEA<br />
Rate<br />
B) In the Regular Class less than 40% of the day<br />
Percent of CWD with<br />
IEPs receiving instruction<br />
in the regular class less<br />
than 60% of the day.<br />
53.87% 59.77%<br />
State<br />
Rate<br />
State<br />
Target<br />
12.42% 12.51%<br />
54.55%<br />
LEA<br />
Rate<br />
4.55%<br />
C) Other Settings outside the regular class<br />
Percent of CWD with IEPs served in<br />
public or private separate schools,<br />
residential placements, or<br />
homebound/hospital placements.<br />
State<br />
Rate<br />
State<br />
Target<br />
2.80% 2.56%<br />
Target Met<br />
by LEA (Y/N)<br />
N<br />
Target Met<br />
by LEA (Y/N)<br />
Y<br />
LEA<br />
Rate<br />
0.00%<br />
Target Met<br />
by LEA(Y/N)<br />
Indicator 06: Early Childhood (3-5) Least Restrictive Environment<br />
A) Regular Early Childhood Program<br />
Percent of children (aged 3 through 5) with IEPs attending a regular<br />
early childhood program and receiving the majority of special<br />
education and related services in the regular early childhood program<br />
Allowable<br />
Difference<br />
LEA: 5502 - CENTERPOINT SCHOOL <strong>DISTRICT</strong><br />
Indicator 07: Preschool (3-5) Outcomes<br />
a) Percent of preschool CWD<br />
children who did not<br />
improve functioning.<br />
b) Percent of preschool CWD<br />
who improved but whose<br />
functioning remained below<br />
same age peers.<br />
c) Percent of preschool CWD<br />
who improved at a level<br />
nearer to same aged peers.<br />
d) Percent of preschool CWD<br />
who improved functioning to<br />
reach a level comparable to<br />
same age peers.<br />
e) Percent of preschool CWD<br />
children who maintain<br />
functioning at a level<br />
comparable to same aged<br />
peers.<br />
Summary<br />
Statements<br />
1) Of those preschool<br />
children who entered<br />
the preschool program<br />
below age expectations<br />
in each Outcome, the<br />
percent who<br />
substantially increased<br />
their rate of growth by<br />
the time they turned 6<br />
years of age or exited<br />
the program.<br />
2) The percent of<br />
preschool children who<br />
were functioning<br />
within age expectations<br />
in each Outcome by the<br />
time they turned 6<br />
years of age or exited<br />
A) Positive Social -Emotional<br />
Skills*<br />
State<br />
Rate<br />
A) Positive Social -<br />
Emotional Skills<br />
(Including social<br />
relationships)<br />
State<br />
Rate<br />
2.14%<br />
5.31%<br />
25.97%<br />
38.22%<br />
28.36%<br />
State<br />
Target<br />
LEA<br />
Rate<br />
LEA<br />
Rate<br />
— —<br />
— —<br />
— —<br />
— —<br />
— —<br />
Target<br />
Met by<br />
LEA(Y/N)<br />
B) Acquisition and Use of<br />
Knowledge and Skills<br />
(Including early language/<br />
communication and early literacy)<br />
B) Acquisition and Use of<br />
Knowledge and Skills **<br />
State<br />
Rate<br />
1.75%<br />
6.59%<br />
34.23%<br />
43.51%<br />
13.92%<br />
State<br />
Target<br />
LEA<br />
Rate<br />
Target<br />
Met by<br />
LEA(Y/N)<br />
C) Use of Appropriate Behaviors<br />
to Meet Their Needs<br />
State<br />
Rate<br />
State<br />
Target<br />
LEA<br />
Rate<br />
Target<br />
Met by<br />
LEA(Y/N)<br />
89.61% 90.50% — — N/A 90.31% 90.50% — — N/A 90.82% 92.50% — — N/A<br />
66.58% 69.50% — — N/A 57.43% 60.50% — — N/A 76.69% 78.50% — — N/A<br />
NOTE: * Including social relationships ** Including early language/ communication and early literacy<br />
Note: - - denotes not applicable<br />
State<br />
Rate<br />
LEA<br />
Rate<br />
— —<br />
— —<br />
— —<br />
— —<br />
— —<br />
C) Use of<br />
Appropriate<br />
Behaviors to<br />
Meet Their Needs<br />
State<br />
Rate<br />
4.51%<br />
17.34%<br />
41.72%<br />
34.97%<br />
LEA<br />
Rate<br />
1.46% — —<br />
— —<br />
— —<br />
— —<br />
— —<br />
Page 3 of 5
LEA: 5502 - CENTERPOINT SCHOOL <strong>DISTRICT</strong><br />
Indicator 08: Parent Involvement<br />
Percent of surveyed<br />
parents who reported<br />
school facilitated parent<br />
involvement as a means<br />
of improving services<br />
and results for children<br />
with disabilities.<br />
Early Childhood<br />
(3-5)<br />
School Age<br />
(5-21)<br />
State<br />
Rate<br />
90.47%<br />
95.05%<br />
Indicator 09: Disproportionality - Eligibility<br />
Disproportionate representation of racial<br />
and ethnic groups in special education and<br />
related services that is a result of<br />
inappropriate identification (e.g.<br />
monitoring data, review of policies,<br />
practices, and procedures under 618(d),<br />
etc.).<br />
State<br />
Rate<br />
State<br />
Target<br />
88.00%<br />
96.00%<br />
State<br />
Target<br />
0.00% 0.00%<br />
LEA<br />
Rate<br />
— —<br />
100.00%<br />
Indicator 10: Disproportionality-Child with a Disability<br />
Disproportionate representation of racial<br />
and ethnic groups in specific disability<br />
categories that is a result of inappropriate<br />
identification (e.g. monitoring data, review<br />
of policies, practices, and procedures under<br />
618(d), etc.).<br />
Indicator 11: Child Find<br />
Percent of children with<br />
parental consent to evaluate<br />
who are evaluated within<br />
the State established timeline<br />
of 60 days.<br />
Overall<br />
(3-21)<br />
Early Childhood<br />
(3-5)<br />
School Age<br />
(5-21)<br />
State<br />
Rate<br />
0.00%<br />
Indicator 12: Early Childhood Transition<br />
Percent of children referred by Part C prior to<br />
age 3, who are found eligible for Part B, and<br />
who have an IEP developed and implemented<br />
by their third birthday.<br />
Note: - - denotes not applicable<br />
State<br />
Rate<br />
99.41%<br />
99.70%<br />
98.97%<br />
State<br />
Rate<br />
State<br />
Target<br />
0.00%<br />
State<br />
Target<br />
100.00%<br />
100.00%<br />
100.00%<br />
State<br />
Target<br />
Target Met by<br />
LEA (Y/N)<br />
Y<br />
Target Met by<br />
LEA (Y/N)<br />
Y<br />
LEA<br />
Rate<br />
100.00%<br />
— —<br />
100.00%<br />
LEA<br />
Rate<br />
Target Met by<br />
LEA (Y/N)<br />
N/A<br />
Y<br />
Note: The target for Indicator 09 is to have zero percent<br />
(0%) of districts identified as having disproportionate<br />
representation as a result of inappropriate<br />
identification in eligibility.<br />
Note: The target for Indicator 10 is to have zero<br />
percent (0%) of districts identified as having<br />
disproportionate representation as a result of<br />
inappropriate identification in a disability<br />
category.<br />
Target Met by<br />
LEA (Y/N)<br />
N/A<br />
Y<br />
Target Met<br />
by LEA<br />
(Y/N)<br />
99.21% 100.00% - - N/A<br />
Y<br />
Note: * Indicates a zero reponse rate for the<br />
district.<br />
Page 4 of 5
LEA: 5502 - CENTERPOINT SCHOOL <strong>DISTRICT</strong><br />
Indicator 13: Secondary Transition<br />
Percent of youth with disabilities aged 16 and<br />
up with an IEP that includes coordinated,<br />
measurable, annual IEP goals and transition<br />
services that will reasonably enable the student<br />
to meet the post-secondary goals.<br />
Indicator 14: Post-School Outcomes<br />
A. Percent of youth enrolled in higher<br />
education within one year of leaving high<br />
school.<br />
State<br />
Rate<br />
State<br />
Target<br />
Note: Data for this Indicator is from the on-site monitoring of LEAs for the given year.<br />
B. Percent of youth enrolled in higher<br />
education or competitively employed<br />
within one year of leaving high school.<br />
C. Percent of youth enrolled in higher<br />
education or in some other postsecondary<br />
education or training program; or<br />
competitively employed or in some other<br />
employment within one year of leaving<br />
high school.<br />
State<br />
Rate<br />
Indicator 20: Reported Data-Timely and Accurate*<br />
District submitted<br />
required data elements<br />
on or before due dates;<br />
made revisions within<br />
the alloted reveiw<br />
periods.<br />
Accurate and Timely<br />
Data Submission<br />
Overall (3-21)<br />
Early Childhood (3-5)<br />
School Age (5-21)<br />
State<br />
Target<br />
100.00%<br />
100.00%<br />
100.00%<br />
State<br />
Target<br />
LEA<br />
Rate<br />
LEA<br />
Rate<br />
Target Met by<br />
LEA (Y/N)<br />
Target Met<br />
by LEA<br />
(Y/N)<br />
Target Met<br />
by LEA<br />
(Y/N)<br />
*Data reviewed for timely and accurate submissions included all APSCN cycle data except for personnel<br />
Note: - - denotes not applicable<br />
96.19 100.00 100.00% Y<br />
14.53<br />
State<br />
Rate<br />
49.42<br />
State<br />
Rate<br />
54.07<br />
13.00<br />
State<br />
Target<br />
49.00<br />
State<br />
Target<br />
60.00<br />
Y<br />
N/A<br />
Y<br />
— —<br />
LEA<br />
Rate<br />
— —<br />
LEA<br />
Rate<br />
— —<br />
N/A<br />
Target Met<br />
by LEA<br />
(Y/N)<br />
N/A<br />
Target Met<br />
by LEA<br />
(Y/N)<br />
N/A<br />
Page 5 of 5
LEA: 5503 - KIRBY SCHOOL <strong>DISTRICT</strong><br />
<strong>ARKANSAS</strong> <strong>SPECIAL</strong> <strong>EDUCATION</strong><br />
<strong>DISTRICT</strong> <strong>ANNUAL</strong> PERFORMANCE REPORT<br />
2010/11 School Year<br />
Publication Date: March 2012<br />
Each State must have in place a State Performance Plan (SPP) to evaluate the State's efforts to meet the requirements and<br />
purposes of the implementation of the Individuals with Disabilities Education Act (IDEA). The SPP is a six-year plan, which<br />
describes Arkansas's performance on 20 indicators. The Office of Special Education Programs in the U. S. Department of<br />
Education requires that States report annually to the public on the performance of each local education agency (LEA) on 14 of<br />
20 indicators as compared with targets established by the State in the SPP. Arkansas will report indicators 1 through 14 and<br />
20 for each LEA serving children with disabilities (CWD). Any LEA not meeting targets on compliance indicators (0% for<br />
Indicators 4B, 09 & 10 and 100% for Indicators 11, 12, 13, and 20) are non-compliant with IDEA.<br />
There are no report changes for the 2010/11 school year profile; However, it is important to recognize that: .<br />
1. Indicator 01 (Graduation) is reported a year in arrear (2009/10 graduates) and is based on a four-year cohort. This<br />
means the rate is a measure of students who entered in ninth grade and graduate in four years. The calculation is a<br />
requirement under Title I of the Elementary and Secondary Education Act (ESEA).<br />
2. Indicator 02 (Drop out) is reported a year in arrear. This means the rate is a measure of students who dropped out in<br />
the 2009/10 school year. The Indicator 02 data are aligned with the Common Core of Data (CCD) requirements for<br />
grades 7-12.<br />
3. Indicator 04A and 4B (Suspension/Expulsion) is reported a year in arrear. This means the rate is a measure of<br />
students who had out-of-school suspensions and/or expulsions totaling more than 10 days.<br />
Percent of youth<br />
with IEPs<br />
graduating from<br />
high school with a<br />
regular diploma<br />
For a complete description of all the Indicators, please visit the special education website at<br />
http://arksped.k12.ar.us/sections/policy.html<br />
Indicator 01: Graduation Rates (2009/10 school year) Indicator 02: Dropout Rates (2009/10 school year)<br />
State<br />
Rate<br />
State<br />
Target<br />
75.76% 85.00%<br />
LEA<br />
Rate<br />
62.50%<br />
Target Met<br />
by LEA<br />
(Y/N)<br />
N<br />
Percent of<br />
youth with<br />
IEPs dropping<br />
out of high<br />
school<br />
State<br />
Rate<br />
Indicator 03: Assessment on Statewide Benchmark Exam (grades 3-8, 11)<br />
A) Adequate Yearly Progress<br />
n=40<br />
Literacy<br />
Mathematics<br />
Met Disability Subgroup "n"<br />
for Reporting Purposes (Y/N)<br />
State Target for % of Districts Meeting<br />
AYP for Disability Subgroup<br />
State<br />
Target<br />
3.06% 4.20%<br />
LEA<br />
Rate<br />
3.45%<br />
% of Districts Meeting AYP<br />
for Disability Subgroup<br />
Target Met by<br />
LEA (Y/N)<br />
Y<br />
Target Met by<br />
LEA(Y/N)<br />
Overall N 17.15% 6.25%<br />
NA<br />
N<br />
N<br />
Note: For a district to qualify as having a disability subgroup it must have a minimum of 40 (n=40) students with disabilities in a school building.<br />
B) Participation<br />
Participation Rate: # of<br />
CWD Tested ÷ # of CWD<br />
Enrolled in grades tested.<br />
Participation Rate: Literacy<br />
Participation Rate: Math<br />
Note: - - denotes not applicable<br />
State<br />
Rate<br />
98.78%<br />
State<br />
Target<br />
95.00%<br />
LEA<br />
Rate<br />
100.00%<br />
Target Met<br />
by LEA (Y/N)<br />
98.61% 95.00% 100.00% Y<br />
Y<br />
C) Performance Proficiency<br />
Percent of CWD Scoring<br />
Proficient or Above<br />
Proficiency Rate: Literacy<br />
Proficiency Rate:<br />
Mathematics<br />
16.00%<br />
16.00%<br />
State<br />
Rate<br />
31.49%<br />
44.86%<br />
State<br />
Target<br />
45.22%<br />
51.14%<br />
LEA<br />
Rate<br />
16.67%<br />
23.08%<br />
NA<br />
NA<br />
Target<br />
Met by<br />
LEA (Y/N)<br />
N<br />
N<br />
Page 1 of 5
LEA: 5503 - KIRBY SCHOOL <strong>DISTRICT</strong><br />
Indicator 04: Out-of-School Suspensions and Expulsions (2009/10 school year)<br />
A) Suspension/Expulsion<br />
Percent difference of CWD with out-of- school suspensions and<br />
expulsions totaling greater than 10 days in a school year as<br />
compared to the same data for general education students in<br />
the district.<br />
B) Suspension/Expulsion by Race and Ethnicity<br />
Percent of districts that have: (a) a significant discrepancy, by race or<br />
ethnicity, in the rate of suspensions and expulsions of greater than 10<br />
days in a school year for children with IEPs; and (b) policies,<br />
procedures or practices that contribute to the significant discrepancy<br />
and do not comply with requirements relating to the development<br />
and implementation of IEPs, the use of positive behavioral<br />
interventions and supports, and procedural safeguards.<br />
Indicator 05: School Age (5-21) Least Restrictive Environment<br />
A) In the Regular Class 80% or more of the day<br />
Percent of CWD with<br />
IEPs receiving instruction<br />
in the regular class 80%<br />
or more of the day.<br />
State<br />
Rate<br />
State<br />
Target<br />
LEA<br />
Rate<br />
B) In the Regular Class less than 40% of the day<br />
Percent of CWD with<br />
IEPs receiving instruction<br />
in the regular class less<br />
than 60% of the day.<br />
53.87% 59.77%<br />
State<br />
Rate<br />
State<br />
Target<br />
12.42% 12.51%<br />
66.67%<br />
LEA<br />
Rate<br />
4.44%<br />
C) Other Settings outside the regular class<br />
Percent of CWD with IEPs served in<br />
public or private separate schools,<br />
residential placements, or<br />
homebound/hospital placements.<br />
State<br />
Rate<br />
State<br />
Target<br />
2.80% 2.56%<br />
Target Met<br />
by LEA (Y/N)<br />
Y<br />
Target Met<br />
by LEA (Y/N)<br />
Y<br />
LEA<br />
Rate<br />
0.00%<br />
Target Met<br />
by LEA(Y/N)<br />
Indicator 06: Early Childhood (3-5) Least Restrictive Environment<br />
A) Regular Early Childhood Program<br />
Percent of children (aged 3 through 5) with IEPs attending a regular<br />
early childhood program and receiving the majority of special<br />
education and related services in the regular early childhood program<br />
Allowable<br />
Difference<br />
LEA: 5503 - KIRBY SCHOOL <strong>DISTRICT</strong><br />
Indicator 07: Preschool (3-5) Outcomes<br />
a) Percent of preschool CWD<br />
children who did not<br />
improve functioning.<br />
b) Percent of preschool CWD<br />
who improved but whose<br />
functioning remained below<br />
same age peers.<br />
c) Percent of preschool CWD<br />
who improved at a level<br />
nearer to same aged peers.<br />
d) Percent of preschool CWD<br />
who improved functioning to<br />
reach a level comparable to<br />
same age peers.<br />
e) Percent of preschool CWD<br />
children who maintain<br />
functioning at a level<br />
comparable to same aged<br />
peers.<br />
Summary<br />
Statements<br />
1) Of those preschool<br />
children who entered<br />
the preschool program<br />
below age expectations<br />
in each Outcome, the<br />
percent who<br />
substantially increased<br />
their rate of growth by<br />
the time they turned 6<br />
years of age or exited<br />
the program.<br />
2) The percent of<br />
preschool children who<br />
were functioning<br />
within age expectations<br />
in each Outcome by the<br />
time they turned 6<br />
years of age or exited<br />
A) Positive Social -Emotional<br />
Skills*<br />
State<br />
Rate<br />
A) Positive Social -<br />
Emotional Skills<br />
(Including social<br />
relationships)<br />
State<br />
Rate<br />
2.14%<br />
5.31%<br />
25.97%<br />
38.22%<br />
28.36%<br />
State<br />
Target<br />
LEA<br />
Rate<br />
LEA<br />
Rate<br />
— —<br />
— —<br />
— —<br />
— —<br />
— —<br />
Target<br />
Met by<br />
LEA(Y/N)<br />
B) Acquisition and Use of<br />
Knowledge and Skills<br />
(Including early language/<br />
communication and early literacy)<br />
B) Acquisition and Use of<br />
Knowledge and Skills **<br />
State<br />
Rate<br />
1.75%<br />
6.59%<br />
34.23%<br />
43.51%<br />
13.92%<br />
State<br />
Target<br />
LEA<br />
Rate<br />
Target<br />
Met by<br />
LEA(Y/N)<br />
C) Use of Appropriate Behaviors<br />
to Meet Their Needs<br />
State<br />
Rate<br />
State<br />
Target<br />
LEA<br />
Rate<br />
Target<br />
Met by<br />
LEA(Y/N)<br />
89.61% 90.50% — — N/A 90.31% 90.50% — — N/A 90.82% 92.50% — — N/A<br />
66.58% 69.50% — — N/A 57.43% 60.50% — — N/A 76.69% 78.50% — — N/A<br />
NOTE: * Including social relationships ** Including early language/ communication and early literacy<br />
Note: - - denotes not applicable<br />
State<br />
Rate<br />
LEA<br />
Rate<br />
— —<br />
— —<br />
— —<br />
— —<br />
— —<br />
C) Use of<br />
Appropriate<br />
Behaviors to<br />
Meet Their Needs<br />
State<br />
Rate<br />
4.51%<br />
17.34%<br />
41.72%<br />
34.97%<br />
LEA<br />
Rate<br />
1.46% — —<br />
— —<br />
— —<br />
— —<br />
— —<br />
Page 3 of 5
LEA: 5503 - KIRBY SCHOOL <strong>DISTRICT</strong><br />
Indicator 08: Parent Involvement<br />
Percent of surveyed<br />
parents who reported<br />
school facilitated parent<br />
involvement as a means<br />
of improving services<br />
and results for children<br />
with disabilities.<br />
Early Childhood<br />
(3-5)<br />
School Age<br />
(5-21)<br />
State<br />
Rate<br />
90.47%<br />
95.05%<br />
Indicator 09: Disproportionality - Eligibility<br />
Disproportionate representation of racial<br />
and ethnic groups in special education and<br />
related services that is a result of<br />
inappropriate identification (e.g.<br />
monitoring data, review of policies,<br />
practices, and procedures under 618(d),<br />
etc.).<br />
State<br />
Rate<br />
State<br />
Target<br />
88.00%<br />
96.00%<br />
State<br />
Target<br />
0.00% 0.00%<br />
LEA<br />
Rate<br />
— —<br />
100.00%<br />
Indicator 10: Disproportionality-Child with a Disability<br />
Disproportionate representation of racial<br />
and ethnic groups in specific disability<br />
categories that is a result of inappropriate<br />
identification (e.g. monitoring data, review<br />
of policies, practices, and procedures under<br />
618(d), etc.).<br />
Indicator 11: Child Find<br />
Percent of children with<br />
parental consent to evaluate<br />
who are evaluated within<br />
the State established timeline<br />
of 60 days.<br />
Overall<br />
(3-21)<br />
Early Childhood<br />
(3-5)<br />
School Age<br />
(5-21)<br />
State<br />
Rate<br />
0.00%<br />
Indicator 12: Early Childhood Transition<br />
Percent of children referred by Part C prior to<br />
age 3, who are found eligible for Part B, and<br />
who have an IEP developed and implemented<br />
by their third birthday.<br />
Note: - - denotes not applicable<br />
State<br />
Rate<br />
99.41%<br />
99.70%<br />
98.97%<br />
State<br />
Rate<br />
State<br />
Target<br />
0.00%<br />
State<br />
Target<br />
100.00%<br />
100.00%<br />
100.00%<br />
State<br />
Target<br />
Target Met by<br />
LEA (Y/N)<br />
Y<br />
Target Met by<br />
LEA (Y/N)<br />
Y<br />
LEA<br />
Rate<br />
100.00%<br />
— —<br />
100.00%<br />
LEA<br />
Rate<br />
Target Met by<br />
LEA (Y/N)<br />
N/A<br />
Y<br />
Note: The target for Indicator 09 is to have zero percent<br />
(0%) of districts identified as having disproportionate<br />
representation as a result of inappropriate<br />
identification in eligibility.<br />
Note: The target for Indicator 10 is to have zero<br />
percent (0%) of districts identified as having<br />
disproportionate representation as a result of<br />
inappropriate identification in a disability<br />
category.<br />
Target Met by<br />
LEA (Y/N)<br />
N/A<br />
Y<br />
Target Met<br />
by LEA<br />
(Y/N)<br />
99.21% 100.00% - - N/A<br />
Y<br />
Note: * Indicates a zero reponse rate for the<br />
district.<br />
Page 4 of 5
LEA: 5503 - KIRBY SCHOOL <strong>DISTRICT</strong><br />
Indicator 13: Secondary Transition<br />
Percent of youth with disabilities aged 16 and<br />
up with an IEP that includes coordinated,<br />
measurable, annual IEP goals and transition<br />
services that will reasonably enable the student<br />
to meet the post-secondary goals.<br />
Indicator 14: Post-School Outcomes<br />
A. Percent of youth enrolled in higher<br />
education within one year of leaving high<br />
school.<br />
State<br />
Rate<br />
State<br />
Target<br />
Note: Data for this Indicator is from the on-site monitoring of LEAs for the given year.<br />
B. Percent of youth enrolled in higher<br />
education or competitively employed<br />
within one year of leaving high school.<br />
C. Percent of youth enrolled in higher<br />
education or in some other postsecondary<br />
education or training program; or<br />
competitively employed or in some other<br />
employment within one year of leaving<br />
high school.<br />
State<br />
Rate<br />
Indicator 20: Reported Data-Timely and Accurate*<br />
District submitted<br />
required data elements<br />
on or before due dates;<br />
made revisions within<br />
the alloted reveiw<br />
periods.<br />
Accurate and Timely<br />
Data Submission<br />
Overall (3-21)<br />
Early Childhood (3-5)<br />
School Age (5-21)<br />
State<br />
Target<br />
100.00%<br />
100.00%<br />
100.00%<br />
State<br />
Target<br />
LEA<br />
Rate<br />
LEA<br />
Rate<br />
Target Met by<br />
LEA (Y/N)<br />
Target Met<br />
by LEA<br />
(Y/N)<br />
Target Met<br />
by LEA<br />
(Y/N)<br />
*Data reviewed for timely and accurate submissions included all APSCN cycle data except for personnel<br />
Note: - - denotes not applicable<br />
96.19 100.00 — — N/A<br />
14.53<br />
State<br />
Rate<br />
49.42<br />
State<br />
Rate<br />
54.07<br />
13.00<br />
State<br />
Target<br />
49.00<br />
State<br />
Target<br />
60.00<br />
Y<br />
N/A<br />
Y<br />
— —<br />
LEA<br />
Rate<br />
— —<br />
LEA<br />
Rate<br />
— —<br />
N/A<br />
Target Met<br />
by LEA<br />
(Y/N)<br />
N/A<br />
Target Met<br />
by LEA<br />
(Y/N)<br />
N/A<br />
Page 5 of 5
<strong>ARKANSAS</strong> <strong>SPECIAL</strong> <strong>EDUCATION</strong><br />
<strong>DISTRICT</strong> <strong>ANNUAL</strong> PERFORMANCE REPORT<br />
2010/11 School Year<br />
Publication Date: March 2012<br />
Each State must have in place a State Performance Plan (SPP) to evaluate the State's efforts to meet the requirements and<br />
purposes of the implementation of the Individuals with Disabilities Education Act (IDEA). The SPP is a six-year plan, which<br />
describes Arkansas's performance on 20 indicators. The Office of Special Education Programs in the U. S. Department of<br />
Education requires that States report annually to the public on the performance of each local education agency (LEA) on 14 of<br />
20 indicators as compared with targets established by the State in the SPP. Arkansas will report indicators 1 through 14 and<br />
20 for each LEA serving children with disabilities (CWD). Any LEA not meeting targets on compliance indicators (0% for<br />
Indicators 4B, 09 & 10 and 100% for Indicators 11, 12, 13, and 20) are non-compliant with IDEA.<br />
There are no report changes for the 2010/11 school year profile; However, it is important to recognize that: .<br />
1. Indicator 01 (Graduation) is reported a year in arrear (2009/10 graduates) and is based on a four-year cohort. This<br />
means the rate is a measure of students who entered in ninth grade and graduate in four years. The calculation is a<br />
requirement under Title I of the Elementary and Secondary Education Act (ESEA).<br />
2. Indicator 02 (Drop out) is reported a year in arrear. This means the rate is a measure of students who dropped out in<br />
the 2009/10 school year. The Indicator 02 data are aligned with the Common Core of Data (CCD) requirements for<br />
grades 7-12.<br />
3. Indicator 04A and 4B (Suspension/Expulsion) is reported a year in arrear. This means the rate is a measure of<br />
students who had out-of-school suspensions and/or expulsions totaling more than 10 days.<br />
For a complete description of all the Indicators, please visit the special education website at<br />
http://arksped.k12.ar.us/sections/policy.html<br />
LEA: 5504 - SOUTH PIKE COUNTY SCHOOL <strong>DISTRICT</strong><br />
Indicator 01: Graduation Rates (2009/10 school year) Indicator 02: Dropout Rates (2009/10 school year)<br />
Percent of youth<br />
with IEPs<br />
graduating from<br />
high school with a<br />
regular diploma<br />
State<br />
Rate<br />
State<br />
Target<br />
75.76% 85.00%<br />
LEA<br />
Rate<br />
77.78%<br />
Target Met<br />
by LEA<br />
(Y/N)<br />
N<br />
Percent of<br />
youth with<br />
IEPs dropping<br />
out of high<br />
school<br />
State<br />
Rate<br />
Indicator 03: Assessment on Statewide Benchmark Exam (grades 3-8, 11)<br />
A) Adequate Yearly Progress<br />
n=40<br />
Literacy<br />
Mathematics<br />
Met Disability Subgroup "n"<br />
for Reporting Purposes (Y/N)<br />
State Target for % of Districts Meeting<br />
AYP for Disability Subgroup<br />
State<br />
Target<br />
3.06% 4.20%<br />
LEA<br />
Rate<br />
0.00%<br />
% of Districts Meeting AYP<br />
for Disability Subgroup<br />
Target Met by<br />
LEA (Y/N)<br />
Y<br />
Target Met by<br />
LEA(Y/N)<br />
Overall N 17.15% 6.25%<br />
NA<br />
N<br />
N<br />
Note: For a district to qualify as having a disability subgroup it must have a minimum of 40 (n=40) students with disabilities in a school building.<br />
B) Participation<br />
Participation Rate: # of<br />
CWD Tested ÷ # of CWD<br />
Enrolled in grades tested.<br />
Participation Rate: Literacy<br />
Participation Rate: Math<br />
Note: - - denotes not applicable<br />
State<br />
Rate<br />
98.78%<br />
State<br />
Target<br />
95.00%<br />
LEA<br />
Rate<br />
98.28%<br />
Target Met<br />
by LEA (Y/N)<br />
98.61% 95.00% 96.36% Y<br />
Y<br />
C) Performance Proficiency<br />
Percent of CWD Scoring<br />
Proficient or Above<br />
Proficiency Rate: Literacy<br />
Proficiency Rate:<br />
Mathematics<br />
16.00%<br />
16.00%<br />
State<br />
Rate<br />
31.49%<br />
44.86%<br />
State<br />
Target<br />
45.22%<br />
51.14%<br />
LEA<br />
Rate<br />
35.85%<br />
41.67%<br />
NA<br />
NA<br />
Target<br />
Met by<br />
LEA (Y/N)<br />
N<br />
N<br />
Page 1 of 5
LEA: 5504 - SOUTH PIKE COUNTY SCHOOL <strong>DISTRICT</strong><br />
Indicator 04: Out-of-School Suspensions and Expulsions (2009/10 school year)<br />
A) Suspension/Expulsion<br />
Percent difference of CWD with out-of- school suspensions and<br />
expulsions totaling greater than 10 days in a school year as<br />
compared to the same data for general education students in<br />
the district.<br />
B) Suspension/Expulsion by Race and Ethnicity<br />
Percent of districts that have: (a) a significant discrepancy, by race or<br />
ethnicity, in the rate of suspensions and expulsions of greater than 10<br />
days in a school year for children with IEPs; and (b) policies,<br />
procedures or practices that contribute to the significant discrepancy<br />
and do not comply with requirements relating to the development<br />
and implementation of IEPs, the use of positive behavioral<br />
interventions and supports, and procedural safeguards.<br />
Indicator 05: School Age (5-21) Least Restrictive Environment<br />
A) In the Regular Class 80% or more of the day<br />
Percent of CWD with<br />
IEPs receiving instruction<br />
in the regular class 80%<br />
or more of the day.<br />
State<br />
Rate<br />
State<br />
Target<br />
LEA<br />
Rate<br />
B) In the Regular Class less than 40% of the day<br />
Percent of CWD with<br />
IEPs receiving instruction<br />
in the regular class less<br />
than 60% of the day.<br />
53.87% 59.77%<br />
State<br />
Rate<br />
State<br />
Target<br />
12.42% 12.51%<br />
74.76%<br />
LEA<br />
Rate<br />
4.85%<br />
C) Other Settings outside the regular class<br />
Percent of CWD with IEPs served in<br />
public or private separate schools,<br />
residential placements, or<br />
homebound/hospital placements.<br />
State<br />
Rate<br />
State<br />
Target<br />
2.80% 2.56%<br />
Target Met<br />
by LEA (Y/N)<br />
Y<br />
Target Met<br />
by LEA (Y/N)<br />
Y<br />
LEA<br />
Rate<br />
0.97%<br />
Target Met<br />
by LEA(Y/N)<br />
Indicator 06: Early Childhood (3-5) Least Restrictive Environment<br />
A) Regular Early Childhood Program<br />
Percent of children (aged 3 through 5) with IEPs attending a regular<br />
early childhood program and receiving the majority of special<br />
education and related services in the regular early childhood program<br />
Allowable<br />
Difference<br />
LEA: 5504 - SOUTH PIKE COUNTY SCHOOL <strong>DISTRICT</strong><br />
Indicator 07: Preschool (3-5) Outcomes<br />
a) Percent of preschool CWD<br />
children who did not<br />
improve functioning.<br />
b) Percent of preschool CWD<br />
who improved but whose<br />
functioning remained below<br />
same age peers.<br />
c) Percent of preschool CWD<br />
who improved at a level<br />
nearer to same aged peers.<br />
d) Percent of preschool CWD<br />
who improved functioning to<br />
reach a level comparable to<br />
same age peers.<br />
e) Percent of preschool CWD<br />
children who maintain<br />
functioning at a level<br />
comparable to same aged<br />
peers.<br />
Summary<br />
Statements<br />
1) Of those preschool<br />
children who entered<br />
the preschool program<br />
below age expectations<br />
in each Outcome, the<br />
percent who<br />
substantially increased<br />
their rate of growth by<br />
the time they turned 6<br />
years of age or exited<br />
the program.<br />
2) The percent of<br />
preschool children who<br />
were functioning<br />
within age expectations<br />
in each Outcome by the<br />
time they turned 6<br />
years of age or exited<br />
A) Positive Social -Emotional<br />
Skills*<br />
State<br />
Rate<br />
A) Positive Social -<br />
Emotional Skills<br />
(Including social<br />
relationships)<br />
State<br />
Rate<br />
2.14%<br />
5.31%<br />
25.97%<br />
38.22%<br />
28.36%<br />
State<br />
Target<br />
LEA<br />
Rate<br />
LEA<br />
Rate<br />
— —<br />
— —<br />
— —<br />
— —<br />
— —<br />
Target<br />
Met by<br />
LEA(Y/N)<br />
B) Acquisition and Use of<br />
Knowledge and Skills<br />
(Including early language/<br />
communication and early literacy)<br />
B) Acquisition and Use of<br />
Knowledge and Skills **<br />
State<br />
Rate<br />
1.75%<br />
6.59%<br />
34.23%<br />
43.51%<br />
13.92%<br />
State<br />
Target<br />
LEA<br />
Rate<br />
Target<br />
Met by<br />
LEA(Y/N)<br />
C) Use of Appropriate Behaviors<br />
to Meet Their Needs<br />
State<br />
Rate<br />
State<br />
Target<br />
LEA<br />
Rate<br />
Target<br />
Met by<br />
LEA(Y/N)<br />
89.61% 90.50% — — N/A 90.31% 90.50% — — N/A 90.82% 92.50% — — N/A<br />
66.58% 69.50% — — N/A 57.43% 60.50% — — N/A 76.69% 78.50% — — N/A<br />
NOTE: * Including social relationships ** Including early language/ communication and early literacy<br />
Note: - - denotes not applicable<br />
State<br />
Rate<br />
LEA<br />
Rate<br />
— —<br />
— —<br />
— —<br />
— —<br />
— —<br />
C) Use of<br />
Appropriate<br />
Behaviors to<br />
Meet Their Needs<br />
State<br />
Rate<br />
4.51%<br />
17.34%<br />
41.72%<br />
34.97%<br />
LEA<br />
Rate<br />
1.46% — —<br />
— —<br />
— —<br />
— —<br />
— —<br />
Page 3 of 5
LEA: 5504 - SOUTH PIKE COUNTY SCHOOL <strong>DISTRICT</strong><br />
Indicator 08: Parent Involvement<br />
Percent of surveyed<br />
parents who reported<br />
school facilitated parent<br />
involvement as a means<br />
of improving services<br />
and results for children<br />
with disabilities.<br />
Early Childhood<br />
(3-5)<br />
School Age<br />
(5-21)<br />
State<br />
Rate<br />
90.47%<br />
95.05%<br />
Indicator 09: Disproportionality - Eligibility<br />
Disproportionate representation of racial<br />
and ethnic groups in special education and<br />
related services that is a result of<br />
inappropriate identification (e.g.<br />
monitoring data, review of policies,<br />
practices, and procedures under 618(d),<br />
etc.).<br />
State<br />
Rate<br />
State<br />
Target<br />
88.00%<br />
96.00%<br />
State<br />
Target<br />
0.00% 0.00%<br />
LEA<br />
Rate<br />
— —<br />
100.00%<br />
Indicator 10: Disproportionality-Child with a Disability<br />
Disproportionate representation of racial<br />
and ethnic groups in specific disability<br />
categories that is a result of inappropriate<br />
identification (e.g. monitoring data, review<br />
of policies, practices, and procedures under<br />
618(d), etc.).<br />
Indicator 11: Child Find<br />
Percent of children with<br />
parental consent to evaluate<br />
who are evaluated within<br />
the State established timeline<br />
of 60 days.<br />
Overall<br />
(3-21)<br />
Early Childhood<br />
(3-5)<br />
School Age<br />
(5-21)<br />
State<br />
Rate<br />
0.00%<br />
Indicator 12: Early Childhood Transition<br />
Percent of children referred by Part C prior to<br />
age 3, who are found eligible for Part B, and<br />
who have an IEP developed and implemented<br />
by their third birthday.<br />
Note: - - denotes not applicable<br />
State<br />
Rate<br />
99.41%<br />
99.70%<br />
98.97%<br />
State<br />
Rate<br />
State<br />
Target<br />
0.00%<br />
State<br />
Target<br />
100.00%<br />
100.00%<br />
100.00%<br />
State<br />
Target<br />
Target Met by<br />
LEA (Y/N)<br />
Y<br />
Target Met by<br />
LEA (Y/N)<br />
Y<br />
LEA<br />
Rate<br />
100.00%<br />
— —<br />
100.00%<br />
LEA<br />
Rate<br />
Target Met by<br />
LEA (Y/N)<br />
N/A<br />
Y<br />
Note: The target for Indicator 09 is to have zero percent<br />
(0%) of districts identified as having disproportionate<br />
representation as a result of inappropriate<br />
identification in eligibility.<br />
Note: The target for Indicator 10 is to have zero<br />
percent (0%) of districts identified as having<br />
disproportionate representation as a result of<br />
inappropriate identification in a disability<br />
category.<br />
Target Met by<br />
LEA (Y/N)<br />
N/A<br />
Y<br />
Target Met<br />
by LEA<br />
(Y/N)<br />
99.21% 100.00% - - N/A<br />
Y<br />
Note: * Indicates a zero reponse rate for the<br />
district.<br />
Page 4 of 5
LEA: 5504 - SOUTH PIKE COUNTY SCHOOL <strong>DISTRICT</strong><br />
Indicator 13: Secondary Transition<br />
Percent of youth with disabilities aged 16 and<br />
up with an IEP that includes coordinated,<br />
measurable, annual IEP goals and transition<br />
services that will reasonably enable the student<br />
to meet the post-secondary goals.<br />
Indicator 14: Post-School Outcomes<br />
A. Percent of youth enrolled in higher<br />
education within one year of leaving high<br />
school.<br />
State<br />
Rate<br />
State<br />
Target<br />
Note: Data for this Indicator is from the on-site monitoring of LEAs for the given year.<br />
B. Percent of youth enrolled in higher<br />
education or competitively employed<br />
within one year of leaving high school.<br />
C. Percent of youth enrolled in higher<br />
education or in some other postsecondary<br />
education or training program; or<br />
competitively employed or in some other<br />
employment within one year of leaving<br />
high school.<br />
State<br />
Rate<br />
Indicator 20: Reported Data-Timely and Accurate*<br />
District submitted<br />
required data elements<br />
on or before due dates;<br />
made revisions within<br />
the alloted reveiw<br />
periods.<br />
Accurate and Timely<br />
Data Submission<br />
Overall (3-21)<br />
Early Childhood (3-5)<br />
School Age (5-21)<br />
State<br />
Target<br />
100.00%<br />
100.00%<br />
100.00%<br />
State<br />
Target<br />
LEA<br />
Rate<br />
LEA<br />
Rate<br />
Target Met by<br />
LEA (Y/N)<br />
Target Met<br />
by LEA<br />
(Y/N)<br />
Target Met<br />
by LEA<br />
(Y/N)<br />
*Data reviewed for timely and accurate submissions included all APSCN cycle data except for personnel<br />
Note: - - denotes not applicable<br />
96.19 100.00 — — N/A<br />
14.53<br />
State<br />
Rate<br />
49.42<br />
State<br />
Rate<br />
54.07<br />
13.00<br />
State<br />
Target<br />
49.00<br />
State<br />
Target<br />
60.00<br />
Y<br />
N/A<br />
Y<br />
— —<br />
LEA<br />
Rate<br />
— —<br />
LEA<br />
Rate<br />
— —<br />
N/A<br />
Target Met<br />
by LEA<br />
(Y/N)<br />
N/A<br />
Target Met<br />
by LEA<br />
(Y/N)<br />
N/A<br />
Page 5 of 5
<strong>ARKANSAS</strong> <strong>SPECIAL</strong> <strong>EDUCATION</strong><br />
<strong>DISTRICT</strong> <strong>ANNUAL</strong> PERFORMANCE REPORT<br />
2010/11 School Year<br />
Publication Date: March 2012<br />
Each State must have in place a State Performance Plan (SPP) to evaluate the State's efforts to meet the requirements and<br />
purposes of the implementation of the Individuals with Disabilities Education Act (IDEA). The SPP is a six-year plan, which<br />
describes Arkansas's performance on 20 indicators. The Office of Special Education Programs in the U. S. Department of<br />
Education requires that States report annually to the public on the performance of each local education agency (LEA) on 14 of<br />
20 indicators as compared with targets established by the State in the SPP. Arkansas will report indicators 1 through 14 and<br />
20 for each LEA serving children with disabilities (CWD). Any LEA not meeting targets on compliance indicators (0% for<br />
Indicators 4B, 09 & 10 and 100% for Indicators 11, 12, 13, and 20) are non-compliant with IDEA.<br />
There are no report changes for the 2010/11 school year profile; However, it is important to recognize that: .<br />
1. Indicator 01 (Graduation) is reported a year in arrear (2009/10 graduates) and is based on a four-year cohort. This<br />
means the rate is a measure of students who entered in ninth grade and graduate in four years. The calculation is a<br />
requirement under Title I of the Elementary and Secondary Education Act (ESEA).<br />
2. Indicator 02 (Drop out) is reported a year in arrear. This means the rate is a measure of students who dropped out in<br />
the 2009/10 school year. The Indicator 02 data are aligned with the Common Core of Data (CCD) requirements for<br />
grades 7-12.<br />
3. Indicator 04A and 4B (Suspension/Expulsion) is reported a year in arrear. This means the rate is a measure of<br />
students who had out-of-school suspensions and/or expulsions totaling more than 10 days.<br />
For a complete description of all the Indicators, please visit the special education website at<br />
http://arksped.k12.ar.us/sections/policy.html<br />
LEA: 5602 - HARRISBURG SCHOOL <strong>DISTRICT</strong><br />
Indicator 01: Graduation Rates (2009/10 school year) Indicator 02: Dropout Rates (2009/10 school year)<br />
Percent of youth<br />
with IEPs<br />
graduating from<br />
high school with a<br />
regular diploma<br />
State<br />
Rate<br />
State<br />
Target<br />
75.76% 85.00%<br />
LEA<br />
Rate<br />
92.31%<br />
Target Met<br />
by LEA<br />
(Y/N)<br />
Y<br />
Percent of<br />
youth with<br />
IEPs dropping<br />
out of high<br />
school<br />
State<br />
Rate<br />
Indicator 03: Assessment on Statewide Benchmark Exam (grades 3-8, 11)<br />
A) Adequate Yearly Progress<br />
n=40<br />
Literacy<br />
Mathematics<br />
Met Disability Subgroup "n"<br />
for Reporting Purposes (Y/N)<br />
State Target for % of Districts Meeting<br />
AYP for Disability Subgroup<br />
State<br />
Target<br />
3.06% 4.20%<br />
LEA<br />
Rate<br />
8.70%<br />
% of Districts Meeting AYP<br />
for Disability Subgroup<br />
Target Met by<br />
LEA (Y/N)<br />
N<br />
Target Met by<br />
LEA(Y/N)<br />
Overall N 17.15% 6.25%<br />
NA<br />
N<br />
N<br />
Note: For a district to qualify as having a disability subgroup it must have a minimum of 40 (n=40) students with disabilities in a school building.<br />
B) Participation<br />
Participation Rate: # of<br />
CWD Tested ÷ # of CWD<br />
Enrolled in grades tested.<br />
Participation Rate: Literacy<br />
Participation Rate: Math<br />
Note: - - denotes not applicable<br />
State<br />
Rate<br />
98.78%<br />
State<br />
Target<br />
95.00%<br />
LEA<br />
Rate<br />
99.03%<br />
Target Met<br />
by LEA (Y/N)<br />
98.61% 95.00% 100.00% Y<br />
Y<br />
C) Performance Proficiency<br />
Percent of CWD Scoring<br />
Proficient or Above<br />
Proficiency Rate: Literacy<br />
Proficiency Rate:<br />
Mathematics<br />
16.00%<br />
16.00%<br />
State<br />
Rate<br />
31.49%<br />
44.86%<br />
State<br />
Target<br />
45.22%<br />
51.14%<br />
LEA<br />
Rate<br />
25.26%<br />
47.96%<br />
NA<br />
NA<br />
Target<br />
Met by<br />
LEA (Y/N)<br />
N<br />
N<br />
Page 1 of 5
LEA: 5602 - HARRISBURG SCHOOL <strong>DISTRICT</strong><br />
Indicator 04: Out-of-School Suspensions and Expulsions (2009/10 school year)<br />
A) Suspension/Expulsion<br />
Percent difference of CWD with out-of- school suspensions and<br />
expulsions totaling greater than 10 days in a school year as<br />
compared to the same data for general education students in<br />
the district.<br />
B) Suspension/Expulsion by Race and Ethnicity<br />
Percent of districts that have: (a) a significant discrepancy, by race or<br />
ethnicity, in the rate of suspensions and expulsions of greater than 10<br />
days in a school year for children with IEPs; and (b) policies,<br />
procedures or practices that contribute to the significant discrepancy<br />
and do not comply with requirements relating to the development<br />
and implementation of IEPs, the use of positive behavioral<br />
interventions and supports, and procedural safeguards.<br />
Indicator 05: School Age (5-21) Least Restrictive Environment<br />
A) In the Regular Class 80% or more of the day<br />
Percent of CWD with<br />
IEPs receiving instruction<br />
in the regular class 80%<br />
or more of the day.<br />
State<br />
Rate<br />
State<br />
Target<br />
LEA<br />
Rate<br />
B) In the Regular Class less than 40% of the day<br />
Percent of CWD with<br />
IEPs receiving instruction<br />
in the regular class less<br />
than 60% of the day.<br />
53.87% 59.77%<br />
State<br />
Rate<br />
State<br />
Target<br />
12.42% 12.51%<br />
41.21%<br />
LEA<br />
Rate<br />
10.91%<br />
C) Other Settings outside the regular class<br />
Percent of CWD with IEPs served in<br />
public or private separate schools,<br />
residential placements, or<br />
homebound/hospital placements.<br />
State<br />
Rate<br />
State<br />
Target<br />
2.80% 2.56%<br />
Target Met<br />
by LEA (Y/N)<br />
N<br />
Target Met<br />
by LEA (Y/N)<br />
Y<br />
LEA<br />
Rate<br />
1.21%<br />
Target Met<br />
by LEA(Y/N)<br />
Indicator 06: Early Childhood (3-5) Least Restrictive Environment<br />
A) Regular Early Childhood Program<br />
Percent of children (aged 3 through 5) with IEPs attending a regular<br />
early childhood program and receiving the majority of special<br />
education and related services in the regular early childhood program<br />
Allowable<br />
Difference<br />
LEA: 5602 - HARRISBURG SCHOOL <strong>DISTRICT</strong><br />
Indicator 07: Preschool (3-5) Outcomes<br />
a) Percent of preschool CWD<br />
children who did not<br />
improve functioning.<br />
b) Percent of preschool CWD<br />
who improved but whose<br />
functioning remained below<br />
same age peers.<br />
c) Percent of preschool CWD<br />
who improved at a level<br />
nearer to same aged peers.<br />
d) Percent of preschool CWD<br />
who improved functioning to<br />
reach a level comparable to<br />
same age peers.<br />
e) Percent of preschool CWD<br />
children who maintain<br />
functioning at a level<br />
comparable to same aged<br />
peers.<br />
Summary<br />
Statements<br />
1) Of those preschool<br />
children who entered<br />
the preschool program<br />
below age expectations<br />
in each Outcome, the<br />
percent who<br />
substantially increased<br />
their rate of growth by<br />
the time they turned 6<br />
years of age or exited<br />
the program.<br />
2) The percent of<br />
preschool children who<br />
were functioning<br />
within age expectations<br />
in each Outcome by the<br />
time they turned 6<br />
years of age or exited<br />
A) Positive Social -Emotional<br />
Skills*<br />
State<br />
Rate<br />
A) Positive Social -<br />
Emotional Skills<br />
(Including social<br />
relationships)<br />
State<br />
Rate<br />
2.14%<br />
5.31%<br />
25.97%<br />
38.22%<br />
28.36%<br />
State<br />
Target<br />
LEA<br />
Rate<br />
LEA<br />
Rate<br />
— —<br />
— —<br />
— —<br />
— —<br />
— —<br />
Target<br />
Met by<br />
LEA(Y/N)<br />
B) Acquisition and Use of<br />
Knowledge and Skills<br />
(Including early language/<br />
communication and early literacy)<br />
B) Acquisition and Use of<br />
Knowledge and Skills **<br />
State<br />
Rate<br />
1.75%<br />
6.59%<br />
34.23%<br />
43.51%<br />
13.92%<br />
State<br />
Target<br />
LEA<br />
Rate<br />
Target<br />
Met by<br />
LEA(Y/N)<br />
C) Use of Appropriate Behaviors<br />
to Meet Their Needs<br />
State<br />
Rate<br />
State<br />
Target<br />
LEA<br />
Rate<br />
Target<br />
Met by<br />
LEA(Y/N)<br />
89.61% 90.50% — — N/A 90.31% 90.50% — — N/A 90.82% 92.50% — — N/A<br />
66.58% 69.50% — — N/A 57.43% 60.50% — — N/A 76.69% 78.50% — — N/A<br />
NOTE: * Including social relationships ** Including early language/ communication and early literacy<br />
Note: - - denotes not applicable<br />
State<br />
Rate<br />
LEA<br />
Rate<br />
— —<br />
— —<br />
— —<br />
— —<br />
— —<br />
C) Use of<br />
Appropriate<br />
Behaviors to<br />
Meet Their Needs<br />
State<br />
Rate<br />
4.51%<br />
17.34%<br />
41.72%<br />
34.97%<br />
LEA<br />
Rate<br />
1.46% — —<br />
— —<br />
— —<br />
— —<br />
— —<br />
Page 3 of 5
LEA: 5602 - HARRISBURG SCHOOL <strong>DISTRICT</strong><br />
Indicator 08: Parent Involvement<br />
Percent of surveyed<br />
parents who reported<br />
school facilitated parent<br />
involvement as a means<br />
of improving services<br />
and results for children<br />
with disabilities.<br />
Early Childhood<br />
(3-5)<br />
School Age<br />
(5-21)<br />
State<br />
Rate<br />
90.47%<br />
95.05%<br />
Indicator 09: Disproportionality - Eligibility<br />
Disproportionate representation of racial<br />
and ethnic groups in special education and<br />
related services that is a result of<br />
inappropriate identification (e.g.<br />
monitoring data, review of policies,<br />
practices, and procedures under 618(d),<br />
etc.).<br />
State<br />
Rate<br />
State<br />
Target<br />
88.00%<br />
96.00%<br />
State<br />
Target<br />
0.00% 0.00%<br />
LEA<br />
Rate<br />
— —<br />
94.55%<br />
Indicator 10: Disproportionality-Child with a Disability<br />
Disproportionate representation of racial<br />
and ethnic groups in specific disability<br />
categories that is a result of inappropriate<br />
identification (e.g. monitoring data, review<br />
of policies, practices, and procedures under<br />
618(d), etc.).<br />
Indicator 11: Child Find<br />
Percent of children with<br />
parental consent to evaluate<br />
who are evaluated within<br />
the State established timeline<br />
of 60 days.<br />
Overall<br />
(3-21)<br />
Early Childhood<br />
(3-5)<br />
School Age<br />
(5-21)<br />
State<br />
Rate<br />
0.00%<br />
Indicator 12: Early Childhood Transition<br />
Percent of children referred by Part C prior to<br />
age 3, who are found eligible for Part B, and<br />
who have an IEP developed and implemented<br />
by their third birthday.<br />
Note: - - denotes not applicable<br />
State<br />
Rate<br />
99.41%<br />
99.70%<br />
98.97%<br />
State<br />
Rate<br />
State<br />
Target<br />
0.00%<br />
State<br />
Target<br />
100.00%<br />
100.00%<br />
100.00%<br />
State<br />
Target<br />
Target Met by<br />
LEA (Y/N)<br />
Y<br />
Target Met by<br />
LEA (Y/N)<br />
Y<br />
LEA<br />
Rate<br />
100.00%<br />
— —<br />
100.00%<br />
LEA<br />
Rate<br />
Target Met by<br />
LEA (Y/N)<br />
N/A<br />
N<br />
Note: The target for Indicator 09 is to have zero percent<br />
(0%) of districts identified as having disproportionate<br />
representation as a result of inappropriate<br />
identification in eligibility.<br />
Note: The target for Indicator 10 is to have zero<br />
percent (0%) of districts identified as having<br />
disproportionate representation as a result of<br />
inappropriate identification in a disability<br />
category.<br />
Target Met by<br />
LEA (Y/N)<br />
N/A<br />
Y<br />
Target Met<br />
by LEA<br />
(Y/N)<br />
99.21% 100.00% - - N/A<br />
Y<br />
Note: * Indicates a zero reponse rate for the<br />
district.<br />
Page 4 of 5
LEA: 5602 - HARRISBURG SCHOOL <strong>DISTRICT</strong><br />
Indicator 13: Secondary Transition<br />
Percent of youth with disabilities aged 16 and<br />
up with an IEP that includes coordinated,<br />
measurable, annual IEP goals and transition<br />
services that will reasonably enable the student<br />
to meet the post-secondary goals.<br />
Indicator 14: Post-School Outcomes<br />
A. Percent of youth enrolled in higher<br />
education within one year of leaving high<br />
school.<br />
State<br />
Rate<br />
State<br />
Target<br />
Note: Data for this Indicator is from the on-site monitoring of LEAs for the given year.<br />
B. Percent of youth enrolled in higher<br />
education or competitively employed<br />
within one year of leaving high school.<br />
C. Percent of youth enrolled in higher<br />
education or in some other postsecondary<br />
education or training program; or<br />
competitively employed or in some other<br />
employment within one year of leaving<br />
high school.<br />
State<br />
Rate<br />
Indicator 20: Reported Data-Timely and Accurate*<br />
District submitted<br />
required data elements<br />
on or before due dates;<br />
made revisions within<br />
the alloted reveiw<br />
periods.<br />
Accurate and Timely<br />
Data Submission<br />
Overall (3-21)<br />
Early Childhood (3-5)<br />
School Age (5-21)<br />
State<br />
Target<br />
100.00%<br />
100.00%<br />
100.00%<br />
State<br />
Target<br />
LEA<br />
Rate<br />
LEA<br />
Rate<br />
Target Met by<br />
LEA (Y/N)<br />
Target Met<br />
by LEA<br />
(Y/N)<br />
Target Met<br />
by LEA<br />
(Y/N)<br />
*Data reviewed for timely and accurate submissions included all APSCN cycle data except for personnel<br />
Note: - - denotes not applicable<br />
96.19 100.00 — — N/A<br />
14.53<br />
State<br />
Rate<br />
49.42<br />
State<br />
Rate<br />
54.07<br />
13.00<br />
State<br />
Target<br />
49.00<br />
State<br />
Target<br />
60.00<br />
Y<br />
N/A<br />
Y<br />
— —<br />
LEA<br />
Rate<br />
— —<br />
LEA<br />
Rate<br />
— —<br />
N/A<br />
Target Met<br />
by LEA<br />
(Y/N)<br />
N/A<br />
Target Met<br />
by LEA<br />
(Y/N)<br />
N/A<br />
Page 5 of 5
<strong>ARKANSAS</strong> <strong>SPECIAL</strong> <strong>EDUCATION</strong><br />
<strong>DISTRICT</strong> <strong>ANNUAL</strong> PERFORMANCE REPORT<br />
2010/11 School Year<br />
Publication Date: March 2012<br />
Each State must have in place a State Performance Plan (SPP) to evaluate the State's efforts to meet the requirements and<br />
purposes of the implementation of the Individuals with Disabilities Education Act (IDEA). The SPP is a six-year plan, which<br />
describes Arkansas's performance on 20 indicators. The Office of Special Education Programs in the U. S. Department of<br />
Education requires that States report annually to the public on the performance of each local education agency (LEA) on 14 of<br />
20 indicators as compared with targets established by the State in the SPP. Arkansas will report indicators 1 through 14 and<br />
20 for each LEA serving children with disabilities (CWD). Any LEA not meeting targets on compliance indicators (0% for<br />
Indicators 4B, 09 & 10 and 100% for Indicators 11, 12, 13, and 20) are non-compliant with IDEA.<br />
There are no report changes for the 2010/11 school year profile; However, it is important to recognize that: .<br />
1. Indicator 01 (Graduation) is reported a year in arrear (2009/10 graduates) and is based on a four-year cohort. This<br />
means the rate is a measure of students who entered in ninth grade and graduate in four years. The calculation is a<br />
requirement under Title I of the Elementary and Secondary Education Act (ESEA).<br />
2. Indicator 02 (Drop out) is reported a year in arrear. This means the rate is a measure of students who dropped out in<br />
the 2009/10 school year. The Indicator 02 data are aligned with the Common Core of Data (CCD) requirements for<br />
grades 7-12.<br />
3. Indicator 04A and 4B (Suspension/Expulsion) is reported a year in arrear. This means the rate is a measure of<br />
students who had out-of-school suspensions and/or expulsions totaling more than 10 days.<br />
For a complete description of all the Indicators, please visit the special education website at<br />
http://arksped.k12.ar.us/sections/policy.html<br />
LEA: 5604 - MARKED TREE SCHOOL <strong>DISTRICT</strong><br />
Indicator 01: Graduation Rates (2009/10 school year) Indicator 02: Dropout Rates (2009/10 school year)<br />
Percent of youth<br />
with IEPs<br />
graduating from<br />
high school with a<br />
regular diploma<br />
State<br />
Rate<br />
State<br />
Target<br />
75.76% 85.00%<br />
LEA<br />
Rate<br />
100.00%<br />
Target Met<br />
by LEA<br />
(Y/N)<br />
Y<br />
Percent of<br />
youth with<br />
IEPs dropping<br />
out of high<br />
school<br />
State<br />
Rate<br />
Indicator 03: Assessment on Statewide Benchmark Exam (grades 3-8, 11)<br />
A) Adequate Yearly Progress<br />
n=40<br />
Literacy<br />
Mathematics<br />
Met Disability Subgroup "n"<br />
for Reporting Purposes (Y/N)<br />
State Target for % of Districts Meeting<br />
AYP for Disability Subgroup<br />
State<br />
Target<br />
3.06% 4.20%<br />
LEA<br />
Rate<br />
0.00%<br />
% of Districts Meeting AYP<br />
for Disability Subgroup<br />
Target Met by<br />
LEA (Y/N)<br />
Y<br />
Target Met by<br />
LEA(Y/N)<br />
Overall N 17.15% 6.25%<br />
NA<br />
N<br />
N<br />
Note: For a district to qualify as having a disability subgroup it must have a minimum of 40 (n=40) students with disabilities in a school building.<br />
B) Participation<br />
Participation Rate: # of<br />
CWD Tested ÷ # of CWD<br />
Enrolled in grades tested.<br />
Participation Rate: Literacy<br />
Participation Rate: Math<br />
Note: - - denotes not applicable<br />
State<br />
Rate<br />
98.78%<br />
State<br />
Target<br />
95.00%<br />
LEA<br />
Rate<br />
100.00%<br />
Target Met<br />
by LEA (Y/N)<br />
98.61% 95.00% 98.25% Y<br />
Y<br />
C) Performance Proficiency<br />
Percent of CWD Scoring<br />
Proficient or Above<br />
Proficiency Rate: Literacy<br />
Proficiency Rate:<br />
Mathematics<br />
16.00%<br />
16.00%<br />
State<br />
Rate<br />
31.49%<br />
44.86%<br />
State<br />
Target<br />
45.22%<br />
51.14%<br />
LEA<br />
Rate<br />
22.41%<br />
35.19%<br />
NA<br />
NA<br />
Target<br />
Met by<br />
LEA (Y/N)<br />
N<br />
N<br />
Page 1 of 5
LEA: 5604 - MARKED TREE SCHOOL <strong>DISTRICT</strong><br />
Indicator 04: Out-of-School Suspensions and Expulsions (2009/10 school year)<br />
A) Suspension/Expulsion<br />
Percent difference of CWD with out-of- school suspensions and<br />
expulsions totaling greater than 10 days in a school year as<br />
compared to the same data for general education students in<br />
the district.<br />
B) Suspension/Expulsion by Race and Ethnicity<br />
Percent of districts that have: (a) a significant discrepancy, by race or<br />
ethnicity, in the rate of suspensions and expulsions of greater than 10<br />
days in a school year for children with IEPs; and (b) policies,<br />
procedures or practices that contribute to the significant discrepancy<br />
and do not comply with requirements relating to the development<br />
and implementation of IEPs, the use of positive behavioral<br />
interventions and supports, and procedural safeguards.<br />
Indicator 05: School Age (5-21) Least Restrictive Environment<br />
A) In the Regular Class 80% or more of the day<br />
Percent of CWD with<br />
IEPs receiving instruction<br />
in the regular class 80%<br />
or more of the day.<br />
State<br />
Rate<br />
State<br />
Target<br />
LEA<br />
Rate<br />
B) In the Regular Class less than 40% of the day<br />
Percent of CWD with<br />
IEPs receiving instruction<br />
in the regular class less<br />
than 60% of the day.<br />
53.87% 59.77%<br />
State<br />
Rate<br />
State<br />
Target<br />
12.42% 12.51%<br />
33.65%<br />
LEA<br />
Rate<br />
24.04%<br />
C) Other Settings outside the regular class<br />
Percent of CWD with IEPs served in<br />
public or private separate schools,<br />
residential placements, or<br />
homebound/hospital placements.<br />
State<br />
Rate<br />
State<br />
Target<br />
2.80% 2.56%<br />
Target Met<br />
by LEA (Y/N)<br />
N<br />
Target Met<br />
by LEA (Y/N)<br />
N<br />
LEA<br />
Rate<br />
0.00%<br />
Target Met<br />
by LEA(Y/N)<br />
Indicator 06: Early Childhood (3-5) Least Restrictive Environment<br />
A) Regular Early Childhood Program<br />
Percent of children (aged 3 through 5) with IEPs attending a regular<br />
early childhood program and receiving the majority of special<br />
education and related services in the regular early childhood program<br />
Allowable<br />
Difference<br />
LEA: 5604 - MARKED TREE SCHOOL <strong>DISTRICT</strong><br />
Indicator 07: Preschool (3-5) Outcomes<br />
a) Percent of preschool CWD<br />
children who did not<br />
improve functioning.<br />
b) Percent of preschool CWD<br />
who improved but whose<br />
functioning remained below<br />
same age peers.<br />
c) Percent of preschool CWD<br />
who improved at a level<br />
nearer to same aged peers.<br />
d) Percent of preschool CWD<br />
who improved functioning to<br />
reach a level comparable to<br />
same age peers.<br />
e) Percent of preschool CWD<br />
children who maintain<br />
functioning at a level<br />
comparable to same aged<br />
peers.<br />
Summary<br />
Statements<br />
1) Of those preschool<br />
children who entered<br />
the preschool program<br />
below age expectations<br />
in each Outcome, the<br />
percent who<br />
substantially increased<br />
their rate of growth by<br />
the time they turned 6<br />
years of age or exited<br />
the program.<br />
2) The percent of<br />
preschool children who<br />
were functioning<br />
within age expectations<br />
in each Outcome by the<br />
time they turned 6<br />
years of age or exited<br />
A) Positive Social -Emotional<br />
Skills*<br />
State<br />
Rate<br />
A) Positive Social -<br />
Emotional Skills<br />
(Including social<br />
relationships)<br />
State<br />
Rate<br />
2.14%<br />
5.31%<br />
25.97%<br />
38.22%<br />
28.36%<br />
State<br />
Target<br />
LEA<br />
Rate<br />
LEA<br />
Rate<br />
— —<br />
— —<br />
— —<br />
— —<br />
— —<br />
Target<br />
Met by<br />
LEA(Y/N)<br />
B) Acquisition and Use of<br />
Knowledge and Skills<br />
(Including early language/<br />
communication and early literacy)<br />
B) Acquisition and Use of<br />
Knowledge and Skills **<br />
State<br />
Rate<br />
1.75%<br />
6.59%<br />
34.23%<br />
43.51%<br />
13.92%<br />
State<br />
Target<br />
LEA<br />
Rate<br />
Target<br />
Met by<br />
LEA(Y/N)<br />
C) Use of Appropriate Behaviors<br />
to Meet Their Needs<br />
State<br />
Rate<br />
State<br />
Target<br />
LEA<br />
Rate<br />
Target<br />
Met by<br />
LEA(Y/N)<br />
89.61% 90.50% — — N/A 90.31% 90.50% — — N/A 90.82% 92.50% — — N/A<br />
66.58% 69.50% — — N/A 57.43% 60.50% — — N/A 76.69% 78.50% — — N/A<br />
NOTE: * Including social relationships ** Including early language/ communication and early literacy<br />
Note: - - denotes not applicable<br />
State<br />
Rate<br />
LEA<br />
Rate<br />
— —<br />
— —<br />
— —<br />
— —<br />
— —<br />
C) Use of<br />
Appropriate<br />
Behaviors to<br />
Meet Their Needs<br />
State<br />
Rate<br />
4.51%<br />
17.34%<br />
41.72%<br />
34.97%<br />
LEA<br />
Rate<br />
1.46% — —<br />
— —<br />
— —<br />
— —<br />
— —<br />
Page 3 of 5
LEA: 5604 - MARKED TREE SCHOOL <strong>DISTRICT</strong><br />
Indicator 08: Parent Involvement<br />
Percent of surveyed<br />
parents who reported<br />
school facilitated parent<br />
involvement as a means<br />
of improving services<br />
and results for children<br />
with disabilities.<br />
Early Childhood<br />
(3-5)<br />
School Age<br />
(5-21)<br />
State<br />
Rate<br />
90.47%<br />
95.05%<br />
Indicator 09: Disproportionality - Eligibility<br />
Disproportionate representation of racial<br />
and ethnic groups in special education and<br />
related services that is a result of<br />
inappropriate identification (e.g.<br />
monitoring data, review of policies,<br />
practices, and procedures under 618(d),<br />
etc.).<br />
State<br />
Rate<br />
State<br />
Target<br />
88.00%<br />
96.00%<br />
State<br />
Target<br />
0.00% 0.00%<br />
LEA<br />
Rate<br />
— —<br />
90.48%<br />
Indicator 10: Disproportionality-Child with a Disability<br />
Disproportionate representation of racial<br />
and ethnic groups in specific disability<br />
categories that is a result of inappropriate<br />
identification (e.g. monitoring data, review<br />
of policies, practices, and procedures under<br />
618(d), etc.).<br />
Indicator 11: Child Find<br />
Percent of children with<br />
parental consent to evaluate<br />
who are evaluated within<br />
the State established timeline<br />
of 60 days.<br />
Overall<br />
(3-21)<br />
Early Childhood<br />
(3-5)<br />
School Age<br />
(5-21)<br />
State<br />
Rate<br />
0.00%<br />
Indicator 12: Early Childhood Transition<br />
Percent of children referred by Part C prior to<br />
age 3, who are found eligible for Part B, and<br />
who have an IEP developed and implemented<br />
by their third birthday.<br />
Note: - - denotes not applicable<br />
State<br />
Rate<br />
99.41%<br />
99.70%<br />
98.97%<br />
State<br />
Rate<br />
State<br />
Target<br />
0.00%<br />
State<br />
Target<br />
100.00%<br />
100.00%<br />
100.00%<br />
State<br />
Target<br />
Target Met by<br />
LEA (Y/N)<br />
Y<br />
Target Met by<br />
LEA (Y/N)<br />
Y<br />
LEA<br />
Rate<br />
100.00%<br />
— —<br />
100.00%<br />
LEA<br />
Rate<br />
Target Met by<br />
LEA (Y/N)<br />
N/A<br />
N<br />
Note: The target for Indicator 09 is to have zero percent<br />
(0%) of districts identified as having disproportionate<br />
representation as a result of inappropriate<br />
identification in eligibility.<br />
Note: The target for Indicator 10 is to have zero<br />
percent (0%) of districts identified as having<br />
disproportionate representation as a result of<br />
inappropriate identification in a disability<br />
category.<br />
Target Met by<br />
LEA (Y/N)<br />
N/A<br />
Y<br />
Target Met<br />
by LEA<br />
(Y/N)<br />
99.21% 100.00% - - N/A<br />
Y<br />
Note: * Indicates a zero reponse rate for the<br />
district.<br />
Page 4 of 5
LEA: 5604 - MARKED TREE SCHOOL <strong>DISTRICT</strong><br />
Indicator 13: Secondary Transition<br />
Percent of youth with disabilities aged 16 and<br />
up with an IEP that includes coordinated,<br />
measurable, annual IEP goals and transition<br />
services that will reasonably enable the student<br />
to meet the post-secondary goals.<br />
Indicator 14: Post-School Outcomes<br />
A. Percent of youth enrolled in higher<br />
education within one year of leaving high<br />
school.<br />
State<br />
Rate<br />
State<br />
Target<br />
Note: Data for this Indicator is from the on-site monitoring of LEAs for the given year.<br />
B. Percent of youth enrolled in higher<br />
education or competitively employed<br />
within one year of leaving high school.<br />
C. Percent of youth enrolled in higher<br />
education or in some other postsecondary<br />
education or training program; or<br />
competitively employed or in some other<br />
employment within one year of leaving<br />
high school.<br />
State<br />
Rate<br />
Indicator 20: Reported Data-Timely and Accurate*<br />
District submitted<br />
required data elements<br />
on or before due dates;<br />
made revisions within<br />
the alloted reveiw<br />
periods.<br />
Accurate and Timely<br />
Data Submission<br />
Overall (3-21)<br />
Early Childhood (3-5)<br />
School Age (5-21)<br />
State<br />
Target<br />
100.00%<br />
100.00%<br />
100.00%<br />
State<br />
Target<br />
LEA<br />
Rate<br />
LEA<br />
Rate<br />
Target Met by<br />
LEA (Y/N)<br />
Target Met<br />
by LEA<br />
(Y/N)<br />
Target Met<br />
by LEA<br />
(Y/N)<br />
*Data reviewed for timely and accurate submissions included all APSCN cycle data except for personnel<br />
Note: - - denotes not applicable<br />
96.19 100.00 — — N/A<br />
14.53<br />
State<br />
Rate<br />
49.42<br />
State<br />
Rate<br />
54.07<br />
13.00<br />
State<br />
Target<br />
49.00<br />
State<br />
Target<br />
60.00<br />
Y<br />
N/A<br />
Y<br />
— —<br />
LEA<br />
Rate<br />
— —<br />
LEA<br />
Rate<br />
— —<br />
N/A<br />
Target Met<br />
by LEA<br />
(Y/N)<br />
N/A<br />
Target Met<br />
by LEA<br />
(Y/N)<br />
N/A<br />
Page 5 of 5
LEA: 5605 - TRUMANN SCHOOL <strong>DISTRICT</strong><br />
<strong>ARKANSAS</strong> <strong>SPECIAL</strong> <strong>EDUCATION</strong><br />
<strong>DISTRICT</strong> <strong>ANNUAL</strong> PERFORMANCE REPORT<br />
2010/11 School Year<br />
Publication Date: March 2012<br />
Each State must have in place a State Performance Plan (SPP) to evaluate the State's efforts to meet the requirements and<br />
purposes of the implementation of the Individuals with Disabilities Education Act (IDEA). The SPP is a six-year plan, which<br />
describes Arkansas's performance on 20 indicators. The Office of Special Education Programs in the U. S. Department of<br />
Education requires that States report annually to the public on the performance of each local education agency (LEA) on 14 of<br />
20 indicators as compared with targets established by the State in the SPP. Arkansas will report indicators 1 through 14 and<br />
20 for each LEA serving children with disabilities (CWD). Any LEA not meeting targets on compliance indicators (0% for<br />
Indicators 4B, 09 & 10 and 100% for Indicators 11, 12, 13, and 20) are non-compliant with IDEA.<br />
There are no report changes for the 2010/11 school year profile; However, it is important to recognize that: .<br />
1. Indicator 01 (Graduation) is reported a year in arrear (2009/10 graduates) and is based on a four-year cohort. This<br />
means the rate is a measure of students who entered in ninth grade and graduate in four years. The calculation is a<br />
requirement under Title I of the Elementary and Secondary Education Act (ESEA).<br />
2. Indicator 02 (Drop out) is reported a year in arrear. This means the rate is a measure of students who dropped out in<br />
the 2009/10 school year. The Indicator 02 data are aligned with the Common Core of Data (CCD) requirements for<br />
grades 7-12.<br />
3. Indicator 04A and 4B (Suspension/Expulsion) is reported a year in arrear. This means the rate is a measure of<br />
students who had out-of-school suspensions and/or expulsions totaling more than 10 days.<br />
Percent of youth<br />
with IEPs<br />
graduating from<br />
high school with a<br />
regular diploma<br />
For a complete description of all the Indicators, please visit the special education website at<br />
http://arksped.k12.ar.us/sections/policy.html<br />
Indicator 01: Graduation Rates (2009/10 school year) Indicator 02: Dropout Rates (2009/10 school year)<br />
State<br />
Rate<br />
State<br />
Target<br />
75.76% 85.00%<br />
LEA<br />
Rate<br />
74.07%<br />
Target Met<br />
by LEA<br />
(Y/N)<br />
N<br />
Percent of<br />
youth with<br />
IEPs dropping<br />
out of high<br />
school<br />
State<br />
Rate<br />
Indicator 03: Assessment on Statewide Benchmark Exam (grades 3-8, 11)<br />
A) Adequate Yearly Progress<br />
n=40<br />
Literacy<br />
Mathematics<br />
Met Disability Subgroup "n"<br />
for Reporting Purposes (Y/N)<br />
State Target for % of Districts Meeting<br />
AYP for Disability Subgroup<br />
State<br />
Target<br />
3.06% 4.20%<br />
LEA<br />
Rate<br />
3.81%<br />
% of Districts Meeting AYP<br />
for Disability Subgroup<br />
Target Met by<br />
LEA (Y/N)<br />
Y<br />
Target Met by<br />
LEA(Y/N)<br />
Overall N 17.15% 6.25%<br />
NA<br />
N<br />
N<br />
Note: For a district to qualify as having a disability subgroup it must have a minimum of 40 (n=40) students with disabilities in a school building.<br />
B) Participation<br />
Participation Rate: # of<br />
CWD Tested ÷ # of CWD<br />
Enrolled in grades tested.<br />
Participation Rate: Literacy<br />
Participation Rate: Math<br />
Note: - - denotes not applicable<br />
State<br />
Rate<br />
98.78%<br />
State<br />
Target<br />
95.00%<br />
LEA<br />
Rate<br />
99.32%<br />
Target Met<br />
by LEA (Y/N)<br />
98.61% 95.00% 99.33% Y<br />
Y<br />
C) Performance Proficiency<br />
Percent of CWD Scoring<br />
Proficient or Above<br />
Proficiency Rate: Literacy<br />
Proficiency Rate:<br />
Mathematics<br />
16.00%<br />
16.00%<br />
State<br />
Rate<br />
31.49%<br />
44.86%<br />
State<br />
Target<br />
45.22%<br />
51.14%<br />
LEA<br />
Rate<br />
27.69%<br />
46.21%<br />
NA<br />
NA<br />
Target<br />
Met by<br />
LEA (Y/N)<br />
N<br />
N<br />
Page 1 of 5
LEA: 5605 - TRUMANN SCHOOL <strong>DISTRICT</strong><br />
Indicator 04: Out-of-School Suspensions and Expulsions (2009/10 school year)<br />
A) Suspension/Expulsion<br />
Percent difference of CWD with out-of- school suspensions and<br />
expulsions totaling greater than 10 days in a school year as<br />
compared to the same data for general education students in<br />
the district.<br />
B) Suspension/Expulsion by Race and Ethnicity<br />
Percent of districts that have: (a) a significant discrepancy, by race or<br />
ethnicity, in the rate of suspensions and expulsions of greater than 10<br />
days in a school year for children with IEPs; and (b) policies,<br />
procedures or practices that contribute to the significant discrepancy<br />
and do not comply with requirements relating to the development<br />
and implementation of IEPs, the use of positive behavioral<br />
interventions and supports, and procedural safeguards.<br />
Indicator 05: School Age (5-21) Least Restrictive Environment<br />
A) In the Regular Class 80% or more of the day<br />
Percent of CWD with<br />
IEPs receiving instruction<br />
in the regular class 80%<br />
or more of the day.<br />
State<br />
Rate<br />
State<br />
Target<br />
LEA<br />
Rate<br />
B) In the Regular Class less than 40% of the day<br />
Percent of CWD with<br />
IEPs receiving instruction<br />
in the regular class less<br />
than 60% of the day.<br />
53.87% 59.77%<br />
State<br />
Rate<br />
State<br />
Target<br />
12.42% 12.51%<br />
61.29%<br />
LEA<br />
Rate<br />
20.97%<br />
C) Other Settings outside the regular class<br />
Percent of CWD with IEPs served in<br />
public or private separate schools,<br />
residential placements, or<br />
homebound/hospital placements.<br />
State<br />
Rate<br />
State<br />
Target<br />
2.80% 2.56%<br />
Target Met<br />
by LEA (Y/N)<br />
Y<br />
Target Met<br />
by LEA (Y/N)<br />
N<br />
LEA<br />
Rate<br />
0.00%<br />
Target Met<br />
by LEA(Y/N)<br />
Indicator 06: Early Childhood (3-5) Least Restrictive Environment<br />
A) Regular Early Childhood Program<br />
Percent of children (aged 3 through 5) with IEPs attending a regular<br />
early childhood program and receiving the majority of special<br />
education and related services in the regular early childhood program<br />
Allowable<br />
Difference<br />
LEA: 5605 - TRUMANN SCHOOL <strong>DISTRICT</strong><br />
Indicator 07: Preschool (3-5) Outcomes<br />
a) Percent of preschool CWD<br />
children who did not<br />
improve functioning.<br />
b) Percent of preschool CWD<br />
who improved but whose<br />
functioning remained below<br />
same age peers.<br />
c) Percent of preschool CWD<br />
who improved at a level<br />
nearer to same aged peers.<br />
d) Percent of preschool CWD<br />
who improved functioning to<br />
reach a level comparable to<br />
same age peers.<br />
e) Percent of preschool CWD<br />
children who maintain<br />
functioning at a level<br />
comparable to same aged<br />
peers.<br />
Summary<br />
Statements<br />
1) Of those preschool<br />
children who entered<br />
the preschool program<br />
below age expectations<br />
in each Outcome, the<br />
percent who<br />
substantially increased<br />
their rate of growth by<br />
the time they turned 6<br />
years of age or exited<br />
the program.<br />
2) The percent of<br />
preschool children who<br />
were functioning<br />
within age expectations<br />
in each Outcome by the<br />
time they turned 6<br />
years of age or exited<br />
A) Positive Social -Emotional<br />
Skills*<br />
State<br />
Rate<br />
A) Positive Social -<br />
Emotional Skills<br />
(Including social<br />
relationships)<br />
State<br />
Rate<br />
2.14%<br />
5.31%<br />
25.97%<br />
38.22%<br />
28.36%<br />
State<br />
Target<br />
LEA<br />
Rate<br />
LEA<br />
Rate<br />
— —<br />
— —<br />
— —<br />
— —<br />
— —<br />
Target<br />
Met by<br />
LEA(Y/N)<br />
B) Acquisition and Use of<br />
Knowledge and Skills<br />
(Including early language/<br />
communication and early literacy)<br />
B) Acquisition and Use of<br />
Knowledge and Skills **<br />
State<br />
Rate<br />
1.75%<br />
6.59%<br />
34.23%<br />
43.51%<br />
13.92%<br />
State<br />
Target<br />
LEA<br />
Rate<br />
Target<br />
Met by<br />
LEA(Y/N)<br />
C) Use of Appropriate Behaviors<br />
to Meet Their Needs<br />
State<br />
Rate<br />
State<br />
Target<br />
LEA<br />
Rate<br />
Target<br />
Met by<br />
LEA(Y/N)<br />
89.61% 90.50% — — N/A 90.31% 90.50% — — N/A 90.82% 92.50% — — N/A<br />
66.58% 69.50% — — N/A 57.43% 60.50% — — N/A 76.69% 78.50% — — N/A<br />
NOTE: * Including social relationships ** Including early language/ communication and early literacy<br />
Note: - - denotes not applicable<br />
State<br />
Rate<br />
LEA<br />
Rate<br />
— —<br />
— —<br />
— —<br />
— —<br />
— —<br />
C) Use of<br />
Appropriate<br />
Behaviors to<br />
Meet Their Needs<br />
State<br />
Rate<br />
4.51%<br />
17.34%<br />
41.72%<br />
34.97%<br />
LEA<br />
Rate<br />
1.46% — —<br />
— —<br />
— —<br />
— —<br />
— —<br />
Page 3 of 5
LEA: 5605 - TRUMANN SCHOOL <strong>DISTRICT</strong><br />
Indicator 08: Parent Involvement<br />
Percent of surveyed<br />
parents who reported<br />
school facilitated parent<br />
involvement as a means<br />
of improving services<br />
and results for children<br />
with disabilities.<br />
Early Childhood<br />
(3-5)<br />
School Age<br />
(5-21)<br />
State<br />
Rate<br />
90.47%<br />
95.05%<br />
Indicator 09: Disproportionality - Eligibility<br />
Disproportionate representation of racial<br />
and ethnic groups in special education and<br />
related services that is a result of<br />
inappropriate identification (e.g.<br />
monitoring data, review of policies,<br />
practices, and procedures under 618(d),<br />
etc.).<br />
State<br />
Rate<br />
State<br />
Target<br />
88.00%<br />
96.00%<br />
State<br />
Target<br />
0.00% 0.00%<br />
LEA<br />
Rate<br />
— —<br />
99.34%<br />
Indicator 10: Disproportionality-Child with a Disability<br />
Disproportionate representation of racial<br />
and ethnic groups in specific disability<br />
categories that is a result of inappropriate<br />
identification (e.g. monitoring data, review<br />
of policies, practices, and procedures under<br />
618(d), etc.).<br />
Indicator 11: Child Find<br />
Percent of children with<br />
parental consent to evaluate<br />
who are evaluated within<br />
the State established timeline<br />
of 60 days.<br />
Overall<br />
(3-21)<br />
Early Childhood<br />
(3-5)<br />
School Age<br />
(5-21)<br />
State<br />
Rate<br />
0.00%<br />
Indicator 12: Early Childhood Transition<br />
Percent of children referred by Part C prior to<br />
age 3, who are found eligible for Part B, and<br />
who have an IEP developed and implemented<br />
by their third birthday.<br />
Note: - - denotes not applicable<br />
State<br />
Rate<br />
99.41%<br />
99.70%<br />
98.97%<br />
State<br />
Rate<br />
State<br />
Target<br />
0.00%<br />
State<br />
Target<br />
100.00%<br />
100.00%<br />
100.00%<br />
State<br />
Target<br />
Target Met by<br />
LEA (Y/N)<br />
Y<br />
Target Met by<br />
LEA (Y/N)<br />
Y<br />
LEA<br />
Rate<br />
100.00%<br />
— —<br />
100.00%<br />
LEA<br />
Rate<br />
Target Met by<br />
LEA (Y/N)<br />
N/A<br />
Y<br />
Note: The target for Indicator 09 is to have zero percent<br />
(0%) of districts identified as having disproportionate<br />
representation as a result of inappropriate<br />
identification in eligibility.<br />
Note: The target for Indicator 10 is to have zero<br />
percent (0%) of districts identified as having<br />
disproportionate representation as a result of<br />
inappropriate identification in a disability<br />
category.<br />
Target Met by<br />
LEA (Y/N)<br />
N/A<br />
Y<br />
Target Met<br />
by LEA<br />
(Y/N)<br />
99.21% 100.00% - - N/A<br />
Y<br />
Note: * Indicates a zero reponse rate for the<br />
district.<br />
Page 4 of 5
LEA: 5605 - TRUMANN SCHOOL <strong>DISTRICT</strong><br />
Indicator 13: Secondary Transition<br />
Percent of youth with disabilities aged 16 and<br />
up with an IEP that includes coordinated,<br />
measurable, annual IEP goals and transition<br />
services that will reasonably enable the student<br />
to meet the post-secondary goals.<br />
Indicator 14: Post-School Outcomes<br />
A. Percent of youth enrolled in higher<br />
education within one year of leaving high<br />
school.<br />
State<br />
Rate<br />
State<br />
Target<br />
Note: Data for this Indicator is from the on-site monitoring of LEAs for the given year.<br />
B. Percent of youth enrolled in higher<br />
education or competitively employed<br />
within one year of leaving high school.<br />
C. Percent of youth enrolled in higher<br />
education or in some other postsecondary<br />
education or training program; or<br />
competitively employed or in some other<br />
employment within one year of leaving<br />
high school.<br />
State<br />
Rate<br />
Indicator 20: Reported Data-Timely and Accurate*<br />
District submitted<br />
required data elements<br />
on or before due dates;<br />
made revisions within<br />
the alloted reveiw<br />
periods.<br />
Accurate and Timely<br />
Data Submission<br />
Overall (3-21)<br />
Early Childhood (3-5)<br />
School Age (5-21)<br />
State<br />
Target<br />
100.00%<br />
100.00%<br />
100.00%<br />
State<br />
Target<br />
LEA<br />
Rate<br />
LEA<br />
Rate<br />
Target Met by<br />
LEA (Y/N)<br />
Target Met<br />
by LEA<br />
(Y/N)<br />
Target Met<br />
by LEA<br />
(Y/N)<br />
*Data reviewed for timely and accurate submissions included all APSCN cycle data except for personnel<br />
Note: - - denotes not applicable<br />
96.19 100.00 — — N/A<br />
14.53<br />
State<br />
Rate<br />
49.42<br />
State<br />
Rate<br />
54.07<br />
13.00<br />
State<br />
Target<br />
49.00<br />
State<br />
Target<br />
60.00<br />
Y<br />
N/A<br />
Y<br />
— —<br />
LEA<br />
Rate<br />
— —<br />
LEA<br />
Rate<br />
— —<br />
N/A<br />
Target Met<br />
by LEA<br />
(Y/N)<br />
N/A<br />
Target Met<br />
by LEA<br />
(Y/N)<br />
N/A<br />
Page 5 of 5
<strong>ARKANSAS</strong> <strong>SPECIAL</strong> <strong>EDUCATION</strong><br />
<strong>DISTRICT</strong> <strong>ANNUAL</strong> PERFORMANCE REPORT<br />
2010/11 School Year<br />
Publication Date: March 2012<br />
Each State must have in place a State Performance Plan (SPP) to evaluate the State's efforts to meet the requirements and<br />
purposes of the implementation of the Individuals with Disabilities Education Act (IDEA). The SPP is a six-year plan, which<br />
describes Arkansas's performance on 20 indicators. The Office of Special Education Programs in the U. S. Department of<br />
Education requires that States report annually to the public on the performance of each local education agency (LEA) on 14 of<br />
20 indicators as compared with targets established by the State in the SPP. Arkansas will report indicators 1 through 14 and<br />
20 for each LEA serving children with disabilities (CWD). Any LEA not meeting targets on compliance indicators (0% for<br />
Indicators 4B, 09 & 10 and 100% for Indicators 11, 12, 13, and 20) are non-compliant with IDEA.<br />
There are no report changes for the 2010/11 school year profile; However, it is important to recognize that: .<br />
1. Indicator 01 (Graduation) is reported a year in arrear (2009/10 graduates) and is based on a four-year cohort. This<br />
means the rate is a measure of students who entered in ninth grade and graduate in four years. The calculation is a<br />
requirement under Title I of the Elementary and Secondary Education Act (ESEA).<br />
2. Indicator 02 (Drop out) is reported a year in arrear. This means the rate is a measure of students who dropped out in<br />
the 2009/10 school year. The Indicator 02 data are aligned with the Common Core of Data (CCD) requirements for<br />
grades 7-12.<br />
3. Indicator 04A and 4B (Suspension/Expulsion) is reported a year in arrear. This means the rate is a measure of<br />
students who had out-of-school suspensions and/or expulsions totaling more than 10 days.<br />
For a complete description of all the Indicators, please visit the special education website at<br />
http://arksped.k12.ar.us/sections/policy.html<br />
LEA: 5608 - EAST POINSETT CO. SCHOOL <strong>DISTRICT</strong><br />
Indicator 01: Graduation Rates (2009/10 school year) Indicator 02: Dropout Rates (2009/10 school year)<br />
Percent of youth<br />
with IEPs<br />
graduating from<br />
high school with a<br />
regular diploma<br />
State<br />
Rate<br />
State<br />
Target<br />
75.76% 85.00%<br />
LEA<br />
Rate<br />
54.55%<br />
Target Met<br />
by LEA<br />
(Y/N)<br />
N<br />
Percent of<br />
youth with<br />
IEPs dropping<br />
out of high<br />
school<br />
State<br />
Rate<br />
Indicator 03: Assessment on Statewide Benchmark Exam (grades 3-8, 11)<br />
A) Adequate Yearly Progress<br />
n=40<br />
Literacy<br />
Mathematics<br />
Met Disability Subgroup "n"<br />
for Reporting Purposes (Y/N)<br />
State Target for % of Districts Meeting<br />
AYP for Disability Subgroup<br />
State<br />
Target<br />
3.06% 4.20%<br />
LEA<br />
Rate<br />
5.77%<br />
% of Districts Meeting AYP<br />
for Disability Subgroup<br />
Target Met by<br />
LEA (Y/N)<br />
N<br />
Target Met by<br />
LEA(Y/N)<br />
Overall Y 17.15% 6.25%<br />
N<br />
Y<br />
Y<br />
Note: For a district to qualify as having a disability subgroup it must have a minimum of 40 (n=40) students with disabilities in a school building.<br />
B) Participation<br />
Participation Rate: # of<br />
CWD Tested ÷ # of CWD<br />
Enrolled in grades tested.<br />
Participation Rate: Literacy<br />
Participation Rate: Math<br />
Note: - - denotes not applicable<br />
State<br />
Rate<br />
98.78%<br />
State<br />
Target<br />
95.00%<br />
LEA<br />
Rate<br />
100.00%<br />
Target Met<br />
by LEA (Y/N)<br />
98.61% 95.00% 100.00% Y<br />
Y<br />
C) Performance Proficiency<br />
Percent of CWD Scoring<br />
Proficient or Above<br />
Proficiency Rate: Literacy<br />
Proficiency Rate:<br />
Mathematics<br />
16.00%<br />
16.00%<br />
State<br />
Rate<br />
31.49%<br />
44.86%<br />
State<br />
Target<br />
45.22%<br />
51.14%<br />
LEA<br />
Rate<br />
16.46%<br />
40.54%<br />
N<br />
N<br />
Target<br />
Met by<br />
LEA (Y/N)<br />
N<br />
N<br />
Page 1 of 5
LEA: 5608 - EAST POINSETT CO. SCHOOL <strong>DISTRICT</strong><br />
Indicator 04: Out-of-School Suspensions and Expulsions (2009/10 school year)<br />
A) Suspension/Expulsion<br />
Percent difference of CWD with out-of- school suspensions and<br />
expulsions totaling greater than 10 days in a school year as<br />
compared to the same data for general education students in<br />
the district.<br />
B) Suspension/Expulsion by Race and Ethnicity<br />
Percent of districts that have: (a) a significant discrepancy, by race or<br />
ethnicity, in the rate of suspensions and expulsions of greater than 10<br />
days in a school year for children with IEPs; and (b) policies,<br />
procedures or practices that contribute to the significant discrepancy<br />
and do not comply with requirements relating to the development<br />
and implementation of IEPs, the use of positive behavioral<br />
interventions and supports, and procedural safeguards.<br />
Indicator 05: School Age (5-21) Least Restrictive Environment<br />
A) In the Regular Class 80% or more of the day<br />
Percent of CWD with<br />
IEPs receiving instruction<br />
in the regular class 80%<br />
or more of the day.<br />
State<br />
Rate<br />
State<br />
Target<br />
LEA<br />
Rate<br />
B) In the Regular Class less than 40% of the day<br />
Percent of CWD with<br />
IEPs receiving instruction<br />
in the regular class less<br />
than 60% of the day.<br />
53.87% 59.77%<br />
State<br />
Rate<br />
State<br />
Target<br />
12.42% 12.51%<br />
55.70%<br />
LEA<br />
Rate<br />
11.41%<br />
C) Other Settings outside the regular class<br />
Percent of CWD with IEPs served in<br />
public or private separate schools,<br />
residential placements, or<br />
homebound/hospital placements.<br />
State<br />
Rate<br />
State<br />
Target<br />
2.80% 2.56%<br />
Target Met<br />
by LEA (Y/N)<br />
N<br />
Target Met<br />
by LEA (Y/N)<br />
Y<br />
LEA<br />
Rate<br />
0.00%<br />
Target Met<br />
by LEA(Y/N)<br />
Indicator 06: Early Childhood (3-5) Least Restrictive Environment<br />
A) Regular Early Childhood Program<br />
Percent of children (aged 3 through 5) with IEPs attending a regular<br />
early childhood program and receiving the majority of special<br />
education and related services in the regular early childhood program<br />
Allowable<br />
Difference<br />
LEA: 5608 - EAST POINSETT CO. SCHOOL <strong>DISTRICT</strong><br />
Indicator 07: Preschool (3-5) Outcomes<br />
a) Percent of preschool CWD<br />
children who did not<br />
improve functioning.<br />
b) Percent of preschool CWD<br />
who improved but whose<br />
functioning remained below<br />
same age peers.<br />
c) Percent of preschool CWD<br />
who improved at a level<br />
nearer to same aged peers.<br />
d) Percent of preschool CWD<br />
who improved functioning to<br />
reach a level comparable to<br />
same age peers.<br />
e) Percent of preschool CWD<br />
children who maintain<br />
functioning at a level<br />
comparable to same aged<br />
peers.<br />
Summary<br />
Statements<br />
1) Of those preschool<br />
children who entered<br />
the preschool program<br />
below age expectations<br />
in each Outcome, the<br />
percent who<br />
substantially increased<br />
their rate of growth by<br />
the time they turned 6<br />
years of age or exited<br />
the program.<br />
2) The percent of<br />
preschool children who<br />
were functioning<br />
within age expectations<br />
in each Outcome by the<br />
time they turned 6<br />
years of age or exited<br />
A) Positive Social -Emotional<br />
Skills*<br />
State<br />
Rate<br />
A) Positive Social -<br />
Emotional Skills<br />
(Including social<br />
relationships)<br />
State<br />
Rate<br />
2.14%<br />
5.31%<br />
25.97%<br />
38.22%<br />
28.36%<br />
State<br />
Target<br />
LEA<br />
Rate<br />
LEA<br />
Rate<br />
— —<br />
— —<br />
— —<br />
— —<br />
— —<br />
Target<br />
Met by<br />
LEA(Y/N)<br />
B) Acquisition and Use of<br />
Knowledge and Skills<br />
(Including early language/<br />
communication and early literacy)<br />
B) Acquisition and Use of<br />
Knowledge and Skills **<br />
State<br />
Rate<br />
1.75%<br />
6.59%<br />
34.23%<br />
43.51%<br />
13.92%<br />
State<br />
Target<br />
LEA<br />
Rate<br />
Target<br />
Met by<br />
LEA(Y/N)<br />
C) Use of Appropriate Behaviors<br />
to Meet Their Needs<br />
State<br />
Rate<br />
State<br />
Target<br />
LEA<br />
Rate<br />
Target<br />
Met by<br />
LEA(Y/N)<br />
89.61% 90.50% — — N/A 90.31% 90.50% — — N/A 90.82% 92.50% — — N/A<br />
66.58% 69.50% — — N/A 57.43% 60.50% — — N/A 76.69% 78.50% — — N/A<br />
NOTE: * Including social relationships ** Including early language/ communication and early literacy<br />
Note: - - denotes not applicable<br />
State<br />
Rate<br />
LEA<br />
Rate<br />
— —<br />
— —<br />
— —<br />
— —<br />
— —<br />
C) Use of<br />
Appropriate<br />
Behaviors to<br />
Meet Their Needs<br />
State<br />
Rate<br />
4.51%<br />
17.34%<br />
41.72%<br />
34.97%<br />
LEA<br />
Rate<br />
1.46% — —<br />
— —<br />
— —<br />
— —<br />
— —<br />
Page 3 of 5
LEA: 5608 - EAST POINSETT CO. SCHOOL <strong>DISTRICT</strong><br />
Indicator 08: Parent Involvement<br />
Percent of surveyed<br />
parents who reported<br />
school facilitated parent<br />
involvement as a means<br />
of improving services<br />
and results for children<br />
with disabilities.<br />
Early Childhood<br />
(3-5)<br />
School Age<br />
(5-21)<br />
State<br />
Rate<br />
90.47%<br />
95.05%<br />
Indicator 09: Disproportionality - Eligibility<br />
Disproportionate representation of racial<br />
and ethnic groups in special education and<br />
related services that is a result of<br />
inappropriate identification (e.g.<br />
monitoring data, review of policies,<br />
practices, and procedures under 618(d),<br />
etc.).<br />
State<br />
Rate<br />
State<br />
Target<br />
88.00%<br />
96.00%<br />
State<br />
Target<br />
0.00% 0.00%<br />
LEA<br />
Rate<br />
— —<br />
95.38%<br />
Indicator 10: Disproportionality-Child with a Disability<br />
Disproportionate representation of racial<br />
and ethnic groups in specific disability<br />
categories that is a result of inappropriate<br />
identification (e.g. monitoring data, review<br />
of policies, practices, and procedures under<br />
618(d), etc.).<br />
Indicator 11: Child Find<br />
Percent of children with<br />
parental consent to evaluate<br />
who are evaluated within<br />
the State established timeline<br />
of 60 days.<br />
Overall<br />
(3-21)<br />
Early Childhood<br />
(3-5)<br />
School Age<br />
(5-21)<br />
State<br />
Rate<br />
0.00%<br />
Indicator 12: Early Childhood Transition<br />
Percent of children referred by Part C prior to<br />
age 3, who are found eligible for Part B, and<br />
who have an IEP developed and implemented<br />
by their third birthday.<br />
Note: - - denotes not applicable<br />
State<br />
Rate<br />
99.41%<br />
99.70%<br />
98.97%<br />
State<br />
Rate<br />
State<br />
Target<br />
0.00%<br />
State<br />
Target<br />
100.00%<br />
100.00%<br />
100.00%<br />
State<br />
Target<br />
Target Met by<br />
LEA (Y/N)<br />
Y<br />
Target Met by<br />
LEA (Y/N)<br />
Y<br />
LEA<br />
Rate<br />
100.00%<br />
— —<br />
100.00%<br />
LEA<br />
Rate<br />
Target Met by<br />
LEA (Y/N)<br />
N/A<br />
N<br />
Note: The target for Indicator 09 is to have zero percent<br />
(0%) of districts identified as having disproportionate<br />
representation as a result of inappropriate<br />
identification in eligibility.<br />
Note: The target for Indicator 10 is to have zero<br />
percent (0%) of districts identified as having<br />
disproportionate representation as a result of<br />
inappropriate identification in a disability<br />
category.<br />
Target Met by<br />
LEA (Y/N)<br />
N/A<br />
Y<br />
Target Met<br />
by LEA<br />
(Y/N)<br />
99.21% 100.00% - - N/A<br />
Y<br />
Note: * Indicates a zero reponse rate for the<br />
district.<br />
Page 4 of 5
LEA: 5608 - EAST POINSETT CO. SCHOOL <strong>DISTRICT</strong><br />
Indicator 13: Secondary Transition<br />
Percent of youth with disabilities aged 16 and<br />
up with an IEP that includes coordinated,<br />
measurable, annual IEP goals and transition<br />
services that will reasonably enable the student<br />
to meet the post-secondary goals.<br />
Indicator 14: Post-School Outcomes<br />
A. Percent of youth enrolled in higher<br />
education within one year of leaving high<br />
school.<br />
State<br />
Rate<br />
State<br />
Target<br />
Note: Data for this Indicator is from the on-site monitoring of LEAs for the given year.<br />
B. Percent of youth enrolled in higher<br />
education or competitively employed<br />
within one year of leaving high school.<br />
C. Percent of youth enrolled in higher<br />
education or in some other postsecondary<br />
education or training program; or<br />
competitively employed or in some other<br />
employment within one year of leaving<br />
high school.<br />
State<br />
Rate<br />
Indicator 20: Reported Data-Timely and Accurate*<br />
District submitted<br />
required data elements<br />
on or before due dates;<br />
made revisions within<br />
the alloted reveiw<br />
periods.<br />
Accurate and Timely<br />
Data Submission<br />
Overall (3-21)<br />
Early Childhood (3-5)<br />
School Age (5-21)<br />
State<br />
Target<br />
100.00%<br />
100.00%<br />
100.00%<br />
State<br />
Target<br />
LEA<br />
Rate<br />
LEA<br />
Rate<br />
Target Met by<br />
LEA (Y/N)<br />
Target Met<br />
by LEA<br />
(Y/N)<br />
Target Met<br />
by LEA<br />
(Y/N)<br />
*Data reviewed for timely and accurate submissions included all APSCN cycle data except for personnel<br />
Note: - - denotes not applicable<br />
96.19 100.00 — — N/A<br />
14.53<br />
State<br />
Rate<br />
49.42<br />
State<br />
Rate<br />
54.07<br />
13.00<br />
State<br />
Target<br />
49.00<br />
State<br />
Target<br />
60.00<br />
Y<br />
N/A<br />
Y<br />
— —<br />
LEA<br />
Rate<br />
— —<br />
LEA<br />
Rate<br />
— —<br />
N/A<br />
Target Met<br />
by LEA<br />
(Y/N)<br />
N/A<br />
Target Met<br />
by LEA<br />
(Y/N)<br />
N/A<br />
Page 5 of 5
<strong>ARKANSAS</strong> <strong>SPECIAL</strong> <strong>EDUCATION</strong><br />
<strong>DISTRICT</strong> <strong>ANNUAL</strong> PERFORMANCE REPORT<br />
2010/11 School Year<br />
Publication Date: March 2012<br />
Each State must have in place a State Performance Plan (SPP) to evaluate the State's efforts to meet the requirements and<br />
purposes of the implementation of the Individuals with Disabilities Education Act (IDEA). The SPP is a six-year plan, which<br />
describes Arkansas's performance on 20 indicators. The Office of Special Education Programs in the U. S. Department of<br />
Education requires that States report annually to the public on the performance of each local education agency (LEA) on 14 of<br />
20 indicators as compared with targets established by the State in the SPP. Arkansas will report indicators 1 through 14 and<br />
20 for each LEA serving children with disabilities (CWD). Any LEA not meeting targets on compliance indicators (0% for<br />
Indicators 4B, 09 & 10 and 100% for Indicators 11, 12, 13, and 20) are non-compliant with IDEA.<br />
There are no report changes for the 2010/11 school year profile; However, it is important to recognize that: .<br />
1. Indicator 01 (Graduation) is reported a year in arrear (2009/10 graduates) and is based on a four-year cohort. This<br />
means the rate is a measure of students who entered in ninth grade and graduate in four years. The calculation is a<br />
requirement under Title I of the Elementary and Secondary Education Act (ESEA).<br />
2. Indicator 02 (Drop out) is reported a year in arrear. This means the rate is a measure of students who dropped out in<br />
the 2009/10 school year. The Indicator 02 data are aligned with the Common Core of Data (CCD) requirements for<br />
grades 7-12.<br />
3. Indicator 04A and 4B (Suspension/Expulsion) is reported a year in arrear. This means the rate is a measure of<br />
students who had out-of-school suspensions and/or expulsions totaling more than 10 days.<br />
For a complete description of all the Indicators, please visit the special education website at<br />
http://arksped.k12.ar.us/sections/policy.html<br />
LEA: 5620 - CROWLEY'S RIDGE <strong>EDUCATION</strong>AL CO-OP<br />
Indicator 01: Graduation Rates (2009/10 school year) Indicator 02: Dropout Rates (2009/10 school year)<br />
Percent of youth<br />
with IEPs<br />
graduating from<br />
high school with a<br />
regular diploma<br />
State<br />
Rate<br />
State<br />
Target<br />
75.76% 85.00%<br />
LEA<br />
Rate<br />
— —<br />
Target Met<br />
by LEA<br />
(Y/N)<br />
NA<br />
Percent of<br />
youth with<br />
IEPs dropping<br />
out of high<br />
school<br />
State<br />
Rate<br />
Indicator 03: Assessment on Statewide Benchmark Exam (grades 3-8, 11)<br />
A) Adequate Yearly Progress<br />
n=40<br />
Literacy<br />
Mathematics<br />
Met Disability Subgroup "n"<br />
for Reporting Purposes (Y/N)<br />
State Target for % of Districts Meeting<br />
AYP for Disability Subgroup<br />
State<br />
Target<br />
3.06% 4.20%<br />
LEA<br />
Rate<br />
— —<br />
% of Districts Meeting AYP<br />
for Disability Subgroup<br />
Target Met by<br />
LEA (Y/N)<br />
N/A<br />
Target Met by<br />
LEA(Y/N)<br />
Overall N/A 17.15% 6.25%<br />
N/A<br />
N/A<br />
N/A<br />
Note: For a district to qualify as having a disability subgroup it must have a minimum of 40 (n=40) students with disabilities in a school building.<br />
B) Participation<br />
Participation Rate: # of<br />
CWD Tested ÷ # of CWD<br />
Enrolled in grades tested.<br />
Participation Rate: Literacy<br />
Participation Rate: Math<br />
Note: - - denotes not applicable<br />
State<br />
Rate<br />
98.78%<br />
State<br />
Target<br />
95.00%<br />
LEA<br />
Rate<br />
— —<br />
Target Met<br />
by LEA (Y/N)<br />
N/A<br />
98.61% 95.00% — — N/A<br />
C) Performance Proficiency<br />
Percent of CWD Scoring<br />
Proficient or Above<br />
Proficiency Rate: Literacy<br />
Proficiency Rate:<br />
Mathematics<br />
16.00%<br />
16.00%<br />
State<br />
Rate<br />
31.49%<br />
44.86%<br />
State<br />
Target<br />
45.22%<br />
51.14%<br />
LEA<br />
Rate<br />
— —<br />
— —<br />
N/A<br />
N/A<br />
Target<br />
Met by<br />
LEA (Y/N)<br />
N/A<br />
N/A<br />
Page 1 of 5
LEA: 5620 - CROWLEY'S RIDGE <strong>EDUCATION</strong>AL CO-OP<br />
Indicator 04: Out-of-School Suspensions and Expulsions (2009/10 school year)<br />
A) Suspension/Expulsion<br />
Percent difference of CWD with out-of- school suspensions and<br />
expulsions totaling greater than 10 days in a school year as<br />
compared to the same data for general education students in<br />
the district.<br />
B) Suspension/Expulsion by Race and Ethnicity<br />
Percent of districts that have: (a) a significant discrepancy, by race or<br />
ethnicity, in the rate of suspensions and expulsions of greater than 10<br />
days in a school year for children with IEPs; and (b) policies,<br />
procedures or practices that contribute to the significant discrepancy<br />
and do not comply with requirements relating to the development<br />
and implementation of IEPs, the use of positive behavioral<br />
interventions and supports, and procedural safeguards.<br />
Indicator 05: School Age (5-21) Least Restrictive Environment<br />
A) In the Regular Class 80% or more of the day<br />
Percent of CWD with<br />
IEPs receiving instruction<br />
in the regular class 80%<br />
or more of the day.<br />
State<br />
Rate<br />
State<br />
Target<br />
LEA<br />
Rate<br />
B) In the Regular Class less than 40% of the day<br />
Percent of CWD with<br />
IEPs receiving instruction<br />
in the regular class less<br />
than 60% of the day.<br />
53.87% 59.77%<br />
State<br />
Rate<br />
State<br />
Target<br />
12.42% 12.51%<br />
— —<br />
LEA<br />
Rate<br />
— —<br />
C) Other Settings outside the regular class<br />
Percent of CWD with IEPs served in<br />
public or private separate schools,<br />
residential placements, or<br />
homebound/hospital placements.<br />
State<br />
Rate<br />
State<br />
Target<br />
2.80% 2.56%<br />
Target Met<br />
by LEA (Y/N)<br />
N/A<br />
Target Met<br />
by LEA (Y/N)<br />
N/A<br />
LEA<br />
Rate<br />
— —<br />
Target Met<br />
by LEA(Y/N)<br />
N/A<br />
Indicator 06: Early Childhood (3-5) Least Restrictive Environment<br />
A) Regular Early Childhood Program<br />
Percent of children (aged 3 through 5) with IEPs attending a regular<br />
early childhood program and receiving the majority of special<br />
education and related services in the regular early childhood program<br />
Allowable<br />
Difference<br />
LEA: 5620 - CROWLEY'S RIDGE <strong>EDUCATION</strong>AL CO-OP<br />
Indicator 07: Preschool (3-5) Outcomes<br />
a) Percent of preschool CWD<br />
children who did not<br />
improve functioning.<br />
b) Percent of preschool CWD<br />
who improved but whose<br />
functioning remained below<br />
same age peers.<br />
c) Percent of preschool CWD<br />
who improved at a level<br />
nearer to same aged peers.<br />
d) Percent of preschool CWD<br />
who improved functioning to<br />
reach a level comparable to<br />
same age peers.<br />
e) Percent of preschool CWD<br />
children who maintain<br />
functioning at a level<br />
comparable to same aged<br />
peers.<br />
Summary<br />
Statements<br />
1) Of those preschool<br />
children who entered<br />
the preschool program<br />
below age expectations<br />
in each Outcome, the<br />
percent who<br />
substantially increased<br />
their rate of growth by<br />
the time they turned 6<br />
years of age or exited<br />
the program.<br />
2) The percent of<br />
preschool children who<br />
were functioning<br />
within age expectations<br />
in each Outcome by the<br />
time they turned 6<br />
years of age or exited<br />
A) Positive Social -Emotional<br />
Skills*<br />
State<br />
Rate<br />
A) Positive Social -<br />
Emotional Skills<br />
(Including social<br />
relationships)<br />
State<br />
Rate<br />
2.14%<br />
5.31%<br />
25.97%<br />
38.22%<br />
28.36%<br />
State<br />
Target<br />
LEA<br />
Rate<br />
LEA<br />
Rate<br />
1.94%<br />
5.81%<br />
43.87%<br />
40.00%<br />
8.39%<br />
Target<br />
Met by<br />
LEA(Y/N)<br />
B) Acquisition and Use of<br />
Knowledge and Skills<br />
(Including early language/<br />
communication and early literacy)<br />
B) Acquisition and Use of<br />
Knowledge and Skills **<br />
State<br />
Rate<br />
1.75%<br />
6.59%<br />
34.23%<br />
43.51%<br />
13.92%<br />
State<br />
Target<br />
LEA<br />
Rate<br />
Target<br />
Met by<br />
LEA(Y/N)<br />
C) Use of Appropriate Behaviors<br />
to Meet Their Needs<br />
State<br />
Rate<br />
State<br />
Target<br />
LEA<br />
Rate<br />
Target<br />
Met by<br />
LEA(Y/N)<br />
89.61% 90.50% 91.55% Y 90.31% 90.50% 96.48% Y 90.82% 92.50% 94.07% Y<br />
66.58% 69.50% 48.39% N 57.43% 60.50% 51.61% N 76.69% 78.50% 58.06% N<br />
NOTE: * Including social relationships ** Including early language/ communication and early literacy<br />
Note: - - denotes not applicable<br />
State<br />
Rate<br />
LEA<br />
Rate<br />
1.29%<br />
1.94%<br />
45.16%<br />
43.23%<br />
8.39%<br />
C) Use of<br />
Appropriate<br />
Behaviors to<br />
Meet Their Needs<br />
State<br />
Rate<br />
4.51%<br />
17.34%<br />
41.72%<br />
34.97%<br />
LEA<br />
Rate<br />
1.46% 0.65%<br />
4.52%<br />
36.77%<br />
45.16%<br />
12.90%<br />
Page 3 of 5
LEA: 5620 - CROWLEY'S RIDGE <strong>EDUCATION</strong>AL CO-OP<br />
Indicator 08: Parent Involvement<br />
Percent of surveyed<br />
parents who reported<br />
school facilitated parent<br />
involvement as a means<br />
of improving services<br />
and results for children<br />
with disabilities.<br />
Early Childhood<br />
(3-5)<br />
School Age<br />
(5-21)<br />
State<br />
Rate<br />
90.47%<br />
95.05%<br />
Indicator 09: Disproportionality - Eligibility<br />
Disproportionate representation of racial<br />
and ethnic groups in special education and<br />
related services that is a result of<br />
inappropriate identification (e.g.<br />
monitoring data, review of policies,<br />
practices, and procedures under 618(d),<br />
etc.).<br />
State<br />
Rate<br />
State<br />
Target<br />
88.00%<br />
96.00%<br />
State<br />
Target<br />
0.00% 0.00%<br />
LEA<br />
Rate<br />
76.92%<br />
— —<br />
Indicator 10: Disproportionality-Child with a Disability<br />
Disproportionate representation of racial<br />
and ethnic groups in specific disability<br />
categories that is a result of inappropriate<br />
identification (e.g. monitoring data, review<br />
of policies, practices, and procedures under<br />
618(d), etc.).<br />
Indicator 11: Child Find<br />
Percent of children with<br />
parental consent to evaluate<br />
who are evaluated within<br />
the State established timeline<br />
of 60 days.<br />
Overall<br />
(3-21)<br />
Early Childhood<br />
(3-5)<br />
School Age<br />
(5-21)<br />
State<br />
Rate<br />
0.00%<br />
Indicator 12: Early Childhood Transition<br />
Percent of children referred by Part C prior to<br />
age 3, who are found eligible for Part B, and<br />
who have an IEP developed and implemented<br />
by their third birthday.<br />
Note: - - denotes not applicable<br />
State<br />
Rate<br />
99.41%<br />
99.70%<br />
98.97%<br />
State<br />
Rate<br />
State<br />
Target<br />
0.00%<br />
State<br />
Target<br />
100.00%<br />
100.00%<br />
100.00%<br />
State<br />
Target<br />
Target Met by<br />
LEA (Y/N)<br />
N/A<br />
Target Met by<br />
LEA (Y/N)<br />
N/A<br />
LEA<br />
Rate<br />
100.00%<br />
100.00%<br />
— —<br />
LEA<br />
Rate<br />
Target Met by<br />
LEA (Y/N)<br />
N<br />
N/A<br />
Note: The target for Indicator 09 is to have zero percent<br />
(0%) of districts identified as having disproportionate<br />
representation as a result of inappropriate<br />
identification in eligibility.<br />
Note: The target for Indicator 10 is to have zero<br />
percent (0%) of districts identified as having<br />
disproportionate representation as a result of<br />
inappropriate identification in a disability<br />
category.<br />
Target Met by<br />
LEA (Y/N)<br />
Y<br />
N/A<br />
Target Met<br />
by LEA<br />
(Y/N)<br />
99.21% 100.00% 100.00% Y<br />
Y<br />
Note: * Indicates a zero reponse rate for the<br />
district.<br />
Page 4 of 5
LEA: 5620 - CROWLEY'S RIDGE <strong>EDUCATION</strong>AL CO-OP<br />
Indicator 13: Secondary Transition<br />
Percent of youth with disabilities aged 16 and<br />
up with an IEP that includes coordinated,<br />
measurable, annual IEP goals and transition<br />
services that will reasonably enable the student<br />
to meet the post-secondary goals.<br />
Indicator 14: Post-School Outcomes<br />
A. Percent of youth enrolled in higher<br />
education within one year of leaving high<br />
school.<br />
State<br />
Rate<br />
State<br />
Target<br />
Note: Data for this Indicator is from the on-site monitoring of LEAs for the given year.<br />
B. Percent of youth enrolled in higher<br />
education or competitively employed<br />
within one year of leaving high school.<br />
C. Percent of youth enrolled in higher<br />
education or in some other postsecondary<br />
education or training program; or<br />
competitively employed or in some other<br />
employment within one year of leaving<br />
high school.<br />
State<br />
Rate<br />
Indicator 20: Reported Data-Timely and Accurate*<br />
District submitted<br />
required data elements<br />
on or before due dates;<br />
made revisions within<br />
the alloted reveiw<br />
periods.<br />
Accurate and Timely<br />
Data Submission<br />
Overall (3-21)<br />
Early Childhood (3-5)<br />
School Age (5-21)<br />
State<br />
Target<br />
100.00%<br />
100.00%<br />
100.00%<br />
State<br />
Target<br />
LEA<br />
Rate<br />
LEA<br />
Rate<br />
Target Met by<br />
LEA (Y/N)<br />
Target Met<br />
by LEA<br />
(Y/N)<br />
Target Met<br />
by LEA<br />
(Y/N)<br />
*Data reviewed for timely and accurate submissions included all APSCN cycle data except for personnel<br />
Note: - - denotes not applicable<br />
96.19 100.00 — — N/A<br />
14.53<br />
State<br />
Rate<br />
49.42<br />
State<br />
Rate<br />
54.07<br />
13.00<br />
State<br />
Target<br />
49.00<br />
State<br />
Target<br />
60.00<br />
Y<br />
Y<br />
N/A<br />
— —<br />
LEA<br />
Rate<br />
— —<br />
LEA<br />
Rate<br />
— —<br />
N/A<br />
Target Met<br />
by LEA<br />
(Y/N)<br />
N/A<br />
Target Met<br />
by LEA<br />
(Y/N)<br />
N/A<br />
Page 5 of 5
LEA: 5703 - MENA SCHOOL <strong>DISTRICT</strong><br />
<strong>ARKANSAS</strong> <strong>SPECIAL</strong> <strong>EDUCATION</strong><br />
<strong>DISTRICT</strong> <strong>ANNUAL</strong> PERFORMANCE REPORT<br />
2010/11 School Year<br />
Publication Date: March 2012<br />
Each State must have in place a State Performance Plan (SPP) to evaluate the State's efforts to meet the requirements and<br />
purposes of the implementation of the Individuals with Disabilities Education Act (IDEA). The SPP is a six-year plan, which<br />
describes Arkansas's performance on 20 indicators. The Office of Special Education Programs in the U. S. Department of<br />
Education requires that States report annually to the public on the performance of each local education agency (LEA) on 14 of<br />
20 indicators as compared with targets established by the State in the SPP. Arkansas will report indicators 1 through 14 and<br />
20 for each LEA serving children with disabilities (CWD). Any LEA not meeting targets on compliance indicators (0% for<br />
Indicators 4B, 09 & 10 and 100% for Indicators 11, 12, 13, and 20) are non-compliant with IDEA.<br />
There are no report changes for the 2010/11 school year profile; However, it is important to recognize that: .<br />
1. Indicator 01 (Graduation) is reported a year in arrear (2009/10 graduates) and is based on a four-year cohort. This<br />
means the rate is a measure of students who entered in ninth grade and graduate in four years. The calculation is a<br />
requirement under Title I of the Elementary and Secondary Education Act (ESEA).<br />
2. Indicator 02 (Drop out) is reported a year in arrear. This means the rate is a measure of students who dropped out in<br />
the 2009/10 school year. The Indicator 02 data are aligned with the Common Core of Data (CCD) requirements for<br />
grades 7-12.<br />
3. Indicator 04A and 4B (Suspension/Expulsion) is reported a year in arrear. This means the rate is a measure of<br />
students who had out-of-school suspensions and/or expulsions totaling more than 10 days.<br />
Percent of youth<br />
with IEPs<br />
graduating from<br />
high school with a<br />
regular diploma<br />
For a complete description of all the Indicators, please visit the special education website at<br />
http://arksped.k12.ar.us/sections/policy.html<br />
Indicator 01: Graduation Rates (2009/10 school year) Indicator 02: Dropout Rates (2009/10 school year)<br />
State<br />
Rate<br />
State<br />
Target<br />
75.76% 85.00%<br />
LEA<br />
Rate<br />
84.21%<br />
Target Met<br />
by LEA<br />
(Y/N)<br />
N<br />
Percent of<br />
youth with<br />
IEPs dropping<br />
out of high<br />
school<br />
State<br />
Rate<br />
Indicator 03: Assessment on Statewide Benchmark Exam (grades 3-8, 11)<br />
A) Adequate Yearly Progress<br />
n=40<br />
Literacy<br />
Mathematics<br />
Met Disability Subgroup "n"<br />
for Reporting Purposes (Y/N)<br />
State Target for % of Districts Meeting<br />
AYP for Disability Subgroup<br />
State<br />
Target<br />
3.06% 4.20%<br />
LEA<br />
Rate<br />
0.00%<br />
% of Districts Meeting AYP<br />
for Disability Subgroup<br />
Target Met by<br />
LEA (Y/N)<br />
Y<br />
Target Met by<br />
LEA(Y/N)<br />
Overall N 17.15% 6.25%<br />
NA<br />
N<br />
N<br />
Note: For a district to qualify as having a disability subgroup it must have a minimum of 40 (n=40) students with disabilities in a school building.<br />
B) Participation<br />
Participation Rate: # of<br />
CWD Tested ÷ # of CWD<br />
Enrolled in grades tested.<br />
Participation Rate: Literacy<br />
Participation Rate: Math<br />
Note: - - denotes not applicable<br />
State<br />
Rate<br />
98.78%<br />
State<br />
Target<br />
95.00%<br />
LEA<br />
Rate<br />
99.00%<br />
Target Met<br />
by LEA (Y/N)<br />
98.61% 95.00% 100.00% Y<br />
Y<br />
C) Performance Proficiency<br />
Percent of CWD Scoring<br />
Proficient or Above<br />
Proficiency Rate: Literacy<br />
Proficiency Rate:<br />
Mathematics<br />
16.00%<br />
16.00%<br />
State<br />
Rate<br />
31.49%<br />
44.86%<br />
State<br />
Target<br />
45.22%<br />
51.14%<br />
LEA<br />
Rate<br />
24.47%<br />
52.83%<br />
NA<br />
NA<br />
Target<br />
Met by<br />
LEA (Y/N)<br />
N<br />
Y<br />
Page 1 of 5
LEA: 5703 - MENA SCHOOL <strong>DISTRICT</strong><br />
Indicator 04: Out-of-School Suspensions and Expulsions (2009/10 school year)<br />
A) Suspension/Expulsion<br />
Percent difference of CWD with out-of- school suspensions and<br />
expulsions totaling greater than 10 days in a school year as<br />
compared to the same data for general education students in<br />
the district.<br />
B) Suspension/Expulsion by Race and Ethnicity<br />
Percent of districts that have: (a) a significant discrepancy, by race or<br />
ethnicity, in the rate of suspensions and expulsions of greater than 10<br />
days in a school year for children with IEPs; and (b) policies,<br />
procedures or practices that contribute to the significant discrepancy<br />
and do not comply with requirements relating to the development<br />
and implementation of IEPs, the use of positive behavioral<br />
interventions and supports, and procedural safeguards.<br />
Indicator 05: School Age (5-21) Least Restrictive Environment<br />
A) In the Regular Class 80% or more of the day<br />
Percent of CWD with<br />
IEPs receiving instruction<br />
in the regular class 80%<br />
or more of the day.<br />
State<br />
Rate<br />
State<br />
Target<br />
LEA<br />
Rate<br />
B) In the Regular Class less than 40% of the day<br />
Percent of CWD with<br />
IEPs receiving instruction<br />
in the regular class less<br />
than 60% of the day.<br />
53.87% 59.77%<br />
State<br />
Rate<br />
State<br />
Target<br />
12.42% 12.51%<br />
79.38%<br />
LEA<br />
Rate<br />
14.43%<br />
C) Other Settings outside the regular class<br />
Percent of CWD with IEPs served in<br />
public or private separate schools,<br />
residential placements, or<br />
homebound/hospital placements.<br />
State<br />
Rate<br />
State<br />
Target<br />
2.80% 2.56%<br />
Target Met<br />
by LEA (Y/N)<br />
Y<br />
Target Met<br />
by LEA (Y/N)<br />
N<br />
LEA<br />
Rate<br />
0.00%<br />
Target Met<br />
by LEA(Y/N)<br />
Indicator 06: Early Childhood (3-5) Least Restrictive Environment<br />
A) Regular Early Childhood Program<br />
Percent of children (aged 3 through 5) with IEPs attending a regular<br />
early childhood program and receiving the majority of special<br />
education and related services in the regular early childhood program<br />
Allowable<br />
Difference<br />
LEA: 5703 - MENA SCHOOL <strong>DISTRICT</strong><br />
Indicator 07: Preschool (3-5) Outcomes<br />
a) Percent of preschool CWD<br />
children who did not<br />
improve functioning.<br />
b) Percent of preschool CWD<br />
who improved but whose<br />
functioning remained below<br />
same age peers.<br />
c) Percent of preschool CWD<br />
who improved at a level<br />
nearer to same aged peers.<br />
d) Percent of preschool CWD<br />
who improved functioning to<br />
reach a level comparable to<br />
same age peers.<br />
e) Percent of preschool CWD<br />
children who maintain<br />
functioning at a level<br />
comparable to same aged<br />
peers.<br />
Summary<br />
Statements<br />
1) Of those preschool<br />
children who entered<br />
the preschool program<br />
below age expectations<br />
in each Outcome, the<br />
percent who<br />
substantially increased<br />
their rate of growth by<br />
the time they turned 6<br />
years of age or exited<br />
the program.<br />
2) The percent of<br />
preschool children who<br />
were functioning<br />
within age expectations<br />
in each Outcome by the<br />
time they turned 6<br />
years of age or exited<br />
A) Positive Social -Emotional<br />
Skills*<br />
State<br />
Rate<br />
A) Positive Social -<br />
Emotional Skills<br />
(Including social<br />
relationships)<br />
State<br />
Rate<br />
2.14%<br />
5.31%<br />
25.97%<br />
38.22%<br />
28.36%<br />
State<br />
Target<br />
LEA<br />
Rate<br />
LEA<br />
Rate<br />
— —<br />
— —<br />
— —<br />
— —<br />
— —<br />
Target<br />
Met by<br />
LEA(Y/N)<br />
B) Acquisition and Use of<br />
Knowledge and Skills<br />
(Including early language/<br />
communication and early literacy)<br />
B) Acquisition and Use of<br />
Knowledge and Skills **<br />
State<br />
Rate<br />
1.75%<br />
6.59%<br />
34.23%<br />
43.51%<br />
13.92%<br />
State<br />
Target<br />
LEA<br />
Rate<br />
Target<br />
Met by<br />
LEA(Y/N)<br />
C) Use of Appropriate Behaviors<br />
to Meet Their Needs<br />
State<br />
Rate<br />
State<br />
Target<br />
LEA<br />
Rate<br />
Target<br />
Met by<br />
LEA(Y/N)<br />
89.61% 90.50% — — N/A 90.31% 90.50% — — N/A 90.82% 92.50% — — N/A<br />
66.58% 69.50% — — N/A 57.43% 60.50% — — N/A 76.69% 78.50% — — N/A<br />
NOTE: * Including social relationships ** Including early language/ communication and early literacy<br />
Note: - - denotes not applicable<br />
State<br />
Rate<br />
LEA<br />
Rate<br />
— —<br />
— —<br />
— —<br />
— —<br />
— —<br />
C) Use of<br />
Appropriate<br />
Behaviors to<br />
Meet Their Needs<br />
State<br />
Rate<br />
4.51%<br />
17.34%<br />
41.72%<br />
34.97%<br />
LEA<br />
Rate<br />
1.46% — —<br />
— —<br />
— —<br />
— —<br />
— —<br />
Page 3 of 5
LEA: 5703 - MENA SCHOOL <strong>DISTRICT</strong><br />
Indicator 08: Parent Involvement<br />
Percent of surveyed<br />
parents who reported<br />
school facilitated parent<br />
involvement as a means<br />
of improving services<br />
and results for children<br />
with disabilities.<br />
Early Childhood<br />
(3-5)<br />
School Age<br />
(5-21)<br />
State<br />
Rate<br />
90.47%<br />
95.05%<br />
Indicator 09: Disproportionality - Eligibility<br />
Disproportionate representation of racial<br />
and ethnic groups in special education and<br />
related services that is a result of<br />
inappropriate identification (e.g.<br />
monitoring data, review of policies,<br />
practices, and procedures under 618(d),<br />
etc.).<br />
State<br />
Rate<br />
State<br />
Target<br />
88.00%<br />
96.00%<br />
State<br />
Target<br />
0.00% 0.00%<br />
LEA<br />
Rate<br />
— —<br />
96.25%<br />
Indicator 10: Disproportionality-Child with a Disability<br />
Disproportionate representation of racial<br />
and ethnic groups in specific disability<br />
categories that is a result of inappropriate<br />
identification (e.g. monitoring data, review<br />
of policies, practices, and procedures under<br />
618(d), etc.).<br />
Indicator 11: Child Find<br />
Percent of children with<br />
parental consent to evaluate<br />
who are evaluated within<br />
the State established timeline<br />
of 60 days.<br />
Overall<br />
(3-21)<br />
Early Childhood<br />
(3-5)<br />
School Age<br />
(5-21)<br />
State<br />
Rate<br />
0.00%<br />
Indicator 12: Early Childhood Transition<br />
Percent of children referred by Part C prior to<br />
age 3, who are found eligible for Part B, and<br />
who have an IEP developed and implemented<br />
by their third birthday.<br />
Note: - - denotes not applicable<br />
State<br />
Rate<br />
99.41%<br />
99.70%<br />
98.97%<br />
State<br />
Rate<br />
State<br />
Target<br />
0.00%<br />
State<br />
Target<br />
100.00%<br />
100.00%<br />
100.00%<br />
State<br />
Target<br />
Target Met by<br />
LEA (Y/N)<br />
Y<br />
Target Met by<br />
LEA (Y/N)<br />
Y<br />
LEA<br />
Rate<br />
100.00%<br />
— —<br />
100.00%<br />
LEA<br />
Rate<br />
Target Met by<br />
LEA (Y/N)<br />
N/A<br />
Y<br />
Note: The target for Indicator 09 is to have zero percent<br />
(0%) of districts identified as having disproportionate<br />
representation as a result of inappropriate<br />
identification in eligibility.<br />
Note: The target for Indicator 10 is to have zero<br />
percent (0%) of districts identified as having<br />
disproportionate representation as a result of<br />
inappropriate identification in a disability<br />
category.<br />
Target Met by<br />
LEA (Y/N)<br />
N/A<br />
Y<br />
Target Met<br />
by LEA<br />
(Y/N)<br />
99.21% 100.00% - - N/A<br />
Y<br />
Note: * Indicates a zero reponse rate for the<br />
district.<br />
Page 4 of 5
LEA: 5703 - MENA SCHOOL <strong>DISTRICT</strong><br />
Indicator 13: Secondary Transition<br />
Percent of youth with disabilities aged 16 and<br />
up with an IEP that includes coordinated,<br />
measurable, annual IEP goals and transition<br />
services that will reasonably enable the student<br />
to meet the post-secondary goals.<br />
Indicator 14: Post-School Outcomes<br />
A. Percent of youth enrolled in higher<br />
education within one year of leaving high<br />
school.<br />
State<br />
Rate<br />
State<br />
Target<br />
Note: Data for this Indicator is from the on-site monitoring of LEAs for the given year.<br />
B. Percent of youth enrolled in higher<br />
education or competitively employed<br />
within one year of leaving high school.<br />
C. Percent of youth enrolled in higher<br />
education or in some other postsecondary<br />
education or training program; or<br />
competitively employed or in some other<br />
employment within one year of leaving<br />
high school.<br />
State<br />
Rate<br />
Indicator 20: Reported Data-Timely and Accurate*<br />
District submitted<br />
required data elements<br />
on or before due dates;<br />
made revisions within<br />
the alloted reveiw<br />
periods.<br />
Accurate and Timely<br />
Data Submission<br />
Overall (3-21)<br />
Early Childhood (3-5)<br />
School Age (5-21)<br />
State<br />
Target<br />
100.00%<br />
100.00%<br />
100.00%<br />
State<br />
Target<br />
LEA<br />
Rate<br />
LEA<br />
Rate<br />
Target Met by<br />
LEA (Y/N)<br />
Target Met<br />
by LEA<br />
(Y/N)<br />
Target Met<br />
by LEA<br />
(Y/N)<br />
*Data reviewed for timely and accurate submissions included all APSCN cycle data except for personnel<br />
Note: - - denotes not applicable<br />
96.19 100.00 — — N/A<br />
14.53<br />
State<br />
Rate<br />
49.42<br />
State<br />
Rate<br />
54.07<br />
13.00<br />
State<br />
Target<br />
49.00<br />
State<br />
Target<br />
60.00<br />
N<br />
N/A<br />
N<br />
— —<br />
LEA<br />
Rate<br />
— —<br />
LEA<br />
Rate<br />
— —<br />
N/A<br />
Target Met<br />
by LEA<br />
(Y/N)<br />
N/A<br />
Target Met<br />
by LEA<br />
(Y/N)<br />
N/A<br />
Page 5 of 5
<strong>ARKANSAS</strong> <strong>SPECIAL</strong> <strong>EDUCATION</strong><br />
<strong>DISTRICT</strong> <strong>ANNUAL</strong> PERFORMANCE REPORT<br />
2010/11 School Year<br />
Publication Date: March 2012<br />
Each State must have in place a State Performance Plan (SPP) to evaluate the State's efforts to meet the requirements and<br />
purposes of the implementation of the Individuals with Disabilities Education Act (IDEA). The SPP is a six-year plan, which<br />
describes Arkansas's performance on 20 indicators. The Office of Special Education Programs in the U. S. Department of<br />
Education requires that States report annually to the public on the performance of each local education agency (LEA) on 14 of<br />
20 indicators as compared with targets established by the State in the SPP. Arkansas will report indicators 1 through 14 and<br />
20 for each LEA serving children with disabilities (CWD). Any LEA not meeting targets on compliance indicators (0% for<br />
Indicators 4B, 09 & 10 and 100% for Indicators 11, 12, 13, and 20) are non-compliant with IDEA.<br />
There are no report changes for the 2010/11 school year profile; However, it is important to recognize that: .<br />
1. Indicator 01 (Graduation) is reported a year in arrear (2009/10 graduates) and is based on a four-year cohort. This<br />
means the rate is a measure of students who entered in ninth grade and graduate in four years. The calculation is a<br />
requirement under Title I of the Elementary and Secondary Education Act (ESEA).<br />
2. Indicator 02 (Drop out) is reported a year in arrear. This means the rate is a measure of students who dropped out in<br />
the 2009/10 school year. The Indicator 02 data are aligned with the Common Core of Data (CCD) requirements for<br />
grades 7-12.<br />
3. Indicator 04A and 4B (Suspension/Expulsion) is reported a year in arrear. This means the rate is a measure of<br />
students who had out-of-school suspensions and/or expulsions totaling more than 10 days.<br />
For a complete description of all the Indicators, please visit the special education website at<br />
http://arksped.k12.ar.us/sections/policy.html<br />
LEA: 5706 - OUACHITA RIVER SCHOOL <strong>DISTRICT</strong><br />
Indicator 01: Graduation Rates (2009/10 school year) Indicator 02: Dropout Rates (2009/10 school year)<br />
Percent of youth<br />
with IEPs<br />
graduating from<br />
high school with a<br />
regular diploma<br />
State<br />
Rate<br />
State<br />
Target<br />
75.76% 85.00%<br />
LEA<br />
Rate<br />
100.00%<br />
Target Met<br />
by LEA<br />
(Y/N)<br />
Y<br />
Percent of<br />
youth with<br />
IEPs dropping<br />
out of high<br />
school<br />
State<br />
Rate<br />
Indicator 03: Assessment on Statewide Benchmark Exam (grades 3-8, 11)<br />
A) Adequate Yearly Progress<br />
n=40<br />
Literacy<br />
Mathematics<br />
Met Disability Subgroup "n"<br />
for Reporting Purposes (Y/N)<br />
State Target for % of Districts Meeting<br />
AYP for Disability Subgroup<br />
State<br />
Target<br />
3.06% 4.20%<br />
LEA<br />
Rate<br />
2.78%<br />
% of Districts Meeting AYP<br />
for Disability Subgroup<br />
Target Met by<br />
LEA (Y/N)<br />
Y<br />
Target Met by<br />
LEA(Y/N)<br />
Overall N 17.15% 6.25%<br />
NA<br />
N<br />
N<br />
Note: For a district to qualify as having a disability subgroup it must have a minimum of 40 (n=40) students with disabilities in a school building.<br />
B) Participation<br />
Participation Rate: # of<br />
CWD Tested ÷ # of CWD<br />
Enrolled in grades tested.<br />
Participation Rate: Literacy<br />
Participation Rate: Math<br />
Note: - - denotes not applicable<br />
State<br />
Rate<br />
98.78%<br />
State<br />
Target<br />
95.00%<br />
LEA<br />
Rate<br />
96.88%<br />
Target Met<br />
by LEA (Y/N)<br />
98.61% 95.00% 97.62% Y<br />
Y<br />
C) Performance Proficiency<br />
Percent of CWD Scoring<br />
Proficient or Above<br />
Proficiency Rate: Literacy<br />
Proficiency Rate:<br />
Mathematics<br />
16.00%<br />
16.00%<br />
State<br />
Rate<br />
31.49%<br />
44.86%<br />
State<br />
Target<br />
45.22%<br />
51.14%<br />
LEA<br />
Rate<br />
23.33%<br />
47.37%<br />
NA<br />
NA<br />
Target<br />
Met by<br />
LEA (Y/N)<br />
N<br />
N<br />
Page 1 of 5
LEA: 5706 - OUACHITA RIVER SCHOOL <strong>DISTRICT</strong><br />
Indicator 04: Out-of-School Suspensions and Expulsions (2009/10 school year)<br />
A) Suspension/Expulsion<br />
Percent difference of CWD with out-of- school suspensions and<br />
expulsions totaling greater than 10 days in a school year as<br />
compared to the same data for general education students in<br />
the district.<br />
B) Suspension/Expulsion by Race and Ethnicity<br />
Percent of districts that have: (a) a significant discrepancy, by race or<br />
ethnicity, in the rate of suspensions and expulsions of greater than 10<br />
days in a school year for children with IEPs; and (b) policies,<br />
procedures or practices that contribute to the significant discrepancy<br />
and do not comply with requirements relating to the development<br />
and implementation of IEPs, the use of positive behavioral<br />
interventions and supports, and procedural safeguards.<br />
Indicator 05: School Age (5-21) Least Restrictive Environment<br />
A) In the Regular Class 80% or more of the day<br />
Percent of CWD with<br />
IEPs receiving instruction<br />
in the regular class 80%<br />
or more of the day.<br />
State<br />
Rate<br />
State<br />
Target<br />
LEA<br />
Rate<br />
B) In the Regular Class less than 40% of the day<br />
Percent of CWD with<br />
IEPs receiving instruction<br />
in the regular class less<br />
than 60% of the day.<br />
53.87% 59.77%<br />
State<br />
Rate<br />
State<br />
Target<br />
12.42% 12.51%<br />
72.15%<br />
LEA<br />
Rate<br />
2.53%<br />
C) Other Settings outside the regular class<br />
Percent of CWD with IEPs served in<br />
public or private separate schools,<br />
residential placements, or<br />
homebound/hospital placements.<br />
State<br />
Rate<br />
State<br />
Target<br />
2.80% 2.56%<br />
Target Met<br />
by LEA (Y/N)<br />
Y<br />
Target Met<br />
by LEA (Y/N)<br />
Y<br />
LEA<br />
Rate<br />
1.27%<br />
Target Met<br />
by LEA(Y/N)<br />
Indicator 06: Early Childhood (3-5) Least Restrictive Environment<br />
A) Regular Early Childhood Program<br />
Percent of children (aged 3 through 5) with IEPs attending a regular<br />
early childhood program and receiving the majority of special<br />
education and related services in the regular early childhood program<br />
Allowable<br />
Difference<br />
LEA: 5706 - OUACHITA RIVER SCHOOL <strong>DISTRICT</strong><br />
Indicator 07: Preschool (3-5) Outcomes<br />
a) Percent of preschool CWD<br />
children who did not<br />
improve functioning.<br />
b) Percent of preschool CWD<br />
who improved but whose<br />
functioning remained below<br />
same age peers.<br />
c) Percent of preschool CWD<br />
who improved at a level<br />
nearer to same aged peers.<br />
d) Percent of preschool CWD<br />
who improved functioning to<br />
reach a level comparable to<br />
same age peers.<br />
e) Percent of preschool CWD<br />
children who maintain<br />
functioning at a level<br />
comparable to same aged<br />
peers.<br />
Summary<br />
Statements<br />
1) Of those preschool<br />
children who entered<br />
the preschool program<br />
below age expectations<br />
in each Outcome, the<br />
percent who<br />
substantially increased<br />
their rate of growth by<br />
the time they turned 6<br />
years of age or exited<br />
the program.<br />
2) The percent of<br />
preschool children who<br />
were functioning<br />
within age expectations<br />
in each Outcome by the<br />
time they turned 6<br />
years of age or exited<br />
A) Positive Social -Emotional<br />
Skills*<br />
State<br />
Rate<br />
A) Positive Social -<br />
Emotional Skills<br />
(Including social<br />
relationships)<br />
State<br />
Rate<br />
2.14%<br />
5.31%<br />
25.97%<br />
38.22%<br />
28.36%<br />
State<br />
Target<br />
LEA<br />
Rate<br />
LEA<br />
Rate<br />
— —<br />
— —<br />
— —<br />
— —<br />
— —<br />
Target<br />
Met by<br />
LEA(Y/N)<br />
B) Acquisition and Use of<br />
Knowledge and Skills<br />
(Including early language/<br />
communication and early literacy)<br />
B) Acquisition and Use of<br />
Knowledge and Skills **<br />
State<br />
Rate<br />
1.75%<br />
6.59%<br />
34.23%<br />
43.51%<br />
13.92%<br />
State<br />
Target<br />
LEA<br />
Rate<br />
Target<br />
Met by<br />
LEA(Y/N)<br />
C) Use of Appropriate Behaviors<br />
to Meet Their Needs<br />
State<br />
Rate<br />
State<br />
Target<br />
LEA<br />
Rate<br />
Target<br />
Met by<br />
LEA(Y/N)<br />
89.61% 90.50% — — N/A 90.31% 90.50% — — N/A 90.82% 92.50% — — N/A<br />
66.58% 69.50% — — N/A 57.43% 60.50% — — N/A 76.69% 78.50% — — N/A<br />
NOTE: * Including social relationships ** Including early language/ communication and early literacy<br />
Note: - - denotes not applicable<br />
State<br />
Rate<br />
LEA<br />
Rate<br />
— —<br />
— —<br />
— —<br />
— —<br />
— —<br />
C) Use of<br />
Appropriate<br />
Behaviors to<br />
Meet Their Needs<br />
State<br />
Rate<br />
4.51%<br />
17.34%<br />
41.72%<br />
34.97%<br />
LEA<br />
Rate<br />
1.46% — —<br />
— —<br />
— —<br />
— —<br />
— —<br />
Page 3 of 5
LEA: 5706 - OUACHITA RIVER SCHOOL <strong>DISTRICT</strong><br />
Indicator 08: Parent Involvement<br />
Percent of surveyed<br />
parents who reported<br />
school facilitated parent<br />
involvement as a means<br />
of improving services<br />
and results for children<br />
with disabilities.<br />
Early Childhood<br />
(3-5)<br />
School Age<br />
(5-21)<br />
State<br />
Rate<br />
90.47%<br />
95.05%<br />
Indicator 09: Disproportionality - Eligibility<br />
Disproportionate representation of racial<br />
and ethnic groups in special education and<br />
related services that is a result of<br />
inappropriate identification (e.g.<br />
monitoring data, review of policies,<br />
practices, and procedures under 618(d),<br />
etc.).<br />
State<br />
Rate<br />
State<br />
Target<br />
88.00%<br />
96.00%<br />
State<br />
Target<br />
0.00% 0.00%<br />
LEA<br />
Rate<br />
— —<br />
100.00%<br />
Indicator 10: Disproportionality-Child with a Disability<br />
Disproportionate representation of racial<br />
and ethnic groups in specific disability<br />
categories that is a result of inappropriate<br />
identification (e.g. monitoring data, review<br />
of policies, practices, and procedures under<br />
618(d), etc.).<br />
Indicator 11: Child Find<br />
Percent of children with<br />
parental consent to evaluate<br />
who are evaluated within<br />
the State established timeline<br />
of 60 days.<br />
Overall<br />
(3-21)<br />
Early Childhood<br />
(3-5)<br />
School Age<br />
(5-21)<br />
State<br />
Rate<br />
0.00%<br />
Indicator 12: Early Childhood Transition<br />
Percent of children referred by Part C prior to<br />
age 3, who are found eligible for Part B, and<br />
who have an IEP developed and implemented<br />
by their third birthday.<br />
Note: - - denotes not applicable<br />
State<br />
Rate<br />
99.41%<br />
99.70%<br />
98.97%<br />
State<br />
Rate<br />
State<br />
Target<br />
0.00%<br />
State<br />
Target<br />
100.00%<br />
100.00%<br />
100.00%<br />
State<br />
Target<br />
Target Met by<br />
LEA (Y/N)<br />
Y<br />
Target Met by<br />
LEA (Y/N)<br />
Y<br />
LEA<br />
Rate<br />
100.00%<br />
— —<br />
100.00%<br />
LEA<br />
Rate<br />
Target Met by<br />
LEA (Y/N)<br />
N/A<br />
Y<br />
Note: The target for Indicator 09 is to have zero percent<br />
(0%) of districts identified as having disproportionate<br />
representation as a result of inappropriate<br />
identification in eligibility.<br />
Note: The target for Indicator 10 is to have zero<br />
percent (0%) of districts identified as having<br />
disproportionate representation as a result of<br />
inappropriate identification in a disability<br />
category.<br />
Target Met by<br />
LEA (Y/N)<br />
N/A<br />
Y<br />
Target Met<br />
by LEA<br />
(Y/N)<br />
99.21% 100.00% - - N/A<br />
Y<br />
Note: * Indicates a zero reponse rate for the<br />
district.<br />
Page 4 of 5
LEA: 5706 - OUACHITA RIVER SCHOOL <strong>DISTRICT</strong><br />
Indicator 13: Secondary Transition<br />
Percent of youth with disabilities aged 16 and<br />
up with an IEP that includes coordinated,<br />
measurable, annual IEP goals and transition<br />
services that will reasonably enable the student<br />
to meet the post-secondary goals.<br />
Indicator 14: Post-School Outcomes<br />
A. Percent of youth enrolled in higher<br />
education within one year of leaving high<br />
school.<br />
State<br />
Rate<br />
State<br />
Target<br />
Note: Data for this Indicator is from the on-site monitoring of LEAs for the given year.<br />
B. Percent of youth enrolled in higher<br />
education or competitively employed<br />
within one year of leaving high school.<br />
C. Percent of youth enrolled in higher<br />
education or in some other postsecondary<br />
education or training program; or<br />
competitively employed or in some other<br />
employment within one year of leaving<br />
high school.<br />
State<br />
Rate<br />
Indicator 20: Reported Data-Timely and Accurate*<br />
District submitted<br />
required data elements<br />
on or before due dates;<br />
made revisions within<br />
the alloted reveiw<br />
periods.<br />
Accurate and Timely<br />
Data Submission<br />
Overall (3-21)<br />
Early Childhood (3-5)<br />
School Age (5-21)<br />
State<br />
Target<br />
100.00%<br />
100.00%<br />
100.00%<br />
State<br />
Target<br />
LEA<br />
Rate<br />
LEA<br />
Rate<br />
Target Met by<br />
LEA (Y/N)<br />
Target Met<br />
by LEA<br />
(Y/N)<br />
Target Met<br />
by LEA<br />
(Y/N)<br />
*Data reviewed for timely and accurate submissions included all APSCN cycle data except for personnel<br />
Note: - - denotes not applicable<br />
96.19 100.00 — — N/A<br />
14.53<br />
State<br />
Rate<br />
49.42<br />
State<br />
Rate<br />
54.07<br />
13.00<br />
State<br />
Target<br />
49.00<br />
State<br />
Target<br />
60.00<br />
Y<br />
N/A<br />
Y<br />
— —<br />
LEA<br />
Rate<br />
— —<br />
LEA<br />
Rate<br />
— —<br />
N/A<br />
Target Met<br />
by LEA<br />
(Y/N)<br />
N/A<br />
Target Met<br />
by LEA<br />
(Y/N)<br />
N/A<br />
Page 5 of 5
<strong>ARKANSAS</strong> <strong>SPECIAL</strong> <strong>EDUCATION</strong><br />
<strong>DISTRICT</strong> <strong>ANNUAL</strong> PERFORMANCE REPORT<br />
2010/11 School Year<br />
Publication Date: March 2012<br />
Each State must have in place a State Performance Plan (SPP) to evaluate the State's efforts to meet the requirements and<br />
purposes of the implementation of the Individuals with Disabilities Education Act (IDEA). The SPP is a six-year plan, which<br />
describes Arkansas's performance on 20 indicators. The Office of Special Education Programs in the U. S. Department of<br />
Education requires that States report annually to the public on the performance of each local education agency (LEA) on 14 of<br />
20 indicators as compared with targets established by the State in the SPP. Arkansas will report indicators 1 through 14 and<br />
20 for each LEA serving children with disabilities (CWD). Any LEA not meeting targets on compliance indicators (0% for<br />
Indicators 4B, 09 & 10 and 100% for Indicators 11, 12, 13, and 20) are non-compliant with IDEA.<br />
There are no report changes for the 2010/11 school year profile; However, it is important to recognize that: .<br />
1. Indicator 01 (Graduation) is reported a year in arrear (2009/10 graduates) and is based on a four-year cohort. This<br />
means the rate is a measure of students who entered in ninth grade and graduate in four years. The calculation is a<br />
requirement under Title I of the Elementary and Secondary Education Act (ESEA).<br />
2. Indicator 02 (Drop out) is reported a year in arrear. This means the rate is a measure of students who dropped out in<br />
the 2009/10 school year. The Indicator 02 data are aligned with the Common Core of Data (CCD) requirements for<br />
grades 7-12.<br />
3. Indicator 04A and 4B (Suspension/Expulsion) is reported a year in arrear. This means the rate is a measure of<br />
students who had out-of-school suspensions and/or expulsions totaling more than 10 days.<br />
For a complete description of all the Indicators, please visit the special education website at<br />
http://arksped.k12.ar.us/sections/policy.html<br />
LEA: 5707 - COSSATOT RIVER SCHOOL <strong>DISTRICT</strong><br />
Indicator 01: Graduation Rates (2009/10 school year) Indicator 02: Dropout Rates (2009/10 school year)<br />
Percent of youth<br />
with IEPs<br />
graduating from<br />
high school with a<br />
regular diploma<br />
State<br />
Rate<br />
State<br />
Target<br />
75.76% 85.00%<br />
LEA<br />
Rate<br />
— —<br />
Target Met<br />
by LEA<br />
(Y/N)<br />
NA<br />
Percent of<br />
youth with<br />
IEPs dropping<br />
out of high<br />
school<br />
State<br />
Rate<br />
Indicator 03: Assessment on Statewide Benchmark Exam (grades 3-8, 11)<br />
A) Adequate Yearly Progress<br />
n=40<br />
Literacy<br />
Mathematics<br />
Met Disability Subgroup "n"<br />
for Reporting Purposes (Y/N)<br />
State Target for % of Districts Meeting<br />
AYP for Disability Subgroup<br />
State<br />
Target<br />
3.06% 4.20%<br />
LEA<br />
Rate<br />
0.00%<br />
% of Districts Meeting AYP<br />
for Disability Subgroup<br />
Target Met by<br />
LEA (Y/N)<br />
Y<br />
Target Met by<br />
LEA(Y/N)<br />
Overall N 17.15% 6.25%<br />
NA<br />
N<br />
N<br />
Note: For a district to qualify as having a disability subgroup it must have a minimum of 40 (n=40) students with disabilities in a school building.<br />
B) Participation<br />
Participation Rate: # of<br />
CWD Tested ÷ # of CWD<br />
Enrolled in grades tested.<br />
Participation Rate: Literacy<br />
Participation Rate: Math<br />
Note: - - denotes not applicable<br />
State<br />
Rate<br />
98.78%<br />
State<br />
Target<br />
95.00%<br />
LEA<br />
Rate<br />
98.39%<br />
Target Met<br />
by LEA (Y/N)<br />
98.61% 95.00% 94.59% N<br />
Y<br />
C) Performance Proficiency<br />
Percent of CWD Scoring<br />
Proficient or Above<br />
Proficiency Rate: Literacy<br />
Proficiency Rate:<br />
Mathematics<br />
16.00%<br />
16.00%<br />
State<br />
Rate<br />
31.49%<br />
44.86%<br />
State<br />
Target<br />
45.22%<br />
51.14%<br />
LEA<br />
Rate<br />
30.51%<br />
57.35%<br />
NA<br />
NA<br />
Target<br />
Met by<br />
LEA (Y/N)<br />
N<br />
Y<br />
Page 1 of 5
LEA: 5707 - COSSATOT RIVER SCHOOL <strong>DISTRICT</strong><br />
Indicator 04: Out-of-School Suspensions and Expulsions (2009/10 school year)<br />
A) Suspension/Expulsion<br />
Percent difference of CWD with out-of- school suspensions and<br />
expulsions totaling greater than 10 days in a school year as<br />
compared to the same data for general education students in<br />
the district.<br />
B) Suspension/Expulsion by Race and Ethnicity<br />
Percent of districts that have: (a) a significant discrepancy, by race or<br />
ethnicity, in the rate of suspensions and expulsions of greater than 10<br />
days in a school year for children with IEPs; and (b) policies,<br />
procedures or practices that contribute to the significant discrepancy<br />
and do not comply with requirements relating to the development<br />
and implementation of IEPs, the use of positive behavioral<br />
interventions and supports, and procedural safeguards.<br />
Indicator 05: School Age (5-21) Least Restrictive Environment<br />
A) In the Regular Class 80% or more of the day<br />
Percent of CWD with<br />
IEPs receiving instruction<br />
in the regular class 80%<br />
or more of the day.<br />
State<br />
Rate<br />
State<br />
Target<br />
LEA<br />
Rate<br />
B) In the Regular Class less than 40% of the day<br />
Percent of CWD with<br />
IEPs receiving instruction<br />
in the regular class less<br />
than 60% of the day.<br />
53.87% 59.77%<br />
State<br />
Rate<br />
State<br />
Target<br />
12.42% 12.51%<br />
54.41%<br />
LEA<br />
Rate<br />
6.62%<br />
C) Other Settings outside the regular class<br />
Percent of CWD with IEPs served in<br />
public or private separate schools,<br />
residential placements, or<br />
homebound/hospital placements.<br />
State<br />
Rate<br />
State<br />
Target<br />
2.80% 2.56%<br />
Target Met<br />
by LEA (Y/N)<br />
N<br />
Target Met<br />
by LEA (Y/N)<br />
Y<br />
LEA<br />
Rate<br />
0.00%<br />
Target Met<br />
by LEA(Y/N)<br />
Indicator 06: Early Childhood (3-5) Least Restrictive Environment<br />
A) Regular Early Childhood Program<br />
Percent of children (aged 3 through 5) with IEPs attending a regular<br />
early childhood program and receiving the majority of special<br />
education and related services in the regular early childhood program<br />
Allowable<br />
Difference<br />
LEA: 5707 - COSSATOT RIVER SCHOOL <strong>DISTRICT</strong><br />
Indicator 07: Preschool (3-5) Outcomes<br />
a) Percent of preschool CWD<br />
children who did not<br />
improve functioning.<br />
b) Percent of preschool CWD<br />
who improved but whose<br />
functioning remained below<br />
same age peers.<br />
c) Percent of preschool CWD<br />
who improved at a level<br />
nearer to same aged peers.<br />
d) Percent of preschool CWD<br />
who improved functioning to<br />
reach a level comparable to<br />
same age peers.<br />
e) Percent of preschool CWD<br />
children who maintain<br />
functioning at a level<br />
comparable to same aged<br />
peers.<br />
Summary<br />
Statements<br />
1) Of those preschool<br />
children who entered<br />
the preschool program<br />
below age expectations<br />
in each Outcome, the<br />
percent who<br />
substantially increased<br />
their rate of growth by<br />
the time they turned 6<br />
years of age or exited<br />
the program.<br />
2) The percent of<br />
preschool children who<br />
were functioning<br />
within age expectations<br />
in each Outcome by the<br />
time they turned 6<br />
years of age or exited<br />
A) Positive Social -Emotional<br />
Skills*<br />
State<br />
Rate<br />
A) Positive Social -<br />
Emotional Skills<br />
(Including social<br />
relationships)<br />
State<br />
Rate<br />
2.14%<br />
5.31%<br />
25.97%<br />
38.22%<br />
28.36%<br />
State<br />
Target<br />
LEA<br />
Rate<br />
LEA<br />
Rate<br />
— —<br />
— —<br />
— —<br />
— —<br />
— —<br />
Target<br />
Met by<br />
LEA(Y/N)<br />
B) Acquisition and Use of<br />
Knowledge and Skills<br />
(Including early language/<br />
communication and early literacy)<br />
B) Acquisition and Use of<br />
Knowledge and Skills **<br />
State<br />
Rate<br />
1.75%<br />
6.59%<br />
34.23%<br />
43.51%<br />
13.92%<br />
State<br />
Target<br />
LEA<br />
Rate<br />
Target<br />
Met by<br />
LEA(Y/N)<br />
C) Use of Appropriate Behaviors<br />
to Meet Their Needs<br />
State<br />
Rate<br />
State<br />
Target<br />
LEA<br />
Rate<br />
Target<br />
Met by<br />
LEA(Y/N)<br />
89.61% 90.50% — — N/A 90.31% 90.50% — — N/A 90.82% 92.50% — — N/A<br />
66.58% 69.50% — — N/A 57.43% 60.50% — — N/A 76.69% 78.50% — — N/A<br />
NOTE: * Including social relationships ** Including early language/ communication and early literacy<br />
Note: - - denotes not applicable<br />
State<br />
Rate<br />
LEA<br />
Rate<br />
— —<br />
— —<br />
— —<br />
— —<br />
— —<br />
C) Use of<br />
Appropriate<br />
Behaviors to<br />
Meet Their Needs<br />
State<br />
Rate<br />
4.51%<br />
17.34%<br />
41.72%<br />
34.97%<br />
LEA<br />
Rate<br />
1.46% — —<br />
— —<br />
— —<br />
— —<br />
— —<br />
Page 3 of 5
LEA: 5707 - COSSATOT RIVER SCHOOL <strong>DISTRICT</strong><br />
Indicator 08: Parent Involvement<br />
Percent of surveyed<br />
parents who reported<br />
school facilitated parent<br />
involvement as a means<br />
of improving services<br />
and results for children<br />
with disabilities.<br />
Early Childhood<br />
(3-5)<br />
School Age<br />
(5-21)<br />
State<br />
Rate<br />
90.47%<br />
95.05%<br />
Indicator 09: Disproportionality - Eligibility<br />
Disproportionate representation of racial<br />
and ethnic groups in special education and<br />
related services that is a result of<br />
inappropriate identification (e.g.<br />
monitoring data, review of policies,<br />
practices, and procedures under 618(d),<br />
etc.).<br />
State<br />
Rate<br />
State<br />
Target<br />
88.00%<br />
96.00%<br />
State<br />
Target<br />
0.00% 0.00%<br />
LEA<br />
Rate<br />
— —<br />
100.00%<br />
Indicator 10: Disproportionality-Child with a Disability<br />
Disproportionate representation of racial<br />
and ethnic groups in specific disability<br />
categories that is a result of inappropriate<br />
identification (e.g. monitoring data, review<br />
of policies, practices, and procedures under<br />
618(d), etc.).<br />
Indicator 11: Child Find<br />
Percent of children with<br />
parental consent to evaluate<br />
who are evaluated within<br />
the State established timeline<br />
of 60 days.<br />
Overall<br />
(3-21)<br />
Early Childhood<br />
(3-5)<br />
School Age<br />
(5-21)<br />
State<br />
Rate<br />
0.00%<br />
Indicator 12: Early Childhood Transition<br />
Percent of children referred by Part C prior to<br />
age 3, who are found eligible for Part B, and<br />
who have an IEP developed and implemented<br />
by their third birthday.<br />
Note: - - denotes not applicable<br />
State<br />
Rate<br />
99.41%<br />
99.70%<br />
98.97%<br />
State<br />
Rate<br />
State<br />
Target<br />
0.00%<br />
State<br />
Target<br />
100.00%<br />
100.00%<br />
100.00%<br />
State<br />
Target<br />
Target Met by<br />
LEA (Y/N)<br />
Y<br />
Target Met by<br />
LEA (Y/N)<br />
Y<br />
LEA<br />
Rate<br />
100.00%<br />
— —<br />
100.00%<br />
LEA<br />
Rate<br />
Target Met by<br />
LEA (Y/N)<br />
N/A<br />
Y<br />
Note: The target for Indicator 09 is to have zero percent<br />
(0%) of districts identified as having disproportionate<br />
representation as a result of inappropriate<br />
identification in eligibility.<br />
Note: The target for Indicator 10 is to have zero<br />
percent (0%) of districts identified as having<br />
disproportionate representation as a result of<br />
inappropriate identification in a disability<br />
category.<br />
Target Met by<br />
LEA (Y/N)<br />
N/A<br />
Y<br />
Target Met<br />
by LEA<br />
(Y/N)<br />
99.21% 100.00% - - N/A<br />
Y<br />
Note: * Indicates a zero reponse rate for the<br />
district.<br />
Page 4 of 5
LEA: 5707 - COSSATOT RIVER SCHOOL <strong>DISTRICT</strong><br />
Indicator 13: Secondary Transition<br />
Percent of youth with disabilities aged 16 and<br />
up with an IEP that includes coordinated,<br />
measurable, annual IEP goals and transition<br />
services that will reasonably enable the student<br />
to meet the post-secondary goals.<br />
Indicator 14: Post-School Outcomes<br />
A. Percent of youth enrolled in higher<br />
education within one year of leaving high<br />
school.<br />
State<br />
Rate<br />
State<br />
Target<br />
Note: Data for this Indicator is from the on-site monitoring of LEAs for the given year.<br />
B. Percent of youth enrolled in higher<br />
education or competitively employed<br />
within one year of leaving high school.<br />
C. Percent of youth enrolled in higher<br />
education or in some other postsecondary<br />
education or training program; or<br />
competitively employed or in some other<br />
employment within one year of leaving<br />
high school.<br />
State<br />
Rate<br />
Indicator 20: Reported Data-Timely and Accurate*<br />
District submitted<br />
required data elements<br />
on or before due dates;<br />
made revisions within<br />
the alloted reveiw<br />
periods.<br />
Accurate and Timely<br />
Data Submission<br />
Overall (3-21)<br />
Early Childhood (3-5)<br />
School Age (5-21)<br />
State<br />
Target<br />
100.00%<br />
100.00%<br />
100.00%<br />
State<br />
Target<br />
LEA<br />
Rate<br />
LEA<br />
Rate<br />
Target Met by<br />
LEA (Y/N)<br />
Target Met<br />
by LEA<br />
(Y/N)<br />
Target Met<br />
by LEA<br />
(Y/N)<br />
*Data reviewed for timely and accurate submissions included all APSCN cycle data except for personnel<br />
Note: - - denotes not applicable<br />
96.19 100.00 — — N/A<br />
14.53<br />
State<br />
Rate<br />
49.42<br />
State<br />
Rate<br />
54.07<br />
13.00<br />
State<br />
Target<br />
49.00<br />
State<br />
Target<br />
60.00<br />
Y<br />
N/A<br />
Y<br />
— —<br />
LEA<br />
Rate<br />
— —<br />
LEA<br />
Rate<br />
— —<br />
N/A<br />
Target Met<br />
by LEA<br />
(Y/N)<br />
N/A<br />
Target Met<br />
by LEA<br />
(Y/N)<br />
N/A<br />
Page 5 of 5
LEA: 5801 - ATKINS SCHOOL <strong>DISTRICT</strong><br />
<strong>ARKANSAS</strong> <strong>SPECIAL</strong> <strong>EDUCATION</strong><br />
<strong>DISTRICT</strong> <strong>ANNUAL</strong> PERFORMANCE REPORT<br />
2010/11 School Year<br />
Publication Date: March 2012<br />
Each State must have in place a State Performance Plan (SPP) to evaluate the State's efforts to meet the requirements and<br />
purposes of the implementation of the Individuals with Disabilities Education Act (IDEA). The SPP is a six-year plan, which<br />
describes Arkansas's performance on 20 indicators. The Office of Special Education Programs in the U. S. Department of<br />
Education requires that States report annually to the public on the performance of each local education agency (LEA) on 14 of<br />
20 indicators as compared with targets established by the State in the SPP. Arkansas will report indicators 1 through 14 and<br />
20 for each LEA serving children with disabilities (CWD). Any LEA not meeting targets on compliance indicators (0% for<br />
Indicators 4B, 09 & 10 and 100% for Indicators 11, 12, 13, and 20) are non-compliant with IDEA.<br />
There are no report changes for the 2010/11 school year profile; However, it is important to recognize that: .<br />
1. Indicator 01 (Graduation) is reported a year in arrear (2009/10 graduates) and is based on a four-year cohort. This<br />
means the rate is a measure of students who entered in ninth grade and graduate in four years. The calculation is a<br />
requirement under Title I of the Elementary and Secondary Education Act (ESEA).<br />
2. Indicator 02 (Drop out) is reported a year in arrear. This means the rate is a measure of students who dropped out in<br />
the 2009/10 school year. The Indicator 02 data are aligned with the Common Core of Data (CCD) requirements for<br />
grades 7-12.<br />
3. Indicator 04A and 4B (Suspension/Expulsion) is reported a year in arrear. This means the rate is a measure of<br />
students who had out-of-school suspensions and/or expulsions totaling more than 10 days.<br />
Percent of youth<br />
with IEPs<br />
graduating from<br />
high school with a<br />
regular diploma<br />
For a complete description of all the Indicators, please visit the special education website at<br />
http://arksped.k12.ar.us/sections/policy.html<br />
Indicator 01: Graduation Rates (2009/10 school year) Indicator 02: Dropout Rates (2009/10 school year)<br />
State<br />
Rate<br />
State<br />
Target<br />
75.76% 85.00%<br />
LEA<br />
Rate<br />
75.00%<br />
Target Met<br />
by LEA<br />
(Y/N)<br />
N<br />
Percent of<br />
youth with<br />
IEPs dropping<br />
out of high<br />
school<br />
State<br />
Rate<br />
Indicator 03: Assessment on Statewide Benchmark Exam (grades 3-8, 11)<br />
A) Adequate Yearly Progress<br />
n=40<br />
Literacy<br />
Mathematics<br />
Met Disability Subgroup "n"<br />
for Reporting Purposes (Y/N)<br />
State Target for % of Districts Meeting<br />
AYP for Disability Subgroup<br />
State<br />
Target<br />
3.06% 4.20%<br />
LEA<br />
Rate<br />
5.08%<br />
% of Districts Meeting AYP<br />
for Disability Subgroup<br />
Target Met by<br />
LEA (Y/N)<br />
N<br />
Target Met by<br />
LEA(Y/N)<br />
Overall N 17.15% 6.25%<br />
NA<br />
N<br />
N<br />
Note: For a district to qualify as having a disability subgroup it must have a minimum of 40 (n=40) students with disabilities in a school building.<br />
B) Participation<br />
Participation Rate: # of<br />
CWD Tested ÷ # of CWD<br />
Enrolled in grades tested.<br />
Participation Rate: Literacy<br />
Participation Rate: Math<br />
Note: - - denotes not applicable<br />
State<br />
Rate<br />
98.78%<br />
State<br />
Target<br />
95.00%<br />
LEA<br />
Rate<br />
96.97%<br />
Target Met<br />
by LEA (Y/N)<br />
98.61% 95.00% 96.88% Y<br />
Y<br />
C) Performance Proficiency<br />
Percent of CWD Scoring<br />
Proficient or Above<br />
Proficiency Rate: Literacy<br />
Proficiency Rate:<br />
Mathematics<br />
16.00%<br />
16.00%<br />
State<br />
Rate<br />
31.49%<br />
44.86%<br />
State<br />
Target<br />
45.22%<br />
51.14%<br />
LEA<br />
Rate<br />
30.51%<br />
43.86%<br />
NA<br />
NA<br />
Target<br />
Met by<br />
LEA (Y/N)<br />
N<br />
N<br />
Page 1 of 5
LEA: 5801 - ATKINS SCHOOL <strong>DISTRICT</strong><br />
Indicator 04: Out-of-School Suspensions and Expulsions (2009/10 school year)<br />
A) Suspension/Expulsion<br />
Percent difference of CWD with out-of- school suspensions and<br />
expulsions totaling greater than 10 days in a school year as<br />
compared to the same data for general education students in<br />
the district.<br />
B) Suspension/Expulsion by Race and Ethnicity<br />
Percent of districts that have: (a) a significant discrepancy, by race or<br />
ethnicity, in the rate of suspensions and expulsions of greater than 10<br />
days in a school year for children with IEPs; and (b) policies,<br />
procedures or practices that contribute to the significant discrepancy<br />
and do not comply with requirements relating to the development<br />
and implementation of IEPs, the use of positive behavioral<br />
interventions and supports, and procedural safeguards.<br />
Indicator 05: School Age (5-21) Least Restrictive Environment<br />
A) In the Regular Class 80% or more of the day<br />
Percent of CWD with<br />
IEPs receiving instruction<br />
in the regular class 80%<br />
or more of the day.<br />
State<br />
Rate<br />
State<br />
Target<br />
LEA<br />
Rate<br />
B) In the Regular Class less than 40% of the day<br />
Percent of CWD with<br />
IEPs receiving instruction<br />
in the regular class less<br />
than 60% of the day.<br />
53.87% 59.77%<br />
State<br />
Rate<br />
State<br />
Target<br />
12.42% 12.51%<br />
41.35%<br />
LEA<br />
Rate<br />
15.79%<br />
C) Other Settings outside the regular class<br />
Percent of CWD with IEPs served in<br />
public or private separate schools,<br />
residential placements, or<br />
homebound/hospital placements.<br />
State<br />
Rate<br />
State<br />
Target<br />
2.80% 2.56%<br />
Target Met<br />
by LEA (Y/N)<br />
N<br />
Target Met<br />
by LEA (Y/N)<br />
N<br />
LEA<br />
Rate<br />
0.00%<br />
Target Met<br />
by LEA(Y/N)<br />
Indicator 06: Early Childhood (3-5) Least Restrictive Environment<br />
A) Regular Early Childhood Program<br />
Percent of children (aged 3 through 5) with IEPs attending a regular<br />
early childhood program and receiving the majority of special<br />
education and related services in the regular early childhood program<br />
Allowable<br />
Difference<br />
LEA: 5801 - ATKINS SCHOOL <strong>DISTRICT</strong><br />
Indicator 07: Preschool (3-5) Outcomes<br />
a) Percent of preschool CWD<br />
children who did not<br />
improve functioning.<br />
b) Percent of preschool CWD<br />
who improved but whose<br />
functioning remained below<br />
same age peers.<br />
c) Percent of preschool CWD<br />
who improved at a level<br />
nearer to same aged peers.<br />
d) Percent of preschool CWD<br />
who improved functioning to<br />
reach a level comparable to<br />
same age peers.<br />
e) Percent of preschool CWD<br />
children who maintain<br />
functioning at a level<br />
comparable to same aged<br />
peers.<br />
Summary<br />
Statements<br />
1) Of those preschool<br />
children who entered<br />
the preschool program<br />
below age expectations<br />
in each Outcome, the<br />
percent who<br />
substantially increased<br />
their rate of growth by<br />
the time they turned 6<br />
years of age or exited<br />
the program.<br />
2) The percent of<br />
preschool children who<br />
were functioning<br />
within age expectations<br />
in each Outcome by the<br />
time they turned 6<br />
years of age or exited<br />
A) Positive Social -Emotional<br />
Skills*<br />
State<br />
Rate<br />
A) Positive Social -<br />
Emotional Skills<br />
(Including social<br />
relationships)<br />
State<br />
Rate<br />
2.14%<br />
5.31%<br />
25.97%<br />
38.22%<br />
28.36%<br />
State<br />
Target<br />
LEA<br />
Rate<br />
LEA<br />
Rate<br />
— —<br />
— —<br />
— —<br />
— —<br />
— —<br />
Target<br />
Met by<br />
LEA(Y/N)<br />
B) Acquisition and Use of<br />
Knowledge and Skills<br />
(Including early language/<br />
communication and early literacy)<br />
B) Acquisition and Use of<br />
Knowledge and Skills **<br />
State<br />
Rate<br />
1.75%<br />
6.59%<br />
34.23%<br />
43.51%<br />
13.92%<br />
State<br />
Target<br />
LEA<br />
Rate<br />
Target<br />
Met by<br />
LEA(Y/N)<br />
C) Use of Appropriate Behaviors<br />
to Meet Their Needs<br />
State<br />
Rate<br />
State<br />
Target<br />
LEA<br />
Rate<br />
Target<br />
Met by<br />
LEA(Y/N)<br />
89.61% 90.50% — — N/A 90.31% 90.50% — — N/A 90.82% 92.50% — — N/A<br />
66.58% 69.50% — — N/A 57.43% 60.50% — — N/A 76.69% 78.50% — — N/A<br />
NOTE: * Including social relationships ** Including early language/ communication and early literacy<br />
Note: - - denotes not applicable<br />
State<br />
Rate<br />
LEA<br />
Rate<br />
— —<br />
— —<br />
— —<br />
— —<br />
— —<br />
C) Use of<br />
Appropriate<br />
Behaviors to<br />
Meet Their Needs<br />
State<br />
Rate<br />
4.51%<br />
17.34%<br />
41.72%<br />
34.97%<br />
LEA<br />
Rate<br />
1.46% — —<br />
— —<br />
— —<br />
— —<br />
— —<br />
Page 3 of 5
LEA: 5801 - ATKINS SCHOOL <strong>DISTRICT</strong><br />
Indicator 08: Parent Involvement<br />
Percent of surveyed<br />
parents who reported<br />
school facilitated parent<br />
involvement as a means<br />
of improving services<br />
and results for children<br />
with disabilities.<br />
Early Childhood<br />
(3-5)<br />
School Age<br />
(5-21)<br />
State<br />
Rate<br />
90.47%<br />
95.05%<br />
Indicator 09: Disproportionality - Eligibility<br />
Disproportionate representation of racial<br />
and ethnic groups in special education and<br />
related services that is a result of<br />
inappropriate identification (e.g.<br />
monitoring data, review of policies,<br />
practices, and procedures under 618(d),<br />
etc.).<br />
State<br />
Rate<br />
State<br />
Target<br />
88.00%<br />
96.00%<br />
State<br />
Target<br />
0.00% 0.00%<br />
LEA<br />
Rate<br />
— —<br />
80.00%<br />
Indicator 10: Disproportionality-Child with a Disability<br />
Disproportionate representation of racial<br />
and ethnic groups in specific disability<br />
categories that is a result of inappropriate<br />
identification (e.g. monitoring data, review<br />
of policies, practices, and procedures under<br />
618(d), etc.).<br />
Indicator 11: Child Find<br />
Percent of children with<br />
parental consent to evaluate<br />
who are evaluated within<br />
the State established timeline<br />
of 60 days.<br />
Overall<br />
(3-21)<br />
Early Childhood<br />
(3-5)<br />
School Age<br />
(5-21)<br />
State<br />
Rate<br />
0.00%<br />
Indicator 12: Early Childhood Transition<br />
Percent of children referred by Part C prior to<br />
age 3, who are found eligible for Part B, and<br />
who have an IEP developed and implemented<br />
by their third birthday.<br />
Note: - - denotes not applicable<br />
State<br />
Rate<br />
99.41%<br />
99.70%<br />
98.97%<br />
State<br />
Rate<br />
State<br />
Target<br />
0.00%<br />
State<br />
Target<br />
100.00%<br />
100.00%<br />
100.00%<br />
State<br />
Target<br />
Target Met by<br />
LEA (Y/N)<br />
Y<br />
Target Met by<br />
LEA (Y/N)<br />
Y<br />
LEA<br />
Rate<br />
100.00%<br />
— —<br />
100.00%<br />
LEA<br />
Rate<br />
Target Met by<br />
LEA (Y/N)<br />
N/A<br />
N<br />
Note: The target for Indicator 09 is to have zero percent<br />
(0%) of districts identified as having disproportionate<br />
representation as a result of inappropriate<br />
identification in eligibility.<br />
Note: The target for Indicator 10 is to have zero<br />
percent (0%) of districts identified as having<br />
disproportionate representation as a result of<br />
inappropriate identification in a disability<br />
category.<br />
Target Met by<br />
LEA (Y/N)<br />
N/A<br />
Y<br />
Target Met<br />
by LEA<br />
(Y/N)<br />
99.21% 100.00% - - N/A<br />
Y<br />
Note: * Indicates a zero reponse rate for the<br />
district.<br />
Page 4 of 5
LEA: 5801 - ATKINS SCHOOL <strong>DISTRICT</strong><br />
Indicator 13: Secondary Transition<br />
Percent of youth with disabilities aged 16 and<br />
up with an IEP that includes coordinated,<br />
measurable, annual IEP goals and transition<br />
services that will reasonably enable the student<br />
to meet the post-secondary goals.<br />
Indicator 14: Post-School Outcomes<br />
A. Percent of youth enrolled in higher<br />
education within one year of leaving high<br />
school.<br />
State<br />
Rate<br />
State<br />
Target<br />
Note: Data for this Indicator is from the on-site monitoring of LEAs for the given year.<br />
B. Percent of youth enrolled in higher<br />
education or competitively employed<br />
within one year of leaving high school.<br />
C. Percent of youth enrolled in higher<br />
education or in some other postsecondary<br />
education or training program; or<br />
competitively employed or in some other<br />
employment within one year of leaving<br />
high school.<br />
State<br />
Rate<br />
Indicator 20: Reported Data-Timely and Accurate*<br />
District submitted<br />
required data elements<br />
on or before due dates;<br />
made revisions within<br />
the alloted reveiw<br />
periods.<br />
Accurate and Timely<br />
Data Submission<br />
Overall (3-21)<br />
Early Childhood (3-5)<br />
School Age (5-21)<br />
State<br />
Target<br />
100.00%<br />
100.00%<br />
100.00%<br />
State<br />
Target<br />
LEA<br />
Rate<br />
LEA<br />
Rate<br />
Target Met by<br />
LEA (Y/N)<br />
Target Met<br />
by LEA<br />
(Y/N)<br />
Target Met<br />
by LEA<br />
(Y/N)<br />
*Data reviewed for timely and accurate submissions included all APSCN cycle data except for personnel<br />
Note: - - denotes not applicable<br />
96.19 100.00 100.00% Y<br />
14.53<br />
State<br />
Rate<br />
49.42<br />
State<br />
Rate<br />
54.07<br />
13.00<br />
State<br />
Target<br />
49.00<br />
State<br />
Target<br />
60.00<br />
Y<br />
N/A<br />
Y<br />
— —<br />
LEA<br />
Rate<br />
— —<br />
LEA<br />
Rate<br />
— —<br />
N/A<br />
Target Met<br />
by LEA<br />
(Y/N)<br />
N/A<br />
Target Met<br />
by LEA<br />
(Y/N)<br />
N/A<br />
Page 5 of 5
LEA: 5802 - DOVER SCHOOL <strong>DISTRICT</strong><br />
<strong>ARKANSAS</strong> <strong>SPECIAL</strong> <strong>EDUCATION</strong><br />
<strong>DISTRICT</strong> <strong>ANNUAL</strong> PERFORMANCE REPORT<br />
2010/11 School Year<br />
Publication Date: March 2012<br />
Each State must have in place a State Performance Plan (SPP) to evaluate the State's efforts to meet the requirements and<br />
purposes of the implementation of the Individuals with Disabilities Education Act (IDEA). The SPP is a six-year plan, which<br />
describes Arkansas's performance on 20 indicators. The Office of Special Education Programs in the U. S. Department of<br />
Education requires that States report annually to the public on the performance of each local education agency (LEA) on 14 of<br />
20 indicators as compared with targets established by the State in the SPP. Arkansas will report indicators 1 through 14 and<br />
20 for each LEA serving children with disabilities (CWD). Any LEA not meeting targets on compliance indicators (0% for<br />
Indicators 4B, 09 & 10 and 100% for Indicators 11, 12, 13, and 20) are non-compliant with IDEA.<br />
There are no report changes for the 2010/11 school year profile; However, it is important to recognize that: .<br />
1. Indicator 01 (Graduation) is reported a year in arrear (2009/10 graduates) and is based on a four-year cohort. This<br />
means the rate is a measure of students who entered in ninth grade and graduate in four years. The calculation is a<br />
requirement under Title I of the Elementary and Secondary Education Act (ESEA).<br />
2. Indicator 02 (Drop out) is reported a year in arrear. This means the rate is a measure of students who dropped out in<br />
the 2009/10 school year. The Indicator 02 data are aligned with the Common Core of Data (CCD) requirements for<br />
grades 7-12.<br />
3. Indicator 04A and 4B (Suspension/Expulsion) is reported a year in arrear. This means the rate is a measure of<br />
students who had out-of-school suspensions and/or expulsions totaling more than 10 days.<br />
Percent of youth<br />
with IEPs<br />
graduating from<br />
high school with a<br />
regular diploma<br />
For a complete description of all the Indicators, please visit the special education website at<br />
http://arksped.k12.ar.us/sections/policy.html<br />
Indicator 01: Graduation Rates (2009/10 school year) Indicator 02: Dropout Rates (2009/10 school year)<br />
State<br />
Rate<br />
State<br />
Target<br />
75.76% 85.00%<br />
LEA<br />
Rate<br />
91.67%<br />
Target Met<br />
by LEA<br />
(Y/N)<br />
Y<br />
Percent of<br />
youth with<br />
IEPs dropping<br />
out of high<br />
school<br />
State<br />
Rate<br />
Indicator 03: Assessment on Statewide Benchmark Exam (grades 3-8, 11)<br />
A) Adequate Yearly Progress<br />
n=40<br />
Literacy<br />
Mathematics<br />
Met Disability Subgroup "n"<br />
for Reporting Purposes (Y/N)<br />
State Target for % of Districts Meeting<br />
AYP for Disability Subgroup<br />
State<br />
Target<br />
3.06% 4.20%<br />
LEA<br />
Rate<br />
3.28%<br />
% of Districts Meeting AYP<br />
for Disability Subgroup<br />
Target Met by<br />
LEA (Y/N)<br />
Y<br />
Target Met by<br />
LEA(Y/N)<br />
Overall N 17.15% 6.25%<br />
NA<br />
N<br />
N<br />
Note: For a district to qualify as having a disability subgroup it must have a minimum of 40 (n=40) students with disabilities in a school building.<br />
B) Participation<br />
Participation Rate: # of<br />
CWD Tested ÷ # of CWD<br />
Enrolled in grades tested.<br />
Participation Rate: Literacy<br />
Participation Rate: Math<br />
Note: - - denotes not applicable<br />
State<br />
Rate<br />
98.78%<br />
State<br />
Target<br />
95.00%<br />
LEA<br />
Rate<br />
97.65%<br />
Target Met<br />
by LEA (Y/N)<br />
98.61% 95.00% 97.92% Y<br />
Y<br />
C) Performance Proficiency<br />
Percent of CWD Scoring<br />
Proficient or Above<br />
Proficiency Rate: Literacy<br />
Proficiency Rate:<br />
Mathematics<br />
16.00%<br />
16.00%<br />
State<br />
Rate<br />
31.49%<br />
44.86%<br />
State<br />
Target<br />
45.22%<br />
51.14%<br />
LEA<br />
Rate<br />
46.84%<br />
48.89%<br />
NA<br />
NA<br />
Target<br />
Met by<br />
LEA (Y/N)<br />
Y<br />
N<br />
Page 1 of 5
LEA: 5802 - DOVER SCHOOL <strong>DISTRICT</strong><br />
Indicator 04: Out-of-School Suspensions and Expulsions (2009/10 school year)<br />
A) Suspension/Expulsion<br />
Percent difference of CWD with out-of- school suspensions and<br />
expulsions totaling greater than 10 days in a school year as<br />
compared to the same data for general education students in<br />
the district.<br />
B) Suspension/Expulsion by Race and Ethnicity<br />
Percent of districts that have: (a) a significant discrepancy, by race or<br />
ethnicity, in the rate of suspensions and expulsions of greater than 10<br />
days in a school year for children with IEPs; and (b) policies,<br />
procedures or practices that contribute to the significant discrepancy<br />
and do not comply with requirements relating to the development<br />
and implementation of IEPs, the use of positive behavioral<br />
interventions and supports, and procedural safeguards.<br />
Indicator 05: School Age (5-21) Least Restrictive Environment<br />
A) In the Regular Class 80% or more of the day<br />
Percent of CWD with<br />
IEPs receiving instruction<br />
in the regular class 80%<br />
or more of the day.<br />
State<br />
Rate<br />
State<br />
Target<br />
LEA<br />
Rate<br />
B) In the Regular Class less than 40% of the day<br />
Percent of CWD with<br />
IEPs receiving instruction<br />
in the regular class less<br />
than 60% of the day.<br />
53.87% 59.77%<br />
State<br />
Rate<br />
State<br />
Target<br />
12.42% 12.51%<br />
69.82%<br />
LEA<br />
Rate<br />
15.98%<br />
C) Other Settings outside the regular class<br />
Percent of CWD with IEPs served in<br />
public or private separate schools,<br />
residential placements, or<br />
homebound/hospital placements.<br />
State<br />
Rate<br />
State<br />
Target<br />
2.80% 2.56%<br />
Target Met<br />
by LEA (Y/N)<br />
Y<br />
Target Met<br />
by LEA (Y/N)<br />
N<br />
LEA<br />
Rate<br />
0.00%<br />
Target Met<br />
by LEA(Y/N)<br />
Indicator 06: Early Childhood (3-5) Least Restrictive Environment<br />
A) Regular Early Childhood Program<br />
Percent of children (aged 3 through 5) with IEPs attending a regular<br />
early childhood program and receiving the majority of special<br />
education and related services in the regular early childhood program<br />
Allowable<br />
Difference<br />
LEA: 5802 - DOVER SCHOOL <strong>DISTRICT</strong><br />
Indicator 07: Preschool (3-5) Outcomes<br />
a) Percent of preschool CWD<br />
children who did not<br />
improve functioning.<br />
b) Percent of preschool CWD<br />
who improved but whose<br />
functioning remained below<br />
same age peers.<br />
c) Percent of preschool CWD<br />
who improved at a level<br />
nearer to same aged peers.<br />
d) Percent of preschool CWD<br />
who improved functioning to<br />
reach a level comparable to<br />
same age peers.<br />
e) Percent of preschool CWD<br />
children who maintain<br />
functioning at a level<br />
comparable to same aged<br />
peers.<br />
Summary<br />
Statements<br />
1) Of those preschool<br />
children who entered<br />
the preschool program<br />
below age expectations<br />
in each Outcome, the<br />
percent who<br />
substantially increased<br />
their rate of growth by<br />
the time they turned 6<br />
years of age or exited<br />
the program.<br />
2) The percent of<br />
preschool children who<br />
were functioning<br />
within age expectations<br />
in each Outcome by the<br />
time they turned 6<br />
years of age or exited<br />
A) Positive Social -Emotional<br />
Skills*<br />
State<br />
Rate<br />
A) Positive Social -<br />
Emotional Skills<br />
(Including social<br />
relationships)<br />
State<br />
Rate<br />
2.14%<br />
5.31%<br />
25.97%<br />
38.22%<br />
28.36%<br />
State<br />
Target<br />
LEA<br />
Rate<br />
LEA<br />
Rate<br />
— —<br />
— —<br />
— —<br />
— —<br />
— —<br />
Target<br />
Met by<br />
LEA(Y/N)<br />
B) Acquisition and Use of<br />
Knowledge and Skills<br />
(Including early language/<br />
communication and early literacy)<br />
B) Acquisition and Use of<br />
Knowledge and Skills **<br />
State<br />
Rate<br />
1.75%<br />
6.59%<br />
34.23%<br />
43.51%<br />
13.92%<br />
State<br />
Target<br />
LEA<br />
Rate<br />
Target<br />
Met by<br />
LEA(Y/N)<br />
C) Use of Appropriate Behaviors<br />
to Meet Their Needs<br />
State<br />
Rate<br />
State<br />
Target<br />
LEA<br />
Rate<br />
Target<br />
Met by<br />
LEA(Y/N)<br />
89.61% 90.50% — — N/A 90.31% 90.50% — — N/A 90.82% 92.50% — — N/A<br />
66.58% 69.50% — — N/A 57.43% 60.50% — — N/A 76.69% 78.50% — — N/A<br />
NOTE: * Including social relationships ** Including early language/ communication and early literacy<br />
Note: - - denotes not applicable<br />
State<br />
Rate<br />
LEA<br />
Rate<br />
— —<br />
— —<br />
— —<br />
— —<br />
— —<br />
C) Use of<br />
Appropriate<br />
Behaviors to<br />
Meet Their Needs<br />
State<br />
Rate<br />
4.51%<br />
17.34%<br />
41.72%<br />
34.97%<br />
LEA<br />
Rate<br />
1.46% — —<br />
— —<br />
— —<br />
— —<br />
— —<br />
Page 3 of 5
LEA: 5802 - DOVER SCHOOL <strong>DISTRICT</strong><br />
Indicator 08: Parent Involvement<br />
Percent of surveyed<br />
parents who reported<br />
school facilitated parent<br />
involvement as a means<br />
of improving services<br />
and results for children<br />
with disabilities.<br />
Early Childhood<br />
(3-5)<br />
School Age<br />
(5-21)<br />
State<br />
Rate<br />
90.47%<br />
95.05%<br />
Indicator 09: Disproportionality - Eligibility<br />
Disproportionate representation of racial<br />
and ethnic groups in special education and<br />
related services that is a result of<br />
inappropriate identification (e.g.<br />
monitoring data, review of policies,<br />
practices, and procedures under 618(d),<br />
etc.).<br />
State<br />
Rate<br />
State<br />
Target<br />
88.00%<br />
96.00%<br />
State<br />
Target<br />
0.00% 0.00%<br />
LEA<br />
Rate<br />
— —<br />
98.31%<br />
Indicator 10: Disproportionality-Child with a Disability<br />
Disproportionate representation of racial<br />
and ethnic groups in specific disability<br />
categories that is a result of inappropriate<br />
identification (e.g. monitoring data, review<br />
of policies, practices, and procedures under<br />
618(d), etc.).<br />
Indicator 11: Child Find<br />
Percent of children with<br />
parental consent to evaluate<br />
who are evaluated within<br />
the State established timeline<br />
of 60 days.<br />
Overall<br />
(3-21)<br />
Early Childhood<br />
(3-5)<br />
School Age<br />
(5-21)<br />
State<br />
Rate<br />
0.00%<br />
Indicator 12: Early Childhood Transition<br />
Percent of children referred by Part C prior to<br />
age 3, who are found eligible for Part B, and<br />
who have an IEP developed and implemented<br />
by their third birthday.<br />
Note: - - denotes not applicable<br />
State<br />
Rate<br />
99.41%<br />
99.70%<br />
98.97%<br />
State<br />
Rate<br />
State<br />
Target<br />
0.00%<br />
State<br />
Target<br />
100.00%<br />
100.00%<br />
100.00%<br />
State<br />
Target<br />
Target Met by<br />
LEA (Y/N)<br />
Y<br />
Target Met by<br />
LEA (Y/N)<br />
Y<br />
LEA<br />
Rate<br />
100.00%<br />
— —<br />
100.00%<br />
LEA<br />
Rate<br />
Target Met by<br />
LEA (Y/N)<br />
N/A<br />
Y<br />
Note: The target for Indicator 09 is to have zero percent<br />
(0%) of districts identified as having disproportionate<br />
representation as a result of inappropriate<br />
identification in eligibility.<br />
Note: The target for Indicator 10 is to have zero<br />
percent (0%) of districts identified as having<br />
disproportionate representation as a result of<br />
inappropriate identification in a disability<br />
category.<br />
Target Met by<br />
LEA (Y/N)<br />
N/A<br />
Y<br />
Target Met<br />
by LEA<br />
(Y/N)<br />
99.21% 100.00% - - N/A<br />
Y<br />
Note: * Indicates a zero reponse rate for the<br />
district.<br />
Page 4 of 5
LEA: 5802 - DOVER SCHOOL <strong>DISTRICT</strong><br />
Indicator 13: Secondary Transition<br />
Percent of youth with disabilities aged 16 and<br />
up with an IEP that includes coordinated,<br />
measurable, annual IEP goals and transition<br />
services that will reasonably enable the student<br />
to meet the post-secondary goals.<br />
Indicator 14: Post-School Outcomes<br />
A. Percent of youth enrolled in higher<br />
education within one year of leaving high<br />
school.<br />
State<br />
Rate<br />
State<br />
Target<br />
Note: Data for this Indicator is from the on-site monitoring of LEAs for the given year.<br />
B. Percent of youth enrolled in higher<br />
education or competitively employed<br />
within one year of leaving high school.<br />
C. Percent of youth enrolled in higher<br />
education or in some other postsecondary<br />
education or training program; or<br />
competitively employed or in some other<br />
employment within one year of leaving<br />
high school.<br />
State<br />
Rate<br />
Indicator 20: Reported Data-Timely and Accurate*<br />
District submitted<br />
required data elements<br />
on or before due dates;<br />
made revisions within<br />
the alloted reveiw<br />
periods.<br />
Accurate and Timely<br />
Data Submission<br />
Overall (3-21)<br />
Early Childhood (3-5)<br />
School Age (5-21)<br />
State<br />
Target<br />
100.00%<br />
100.00%<br />
100.00%<br />
State<br />
Target<br />
LEA<br />
Rate<br />
LEA<br />
Rate<br />
Target Met by<br />
LEA (Y/N)<br />
Target Met<br />
by LEA<br />
(Y/N)<br />
Target Met<br />
by LEA<br />
(Y/N)<br />
*Data reviewed for timely and accurate submissions included all APSCN cycle data except for personnel<br />
Note: - - denotes not applicable<br />
96.19 100.00 — — N/A<br />
14.53<br />
State<br />
Rate<br />
49.42<br />
State<br />
Rate<br />
54.07<br />
13.00<br />
State<br />
Target<br />
49.00<br />
State<br />
Target<br />
60.00<br />
Y<br />
N/A<br />
Y<br />
— —<br />
LEA<br />
Rate<br />
— —<br />
LEA<br />
Rate<br />
— —<br />
N/A<br />
Target Met<br />
by LEA<br />
(Y/N)<br />
N/A<br />
Target Met<br />
by LEA<br />
(Y/N)<br />
N/A<br />
Page 5 of 5
LEA: 5803 - HECTOR SCHOOL <strong>DISTRICT</strong><br />
<strong>ARKANSAS</strong> <strong>SPECIAL</strong> <strong>EDUCATION</strong><br />
<strong>DISTRICT</strong> <strong>ANNUAL</strong> PERFORMANCE REPORT<br />
2010/11 School Year<br />
Publication Date: March 2012<br />
Each State must have in place a State Performance Plan (SPP) to evaluate the State's efforts to meet the requirements and<br />
purposes of the implementation of the Individuals with Disabilities Education Act (IDEA). The SPP is a six-year plan, which<br />
describes Arkansas's performance on 20 indicators. The Office of Special Education Programs in the U. S. Department of<br />
Education requires that States report annually to the public on the performance of each local education agency (LEA) on 14 of<br />
20 indicators as compared with targets established by the State in the SPP. Arkansas will report indicators 1 through 14 and<br />
20 for each LEA serving children with disabilities (CWD). Any LEA not meeting targets on compliance indicators (0% for<br />
Indicators 4B, 09 & 10 and 100% for Indicators 11, 12, 13, and 20) are non-compliant with IDEA.<br />
There are no report changes for the 2010/11 school year profile; However, it is important to recognize that: .<br />
1. Indicator 01 (Graduation) is reported a year in arrear (2009/10 graduates) and is based on a four-year cohort. This<br />
means the rate is a measure of students who entered in ninth grade and graduate in four years. The calculation is a<br />
requirement under Title I of the Elementary and Secondary Education Act (ESEA).<br />
2. Indicator 02 (Drop out) is reported a year in arrear. This means the rate is a measure of students who dropped out in<br />
the 2009/10 school year. The Indicator 02 data are aligned with the Common Core of Data (CCD) requirements for<br />
grades 7-12.<br />
3. Indicator 04A and 4B (Suspension/Expulsion) is reported a year in arrear. This means the rate is a measure of<br />
students who had out-of-school suspensions and/or expulsions totaling more than 10 days.<br />
Percent of youth<br />
with IEPs<br />
graduating from<br />
high school with a<br />
regular diploma<br />
For a complete description of all the Indicators, please visit the special education website at<br />
http://arksped.k12.ar.us/sections/policy.html<br />
Indicator 01: Graduation Rates (2009/10 school year) Indicator 02: Dropout Rates (2009/10 school year)<br />
State<br />
Rate<br />
State<br />
Target<br />
75.76% 85.00%<br />
LEA<br />
Rate<br />
83.33%<br />
Target Met<br />
by LEA<br />
(Y/N)<br />
N<br />
Percent of<br />
youth with<br />
IEPs dropping<br />
out of high<br />
school<br />
State<br />
Rate<br />
Indicator 03: Assessment on Statewide Benchmark Exam (grades 3-8, 11)<br />
A) Adequate Yearly Progress<br />
n=40<br />
Literacy<br />
Mathematics<br />
Met Disability Subgroup "n"<br />
for Reporting Purposes (Y/N)<br />
State Target for % of Districts Meeting<br />
AYP for Disability Subgroup<br />
State<br />
Target<br />
3.06% 4.20%<br />
LEA<br />
Rate<br />
0.00%<br />
% of Districts Meeting AYP<br />
for Disability Subgroup<br />
Target Met by<br />
LEA (Y/N)<br />
Y<br />
Target Met by<br />
LEA(Y/N)<br />
Overall N 17.15% 6.25%<br />
NA<br />
N<br />
N<br />
Note: For a district to qualify as having a disability subgroup it must have a minimum of 40 (n=40) students with disabilities in a school building.<br />
B) Participation<br />
Participation Rate: # of<br />
CWD Tested ÷ # of CWD<br />
Enrolled in grades tested.<br />
Participation Rate: Literacy<br />
Participation Rate: Math<br />
Note: - - denotes not applicable<br />
State<br />
Rate<br />
98.78%<br />
State<br />
Target<br />
95.00%<br />
LEA<br />
Rate<br />
100.00%<br />
Target Met<br />
by LEA (Y/N)<br />
98.61% 95.00% 100.00% Y<br />
Y<br />
C) Performance Proficiency<br />
Percent of CWD Scoring<br />
Proficient or Above<br />
Proficiency Rate: Literacy<br />
Proficiency Rate:<br />
Mathematics<br />
16.00%<br />
16.00%<br />
State<br />
Rate<br />
31.49%<br />
44.86%<br />
State<br />
Target<br />
45.22%<br />
51.14%<br />
LEA<br />
Rate<br />
67.65%<br />
48.78%<br />
NA<br />
NA<br />
Target<br />
Met by<br />
LEA (Y/N)<br />
Y<br />
N<br />
Page 1 of 5
LEA: 5803 - HECTOR SCHOOL <strong>DISTRICT</strong><br />
Indicator 04: Out-of-School Suspensions and Expulsions (2009/10 school year)<br />
A) Suspension/Expulsion<br />
Percent difference of CWD with out-of- school suspensions and<br />
expulsions totaling greater than 10 days in a school year as<br />
compared to the same data for general education students in<br />
the district.<br />
B) Suspension/Expulsion by Race and Ethnicity<br />
Percent of districts that have: (a) a significant discrepancy, by race or<br />
ethnicity, in the rate of suspensions and expulsions of greater than 10<br />
days in a school year for children with IEPs; and (b) policies,<br />
procedures or practices that contribute to the significant discrepancy<br />
and do not comply with requirements relating to the development<br />
and implementation of IEPs, the use of positive behavioral<br />
interventions and supports, and procedural safeguards.<br />
Indicator 05: School Age (5-21) Least Restrictive Environment<br />
A) In the Regular Class 80% or more of the day<br />
Percent of CWD with<br />
IEPs receiving instruction<br />
in the regular class 80%<br />
or more of the day.<br />
State<br />
Rate<br />
State<br />
Target<br />
LEA<br />
Rate<br />
B) In the Regular Class less than 40% of the day<br />
Percent of CWD with<br />
IEPs receiving instruction<br />
in the regular class less<br />
than 60% of the day.<br />
53.87% 59.77%<br />
State<br />
Rate<br />
State<br />
Target<br />
12.42% 12.51%<br />
60.76%<br />
LEA<br />
Rate<br />
27.85%<br />
C) Other Settings outside the regular class<br />
Percent of CWD with IEPs served in<br />
public or private separate schools,<br />
residential placements, or<br />
homebound/hospital placements.<br />
State<br />
Rate<br />
State<br />
Target<br />
2.80% 2.56%<br />
Target Met<br />
by LEA (Y/N)<br />
Y<br />
Target Met<br />
by LEA (Y/N)<br />
N<br />
LEA<br />
Rate<br />
0.00%<br />
Target Met<br />
by LEA(Y/N)<br />
Indicator 06: Early Childhood (3-5) Least Restrictive Environment<br />
A) Regular Early Childhood Program<br />
Percent of children (aged 3 through 5) with IEPs attending a regular<br />
early childhood program and receiving the majority of special<br />
education and related services in the regular early childhood program<br />
Allowable<br />
Difference<br />
LEA: 5803 - HECTOR SCHOOL <strong>DISTRICT</strong><br />
Indicator 07: Preschool (3-5) Outcomes<br />
a) Percent of preschool CWD<br />
children who did not<br />
improve functioning.<br />
b) Percent of preschool CWD<br />
who improved but whose<br />
functioning remained below<br />
same age peers.<br />
c) Percent of preschool CWD<br />
who improved at a level<br />
nearer to same aged peers.<br />
d) Percent of preschool CWD<br />
who improved functioning to<br />
reach a level comparable to<br />
same age peers.<br />
e) Percent of preschool CWD<br />
children who maintain<br />
functioning at a level<br />
comparable to same aged<br />
peers.<br />
Summary<br />
Statements<br />
1) Of those preschool<br />
children who entered<br />
the preschool program<br />
below age expectations<br />
in each Outcome, the<br />
percent who<br />
substantially increased<br />
their rate of growth by<br />
the time they turned 6<br />
years of age or exited<br />
the program.<br />
2) The percent of<br />
preschool children who<br />
were functioning<br />
within age expectations<br />
in each Outcome by the<br />
time they turned 6<br />
years of age or exited<br />
A) Positive Social -Emotional<br />
Skills*<br />
State<br />
Rate<br />
A) Positive Social -<br />
Emotional Skills<br />
(Including social<br />
relationships)<br />
State<br />
Rate<br />
2.14%<br />
5.31%<br />
25.97%<br />
38.22%<br />
28.36%<br />
State<br />
Target<br />
LEA<br />
Rate<br />
LEA<br />
Rate<br />
— —<br />
— —<br />
— —<br />
— —<br />
— —<br />
Target<br />
Met by<br />
LEA(Y/N)<br />
B) Acquisition and Use of<br />
Knowledge and Skills<br />
(Including early language/<br />
communication and early literacy)<br />
B) Acquisition and Use of<br />
Knowledge and Skills **<br />
State<br />
Rate<br />
1.75%<br />
6.59%<br />
34.23%<br />
43.51%<br />
13.92%<br />
State<br />
Target<br />
LEA<br />
Rate<br />
Target<br />
Met by<br />
LEA(Y/N)<br />
C) Use of Appropriate Behaviors<br />
to Meet Their Needs<br />
State<br />
Rate<br />
State<br />
Target<br />
LEA<br />
Rate<br />
Target<br />
Met by<br />
LEA(Y/N)<br />
89.61% 90.50% — — N/A 90.31% 90.50% — — N/A 90.82% 92.50% — — N/A<br />
66.58% 69.50% — — N/A 57.43% 60.50% — — N/A 76.69% 78.50% — — N/A<br />
NOTE: * Including social relationships ** Including early language/ communication and early literacy<br />
Note: - - denotes not applicable<br />
State<br />
Rate<br />
LEA<br />
Rate<br />
— —<br />
— —<br />
— —<br />
— —<br />
— —<br />
C) Use of<br />
Appropriate<br />
Behaviors to<br />
Meet Their Needs<br />
State<br />
Rate<br />
4.51%<br />
17.34%<br />
41.72%<br />
34.97%<br />
LEA<br />
Rate<br />
1.46% — —<br />
— —<br />
— —<br />
— —<br />
— —<br />
Page 3 of 5
LEA: 5803 - HECTOR SCHOOL <strong>DISTRICT</strong><br />
Indicator 08: Parent Involvement<br />
Percent of surveyed<br />
parents who reported<br />
school facilitated parent<br />
involvement as a means<br />
of improving services<br />
and results for children<br />
with disabilities.<br />
Early Childhood<br />
(3-5)<br />
School Age<br />
(5-21)<br />
State<br />
Rate<br />
90.47%<br />
95.05%<br />
Indicator 09: Disproportionality - Eligibility<br />
Disproportionate representation of racial<br />
and ethnic groups in special education and<br />
related services that is a result of<br />
inappropriate identification (e.g.<br />
monitoring data, review of policies,<br />
practices, and procedures under 618(d),<br />
etc.).<br />
State<br />
Rate<br />
State<br />
Target<br />
88.00%<br />
96.00%<br />
State<br />
Target<br />
0.00% 0.00%<br />
LEA<br />
Rate<br />
— —<br />
— —<br />
Indicator 10: Disproportionality-Child with a Disability<br />
Disproportionate representation of racial<br />
and ethnic groups in specific disability<br />
categories that is a result of inappropriate<br />
identification (e.g. monitoring data, review<br />
of policies, practices, and procedures under<br />
618(d), etc.).<br />
Indicator 11: Child Find<br />
Percent of children with<br />
parental consent to evaluate<br />
who are evaluated within<br />
the State established timeline<br />
of 60 days.<br />
Overall<br />
(3-21)<br />
Early Childhood<br />
(3-5)<br />
School Age<br />
(5-21)<br />
State<br />
Rate<br />
0.00%<br />
Indicator 12: Early Childhood Transition<br />
Percent of children referred by Part C prior to<br />
age 3, who are found eligible for Part B, and<br />
who have an IEP developed and implemented<br />
by their third birthday.<br />
Note: - - denotes not applicable<br />
State<br />
Rate<br />
99.41%<br />
99.70%<br />
98.97%<br />
State<br />
Rate<br />
State<br />
Target<br />
0.00%<br />
State<br />
Target<br />
100.00%<br />
100.00%<br />
100.00%<br />
State<br />
Target<br />
Target Met by<br />
LEA (Y/N)<br />
Y<br />
Target Met by<br />
LEA (Y/N)<br />
Y<br />
LEA<br />
Rate<br />
100.00%<br />
— —<br />
100.00%<br />
LEA<br />
Rate<br />
Target Met by<br />
LEA (Y/N)<br />
N/A<br />
N<br />
Note: The target for Indicator 09 is to have zero percent<br />
(0%) of districts identified as having disproportionate<br />
representation as a result of inappropriate<br />
identification in eligibility.<br />
Note: The target for Indicator 10 is to have zero<br />
percent (0%) of districts identified as having<br />
disproportionate representation as a result of<br />
inappropriate identification in a disability<br />
category.<br />
Target Met by<br />
LEA (Y/N)<br />
N/A<br />
Y<br />
Target Met<br />
by LEA<br />
(Y/N)<br />
99.21% 100.00% - - N/A<br />
Y<br />
Note: * Indicates a zero reponse rate for the<br />
district.<br />
Page 4 of 5
LEA: 5803 - HECTOR SCHOOL <strong>DISTRICT</strong><br />
Indicator 13: Secondary Transition<br />
Percent of youth with disabilities aged 16 and<br />
up with an IEP that includes coordinated,<br />
measurable, annual IEP goals and transition<br />
services that will reasonably enable the student<br />
to meet the post-secondary goals.<br />
Indicator 14: Post-School Outcomes<br />
A. Percent of youth enrolled in higher<br />
education within one year of leaving high<br />
school.<br />
State<br />
Rate<br />
State<br />
Target<br />
Note: Data for this Indicator is from the on-site monitoring of LEAs for the given year.<br />
B. Percent of youth enrolled in higher<br />
education or competitively employed<br />
within one year of leaving high school.<br />
C. Percent of youth enrolled in higher<br />
education or in some other postsecondary<br />
education or training program; or<br />
competitively employed or in some other<br />
employment within one year of leaving<br />
high school.<br />
State<br />
Rate<br />
Indicator 20: Reported Data-Timely and Accurate*<br />
District submitted<br />
required data elements<br />
on or before due dates;<br />
made revisions within<br />
the alloted reveiw<br />
periods.<br />
Accurate and Timely<br />
Data Submission<br />
Overall (3-21)<br />
Early Childhood (3-5)<br />
School Age (5-21)<br />
State<br />
Target<br />
100.00%<br />
100.00%<br />
100.00%<br />
State<br />
Target<br />
LEA<br />
Rate<br />
LEA<br />
Rate<br />
Target Met by<br />
LEA (Y/N)<br />
Target Met<br />
by LEA<br />
(Y/N)<br />
Target Met<br />
by LEA<br />
(Y/N)<br />
*Data reviewed for timely and accurate submissions included all APSCN cycle data except for personnel<br />
Note: - - denotes not applicable<br />
96.19 100.00 — — N/A<br />
14.53<br />
State<br />
Rate<br />
49.42<br />
State<br />
Rate<br />
54.07<br />
13.00<br />
State<br />
Target<br />
49.00<br />
State<br />
Target<br />
60.00<br />
Y<br />
N/A<br />
Y<br />
— —<br />
LEA<br />
Rate<br />
— —<br />
LEA<br />
Rate<br />
— —<br />
N/A<br />
Target Met<br />
by LEA<br />
(Y/N)<br />
N/A<br />
Target Met<br />
by LEA<br />
(Y/N)<br />
N/A<br />
Page 5 of 5
LEA: 5804 - POTTSVILLE SCHOOL <strong>DISTRICT</strong><br />
<strong>ARKANSAS</strong> <strong>SPECIAL</strong> <strong>EDUCATION</strong><br />
<strong>DISTRICT</strong> <strong>ANNUAL</strong> PERFORMANCE REPORT<br />
2010/11 School Year<br />
Publication Date: March 2012<br />
Each State must have in place a State Performance Plan (SPP) to evaluate the State's efforts to meet the requirements and<br />
purposes of the implementation of the Individuals with Disabilities Education Act (IDEA). The SPP is a six-year plan, which<br />
describes Arkansas's performance on 20 indicators. The Office of Special Education Programs in the U. S. Department of<br />
Education requires that States report annually to the public on the performance of each local education agency (LEA) on 14 of<br />
20 indicators as compared with targets established by the State in the SPP. Arkansas will report indicators 1 through 14 and<br />
20 for each LEA serving children with disabilities (CWD). Any LEA not meeting targets on compliance indicators (0% for<br />
Indicators 4B, 09 & 10 and 100% for Indicators 11, 12, 13, and 20) are non-compliant with IDEA.<br />
There are no report changes for the 2010/11 school year profile; However, it is important to recognize that: .<br />
1. Indicator 01 (Graduation) is reported a year in arrear (2009/10 graduates) and is based on a four-year cohort. This<br />
means the rate is a measure of students who entered in ninth grade and graduate in four years. The calculation is a<br />
requirement under Title I of the Elementary and Secondary Education Act (ESEA).<br />
2. Indicator 02 (Drop out) is reported a year in arrear. This means the rate is a measure of students who dropped out in<br />
the 2009/10 school year. The Indicator 02 data are aligned with the Common Core of Data (CCD) requirements for<br />
grades 7-12.<br />
3. Indicator 04A and 4B (Suspension/Expulsion) is reported a year in arrear. This means the rate is a measure of<br />
students who had out-of-school suspensions and/or expulsions totaling more than 10 days.<br />
Percent of youth<br />
with IEPs<br />
graduating from<br />
high school with a<br />
regular diploma<br />
For a complete description of all the Indicators, please visit the special education website at<br />
http://arksped.k12.ar.us/sections/policy.html<br />
Indicator 01: Graduation Rates (2009/10 school year) Indicator 02: Dropout Rates (2009/10 school year)<br />
State<br />
Rate<br />
State<br />
Target<br />
75.76% 85.00%<br />
LEA<br />
Rate<br />
100.00%<br />
Target Met<br />
by LEA<br />
(Y/N)<br />
Y<br />
Percent of<br />
youth with<br />
IEPs dropping<br />
out of high<br />
school<br />
State<br />
Rate<br />
Indicator 03: Assessment on Statewide Benchmark Exam (grades 3-8, 11)<br />
A) Adequate Yearly Progress<br />
n=40<br />
Literacy<br />
Mathematics<br />
Met Disability Subgroup "n"<br />
for Reporting Purposes (Y/N)<br />
State Target for % of Districts Meeting<br />
AYP for Disability Subgroup<br />
State<br />
Target<br />
3.06% 4.20%<br />
LEA<br />
Rate<br />
2.08%<br />
% of Districts Meeting AYP<br />
for Disability Subgroup<br />
Target Met by<br />
LEA (Y/N)<br />
Y<br />
Target Met by<br />
LEA(Y/N)<br />
Overall N 17.15% 6.25%<br />
NA<br />
N<br />
N<br />
Note: For a district to qualify as having a disability subgroup it must have a minimum of 40 (n=40) students with disabilities in a school building.<br />
B) Participation<br />
Participation Rate: # of<br />
CWD Tested ÷ # of CWD<br />
Enrolled in grades tested.<br />
Participation Rate: Literacy<br />
Participation Rate: Math<br />
Note: - - denotes not applicable<br />
State<br />
Rate<br />
98.78%<br />
State<br />
Target<br />
95.00%<br />
LEA<br />
Rate<br />
100.00%<br />
Target Met<br />
by LEA (Y/N)<br />
98.61% 95.00% 100.00% Y<br />
Y<br />
C) Performance Proficiency<br />
Percent of CWD Scoring<br />
Proficient or Above<br />
Proficiency Rate: Literacy<br />
Proficiency Rate:<br />
Mathematics<br />
16.00%<br />
16.00%<br />
State<br />
Rate<br />
31.49%<br />
44.86%<br />
State<br />
Target<br />
45.22%<br />
51.14%<br />
LEA<br />
Rate<br />
58.33%<br />
71.88%<br />
NA<br />
NA<br />
Target<br />
Met by<br />
LEA (Y/N)<br />
Y<br />
Y<br />
Page 1 of 5
LEA: 5804 - POTTSVILLE SCHOOL <strong>DISTRICT</strong><br />
Indicator 04: Out-of-School Suspensions and Expulsions (2009/10 school year)<br />
A) Suspension/Expulsion<br />
Percent difference of CWD with out-of- school suspensions and<br />
expulsions totaling greater than 10 days in a school year as<br />
compared to the same data for general education students in<br />
the district.<br />
B) Suspension/Expulsion by Race and Ethnicity<br />
Percent of districts that have: (a) a significant discrepancy, by race or<br />
ethnicity, in the rate of suspensions and expulsions of greater than 10<br />
days in a school year for children with IEPs; and (b) policies,<br />
procedures or practices that contribute to the significant discrepancy<br />
and do not comply with requirements relating to the development<br />
and implementation of IEPs, the use of positive behavioral<br />
interventions and supports, and procedural safeguards.<br />
Indicator 05: School Age (5-21) Least Restrictive Environment<br />
A) In the Regular Class 80% or more of the day<br />
Percent of CWD with<br />
IEPs receiving instruction<br />
in the regular class 80%<br />
or more of the day.<br />
State<br />
Rate<br />
State<br />
Target<br />
LEA<br />
Rate<br />
B) In the Regular Class less than 40% of the day<br />
Percent of CWD with<br />
IEPs receiving instruction<br />
in the regular class less<br />
than 60% of the day.<br />
53.87% 59.77%<br />
State<br />
Rate<br />
State<br />
Target<br />
12.42% 12.51%<br />
68.66%<br />
LEA<br />
Rate<br />
13.43%<br />
C) Other Settings outside the regular class<br />
Percent of CWD with IEPs served in<br />
public or private separate schools,<br />
residential placements, or<br />
homebound/hospital placements.<br />
State<br />
Rate<br />
State<br />
Target<br />
2.80% 2.56%<br />
Target Met<br />
by LEA (Y/N)<br />
Y<br />
Target Met<br />
by LEA (Y/N)<br />
N<br />
LEA<br />
Rate<br />
0.00%<br />
Target Met<br />
by LEA(Y/N)<br />
Indicator 06: Early Childhood (3-5) Least Restrictive Environment<br />
A) Regular Early Childhood Program<br />
Percent of children (aged 3 through 5) with IEPs attending a regular<br />
early childhood program and receiving the majority of special<br />
education and related services in the regular early childhood program<br />
Allowable<br />
Difference<br />
LEA: 5804 - POTTSVILLE SCHOOL <strong>DISTRICT</strong><br />
Indicator 07: Preschool (3-5) Outcomes<br />
a) Percent of preschool CWD<br />
children who did not<br />
improve functioning.<br />
b) Percent of preschool CWD<br />
who improved but whose<br />
functioning remained below<br />
same age peers.<br />
c) Percent of preschool CWD<br />
who improved at a level<br />
nearer to same aged peers.<br />
d) Percent of preschool CWD<br />
who improved functioning to<br />
reach a level comparable to<br />
same age peers.<br />
e) Percent of preschool CWD<br />
children who maintain<br />
functioning at a level<br />
comparable to same aged<br />
peers.<br />
Summary<br />
Statements<br />
1) Of those preschool<br />
children who entered<br />
the preschool program<br />
below age expectations<br />
in each Outcome, the<br />
percent who<br />
substantially increased<br />
their rate of growth by<br />
the time they turned 6<br />
years of age or exited<br />
the program.<br />
2) The percent of<br />
preschool children who<br />
were functioning<br />
within age expectations<br />
in each Outcome by the<br />
time they turned 6<br />
years of age or exited<br />
A) Positive Social -Emotional<br />
Skills*<br />
State<br />
Rate<br />
A) Positive Social -<br />
Emotional Skills<br />
(Including social<br />
relationships)<br />
State<br />
Rate<br />
2.14%<br />
5.31%<br />
25.97%<br />
38.22%<br />
28.36%<br />
State<br />
Target<br />
LEA<br />
Rate<br />
LEA<br />
Rate<br />
— —<br />
— —<br />
— —<br />
— —<br />
— —<br />
Target<br />
Met by<br />
LEA(Y/N)<br />
B) Acquisition and Use of<br />
Knowledge and Skills<br />
(Including early language/<br />
communication and early literacy)<br />
B) Acquisition and Use of<br />
Knowledge and Skills **<br />
State<br />
Rate<br />
1.75%<br />
6.59%<br />
34.23%<br />
43.51%<br />
13.92%<br />
State<br />
Target<br />
LEA<br />
Rate<br />
Target<br />
Met by<br />
LEA(Y/N)<br />
C) Use of Appropriate Behaviors<br />
to Meet Their Needs<br />
State<br />
Rate<br />
State<br />
Target<br />
LEA<br />
Rate<br />
Target<br />
Met by<br />
LEA(Y/N)<br />
89.61% 90.50% — — N/A 90.31% 90.50% — — N/A 90.82% 92.50% — — N/A<br />
66.58% 69.50% — — N/A 57.43% 60.50% — — N/A 76.69% 78.50% — — N/A<br />
NOTE: * Including social relationships ** Including early language/ communication and early literacy<br />
Note: - - denotes not applicable<br />
State<br />
Rate<br />
LEA<br />
Rate<br />
— —<br />
— —<br />
— —<br />
— —<br />
— —<br />
C) Use of<br />
Appropriate<br />
Behaviors to<br />
Meet Their Needs<br />
State<br />
Rate<br />
4.51%<br />
17.34%<br />
41.72%<br />
34.97%<br />
LEA<br />
Rate<br />
1.46% — —<br />
— —<br />
— —<br />
— —<br />
— —<br />
Page 3 of 5
LEA: 5804 - POTTSVILLE SCHOOL <strong>DISTRICT</strong><br />
Indicator 08: Parent Involvement<br />
Percent of surveyed<br />
parents who reported<br />
school facilitated parent<br />
involvement as a means<br />
of improving services<br />
and results for children<br />
with disabilities.<br />
Early Childhood<br />
(3-5)<br />
School Age<br />
(5-21)<br />
State<br />
Rate<br />
90.47%<br />
95.05%<br />
Indicator 09: Disproportionality - Eligibility<br />
Disproportionate representation of racial<br />
and ethnic groups in special education and<br />
related services that is a result of<br />
inappropriate identification (e.g.<br />
monitoring data, review of policies,<br />
practices, and procedures under 618(d),<br />
etc.).<br />
State<br />
Rate<br />
State<br />
Target<br />
88.00%<br />
96.00%<br />
State<br />
Target<br />
0.00% 0.00%<br />
LEA<br />
Rate<br />
— —<br />
95.89%<br />
Indicator 10: Disproportionality-Child with a Disability<br />
Disproportionate representation of racial<br />
and ethnic groups in specific disability<br />
categories that is a result of inappropriate<br />
identification (e.g. monitoring data, review<br />
of policies, practices, and procedures under<br />
618(d), etc.).<br />
Indicator 11: Child Find<br />
Percent of children with<br />
parental consent to evaluate<br />
who are evaluated within<br />
the State established timeline<br />
of 60 days.<br />
Overall<br />
(3-21)<br />
Early Childhood<br />
(3-5)<br />
School Age<br />
(5-21)<br />
State<br />
Rate<br />
0.00%<br />
Indicator 12: Early Childhood Transition<br />
Percent of children referred by Part C prior to<br />
age 3, who are found eligible for Part B, and<br />
who have an IEP developed and implemented<br />
by their third birthday.<br />
Note: - - denotes not applicable<br />
State<br />
Rate<br />
99.41%<br />
99.70%<br />
98.97%<br />
State<br />
Rate<br />
State<br />
Target<br />
0.00%<br />
State<br />
Target<br />
100.00%<br />
100.00%<br />
100.00%<br />
State<br />
Target<br />
Target Met by<br />
LEA (Y/N)<br />
Y<br />
Target Met by<br />
LEA (Y/N)<br />
Y<br />
LEA<br />
Rate<br />
100.00%<br />
— —<br />
100.00%<br />
LEA<br />
Rate<br />
Target Met by<br />
LEA (Y/N)<br />
N/A<br />
N<br />
Note: The target for Indicator 09 is to have zero percent<br />
(0%) of districts identified as having disproportionate<br />
representation as a result of inappropriate<br />
identification in eligibility.<br />
Note: The target for Indicator 10 is to have zero<br />
percent (0%) of districts identified as having<br />
disproportionate representation as a result of<br />
inappropriate identification in a disability<br />
category.<br />
Target Met by<br />
LEA (Y/N)<br />
N/A<br />
Y<br />
Target Met<br />
by LEA<br />
(Y/N)<br />
99.21% 100.00% - - N/A<br />
Y<br />
Note: * Indicates a zero reponse rate for the<br />
district.<br />
Page 4 of 5
LEA: 5804 - POTTSVILLE SCHOOL <strong>DISTRICT</strong><br />
Indicator 13: Secondary Transition<br />
Percent of youth with disabilities aged 16 and<br />
up with an IEP that includes coordinated,<br />
measurable, annual IEP goals and transition<br />
services that will reasonably enable the student<br />
to meet the post-secondary goals.<br />
Indicator 14: Post-School Outcomes<br />
A. Percent of youth enrolled in higher<br />
education within one year of leaving high<br />
school.<br />
State<br />
Rate<br />
State<br />
Target<br />
Note: Data for this Indicator is from the on-site monitoring of LEAs for the given year.<br />
B. Percent of youth enrolled in higher<br />
education or competitively employed<br />
within one year of leaving high school.<br />
C. Percent of youth enrolled in higher<br />
education or in some other postsecondary<br />
education or training program; or<br />
competitively employed or in some other<br />
employment within one year of leaving<br />
high school.<br />
State<br />
Rate<br />
Indicator 20: Reported Data-Timely and Accurate*<br />
District submitted<br />
required data elements<br />
on or before due dates;<br />
made revisions within<br />
the alloted reveiw<br />
periods.<br />
Accurate and Timely<br />
Data Submission<br />
Overall (3-21)<br />
Early Childhood (3-5)<br />
School Age (5-21)<br />
State<br />
Target<br />
100.00%<br />
100.00%<br />
100.00%<br />
State<br />
Target<br />
LEA<br />
Rate<br />
LEA<br />
Rate<br />
Target Met by<br />
LEA (Y/N)<br />
Target Met<br />
by LEA<br />
(Y/N)<br />
Target Met<br />
by LEA<br />
(Y/N)<br />
*Data reviewed for timely and accurate submissions included all APSCN cycle data except for personnel<br />
Note: - - denotes not applicable<br />
96.19 100.00 — — N/A<br />
14.53<br />
State<br />
Rate<br />
49.42<br />
State<br />
Rate<br />
54.07<br />
13.00<br />
State<br />
Target<br />
49.00<br />
State<br />
Target<br />
60.00<br />
Y<br />
N/A<br />
Y<br />
— —<br />
LEA<br />
Rate<br />
— —<br />
LEA<br />
Rate<br />
— —<br />
N/A<br />
Target Met<br />
by LEA<br />
(Y/N)<br />
N/A<br />
Target Met<br />
by LEA<br />
(Y/N)<br />
N/A<br />
Page 5 of 5
<strong>ARKANSAS</strong> <strong>SPECIAL</strong> <strong>EDUCATION</strong><br />
<strong>DISTRICT</strong> <strong>ANNUAL</strong> PERFORMANCE REPORT<br />
2010/11 School Year<br />
Publication Date: March 2012<br />
Each State must have in place a State Performance Plan (SPP) to evaluate the State's efforts to meet the requirements and<br />
purposes of the implementation of the Individuals with Disabilities Education Act (IDEA). The SPP is a six-year plan, which<br />
describes Arkansas's performance on 20 indicators. The Office of Special Education Programs in the U. S. Department of<br />
Education requires that States report annually to the public on the performance of each local education agency (LEA) on 14 of<br />
20 indicators as compared with targets established by the State in the SPP. Arkansas will report indicators 1 through 14 and<br />
20 for each LEA serving children with disabilities (CWD). Any LEA not meeting targets on compliance indicators (0% for<br />
Indicators 4B, 09 & 10 and 100% for Indicators 11, 12, 13, and 20) are non-compliant with IDEA.<br />
There are no report changes for the 2010/11 school year profile; However, it is important to recognize that: .<br />
1. Indicator 01 (Graduation) is reported a year in arrear (2009/10 graduates) and is based on a four-year cohort. This<br />
means the rate is a measure of students who entered in ninth grade and graduate in four years. The calculation is a<br />
requirement under Title I of the Elementary and Secondary Education Act (ESEA).<br />
2. Indicator 02 (Drop out) is reported a year in arrear. This means the rate is a measure of students who dropped out in<br />
the 2009/10 school year. The Indicator 02 data are aligned with the Common Core of Data (CCD) requirements for<br />
grades 7-12.<br />
3. Indicator 04A and 4B (Suspension/Expulsion) is reported a year in arrear. This means the rate is a measure of<br />
students who had out-of-school suspensions and/or expulsions totaling more than 10 days.<br />
For a complete description of all the Indicators, please visit the special education website at<br />
http://arksped.k12.ar.us/sections/policy.html<br />
LEA: 5805 - RUSSELLVILLE SCHOOL <strong>DISTRICT</strong><br />
Indicator 01: Graduation Rates (2009/10 school year) Indicator 02: Dropout Rates (2009/10 school year)<br />
Percent of youth<br />
with IEPs<br />
graduating from<br />
high school with a<br />
regular diploma<br />
State<br />
Rate<br />
State<br />
Target<br />
75.76% 85.00%<br />
LEA<br />
Rate<br />
91.67%<br />
Target Met<br />
by LEA<br />
(Y/N)<br />
Y<br />
Percent of<br />
youth with<br />
IEPs dropping<br />
out of high<br />
school<br />
State<br />
Rate<br />
Indicator 03: Assessment on Statewide Benchmark Exam (grades 3-8, 11)<br />
A) Adequate Yearly Progress<br />
n=40<br />
Literacy<br />
Mathematics<br />
Met Disability Subgroup "n"<br />
for Reporting Purposes (Y/N)<br />
State Target for % of Districts Meeting<br />
AYP for Disability Subgroup<br />
State<br />
Target<br />
3.06% 4.20%<br />
LEA<br />
Rate<br />
1.82%<br />
% of Districts Meeting AYP<br />
for Disability Subgroup<br />
Target Met by<br />
LEA (Y/N)<br />
Y<br />
Target Met by<br />
LEA(Y/N)<br />
Overall N 17.15% 6.25%<br />
NA<br />
N<br />
N<br />
Note: For a district to qualify as having a disability subgroup it must have a minimum of 40 (n=40) students with disabilities in a school building.<br />
B) Participation<br />
Participation Rate: # of<br />
CWD Tested ÷ # of CWD<br />
Enrolled in grades tested.<br />
Participation Rate: Literacy<br />
Participation Rate: Math<br />
Note: - - denotes not applicable<br />
State<br />
Rate<br />
98.78%<br />
State<br />
Target<br />
95.00%<br />
LEA<br />
Rate<br />
98.61%<br />
Target Met<br />
by LEA (Y/N)<br />
98.61% 95.00% 98.36% Y<br />
Y<br />
C) Performance Proficiency<br />
Percent of CWD Scoring<br />
Proficient or Above<br />
Proficiency Rate: Literacy<br />
Proficiency Rate:<br />
Mathematics<br />
16.00%<br />
16.00%<br />
State<br />
Rate<br />
31.49%<br />
44.86%<br />
State<br />
Target<br />
45.22%<br />
51.14%<br />
LEA<br />
Rate<br />
45.90%<br />
64.39%<br />
NA<br />
NA<br />
Target<br />
Met by<br />
LEA (Y/N)<br />
Y<br />
Y<br />
Page 1 of 5
LEA: 5805 - RUSSELLVILLE SCHOOL <strong>DISTRICT</strong><br />
Indicator 04: Out-of-School Suspensions and Expulsions (2009/10 school year)<br />
A) Suspension/Expulsion<br />
Percent difference of CWD with out-of- school suspensions and<br />
expulsions totaling greater than 10 days in a school year as<br />
compared to the same data for general education students in<br />
the district.<br />
B) Suspension/Expulsion by Race and Ethnicity<br />
Percent of districts that have: (a) a significant discrepancy, by race or<br />
ethnicity, in the rate of suspensions and expulsions of greater than 10<br />
days in a school year for children with IEPs; and (b) policies,<br />
procedures or practices that contribute to the significant discrepancy<br />
and do not comply with requirements relating to the development<br />
and implementation of IEPs, the use of positive behavioral<br />
interventions and supports, and procedural safeguards.<br />
Indicator 05: School Age (5-21) Least Restrictive Environment<br />
A) In the Regular Class 80% or more of the day<br />
Percent of CWD with<br />
IEPs receiving instruction<br />
in the regular class 80%<br />
or more of the day.<br />
State<br />
Rate<br />
State<br />
Target<br />
LEA<br />
Rate<br />
B) In the Regular Class less than 40% of the day<br />
Percent of CWD with<br />
IEPs receiving instruction<br />
in the regular class less<br />
than 60% of the day.<br />
53.87% 59.77%<br />
State<br />
Rate<br />
State<br />
Target<br />
12.42% 12.51%<br />
65.58%<br />
LEA<br />
Rate<br />
19.69%<br />
C) Other Settings outside the regular class<br />
Percent of CWD with IEPs served in<br />
public or private separate schools,<br />
residential placements, or<br />
homebound/hospital placements.<br />
State<br />
Rate<br />
State<br />
Target<br />
2.80% 2.56%<br />
Target Met<br />
by LEA (Y/N)<br />
Y<br />
Target Met<br />
by LEA (Y/N)<br />
N<br />
LEA<br />
Rate<br />
0.51%<br />
Target Met<br />
by LEA(Y/N)<br />
Indicator 06: Early Childhood (3-5) Least Restrictive Environment<br />
A) Regular Early Childhood Program<br />
Percent of children (aged 3 through 5) with IEPs attending a regular<br />
early childhood program and receiving the majority of special<br />
education and related services in the regular early childhood program<br />
Allowable<br />
Difference<br />
LEA: 5805 - RUSSELLVILLE SCHOOL <strong>DISTRICT</strong><br />
Indicator 07: Preschool (3-5) Outcomes<br />
a) Percent of preschool CWD<br />
children who did not<br />
improve functioning.<br />
b) Percent of preschool CWD<br />
who improved but whose<br />
functioning remained below<br />
same age peers.<br />
c) Percent of preschool CWD<br />
who improved at a level<br />
nearer to same aged peers.<br />
d) Percent of preschool CWD<br />
who improved functioning to<br />
reach a level comparable to<br />
same age peers.<br />
e) Percent of preschool CWD<br />
children who maintain<br />
functioning at a level<br />
comparable to same aged<br />
peers.<br />
Summary<br />
Statements<br />
1) Of those preschool<br />
children who entered<br />
the preschool program<br />
below age expectations<br />
in each Outcome, the<br />
percent who<br />
substantially increased<br />
their rate of growth by<br />
the time they turned 6<br />
years of age or exited<br />
the program.<br />
2) The percent of<br />
preschool children who<br />
were functioning<br />
within age expectations<br />
in each Outcome by the<br />
time they turned 6<br />
years of age or exited<br />
A) Positive Social -Emotional<br />
Skills*<br />
State<br />
Rate<br />
A) Positive Social -<br />
Emotional Skills<br />
(Including social<br />
relationships)<br />
State<br />
Rate<br />
2.14%<br />
5.31%<br />
25.97%<br />
38.22%<br />
28.36%<br />
State<br />
Target<br />
LEA<br />
Rate<br />
LEA<br />
Rate<br />
— —<br />
— —<br />
— —<br />
— —<br />
— —<br />
Target<br />
Met by<br />
LEA(Y/N)<br />
B) Acquisition and Use of<br />
Knowledge and Skills<br />
(Including early language/<br />
communication and early literacy)<br />
B) Acquisition and Use of<br />
Knowledge and Skills **<br />
State<br />
Rate<br />
1.75%<br />
6.59%<br />
34.23%<br />
43.51%<br />
13.92%<br />
State<br />
Target<br />
LEA<br />
Rate<br />
Target<br />
Met by<br />
LEA(Y/N)<br />
C) Use of Appropriate Behaviors<br />
to Meet Their Needs<br />
State<br />
Rate<br />
State<br />
Target<br />
LEA<br />
Rate<br />
Target<br />
Met by<br />
LEA(Y/N)<br />
89.61% 90.50% — — N/A 90.31% 90.50% — — N/A 90.82% 92.50% — — N/A<br />
66.58% 69.50% — — N/A 57.43% 60.50% — — N/A 76.69% 78.50% — — N/A<br />
NOTE: * Including social relationships ** Including early language/ communication and early literacy<br />
Note: - - denotes not applicable<br />
State<br />
Rate<br />
LEA<br />
Rate<br />
— —<br />
— —<br />
— —<br />
— —<br />
— —<br />
C) Use of<br />
Appropriate<br />
Behaviors to<br />
Meet Their Needs<br />
State<br />
Rate<br />
4.51%<br />
17.34%<br />
41.72%<br />
34.97%<br />
LEA<br />
Rate<br />
1.46% — —<br />
— —<br />
— —<br />
— —<br />
— —<br />
Page 3 of 5
LEA: 5805 - RUSSELLVILLE SCHOOL <strong>DISTRICT</strong><br />
Indicator 08: Parent Involvement<br />
Percent of surveyed<br />
parents who reported<br />
school facilitated parent<br />
involvement as a means<br />
of improving services<br />
and results for children<br />
with disabilities.<br />
Early Childhood<br />
(3-5)<br />
School Age<br />
(5-21)<br />
State<br />
Rate<br />
90.47%<br />
95.05%<br />
Indicator 09: Disproportionality - Eligibility<br />
Disproportionate representation of racial<br />
and ethnic groups in special education and<br />
related services that is a result of<br />
inappropriate identification (e.g.<br />
monitoring data, review of policies,<br />
practices, and procedures under 618(d),<br />
etc.).<br />
State<br />
Rate<br />
State<br />
Target<br />
88.00%<br />
96.00%<br />
State<br />
Target<br />
0.00% 0.00%<br />
LEA<br />
Rate<br />
— —<br />
96.21%<br />
Indicator 10: Disproportionality-Child with a Disability<br />
Disproportionate representation of racial<br />
and ethnic groups in specific disability<br />
categories that is a result of inappropriate<br />
identification (e.g. monitoring data, review<br />
of policies, practices, and procedures under<br />
618(d), etc.).<br />
Indicator 11: Child Find<br />
Percent of children with<br />
parental consent to evaluate<br />
who are evaluated within<br />
the State established timeline<br />
of 60 days.<br />
Overall<br />
(3-21)<br />
Early Childhood<br />
(3-5)<br />
School Age<br />
(5-21)<br />
State<br />
Rate<br />
0.00%<br />
Indicator 12: Early Childhood Transition<br />
Percent of children referred by Part C prior to<br />
age 3, who are found eligible for Part B, and<br />
who have an IEP developed and implemented<br />
by their third birthday.<br />
Note: - - denotes not applicable<br />
State<br />
Rate<br />
99.41%<br />
99.70%<br />
98.97%<br />
State<br />
Rate<br />
State<br />
Target<br />
0.00%<br />
State<br />
Target<br />
100.00%<br />
100.00%<br />
100.00%<br />
State<br />
Target<br />
Target Met by<br />
LEA (Y/N)<br />
Y<br />
Target Met by<br />
LEA (Y/N)<br />
Y<br />
LEA<br />
Rate<br />
100.00%<br />
— —<br />
100.00%<br />
LEA<br />
Rate<br />
Target Met by<br />
LEA (Y/N)<br />
N/A<br />
Y<br />
Note: The target for Indicator 09 is to have zero percent<br />
(0%) of districts identified as having disproportionate<br />
representation as a result of inappropriate<br />
identification in eligibility.<br />
Note: The target for Indicator 10 is to have zero<br />
percent (0%) of districts identified as having<br />
disproportionate representation as a result of<br />
inappropriate identification in a disability<br />
category.<br />
Target Met by<br />
LEA (Y/N)<br />
N/A<br />
Y<br />
Target Met<br />
by LEA<br />
(Y/N)<br />
99.21% 100.00% - - N/A<br />
Y<br />
Note: * Indicates a zero reponse rate for the<br />
district.<br />
Page 4 of 5
LEA: 5805 - RUSSELLVILLE SCHOOL <strong>DISTRICT</strong><br />
Indicator 13: Secondary Transition<br />
Percent of youth with disabilities aged 16 and<br />
up with an IEP that includes coordinated,<br />
measurable, annual IEP goals and transition<br />
services that will reasonably enable the student<br />
to meet the post-secondary goals.<br />
Indicator 14: Post-School Outcomes<br />
A. Percent of youth enrolled in higher<br />
education within one year of leaving high<br />
school.<br />
State<br />
Rate<br />
State<br />
Target<br />
Note: Data for this Indicator is from the on-site monitoring of LEAs for the given year.<br />
B. Percent of youth enrolled in higher<br />
education or competitively employed<br />
within one year of leaving high school.<br />
C. Percent of youth enrolled in higher<br />
education or in some other postsecondary<br />
education or training program; or<br />
competitively employed or in some other<br />
employment within one year of leaving<br />
high school.<br />
State<br />
Rate<br />
Indicator 20: Reported Data-Timely and Accurate*<br />
District submitted<br />
required data elements<br />
on or before due dates;<br />
made revisions within<br />
the alloted reveiw<br />
periods.<br />
Accurate and Timely<br />
Data Submission<br />
Overall (3-21)<br />
Early Childhood (3-5)<br />
School Age (5-21)<br />
State<br />
Target<br />
100.00%<br />
100.00%<br />
100.00%<br />
State<br />
Target<br />
LEA<br />
Rate<br />
LEA<br />
Rate<br />
Target Met by<br />
LEA (Y/N)<br />
Target Met<br />
by LEA<br />
(Y/N)<br />
Target Met<br />
by LEA<br />
(Y/N)<br />
*Data reviewed for timely and accurate submissions included all APSCN cycle data except for personnel<br />
Note: - - denotes not applicable<br />
96.19 100.00 — — N/A<br />
14.53<br />
State<br />
Rate<br />
49.42<br />
State<br />
Rate<br />
54.07<br />
13.00<br />
State<br />
Target<br />
49.00<br />
State<br />
Target<br />
60.00<br />
Y<br />
N/A<br />
Y<br />
— —<br />
LEA<br />
Rate<br />
— —<br />
LEA<br />
Rate<br />
— —<br />
N/A<br />
Target Met<br />
by LEA<br />
(Y/N)<br />
N/A<br />
Target Met<br />
by LEA<br />
(Y/N)<br />
N/A<br />
Page 5 of 5
LEA: 5901 - DES ARC SCHOOL <strong>DISTRICT</strong><br />
<strong>ARKANSAS</strong> <strong>SPECIAL</strong> <strong>EDUCATION</strong><br />
<strong>DISTRICT</strong> <strong>ANNUAL</strong> PERFORMANCE REPORT<br />
2010/11 School Year<br />
Publication Date: March 2012<br />
Each State must have in place a State Performance Plan (SPP) to evaluate the State's efforts to meet the requirements and<br />
purposes of the implementation of the Individuals with Disabilities Education Act (IDEA). The SPP is a six-year plan, which<br />
describes Arkansas's performance on 20 indicators. The Office of Special Education Programs in the U. S. Department of<br />
Education requires that States report annually to the public on the performance of each local education agency (LEA) on 14 of<br />
20 indicators as compared with targets established by the State in the SPP. Arkansas will report indicators 1 through 14 and<br />
20 for each LEA serving children with disabilities (CWD). Any LEA not meeting targets on compliance indicators (0% for<br />
Indicators 4B, 09 & 10 and 100% for Indicators 11, 12, 13, and 20) are non-compliant with IDEA.<br />
There are no report changes for the 2010/11 school year profile; However, it is important to recognize that: .<br />
1. Indicator 01 (Graduation) is reported a year in arrear (2009/10 graduates) and is based on a four-year cohort. This<br />
means the rate is a measure of students who entered in ninth grade and graduate in four years. The calculation is a<br />
requirement under Title I of the Elementary and Secondary Education Act (ESEA).<br />
2. Indicator 02 (Drop out) is reported a year in arrear. This means the rate is a measure of students who dropped out in<br />
the 2009/10 school year. The Indicator 02 data are aligned with the Common Core of Data (CCD) requirements for<br />
grades 7-12.<br />
3. Indicator 04A and 4B (Suspension/Expulsion) is reported a year in arrear. This means the rate is a measure of<br />
students who had out-of-school suspensions and/or expulsions totaling more than 10 days.<br />
Percent of youth<br />
with IEPs<br />
graduating from<br />
high school with a<br />
regular diploma<br />
For a complete description of all the Indicators, please visit the special education website at<br />
http://arksped.k12.ar.us/sections/policy.html<br />
Indicator 01: Graduation Rates (2009/10 school year) Indicator 02: Dropout Rates (2009/10 school year)<br />
State<br />
Rate<br />
State<br />
Target<br />
75.76% 85.00%<br />
LEA<br />
Rate<br />
100.00%<br />
Target Met<br />
by LEA<br />
(Y/N)<br />
Y<br />
Percent of<br />
youth with<br />
IEPs dropping<br />
out of high<br />
school<br />
State<br />
Rate<br />
Indicator 03: Assessment on Statewide Benchmark Exam (grades 3-8, 11)<br />
A) Adequate Yearly Progress<br />
n=40<br />
Literacy<br />
Mathematics<br />
Met Disability Subgroup "n"<br />
for Reporting Purposes (Y/N)<br />
State Target for % of Districts Meeting<br />
AYP for Disability Subgroup<br />
State<br />
Target<br />
3.06% 4.20%<br />
LEA<br />
Rate<br />
0.00%<br />
% of Districts Meeting AYP<br />
for Disability Subgroup<br />
Target Met by<br />
LEA (Y/N)<br />
Y<br />
Target Met by<br />
LEA(Y/N)<br />
Overall N 17.15% 6.25%<br />
NA<br />
N<br />
N<br />
Note: For a district to qualify as having a disability subgroup it must have a minimum of 40 (n=40) students with disabilities in a school building.<br />
B) Participation<br />
Participation Rate: # of<br />
CWD Tested ÷ # of CWD<br />
Enrolled in grades tested.<br />
Participation Rate: Literacy<br />
Participation Rate: Math<br />
Note: - - denotes not applicable<br />
State<br />
Rate<br />
98.78%<br />
State<br />
Target<br />
95.00%<br />
LEA<br />
Rate<br />
100.00%<br />
Target Met<br />
by LEA (Y/N)<br />
98.61% 95.00% 100.00% Y<br />
Y<br />
C) Performance Proficiency<br />
Percent of CWD Scoring<br />
Proficient or Above<br />
Proficiency Rate: Literacy<br />
Proficiency Rate:<br />
Mathematics<br />
16.00%<br />
16.00%<br />
State<br />
Rate<br />
31.49%<br />
44.86%<br />
State<br />
Target<br />
45.22%<br />
51.14%<br />
LEA<br />
Rate<br />
32.43%<br />
46.34%<br />
NA<br />
NA<br />
Target<br />
Met by<br />
LEA (Y/N)<br />
N<br />
N<br />
Page 1 of 5
LEA: 5901 - DES ARC SCHOOL <strong>DISTRICT</strong><br />
Indicator 04: Out-of-School Suspensions and Expulsions (2009/10 school year)<br />
A) Suspension/Expulsion<br />
Percent difference of CWD with out-of- school suspensions and<br />
expulsions totaling greater than 10 days in a school year as<br />
compared to the same data for general education students in<br />
the district.<br />
B) Suspension/Expulsion by Race and Ethnicity<br />
Percent of districts that have: (a) a significant discrepancy, by race or<br />
ethnicity, in the rate of suspensions and expulsions of greater than 10<br />
days in a school year for children with IEPs; and (b) policies,<br />
procedures or practices that contribute to the significant discrepancy<br />
and do not comply with requirements relating to the development<br />
and implementation of IEPs, the use of positive behavioral<br />
interventions and supports, and procedural safeguards.<br />
Indicator 05: School Age (5-21) Least Restrictive Environment<br />
A) In the Regular Class 80% or more of the day<br />
Percent of CWD with<br />
IEPs receiving instruction<br />
in the regular class 80%<br />
or more of the day.<br />
State<br />
Rate<br />
State<br />
Target<br />
LEA<br />
Rate<br />
B) In the Regular Class less than 40% of the day<br />
Percent of CWD with<br />
IEPs receiving instruction<br />
in the regular class less<br />
than 60% of the day.<br />
53.87% 59.77%<br />
State<br />
Rate<br />
State<br />
Target<br />
12.42% 12.51%<br />
49.35%<br />
LEA<br />
Rate<br />
3.90%<br />
C) Other Settings outside the regular class<br />
Percent of CWD with IEPs served in<br />
public or private separate schools,<br />
residential placements, or<br />
homebound/hospital placements.<br />
State<br />
Rate<br />
State<br />
Target<br />
2.80% 2.56%<br />
Target Met<br />
by LEA (Y/N)<br />
N<br />
Target Met<br />
by LEA (Y/N)<br />
Y<br />
LEA<br />
Rate<br />
6.49%<br />
Target Met<br />
by LEA(Y/N)<br />
Indicator 06: Early Childhood (3-5) Least Restrictive Environment<br />
A) Regular Early Childhood Program<br />
Percent of children (aged 3 through 5) with IEPs attending a regular<br />
early childhood program and receiving the majority of special<br />
education and related services in the regular early childhood program<br />
Allowable<br />
Difference<br />
LEA: 5901 - DES ARC SCHOOL <strong>DISTRICT</strong><br />
Indicator 07: Preschool (3-5) Outcomes<br />
a) Percent of preschool CWD<br />
children who did not<br />
improve functioning.<br />
b) Percent of preschool CWD<br />
who improved but whose<br />
functioning remained below<br />
same age peers.<br />
c) Percent of preschool CWD<br />
who improved at a level<br />
nearer to same aged peers.<br />
d) Percent of preschool CWD<br />
who improved functioning to<br />
reach a level comparable to<br />
same age peers.<br />
e) Percent of preschool CWD<br />
children who maintain<br />
functioning at a level<br />
comparable to same aged<br />
peers.<br />
Summary<br />
Statements<br />
1) Of those preschool<br />
children who entered<br />
the preschool program<br />
below age expectations<br />
in each Outcome, the<br />
percent who<br />
substantially increased<br />
their rate of growth by<br />
the time they turned 6<br />
years of age or exited<br />
the program.<br />
2) The percent of<br />
preschool children who<br />
were functioning<br />
within age expectations<br />
in each Outcome by the<br />
time they turned 6<br />
years of age or exited<br />
A) Positive Social -Emotional<br />
Skills*<br />
State<br />
Rate<br />
A) Positive Social -<br />
Emotional Skills<br />
(Including social<br />
relationships)<br />
State<br />
Rate<br />
2.14%<br />
5.31%<br />
25.97%<br />
38.22%<br />
28.36%<br />
State<br />
Target<br />
LEA<br />
Rate<br />
LEA<br />
Rate<br />
— —<br />
— —<br />
— —<br />
— —<br />
— —<br />
Target<br />
Met by<br />
LEA(Y/N)<br />
B) Acquisition and Use of<br />
Knowledge and Skills<br />
(Including early language/<br />
communication and early literacy)<br />
B) Acquisition and Use of<br />
Knowledge and Skills **<br />
State<br />
Rate<br />
1.75%<br />
6.59%<br />
34.23%<br />
43.51%<br />
13.92%<br />
State<br />
Target<br />
LEA<br />
Rate<br />
Target<br />
Met by<br />
LEA(Y/N)<br />
C) Use of Appropriate Behaviors<br />
to Meet Their Needs<br />
State<br />
Rate<br />
State<br />
Target<br />
LEA<br />
Rate<br />
Target<br />
Met by<br />
LEA(Y/N)<br />
89.61% 90.50% — — N/A 90.31% 90.50% — — N/A 90.82% 92.50% — — N/A<br />
66.58% 69.50% — — N/A 57.43% 60.50% — — N/A 76.69% 78.50% — — N/A<br />
NOTE: * Including social relationships ** Including early language/ communication and early literacy<br />
Note: - - denotes not applicable<br />
State<br />
Rate<br />
LEA<br />
Rate<br />
— —<br />
— —<br />
— —<br />
— —<br />
— —<br />
C) Use of<br />
Appropriate<br />
Behaviors to<br />
Meet Their Needs<br />
State<br />
Rate<br />
4.51%<br />
17.34%<br />
41.72%<br />
34.97%<br />
LEA<br />
Rate<br />
1.46% — —<br />
— —<br />
— —<br />
— —<br />
— —<br />
Page 3 of 5
LEA: 5901 - DES ARC SCHOOL <strong>DISTRICT</strong><br />
Indicator 08: Parent Involvement<br />
Percent of surveyed<br />
parents who reported<br />
school facilitated parent<br />
involvement as a means<br />
of improving services<br />
and results for children<br />
with disabilities.<br />
Early Childhood<br />
(3-5)<br />
School Age<br />
(5-21)<br />
State<br />
Rate<br />
90.47%<br />
95.05%<br />
Indicator 09: Disproportionality - Eligibility<br />
Disproportionate representation of racial<br />
and ethnic groups in special education and<br />
related services that is a result of<br />
inappropriate identification (e.g.<br />
monitoring data, review of policies,<br />
practices, and procedures under 618(d),<br />
etc.).<br />
State<br />
Rate<br />
State<br />
Target<br />
88.00%<br />
96.00%<br />
State<br />
Target<br />
0.00% 0.00%<br />
LEA<br />
Rate<br />
— —<br />
97.44%<br />
Indicator 10: Disproportionality-Child with a Disability<br />
Disproportionate representation of racial<br />
and ethnic groups in specific disability<br />
categories that is a result of inappropriate<br />
identification (e.g. monitoring data, review<br />
of policies, practices, and procedures under<br />
618(d), etc.).<br />
Indicator 11: Child Find<br />
Percent of children with<br />
parental consent to evaluate<br />
who are evaluated within<br />
the State established timeline<br />
of 60 days.<br />
Overall<br />
(3-21)<br />
Early Childhood<br />
(3-5)<br />
School Age<br />
(5-21)<br />
State<br />
Rate<br />
0.00%<br />
Indicator 12: Early Childhood Transition<br />
Percent of children referred by Part C prior to<br />
age 3, who are found eligible for Part B, and<br />
who have an IEP developed and implemented<br />
by their third birthday.<br />
Note: - - denotes not applicable<br />
State<br />
Rate<br />
99.41%<br />
99.70%<br />
98.97%<br />
State<br />
Rate<br />
State<br />
Target<br />
0.00%<br />
State<br />
Target<br />
100.00%<br />
100.00%<br />
100.00%<br />
State<br />
Target<br />
Target Met by<br />
LEA (Y/N)<br />
Y<br />
Target Met by<br />
LEA (Y/N)<br />
Y<br />
LEA<br />
Rate<br />
100.00%<br />
— —<br />
100.00%<br />
LEA<br />
Rate<br />
Target Met by<br />
LEA (Y/N)<br />
N/A<br />
Y<br />
Note: The target for Indicator 09 is to have zero percent<br />
(0%) of districts identified as having disproportionate<br />
representation as a result of inappropriate<br />
identification in eligibility.<br />
Note: The target for Indicator 10 is to have zero<br />
percent (0%) of districts identified as having<br />
disproportionate representation as a result of<br />
inappropriate identification in a disability<br />
category.<br />
Target Met by<br />
LEA (Y/N)<br />
N/A<br />
Y<br />
Target Met<br />
by LEA<br />
(Y/N)<br />
99.21% 100.00% - - N/A<br />
Y<br />
Note: * Indicates a zero reponse rate for the<br />
district.<br />
Page 4 of 5
LEA: 5901 - DES ARC SCHOOL <strong>DISTRICT</strong><br />
Indicator 13: Secondary Transition<br />
Percent of youth with disabilities aged 16 and<br />
up with an IEP that includes coordinated,<br />
measurable, annual IEP goals and transition<br />
services that will reasonably enable the student<br />
to meet the post-secondary goals.<br />
Indicator 14: Post-School Outcomes<br />
A. Percent of youth enrolled in higher<br />
education within one year of leaving high<br />
school.<br />
State<br />
Rate<br />
State<br />
Target<br />
Note: Data for this Indicator is from the on-site monitoring of LEAs for the given year.<br />
B. Percent of youth enrolled in higher<br />
education or competitively employed<br />
within one year of leaving high school.<br />
C. Percent of youth enrolled in higher<br />
education or in some other postsecondary<br />
education or training program; or<br />
competitively employed or in some other<br />
employment within one year of leaving<br />
high school.<br />
State<br />
Rate<br />
Indicator 20: Reported Data-Timely and Accurate*<br />
District submitted<br />
required data elements<br />
on or before due dates;<br />
made revisions within<br />
the alloted reveiw<br />
periods.<br />
Accurate and Timely<br />
Data Submission<br />
Overall (3-21)<br />
Early Childhood (3-5)<br />
School Age (5-21)<br />
State<br />
Target<br />
100.00%<br />
100.00%<br />
100.00%<br />
State<br />
Target<br />
LEA<br />
Rate<br />
LEA<br />
Rate<br />
Target Met by<br />
LEA (Y/N)<br />
Target Met<br />
by LEA<br />
(Y/N)<br />
Target Met<br />
by LEA<br />
(Y/N)<br />
*Data reviewed for timely and accurate submissions included all APSCN cycle data except for personnel<br />
Note: - - denotes not applicable<br />
96.19 100.00 — — N/A<br />
14.53<br />
State<br />
Rate<br />
49.42<br />
State<br />
Rate<br />
54.07<br />
13.00<br />
State<br />
Target<br />
49.00<br />
State<br />
Target<br />
60.00<br />
Y<br />
N/A<br />
Y<br />
— —<br />
LEA<br />
Rate<br />
— —<br />
LEA<br />
Rate<br />
— —<br />
N/A<br />
Target Met<br />
by LEA<br />
(Y/N)<br />
N/A<br />
Target Met<br />
by LEA<br />
(Y/N)<br />
N/A<br />
Page 5 of 5
LEA: 5903 - HAZEN SCHOOL <strong>DISTRICT</strong><br />
<strong>ARKANSAS</strong> <strong>SPECIAL</strong> <strong>EDUCATION</strong><br />
<strong>DISTRICT</strong> <strong>ANNUAL</strong> PERFORMANCE REPORT<br />
2010/11 School Year<br />
Publication Date: March 2012<br />
Each State must have in place a State Performance Plan (SPP) to evaluate the State's efforts to meet the requirements and<br />
purposes of the implementation of the Individuals with Disabilities Education Act (IDEA). The SPP is a six-year plan, which<br />
describes Arkansas's performance on 20 indicators. The Office of Special Education Programs in the U. S. Department of<br />
Education requires that States report annually to the public on the performance of each local education agency (LEA) on 14 of<br />
20 indicators as compared with targets established by the State in the SPP. Arkansas will report indicators 1 through 14 and<br />
20 for each LEA serving children with disabilities (CWD). Any LEA not meeting targets on compliance indicators (0% for<br />
Indicators 4B, 09 & 10 and 100% for Indicators 11, 12, 13, and 20) are non-compliant with IDEA.<br />
There are no report changes for the 2010/11 school year profile; However, it is important to recognize that: .<br />
1. Indicator 01 (Graduation) is reported a year in arrear (2009/10 graduates) and is based on a four-year cohort. This<br />
means the rate is a measure of students who entered in ninth grade and graduate in four years. The calculation is a<br />
requirement under Title I of the Elementary and Secondary Education Act (ESEA).<br />
2. Indicator 02 (Drop out) is reported a year in arrear. This means the rate is a measure of students who dropped out in<br />
the 2009/10 school year. The Indicator 02 data are aligned with the Common Core of Data (CCD) requirements for<br />
grades 7-12.<br />
3. Indicator 04A and 4B (Suspension/Expulsion) is reported a year in arrear. This means the rate is a measure of<br />
students who had out-of-school suspensions and/or expulsions totaling more than 10 days.<br />
Percent of youth<br />
with IEPs<br />
graduating from<br />
high school with a<br />
regular diploma<br />
For a complete description of all the Indicators, please visit the special education website at<br />
http://arksped.k12.ar.us/sections/policy.html<br />
Indicator 01: Graduation Rates (2009/10 school year) Indicator 02: Dropout Rates (2009/10 school year)<br />
State<br />
Rate<br />
State<br />
Target<br />
75.76% 85.00%<br />
LEA<br />
Rate<br />
100.00%<br />
Target Met<br />
by LEA<br />
(Y/N)<br />
Y<br />
Percent of<br />
youth with<br />
IEPs dropping<br />
out of high<br />
school<br />
State<br />
Rate<br />
Indicator 03: Assessment on Statewide Benchmark Exam (grades 3-8, 11)<br />
A) Adequate Yearly Progress<br />
n=40<br />
Literacy<br />
Mathematics<br />
Met Disability Subgroup "n"<br />
for Reporting Purposes (Y/N)<br />
State Target for % of Districts Meeting<br />
AYP for Disability Subgroup<br />
State<br />
Target<br />
3.06% 4.20%<br />
LEA<br />
Rate<br />
0.00%<br />
% of Districts Meeting AYP<br />
for Disability Subgroup<br />
Target Met by<br />
LEA (Y/N)<br />
Y<br />
Target Met by<br />
LEA(Y/N)<br />
Overall N 17.15% 6.25%<br />
NA<br />
N<br />
N<br />
Note: For a district to qualify as having a disability subgroup it must have a minimum of 40 (n=40) students with disabilities in a school building.<br />
B) Participation<br />
Participation Rate: # of<br />
CWD Tested ÷ # of CWD<br />
Enrolled in grades tested.<br />
Participation Rate: Literacy<br />
Participation Rate: Math<br />
Note: - - denotes not applicable<br />
State<br />
Rate<br />
98.78%<br />
State<br />
Target<br />
95.00%<br />
LEA<br />
Rate<br />
100.00%<br />
Target Met<br />
by LEA (Y/N)<br />
98.61% 95.00% 100.00% Y<br />
Y<br />
C) Performance Proficiency<br />
Percent of CWD Scoring<br />
Proficient or Above<br />
Proficiency Rate: Literacy<br />
Proficiency Rate:<br />
Mathematics<br />
16.00%<br />
16.00%<br />
State<br />
Rate<br />
31.49%<br />
44.86%<br />
State<br />
Target<br />
45.22%<br />
51.14%<br />
LEA<br />
Rate<br />
20.51%<br />
40.91%<br />
NA<br />
NA<br />
Target<br />
Met by<br />
LEA (Y/N)<br />
N<br />
N<br />
Page 1 of 5
LEA: 5903 - HAZEN SCHOOL <strong>DISTRICT</strong><br />
Indicator 04: Out-of-School Suspensions and Expulsions (2009/10 school year)<br />
A) Suspension/Expulsion<br />
Percent difference of CWD with out-of- school suspensions and<br />
expulsions totaling greater than 10 days in a school year as<br />
compared to the same data for general education students in<br />
the district.<br />
B) Suspension/Expulsion by Race and Ethnicity<br />
Percent of districts that have: (a) a significant discrepancy, by race or<br />
ethnicity, in the rate of suspensions and expulsions of greater than 10<br />
days in a school year for children with IEPs; and (b) policies,<br />
procedures or practices that contribute to the significant discrepancy<br />
and do not comply with requirements relating to the development<br />
and implementation of IEPs, the use of positive behavioral<br />
interventions and supports, and procedural safeguards.<br />
Indicator 05: School Age (5-21) Least Restrictive Environment<br />
A) In the Regular Class 80% or more of the day<br />
Percent of CWD with<br />
IEPs receiving instruction<br />
in the regular class 80%<br />
or more of the day.<br />
State<br />
Rate<br />
State<br />
Target<br />
LEA<br />
Rate<br />
B) In the Regular Class less than 40% of the day<br />
Percent of CWD with<br />
IEPs receiving instruction<br />
in the regular class less<br />
than 60% of the day.<br />
53.87% 59.77%<br />
State<br />
Rate<br />
State<br />
Target<br />
12.42% 12.51%<br />
51.28%<br />
LEA<br />
Rate<br />
5.13%<br />
C) Other Settings outside the regular class<br />
Percent of CWD with IEPs served in<br />
public or private separate schools,<br />
residential placements, or<br />
homebound/hospital placements.<br />
State<br />
Rate<br />
State<br />
Target<br />
2.80% 2.56%<br />
Target Met<br />
by LEA (Y/N)<br />
N<br />
Target Met<br />
by LEA (Y/N)<br />
Y<br />
LEA<br />
Rate<br />
1.28%<br />
Target Met<br />
by LEA(Y/N)<br />
Indicator 06: Early Childhood (3-5) Least Restrictive Environment<br />
A) Regular Early Childhood Program<br />
Percent of children (aged 3 through 5) with IEPs attending a regular<br />
early childhood program and receiving the majority of special<br />
education and related services in the regular early childhood program<br />
Allowable<br />
Difference<br />
LEA: 5903 - HAZEN SCHOOL <strong>DISTRICT</strong><br />
Indicator 07: Preschool (3-5) Outcomes<br />
a) Percent of preschool CWD<br />
children who did not<br />
improve functioning.<br />
b) Percent of preschool CWD<br />
who improved but whose<br />
functioning remained below<br />
same age peers.<br />
c) Percent of preschool CWD<br />
who improved at a level<br />
nearer to same aged peers.<br />
d) Percent of preschool CWD<br />
who improved functioning to<br />
reach a level comparable to<br />
same age peers.<br />
e) Percent of preschool CWD<br />
children who maintain<br />
functioning at a level<br />
comparable to same aged<br />
peers.<br />
Summary<br />
Statements<br />
1) Of those preschool<br />
children who entered<br />
the preschool program<br />
below age expectations<br />
in each Outcome, the<br />
percent who<br />
substantially increased<br />
their rate of growth by<br />
the time they turned 6<br />
years of age or exited<br />
the program.<br />
2) The percent of<br />
preschool children who<br />
were functioning<br />
within age expectations<br />
in each Outcome by the<br />
time they turned 6<br />
years of age or exited<br />
A) Positive Social -Emotional<br />
Skills*<br />
State<br />
Rate<br />
A) Positive Social -<br />
Emotional Skills<br />
(Including social<br />
relationships)<br />
State<br />
Rate<br />
2.14%<br />
5.31%<br />
25.97%<br />
38.22%<br />
28.36%<br />
State<br />
Target<br />
LEA<br />
Rate<br />
LEA<br />
Rate<br />
— —<br />
— —<br />
— —<br />
— —<br />
— —<br />
Target<br />
Met by<br />
LEA(Y/N)<br />
B) Acquisition and Use of<br />
Knowledge and Skills<br />
(Including early language/<br />
communication and early literacy)<br />
B) Acquisition and Use of<br />
Knowledge and Skills **<br />
State<br />
Rate<br />
1.75%<br />
6.59%<br />
34.23%<br />
43.51%<br />
13.92%<br />
State<br />
Target<br />
LEA<br />
Rate<br />
Target<br />
Met by<br />
LEA(Y/N)<br />
C) Use of Appropriate Behaviors<br />
to Meet Their Needs<br />
State<br />
Rate<br />
State<br />
Target<br />
LEA<br />
Rate<br />
Target<br />
Met by<br />
LEA(Y/N)<br />
89.61% 90.50% — — N/A 90.31% 90.50% — — N/A 90.82% 92.50% — — N/A<br />
66.58% 69.50% — — N/A 57.43% 60.50% — — N/A 76.69% 78.50% — — N/A<br />
NOTE: * Including social relationships ** Including early language/ communication and early literacy<br />
Note: - - denotes not applicable<br />
State<br />
Rate<br />
LEA<br />
Rate<br />
— —<br />
— —<br />
— —<br />
— —<br />
— —<br />
C) Use of<br />
Appropriate<br />
Behaviors to<br />
Meet Their Needs<br />
State<br />
Rate<br />
4.51%<br />
17.34%<br />
41.72%<br />
34.97%<br />
LEA<br />
Rate<br />
1.46% — —<br />
— —<br />
— —<br />
— —<br />
— —<br />
Page 3 of 5
LEA: 5903 - HAZEN SCHOOL <strong>DISTRICT</strong><br />
Indicator 08: Parent Involvement<br />
Percent of surveyed<br />
parents who reported<br />
school facilitated parent<br />
involvement as a means<br />
of improving services<br />
and results for children<br />
with disabilities.<br />
Early Childhood<br />
(3-5)<br />
School Age<br />
(5-21)<br />
State<br />
Rate<br />
90.47%<br />
95.05%<br />
Indicator 09: Disproportionality - Eligibility<br />
Disproportionate representation of racial<br />
and ethnic groups in special education and<br />
related services that is a result of<br />
inappropriate identification (e.g.<br />
monitoring data, review of policies,<br />
practices, and procedures under 618(d),<br />
etc.).<br />
State<br />
Rate<br />
State<br />
Target<br />
88.00%<br />
96.00%<br />
State<br />
Target<br />
0.00% 0.00%<br />
LEA<br />
Rate<br />
— —<br />
— —<br />
Indicator 10: Disproportionality-Child with a Disability<br />
Disproportionate representation of racial<br />
and ethnic groups in specific disability<br />
categories that is a result of inappropriate<br />
identification (e.g. monitoring data, review<br />
of policies, practices, and procedures under<br />
618(d), etc.).<br />
Indicator 11: Child Find<br />
Percent of children with<br />
parental consent to evaluate<br />
who are evaluated within<br />
the State established timeline<br />
of 60 days.<br />
Overall<br />
(3-21)<br />
Early Childhood<br />
(3-5)<br />
School Age<br />
(5-21)<br />
State<br />
Rate<br />
0.00%<br />
Indicator 12: Early Childhood Transition<br />
Percent of children referred by Part C prior to<br />
age 3, who are found eligible for Part B, and<br />
who have an IEP developed and implemented<br />
by their third birthday.<br />
Note: - - denotes not applicable<br />
State<br />
Rate<br />
99.41%<br />
99.70%<br />
98.97%<br />
State<br />
Rate<br />
State<br />
Target<br />
0.00%<br />
State<br />
Target<br />
100.00%<br />
100.00%<br />
100.00%<br />
State<br />
Target<br />
Target Met by<br />
LEA (Y/N)<br />
Y<br />
Target Met by<br />
LEA (Y/N)<br />
Y<br />
LEA<br />
Rate<br />
100.00%<br />
— —<br />
100.00%<br />
LEA<br />
Rate<br />
Target Met by<br />
LEA (Y/N)<br />
N/A<br />
N<br />
Note: The target for Indicator 09 is to have zero percent<br />
(0%) of districts identified as having disproportionate<br />
representation as a result of inappropriate<br />
identification in eligibility.<br />
Note: The target for Indicator 10 is to have zero<br />
percent (0%) of districts identified as having<br />
disproportionate representation as a result of<br />
inappropriate identification in a disability<br />
category.<br />
Target Met by<br />
LEA (Y/N)<br />
N/A<br />
Y<br />
Target Met<br />
by LEA<br />
(Y/N)<br />
99.21% 100.00% - - N/A<br />
Y<br />
Note: * Indicates a zero reponse rate for the<br />
district.<br />
Page 4 of 5
LEA: 5903 - HAZEN SCHOOL <strong>DISTRICT</strong><br />
Indicator 13: Secondary Transition<br />
Percent of youth with disabilities aged 16 and<br />
up with an IEP that includes coordinated,<br />
measurable, annual IEP goals and transition<br />
services that will reasonably enable the student<br />
to meet the post-secondary goals.<br />
Indicator 14: Post-School Outcomes<br />
A. Percent of youth enrolled in higher<br />
education within one year of leaving high<br />
school.<br />
State<br />
Rate<br />
State<br />
Target<br />
Note: Data for this Indicator is from the on-site monitoring of LEAs for the given year.<br />
B. Percent of youth enrolled in higher<br />
education or competitively employed<br />
within one year of leaving high school.<br />
C. Percent of youth enrolled in higher<br />
education or in some other postsecondary<br />
education or training program; or<br />
competitively employed or in some other<br />
employment within one year of leaving<br />
high school.<br />
State<br />
Rate<br />
Indicator 20: Reported Data-Timely and Accurate*<br />
District submitted<br />
required data elements<br />
on or before due dates;<br />
made revisions within<br />
the alloted reveiw<br />
periods.<br />
Accurate and Timely<br />
Data Submission<br />
Overall (3-21)<br />
Early Childhood (3-5)<br />
School Age (5-21)<br />
State<br />
Target<br />
100.00%<br />
100.00%<br />
100.00%<br />
State<br />
Target<br />
LEA<br />
Rate<br />
LEA<br />
Rate<br />
Target Met by<br />
LEA (Y/N)<br />
Target Met<br />
by LEA<br />
(Y/N)<br />
Target Met<br />
by LEA<br />
(Y/N)<br />
*Data reviewed for timely and accurate submissions included all APSCN cycle data except for personnel<br />
Note: - - denotes not applicable<br />
96.19 100.00 50.00% N<br />
14.53<br />
State<br />
Rate<br />
49.42<br />
State<br />
Rate<br />
54.07<br />
13.00<br />
State<br />
Target<br />
49.00<br />
State<br />
Target<br />
60.00<br />
Y<br />
N/A<br />
Y<br />
— —<br />
LEA<br />
Rate<br />
— —<br />
LEA<br />
Rate<br />
— —<br />
N/A<br />
Target Met<br />
by LEA<br />
(Y/N)<br />
N/A<br />
Target Met<br />
by LEA<br />
(Y/N)<br />
N/A<br />
Page 5 of 5
<strong>ARKANSAS</strong> <strong>SPECIAL</strong> <strong>EDUCATION</strong><br />
<strong>DISTRICT</strong> <strong>ANNUAL</strong> PERFORMANCE REPORT<br />
2010/11 School Year<br />
Publication Date: March 2012<br />
Each State must have in place a State Performance Plan (SPP) to evaluate the State's efforts to meet the requirements and<br />
purposes of the implementation of the Individuals with Disabilities Education Act (IDEA). The SPP is a six-year plan, which<br />
describes Arkansas's performance on 20 indicators. The Office of Special Education Programs in the U. S. Department of<br />
Education requires that States report annually to the public on the performance of each local education agency (LEA) on 14 of<br />
20 indicators as compared with targets established by the State in the SPP. Arkansas will report indicators 1 through 14 and<br />
20 for each LEA serving children with disabilities (CWD). Any LEA not meeting targets on compliance indicators (0% for<br />
Indicators 4B, 09 & 10 and 100% for Indicators 11, 12, 13, and 20) are non-compliant with IDEA.<br />
There are no report changes for the 2010/11 school year profile; However, it is important to recognize that: .<br />
1. Indicator 01 (Graduation) is reported a year in arrear (2009/10 graduates) and is based on a four-year cohort. This<br />
means the rate is a measure of students who entered in ninth grade and graduate in four years. The calculation is a<br />
requirement under Title I of the Elementary and Secondary Education Act (ESEA).<br />
2. Indicator 02 (Drop out) is reported a year in arrear. This means the rate is a measure of students who dropped out in<br />
the 2009/10 school year. The Indicator 02 data are aligned with the Common Core of Data (CCD) requirements for<br />
grades 7-12.<br />
3. Indicator 04A and 4B (Suspension/Expulsion) is reported a year in arrear. This means the rate is a measure of<br />
students who had out-of-school suspensions and/or expulsions totaling more than 10 days.<br />
For a complete description of all the Indicators, please visit the special education website at<br />
http://arksped.k12.ar.us/sections/policy.html<br />
LEA: 6001 - LITTLE ROCK SCHOOL <strong>DISTRICT</strong><br />
Indicator 01: Graduation Rates (2009/10 school year) Indicator 02: Dropout Rates (2009/10 school year)<br />
Percent of youth<br />
with IEPs<br />
graduating from<br />
high school with a<br />
regular diploma<br />
State<br />
Rate<br />
State<br />
Target<br />
75.76% 85.00%<br />
LEA<br />
Rate<br />
62.92%<br />
Target Met<br />
by LEA<br />
(Y/N)<br />
N<br />
Percent of<br />
youth with<br />
IEPs dropping<br />
out of high<br />
school<br />
State<br />
Rate<br />
Indicator 03: Assessment on Statewide Benchmark Exam (grades 3-8, 11)<br />
A) Adequate Yearly Progress<br />
n=40<br />
Literacy<br />
Mathematics<br />
Met Disability Subgroup "n"<br />
for Reporting Purposes (Y/N)<br />
State Target for % of Districts Meeting<br />
AYP for Disability Subgroup<br />
State<br />
Target<br />
3.06% 4.20%<br />
LEA<br />
Rate<br />
2.70%<br />
% of Districts Meeting AYP<br />
for Disability Subgroup<br />
Target Met by<br />
LEA (Y/N)<br />
Y<br />
Target Met by<br />
LEA(Y/N)<br />
Overall Y 17.15% 6.25%<br />
N<br />
Y<br />
Y<br />
Note: For a district to qualify as having a disability subgroup it must have a minimum of 40 (n=40) students with disabilities in a school building.<br />
B) Participation<br />
Participation Rate: # of<br />
CWD Tested ÷ # of CWD<br />
Enrolled in grades tested.<br />
Participation Rate: Literacy<br />
Participation Rate: Math<br />
Note: - - denotes not applicable<br />
State<br />
Rate<br />
98.78%<br />
State<br />
Target<br />
95.00%<br />
LEA<br />
Rate<br />
97.48%<br />
Target Met<br />
by LEA (Y/N)<br />
98.61% 95.00% 96.07% Y<br />
Y<br />
C) Performance Proficiency<br />
Percent of CWD Scoring<br />
Proficient or Above<br />
Proficiency Rate: Literacy<br />
Proficiency Rate:<br />
Mathematics<br />
16.00%<br />
16.00%<br />
State<br />
Rate<br />
31.49%<br />
44.86%<br />
State<br />
Target<br />
45.22%<br />
51.14%<br />
LEA<br />
Rate<br />
25.06%<br />
33.65%<br />
N<br />
N<br />
Target<br />
Met by<br />
LEA (Y/N)<br />
N<br />
N<br />
Page 1 of 5
LEA: 6001 - LITTLE ROCK SCHOOL <strong>DISTRICT</strong><br />
Indicator 04: Out-of-School Suspensions and Expulsions (2009/10 school year)<br />
A) Suspension/Expulsion<br />
Percent difference of CWD with out-of- school suspensions and<br />
expulsions totaling greater than 10 days in a school year as<br />
compared to the same data for general education students in<br />
the district.<br />
B) Suspension/Expulsion by Race and Ethnicity<br />
Percent of districts that have: (a) a significant discrepancy, by race or<br />
ethnicity, in the rate of suspensions and expulsions of greater than 10<br />
days in a school year for children with IEPs; and (b) policies,<br />
procedures or practices that contribute to the significant discrepancy<br />
and do not comply with requirements relating to the development<br />
and implementation of IEPs, the use of positive behavioral<br />
interventions and supports, and procedural safeguards.<br />
Indicator 05: School Age (5-21) Least Restrictive Environment<br />
A) In the Regular Class 80% or more of the day<br />
Percent of CWD with<br />
IEPs receiving instruction<br />
in the regular class 80%<br />
or more of the day.<br />
State<br />
Rate<br />
State<br />
Target<br />
LEA<br />
Rate<br />
B) In the Regular Class less than 40% of the day<br />
Percent of CWD with<br />
IEPs receiving instruction<br />
in the regular class less<br />
than 60% of the day.<br />
53.87% 59.77%<br />
State<br />
Rate<br />
State<br />
Target<br />
12.42% 12.51%<br />
50.44%<br />
LEA<br />
Rate<br />
15.67%<br />
C) Other Settings outside the regular class<br />
Percent of CWD with IEPs served in<br />
public or private separate schools,<br />
residential placements, or<br />
homebound/hospital placements.<br />
State<br />
Rate<br />
State<br />
Target<br />
2.80% 2.56%<br />
Target Met<br />
by LEA (Y/N)<br />
N<br />
Target Met<br />
by LEA (Y/N)<br />
N<br />
LEA<br />
Rate<br />
6.35%<br />
Target Met<br />
by LEA(Y/N)<br />
Indicator 06: Early Childhood (3-5) Least Restrictive Environment<br />
A) Regular Early Childhood Program<br />
Percent of children (aged 3 through 5) with IEPs attending a regular<br />
early childhood program and receiving the majority of special<br />
education and related services in the regular early childhood program<br />
Allowable<br />
Difference<br />
LEA: 6001 - LITTLE ROCK SCHOOL <strong>DISTRICT</strong><br />
Indicator 07: Preschool (3-5) Outcomes<br />
a) Percent of preschool CWD<br />
children who did not<br />
improve functioning.<br />
b) Percent of preschool CWD<br />
who improved but whose<br />
functioning remained below<br />
same age peers.<br />
c) Percent of preschool CWD<br />
who improved at a level<br />
nearer to same aged peers.<br />
d) Percent of preschool CWD<br />
who improved functioning to<br />
reach a level comparable to<br />
same age peers.<br />
e) Percent of preschool CWD<br />
children who maintain<br />
functioning at a level<br />
comparable to same aged<br />
peers.<br />
Summary<br />
Statements<br />
1) Of those preschool<br />
children who entered<br />
the preschool program<br />
below age expectations<br />
in each Outcome, the<br />
percent who<br />
substantially increased<br />
their rate of growth by<br />
the time they turned 6<br />
years of age or exited<br />
the program.<br />
2) The percent of<br />
preschool children who<br />
were functioning<br />
within age expectations<br />
in each Outcome by the<br />
time they turned 6<br />
years of age or exited<br />
A) Positive Social -Emotional<br />
Skills*<br />
State<br />
Rate<br />
A) Positive Social -<br />
Emotional Skills<br />
(Including social<br />
relationships)<br />
State<br />
Rate<br />
2.14%<br />
5.31%<br />
25.97%<br />
38.22%<br />
28.36%<br />
State<br />
Target<br />
LEA<br />
Rate<br />
LEA<br />
Rate<br />
— —<br />
— —<br />
— —<br />
— —<br />
— —<br />
Target<br />
Met by<br />
LEA(Y/N)<br />
B) Acquisition and Use of<br />
Knowledge and Skills<br />
(Including early language/<br />
communication and early literacy)<br />
B) Acquisition and Use of<br />
Knowledge and Skills **<br />
State<br />
Rate<br />
1.75%<br />
6.59%<br />
34.23%<br />
43.51%<br />
13.92%<br />
State<br />
Target<br />
LEA<br />
Rate<br />
Target<br />
Met by<br />
LEA(Y/N)<br />
C) Use of Appropriate Behaviors<br />
to Meet Their Needs<br />
State<br />
Rate<br />
State<br />
Target<br />
LEA<br />
Rate<br />
Target<br />
Met by<br />
LEA(Y/N)<br />
89.61% 90.50% — — N/A 90.31% 90.50% — — N/A 90.82% 92.50% — — N/A<br />
66.58% 69.50% — — N/A 57.43% 60.50% — — N/A 76.69% 78.50% — — N/A<br />
NOTE: * Including social relationships ** Including early language/ communication and early literacy<br />
Note: - - denotes not applicable<br />
State<br />
Rate<br />
LEA<br />
Rate<br />
— —<br />
— —<br />
— —<br />
— —<br />
— —<br />
C) Use of<br />
Appropriate<br />
Behaviors to<br />
Meet Their Needs<br />
State<br />
Rate<br />
4.51%<br />
17.34%<br />
41.72%<br />
34.97%<br />
LEA<br />
Rate<br />
1.46% — —<br />
— —<br />
— —<br />
— —<br />
— —<br />
Page 3 of 5
LEA: 6001 - LITTLE ROCK SCHOOL <strong>DISTRICT</strong><br />
Indicator 08: Parent Involvement<br />
Percent of surveyed<br />
parents who reported<br />
school facilitated parent<br />
involvement as a means<br />
of improving services<br />
and results for children<br />
with disabilities.<br />
Early Childhood<br />
(3-5)<br />
School Age<br />
(5-21)<br />
State<br />
Rate<br />
90.47%<br />
95.05%<br />
Indicator 09: Disproportionality - Eligibility<br />
Disproportionate representation of racial<br />
and ethnic groups in special education and<br />
related services that is a result of<br />
inappropriate identification (e.g.<br />
monitoring data, review of policies,<br />
practices, and procedures under 618(d),<br />
etc.).<br />
State<br />
Rate<br />
State<br />
Target<br />
88.00%<br />
96.00%<br />
State<br />
Target<br />
0.00% 0.00%<br />
LEA<br />
Rate<br />
— —<br />
— —<br />
Indicator 10: Disproportionality-Child with a Disability<br />
Disproportionate representation of racial<br />
and ethnic groups in specific disability<br />
categories that is a result of inappropriate<br />
identification (e.g. monitoring data, review<br />
of policies, practices, and procedures under<br />
618(d), etc.).<br />
Indicator 11: Child Find<br />
Percent of children with<br />
parental consent to evaluate<br />
who are evaluated within<br />
the State established timeline<br />
of 60 days.<br />
Overall<br />
(3-21)<br />
Early Childhood<br />
(3-5)<br />
School Age<br />
(5-21)<br />
State<br />
Rate<br />
0.00%<br />
Indicator 12: Early Childhood Transition<br />
Percent of children referred by Part C prior to<br />
age 3, who are found eligible for Part B, and<br />
who have an IEP developed and implemented<br />
by their third birthday.<br />
Note: - - denotes not applicable<br />
State<br />
Rate<br />
99.41%<br />
99.70%<br />
98.97%<br />
State<br />
Rate<br />
State<br />
Target<br />
0.00%<br />
State<br />
Target<br />
100.00%<br />
100.00%<br />
100.00%<br />
State<br />
Target<br />
Target Met by<br />
LEA (Y/N)<br />
Y<br />
Target Met by<br />
LEA (Y/N)<br />
Y<br />
LEA<br />
Rate<br />
91.54%<br />
— —<br />
91.54%<br />
LEA<br />
Rate<br />
Target Met by<br />
LEA (Y/N)<br />
N/A<br />
N<br />
Note: The target for Indicator 09 is to have zero percent<br />
(0%) of districts identified as having disproportionate<br />
representation as a result of inappropriate<br />
identification in eligibility.<br />
Note: The target for Indicator 10 is to have zero<br />
percent (0%) of districts identified as having<br />
disproportionate representation as a result of<br />
inappropriate identification in a disability<br />
category.<br />
Target Met by<br />
LEA (Y/N)<br />
N/A<br />
N<br />
Target Met<br />
by LEA<br />
(Y/N)<br />
99.21% 100.00% - - N/A<br />
N<br />
Note: * Indicates a zero reponse rate for the<br />
district.<br />
Page 4 of 5
LEA: 6001 - LITTLE ROCK SCHOOL <strong>DISTRICT</strong><br />
Indicator 13: Secondary Transition<br />
Percent of youth with disabilities aged 16 and<br />
up with an IEP that includes coordinated,<br />
measurable, annual IEP goals and transition<br />
services that will reasonably enable the student<br />
to meet the post-secondary goals.<br />
Indicator 14: Post-School Outcomes<br />
A. Percent of youth enrolled in higher<br />
education within one year of leaving high<br />
school.<br />
State<br />
Rate<br />
State<br />
Target<br />
Note: Data for this Indicator is from the on-site monitoring of LEAs for the given year.<br />
B. Percent of youth enrolled in higher<br />
education or competitively employed<br />
within one year of leaving high school.<br />
C. Percent of youth enrolled in higher<br />
education or in some other postsecondary<br />
education or training program; or<br />
competitively employed or in some other<br />
employment within one year of leaving<br />
high school.<br />
State<br />
Rate<br />
Indicator 20: Reported Data-Timely and Accurate*<br />
District submitted<br />
required data elements<br />
on or before due dates;<br />
made revisions within<br />
the alloted reveiw<br />
periods.<br />
Accurate and Timely<br />
Data Submission<br />
Overall (3-21)<br />
Early Childhood (3-5)<br />
School Age (5-21)<br />
State<br />
Target<br />
100.00%<br />
100.00%<br />
100.00%<br />
State<br />
Target<br />
LEA<br />
Rate<br />
LEA<br />
Rate<br />
Target Met by<br />
LEA (Y/N)<br />
Target Met<br />
by LEA<br />
(Y/N)<br />
Target Met<br />
by LEA<br />
(Y/N)<br />
*Data reviewed for timely and accurate submissions included all APSCN cycle data except for personnel<br />
Note: - - denotes not applicable<br />
96.19 100.00 — — N/A<br />
14.53<br />
State<br />
Rate<br />
49.42<br />
State<br />
Rate<br />
54.07<br />
13.00<br />
State<br />
Target<br />
49.00<br />
State<br />
Target<br />
60.00<br />
Y<br />
N/A<br />
Y<br />
— —<br />
LEA<br />
Rate<br />
— —<br />
LEA<br />
Rate<br />
— —<br />
N/A<br />
Target Met<br />
by LEA<br />
(Y/N)<br />
N/A<br />
Target Met<br />
by LEA<br />
(Y/N)<br />
N/A<br />
Page 5 of 5
<strong>ARKANSAS</strong> <strong>SPECIAL</strong> <strong>EDUCATION</strong><br />
<strong>DISTRICT</strong> <strong>ANNUAL</strong> PERFORMANCE REPORT<br />
2010/11 School Year<br />
Publication Date: March 2012<br />
Each State must have in place a State Performance Plan (SPP) to evaluate the State's efforts to meet the requirements and<br />
purposes of the implementation of the Individuals with Disabilities Education Act (IDEA). The SPP is a six-year plan, which<br />
describes Arkansas's performance on 20 indicators. The Office of Special Education Programs in the U. S. Department of<br />
Education requires that States report annually to the public on the performance of each local education agency (LEA) on 14 of<br />
20 indicators as compared with targets established by the State in the SPP. Arkansas will report indicators 1 through 14 and<br />
20 for each LEA serving children with disabilities (CWD). Any LEA not meeting targets on compliance indicators (0% for<br />
Indicators 4B, 09 & 10 and 100% for Indicators 11, 12, 13, and 20) are non-compliant with IDEA.<br />
There are no report changes for the 2010/11 school year profile; However, it is important to recognize that: .<br />
1. Indicator 01 (Graduation) is reported a year in arrear (2009/10 graduates) and is based on a four-year cohort. This<br />
means the rate is a measure of students who entered in ninth grade and graduate in four years. The calculation is a<br />
requirement under Title I of the Elementary and Secondary Education Act (ESEA).<br />
2. Indicator 02 (Drop out) is reported a year in arrear. This means the rate is a measure of students who dropped out in<br />
the 2009/10 school year. The Indicator 02 data are aligned with the Common Core of Data (CCD) requirements for<br />
grades 7-12.<br />
3. Indicator 04A and 4B (Suspension/Expulsion) is reported a year in arrear. This means the rate is a measure of<br />
students who had out-of-school suspensions and/or expulsions totaling more than 10 days.<br />
For a complete description of all the Indicators, please visit the special education website at<br />
http://arksped.k12.ar.us/sections/policy.html<br />
LEA: 6002 - N. LITTLE ROCK SCHOOL <strong>DISTRICT</strong><br />
Indicator 01: Graduation Rates (2009/10 school year) Indicator 02: Dropout Rates (2009/10 school year)<br />
Percent of youth<br />
with IEPs<br />
graduating from<br />
high school with a<br />
regular diploma<br />
State<br />
Rate<br />
State<br />
Target<br />
75.76% 85.00%<br />
LEA<br />
Rate<br />
71.43%<br />
Target Met<br />
by LEA<br />
(Y/N)<br />
N<br />
Percent of<br />
youth with<br />
IEPs dropping<br />
out of high<br />
school<br />
State<br />
Rate<br />
Indicator 03: Assessment on Statewide Benchmark Exam (grades 3-8, 11)<br />
A) Adequate Yearly Progress<br />
n=40<br />
Literacy<br />
Mathematics<br />
Met Disability Subgroup "n"<br />
for Reporting Purposes (Y/N)<br />
State Target for % of Districts Meeting<br />
AYP for Disability Subgroup<br />
State<br />
Target<br />
3.06% 4.20%<br />
LEA<br />
Rate<br />
7.37%<br />
% of Districts Meeting AYP<br />
for Disability Subgroup<br />
Target Met by<br />
LEA (Y/N)<br />
N<br />
Target Met by<br />
LEA(Y/N)<br />
Overall N 17.15% 6.25%<br />
NA<br />
N<br />
N<br />
Note: For a district to qualify as having a disability subgroup it must have a minimum of 40 (n=40) students with disabilities in a school building.<br />
B) Participation<br />
Participation Rate: # of<br />
CWD Tested ÷ # of CWD<br />
Enrolled in grades tested.<br />
Participation Rate: Literacy<br />
Participation Rate: Math<br />
Note: - - denotes not applicable<br />
State<br />
Rate<br />
98.78%<br />
State<br />
Target<br />
95.00%<br />
LEA<br />
Rate<br />
99.51%<br />
Target Met<br />
by LEA (Y/N)<br />
98.61% 95.00% 98.27% Y<br />
Y<br />
C) Performance Proficiency<br />
Percent of CWD Scoring<br />
Proficient or Above<br />
Proficiency Rate: Literacy<br />
Proficiency Rate:<br />
Mathematics<br />
16.00%<br />
16.00%<br />
State<br />
Rate<br />
31.49%<br />
44.86%<br />
State<br />
Target<br />
45.22%<br />
51.14%<br />
LEA<br />
Rate<br />
20.89%<br />
23.78%<br />
NA<br />
NA<br />
Target<br />
Met by<br />
LEA (Y/N)<br />
N<br />
N<br />
Page 1 of 5
LEA: 6002 - N. LITTLE ROCK SCHOOL <strong>DISTRICT</strong><br />
Indicator 04: Out-of-School Suspensions and Expulsions (2009/10 school year)<br />
A) Suspension/Expulsion<br />
Percent difference of CWD with out-of- school suspensions and<br />
expulsions totaling greater than 10 days in a school year as<br />
compared to the same data for general education students in<br />
the district.<br />
B) Suspension/Expulsion by Race and Ethnicity<br />
Percent of districts that have: (a) a significant discrepancy, by race or<br />
ethnicity, in the rate of suspensions and expulsions of greater than 10<br />
days in a school year for children with IEPs; and (b) policies,<br />
procedures or practices that contribute to the significant discrepancy<br />
and do not comply with requirements relating to the development<br />
and implementation of IEPs, the use of positive behavioral<br />
interventions and supports, and procedural safeguards.<br />
Indicator 05: School Age (5-21) Least Restrictive Environment<br />
A) In the Regular Class 80% or more of the day<br />
Percent of CWD with<br />
IEPs receiving instruction<br />
in the regular class 80%<br />
or more of the day.<br />
State<br />
Rate<br />
State<br />
Target<br />
LEA<br />
Rate<br />
B) In the Regular Class less than 40% of the day<br />
Percent of CWD with<br />
IEPs receiving instruction<br />
in the regular class less<br />
than 60% of the day.<br />
53.87% 59.77%<br />
State<br />
Rate<br />
State<br />
Target<br />
12.42% 12.51%<br />
59.10%<br />
LEA<br />
Rate<br />
16.55%<br />
C) Other Settings outside the regular class<br />
Percent of CWD with IEPs served in<br />
public or private separate schools,<br />
residential placements, or<br />
homebound/hospital placements.<br />
State<br />
Rate<br />
State<br />
Target<br />
2.80% 2.56%<br />
Target Met<br />
by LEA (Y/N)<br />
N<br />
Target Met<br />
by LEA (Y/N)<br />
N<br />
LEA<br />
Rate<br />
5.91%<br />
Target Met<br />
by LEA(Y/N)<br />
Indicator 06: Early Childhood (3-5) Least Restrictive Environment<br />
A) Regular Early Childhood Program<br />
Percent of children (aged 3 through 5) with IEPs attending a regular<br />
early childhood program and receiving the majority of special<br />
education and related services in the regular early childhood program<br />
Allowable<br />
Difference<br />
LEA: 6002 - N. LITTLE ROCK SCHOOL <strong>DISTRICT</strong><br />
Indicator 07: Preschool (3-5) Outcomes<br />
a) Percent of preschool CWD<br />
children who did not<br />
improve functioning.<br />
b) Percent of preschool CWD<br />
who improved but whose<br />
functioning remained below<br />
same age peers.<br />
c) Percent of preschool CWD<br />
who improved at a level<br />
nearer to same aged peers.<br />
d) Percent of preschool CWD<br />
who improved functioning to<br />
reach a level comparable to<br />
same age peers.<br />
e) Percent of preschool CWD<br />
children who maintain<br />
functioning at a level<br />
comparable to same aged<br />
peers.<br />
Summary<br />
Statements<br />
1) Of those preschool<br />
children who entered<br />
the preschool program<br />
below age expectations<br />
in each Outcome, the<br />
percent who<br />
substantially increased<br />
their rate of growth by<br />
the time they turned 6<br />
years of age or exited<br />
the program.<br />
2) The percent of<br />
preschool children who<br />
were functioning<br />
within age expectations<br />
in each Outcome by the<br />
time they turned 6<br />
years of age or exited<br />
A) Positive Social -Emotional<br />
Skills*<br />
State<br />
Rate<br />
A) Positive Social -<br />
Emotional Skills<br />
(Including social<br />
relationships)<br />
State<br />
Rate<br />
2.14%<br />
5.31%<br />
25.97%<br />
38.22%<br />
28.36%<br />
State<br />
Target<br />
LEA<br />
Rate<br />
LEA<br />
Rate<br />
— —<br />
— —<br />
— —<br />
— —<br />
— —<br />
Target<br />
Met by<br />
LEA(Y/N)<br />
B) Acquisition and Use of<br />
Knowledge and Skills<br />
(Including early language/<br />
communication and early literacy)<br />
B) Acquisition and Use of<br />
Knowledge and Skills **<br />
State<br />
Rate<br />
1.75%<br />
6.59%<br />
34.23%<br />
43.51%<br />
13.92%<br />
State<br />
Target<br />
LEA<br />
Rate<br />
Target<br />
Met by<br />
LEA(Y/N)<br />
C) Use of Appropriate Behaviors<br />
to Meet Their Needs<br />
State<br />
Rate<br />
State<br />
Target<br />
LEA<br />
Rate<br />
Target<br />
Met by<br />
LEA(Y/N)<br />
89.61% 90.50% — — N/A 90.31% 90.50% — — N/A 90.82% 92.50% — — N/A<br />
66.58% 69.50% — — N/A 57.43% 60.50% — — N/A 76.69% 78.50% — — N/A<br />
NOTE: * Including social relationships ** Including early language/ communication and early literacy<br />
Note: - - denotes not applicable<br />
State<br />
Rate<br />
LEA<br />
Rate<br />
— —<br />
— —<br />
— —<br />
— —<br />
— —<br />
C) Use of<br />
Appropriate<br />
Behaviors to<br />
Meet Their Needs<br />
State<br />
Rate<br />
4.51%<br />
17.34%<br />
41.72%<br />
34.97%<br />
LEA<br />
Rate<br />
1.46% — —<br />
— —<br />
— —<br />
— —<br />
— —<br />
Page 3 of 5
LEA: 6002 - N. LITTLE ROCK SCHOOL <strong>DISTRICT</strong><br />
Indicator 08: Parent Involvement<br />
Percent of surveyed<br />
parents who reported<br />
school facilitated parent<br />
involvement as a means<br />
of improving services<br />
and results for children<br />
with disabilities.<br />
Early Childhood<br />
(3-5)<br />
School Age<br />
(5-21)<br />
State<br />
Rate<br />
90.47%<br />
95.05%<br />
Indicator 09: Disproportionality - Eligibility<br />
Disproportionate representation of racial<br />
and ethnic groups in special education and<br />
related services that is a result of<br />
inappropriate identification (e.g.<br />
monitoring data, review of policies,<br />
practices, and procedures under 618(d),<br />
etc.).<br />
State<br />
Rate<br />
State<br />
Target<br />
88.00%<br />
96.00%<br />
State<br />
Target<br />
0.00% 0.00%<br />
LEA<br />
Rate<br />
— —<br />
86.67%<br />
Indicator 10: Disproportionality-Child with a Disability<br />
Disproportionate representation of racial<br />
and ethnic groups in specific disability<br />
categories that is a result of inappropriate<br />
identification (e.g. monitoring data, review<br />
of policies, practices, and procedures under<br />
618(d), etc.).<br />
Indicator 11: Child Find<br />
Percent of children with<br />
parental consent to evaluate<br />
who are evaluated within<br />
the State established timeline<br />
of 60 days.<br />
Overall<br />
(3-21)<br />
Early Childhood<br />
(3-5)<br />
School Age<br />
(5-21)<br />
State<br />
Rate<br />
0.00%<br />
Indicator 12: Early Childhood Transition<br />
Percent of children referred by Part C prior to<br />
age 3, who are found eligible for Part B, and<br />
who have an IEP developed and implemented<br />
by their third birthday.<br />
Note: - - denotes not applicable<br />
State<br />
Rate<br />
99.41%<br />
99.70%<br />
98.97%<br />
State<br />
Rate<br />
State<br />
Target<br />
0.00%<br />
State<br />
Target<br />
100.00%<br />
100.00%<br />
100.00%<br />
State<br />
Target<br />
Target Met by<br />
LEA (Y/N)<br />
Y<br />
Target Met by<br />
LEA (Y/N)<br />
Y<br />
LEA<br />
Rate<br />
100.00%<br />
100.00%<br />
100.00%<br />
LEA<br />
Rate<br />
Target Met by<br />
LEA (Y/N)<br />
N/A<br />
N<br />
Note: The target for Indicator 09 is to have zero percent<br />
(0%) of districts identified as having disproportionate<br />
representation as a result of inappropriate<br />
identification in eligibility.<br />
Note: The target for Indicator 10 is to have zero<br />
percent (0%) of districts identified as having<br />
disproportionate representation as a result of<br />
inappropriate identification in a disability<br />
category.<br />
Target Met by<br />
LEA (Y/N)<br />
Y<br />
Y<br />
Target Met<br />
by LEA<br />
(Y/N)<br />
99.21% 100.00% - - N/A<br />
Y<br />
Note: * Indicates a zero reponse rate for the<br />
district.<br />
Page 4 of 5
LEA: 6002 - N. LITTLE ROCK SCHOOL <strong>DISTRICT</strong><br />
Indicator 13: Secondary Transition<br />
Percent of youth with disabilities aged 16 and<br />
up with an IEP that includes coordinated,<br />
measurable, annual IEP goals and transition<br />
services that will reasonably enable the student<br />
to meet the post-secondary goals.<br />
Indicator 14: Post-School Outcomes<br />
A. Percent of youth enrolled in higher<br />
education within one year of leaving high<br />
school.<br />
State<br />
Rate<br />
State<br />
Target<br />
Note: Data for this Indicator is from the on-site monitoring of LEAs for the given year.<br />
B. Percent of youth enrolled in higher<br />
education or competitively employed<br />
within one year of leaving high school.<br />
C. Percent of youth enrolled in higher<br />
education or in some other postsecondary<br />
education or training program; or<br />
competitively employed or in some other<br />
employment within one year of leaving<br />
high school.<br />
State<br />
Rate<br />
Indicator 20: Reported Data-Timely and Accurate*<br />
District submitted<br />
required data elements<br />
on or before due dates;<br />
made revisions within<br />
the alloted reveiw<br />
periods.<br />
Accurate and Timely<br />
Data Submission<br />
Overall (3-21)<br />
Early Childhood (3-5)<br />
School Age (5-21)<br />
State<br />
Target<br />
100.00%<br />
100.00%<br />
100.00%<br />
State<br />
Target<br />
LEA<br />
Rate<br />
LEA<br />
Rate<br />
Target Met by<br />
LEA (Y/N)<br />
Target Met<br />
by LEA<br />
(Y/N)<br />
Target Met<br />
by LEA<br />
(Y/N)<br />
*Data reviewed for timely and accurate submissions included all APSCN cycle data except for personnel<br />
Note: - - denotes not applicable<br />
96.19 100.00 100.00% Y<br />
14.53<br />
State<br />
Rate<br />
49.42<br />
State<br />
Rate<br />
54.07<br />
13.00<br />
State<br />
Target<br />
49.00<br />
State<br />
Target<br />
60.00<br />
Y<br />
Y<br />
Y<br />
— —<br />
LEA<br />
Rate<br />
— —<br />
LEA<br />
Rate<br />
— —<br />
N/A<br />
Target Met<br />
by LEA<br />
(Y/N)<br />
N/A<br />
Target Met<br />
by LEA<br />
(Y/N)<br />
N/A<br />
Page 5 of 5
<strong>ARKANSAS</strong> <strong>SPECIAL</strong> <strong>EDUCATION</strong><br />
<strong>DISTRICT</strong> <strong>ANNUAL</strong> PERFORMANCE REPORT<br />
2010/11 School Year<br />
Publication Date: March 2012<br />
Each State must have in place a State Performance Plan (SPP) to evaluate the State's efforts to meet the requirements and<br />
purposes of the implementation of the Individuals with Disabilities Education Act (IDEA). The SPP is a six-year plan, which<br />
describes Arkansas's performance on 20 indicators. The Office of Special Education Programs in the U. S. Department of<br />
Education requires that States report annually to the public on the performance of each local education agency (LEA) on 14 of<br />
20 indicators as compared with targets established by the State in the SPP. Arkansas will report indicators 1 through 14 and<br />
20 for each LEA serving children with disabilities (CWD). Any LEA not meeting targets on compliance indicators (0% for<br />
Indicators 4B, 09 & 10 and 100% for Indicators 11, 12, 13, and 20) are non-compliant with IDEA.<br />
There are no report changes for the 2010/11 school year profile; However, it is important to recognize that: .<br />
1. Indicator 01 (Graduation) is reported a year in arrear (2009/10 graduates) and is based on a four-year cohort. This<br />
means the rate is a measure of students who entered in ninth grade and graduate in four years. The calculation is a<br />
requirement under Title I of the Elementary and Secondary Education Act (ESEA).<br />
2. Indicator 02 (Drop out) is reported a year in arrear. This means the rate is a measure of students who dropped out in<br />
the 2009/10 school year. The Indicator 02 data are aligned with the Common Core of Data (CCD) requirements for<br />
grades 7-12.<br />
3. Indicator 04A and 4B (Suspension/Expulsion) is reported a year in arrear. This means the rate is a measure of<br />
students who had out-of-school suspensions and/or expulsions totaling more than 10 days.<br />
For a complete description of all the Indicators, please visit the special education website at<br />
http://arksped.k12.ar.us/sections/policy.html<br />
LEA: 6003 - PULASKI CO. SPEC. SCHOOL <strong>DISTRICT</strong><br />
Indicator 01: Graduation Rates (2009/10 school year) Indicator 02: Dropout Rates (2009/10 school year)<br />
Percent of youth<br />
with IEPs<br />
graduating from<br />
high school with a<br />
regular diploma<br />
State<br />
Rate<br />
State<br />
Target<br />
75.76% 85.00%<br />
LEA<br />
Rate<br />
61.59%<br />
Target Met<br />
by LEA<br />
(Y/N)<br />
N<br />
Percent of<br />
youth with<br />
IEPs dropping<br />
out of high<br />
school<br />
State<br />
Rate<br />
Indicator 03: Assessment on Statewide Benchmark Exam (grades 3-8, 11)<br />
A) Adequate Yearly Progress<br />
n=40<br />
Literacy<br />
Mathematics<br />
Met Disability Subgroup "n"<br />
for Reporting Purposes (Y/N)<br />
State Target for % of Districts Meeting<br />
AYP for Disability Subgroup<br />
State<br />
Target<br />
3.06% 4.20%<br />
LEA<br />
Rate<br />
2.00%<br />
% of Districts Meeting AYP<br />
for Disability Subgroup<br />
Target Met by<br />
LEA (Y/N)<br />
Y<br />
Target Met by<br />
LEA(Y/N)<br />
Overall Y 17.15% 6.25%<br />
N<br />
Y<br />
Y<br />
Note: For a district to qualify as having a disability subgroup it must have a minimum of 40 (n=40) students with disabilities in a school building.<br />
B) Participation<br />
Participation Rate: # of<br />
CWD Tested ÷ # of CWD<br />
Enrolled in grades tested.<br />
Participation Rate: Literacy<br />
Participation Rate: Math<br />
Note: - - denotes not applicable<br />
State<br />
Rate<br />
98.78%<br />
State<br />
Target<br />
95.00%<br />
LEA<br />
Rate<br />
98.08%<br />
Target Met<br />
by LEA (Y/N)<br />
98.61% 95.00% 98.48% Y<br />
Y<br />
C) Performance Proficiency<br />
Percent of CWD Scoring<br />
Proficient or Above<br />
Proficiency Rate: Literacy<br />
Proficiency Rate:<br />
Mathematics<br />
16.00%<br />
16.00%<br />
State<br />
Rate<br />
31.49%<br />
44.86%<br />
State<br />
Target<br />
45.22%<br />
51.14%<br />
LEA<br />
Rate<br />
26.08%<br />
35.10%<br />
N<br />
N<br />
Target<br />
Met by<br />
LEA (Y/N)<br />
N<br />
N<br />
Page 1 of 5
LEA: 6003 - PULASKI CO. SPEC. SCHOOL <strong>DISTRICT</strong><br />
Indicator 04: Out-of-School Suspensions and Expulsions (2009/10 school year)<br />
A) Suspension/Expulsion<br />
Percent difference of CWD with out-of- school suspensions and<br />
expulsions totaling greater than 10 days in a school year as<br />
compared to the same data for general education students in<br />
the district.<br />
B) Suspension/Expulsion by Race and Ethnicity<br />
Percent of districts that have: (a) a significant discrepancy, by race or<br />
ethnicity, in the rate of suspensions and expulsions of greater than 10<br />
days in a school year for children with IEPs; and (b) policies,<br />
procedures or practices that contribute to the significant discrepancy<br />
and do not comply with requirements relating to the development<br />
and implementation of IEPs, the use of positive behavioral<br />
interventions and supports, and procedural safeguards.<br />
Indicator 05: School Age (5-21) Least Restrictive Environment<br />
A) In the Regular Class 80% or more of the day<br />
Percent of CWD with<br />
IEPs receiving instruction<br />
in the regular class 80%<br />
or more of the day.<br />
State<br />
Rate<br />
State<br />
Target<br />
LEA<br />
Rate<br />
B) In the Regular Class less than 40% of the day<br />
Percent of CWD with<br />
IEPs receiving instruction<br />
in the regular class less<br />
than 60% of the day.<br />
53.87% 59.77%<br />
State<br />
Rate<br />
State<br />
Target<br />
12.42% 12.51%<br />
52.84%<br />
LEA<br />
Rate<br />
12.81%<br />
C) Other Settings outside the regular class<br />
Percent of CWD with IEPs served in<br />
public or private separate schools,<br />
residential placements, or<br />
homebound/hospital placements.<br />
State<br />
Rate<br />
State<br />
Target<br />
2.80% 2.56%<br />
Target Met<br />
by LEA (Y/N)<br />
N<br />
Target Met<br />
by LEA (Y/N)<br />
N<br />
LEA<br />
Rate<br />
5.89%<br />
Target Met<br />
by LEA(Y/N)<br />
Indicator 06: Early Childhood (3-5) Least Restrictive Environment<br />
A) Regular Early Childhood Program<br />
Percent of children (aged 3 through 5) with IEPs attending a regular<br />
early childhood program and receiving the majority of special<br />
education and related services in the regular early childhood program<br />
Allowable<br />
Difference<br />
LEA: 6003 - PULASKI CO. SPEC. SCHOOL <strong>DISTRICT</strong><br />
Indicator 07: Preschool (3-5) Outcomes<br />
a) Percent of preschool CWD<br />
children who did not<br />
improve functioning.<br />
b) Percent of preschool CWD<br />
who improved but whose<br />
functioning remained below<br />
same age peers.<br />
c) Percent of preschool CWD<br />
who improved at a level<br />
nearer to same aged peers.<br />
d) Percent of preschool CWD<br />
who improved functioning to<br />
reach a level comparable to<br />
same age peers.<br />
e) Percent of preschool CWD<br />
children who maintain<br />
functioning at a level<br />
comparable to same aged<br />
peers.<br />
Summary<br />
Statements<br />
1) Of those preschool<br />
children who entered<br />
the preschool program<br />
below age expectations<br />
in each Outcome, the<br />
percent who<br />
substantially increased<br />
their rate of growth by<br />
the time they turned 6<br />
years of age or exited<br />
the program.<br />
2) The percent of<br />
preschool children who<br />
were functioning<br />
within age expectations<br />
in each Outcome by the<br />
time they turned 6<br />
years of age or exited<br />
A) Positive Social -Emotional<br />
Skills*<br />
State<br />
Rate<br />
A) Positive Social -<br />
Emotional Skills<br />
(Including social<br />
relationships)<br />
State<br />
Rate<br />
2.14%<br />
5.31%<br />
25.97%<br />
38.22%<br />
28.36%<br />
State<br />
Target<br />
LEA<br />
Rate<br />
LEA<br />
Rate<br />
— —<br />
— —<br />
— —<br />
— —<br />
— —<br />
Target<br />
Met by<br />
LEA(Y/N)<br />
B) Acquisition and Use of<br />
Knowledge and Skills<br />
(Including early language/<br />
communication and early literacy)<br />
B) Acquisition and Use of<br />
Knowledge and Skills **<br />
State<br />
Rate<br />
1.75%<br />
6.59%<br />
34.23%<br />
43.51%<br />
13.92%<br />
State<br />
Target<br />
LEA<br />
Rate<br />
Target<br />
Met by<br />
LEA(Y/N)<br />
C) Use of Appropriate Behaviors<br />
to Meet Their Needs<br />
State<br />
Rate<br />
State<br />
Target<br />
LEA<br />
Rate<br />
Target<br />
Met by<br />
LEA(Y/N)<br />
89.61% 90.50% — — N/A 90.31% 90.50% — — N/A 90.82% 92.50% — — N/A<br />
66.58% 69.50% — — N/A 57.43% 60.50% — — N/A 76.69% 78.50% — — N/A<br />
NOTE: * Including social relationships ** Including early language/ communication and early literacy<br />
Note: - - denotes not applicable<br />
State<br />
Rate<br />
LEA<br />
Rate<br />
— —<br />
— —<br />
— —<br />
— —<br />
— —<br />
C) Use of<br />
Appropriate<br />
Behaviors to<br />
Meet Their Needs<br />
State<br />
Rate<br />
4.51%<br />
17.34%<br />
41.72%<br />
34.97%<br />
LEA<br />
Rate<br />
1.46% — —<br />
— —<br />
— —<br />
— —<br />
— —<br />
Page 3 of 5
LEA: 6003 - PULASKI CO. SPEC. SCHOOL <strong>DISTRICT</strong><br />
Indicator 08: Parent Involvement<br />
Percent of surveyed<br />
parents who reported<br />
school facilitated parent<br />
involvement as a means<br />
of improving services<br />
and results for children<br />
with disabilities.<br />
Early Childhood<br />
(3-5)<br />
School Age<br />
(5-21)<br />
State<br />
Rate<br />
90.47%<br />
95.05%<br />
Indicator 09: Disproportionality - Eligibility<br />
Disproportionate representation of racial<br />
and ethnic groups in special education and<br />
related services that is a result of<br />
inappropriate identification (e.g.<br />
monitoring data, review of policies,<br />
practices, and procedures under 618(d),<br />
etc.).<br />
State<br />
Rate<br />
State<br />
Target<br />
88.00%<br />
96.00%<br />
State<br />
Target<br />
0.00% 0.00%<br />
LEA<br />
Rate<br />
— —<br />
94.19%<br />
Indicator 10: Disproportionality-Child with a Disability<br />
Disproportionate representation of racial<br />
and ethnic groups in specific disability<br />
categories that is a result of inappropriate<br />
identification (e.g. monitoring data, review<br />
of policies, practices, and procedures under<br />
618(d), etc.).<br />
Indicator 11: Child Find<br />
Percent of children with<br />
parental consent to evaluate<br />
who are evaluated within<br />
the State established timeline<br />
of 60 days.<br />
Overall<br />
(3-21)<br />
Early Childhood<br />
(3-5)<br />
School Age<br />
(5-21)<br />
State<br />
Rate<br />
0.00%<br />
Indicator 12: Early Childhood Transition<br />
Percent of children referred by Part C prior to<br />
age 3, who are found eligible for Part B, and<br />
who have an IEP developed and implemented<br />
by their third birthday.<br />
Note: - - denotes not applicable<br />
State<br />
Rate<br />
99.41%<br />
99.70%<br />
98.97%<br />
State<br />
Rate<br />
State<br />
Target<br />
0.00%<br />
State<br />
Target<br />
100.00%<br />
100.00%<br />
100.00%<br />
State<br />
Target<br />
Target Met by<br />
LEA (Y/N)<br />
Y<br />
Target Met by<br />
LEA (Y/N)<br />
Y<br />
LEA<br />
Rate<br />
97.44%<br />
— —<br />
97.44%<br />
LEA<br />
Rate<br />
Target Met by<br />
LEA (Y/N)<br />
N/A<br />
N<br />
Note: The target for Indicator 09 is to have zero percent<br />
(0%) of districts identified as having disproportionate<br />
representation as a result of inappropriate<br />
identification in eligibility.<br />
Note: The target for Indicator 10 is to have zero<br />
percent (0%) of districts identified as having<br />
disproportionate representation as a result of<br />
inappropriate identification in a disability<br />
category.<br />
Target Met by<br />
LEA (Y/N)<br />
N/A<br />
N<br />
Target Met<br />
by LEA<br />
(Y/N)<br />
99.21% 100.00% - - N/A<br />
N<br />
Note: * Indicates a zero reponse rate for the<br />
district.<br />
Page 4 of 5
LEA: 6003 - PULASKI CO. SPEC. SCHOOL <strong>DISTRICT</strong><br />
Indicator 13: Secondary Transition<br />
Percent of youth with disabilities aged 16 and<br />
up with an IEP that includes coordinated,<br />
measurable, annual IEP goals and transition<br />
services that will reasonably enable the student<br />
to meet the post-secondary goals.<br />
Indicator 14: Post-School Outcomes<br />
A. Percent of youth enrolled in higher<br />
education within one year of leaving high<br />
school.<br />
State<br />
Rate<br />
State<br />
Target<br />
Note: Data for this Indicator is from the on-site monitoring of LEAs for the given year.<br />
B. Percent of youth enrolled in higher<br />
education or competitively employed<br />
within one year of leaving high school.<br />
C. Percent of youth enrolled in higher<br />
education or in some other postsecondary<br />
education or training program; or<br />
competitively employed or in some other<br />
employment within one year of leaving<br />
high school.<br />
State<br />
Rate<br />
Indicator 20: Reported Data-Timely and Accurate*<br />
District submitted<br />
required data elements<br />
on or before due dates;<br />
made revisions within<br />
the alloted reveiw<br />
periods.<br />
Accurate and Timely<br />
Data Submission<br />
Overall (3-21)<br />
Early Childhood (3-5)<br />
School Age (5-21)<br />
State<br />
Target<br />
100.00%<br />
100.00%<br />
100.00%<br />
State<br />
Target<br />
LEA<br />
Rate<br />
LEA<br />
Rate<br />
Target Met by<br />
LEA (Y/N)<br />
Target Met<br />
by LEA<br />
(Y/N)<br />
Target Met<br />
by LEA<br />
(Y/N)<br />
*Data reviewed for timely and accurate submissions included all APSCN cycle data except for personnel<br />
Note: - - denotes not applicable<br />
96.19 100.00 — — N/A<br />
14.53<br />
State<br />
Rate<br />
49.42<br />
State<br />
Rate<br />
54.07<br />
13.00<br />
State<br />
Target<br />
49.00<br />
State<br />
Target<br />
60.00<br />
Y<br />
N/A<br />
Y<br />
— —<br />
LEA<br />
Rate<br />
— —<br />
LEA<br />
Rate<br />
— —<br />
N/A<br />
Target Met<br />
by LEA<br />
(Y/N)<br />
N/A<br />
Target Met<br />
by LEA<br />
(Y/N)<br />
N/A<br />
Page 5 of 5
<strong>ARKANSAS</strong> <strong>SPECIAL</strong> <strong>EDUCATION</strong><br />
<strong>DISTRICT</strong> <strong>ANNUAL</strong> PERFORMANCE REPORT<br />
2010/11 School Year<br />
Publication Date: March 2012<br />
Each State must have in place a State Performance Plan (SPP) to evaluate the State's efforts to meet the requirements and<br />
purposes of the implementation of the Individuals with Disabilities Education Act (IDEA). The SPP is a six-year plan, which<br />
describes Arkansas's performance on 20 indicators. The Office of Special Education Programs in the U. S. Department of<br />
Education requires that States report annually to the public on the performance of each local education agency (LEA) on 14 of<br />
20 indicators as compared with targets established by the State in the SPP. Arkansas will report indicators 1 through 14 and<br />
20 for each LEA serving children with disabilities (CWD). Any LEA not meeting targets on compliance indicators (0% for<br />
Indicators 4B, 09 & 10 and 100% for Indicators 11, 12, 13, and 20) are non-compliant with IDEA.<br />
There are no report changes for the 2010/11 school year profile; However, it is important to recognize that: .<br />
1. Indicator 01 (Graduation) is reported a year in arrear (2009/10 graduates) and is based on a four-year cohort. This<br />
means the rate is a measure of students who entered in ninth grade and graduate in four years. The calculation is a<br />
requirement under Title I of the Elementary and Secondary Education Act (ESEA).<br />
2. Indicator 02 (Drop out) is reported a year in arrear. This means the rate is a measure of students who dropped out in<br />
the 2009/10 school year. The Indicator 02 data are aligned with the Common Core of Data (CCD) requirements for<br />
grades 7-12.<br />
3. Indicator 04A and 4B (Suspension/Expulsion) is reported a year in arrear. This means the rate is a measure of<br />
students who had out-of-school suspensions and/or expulsions totaling more than 10 days.<br />
For a complete description of all the Indicators, please visit the special education website at<br />
http://arksped.k12.ar.us/sections/policy.html<br />
LEA: 6040 - ACADEMICS PLUS CHARTER SCHOOL<br />
Indicator 01: Graduation Rates (2009/10 school year) Indicator 02: Dropout Rates (2009/10 school year)<br />
Percent of youth<br />
with IEPs<br />
graduating from<br />
high school with a<br />
regular diploma<br />
State<br />
Rate<br />
State<br />
Target<br />
75.76% 85.00%<br />
LEA<br />
Rate<br />
0.00%<br />
Target Met<br />
by LEA<br />
(Y/N)<br />
N<br />
Percent of<br />
youth with<br />
IEPs dropping<br />
out of high<br />
school<br />
State<br />
Rate<br />
Indicator 03: Assessment on Statewide Benchmark Exam (grades 3-8, 11)<br />
A) Adequate Yearly Progress<br />
n=40<br />
Literacy<br />
Mathematics<br />
Met Disability Subgroup "n"<br />
for Reporting Purposes (Y/N)<br />
State Target for % of Districts Meeting<br />
AYP for Disability Subgroup<br />
State<br />
Target<br />
3.06% 4.20%<br />
LEA<br />
Rate<br />
0.00%<br />
% of Districts Meeting AYP<br />
for Disability Subgroup<br />
Target Met by<br />
LEA (Y/N)<br />
Y<br />
Target Met by<br />
LEA(Y/N)<br />
Overall N 17.15% 6.25%<br />
NA<br />
N<br />
N<br />
Note: For a district to qualify as having a disability subgroup it must have a minimum of 40 (n=40) students with disabilities in a school building.<br />
B) Participation<br />
Participation Rate: # of<br />
CWD Tested ÷ # of CWD<br />
Enrolled in grades tested.<br />
Participation Rate: Literacy<br />
Participation Rate: Math<br />
Note: - - denotes not applicable<br />
State<br />
Rate<br />
98.78%<br />
State<br />
Target<br />
95.00%<br />
LEA<br />
Rate<br />
100.00%<br />
Target Met<br />
by LEA (Y/N)<br />
98.61% 95.00% 100.00% Y<br />
Y<br />
C) Performance Proficiency<br />
Percent of CWD Scoring<br />
Proficient or Above<br />
Proficiency Rate: Literacy<br />
Proficiency Rate:<br />
Mathematics<br />
16.00%<br />
16.00%<br />
State<br />
Rate<br />
31.49%<br />
44.86%<br />
State<br />
Target<br />
45.22%<br />
51.14%<br />
LEA<br />
Rate<br />
25.00%<br />
21.05%<br />
NA<br />
NA<br />
Target<br />
Met by<br />
LEA (Y/N)<br />
N<br />
N<br />
Page 1 of 5
LEA: 6040 - ACADEMICS PLUS CHARTER SCHOOL<br />
Indicator 04: Out-of-School Suspensions and Expulsions (2009/10 school year)<br />
A) Suspension/Expulsion<br />
Percent difference of CWD with out-of- school suspensions and<br />
expulsions totaling greater than 10 days in a school year as<br />
compared to the same data for general education students in<br />
the district.<br />
B) Suspension/Expulsion by Race and Ethnicity<br />
Percent of districts that have: (a) a significant discrepancy, by race or<br />
ethnicity, in the rate of suspensions and expulsions of greater than 10<br />
days in a school year for children with IEPs; and (b) policies,<br />
procedures or practices that contribute to the significant discrepancy<br />
and do not comply with requirements relating to the development<br />
and implementation of IEPs, the use of positive behavioral<br />
interventions and supports, and procedural safeguards.<br />
Indicator 05: School Age (5-21) Least Restrictive Environment<br />
A) In the Regular Class 80% or more of the day<br />
Percent of CWD with<br />
IEPs receiving instruction<br />
in the regular class 80%<br />
or more of the day.<br />
State<br />
Rate<br />
State<br />
Target<br />
LEA<br />
Rate<br />
B) In the Regular Class less than 40% of the day<br />
Percent of CWD with<br />
IEPs receiving instruction<br />
in the regular class less<br />
than 60% of the day.<br />
53.87% 59.77%<br />
State<br />
Rate<br />
State<br />
Target<br />
12.42% 12.51%<br />
100.00%<br />
LEA<br />
Rate<br />
0.00%<br />
C) Other Settings outside the regular class<br />
Percent of CWD with IEPs served in<br />
public or private separate schools,<br />
residential placements, or<br />
homebound/hospital placements.<br />
State<br />
Rate<br />
State<br />
Target<br />
2.80% 2.56%<br />
Target Met<br />
by LEA (Y/N)<br />
Y<br />
Target Met<br />
by LEA (Y/N)<br />
Y<br />
LEA<br />
Rate<br />
0.00%<br />
Target Met<br />
by LEA(Y/N)<br />
Indicator 06: Early Childhood (3-5) Least Restrictive Environment<br />
A) Regular Early Childhood Program<br />
Percent of children (aged 3 through 5) with IEPs attending a regular<br />
early childhood program and receiving the majority of special<br />
education and related services in the regular early childhood program<br />
Allowable<br />
Difference<br />
LEA: 6040 - ACADEMICS PLUS CHARTER SCHOOL<br />
Indicator 07: Preschool (3-5) Outcomes<br />
a) Percent of preschool CWD<br />
children who did not<br />
improve functioning.<br />
b) Percent of preschool CWD<br />
who improved but whose<br />
functioning remained below<br />
same age peers.<br />
c) Percent of preschool CWD<br />
who improved at a level<br />
nearer to same aged peers.<br />
d) Percent of preschool CWD<br />
who improved functioning to<br />
reach a level comparable to<br />
same age peers.<br />
e) Percent of preschool CWD<br />
children who maintain<br />
functioning at a level<br />
comparable to same aged<br />
peers.<br />
Summary<br />
Statements<br />
1) Of those preschool<br />
children who entered<br />
the preschool program<br />
below age expectations<br />
in each Outcome, the<br />
percent who<br />
substantially increased<br />
their rate of growth by<br />
the time they turned 6<br />
years of age or exited<br />
the program.<br />
2) The percent of<br />
preschool children who<br />
were functioning<br />
within age expectations<br />
in each Outcome by the<br />
time they turned 6<br />
years of age or exited<br />
A) Positive Social -Emotional<br />
Skills*<br />
State<br />
Rate<br />
A) Positive Social -<br />
Emotional Skills<br />
(Including social<br />
relationships)<br />
State<br />
Rate<br />
2.14%<br />
5.31%<br />
25.97%<br />
38.22%<br />
28.36%<br />
State<br />
Target<br />
LEA<br />
Rate<br />
LEA<br />
Rate<br />
— —<br />
— —<br />
— —<br />
— —<br />
— —<br />
Target<br />
Met by<br />
LEA(Y/N)<br />
B) Acquisition and Use of<br />
Knowledge and Skills<br />
(Including early language/<br />
communication and early literacy)<br />
B) Acquisition and Use of<br />
Knowledge and Skills **<br />
State<br />
Rate<br />
1.75%<br />
6.59%<br />
34.23%<br />
43.51%<br />
13.92%<br />
State<br />
Target<br />
LEA<br />
Rate<br />
Target<br />
Met by<br />
LEA(Y/N)<br />
C) Use of Appropriate Behaviors<br />
to Meet Their Needs<br />
State<br />
Rate<br />
State<br />
Target<br />
LEA<br />
Rate<br />
Target<br />
Met by<br />
LEA(Y/N)<br />
89.61% 90.50% — — N/A 90.31% 90.50% — — N/A 90.82% 92.50% — — N/A<br />
66.58% 69.50% — — N/A 57.43% 60.50% — — N/A 76.69% 78.50% — — N/A<br />
NOTE: * Including social relationships ** Including early language/ communication and early literacy<br />
Note: - - denotes not applicable<br />
State<br />
Rate<br />
LEA<br />
Rate<br />
— —<br />
— —<br />
— —<br />
— —<br />
— —<br />
C) Use of<br />
Appropriate<br />
Behaviors to<br />
Meet Their Needs<br />
State<br />
Rate<br />
4.51%<br />
17.34%<br />
41.72%<br />
34.97%<br />
LEA<br />
Rate<br />
1.46% — —<br />
— —<br />
— —<br />
— —<br />
— —<br />
Page 3 of 5
LEA: 6040 - ACADEMICS PLUS CHARTER SCHOOL<br />
Indicator 08: Parent Involvement<br />
Percent of surveyed<br />
parents who reported<br />
school facilitated parent<br />
involvement as a means<br />
of improving services<br />
and results for children<br />
with disabilities.<br />
Early Childhood<br />
(3-5)<br />
School Age<br />
(5-21)<br />
State<br />
Rate<br />
90.47%<br />
95.05%<br />
Indicator 09: Disproportionality - Eligibility<br />
Disproportionate representation of racial<br />
and ethnic groups in special education and<br />
related services that is a result of<br />
inappropriate identification (e.g.<br />
monitoring data, review of policies,<br />
practices, and procedures under 618(d),<br />
etc.).<br />
State<br />
Rate<br />
State<br />
Target<br />
88.00%<br />
96.00%<br />
State<br />
Target<br />
0.00% 0.00%<br />
LEA<br />
Rate<br />
— —<br />
— —<br />
Indicator 10: Disproportionality-Child with a Disability<br />
Disproportionate representation of racial<br />
and ethnic groups in specific disability<br />
categories that is a result of inappropriate<br />
identification (e.g. monitoring data, review<br />
of policies, practices, and procedures under<br />
618(d), etc.).<br />
Indicator 11: Child Find<br />
Percent of children with<br />
parental consent to evaluate<br />
who are evaluated within<br />
the State established timeline<br />
of 60 days.<br />
Overall<br />
(3-21)<br />
Early Childhood<br />
(3-5)<br />
School Age<br />
(5-21)<br />
State<br />
Rate<br />
0.00%<br />
Indicator 12: Early Childhood Transition<br />
Percent of children referred by Part C prior to<br />
age 3, who are found eligible for Part B, and<br />
who have an IEP developed and implemented<br />
by their third birthday.<br />
Note: - - denotes not applicable<br />
State<br />
Rate<br />
99.41%<br />
99.70%<br />
98.97%<br />
State<br />
Rate<br />
State<br />
Target<br />
0.00%<br />
State<br />
Target<br />
100.00%<br />
100.00%<br />
100.00%<br />
State<br />
Target<br />
Target Met by<br />
LEA (Y/N)<br />
Y<br />
Target Met by<br />
LEA (Y/N)<br />
Y<br />
LEA<br />
Rate<br />
100.00%<br />
— —<br />
100.00%<br />
LEA<br />
Rate<br />
Target Met by<br />
LEA (Y/N)<br />
N/A<br />
N<br />
Note: The target for Indicator 09 is to have zero percent<br />
(0%) of districts identified as having disproportionate<br />
representation as a result of inappropriate<br />
identification in eligibility.<br />
Note: The target for Indicator 10 is to have zero<br />
percent (0%) of districts identified as having<br />
disproportionate representation as a result of<br />
inappropriate identification in a disability<br />
category.<br />
Target Met by<br />
LEA (Y/N)<br />
N/A<br />
Y<br />
Target Met<br />
by LEA<br />
(Y/N)<br />
99.21% 100.00% - - N/A<br />
Y<br />
Note: * Indicates a zero reponse rate for the<br />
district.<br />
Page 4 of 5
LEA: 6040 - ACADEMICS PLUS CHARTER SCHOOL<br />
Indicator 13: Secondary Transition<br />
Percent of youth with disabilities aged 16 and<br />
up with an IEP that includes coordinated,<br />
measurable, annual IEP goals and transition<br />
services that will reasonably enable the student<br />
to meet the post-secondary goals.<br />
Indicator 14: Post-School Outcomes<br />
A. Percent of youth enrolled in higher<br />
education within one year of leaving high<br />
school.<br />
State<br />
Rate<br />
State<br />
Target<br />
Note: Data for this Indicator is from the on-site monitoring of LEAs for the given year.<br />
B. Percent of youth enrolled in higher<br />
education or competitively employed<br />
within one year of leaving high school.<br />
C. Percent of youth enrolled in higher<br />
education or in some other postsecondary<br />
education or training program; or<br />
competitively employed or in some other<br />
employment within one year of leaving<br />
high school.<br />
State<br />
Rate<br />
Indicator 20: Reported Data-Timely and Accurate*<br />
District submitted<br />
required data elements<br />
on or before due dates;<br />
made revisions within<br />
the alloted reveiw<br />
periods.<br />
Accurate and Timely<br />
Data Submission<br />
Overall (3-21)<br />
Early Childhood (3-5)<br />
School Age (5-21)<br />
State<br />
Target<br />
100.00%<br />
100.00%<br />
100.00%<br />
State<br />
Target<br />
LEA<br />
Rate<br />
LEA<br />
Rate<br />
Target Met by<br />
LEA (Y/N)<br />
Target Met<br />
by LEA<br />
(Y/N)<br />
Target Met<br />
by LEA<br />
(Y/N)<br />
*Data reviewed for timely and accurate submissions included all APSCN cycle data except for personnel<br />
Note: - - denotes not applicable<br />
96.19 100.00 — — N/A<br />
14.53<br />
State<br />
Rate<br />
49.42<br />
State<br />
Rate<br />
54.07<br />
13.00<br />
State<br />
Target<br />
49.00<br />
State<br />
Target<br />
60.00<br />
Y<br />
N/A<br />
Y<br />
— —<br />
LEA<br />
Rate<br />
— —<br />
LEA<br />
Rate<br />
— —<br />
N/A<br />
Target Met<br />
by LEA<br />
(Y/N)<br />
N/A<br />
Target Met<br />
by LEA<br />
(Y/N)<br />
N/A<br />
Page 5 of 5
<strong>ARKANSAS</strong> <strong>SPECIAL</strong> <strong>EDUCATION</strong><br />
<strong>DISTRICT</strong> <strong>ANNUAL</strong> PERFORMANCE REPORT<br />
2010/11 School Year<br />
Publication Date: March 2012<br />
Each State must have in place a State Performance Plan (SPP) to evaluate the State's efforts to meet the requirements and<br />
purposes of the implementation of the Individuals with Disabilities Education Act (IDEA). The SPP is a six-year plan, which<br />
describes Arkansas's performance on 20 indicators. The Office of Special Education Programs in the U. S. Department of<br />
Education requires that States report annually to the public on the performance of each local education agency (LEA) on 14 of<br />
20 indicators as compared with targets established by the State in the SPP. Arkansas will report indicators 1 through 14 and<br />
20 for each LEA serving children with disabilities (CWD). Any LEA not meeting targets on compliance indicators (0% for<br />
Indicators 4B, 09 & 10 and 100% for Indicators 11, 12, 13, and 20) are non-compliant with IDEA.<br />
There are no report changes for the 2010/11 school year profile; However, it is important to recognize that: .<br />
1. Indicator 01 (Graduation) is reported a year in arrear (2009/10 graduates) and is based on a four-year cohort. This<br />
means the rate is a measure of students who entered in ninth grade and graduate in four years. The calculation is a<br />
requirement under Title I of the Elementary and Secondary Education Act (ESEA).<br />
2. Indicator 02 (Drop out) is reported a year in arrear. This means the rate is a measure of students who dropped out in<br />
the 2009/10 school year. The Indicator 02 data are aligned with the Common Core of Data (CCD) requirements for<br />
grades 7-12.<br />
3. Indicator 04A and 4B (Suspension/Expulsion) is reported a year in arrear. This means the rate is a measure of<br />
students who had out-of-school suspensions and/or expulsions totaling more than 10 days.<br />
For a complete description of all the Indicators, please visit the special education website at<br />
http://arksped.k12.ar.us/sections/policy.html<br />
LEA: 6041 - LISA ACADEMY CHARTER SCHOOL<br />
Indicator 01: Graduation Rates (2009/10 school year) Indicator 02: Dropout Rates (2009/10 school year)<br />
Percent of youth<br />
with IEPs<br />
graduating from<br />
high school with a<br />
regular diploma<br />
State<br />
Rate<br />
State<br />
Target<br />
75.76% 85.00%<br />
LEA<br />
Rate<br />
100.00%<br />
Target Met<br />
by LEA<br />
(Y/N)<br />
Y<br />
Percent of<br />
youth with<br />
IEPs dropping<br />
out of high<br />
school<br />
State<br />
Rate<br />
Indicator 03: Assessment on Statewide Benchmark Exam (grades 3-8, 11)<br />
A) Adequate Yearly Progress<br />
n=40<br />
Literacy<br />
Mathematics<br />
Met Disability Subgroup "n"<br />
for Reporting Purposes (Y/N)<br />
State Target for % of Districts Meeting<br />
AYP for Disability Subgroup<br />
State<br />
Target<br />
3.06% 4.20%<br />
LEA<br />
Rate<br />
0.00%<br />
% of Districts Meeting AYP<br />
for Disability Subgroup<br />
Target Met by<br />
LEA (Y/N)<br />
Y<br />
Target Met by<br />
LEA(Y/N)<br />
Overall N 17.15% 6.25%<br />
NA<br />
N<br />
N<br />
Note: For a district to qualify as having a disability subgroup it must have a minimum of 40 (n=40) students with disabilities in a school building.<br />
B) Participation<br />
Participation Rate: # of<br />
CWD Tested ÷ # of CWD<br />
Enrolled in grades tested.<br />
Participation Rate: Literacy<br />
Participation Rate: Math<br />
Note: - - denotes not applicable<br />
State<br />
Rate<br />
98.78%<br />
State<br />
Target<br />
95.00%<br />
LEA<br />
Rate<br />
100.00%<br />
Target Met<br />
by LEA (Y/N)<br />
98.61% 95.00% 100.00% Y<br />
Y<br />
C) Performance Proficiency<br />
Percent of CWD Scoring<br />
Proficient or Above<br />
Proficiency Rate: Literacy<br />
Proficiency Rate:<br />
Mathematics<br />
16.00%<br />
16.00%<br />
State<br />
Rate<br />
31.49%<br />
44.86%<br />
State<br />
Target<br />
45.22%<br />
51.14%<br />
LEA<br />
Rate<br />
14.29%<br />
33.33%<br />
NA<br />
NA<br />
Target<br />
Met by<br />
LEA (Y/N)<br />
N<br />
N<br />
Page 1 of 5
LEA: 6041 - LISA ACADEMY CHARTER SCHOOL<br />
Indicator 04: Out-of-School Suspensions and Expulsions (2009/10 school year)<br />
A) Suspension/Expulsion<br />
Percent difference of CWD with out-of- school suspensions and<br />
expulsions totaling greater than 10 days in a school year as<br />
compared to the same data for general education students in<br />
the district.<br />
B) Suspension/Expulsion by Race and Ethnicity<br />
Percent of districts that have: (a) a significant discrepancy, by race or<br />
ethnicity, in the rate of suspensions and expulsions of greater than 10<br />
days in a school year for children with IEPs; and (b) policies,<br />
procedures or practices that contribute to the significant discrepancy<br />
and do not comply with requirements relating to the development<br />
and implementation of IEPs, the use of positive behavioral<br />
interventions and supports, and procedural safeguards.<br />
Indicator 05: School Age (5-21) Least Restrictive Environment<br />
A) In the Regular Class 80% or more of the day<br />
Percent of CWD with<br />
IEPs receiving instruction<br />
in the regular class 80%<br />
or more of the day.<br />
State<br />
Rate<br />
State<br />
Target<br />
LEA<br />
Rate<br />
B) In the Regular Class less than 40% of the day<br />
Percent of CWD with<br />
IEPs receiving instruction<br />
in the regular class less<br />
than 60% of the day.<br />
53.87% 59.77%<br />
State<br />
Rate<br />
State<br />
Target<br />
12.42% 12.51%<br />
92.31%<br />
LEA<br />
Rate<br />
0.00%<br />
C) Other Settings outside the regular class<br />
Percent of CWD with IEPs served in<br />
public or private separate schools,<br />
residential placements, or<br />
homebound/hospital placements.<br />
State<br />
Rate<br />
State<br />
Target<br />
2.80% 2.56%<br />
Target Met<br />
by LEA (Y/N)<br />
Y<br />
Target Met<br />
by LEA (Y/N)<br />
Y<br />
LEA<br />
Rate<br />
0.00%<br />
Target Met<br />
by LEA(Y/N)<br />
Indicator 06: Early Childhood (3-5) Least Restrictive Environment<br />
A) Regular Early Childhood Program<br />
Percent of children (aged 3 through 5) with IEPs attending a regular<br />
early childhood program and receiving the majority of special<br />
education and related services in the regular early childhood program<br />
Allowable<br />
Difference<br />
LEA: 6041 - LISA ACADEMY CHARTER SCHOOL<br />
Indicator 07: Preschool (3-5) Outcomes<br />
a) Percent of preschool CWD<br />
children who did not<br />
improve functioning.<br />
b) Percent of preschool CWD<br />
who improved but whose<br />
functioning remained below<br />
same age peers.<br />
c) Percent of preschool CWD<br />
who improved at a level<br />
nearer to same aged peers.<br />
d) Percent of preschool CWD<br />
who improved functioning to<br />
reach a level comparable to<br />
same age peers.<br />
e) Percent of preschool CWD<br />
children who maintain<br />
functioning at a level<br />
comparable to same aged<br />
peers.<br />
Summary<br />
Statements<br />
1) Of those preschool<br />
children who entered<br />
the preschool program<br />
below age expectations<br />
in each Outcome, the<br />
percent who<br />
substantially increased<br />
their rate of growth by<br />
the time they turned 6<br />
years of age or exited<br />
the program.<br />
2) The percent of<br />
preschool children who<br />
were functioning<br />
within age expectations<br />
in each Outcome by the<br />
time they turned 6<br />
years of age or exited<br />
A) Positive Social -Emotional<br />
Skills*<br />
State<br />
Rate<br />
A) Positive Social -<br />
Emotional Skills<br />
(Including social<br />
relationships)<br />
State<br />
Rate<br />
2.14%<br />
5.31%<br />
25.97%<br />
38.22%<br />
28.36%<br />
State<br />
Target<br />
LEA<br />
Rate<br />
LEA<br />
Rate<br />
— —<br />
— —<br />
— —<br />
— —<br />
— —<br />
Target<br />
Met by<br />
LEA(Y/N)<br />
B) Acquisition and Use of<br />
Knowledge and Skills<br />
(Including early language/<br />
communication and early literacy)<br />
B) Acquisition and Use of<br />
Knowledge and Skills **<br />
State<br />
Rate<br />
1.75%<br />
6.59%<br />
34.23%<br />
43.51%<br />
13.92%<br />
State<br />
Target<br />
LEA<br />
Rate<br />
Target<br />
Met by<br />
LEA(Y/N)<br />
C) Use of Appropriate Behaviors<br />
to Meet Their Needs<br />
State<br />
Rate<br />
State<br />
Target<br />
LEA<br />
Rate<br />
Target<br />
Met by<br />
LEA(Y/N)<br />
89.61% 90.50% — — N/A 90.31% 90.50% — — N/A 90.82% 92.50% — — N/A<br />
66.58% 69.50% — — N/A 57.43% 60.50% — — N/A 76.69% 78.50% — — N/A<br />
NOTE: * Including social relationships ** Including early language/ communication and early literacy<br />
Note: - - denotes not applicable<br />
State<br />
Rate<br />
LEA<br />
Rate<br />
— —<br />
— —<br />
— —<br />
— —<br />
— —<br />
C) Use of<br />
Appropriate<br />
Behaviors to<br />
Meet Their Needs<br />
State<br />
Rate<br />
4.51%<br />
17.34%<br />
41.72%<br />
34.97%<br />
LEA<br />
Rate<br />
1.46% — —<br />
— —<br />
— —<br />
— —<br />
— —<br />
Page 3 of 5
LEA: 6041 - LISA ACADEMY CHARTER SCHOOL<br />
Indicator 08: Parent Involvement<br />
Percent of surveyed<br />
parents who reported<br />
school facilitated parent<br />
involvement as a means<br />
of improving services<br />
and results for children<br />
with disabilities.<br />
Early Childhood<br />
(3-5)<br />
School Age<br />
(5-21)<br />
State<br />
Rate<br />
90.47%<br />
95.05%<br />
Indicator 09: Disproportionality - Eligibility<br />
Disproportionate representation of racial<br />
and ethnic groups in special education and<br />
related services that is a result of<br />
inappropriate identification (e.g.<br />
monitoring data, review of policies,<br />
practices, and procedures under 618(d),<br />
etc.).<br />
State<br />
Rate<br />
State<br />
Target<br />
88.00%<br />
96.00%<br />
State<br />
Target<br />
0.00% 0.00%<br />
LEA<br />
Rate<br />
— —<br />
100.00%<br />
Indicator 10: Disproportionality-Child with a Disability<br />
Disproportionate representation of racial<br />
and ethnic groups in specific disability<br />
categories that is a result of inappropriate<br />
identification (e.g. monitoring data, review<br />
of policies, practices, and procedures under<br />
618(d), etc.).<br />
Indicator 11: Child Find<br />
Percent of children with<br />
parental consent to evaluate<br />
who are evaluated within<br />
the State established timeline<br />
of 60 days.<br />
Overall<br />
(3-21)<br />
Early Childhood<br />
(3-5)<br />
School Age<br />
(5-21)<br />
State<br />
Rate<br />
0.00%<br />
Indicator 12: Early Childhood Transition<br />
Percent of children referred by Part C prior to<br />
age 3, who are found eligible for Part B, and<br />
who have an IEP developed and implemented<br />
by their third birthday.<br />
Note: - - denotes not applicable<br />
State<br />
Rate<br />
99.41%<br />
99.70%<br />
98.97%<br />
State<br />
Rate<br />
State<br />
Target<br />
0.00%<br />
State<br />
Target<br />
100.00%<br />
100.00%<br />
100.00%<br />
State<br />
Target<br />
Target Met by<br />
LEA (Y/N)<br />
Y<br />
Target Met by<br />
LEA (Y/N)<br />
Y<br />
LEA<br />
Rate<br />
100.00%<br />
— —<br />
100.00%<br />
LEA<br />
Rate<br />
Target Met by<br />
LEA (Y/N)<br />
N/A<br />
Y<br />
Note: The target for Indicator 09 is to have zero percent<br />
(0%) of districts identified as having disproportionate<br />
representation as a result of inappropriate<br />
identification in eligibility.<br />
Note: The target for Indicator 10 is to have zero<br />
percent (0%) of districts identified as having<br />
disproportionate representation as a result of<br />
inappropriate identification in a disability<br />
category.<br />
Target Met by<br />
LEA (Y/N)<br />
N/A<br />
Y<br />
Target Met<br />
by LEA<br />
(Y/N)<br />
99.21% 100.00% - - N/A<br />
Y<br />
Note: * Indicates a zero reponse rate for the<br />
district.<br />
Page 4 of 5
LEA: 6041 - LISA ACADEMY CHARTER SCHOOL<br />
Indicator 13: Secondary Transition<br />
Percent of youth with disabilities aged 16 and<br />
up with an IEP that includes coordinated,<br />
measurable, annual IEP goals and transition<br />
services that will reasonably enable the student<br />
to meet the post-secondary goals.<br />
Indicator 14: Post-School Outcomes<br />
A. Percent of youth enrolled in higher<br />
education within one year of leaving high<br />
school.<br />
State<br />
Rate<br />
State<br />
Target<br />
Note: Data for this Indicator is from the on-site monitoring of LEAs for the given year.<br />
B. Percent of youth enrolled in higher<br />
education or competitively employed<br />
within one year of leaving high school.<br />
C. Percent of youth enrolled in higher<br />
education or in some other postsecondary<br />
education or training program; or<br />
competitively employed or in some other<br />
employment within one year of leaving<br />
high school.<br />
State<br />
Rate<br />
Indicator 20: Reported Data-Timely and Accurate*<br />
District submitted<br />
required data elements<br />
on or before due dates;<br />
made revisions within<br />
the alloted reveiw<br />
periods.<br />
Accurate and Timely<br />
Data Submission<br />
Overall (3-21)<br />
Early Childhood (3-5)<br />
School Age (5-21)<br />
State<br />
Target<br />
100.00%<br />
100.00%<br />
100.00%<br />
State<br />
Target<br />
LEA<br />
Rate<br />
LEA<br />
Rate<br />
Target Met by<br />
LEA (Y/N)<br />
Target Met<br />
by LEA<br />
(Y/N)<br />
Target Met<br />
by LEA<br />
(Y/N)<br />
*Data reviewed for timely and accurate submissions included all APSCN cycle data except for personnel<br />
Note: - - denotes not applicable<br />
96.19 100.00 — — N/A<br />
14.53<br />
State<br />
Rate<br />
49.42<br />
State<br />
Rate<br />
54.07<br />
13.00<br />
State<br />
Target<br />
49.00<br />
State<br />
Target<br />
60.00<br />
Y<br />
N/A<br />
Y<br />
— —<br />
LEA<br />
Rate<br />
— —<br />
LEA<br />
Rate<br />
— —<br />
N/A<br />
Target Met<br />
by LEA<br />
(Y/N)<br />
N/A<br />
Target Met<br />
by LEA<br />
(Y/N)<br />
N/A<br />
Page 5 of 5
<strong>ARKANSAS</strong> <strong>SPECIAL</strong> <strong>EDUCATION</strong><br />
<strong>DISTRICT</strong> <strong>ANNUAL</strong> PERFORMANCE REPORT<br />
2010/11 School Year<br />
Publication Date: March 2012<br />
Each State must have in place a State Performance Plan (SPP) to evaluate the State's efforts to meet the requirements and<br />
purposes of the implementation of the Individuals with Disabilities Education Act (IDEA). The SPP is a six-year plan, which<br />
describes Arkansas's performance on 20 indicators. The Office of Special Education Programs in the U. S. Department of<br />
Education requires that States report annually to the public on the performance of each local education agency (LEA) on 14 of<br />
20 indicators as compared with targets established by the State in the SPP. Arkansas will report indicators 1 through 14 and<br />
20 for each LEA serving children with disabilities (CWD). Any LEA not meeting targets on compliance indicators (0% for<br />
Indicators 4B, 09 & 10 and 100% for Indicators 11, 12, 13, and 20) are non-compliant with IDEA.<br />
There are no report changes for the 2010/11 school year profile; However, it is important to recognize that: .<br />
1. Indicator 01 (Graduation) is reported a year in arrear (2009/10 graduates) and is based on a four-year cohort. This<br />
means the rate is a measure of students who entered in ninth grade and graduate in four years. The calculation is a<br />
requirement under Title I of the Elementary and Secondary Education Act (ESEA).<br />
2. Indicator 02 (Drop out) is reported a year in arrear. This means the rate is a measure of students who dropped out in<br />
the 2009/10 school year. The Indicator 02 data are aligned with the Common Core of Data (CCD) requirements for<br />
grades 7-12.<br />
3. Indicator 04A and 4B (Suspension/Expulsion) is reported a year in arrear. This means the rate is a measure of<br />
students who had out-of-school suspensions and/or expulsions totaling more than 10 days.<br />
For a complete description of all the Indicators, please visit the special education website at<br />
http://arksped.k12.ar.us/sections/policy.html<br />
LEA: 6042 - DREAMLAND ACADEMY CHARTER SCHOOL<br />
Indicator 01: Graduation Rates (2009/10 school year) Indicator 02: Dropout Rates (2009/10 school year)<br />
Percent of youth<br />
with IEPs<br />
graduating from<br />
high school with a<br />
regular diploma<br />
State<br />
Rate<br />
State<br />
Target<br />
75.76% 85.00%<br />
LEA<br />
Rate<br />
— —<br />
Target Met<br />
by LEA<br />
(Y/N)<br />
NA<br />
Percent of<br />
youth with<br />
IEPs dropping<br />
out of high<br />
school<br />
State<br />
Rate<br />
Indicator 03: Assessment on Statewide Benchmark Exam (grades 3-8, 11)<br />
A) Adequate Yearly Progress<br />
n=40<br />
Literacy<br />
Mathematics<br />
Met Disability Subgroup "n"<br />
for Reporting Purposes (Y/N)<br />
State Target for % of Districts Meeting<br />
AYP for Disability Subgroup<br />
State<br />
Target<br />
3.06% 4.20%<br />
LEA<br />
Rate<br />
— —<br />
% of Districts Meeting AYP<br />
for Disability Subgroup<br />
Target Met by<br />
LEA (Y/N)<br />
N/A<br />
Target Met by<br />
LEA(Y/N)<br />
Overall N 17.15% 6.25%<br />
NA<br />
N<br />
N<br />
Note: For a district to qualify as having a disability subgroup it must have a minimum of 40 (n=40) students with disabilities in a school building.<br />
B) Participation<br />
Participation Rate: # of<br />
CWD Tested ÷ # of CWD<br />
Enrolled in grades tested.<br />
Participation Rate: Literacy<br />
Participation Rate: Math<br />
Note: - - denotes not applicable<br />
State<br />
Rate<br />
98.78%<br />
State<br />
Target<br />
95.00%<br />
LEA<br />
Rate<br />
100.00%<br />
Target Met<br />
by LEA (Y/N)<br />
98.61% 95.00% 100.00% Y<br />
Y<br />
C) Performance Proficiency<br />
Percent of CWD Scoring<br />
Proficient or Above<br />
Proficiency Rate: Literacy<br />
Proficiency Rate:<br />
Mathematics<br />
16.00%<br />
16.00%<br />
State<br />
Rate<br />
31.49%<br />
44.86%<br />
State<br />
Target<br />
45.22%<br />
51.14%<br />
LEA<br />
Rate<br />
0.00%<br />
0.00%<br />
NA<br />
NA<br />
Target<br />
Met by<br />
LEA (Y/N)<br />
N<br />
N<br />
Page 1 of 5
LEA: 6042 - DREAMLAND ACADEMY CHARTER SCHOOL<br />
Indicator 04: Out-of-School Suspensions and Expulsions (2009/10 school year)<br />
A) Suspension/Expulsion<br />
Percent difference of CWD with out-of- school suspensions and<br />
expulsions totaling greater than 10 days in a school year as<br />
compared to the same data for general education students in<br />
the district.<br />
B) Suspension/Expulsion by Race and Ethnicity<br />
Percent of districts that have: (a) a significant discrepancy, by race or<br />
ethnicity, in the rate of suspensions and expulsions of greater than 10<br />
days in a school year for children with IEPs; and (b) policies,<br />
procedures or practices that contribute to the significant discrepancy<br />
and do not comply with requirements relating to the development<br />
and implementation of IEPs, the use of positive behavioral<br />
interventions and supports, and procedural safeguards.<br />
Indicator 05: School Age (5-21) Least Restrictive Environment<br />
A) In the Regular Class 80% or more of the day<br />
Percent of CWD with<br />
IEPs receiving instruction<br />
in the regular class 80%<br />
or more of the day.<br />
State<br />
Rate<br />
State<br />
Target<br />
LEA<br />
Rate<br />
B) In the Regular Class less than 40% of the day<br />
Percent of CWD with<br />
IEPs receiving instruction<br />
in the regular class less<br />
than 60% of the day.<br />
53.87% 59.77%<br />
State<br />
Rate<br />
State<br />
Target<br />
12.42% 12.51%<br />
32.00%<br />
LEA<br />
Rate<br />
4.00%<br />
C) Other Settings outside the regular class<br />
Percent of CWD with IEPs served in<br />
public or private separate schools,<br />
residential placements, or<br />
homebound/hospital placements.<br />
State<br />
Rate<br />
State<br />
Target<br />
2.80% 2.56%<br />
Target Met<br />
by LEA (Y/N)<br />
N<br />
Target Met<br />
by LEA (Y/N)<br />
Y<br />
LEA<br />
Rate<br />
0.00%<br />
Target Met<br />
by LEA(Y/N)<br />
Indicator 06: Early Childhood (3-5) Least Restrictive Environment<br />
A) Regular Early Childhood Program<br />
Percent of children (aged 3 through 5) with IEPs attending a regular<br />
early childhood program and receiving the majority of special<br />
education and related services in the regular early childhood program<br />
Allowable<br />
Difference<br />
LEA: 6042 - DREAMLAND ACADEMY CHARTER SCHOOL<br />
Indicator 07: Preschool (3-5) Outcomes<br />
a) Percent of preschool CWD<br />
children who did not<br />
improve functioning.<br />
b) Percent of preschool CWD<br />
who improved but whose<br />
functioning remained below<br />
same age peers.<br />
c) Percent of preschool CWD<br />
who improved at a level<br />
nearer to same aged peers.<br />
d) Percent of preschool CWD<br />
who improved functioning to<br />
reach a level comparable to<br />
same age peers.<br />
e) Percent of preschool CWD<br />
children who maintain<br />
functioning at a level<br />
comparable to same aged<br />
peers.<br />
Summary<br />
Statements<br />
1) Of those preschool<br />
children who entered<br />
the preschool program<br />
below age expectations<br />
in each Outcome, the<br />
percent who<br />
substantially increased<br />
their rate of growth by<br />
the time they turned 6<br />
years of age or exited<br />
the program.<br />
2) The percent of<br />
preschool children who<br />
were functioning<br />
within age expectations<br />
in each Outcome by the<br />
time they turned 6<br />
years of age or exited<br />
A) Positive Social -Emotional<br />
Skills*<br />
State<br />
Rate<br />
A) Positive Social -<br />
Emotional Skills<br />
(Including social<br />
relationships)<br />
State<br />
Rate<br />
2.14%<br />
5.31%<br />
25.97%<br />
38.22%<br />
28.36%<br />
State<br />
Target<br />
LEA<br />
Rate<br />
LEA<br />
Rate<br />
— —<br />
— —<br />
— —<br />
— —<br />
— —<br />
Target<br />
Met by<br />
LEA(Y/N)<br />
B) Acquisition and Use of<br />
Knowledge and Skills<br />
(Including early language/<br />
communication and early literacy)<br />
B) Acquisition and Use of<br />
Knowledge and Skills **<br />
State<br />
Rate<br />
1.75%<br />
6.59%<br />
34.23%<br />
43.51%<br />
13.92%<br />
State<br />
Target<br />
LEA<br />
Rate<br />
Target<br />
Met by<br />
LEA(Y/N)<br />
C) Use of Appropriate Behaviors<br />
to Meet Their Needs<br />
State<br />
Rate<br />
State<br />
Target<br />
LEA<br />
Rate<br />
Target<br />
Met by<br />
LEA(Y/N)<br />
89.61% 90.50% — — N/A 90.31% 90.50% — — N/A 90.82% 92.50% — — N/A<br />
66.58% 69.50% — — N/A 57.43% 60.50% — — N/A 76.69% 78.50% — — N/A<br />
NOTE: * Including social relationships ** Including early language/ communication and early literacy<br />
Note: - - denotes not applicable<br />
State<br />
Rate<br />
LEA<br />
Rate<br />
— —<br />
— —<br />
— —<br />
— —<br />
— —<br />
C) Use of<br />
Appropriate<br />
Behaviors to<br />
Meet Their Needs<br />
State<br />
Rate<br />
4.51%<br />
17.34%<br />
41.72%<br />
34.97%<br />
LEA<br />
Rate<br />
1.46% — —<br />
— —<br />
— —<br />
— —<br />
— —<br />
Page 3 of 5
LEA: 6042 - DREAMLAND ACADEMY CHARTER SCHOOL<br />
Indicator 08: Parent Involvement<br />
Percent of surveyed<br />
parents who reported<br />
school facilitated parent<br />
involvement as a means<br />
of improving services<br />
and results for children<br />
with disabilities.<br />
Early Childhood<br />
(3-5)<br />
School Age<br />
(5-21)<br />
State<br />
Rate<br />
90.47%<br />
95.05%<br />
Indicator 09: Disproportionality - Eligibility<br />
Disproportionate representation of racial<br />
and ethnic groups in special education and<br />
related services that is a result of<br />
inappropriate identification (e.g.<br />
monitoring data, review of policies,<br />
practices, and procedures under 618(d),<br />
etc.).<br />
State<br />
Rate<br />
State<br />
Target<br />
88.00%<br />
96.00%<br />
State<br />
Target<br />
0.00% 0.00%<br />
LEA<br />
Rate<br />
— —<br />
— —<br />
Indicator 10: Disproportionality-Child with a Disability<br />
Disproportionate representation of racial<br />
and ethnic groups in specific disability<br />
categories that is a result of inappropriate<br />
identification (e.g. monitoring data, review<br />
of policies, practices, and procedures under<br />
618(d), etc.).<br />
Indicator 11: Child Find<br />
Percent of children with<br />
parental consent to evaluate<br />
who are evaluated within<br />
the State established timeline<br />
of 60 days.<br />
Overall<br />
(3-21)<br />
Early Childhood<br />
(3-5)<br />
School Age<br />
(5-21)<br />
State<br />
Rate<br />
0.00%<br />
Indicator 12: Early Childhood Transition<br />
Percent of children referred by Part C prior to<br />
age 3, who are found eligible for Part B, and<br />
who have an IEP developed and implemented<br />
by their third birthday.<br />
Note: - - denotes not applicable<br />
State<br />
Rate<br />
99.41%<br />
99.70%<br />
98.97%<br />
State<br />
Rate<br />
State<br />
Target<br />
0.00%<br />
State<br />
Target<br />
100.00%<br />
100.00%<br />
100.00%<br />
State<br />
Target<br />
Target Met by<br />
LEA (Y/N)<br />
Y<br />
Target Met by<br />
LEA (Y/N)<br />
Y<br />
LEA<br />
Rate<br />
100.00%<br />
— —<br />
100.00%<br />
LEA<br />
Rate<br />
Target Met by<br />
LEA (Y/N)<br />
N/A<br />
N<br />
Note: The target for Indicator 09 is to have zero percent<br />
(0%) of districts identified as having disproportionate<br />
representation as a result of inappropriate<br />
identification in eligibility.<br />
Note: The target for Indicator 10 is to have zero<br />
percent (0%) of districts identified as having<br />
disproportionate representation as a result of<br />
inappropriate identification in a disability<br />
category.<br />
Target Met by<br />
LEA (Y/N)<br />
N/A<br />
Y<br />
Target Met<br />
by LEA<br />
(Y/N)<br />
99.21% 100.00% - - N/A<br />
Y<br />
Note: * Indicates a zero reponse rate for the<br />
district.<br />
Page 4 of 5
LEA: 6042 - DREAMLAND ACADEMY CHARTER SCHOOL<br />
Indicator 13: Secondary Transition<br />
Percent of youth with disabilities aged 16 and<br />
up with an IEP that includes coordinated,<br />
measurable, annual IEP goals and transition<br />
services that will reasonably enable the student<br />
to meet the post-secondary goals.<br />
Indicator 14: Post-School Outcomes<br />
A. Percent of youth enrolled in higher<br />
education within one year of leaving high<br />
school.<br />
State<br />
Rate<br />
State<br />
Target<br />
Note: Data for this Indicator is from the on-site monitoring of LEAs for the given year.<br />
B. Percent of youth enrolled in higher<br />
education or competitively employed<br />
within one year of leaving high school.<br />
C. Percent of youth enrolled in higher<br />
education or in some other postsecondary<br />
education or training program; or<br />
competitively employed or in some other<br />
employment within one year of leaving<br />
high school.<br />
State<br />
Rate<br />
Indicator 20: Reported Data-Timely and Accurate*<br />
District submitted<br />
required data elements<br />
on or before due dates;<br />
made revisions within<br />
the alloted reveiw<br />
periods.<br />
Accurate and Timely<br />
Data Submission<br />
Overall (3-21)<br />
Early Childhood (3-5)<br />
School Age (5-21)<br />
State<br />
Target<br />
100.00%<br />
100.00%<br />
100.00%<br />
State<br />
Target<br />
LEA<br />
Rate<br />
LEA<br />
Rate<br />
Target Met by<br />
LEA (Y/N)<br />
Target Met<br />
by LEA<br />
(Y/N)<br />
Target Met<br />
by LEA<br />
(Y/N)<br />
*Data reviewed for timely and accurate submissions included all APSCN cycle data except for personnel<br />
Note: - - denotes not applicable<br />
96.19 100.00 — — N/A<br />
14.53<br />
State<br />
Rate<br />
49.42<br />
State<br />
Rate<br />
54.07<br />
13.00<br />
State<br />
Target<br />
49.00<br />
State<br />
Target<br />
60.00<br />
Y<br />
N/A<br />
Y<br />
— —<br />
LEA<br />
Rate<br />
— —<br />
LEA<br />
Rate<br />
— —<br />
N/A<br />
Target Met<br />
by LEA<br />
(Y/N)<br />
N/A<br />
Target Met<br />
by LEA<br />
(Y/N)<br />
N/A<br />
Page 5 of 5
<strong>ARKANSAS</strong> <strong>SPECIAL</strong> <strong>EDUCATION</strong><br />
<strong>DISTRICT</strong> <strong>ANNUAL</strong> PERFORMANCE REPORT<br />
2010/11 School Year<br />
Publication Date: March 2012<br />
Each State must have in place a State Performance Plan (SPP) to evaluate the State's efforts to meet the requirements and<br />
purposes of the implementation of the Individuals with Disabilities Education Act (IDEA). The SPP is a six-year plan, which<br />
describes Arkansas's performance on 20 indicators. The Office of Special Education Programs in the U. S. Department of<br />
Education requires that States report annually to the public on the performance of each local education agency (LEA) on 14 of<br />
20 indicators as compared with targets established by the State in the SPP. Arkansas will report indicators 1 through 14 and<br />
20 for each LEA serving children with disabilities (CWD). Any LEA not meeting targets on compliance indicators (0% for<br />
Indicators 4B, 09 & 10 and 100% for Indicators 11, 12, 13, and 20) are non-compliant with IDEA.<br />
There are no report changes for the 2010/11 school year profile; However, it is important to recognize that: .<br />
1. Indicator 01 (Graduation) is reported a year in arrear (2009/10 graduates) and is based on a four-year cohort. This<br />
means the rate is a measure of students who entered in ninth grade and graduate in four years. The calculation is a<br />
requirement under Title I of the Elementary and Secondary Education Act (ESEA).<br />
2. Indicator 02 (Drop out) is reported a year in arrear. This means the rate is a measure of students who dropped out in<br />
the 2009/10 school year. The Indicator 02 data are aligned with the Common Core of Data (CCD) requirements for<br />
grades 7-12.<br />
3. Indicator 04A and 4B (Suspension/Expulsion) is reported a year in arrear. This means the rate is a measure of<br />
students who had out-of-school suspensions and/or expulsions totaling more than 10 days.<br />
For a complete description of all the Indicators, please visit the special education website at<br />
http://arksped.k12.ar.us/sections/policy.html<br />
LEA: 6043 - <strong>ARKANSAS</strong> VIRTUAL CHARTER SCHOOL<br />
Indicator 01: Graduation Rates (2009/10 school year) Indicator 02: Dropout Rates (2009/10 school year)<br />
Percent of youth<br />
with IEPs<br />
graduating from<br />
high school with a<br />
regular diploma<br />
State<br />
Rate<br />
State<br />
Target<br />
75.76% 85.00%<br />
LEA<br />
Rate<br />
— —<br />
Target Met<br />
by LEA<br />
(Y/N)<br />
NA<br />
Percent of<br />
youth with<br />
IEPs dropping<br />
out of high<br />
school<br />
State<br />
Rate<br />
Indicator 03: Assessment on Statewide Benchmark Exam (grades 3-8, 11)<br />
A) Adequate Yearly Progress<br />
n=40<br />
Literacy<br />
Mathematics<br />
Met Disability Subgroup "n"<br />
for Reporting Purposes (Y/N)<br />
State Target for % of Districts Meeting<br />
AYP for Disability Subgroup<br />
State<br />
Target<br />
3.06% 4.20%<br />
LEA<br />
Rate<br />
0.00%<br />
% of Districts Meeting AYP<br />
for Disability Subgroup<br />
Target Met by<br />
LEA (Y/N)<br />
Y<br />
Target Met by<br />
LEA(Y/N)<br />
Overall N 17.15% 6.25%<br />
NA<br />
N<br />
N<br />
Note: For a district to qualify as having a disability subgroup it must have a minimum of 40 (n=40) students with disabilities in a school building.<br />
B) Participation<br />
Participation Rate: # of<br />
CWD Tested ÷ # of CWD<br />
Enrolled in grades tested.<br />
Participation Rate: Literacy<br />
Participation Rate: Math<br />
Note: - - denotes not applicable<br />
State<br />
Rate<br />
98.78%<br />
State<br />
Target<br />
95.00%<br />
LEA<br />
Rate<br />
100.00%<br />
Target Met<br />
by LEA (Y/N)<br />
98.61% 95.00% 100.00% Y<br />
Y<br />
C) Performance Proficiency<br />
Percent of CWD Scoring<br />
Proficient or Above<br />
Proficiency Rate: Literacy<br />
Proficiency Rate:<br />
Mathematics<br />
16.00%<br />
16.00%<br />
State<br />
Rate<br />
31.49%<br />
44.86%<br />
State<br />
Target<br />
45.22%<br />
51.14%<br />
LEA<br />
Rate<br />
18.92%<br />
24.32%<br />
NA<br />
NA<br />
Target<br />
Met by<br />
LEA (Y/N)<br />
N<br />
N<br />
Page 1 of 5
LEA: 6043 - <strong>ARKANSAS</strong> VIRTUAL CHARTER SCHOOL<br />
Indicator 04: Out-of-School Suspensions and Expulsions (2009/10 school year)<br />
A) Suspension/Expulsion<br />
Percent difference of CWD with out-of- school suspensions and<br />
expulsions totaling greater than 10 days in a school year as<br />
compared to the same data for general education students in<br />
the district.<br />
B) Suspension/Expulsion by Race and Ethnicity<br />
Percent of districts that have: (a) a significant discrepancy, by race or<br />
ethnicity, in the rate of suspensions and expulsions of greater than 10<br />
days in a school year for children with IEPs; and (b) policies,<br />
procedures or practices that contribute to the significant discrepancy<br />
and do not comply with requirements relating to the development<br />
and implementation of IEPs, the use of positive behavioral<br />
interventions and supports, and procedural safeguards.<br />
Indicator 05: School Age (5-21) Least Restrictive Environment<br />
A) In the Regular Class 80% or more of the day<br />
Percent of CWD with<br />
IEPs receiving instruction<br />
in the regular class 80%<br />
or more of the day.<br />
State<br />
Rate<br />
State<br />
Target<br />
LEA<br />
Rate<br />
B) In the Regular Class less than 40% of the day<br />
Percent of CWD with<br />
IEPs receiving instruction<br />
in the regular class less<br />
than 60% of the day.<br />
53.87% 59.77%<br />
State<br />
Rate<br />
State<br />
Target<br />
12.42% 12.51%<br />
100.00%<br />
LEA<br />
Rate<br />
0.00%<br />
C) Other Settings outside the regular class<br />
Percent of CWD with IEPs served in<br />
public or private separate schools,<br />
residential placements, or<br />
homebound/hospital placements.<br />
State<br />
Rate<br />
State<br />
Target<br />
2.80% 2.56%<br />
Target Met<br />
by LEA (Y/N)<br />
Y<br />
Target Met<br />
by LEA (Y/N)<br />
Y<br />
LEA<br />
Rate<br />
0.00%<br />
Target Met<br />
by LEA(Y/N)<br />
Indicator 06: Early Childhood (3-5) Least Restrictive Environment<br />
A) Regular Early Childhood Program<br />
Percent of children (aged 3 through 5) with IEPs attending a regular<br />
early childhood program and receiving the majority of special<br />
education and related services in the regular early childhood program<br />
Allowable<br />
Difference<br />
LEA: 6043 - <strong>ARKANSAS</strong> VIRTUAL CHARTER SCHOOL<br />
Indicator 07: Preschool (3-5) Outcomes<br />
a) Percent of preschool CWD<br />
children who did not<br />
improve functioning.<br />
b) Percent of preschool CWD<br />
who improved but whose<br />
functioning remained below<br />
same age peers.<br />
c) Percent of preschool CWD<br />
who improved at a level<br />
nearer to same aged peers.<br />
d) Percent of preschool CWD<br />
who improved functioning to<br />
reach a level comparable to<br />
same age peers.<br />
e) Percent of preschool CWD<br />
children who maintain<br />
functioning at a level<br />
comparable to same aged<br />
peers.<br />
Summary<br />
Statements<br />
1) Of those preschool<br />
children who entered<br />
the preschool program<br />
below age expectations<br />
in each Outcome, the<br />
percent who<br />
substantially increased<br />
their rate of growth by<br />
the time they turned 6<br />
years of age or exited<br />
the program.<br />
2) The percent of<br />
preschool children who<br />
were functioning<br />
within age expectations<br />
in each Outcome by the<br />
time they turned 6<br />
years of age or exited<br />
A) Positive Social -Emotional<br />
Skills*<br />
State<br />
Rate<br />
A) Positive Social -<br />
Emotional Skills<br />
(Including social<br />
relationships)<br />
State<br />
Rate<br />
2.14%<br />
5.31%<br />
25.97%<br />
38.22%<br />
28.36%<br />
State<br />
Target<br />
LEA<br />
Rate<br />
LEA<br />
Rate<br />
— —<br />
— —<br />
— —<br />
— —<br />
— —<br />
Target<br />
Met by<br />
LEA(Y/N)<br />
B) Acquisition and Use of<br />
Knowledge and Skills<br />
(Including early language/<br />
communication and early literacy)<br />
B) Acquisition and Use of<br />
Knowledge and Skills **<br />
State<br />
Rate<br />
1.75%<br />
6.59%<br />
34.23%<br />
43.51%<br />
13.92%<br />
State<br />
Target<br />
LEA<br />
Rate<br />
Target<br />
Met by<br />
LEA(Y/N)<br />
C) Use of Appropriate Behaviors<br />
to Meet Their Needs<br />
State<br />
Rate<br />
State<br />
Target<br />
LEA<br />
Rate<br />
Target<br />
Met by<br />
LEA(Y/N)<br />
89.61% 90.50% — — N/A 90.31% 90.50% — — N/A 90.82% 92.50% — — N/A<br />
66.58% 69.50% — — N/A 57.43% 60.50% — — N/A 76.69% 78.50% — — N/A<br />
NOTE: * Including social relationships ** Including early language/ communication and early literacy<br />
Note: - - denotes not applicable<br />
State<br />
Rate<br />
LEA<br />
Rate<br />
— —<br />
— —<br />
— —<br />
— —<br />
— —<br />
C) Use of<br />
Appropriate<br />
Behaviors to<br />
Meet Their Needs<br />
State<br />
Rate<br />
4.51%<br />
17.34%<br />
41.72%<br />
34.97%<br />
LEA<br />
Rate<br />
1.46% — —<br />
— —<br />
— —<br />
— —<br />
— —<br />
Page 3 of 5
LEA: 6043 - <strong>ARKANSAS</strong> VIRTUAL CHARTER SCHOOL<br />
Indicator 08: Parent Involvement<br />
Percent of surveyed<br />
parents who reported<br />
school facilitated parent<br />
involvement as a means<br />
of improving services<br />
and results for children<br />
with disabilities.<br />
Early Childhood<br />
(3-5)<br />
School Age<br />
(5-21)<br />
State<br />
Rate<br />
90.47%<br />
95.05%<br />
Indicator 09: Disproportionality - Eligibility<br />
Disproportionate representation of racial<br />
and ethnic groups in special education and<br />
related services that is a result of<br />
inappropriate identification (e.g.<br />
monitoring data, review of policies,<br />
practices, and procedures under 618(d),<br />
etc.).<br />
State<br />
Rate<br />
State<br />
Target<br />
88.00%<br />
96.00%<br />
State<br />
Target<br />
0.00% 0.00%<br />
LEA<br />
Rate<br />
— —<br />
100.00%<br />
Indicator 10: Disproportionality-Child with a Disability<br />
Disproportionate representation of racial<br />
and ethnic groups in specific disability<br />
categories that is a result of inappropriate<br />
identification (e.g. monitoring data, review<br />
of policies, practices, and procedures under<br />
618(d), etc.).<br />
Indicator 11: Child Find<br />
Percent of children with<br />
parental consent to evaluate<br />
who are evaluated within<br />
the State established timeline<br />
of 60 days.<br />
Overall<br />
(3-21)<br />
Early Childhood<br />
(3-5)<br />
School Age<br />
(5-21)<br />
State<br />
Rate<br />
0.00%<br />
Indicator 12: Early Childhood Transition<br />
Percent of children referred by Part C prior to<br />
age 3, who are found eligible for Part B, and<br />
who have an IEP developed and implemented<br />
by their third birthday.<br />
Note: - - denotes not applicable<br />
State<br />
Rate<br />
99.41%<br />
99.70%<br />
98.97%<br />
State<br />
Rate<br />
State<br />
Target<br />
0.00%<br />
State<br />
Target<br />
100.00%<br />
100.00%<br />
100.00%<br />
State<br />
Target<br />
Target Met by<br />
LEA (Y/N)<br />
Y<br />
Target Met by<br />
LEA (Y/N)<br />
Y<br />
LEA<br />
Rate<br />
100.00%<br />
— —<br />
100.00%<br />
LEA<br />
Rate<br />
Target Met by<br />
LEA (Y/N)<br />
N/A<br />
Y<br />
Note: The target for Indicator 09 is to have zero percent<br />
(0%) of districts identified as having disproportionate<br />
representation as a result of inappropriate<br />
identification in eligibility.<br />
Note: The target for Indicator 10 is to have zero<br />
percent (0%) of districts identified as having<br />
disproportionate representation as a result of<br />
inappropriate identification in a disability<br />
category.<br />
Target Met by<br />
LEA (Y/N)<br />
N/A<br />
Y<br />
Target Met<br />
by LEA<br />
(Y/N)<br />
99.21% 100.00% - - N/A<br />
Y<br />
Note: * Indicates a zero reponse rate for the<br />
district.<br />
Page 4 of 5
LEA: 6043 - <strong>ARKANSAS</strong> VIRTUAL CHARTER SCHOOL<br />
Indicator 13: Secondary Transition<br />
Percent of youth with disabilities aged 16 and<br />
up with an IEP that includes coordinated,<br />
measurable, annual IEP goals and transition<br />
services that will reasonably enable the student<br />
to meet the post-secondary goals.<br />
Indicator 14: Post-School Outcomes<br />
A. Percent of youth enrolled in higher<br />
education within one year of leaving high<br />
school.<br />
State<br />
Rate<br />
State<br />
Target<br />
Note: Data for this Indicator is from the on-site monitoring of LEAs for the given year.<br />
B. Percent of youth enrolled in higher<br />
education or competitively employed<br />
within one year of leaving high school.<br />
C. Percent of youth enrolled in higher<br />
education or in some other postsecondary<br />
education or training program; or<br />
competitively employed or in some other<br />
employment within one year of leaving<br />
high school.<br />
State<br />
Rate<br />
Indicator 20: Reported Data-Timely and Accurate*<br />
District submitted<br />
required data elements<br />
on or before due dates;<br />
made revisions within<br />
the alloted reveiw<br />
periods.<br />
Accurate and Timely<br />
Data Submission<br />
Overall (3-21)<br />
Early Childhood (3-5)<br />
School Age (5-21)<br />
State<br />
Target<br />
100.00%<br />
100.00%<br />
100.00%<br />
State<br />
Target<br />
LEA<br />
Rate<br />
LEA<br />
Rate<br />
Target Met by<br />
LEA (Y/N)<br />
Target Met<br />
by LEA<br />
(Y/N)<br />
Target Met<br />
by LEA<br />
(Y/N)<br />
*Data reviewed for timely and accurate submissions included all APSCN cycle data except for personnel<br />
Note: - - denotes not applicable<br />
96.19 100.00 — — N/A<br />
14.53<br />
State<br />
Rate<br />
49.42<br />
State<br />
Rate<br />
54.07<br />
13.00<br />
State<br />
Target<br />
49.00<br />
State<br />
Target<br />
60.00<br />
Y<br />
N/A<br />
Y<br />
— —<br />
LEA<br />
Rate<br />
— —<br />
LEA<br />
Rate<br />
— —<br />
N/A<br />
Target Met<br />
by LEA<br />
(Y/N)<br />
N/A<br />
Target Met<br />
by LEA<br />
(Y/N)<br />
N/A<br />
Page 5 of 5
<strong>ARKANSAS</strong> <strong>SPECIAL</strong> <strong>EDUCATION</strong><br />
<strong>DISTRICT</strong> <strong>ANNUAL</strong> PERFORMANCE REPORT<br />
2010/11 School Year<br />
Publication Date: March 2012<br />
Each State must have in place a State Performance Plan (SPP) to evaluate the State's efforts to meet the requirements and<br />
purposes of the implementation of the Individuals with Disabilities Education Act (IDEA). The SPP is a six-year plan, which<br />
describes Arkansas's performance on 20 indicators. The Office of Special Education Programs in the U. S. Department of<br />
Education requires that States report annually to the public on the performance of each local education agency (LEA) on 14 of<br />
20 indicators as compared with targets established by the State in the SPP. Arkansas will report indicators 1 through 14 and<br />
20 for each LEA serving children with disabilities (CWD). Any LEA not meeting targets on compliance indicators (0% for<br />
Indicators 4B, 09 & 10 and 100% for Indicators 11, 12, 13, and 20) are non-compliant with IDEA.<br />
There are no report changes for the 2010/11 school year profile; However, it is important to recognize that: .<br />
1. Indicator 01 (Graduation) is reported a year in arrear (2009/10 graduates) and is based on a four-year cohort. This<br />
means the rate is a measure of students who entered in ninth grade and graduate in four years. The calculation is a<br />
requirement under Title I of the Elementary and Secondary Education Act (ESEA).<br />
2. Indicator 02 (Drop out) is reported a year in arrear. This means the rate is a measure of students who dropped out in<br />
the 2009/10 school year. The Indicator 02 data are aligned with the Common Core of Data (CCD) requirements for<br />
grades 7-12.<br />
3. Indicator 04A and 4B (Suspension/Expulsion) is reported a year in arrear. This means the rate is a measure of<br />
students who had out-of-school suspensions and/or expulsions totaling more than 10 days.<br />
For a complete description of all the Indicators, please visit the special education website at<br />
http://arksped.k12.ar.us/sections/policy.html<br />
LEA: 6044 - COVENANT KEEPERS CHARTER SCHOOL<br />
Indicator 01: Graduation Rates (2009/10 school year) Indicator 02: Dropout Rates (2009/10 school year)<br />
Percent of youth<br />
with IEPs<br />
graduating from<br />
high school with a<br />
regular diploma<br />
State<br />
Rate<br />
State<br />
Target<br />
75.76% 85.00%<br />
LEA<br />
Rate<br />
— —<br />
Target Met<br />
by LEA<br />
(Y/N)<br />
NA<br />
Percent of<br />
youth with<br />
IEPs dropping<br />
out of high<br />
school<br />
State<br />
Rate<br />
Indicator 03: Assessment on Statewide Benchmark Exam (grades 3-8, 11)<br />
A) Adequate Yearly Progress<br />
n=40<br />
Literacy<br />
Mathematics<br />
Met Disability Subgroup "n"<br />
for Reporting Purposes (Y/N)<br />
State Target for % of Districts Meeting<br />
AYP for Disability Subgroup<br />
State<br />
Target<br />
3.06% 4.20%<br />
LEA<br />
Rate<br />
— —<br />
% of Districts Meeting AYP<br />
for Disability Subgroup<br />
Target Met by<br />
LEA (Y/N)<br />
N/A<br />
Target Met by<br />
LEA(Y/N)<br />
Overall N 17.15% 6.25%<br />
NA<br />
N<br />
N<br />
Note: For a district to qualify as having a disability subgroup it must have a minimum of 40 (n=40) students with disabilities in a school building.<br />
B) Participation<br />
Participation Rate: # of<br />
CWD Tested ÷ # of CWD<br />
Enrolled in grades tested.<br />
Participation Rate: Literacy<br />
Participation Rate: Math<br />
Note: - - denotes not applicable<br />
State<br />
Rate<br />
98.78%<br />
State<br />
Target<br />
95.00%<br />
LEA<br />
Rate<br />
100.00%<br />
Target Met<br />
by LEA (Y/N)<br />
98.61% 95.00% 100.00% Y<br />
Y<br />
C) Performance Proficiency<br />
Percent of CWD Scoring<br />
Proficient or Above<br />
Proficiency Rate: Literacy<br />
Proficiency Rate:<br />
Mathematics<br />
16.00%<br />
16.00%<br />
State<br />
Rate<br />
31.49%<br />
44.86%<br />
State<br />
Target<br />
45.22%<br />
51.14%<br />
LEA<br />
Rate<br />
0.00%<br />
0.00%<br />
NA<br />
NA<br />
Target<br />
Met by<br />
LEA (Y/N)<br />
N<br />
N<br />
Page 1 of 5
LEA: 6044 - COVENANT KEEPERS CHARTER SCHOOL<br />
Indicator 04: Out-of-School Suspensions and Expulsions (2009/10 school year)<br />
A) Suspension/Expulsion<br />
Percent difference of CWD with out-of- school suspensions and<br />
expulsions totaling greater than 10 days in a school year as<br />
compared to the same data for general education students in<br />
the district.<br />
B) Suspension/Expulsion by Race and Ethnicity<br />
Percent of districts that have: (a) a significant discrepancy, by race or<br />
ethnicity, in the rate of suspensions and expulsions of greater than 10<br />
days in a school year for children with IEPs; and (b) policies,<br />
procedures or practices that contribute to the significant discrepancy<br />
and do not comply with requirements relating to the development<br />
and implementation of IEPs, the use of positive behavioral<br />
interventions and supports, and procedural safeguards.<br />
Indicator 05: School Age (5-21) Least Restrictive Environment<br />
A) In the Regular Class 80% or more of the day<br />
Percent of CWD with<br />
IEPs receiving instruction<br />
in the regular class 80%<br />
or more of the day.<br />
State<br />
Rate<br />
State<br />
Target<br />
LEA<br />
Rate<br />
B) In the Regular Class less than 40% of the day<br />
Percent of CWD with<br />
IEPs receiving instruction<br />
in the regular class less<br />
than 60% of the day.<br />
53.87% 59.77%<br />
State<br />
Rate<br />
State<br />
Target<br />
12.42% 12.51%<br />
75.00%<br />
LEA<br />
Rate<br />
8.33%<br />
C) Other Settings outside the regular class<br />
Percent of CWD with IEPs served in<br />
public or private separate schools,<br />
residential placements, or<br />
homebound/hospital placements.<br />
State<br />
Rate<br />
State<br />
Target<br />
2.80% 2.56%<br />
Target Met<br />
by LEA (Y/N)<br />
Y<br />
Target Met<br />
by LEA (Y/N)<br />
Y<br />
LEA<br />
Rate<br />
0.00%<br />
Target Met<br />
by LEA(Y/N)<br />
Indicator 06: Early Childhood (3-5) Least Restrictive Environment<br />
A) Regular Early Childhood Program<br />
Percent of children (aged 3 through 5) with IEPs attending a regular<br />
early childhood program and receiving the majority of special<br />
education and related services in the regular early childhood program<br />
Allowable<br />
Difference<br />
LEA: 6044 - COVENANT KEEPERS CHARTER SCHOOL<br />
Indicator 07: Preschool (3-5) Outcomes<br />
a) Percent of preschool CWD<br />
children who did not<br />
improve functioning.<br />
b) Percent of preschool CWD<br />
who improved but whose<br />
functioning remained below<br />
same age peers.<br />
c) Percent of preschool CWD<br />
who improved at a level<br />
nearer to same aged peers.<br />
d) Percent of preschool CWD<br />
who improved functioning to<br />
reach a level comparable to<br />
same age peers.<br />
e) Percent of preschool CWD<br />
children who maintain<br />
functioning at a level<br />
comparable to same aged<br />
peers.<br />
Summary<br />
Statements<br />
1) Of those preschool<br />
children who entered<br />
the preschool program<br />
below age expectations<br />
in each Outcome, the<br />
percent who<br />
substantially increased<br />
their rate of growth by<br />
the time they turned 6<br />
years of age or exited<br />
the program.<br />
2) The percent of<br />
preschool children who<br />
were functioning<br />
within age expectations<br />
in each Outcome by the<br />
time they turned 6<br />
years of age or exited<br />
A) Positive Social -Emotional<br />
Skills*<br />
State<br />
Rate<br />
A) Positive Social -<br />
Emotional Skills<br />
(Including social<br />
relationships)<br />
State<br />
Rate<br />
2.14%<br />
5.31%<br />
25.97%<br />
38.22%<br />
28.36%<br />
State<br />
Target<br />
LEA<br />
Rate<br />
LEA<br />
Rate<br />
— —<br />
— —<br />
— —<br />
— —<br />
— —<br />
Target<br />
Met by<br />
LEA(Y/N)<br />
B) Acquisition and Use of<br />
Knowledge and Skills<br />
(Including early language/<br />
communication and early literacy)<br />
B) Acquisition and Use of<br />
Knowledge and Skills **<br />
State<br />
Rate<br />
1.75%<br />
6.59%<br />
34.23%<br />
43.51%<br />
13.92%<br />
State<br />
Target<br />
LEA<br />
Rate<br />
Target<br />
Met by<br />
LEA(Y/N)<br />
C) Use of Appropriate Behaviors<br />
to Meet Their Needs<br />
State<br />
Rate<br />
State<br />
Target<br />
LEA<br />
Rate<br />
Target<br />
Met by<br />
LEA(Y/N)<br />
89.61% 90.50% — — N/A 90.31% 90.50% — — N/A 90.82% 92.50% — — N/A<br />
66.58% 69.50% — — N/A 57.43% 60.50% — — N/A 76.69% 78.50% — — N/A<br />
NOTE: * Including social relationships ** Including early language/ communication and early literacy<br />
Note: - - denotes not applicable<br />
State<br />
Rate<br />
LEA<br />
Rate<br />
— —<br />
— —<br />
— —<br />
— —<br />
— —<br />
C) Use of<br />
Appropriate<br />
Behaviors to<br />
Meet Their Needs<br />
State<br />
Rate<br />
4.51%<br />
17.34%<br />
41.72%<br />
34.97%<br />
LEA<br />
Rate<br />
1.46% — —<br />
— —<br />
— —<br />
— —<br />
— —<br />
Page 3 of 5
LEA: 6044 - COVENANT KEEPERS CHARTER SCHOOL<br />
Indicator 08: Parent Involvement<br />
Percent of surveyed<br />
parents who reported<br />
school facilitated parent<br />
involvement as a means<br />
of improving services<br />
and results for children<br />
with disabilities.<br />
Early Childhood<br />
(3-5)<br />
School Age<br />
(5-21)<br />
State<br />
Rate<br />
90.47%<br />
95.05%<br />
Indicator 09: Disproportionality - Eligibility<br />
Disproportionate representation of racial<br />
and ethnic groups in special education and<br />
related services that is a result of<br />
inappropriate identification (e.g.<br />
monitoring data, review of policies,<br />
practices, and procedures under 618(d),<br />
etc.).<br />
State<br />
Rate<br />
State<br />
Target<br />
88.00%<br />
96.00%<br />
State<br />
Target<br />
0.00% 0.00%<br />
LEA<br />
Rate<br />
— —<br />
— —<br />
Indicator 10: Disproportionality-Child with a Disability<br />
Disproportionate representation of racial<br />
and ethnic groups in specific disability<br />
categories that is a result of inappropriate<br />
identification (e.g. monitoring data, review<br />
of policies, practices, and procedures under<br />
618(d), etc.).<br />
Indicator 11: Child Find<br />
Percent of children with<br />
parental consent to evaluate<br />
who are evaluated within<br />
the State established timeline<br />
of 60 days.<br />
Overall<br />
(3-21)<br />
Early Childhood<br />
(3-5)<br />
School Age<br />
(5-21)<br />
State<br />
Rate<br />
0.00%<br />
Indicator 12: Early Childhood Transition<br />
Percent of children referred by Part C prior to<br />
age 3, who are found eligible for Part B, and<br />
who have an IEP developed and implemented<br />
by their third birthday.<br />
Note: - - denotes not applicable<br />
State<br />
Rate<br />
99.41%<br />
99.70%<br />
98.97%<br />
State<br />
Rate<br />
State<br />
Target<br />
0.00%<br />
State<br />
Target<br />
100.00%<br />
100.00%<br />
100.00%<br />
State<br />
Target<br />
Target Met by<br />
LEA (Y/N)<br />
Y<br />
Target Met by<br />
LEA (Y/N)<br />
Y<br />
LEA<br />
Rate<br />
100.00%<br />
— —<br />
100.00%<br />
LEA<br />
Rate<br />
Target Met by<br />
LEA (Y/N)<br />
N/A<br />
N<br />
Note: The target for Indicator 09 is to have zero percent<br />
(0%) of districts identified as having disproportionate<br />
representation as a result of inappropriate<br />
identification in eligibility.<br />
Note: The target for Indicator 10 is to have zero<br />
percent (0%) of districts identified as having<br />
disproportionate representation as a result of<br />
inappropriate identification in a disability<br />
category.<br />
Target Met by<br />
LEA (Y/N)<br />
N/A<br />
Y<br />
Target Met<br />
by LEA<br />
(Y/N)<br />
99.21% 100.00% - - N/A<br />
Y<br />
Note: * Indicates a zero reponse rate for the<br />
district.<br />
Page 4 of 5
LEA: 6044 - COVENANT KEEPERS CHARTER SCHOOL<br />
Indicator 13: Secondary Transition<br />
Percent of youth with disabilities aged 16 and<br />
up with an IEP that includes coordinated,<br />
measurable, annual IEP goals and transition<br />
services that will reasonably enable the student<br />
to meet the post-secondary goals.<br />
Indicator 14: Post-School Outcomes<br />
A. Percent of youth enrolled in higher<br />
education within one year of leaving high<br />
school.<br />
State<br />
Rate<br />
State<br />
Target<br />
Note: Data for this Indicator is from the on-site monitoring of LEAs for the given year.<br />
B. Percent of youth enrolled in higher<br />
education or competitively employed<br />
within one year of leaving high school.<br />
C. Percent of youth enrolled in higher<br />
education or in some other postsecondary<br />
education or training program; or<br />
competitively employed or in some other<br />
employment within one year of leaving<br />
high school.<br />
State<br />
Rate<br />
Indicator 20: Reported Data-Timely and Accurate*<br />
District submitted<br />
required data elements<br />
on or before due dates;<br />
made revisions within<br />
the alloted reveiw<br />
periods.<br />
Accurate and Timely<br />
Data Submission<br />
Overall (3-21)<br />
Early Childhood (3-5)<br />
School Age (5-21)<br />
State<br />
Target<br />
100.00%<br />
100.00%<br />
100.00%<br />
State<br />
Target<br />
LEA<br />
Rate<br />
LEA<br />
Rate<br />
Target Met by<br />
LEA (Y/N)<br />
Target Met<br />
by LEA<br />
(Y/N)<br />
Target Met<br />
by LEA<br />
(Y/N)<br />
*Data reviewed for timely and accurate submissions included all APSCN cycle data except for personnel<br />
Note: - - denotes not applicable<br />
96.19 100.00 — — N/A<br />
14.53<br />
State<br />
Rate<br />
49.42<br />
State<br />
Rate<br />
54.07<br />
13.00<br />
State<br />
Target<br />
49.00<br />
State<br />
Target<br />
60.00<br />
Y<br />
N/A<br />
Y<br />
— —<br />
LEA<br />
Rate<br />
— —<br />
LEA<br />
Rate<br />
— —<br />
N/A<br />
Target Met<br />
by LEA<br />
(Y/N)<br />
N/A<br />
Target Met<br />
by LEA<br />
(Y/N)<br />
N/A<br />
Page 5 of 5
<strong>ARKANSAS</strong> <strong>SPECIAL</strong> <strong>EDUCATION</strong><br />
<strong>DISTRICT</strong> <strong>ANNUAL</strong> PERFORMANCE REPORT<br />
2010/11 School Year<br />
Publication Date: March 2012<br />
Each State must have in place a State Performance Plan (SPP) to evaluate the State's efforts to meet the requirements and<br />
purposes of the implementation of the Individuals with Disabilities Education Act (IDEA). The SPP is a six-year plan, which<br />
describes Arkansas's performance on 20 indicators. The Office of Special Education Programs in the U. S. Department of<br />
Education requires that States report annually to the public on the performance of each local education agency (LEA) on 14 of<br />
20 indicators as compared with targets established by the State in the SPP. Arkansas will report indicators 1 through 14 and<br />
20 for each LEA serving children with disabilities (CWD). Any LEA not meeting targets on compliance indicators (0% for<br />
Indicators 4B, 09 & 10 and 100% for Indicators 11, 12, 13, and 20) are non-compliant with IDEA.<br />
There are no report changes for the 2010/11 school year profile; However, it is important to recognize that: .<br />
1. Indicator 01 (Graduation) is reported a year in arrear (2009/10 graduates) and is based on a four-year cohort. This<br />
means the rate is a measure of students who entered in ninth grade and graduate in four years. The calculation is a<br />
requirement under Title I of the Elementary and Secondary Education Act (ESEA).<br />
2. Indicator 02 (Drop out) is reported a year in arrear. This means the rate is a measure of students who dropped out in<br />
the 2009/10 school year. The Indicator 02 data are aligned with the Common Core of Data (CCD) requirements for<br />
grades 7-12.<br />
3. Indicator 04A and 4B (Suspension/Expulsion) is reported a year in arrear. This means the rate is a measure of<br />
students who had out-of-school suspensions and/or expulsions totaling more than 10 days.<br />
For a complete description of all the Indicators, please visit the special education website at<br />
http://arksped.k12.ar.us/sections/policy.html<br />
LEA: 6045 - eSTEM ELEMENTARY CHARTER SCHOOL<br />
Indicator 01: Graduation Rates (2009/10 school year) Indicator 02: Dropout Rates (2009/10 school year)<br />
Percent of youth<br />
with IEPs<br />
graduating from<br />
high school with a<br />
regular diploma<br />
State<br />
Rate<br />
State<br />
Target<br />
75.76% 85.00%<br />
LEA<br />
Rate<br />
— —<br />
Target Met<br />
by LEA<br />
(Y/N)<br />
NA<br />
Percent of<br />
youth with<br />
IEPs dropping<br />
out of high<br />
school<br />
State<br />
Rate<br />
Indicator 03: Assessment on Statewide Benchmark Exam (grades 3-8, 11)<br />
A) Adequate Yearly Progress<br />
n=40<br />
Literacy<br />
Mathematics<br />
Met Disability Subgroup "n"<br />
for Reporting Purposes (Y/N)<br />
State Target for % of Districts Meeting<br />
AYP for Disability Subgroup<br />
State<br />
Target<br />
3.06% 4.20%<br />
LEA<br />
Rate<br />
— —<br />
% of Districts Meeting AYP<br />
for Disability Subgroup<br />
Target Met by<br />
LEA (Y/N)<br />
N/A<br />
Target Met by<br />
LEA(Y/N)<br />
Overall N 17.15% 6.25%<br />
NA<br />
N<br />
N<br />
Note: For a district to qualify as having a disability subgroup it must have a minimum of 40 (n=40) students with disabilities in a school building.<br />
B) Participation<br />
Participation Rate: # of<br />
CWD Tested ÷ # of CWD<br />
Enrolled in grades tested.<br />
Participation Rate: Literacy<br />
Participation Rate: Math<br />
Note: - - denotes not applicable<br />
State<br />
Rate<br />
98.78%<br />
State<br />
Target<br />
95.00%<br />
LEA<br />
Rate<br />
100.00%<br />
Target Met<br />
by LEA (Y/N)<br />
98.61% 95.00% 100.00% Y<br />
Y<br />
C) Performance Proficiency<br />
Percent of CWD Scoring<br />
Proficient or Above<br />
Proficiency Rate: Literacy<br />
Proficiency Rate:<br />
Mathematics<br />
16.00%<br />
16.00%<br />
State<br />
Rate<br />
31.49%<br />
44.86%<br />
State<br />
Target<br />
45.22%<br />
51.14%<br />
LEA<br />
Rate<br />
54.55%<br />
63.64%<br />
NA<br />
NA<br />
Target<br />
Met by<br />
LEA (Y/N)<br />
Y<br />
Y<br />
Page 1 of 5
LEA: 6045 - eSTEM ELEMENTARY CHARTER SCHOOL<br />
Indicator 04: Out-of-School Suspensions and Expulsions (2009/10 school year)<br />
A) Suspension/Expulsion<br />
Percent difference of CWD with out-of- school suspensions and<br />
expulsions totaling greater than 10 days in a school year as<br />
compared to the same data for general education students in<br />
the district.<br />
B) Suspension/Expulsion by Race and Ethnicity<br />
Percent of districts that have: (a) a significant discrepancy, by race or<br />
ethnicity, in the rate of suspensions and expulsions of greater than 10<br />
days in a school year for children with IEPs; and (b) policies,<br />
procedures or practices that contribute to the significant discrepancy<br />
and do not comply with requirements relating to the development<br />
and implementation of IEPs, the use of positive behavioral<br />
interventions and supports, and procedural safeguards.<br />
Indicator 05: School Age (5-21) Least Restrictive Environment<br />
A) In the Regular Class 80% or more of the day<br />
Percent of CWD with<br />
IEPs receiving instruction<br />
in the regular class 80%<br />
or more of the day.<br />
State<br />
Rate<br />
State<br />
Target<br />
LEA<br />
Rate<br />
B) In the Regular Class less than 40% of the day<br />
Percent of CWD with<br />
IEPs receiving instruction<br />
in the regular class less<br />
than 60% of the day.<br />
53.87% 59.77%<br />
State<br />
Rate<br />
State<br />
Target<br />
12.42% 12.51%<br />
100.00%<br />
LEA<br />
Rate<br />
0.00%<br />
C) Other Settings outside the regular class<br />
Percent of CWD with IEPs served in<br />
public or private separate schools,<br />
residential placements, or<br />
homebound/hospital placements.<br />
State<br />
Rate<br />
State<br />
Target<br />
2.80% 2.56%<br />
Target Met<br />
by LEA (Y/N)<br />
Y<br />
Target Met<br />
by LEA (Y/N)<br />
Y<br />
LEA<br />
Rate<br />
0.00%<br />
Target Met<br />
by LEA(Y/N)<br />
Indicator 06: Early Childhood (3-5) Least Restrictive Environment<br />
A) Regular Early Childhood Program<br />
Percent of children (aged 3 through 5) with IEPs attending a regular<br />
early childhood program and receiving the majority of special<br />
education and related services in the regular early childhood program<br />
Allowable<br />
Difference<br />
LEA: 6045 - eSTEM ELEMENTARY CHARTER SCHOOL<br />
Indicator 07: Preschool (3-5) Outcomes<br />
a) Percent of preschool CWD<br />
children who did not<br />
improve functioning.<br />
b) Percent of preschool CWD<br />
who improved but whose<br />
functioning remained below<br />
same age peers.<br />
c) Percent of preschool CWD<br />
who improved at a level<br />
nearer to same aged peers.<br />
d) Percent of preschool CWD<br />
who improved functioning to<br />
reach a level comparable to<br />
same age peers.<br />
e) Percent of preschool CWD<br />
children who maintain<br />
functioning at a level<br />
comparable to same aged<br />
peers.<br />
Summary<br />
Statements<br />
1) Of those preschool<br />
children who entered<br />
the preschool program<br />
below age expectations<br />
in each Outcome, the<br />
percent who<br />
substantially increased<br />
their rate of growth by<br />
the time they turned 6<br />
years of age or exited<br />
the program.<br />
2) The percent of<br />
preschool children who<br />
were functioning<br />
within age expectations<br />
in each Outcome by the<br />
time they turned 6<br />
years of age or exited<br />
A) Positive Social -Emotional<br />
Skills*<br />
State<br />
Rate<br />
A) Positive Social -<br />
Emotional Skills<br />
(Including social<br />
relationships)<br />
State<br />
Rate<br />
2.14%<br />
5.31%<br />
25.97%<br />
38.22%<br />
28.36%<br />
State<br />
Target<br />
LEA<br />
Rate<br />
LEA<br />
Rate<br />
— —<br />
— —<br />
— —<br />
— —<br />
— —<br />
Target<br />
Met by<br />
LEA(Y/N)<br />
B) Acquisition and Use of<br />
Knowledge and Skills<br />
(Including early language/<br />
communication and early literacy)<br />
B) Acquisition and Use of<br />
Knowledge and Skills **<br />
State<br />
Rate<br />
1.75%<br />
6.59%<br />
34.23%<br />
43.51%<br />
13.92%<br />
State<br />
Target<br />
LEA<br />
Rate<br />
Target<br />
Met by<br />
LEA(Y/N)<br />
C) Use of Appropriate Behaviors<br />
to Meet Their Needs<br />
State<br />
Rate<br />
State<br />
Target<br />
LEA<br />
Rate<br />
Target<br />
Met by<br />
LEA(Y/N)<br />
89.61% 90.50% — — N/A 90.31% 90.50% — — N/A 90.82% 92.50% — — N/A<br />
66.58% 69.50% — — N/A 57.43% 60.50% — — N/A 76.69% 78.50% — — N/A<br />
NOTE: * Including social relationships ** Including early language/ communication and early literacy<br />
Note: - - denotes not applicable<br />
State<br />
Rate<br />
LEA<br />
Rate<br />
— —<br />
— —<br />
— —<br />
— —<br />
— —<br />
C) Use of<br />
Appropriate<br />
Behaviors to<br />
Meet Their Needs<br />
State<br />
Rate<br />
4.51%<br />
17.34%<br />
41.72%<br />
34.97%<br />
LEA<br />
Rate<br />
1.46% — —<br />
— —<br />
— —<br />
— —<br />
— —<br />
Page 3 of 5
LEA: 6045 - eSTEM ELEMENTARY CHARTER SCHOOL<br />
Indicator 08: Parent Involvement<br />
Percent of surveyed<br />
parents who reported<br />
school facilitated parent<br />
involvement as a means<br />
of improving services<br />
and results for children<br />
with disabilities.<br />
Early Childhood<br />
(3-5)<br />
School Age<br />
(5-21)<br />
State<br />
Rate<br />
90.47%<br />
95.05%<br />
Indicator 09: Disproportionality - Eligibility<br />
Disproportionate representation of racial<br />
and ethnic groups in special education and<br />
related services that is a result of<br />
inappropriate identification (e.g.<br />
monitoring data, review of policies,<br />
practices, and procedures under 618(d),<br />
etc.).<br />
State<br />
Rate<br />
State<br />
Target<br />
88.00%<br />
96.00%<br />
State<br />
Target<br />
0.00% 0.00%<br />
LEA<br />
Rate<br />
— —<br />
— —<br />
Indicator 10: Disproportionality-Child with a Disability<br />
Disproportionate representation of racial<br />
and ethnic groups in specific disability<br />
categories that is a result of inappropriate<br />
identification (e.g. monitoring data, review<br />
of policies, practices, and procedures under<br />
618(d), etc.).<br />
Indicator 11: Child Find<br />
Percent of children with<br />
parental consent to evaluate<br />
who are evaluated within<br />
the State established timeline<br />
of 60 days.<br />
Overall<br />
(3-21)<br />
Early Childhood<br />
(3-5)<br />
School Age<br />
(5-21)<br />
State<br />
Rate<br />
0.00%<br />
Indicator 12: Early Childhood Transition<br />
Percent of children referred by Part C prior to<br />
age 3, who are found eligible for Part B, and<br />
who have an IEP developed and implemented<br />
by their third birthday.<br />
Note: - - denotes not applicable<br />
State<br />
Rate<br />
99.41%<br />
99.70%<br />
98.97%<br />
State<br />
Rate<br />
State<br />
Target<br />
0.00%<br />
State<br />
Target<br />
100.00%<br />
100.00%<br />
100.00%<br />
State<br />
Target<br />
Target Met by<br />
LEA (Y/N)<br />
Y<br />
Target Met by<br />
LEA (Y/N)<br />
Y<br />
LEA<br />
Rate<br />
100.00%<br />
— —<br />
100.00%<br />
LEA<br />
Rate<br />
Target Met by<br />
LEA (Y/N)<br />
N/A<br />
N<br />
Note: The target for Indicator 09 is to have zero percent<br />
(0%) of districts identified as having disproportionate<br />
representation as a result of inappropriate<br />
identification in eligibility.<br />
Note: The target for Indicator 10 is to have zero<br />
percent (0%) of districts identified as having<br />
disproportionate representation as a result of<br />
inappropriate identification in a disability<br />
category.<br />
Target Met by<br />
LEA (Y/N)<br />
N/A<br />
Y<br />
Target Met<br />
by LEA<br />
(Y/N)<br />
99.21% 100.00% - - N/A<br />
Y<br />
Note: * Indicates a zero reponse rate for the<br />
district.<br />
Page 4 of 5
LEA: 6045 - eSTEM ELEMENTARY CHARTER SCHOOL<br />
Indicator 13: Secondary Transition<br />
Percent of youth with disabilities aged 16 and<br />
up with an IEP that includes coordinated,<br />
measurable, annual IEP goals and transition<br />
services that will reasonably enable the student<br />
to meet the post-secondary goals.<br />
Indicator 14: Post-School Outcomes<br />
A. Percent of youth enrolled in higher<br />
education within one year of leaving high<br />
school.<br />
State<br />
Rate<br />
State<br />
Target<br />
Note: Data for this Indicator is from the on-site monitoring of LEAs for the given year.<br />
B. Percent of youth enrolled in higher<br />
education or competitively employed<br />
within one year of leaving high school.<br />
C. Percent of youth enrolled in higher<br />
education or in some other postsecondary<br />
education or training program; or<br />
competitively employed or in some other<br />
employment within one year of leaving<br />
high school.<br />
State<br />
Rate<br />
Indicator 20: Reported Data-Timely and Accurate*<br />
District submitted<br />
required data elements<br />
on or before due dates;<br />
made revisions within<br />
the alloted reveiw<br />
periods.<br />
Accurate and Timely<br />
Data Submission<br />
Overall (3-21)<br />
Early Childhood (3-5)<br />
School Age (5-21)<br />
State<br />
Target<br />
100.00%<br />
100.00%<br />
100.00%<br />
State<br />
Target<br />
LEA<br />
Rate<br />
LEA<br />
Rate<br />
Target Met by<br />
LEA (Y/N)<br />
Target Met<br />
by LEA<br />
(Y/N)<br />
Target Met<br />
by LEA<br />
(Y/N)<br />
*Data reviewed for timely and accurate submissions included all APSCN cycle data except for personnel<br />
Note: - - denotes not applicable<br />
96.19 100.00 — — N/A<br />
14.53<br />
State<br />
Rate<br />
49.42<br />
State<br />
Rate<br />
54.07<br />
13.00<br />
State<br />
Target<br />
49.00<br />
State<br />
Target<br />
60.00<br />
Y<br />
N/A<br />
Y<br />
— —<br />
LEA<br />
Rate<br />
— —<br />
LEA<br />
Rate<br />
— —<br />
N/A<br />
Target Met<br />
by LEA<br />
(Y/N)<br />
N/A<br />
Target Met<br />
by LEA<br />
(Y/N)<br />
N/A<br />
Page 5 of 5
<strong>ARKANSAS</strong> <strong>SPECIAL</strong> <strong>EDUCATION</strong><br />
<strong>DISTRICT</strong> <strong>ANNUAL</strong> PERFORMANCE REPORT<br />
2010/11 School Year<br />
Publication Date: March 2012<br />
Each State must have in place a State Performance Plan (SPP) to evaluate the State's efforts to meet the requirements and<br />
purposes of the implementation of the Individuals with Disabilities Education Act (IDEA). The SPP is a six-year plan, which<br />
describes Arkansas's performance on 20 indicators. The Office of Special Education Programs in the U. S. Department of<br />
Education requires that States report annually to the public on the performance of each local education agency (LEA) on 14 of<br />
20 indicators as compared with targets established by the State in the SPP. Arkansas will report indicators 1 through 14 and<br />
20 for each LEA serving children with disabilities (CWD). Any LEA not meeting targets on compliance indicators (0% for<br />
Indicators 4B, 09 & 10 and 100% for Indicators 11, 12, 13, and 20) are non-compliant with IDEA.<br />
There are no report changes for the 2010/11 school year profile; However, it is important to recognize that: .<br />
1. Indicator 01 (Graduation) is reported a year in arrear (2009/10 graduates) and is based on a four-year cohort. This<br />
means the rate is a measure of students who entered in ninth grade and graduate in four years. The calculation is a<br />
requirement under Title I of the Elementary and Secondary Education Act (ESEA).<br />
2. Indicator 02 (Drop out) is reported a year in arrear. This means the rate is a measure of students who dropped out in<br />
the 2009/10 school year. The Indicator 02 data are aligned with the Common Core of Data (CCD) requirements for<br />
grades 7-12.<br />
3. Indicator 04A and 4B (Suspension/Expulsion) is reported a year in arrear. This means the rate is a measure of<br />
students who had out-of-school suspensions and/or expulsions totaling more than 10 days.<br />
For a complete description of all the Indicators, please visit the special education website at<br />
http://arksped.k12.ar.us/sections/policy.html<br />
LEA: 6046 - eSTEM MIDDLE CHARTER SCHOOL<br />
Indicator 01: Graduation Rates (2009/10 school year) Indicator 02: Dropout Rates (2009/10 school year)<br />
Percent of youth<br />
with IEPs<br />
graduating from<br />
high school with a<br />
regular diploma<br />
State<br />
Rate<br />
State<br />
Target<br />
75.76% 85.00%<br />
LEA<br />
Rate<br />
— —<br />
Target Met<br />
by LEA<br />
(Y/N)<br />
NA<br />
Percent of<br />
youth with<br />
IEPs dropping<br />
out of high<br />
school<br />
State<br />
Rate<br />
Indicator 03: Assessment on Statewide Benchmark Exam (grades 3-8, 11)<br />
A) Adequate Yearly Progress<br />
n=40<br />
Literacy<br />
Mathematics<br />
Met Disability Subgroup "n"<br />
for Reporting Purposes (Y/N)<br />
State Target for % of Districts Meeting<br />
AYP for Disability Subgroup<br />
State<br />
Target<br />
3.06% 4.20%<br />
LEA<br />
Rate<br />
0.00%<br />
% of Districts Meeting AYP<br />
for Disability Subgroup<br />
Target Met by<br />
LEA (Y/N)<br />
Y<br />
Target Met by<br />
LEA(Y/N)<br />
Overall N 17.15% 6.25%<br />
NA<br />
N<br />
N<br />
Note: For a district to qualify as having a disability subgroup it must have a minimum of 40 (n=40) students with disabilities in a school building.<br />
B) Participation<br />
Participation Rate: # of<br />
CWD Tested ÷ # of CWD<br />
Enrolled in grades tested.<br />
Participation Rate: Literacy<br />
Participation Rate: Math<br />
Note: - - denotes not applicable<br />
State<br />
Rate<br />
98.78%<br />
State<br />
Target<br />
95.00%<br />
LEA<br />
Rate<br />
100.00%<br />
Target Met<br />
by LEA (Y/N)<br />
98.61% 95.00% 100.00% Y<br />
Y<br />
C) Performance Proficiency<br />
Percent of CWD Scoring<br />
Proficient or Above<br />
Proficiency Rate: Literacy<br />
Proficiency Rate:<br />
Mathematics<br />
16.00%<br />
16.00%<br />
State<br />
Rate<br />
31.49%<br />
44.86%<br />
State<br />
Target<br />
45.22%<br />
51.14%<br />
LEA<br />
Rate<br />
15.79%<br />
33.33%<br />
NA<br />
NA<br />
Target<br />
Met by<br />
LEA (Y/N)<br />
N<br />
N<br />
Page 1 of 5
LEA: 6046 - eSTEM MIDDLE CHARTER SCHOOL<br />
Indicator 04: Out-of-School Suspensions and Expulsions (2009/10 school year)<br />
A) Suspension/Expulsion<br />
Percent difference of CWD with out-of- school suspensions and<br />
expulsions totaling greater than 10 days in a school year as<br />
compared to the same data for general education students in<br />
the district.<br />
B) Suspension/Expulsion by Race and Ethnicity<br />
Percent of districts that have: (a) a significant discrepancy, by race or<br />
ethnicity, in the rate of suspensions and expulsions of greater than 10<br />
days in a school year for children with IEPs; and (b) policies,<br />
procedures or practices that contribute to the significant discrepancy<br />
and do not comply with requirements relating to the development<br />
and implementation of IEPs, the use of positive behavioral<br />
interventions and supports, and procedural safeguards.<br />
Indicator 05: School Age (5-21) Least Restrictive Environment<br />
A) In the Regular Class 80% or more of the day<br />
Percent of CWD with<br />
IEPs receiving instruction<br />
in the regular class 80%<br />
or more of the day.<br />
State<br />
Rate<br />
State<br />
Target<br />
LEA<br />
Rate<br />
B) In the Regular Class less than 40% of the day<br />
Percent of CWD with<br />
IEPs receiving instruction<br />
in the regular class less<br />
than 60% of the day.<br />
53.87% 59.77%<br />
State<br />
Rate<br />
State<br />
Target<br />
12.42% 12.51%<br />
100.00%<br />
LEA<br />
Rate<br />
0.00%<br />
C) Other Settings outside the regular class<br />
Percent of CWD with IEPs served in<br />
public or private separate schools,<br />
residential placements, or<br />
homebound/hospital placements.<br />
State<br />
Rate<br />
State<br />
Target<br />
2.80% 2.56%<br />
Target Met<br />
by LEA (Y/N)<br />
Y<br />
Target Met<br />
by LEA (Y/N)<br />
Y<br />
LEA<br />
Rate<br />
0.00%<br />
Target Met<br />
by LEA(Y/N)<br />
Indicator 06: Early Childhood (3-5) Least Restrictive Environment<br />
A) Regular Early Childhood Program<br />
Percent of children (aged 3 through 5) with IEPs attending a regular<br />
early childhood program and receiving the majority of special<br />
education and related services in the regular early childhood program<br />
Allowable<br />
Difference<br />
LEA: 6046 - eSTEM MIDDLE CHARTER SCHOOL<br />
Indicator 07: Preschool (3-5) Outcomes<br />
a) Percent of preschool CWD<br />
children who did not<br />
improve functioning.<br />
b) Percent of preschool CWD<br />
who improved but whose<br />
functioning remained below<br />
same age peers.<br />
c) Percent of preschool CWD<br />
who improved at a level<br />
nearer to same aged peers.<br />
d) Percent of preschool CWD<br />
who improved functioning to<br />
reach a level comparable to<br />
same age peers.<br />
e) Percent of preschool CWD<br />
children who maintain<br />
functioning at a level<br />
comparable to same aged<br />
peers.<br />
Summary<br />
Statements<br />
1) Of those preschool<br />
children who entered<br />
the preschool program<br />
below age expectations<br />
in each Outcome, the<br />
percent who<br />
substantially increased<br />
their rate of growth by<br />
the time they turned 6<br />
years of age or exited<br />
the program.<br />
2) The percent of<br />
preschool children who<br />
were functioning<br />
within age expectations<br />
in each Outcome by the<br />
time they turned 6<br />
years of age or exited<br />
A) Positive Social -Emotional<br />
Skills*<br />
State<br />
Rate<br />
A) Positive Social -<br />
Emotional Skills<br />
(Including social<br />
relationships)<br />
State<br />
Rate<br />
2.14%<br />
5.31%<br />
25.97%<br />
38.22%<br />
28.36%<br />
State<br />
Target<br />
LEA<br />
Rate<br />
LEA<br />
Rate<br />
— —<br />
— —<br />
— —<br />
— —<br />
— —<br />
Target<br />
Met by<br />
LEA(Y/N)<br />
B) Acquisition and Use of<br />
Knowledge and Skills<br />
(Including early language/<br />
communication and early literacy)<br />
B) Acquisition and Use of<br />
Knowledge and Skills **<br />
State<br />
Rate<br />
1.75%<br />
6.59%<br />
34.23%<br />
43.51%<br />
13.92%<br />
State<br />
Target<br />
LEA<br />
Rate<br />
Target<br />
Met by<br />
LEA(Y/N)<br />
C) Use of Appropriate Behaviors<br />
to Meet Their Needs<br />
State<br />
Rate<br />
State<br />
Target<br />
LEA<br />
Rate<br />
Target<br />
Met by<br />
LEA(Y/N)<br />
89.61% 90.50% — — N/A 90.31% 90.50% — — N/A 90.82% 92.50% — — N/A<br />
66.58% 69.50% — — N/A 57.43% 60.50% — — N/A 76.69% 78.50% — — N/A<br />
NOTE: * Including social relationships ** Including early language/ communication and early literacy<br />
Note: - - denotes not applicable<br />
State<br />
Rate<br />
LEA<br />
Rate<br />
— —<br />
— —<br />
— —<br />
— —<br />
— —<br />
C) Use of<br />
Appropriate<br />
Behaviors to<br />
Meet Their Needs<br />
State<br />
Rate<br />
4.51%<br />
17.34%<br />
41.72%<br />
34.97%<br />
LEA<br />
Rate<br />
1.46% — —<br />
— —<br />
— —<br />
— —<br />
— —<br />
Page 3 of 5
LEA: 6046 - eSTEM MIDDLE CHARTER SCHOOL<br />
Indicator 08: Parent Involvement<br />
Percent of surveyed<br />
parents who reported<br />
school facilitated parent<br />
involvement as a means<br />
of improving services<br />
and results for children<br />
with disabilities.<br />
Early Childhood<br />
(3-5)<br />
School Age<br />
(5-21)<br />
State<br />
Rate<br />
90.47%<br />
95.05%<br />
Indicator 09: Disproportionality - Eligibility<br />
Disproportionate representation of racial<br />
and ethnic groups in special education and<br />
related services that is a result of<br />
inappropriate identification (e.g.<br />
monitoring data, review of policies,<br />
practices, and procedures under 618(d),<br />
etc.).<br />
State<br />
Rate<br />
State<br />
Target<br />
88.00%<br />
96.00%<br />
State<br />
Target<br />
0.00% 0.00%<br />
LEA<br />
Rate<br />
— —<br />
— —<br />
Indicator 10: Disproportionality-Child with a Disability<br />
Disproportionate representation of racial<br />
and ethnic groups in specific disability<br />
categories that is a result of inappropriate<br />
identification (e.g. monitoring data, review<br />
of policies, practices, and procedures under<br />
618(d), etc.).<br />
Indicator 11: Child Find<br />
Percent of children with<br />
parental consent to evaluate<br />
who are evaluated within<br />
the State established timeline<br />
of 60 days.<br />
Overall<br />
(3-21)<br />
Early Childhood<br />
(3-5)<br />
School Age<br />
(5-21)<br />
State<br />
Rate<br />
0.00%<br />
Indicator 12: Early Childhood Transition<br />
Percent of children referred by Part C prior to<br />
age 3, who are found eligible for Part B, and<br />
who have an IEP developed and implemented<br />
by their third birthday.<br />
Note: - - denotes not applicable<br />
State<br />
Rate<br />
99.41%<br />
99.70%<br />
98.97%<br />
State<br />
Rate<br />
State<br />
Target<br />
0.00%<br />
State<br />
Target<br />
100.00%<br />
100.00%<br />
100.00%<br />
State<br />
Target<br />
Target Met by<br />
LEA (Y/N)<br />
Y<br />
Target Met by<br />
LEA (Y/N)<br />
Y<br />
LEA<br />
Rate<br />
100.00%<br />
— —<br />
100.00%<br />
LEA<br />
Rate<br />
Target Met by<br />
LEA (Y/N)<br />
N/A<br />
N<br />
Note: The target for Indicator 09 is to have zero percent<br />
(0%) of districts identified as having disproportionate<br />
representation as a result of inappropriate<br />
identification in eligibility.<br />
Note: The target for Indicator 10 is to have zero<br />
percent (0%) of districts identified as having<br />
disproportionate representation as a result of<br />
inappropriate identification in a disability<br />
category.<br />
Target Met by<br />
LEA (Y/N)<br />
N/A<br />
Y<br />
Target Met<br />
by LEA<br />
(Y/N)<br />
99.21% 100.00% - - N/A<br />
Y<br />
Note: * Indicates a zero reponse rate for the<br />
district.<br />
Page 4 of 5
LEA: 6046 - eSTEM MIDDLE CHARTER SCHOOL<br />
Indicator 13: Secondary Transition<br />
Percent of youth with disabilities aged 16 and<br />
up with an IEP that includes coordinated,<br />
measurable, annual IEP goals and transition<br />
services that will reasonably enable the student<br />
to meet the post-secondary goals.<br />
Indicator 14: Post-School Outcomes<br />
A. Percent of youth enrolled in higher<br />
education within one year of leaving high<br />
school.<br />
State<br />
Rate<br />
State<br />
Target<br />
Note: Data for this Indicator is from the on-site monitoring of LEAs for the given year.<br />
B. Percent of youth enrolled in higher<br />
education or competitively employed<br />
within one year of leaving high school.<br />
C. Percent of youth enrolled in higher<br />
education or in some other postsecondary<br />
education or training program; or<br />
competitively employed or in some other<br />
employment within one year of leaving<br />
high school.<br />
State<br />
Rate<br />
Indicator 20: Reported Data-Timely and Accurate*<br />
District submitted<br />
required data elements<br />
on or before due dates;<br />
made revisions within<br />
the alloted reveiw<br />
periods.<br />
Accurate and Timely<br />
Data Submission<br />
Overall (3-21)<br />
Early Childhood (3-5)<br />
School Age (5-21)<br />
State<br />
Target<br />
100.00%<br />
100.00%<br />
100.00%<br />
State<br />
Target<br />
LEA<br />
Rate<br />
LEA<br />
Rate<br />
Target Met by<br />
LEA (Y/N)<br />
Target Met<br />
by LEA<br />
(Y/N)<br />
Target Met<br />
by LEA<br />
(Y/N)<br />
*Data reviewed for timely and accurate submissions included all APSCN cycle data except for personnel<br />
Note: - - denotes not applicable<br />
96.19 100.00 — — N/A<br />
14.53<br />
State<br />
Rate<br />
49.42<br />
State<br />
Rate<br />
54.07<br />
13.00<br />
State<br />
Target<br />
49.00<br />
State<br />
Target<br />
60.00<br />
Y<br />
N/A<br />
Y<br />
— —<br />
LEA<br />
Rate<br />
— —<br />
LEA<br />
Rate<br />
— —<br />
N/A<br />
Target Met<br />
by LEA<br />
(Y/N)<br />
N/A<br />
Target Met<br />
by LEA<br />
(Y/N)<br />
N/A<br />
Page 5 of 5
<strong>ARKANSAS</strong> <strong>SPECIAL</strong> <strong>EDUCATION</strong><br />
<strong>DISTRICT</strong> <strong>ANNUAL</strong> PERFORMANCE REPORT<br />
2010/11 School Year<br />
Publication Date: March 2012<br />
Each State must have in place a State Performance Plan (SPP) to evaluate the State's efforts to meet the requirements and<br />
purposes of the implementation of the Individuals with Disabilities Education Act (IDEA). The SPP is a six-year plan, which<br />
describes Arkansas's performance on 20 indicators. The Office of Special Education Programs in the U. S. Department of<br />
Education requires that States report annually to the public on the performance of each local education agency (LEA) on 14 of<br />
20 indicators as compared with targets established by the State in the SPP. Arkansas will report indicators 1 through 14 and<br />
20 for each LEA serving children with disabilities (CWD). Any LEA not meeting targets on compliance indicators (0% for<br />
Indicators 4B, 09 & 10 and 100% for Indicators 11, 12, 13, and 20) are non-compliant with IDEA.<br />
There are no report changes for the 2010/11 school year profile; However, it is important to recognize that: .<br />
1. Indicator 01 (Graduation) is reported a year in arrear (2009/10 graduates) and is based on a four-year cohort. This<br />
means the rate is a measure of students who entered in ninth grade and graduate in four years. The calculation is a<br />
requirement under Title I of the Elementary and Secondary Education Act (ESEA).<br />
2. Indicator 02 (Drop out) is reported a year in arrear. This means the rate is a measure of students who dropped out in<br />
the 2009/10 school year. The Indicator 02 data are aligned with the Common Core of Data (CCD) requirements for<br />
grades 7-12.<br />
3. Indicator 04A and 4B (Suspension/Expulsion) is reported a year in arrear. This means the rate is a measure of<br />
students who had out-of-school suspensions and/or expulsions totaling more than 10 days.<br />
For a complete description of all the Indicators, please visit the special education website at<br />
http://arksped.k12.ar.us/sections/policy.html<br />
LEA: 6047 - eSTEM HIGH CHARTER SCHOOL<br />
Indicator 01: Graduation Rates (2009/10 school year) Indicator 02: Dropout Rates (2009/10 school year)<br />
Percent of youth<br />
with IEPs<br />
graduating from<br />
high school with a<br />
regular diploma<br />
State<br />
Rate<br />
State<br />
Target<br />
75.76% 85.00%<br />
LEA<br />
Rate<br />
— —<br />
Target Met<br />
by LEA<br />
(Y/N)<br />
NA<br />
Percent of<br />
youth with<br />
IEPs dropping<br />
out of high<br />
school<br />
State<br />
Rate<br />
Indicator 03: Assessment on Statewide Benchmark Exam (grades 3-8, 11)<br />
A) Adequate Yearly Progress<br />
n=40<br />
Literacy<br />
Mathematics<br />
Met Disability Subgroup "n"<br />
for Reporting Purposes (Y/N)<br />
State Target for % of Districts Meeting<br />
AYP for Disability Subgroup<br />
State<br />
Target<br />
3.06% 4.20%<br />
LEA<br />
Rate<br />
0.00%<br />
% of Districts Meeting AYP<br />
for Disability Subgroup<br />
Target Met by<br />
LEA (Y/N)<br />
Y<br />
Target Met by<br />
LEA(Y/N)<br />
Overall N 17.15% 6.25%<br />
NA<br />
N<br />
N<br />
Note: For a district to qualify as having a disability subgroup it must have a minimum of 40 (n=40) students with disabilities in a school building.<br />
B) Participation<br />
Participation Rate: # of<br />
CWD Tested ÷ # of CWD<br />
Enrolled in grades tested.<br />
Participation Rate: Literacy<br />
Participation Rate: Math<br />
Note: - - denotes not applicable<br />
State<br />
Rate<br />
98.78%<br />
State<br />
Target<br />
95.00%<br />
LEA<br />
Rate<br />
— —<br />
Target Met<br />
by LEA (Y/N)<br />
N/A<br />
98.61% 95.00% 100.00% Y<br />
C) Performance Proficiency<br />
Percent of CWD Scoring<br />
Proficient or Above<br />
Proficiency Rate: Literacy<br />
Proficiency Rate:<br />
Mathematics<br />
16.00%<br />
16.00%<br />
State<br />
Rate<br />
31.49%<br />
44.86%<br />
State<br />
Target<br />
45.22%<br />
51.14%<br />
LEA<br />
Rate<br />
— —<br />
— —<br />
NA<br />
NA<br />
Target<br />
Met by<br />
LEA (Y/N)<br />
N/A<br />
N/A<br />
Page 1 of 5
LEA: 6047 - eSTEM HIGH CHARTER SCHOOL<br />
Indicator 04: Out-of-School Suspensions and Expulsions (2009/10 school year)<br />
A) Suspension/Expulsion<br />
Percent difference of CWD with out-of- school suspensions and<br />
expulsions totaling greater than 10 days in a school year as<br />
compared to the same data for general education students in<br />
the district.<br />
B) Suspension/Expulsion by Race and Ethnicity<br />
Percent of districts that have: (a) a significant discrepancy, by race or<br />
ethnicity, in the rate of suspensions and expulsions of greater than 10<br />
days in a school year for children with IEPs; and (b) policies,<br />
procedures or practices that contribute to the significant discrepancy<br />
and do not comply with requirements relating to the development<br />
and implementation of IEPs, the use of positive behavioral<br />
interventions and supports, and procedural safeguards.<br />
Indicator 05: School Age (5-21) Least Restrictive Environment<br />
A) In the Regular Class 80% or more of the day<br />
Percent of CWD with<br />
IEPs receiving instruction<br />
in the regular class 80%<br />
or more of the day.<br />
State<br />
Rate<br />
State<br />
Target<br />
LEA<br />
Rate<br />
B) In the Regular Class less than 40% of the day<br />
Percent of CWD with<br />
IEPs receiving instruction<br />
in the regular class less<br />
than 60% of the day.<br />
53.87% 59.77%<br />
State<br />
Rate<br />
State<br />
Target<br />
12.42% 12.51%<br />
100.00%<br />
LEA<br />
Rate<br />
0.00%<br />
C) Other Settings outside the regular class<br />
Percent of CWD with IEPs served in<br />
public or private separate schools,<br />
residential placements, or<br />
homebound/hospital placements.<br />
State<br />
Rate<br />
State<br />
Target<br />
2.80% 2.56%<br />
Target Met<br />
by LEA (Y/N)<br />
Y<br />
Target Met<br />
by LEA (Y/N)<br />
Y<br />
LEA<br />
Rate<br />
0.00%<br />
Target Met<br />
by LEA(Y/N)<br />
Indicator 06: Early Childhood (3-5) Least Restrictive Environment<br />
A) Regular Early Childhood Program<br />
Percent of children (aged 3 through 5) with IEPs attending a regular<br />
early childhood program and receiving the majority of special<br />
education and related services in the regular early childhood program<br />
Allowable<br />
Difference<br />
LEA: 6047 - eSTEM HIGH CHARTER SCHOOL<br />
Indicator 07: Preschool (3-5) Outcomes<br />
a) Percent of preschool CWD<br />
children who did not<br />
improve functioning.<br />
b) Percent of preschool CWD<br />
who improved but whose<br />
functioning remained below<br />
same age peers.<br />
c) Percent of preschool CWD<br />
who improved at a level<br />
nearer to same aged peers.<br />
d) Percent of preschool CWD<br />
who improved functioning to<br />
reach a level comparable to<br />
same age peers.<br />
e) Percent of preschool CWD<br />
children who maintain<br />
functioning at a level<br />
comparable to same aged<br />
peers.<br />
Summary<br />
Statements<br />
1) Of those preschool<br />
children who entered<br />
the preschool program<br />
below age expectations<br />
in each Outcome, the<br />
percent who<br />
substantially increased<br />
their rate of growth by<br />
the time they turned 6<br />
years of age or exited<br />
the program.<br />
2) The percent of<br />
preschool children who<br />
were functioning<br />
within age expectations<br />
in each Outcome by the<br />
time they turned 6<br />
years of age or exited<br />
A) Positive Social -Emotional<br />
Skills*<br />
State<br />
Rate<br />
A) Positive Social -<br />
Emotional Skills<br />
(Including social<br />
relationships)<br />
State<br />
Rate<br />
2.14%<br />
5.31%<br />
25.97%<br />
38.22%<br />
28.36%<br />
State<br />
Target<br />
LEA<br />
Rate<br />
LEA<br />
Rate<br />
— —<br />
— —<br />
— —<br />
— —<br />
— —<br />
Target<br />
Met by<br />
LEA(Y/N)<br />
B) Acquisition and Use of<br />
Knowledge and Skills<br />
(Including early language/<br />
communication and early literacy)<br />
B) Acquisition and Use of<br />
Knowledge and Skills **<br />
State<br />
Rate<br />
1.75%<br />
6.59%<br />
34.23%<br />
43.51%<br />
13.92%<br />
State<br />
Target<br />
LEA<br />
Rate<br />
Target<br />
Met by<br />
LEA(Y/N)<br />
C) Use of Appropriate Behaviors<br />
to Meet Their Needs<br />
State<br />
Rate<br />
State<br />
Target<br />
LEA<br />
Rate<br />
Target<br />
Met by<br />
LEA(Y/N)<br />
89.61% 90.50% — — N/A 90.31% 90.50% — — N/A 90.82% 92.50% — — N/A<br />
66.58% 69.50% — — N/A 57.43% 60.50% — — N/A 76.69% 78.50% — — N/A<br />
NOTE: * Including social relationships ** Including early language/ communication and early literacy<br />
Note: - - denotes not applicable<br />
State<br />
Rate<br />
LEA<br />
Rate<br />
— —<br />
— —<br />
— —<br />
— —<br />
— —<br />
C) Use of<br />
Appropriate<br />
Behaviors to<br />
Meet Their Needs<br />
State<br />
Rate<br />
4.51%<br />
17.34%<br />
41.72%<br />
34.97%<br />
LEA<br />
Rate<br />
1.46% — —<br />
— —<br />
— —<br />
— —<br />
— —<br />
Page 3 of 5
LEA: 6047 - eSTEM HIGH CHARTER SCHOOL<br />
Indicator 08: Parent Involvement<br />
Percent of surveyed<br />
parents who reported<br />
school facilitated parent<br />
involvement as a means<br />
of improving services<br />
and results for children<br />
with disabilities.<br />
Early Childhood<br />
(3-5)<br />
School Age<br />
(5-21)<br />
State<br />
Rate<br />
90.47%<br />
95.05%<br />
Indicator 09: Disproportionality - Eligibility<br />
Disproportionate representation of racial<br />
and ethnic groups in special education and<br />
related services that is a result of<br />
inappropriate identification (e.g.<br />
monitoring data, review of policies,<br />
practices, and procedures under 618(d),<br />
etc.).<br />
State<br />
Rate<br />
State<br />
Target<br />
88.00%<br />
96.00%<br />
State<br />
Target<br />
0.00% 0.00%<br />
LEA<br />
Rate<br />
— —<br />
0.00%<br />
Indicator 10: Disproportionality-Child with a Disability<br />
Disproportionate representation of racial<br />
and ethnic groups in specific disability<br />
categories that is a result of inappropriate<br />
identification (e.g. monitoring data, review<br />
of policies, practices, and procedures under<br />
618(d), etc.).<br />
Indicator 11: Child Find<br />
Percent of children with<br />
parental consent to evaluate<br />
who are evaluated within<br />
the State established timeline<br />
of 60 days.<br />
Overall<br />
(3-21)<br />
Early Childhood<br />
(3-5)<br />
School Age<br />
(5-21)<br />
State<br />
Rate<br />
0.00%<br />
Indicator 12: Early Childhood Transition<br />
Percent of children referred by Part C prior to<br />
age 3, who are found eligible for Part B, and<br />
who have an IEP developed and implemented<br />
by their third birthday.<br />
Note: - - denotes not applicable<br />
State<br />
Rate<br />
99.41%<br />
99.70%<br />
98.97%<br />
State<br />
Rate<br />
State<br />
Target<br />
0.00%<br />
State<br />
Target<br />
100.00%<br />
100.00%<br />
100.00%<br />
State<br />
Target<br />
Target Met by<br />
LEA (Y/N)<br />
Y<br />
Target Met by<br />
LEA (Y/N)<br />
Y<br />
LEA<br />
Rate<br />
— —<br />
— —<br />
— —<br />
LEA<br />
Rate<br />
Target Met by<br />
LEA (Y/N)<br />
N/A<br />
N<br />
Note: The target for Indicator 09 is to have zero percent<br />
(0%) of districts identified as having disproportionate<br />
representation as a result of inappropriate<br />
identification in eligibility.<br />
Note: The target for Indicator 10 is to have zero<br />
percent (0%) of districts identified as having<br />
disproportionate representation as a result of<br />
inappropriate identification in a disability<br />
category.<br />
Target Met by<br />
LEA (Y/N)<br />
N/A<br />
N/A<br />
N/A<br />
Target Met<br />
by LEA<br />
(Y/N)<br />
99.21% 100.00% - - N/A<br />
Note: * Indicates a zero reponse rate for the<br />
district.<br />
Page 4 of 5
LEA: 6047 - eSTEM HIGH CHARTER SCHOOL<br />
Indicator 13: Secondary Transition<br />
Percent of youth with disabilities aged 16 and<br />
up with an IEP that includes coordinated,<br />
measurable, annual IEP goals and transition<br />
services that will reasonably enable the student<br />
to meet the post-secondary goals.<br />
Indicator 14: Post-School Outcomes<br />
A. Percent of youth enrolled in higher<br />
education within one year of leaving high<br />
school.<br />
State<br />
Rate<br />
State<br />
Target<br />
Note: Data for this Indicator is from the on-site monitoring of LEAs for the given year.<br />
B. Percent of youth enrolled in higher<br />
education or competitively employed<br />
within one year of leaving high school.<br />
C. Percent of youth enrolled in higher<br />
education or in some other postsecondary<br />
education or training program; or<br />
competitively employed or in some other<br />
employment within one year of leaving<br />
high school.<br />
State<br />
Rate<br />
Indicator 20: Reported Data-Timely and Accurate*<br />
District submitted<br />
required data elements<br />
on or before due dates;<br />
made revisions within<br />
the alloted reveiw<br />
periods.<br />
Accurate and Timely<br />
Data Submission<br />
Overall (3-21)<br />
Early Childhood (3-5)<br />
School Age (5-21)<br />
State<br />
Target<br />
100.00%<br />
100.00%<br />
100.00%<br />
State<br />
Target<br />
LEA<br />
Rate<br />
LEA<br />
Rate<br />
Target Met by<br />
LEA (Y/N)<br />
Target Met<br />
by LEA<br />
(Y/N)<br />
Target Met<br />
by LEA<br />
(Y/N)<br />
*Data reviewed for timely and accurate submissions included all APSCN cycle data except for personnel<br />
Note: - - denotes not applicable<br />
96.19 100.00 100.00% Y<br />
14.53<br />
State<br />
Rate<br />
49.42<br />
State<br />
Rate<br />
54.07<br />
13.00<br />
State<br />
Target<br />
49.00<br />
State<br />
Target<br />
60.00<br />
Y<br />
N/A<br />
Y<br />
— —<br />
LEA<br />
Rate<br />
— —<br />
LEA<br />
Rate<br />
— —<br />
N/A<br />
Target Met<br />
by LEA<br />
(Y/N)<br />
N/A<br />
Target Met<br />
by LEA<br />
(Y/N)<br />
N/A<br />
Page 5 of 5
<strong>ARKANSAS</strong> <strong>SPECIAL</strong> <strong>EDUCATION</strong><br />
<strong>DISTRICT</strong> <strong>ANNUAL</strong> PERFORMANCE REPORT<br />
2010/11 School Year<br />
Publication Date: March 2012<br />
Each State must have in place a State Performance Plan (SPP) to evaluate the State's efforts to meet the requirements and<br />
purposes of the implementation of the Individuals with Disabilities Education Act (IDEA). The SPP is a six-year plan, which<br />
describes Arkansas's performance on 20 indicators. The Office of Special Education Programs in the U. S. Department of<br />
Education requires that States report annually to the public on the performance of each local education agency (LEA) on 14 of<br />
20 indicators as compared with targets established by the State in the SPP. Arkansas will report indicators 1 through 14 and<br />
20 for each LEA serving children with disabilities (CWD). Any LEA not meeting targets on compliance indicators (0% for<br />
Indicators 4B, 09 & 10 and 100% for Indicators 11, 12, 13, and 20) are non-compliant with IDEA.<br />
There are no report changes for the 2010/11 school year profile; However, it is important to recognize that: .<br />
1. Indicator 01 (Graduation) is reported a year in arrear (2009/10 graduates) and is based on a four-year cohort. This<br />
means the rate is a measure of students who entered in ninth grade and graduate in four years. The calculation is a<br />
requirement under Title I of the Elementary and Secondary Education Act (ESEA).<br />
2. Indicator 02 (Drop out) is reported a year in arrear. This means the rate is a measure of students who dropped out in<br />
the 2009/10 school year. The Indicator 02 data are aligned with the Common Core of Data (CCD) requirements for<br />
grades 7-12.<br />
3. Indicator 04A and 4B (Suspension/Expulsion) is reported a year in arrear. This means the rate is a measure of<br />
students who had out-of-school suspensions and/or expulsions totaling more than 10 days.<br />
For a complete description of all the Indicators, please visit the special education website at<br />
http://arksped.k12.ar.us/sections/policy.html<br />
LEA: 6048 - LISA ACADEMY CHARTER SCHOOL - NLR<br />
Indicator 01: Graduation Rates (2009/10 school year) Indicator 02: Dropout Rates (2009/10 school year)<br />
Percent of youth<br />
with IEPs<br />
graduating from<br />
high school with a<br />
regular diploma<br />
State<br />
Rate<br />
State<br />
Target<br />
75.76% 85.00%<br />
LEA<br />
Rate<br />
— —<br />
Target Met<br />
by LEA<br />
(Y/N)<br />
NA<br />
Percent of<br />
youth with<br />
IEPs dropping<br />
out of high<br />
school<br />
State<br />
Rate<br />
Indicator 03: Assessment on Statewide Benchmark Exam (grades 3-8, 11)<br />
A) Adequate Yearly Progress<br />
n=40<br />
Literacy<br />
Mathematics<br />
Met Disability Subgroup "n"<br />
for Reporting Purposes (Y/N)<br />
State Target for % of Districts Meeting<br />
AYP for Disability Subgroup<br />
State<br />
Target<br />
3.06% 4.20%<br />
LEA<br />
Rate<br />
— —<br />
% of Districts Meeting AYP<br />
for Disability Subgroup<br />
Target Met by<br />
LEA (Y/N)<br />
N/A<br />
Target Met by<br />
LEA(Y/N)<br />
Overall N 17.15% 6.25%<br />
NA<br />
N<br />
N<br />
Note: For a district to qualify as having a disability subgroup it must have a minimum of 40 (n=40) students with disabilities in a school building.<br />
B) Participation<br />
Participation Rate: # of<br />
CWD Tested ÷ # of CWD<br />
Enrolled in grades tested.<br />
Participation Rate: Literacy<br />
Participation Rate: Math<br />
Note: - - denotes not applicable<br />
State<br />
Rate<br />
98.78%<br />
State<br />
Target<br />
95.00%<br />
LEA<br />
Rate<br />
100.00%<br />
Target Met<br />
by LEA (Y/N)<br />
98.61% 95.00% 100.00% Y<br />
Y<br />
C) Performance Proficiency<br />
Percent of CWD Scoring<br />
Proficient or Above<br />
Proficiency Rate: Literacy<br />
Proficiency Rate:<br />
Mathematics<br />
16.00%<br />
16.00%<br />
State<br />
Rate<br />
31.49%<br />
44.86%<br />
State<br />
Target<br />
45.22%<br />
51.14%<br />
LEA<br />
Rate<br />
33.33%<br />
44.44%<br />
NA<br />
NA<br />
Target<br />
Met by<br />
LEA (Y/N)<br />
N<br />
N<br />
Page 1 of 5
LEA: 6048 - LISA ACADEMY CHARTER SCHOOL - NLR<br />
Indicator 04: Out-of-School Suspensions and Expulsions (2009/10 school year)<br />
A) Suspension/Expulsion<br />
Percent difference of CWD with out-of- school suspensions and<br />
expulsions totaling greater than 10 days in a school year as<br />
compared to the same data for general education students in<br />
the district.<br />
B) Suspension/Expulsion by Race and Ethnicity<br />
Percent of districts that have: (a) a significant discrepancy, by race or<br />
ethnicity, in the rate of suspensions and expulsions of greater than 10<br />
days in a school year for children with IEPs; and (b) policies,<br />
procedures or practices that contribute to the significant discrepancy<br />
and do not comply with requirements relating to the development<br />
and implementation of IEPs, the use of positive behavioral<br />
interventions and supports, and procedural safeguards.<br />
Indicator 05: School Age (5-21) Least Restrictive Environment<br />
A) In the Regular Class 80% or more of the day<br />
Percent of CWD with<br />
IEPs receiving instruction<br />
in the regular class 80%<br />
or more of the day.<br />
State<br />
Rate<br />
State<br />
Target<br />
LEA<br />
Rate<br />
B) In the Regular Class less than 40% of the day<br />
Percent of CWD with<br />
IEPs receiving instruction<br />
in the regular class less<br />
than 60% of the day.<br />
53.87% 59.77%<br />
State<br />
Rate<br />
State<br />
Target<br />
12.42% 12.51%<br />
77.78%<br />
LEA<br />
Rate<br />
0.00%<br />
C) Other Settings outside the regular class<br />
Percent of CWD with IEPs served in<br />
public or private separate schools,<br />
residential placements, or<br />
homebound/hospital placements.<br />
State<br />
Rate<br />
State<br />
Target<br />
2.80% 2.56%<br />
Target Met<br />
by LEA (Y/N)<br />
Y<br />
Target Met<br />
by LEA (Y/N)<br />
Y<br />
LEA<br />
Rate<br />
0.00%<br />
Target Met<br />
by LEA(Y/N)<br />
Indicator 06: Early Childhood (3-5) Least Restrictive Environment<br />
A) Regular Early Childhood Program<br />
Percent of children (aged 3 through 5) with IEPs attending a regular<br />
early childhood program and receiving the majority of special<br />
education and related services in the regular early childhood program<br />
Allowable<br />
Difference<br />
LEA: 6048 - LISA ACADEMY CHARTER SCHOOL - NLR<br />
Indicator 07: Preschool (3-5) Outcomes<br />
a) Percent of preschool CWD<br />
children who did not<br />
improve functioning.<br />
b) Percent of preschool CWD<br />
who improved but whose<br />
functioning remained below<br />
same age peers.<br />
c) Percent of preschool CWD<br />
who improved at a level<br />
nearer to same aged peers.<br />
d) Percent of preschool CWD<br />
who improved functioning to<br />
reach a level comparable to<br />
same age peers.<br />
e) Percent of preschool CWD<br />
children who maintain<br />
functioning at a level<br />
comparable to same aged<br />
peers.<br />
Summary<br />
Statements<br />
1) Of those preschool<br />
children who entered<br />
the preschool program<br />
below age expectations<br />
in each Outcome, the<br />
percent who<br />
substantially increased<br />
their rate of growth by<br />
the time they turned 6<br />
years of age or exited<br />
the program.<br />
2) The percent of<br />
preschool children who<br />
were functioning<br />
within age expectations<br />
in each Outcome by the<br />
time they turned 6<br />
years of age or exited<br />
A) Positive Social -Emotional<br />
Skills*<br />
State<br />
Rate<br />
A) Positive Social -<br />
Emotional Skills<br />
(Including social<br />
relationships)<br />
State<br />
Rate<br />
2.14%<br />
5.31%<br />
25.97%<br />
38.22%<br />
28.36%<br />
State<br />
Target<br />
LEA<br />
Rate<br />
LEA<br />
Rate<br />
— —<br />
— —<br />
— —<br />
— —<br />
— —<br />
Target<br />
Met by<br />
LEA(Y/N)<br />
B) Acquisition and Use of<br />
Knowledge and Skills<br />
(Including early language/<br />
communication and early literacy)<br />
B) Acquisition and Use of<br />
Knowledge and Skills **<br />
State<br />
Rate<br />
1.75%<br />
6.59%<br />
34.23%<br />
43.51%<br />
13.92%<br />
State<br />
Target<br />
LEA<br />
Rate<br />
Target<br />
Met by<br />
LEA(Y/N)<br />
C) Use of Appropriate Behaviors<br />
to Meet Their Needs<br />
State<br />
Rate<br />
State<br />
Target<br />
LEA<br />
Rate<br />
Target<br />
Met by<br />
LEA(Y/N)<br />
89.61% 90.50% — — N/A 90.31% 90.50% — — N/A 90.82% 92.50% — — N/A<br />
66.58% 69.50% — — N/A 57.43% 60.50% — — N/A 76.69% 78.50% — — N/A<br />
NOTE: * Including social relationships ** Including early language/ communication and early literacy<br />
Note: - - denotes not applicable<br />
State<br />
Rate<br />
LEA<br />
Rate<br />
— —<br />
— —<br />
— —<br />
— —<br />
— —<br />
C) Use of<br />
Appropriate<br />
Behaviors to<br />
Meet Their Needs<br />
State<br />
Rate<br />
4.51%<br />
17.34%<br />
41.72%<br />
34.97%<br />
LEA<br />
Rate<br />
1.46% — —<br />
— —<br />
— —<br />
— —<br />
— —<br />
Page 3 of 5
LEA: 6048 - LISA ACADEMY CHARTER SCHOOL - NLR<br />
Indicator 08: Parent Involvement<br />
Percent of surveyed<br />
parents who reported<br />
school facilitated parent<br />
involvement as a means<br />
of improving services<br />
and results for children<br />
with disabilities.<br />
Early Childhood<br />
(3-5)<br />
School Age<br />
(5-21)<br />
State<br />
Rate<br />
90.47%<br />
95.05%<br />
Indicator 09: Disproportionality - Eligibility<br />
Disproportionate representation of racial<br />
and ethnic groups in special education and<br />
related services that is a result of<br />
inappropriate identification (e.g.<br />
monitoring data, review of policies,<br />
practices, and procedures under 618(d),<br />
etc.).<br />
State<br />
Rate<br />
State<br />
Target<br />
88.00%<br />
96.00%<br />
State<br />
Target<br />
0.00% 0.00%<br />
LEA<br />
Rate<br />
— —<br />
— —<br />
Indicator 10: Disproportionality-Child with a Disability<br />
Disproportionate representation of racial<br />
and ethnic groups in specific disability<br />
categories that is a result of inappropriate<br />
identification (e.g. monitoring data, review<br />
of policies, practices, and procedures under<br />
618(d), etc.).<br />
Indicator 11: Child Find<br />
Percent of children with<br />
parental consent to evaluate<br />
who are evaluated within<br />
the State established timeline<br />
of 60 days.<br />
Overall<br />
(3-21)<br />
Early Childhood<br />
(3-5)<br />
School Age<br />
(5-21)<br />
State<br />
Rate<br />
0.00%<br />
Indicator 12: Early Childhood Transition<br />
Percent of children referred by Part C prior to<br />
age 3, who are found eligible for Part B, and<br />
who have an IEP developed and implemented<br />
by their third birthday.<br />
Note: - - denotes not applicable<br />
State<br />
Rate<br />
99.41%<br />
99.70%<br />
98.97%<br />
State<br />
Rate<br />
State<br />
Target<br />
0.00%<br />
State<br />
Target<br />
100.00%<br />
100.00%<br />
100.00%<br />
State<br />
Target<br />
Target Met by<br />
LEA (Y/N)<br />
Y<br />
Target Met by<br />
LEA (Y/N)<br />
Y<br />
LEA<br />
Rate<br />
100.00%<br />
— —<br />
100.00%<br />
LEA<br />
Rate<br />
Target Met by<br />
LEA (Y/N)<br />
N/A<br />
N<br />
Note: The target for Indicator 09 is to have zero percent<br />
(0%) of districts identified as having disproportionate<br />
representation as a result of inappropriate<br />
identification in eligibility.<br />
Note: The target for Indicator 10 is to have zero<br />
percent (0%) of districts identified as having<br />
disproportionate representation as a result of<br />
inappropriate identification in a disability<br />
category.<br />
Target Met by<br />
LEA (Y/N)<br />
N/A<br />
Y<br />
Target Met<br />
by LEA<br />
(Y/N)<br />
99.21% 100.00% - - N/A<br />
Y<br />
Note: * Indicates a zero reponse rate for the<br />
district.<br />
Page 4 of 5
LEA: 6048 - LISA ACADEMY CHARTER SCHOOL - NLR<br />
Indicator 13: Secondary Transition<br />
Percent of youth with disabilities aged 16 and<br />
up with an IEP that includes coordinated,<br />
measurable, annual IEP goals and transition<br />
services that will reasonably enable the student<br />
to meet the post-secondary goals.<br />
Indicator 14: Post-School Outcomes<br />
A. Percent of youth enrolled in higher<br />
education within one year of leaving high<br />
school.<br />
State<br />
Rate<br />
State<br />
Target<br />
Note: Data for this Indicator is from the on-site monitoring of LEAs for the given year.<br />
B. Percent of youth enrolled in higher<br />
education or competitively employed<br />
within one year of leaving high school.<br />
C. Percent of youth enrolled in higher<br />
education or in some other postsecondary<br />
education or training program; or<br />
competitively employed or in some other<br />
employment within one year of leaving<br />
high school.<br />
State<br />
Rate<br />
Indicator 20: Reported Data-Timely and Accurate*<br />
District submitted<br />
required data elements<br />
on or before due dates;<br />
made revisions within<br />
the alloted reveiw<br />
periods.<br />
Accurate and Timely<br />
Data Submission<br />
Overall (3-21)<br />
Early Childhood (3-5)<br />
School Age (5-21)<br />
State<br />
Target<br />
100.00%<br />
100.00%<br />
100.00%<br />
State<br />
Target<br />
LEA<br />
Rate<br />
LEA<br />
Rate<br />
Target Met by<br />
LEA (Y/N)<br />
Target Met<br />
by LEA<br />
(Y/N)<br />
Target Met<br />
by LEA<br />
(Y/N)<br />
*Data reviewed for timely and accurate submissions included all APSCN cycle data except for personnel<br />
Note: - - denotes not applicable<br />
96.19 100.00 — — N/A<br />
14.53<br />
State<br />
Rate<br />
49.42<br />
State<br />
Rate<br />
54.07<br />
13.00<br />
State<br />
Target<br />
49.00<br />
State<br />
Target<br />
60.00<br />
Y<br />
N/A<br />
Y<br />
— —<br />
LEA<br />
Rate<br />
— —<br />
LEA<br />
Rate<br />
— —<br />
N/A<br />
Target Met<br />
by LEA<br />
(Y/N)<br />
N/A<br />
Target Met<br />
by LEA<br />
(Y/N)<br />
N/A<br />
Page 5 of 5
<strong>ARKANSAS</strong> <strong>SPECIAL</strong> <strong>EDUCATION</strong><br />
<strong>DISTRICT</strong> <strong>ANNUAL</strong> PERFORMANCE REPORT<br />
2010/11 School Year<br />
Publication Date: March 2012<br />
Each State must have in place a State Performance Plan (SPP) to evaluate the State's efforts to meet the requirements and<br />
purposes of the implementation of the Individuals with Disabilities Education Act (IDEA). The SPP is a six-year plan, which<br />
describes Arkansas's performance on 20 indicators. The Office of Special Education Programs in the U. S. Department of<br />
Education requires that States report annually to the public on the performance of each local education agency (LEA) on 14 of<br />
20 indicators as compared with targets established by the State in the SPP. Arkansas will report indicators 1 through 14 and<br />
20 for each LEA serving children with disabilities (CWD). Any LEA not meeting targets on compliance indicators (0% for<br />
Indicators 4B, 09 & 10 and 100% for Indicators 11, 12, 13, and 20) are non-compliant with IDEA.<br />
There are no report changes for the 2010/11 school year profile; However, it is important to recognize that: .<br />
1. Indicator 01 (Graduation) is reported a year in arrear (2009/10 graduates) and is based on a four-year cohort. This<br />
means the rate is a measure of students who entered in ninth grade and graduate in four years. The calculation is a<br />
requirement under Title I of the Elementary and Secondary Education Act (ESEA).<br />
2. Indicator 02 (Drop out) is reported a year in arrear. This means the rate is a measure of students who dropped out in<br />
the 2009/10 school year. The Indicator 02 data are aligned with the Common Core of Data (CCD) requirements for<br />
grades 7-12.<br />
3. Indicator 04A and 4B (Suspension/Expulsion) is reported a year in arrear. This means the rate is a measure of<br />
students who had out-of-school suspensions and/or expulsions totaling more than 10 days.<br />
For a complete description of all the Indicators, please visit the special education website at<br />
http://arksped.k12.ar.us/sections/policy.html<br />
LEA: 6049 - LITTLE ROCK PREPARATORY ACADEMY CHARTER SCHOOL<br />
Indicator 01: Graduation Rates (2009/10 school year) Indicator 02: Dropout Rates (2009/10 school year)<br />
Percent of youth<br />
with IEPs<br />
graduating from<br />
high school with a<br />
regular diploma<br />
State<br />
Rate<br />
State<br />
Target<br />
75.76% 85.00%<br />
LEA<br />
Rate<br />
— —<br />
Target Met<br />
by LEA<br />
(Y/N)<br />
NA<br />
Percent of<br />
youth with<br />
IEPs dropping<br />
out of high<br />
school<br />
State<br />
Rate<br />
Indicator 03: Assessment on Statewide Benchmark Exam (grades 3-8, 11)<br />
A) Adequate Yearly Progress<br />
n=40<br />
Literacy<br />
Mathematics<br />
Met Disability Subgroup "n"<br />
for Reporting Purposes (Y/N)<br />
State Target for % of Districts Meeting<br />
AYP for Disability Subgroup<br />
State<br />
Target<br />
3.06% 4.20%<br />
LEA<br />
Rate<br />
0.00%<br />
% of Districts Meeting AYP<br />
for Disability Subgroup<br />
Target Met by<br />
LEA (Y/N)<br />
Y<br />
Target Met by<br />
LEA(Y/N)<br />
Overall N 17.15% 6.25%<br />
NA<br />
N<br />
N<br />
Note: For a district to qualify as having a disability subgroup it must have a minimum of 40 (n=40) students with disabilities in a school building.<br />
B) Participation<br />
Participation Rate: # of<br />
CWD Tested ÷ # of CWD<br />
Enrolled in grades tested.<br />
Participation Rate: Literacy<br />
Participation Rate: Math<br />
Note: - - denotes not applicable<br />
State<br />
Rate<br />
98.78%<br />
State<br />
Target<br />
95.00%<br />
LEA<br />
Rate<br />
100.00%<br />
Target Met<br />
by LEA (Y/N)<br />
98.61% 95.00% 100.00% Y<br />
Y<br />
C) Performance Proficiency<br />
Percent of CWD Scoring<br />
Proficient or Above<br />
Proficiency Rate: Literacy<br />
Proficiency Rate:<br />
Mathematics<br />
16.00%<br />
16.00%<br />
State<br />
Rate<br />
31.49%<br />
44.86%<br />
State<br />
Target<br />
45.22%<br />
51.14%<br />
LEA<br />
Rate<br />
0.00%<br />
12.50%<br />
NA<br />
NA<br />
Target<br />
Met by<br />
LEA (Y/N)<br />
N<br />
N<br />
Page 1 of 5
LEA: 6049 - LITTLE ROCK PREPARATORY ACADEMY CHARTER SCHOOL<br />
Indicator 04: Out-of-School Suspensions and Expulsions (2009/10 school year)<br />
A) Suspension/Expulsion<br />
Percent difference of CWD with out-of- school suspensions and<br />
expulsions totaling greater than 10 days in a school year as<br />
compared to the same data for general education students in<br />
the district.<br />
B) Suspension/Expulsion by Race and Ethnicity<br />
Percent of districts that have: (a) a significant discrepancy, by race or<br />
ethnicity, in the rate of suspensions and expulsions of greater than 10<br />
days in a school year for children with IEPs; and (b) policies,<br />
procedures or practices that contribute to the significant discrepancy<br />
and do not comply with requirements relating to the development<br />
and implementation of IEPs, the use of positive behavioral<br />
interventions and supports, and procedural safeguards.<br />
Indicator 05: School Age (5-21) Least Restrictive Environment<br />
A) In the Regular Class 80% or more of the day<br />
Percent of CWD with<br />
IEPs receiving instruction<br />
in the regular class 80%<br />
or more of the day.<br />
State<br />
Rate<br />
State<br />
Target<br />
LEA<br />
Rate<br />
B) In the Regular Class less than 40% of the day<br />
Percent of CWD with<br />
IEPs receiving instruction<br />
in the regular class less<br />
than 60% of the day.<br />
53.87% 59.77%<br />
State<br />
Rate<br />
State<br />
Target<br />
12.42% 12.51%<br />
0.00%<br />
LEA<br />
Rate<br />
100.00%<br />
C) Other Settings outside the regular class<br />
Percent of CWD with IEPs served in<br />
public or private separate schools,<br />
residential placements, or<br />
homebound/hospital placements.<br />
State<br />
Rate<br />
State<br />
Target<br />
2.80% 2.56%<br />
Target Met<br />
by LEA (Y/N)<br />
N<br />
Target Met<br />
by LEA (Y/N)<br />
N<br />
LEA<br />
Rate<br />
0.00%<br />
Target Met<br />
by LEA(Y/N)<br />
Indicator 06: Early Childhood (3-5) Least Restrictive Environment<br />
A) Regular Early Childhood Program<br />
Percent of children (aged 3 through 5) with IEPs attending a regular<br />
early childhood program and receiving the majority of special<br />
education and related services in the regular early childhood program<br />
Allowable<br />
Difference<br />
LEA: 6049 - LITTLE ROCK PREPARATORY ACADEMY CHARTER SCHOOL<br />
Indicator 07: Preschool (3-5) Outcomes<br />
a) Percent of preschool CWD<br />
children who did not<br />
improve functioning.<br />
b) Percent of preschool CWD<br />
who improved but whose<br />
functioning remained below<br />
same age peers.<br />
c) Percent of preschool CWD<br />
who improved at a level<br />
nearer to same aged peers.<br />
d) Percent of preschool CWD<br />
who improved functioning to<br />
reach a level comparable to<br />
same age peers.<br />
e) Percent of preschool CWD<br />
children who maintain<br />
functioning at a level<br />
comparable to same aged<br />
peers.<br />
Summary<br />
Statements<br />
1) Of those preschool<br />
children who entered<br />
the preschool program<br />
below age expectations<br />
in each Outcome, the<br />
percent who<br />
substantially increased<br />
their rate of growth by<br />
the time they turned 6<br />
years of age or exited<br />
the program.<br />
2) The percent of<br />
preschool children who<br />
were functioning<br />
within age expectations<br />
in each Outcome by the<br />
time they turned 6<br />
years of age or exited<br />
A) Positive Social -Emotional<br />
Skills*<br />
State<br />
Rate<br />
A) Positive Social -<br />
Emotional Skills<br />
(Including social<br />
relationships)<br />
State<br />
Rate<br />
2.14%<br />
5.31%<br />
25.97%<br />
38.22%<br />
28.36%<br />
State<br />
Target<br />
LEA<br />
Rate<br />
LEA<br />
Rate<br />
— —<br />
— —<br />
— —<br />
— —<br />
— —<br />
Target<br />
Met by<br />
LEA(Y/N)<br />
B) Acquisition and Use of<br />
Knowledge and Skills<br />
(Including early language/<br />
communication and early literacy)<br />
B) Acquisition and Use of<br />
Knowledge and Skills **<br />
State<br />
Rate<br />
1.75%<br />
6.59%<br />
34.23%<br />
43.51%<br />
13.92%<br />
State<br />
Target<br />
LEA<br />
Rate<br />
Target<br />
Met by<br />
LEA(Y/N)<br />
C) Use of Appropriate Behaviors<br />
to Meet Their Needs<br />
State<br />
Rate<br />
State<br />
Target<br />
LEA<br />
Rate<br />
Target<br />
Met by<br />
LEA(Y/N)<br />
89.61% 90.50% — — N/A 90.31% 90.50% — — N/A 90.82% 92.50% — — N/A<br />
66.58% 69.50% — — N/A 57.43% 60.50% — — N/A 76.69% 78.50% — — N/A<br />
NOTE: * Including social relationships ** Including early language/ communication and early literacy<br />
Note: - - denotes not applicable<br />
State<br />
Rate<br />
LEA<br />
Rate<br />
— —<br />
— —<br />
— —<br />
— —<br />
— —<br />
C) Use of<br />
Appropriate<br />
Behaviors to<br />
Meet Their Needs<br />
State<br />
Rate<br />
4.51%<br />
17.34%<br />
41.72%<br />
34.97%<br />
LEA<br />
Rate<br />
1.46% — —<br />
— —<br />
— —<br />
— —<br />
— —<br />
Page 3 of 5
LEA: 6049 - LITTLE ROCK PREPARATORY ACADEMY CHARTER SCHOOL<br />
Indicator 08: Parent Involvement<br />
Percent of surveyed<br />
parents who reported<br />
school facilitated parent<br />
involvement as a means<br />
of improving services<br />
and results for children<br />
with disabilities.<br />
Early Childhood<br />
(3-5)<br />
School Age<br />
(5-21)<br />
State<br />
Rate<br />
90.47%<br />
95.05%<br />
Indicator 09: Disproportionality - Eligibility<br />
Disproportionate representation of racial<br />
and ethnic groups in special education and<br />
related services that is a result of<br />
inappropriate identification (e.g.<br />
monitoring data, review of policies,<br />
practices, and procedures under 618(d),<br />
etc.).<br />
State<br />
Rate<br />
State<br />
Target<br />
88.00%<br />
96.00%<br />
State<br />
Target<br />
0.00% 0.00%<br />
LEA<br />
Rate<br />
— —<br />
— —<br />
Indicator 10: Disproportionality-Child with a Disability<br />
Disproportionate representation of racial<br />
and ethnic groups in specific disability<br />
categories that is a result of inappropriate<br />
identification (e.g. monitoring data, review<br />
of policies, practices, and procedures under<br />
618(d), etc.).<br />
Indicator 11: Child Find<br />
Percent of children with<br />
parental consent to evaluate<br />
who are evaluated within<br />
the State established timeline<br />
of 60 days.<br />
Overall<br />
(3-21)<br />
Early Childhood<br />
(3-5)<br />
School Age<br />
(5-21)<br />
State<br />
Rate<br />
0.00%<br />
Indicator 12: Early Childhood Transition<br />
Percent of children referred by Part C prior to<br />
age 3, who are found eligible for Part B, and<br />
who have an IEP developed and implemented<br />
by their third birthday.<br />
Note: - - denotes not applicable<br />
State<br />
Rate<br />
99.41%<br />
99.70%<br />
98.97%<br />
State<br />
Rate<br />
State<br />
Target<br />
0.00%<br />
State<br />
Target<br />
100.00%<br />
100.00%<br />
100.00%<br />
State<br />
Target<br />
Target Met by<br />
LEA (Y/N)<br />
Y<br />
Target Met by<br />
LEA (Y/N)<br />
Y<br />
LEA<br />
Rate<br />
— —<br />
— —<br />
— —<br />
LEA<br />
Rate<br />
Target Met by<br />
LEA (Y/N)<br />
N/A<br />
N<br />
Note: The target for Indicator 09 is to have zero percent<br />
(0%) of districts identified as having disproportionate<br />
representation as a result of inappropriate<br />
identification in eligibility.<br />
Note: The target for Indicator 10 is to have zero<br />
percent (0%) of districts identified as having<br />
disproportionate representation as a result of<br />
inappropriate identification in a disability<br />
category.<br />
Target Met by<br />
LEA (Y/N)<br />
N/A<br />
N/A<br />
N/A<br />
Target Met<br />
by LEA<br />
(Y/N)<br />
99.21% 100.00% - - N/A<br />
Note: * Indicates a zero reponse rate for the<br />
district.<br />
Page 4 of 5
LEA: 6049 - LITTLE ROCK PREPARATORY ACADEMY CHARTER SCHOOL<br />
Indicator 13: Secondary Transition<br />
Percent of youth with disabilities aged 16 and<br />
up with an IEP that includes coordinated,<br />
measurable, annual IEP goals and transition<br />
services that will reasonably enable the student<br />
to meet the post-secondary goals.<br />
Indicator 14: Post-School Outcomes<br />
A. Percent of youth enrolled in higher<br />
education within one year of leaving high<br />
school.<br />
State<br />
Rate<br />
State<br />
Target<br />
Note: Data for this Indicator is from the on-site monitoring of LEAs for the given year.<br />
B. Percent of youth enrolled in higher<br />
education or competitively employed<br />
within one year of leaving high school.<br />
C. Percent of youth enrolled in higher<br />
education or in some other postsecondary<br />
education or training program; or<br />
competitively employed or in some other<br />
employment within one year of leaving<br />
high school.<br />
State<br />
Rate<br />
Indicator 20: Reported Data-Timely and Accurate*<br />
District submitted<br />
required data elements<br />
on or before due dates;<br />
made revisions within<br />
the alloted reveiw<br />
periods.<br />
Accurate and Timely<br />
Data Submission<br />
Overall (3-21)<br />
Early Childhood (3-5)<br />
School Age (5-21)<br />
State<br />
Target<br />
100.00%<br />
100.00%<br />
100.00%<br />
State<br />
Target<br />
LEA<br />
Rate<br />
LEA<br />
Rate<br />
Target Met by<br />
LEA (Y/N)<br />
Target Met<br />
by LEA<br />
(Y/N)<br />
Target Met<br />
by LEA<br />
(Y/N)<br />
*Data reviewed for timely and accurate submissions included all APSCN cycle data except for personnel<br />
Note: - - denotes not applicable<br />
96.19 100.00 — — N/A<br />
14.53<br />
State<br />
Rate<br />
49.42<br />
State<br />
Rate<br />
54.07<br />
13.00<br />
State<br />
Target<br />
49.00<br />
State<br />
Target<br />
60.00<br />
Y<br />
N/A<br />
Y<br />
— —<br />
LEA<br />
Rate<br />
— —<br />
LEA<br />
Rate<br />
— —<br />
N/A<br />
Target Met<br />
by LEA<br />
(Y/N)<br />
N/A<br />
Target Met<br />
by LEA<br />
(Y/N)<br />
N/A<br />
Page 5 of 5
<strong>ARKANSAS</strong> <strong>SPECIAL</strong> <strong>EDUCATION</strong><br />
<strong>DISTRICT</strong> <strong>ANNUAL</strong> PERFORMANCE REPORT<br />
2010/11 School Year<br />
Publication Date: March 2012<br />
Each State must have in place a State Performance Plan (SPP) to evaluate the State's efforts to meet the requirements and<br />
purposes of the implementation of the Individuals with Disabilities Education Act (IDEA). The SPP is a six-year plan, which<br />
describes Arkansas's performance on 20 indicators. The Office of Special Education Programs in the U. S. Department of<br />
Education requires that States report annually to the public on the performance of each local education agency (LEA) on 14 of<br />
20 indicators as compared with targets established by the State in the SPP. Arkansas will report indicators 1 through 14 and<br />
20 for each LEA serving children with disabilities (CWD). Any LEA not meeting targets on compliance indicators (0% for<br />
Indicators 4B, 09 & 10 and 100% for Indicators 11, 12, 13, and 20) are non-compliant with IDEA.<br />
There are no report changes for the 2010/11 school year profile; However, it is important to recognize that: .<br />
1. Indicator 01 (Graduation) is reported a year in arrear (2009/10 graduates) and is based on a four-year cohort. This<br />
means the rate is a measure of students who entered in ninth grade and graduate in four years. The calculation is a<br />
requirement under Title I of the Elementary and Secondary Education Act (ESEA).<br />
2. Indicator 02 (Drop out) is reported a year in arrear. This means the rate is a measure of students who dropped out in<br />
the 2009/10 school year. The Indicator 02 data are aligned with the Common Core of Data (CCD) requirements for<br />
grades 7-12.<br />
3. Indicator 04A and 4B (Suspension/Expulsion) is reported a year in arrear. This means the rate is a measure of<br />
students who had out-of-school suspensions and/or expulsions totaling more than 10 days.<br />
For a complete description of all the Indicators, please visit the special education website at<br />
http://arksped.k12.ar.us/sections/policy.html<br />
LEA: 6050 - JACKSONVILLE LIGHT HOUSE CHARTER SCHOOL<br />
Indicator 01: Graduation Rates (2009/10 school year) Indicator 02: Dropout Rates (2009/10 school year)<br />
Percent of youth<br />
with IEPs<br />
graduating from<br />
high school with a<br />
regular diploma<br />
State<br />
Rate<br />
State<br />
Target<br />
75.76% 85.00%<br />
LEA<br />
Rate<br />
— —<br />
Target Met<br />
by LEA<br />
(Y/N)<br />
NA<br />
Percent of<br />
youth with<br />
IEPs dropping<br />
out of high<br />
school<br />
State<br />
Rate<br />
Indicator 03: Assessment on Statewide Benchmark Exam (grades 3-8, 11)<br />
A) Adequate Yearly Progress<br />
n=40<br />
Literacy<br />
Mathematics<br />
Met Disability Subgroup "n"<br />
for Reporting Purposes (Y/N)<br />
State Target for % of Districts Meeting<br />
AYP for Disability Subgroup<br />
State<br />
Target<br />
3.06% 4.20%<br />
LEA<br />
Rate<br />
— —<br />
% of Districts Meeting AYP<br />
for Disability Subgroup<br />
Target Met by<br />
LEA (Y/N)<br />
N/A<br />
Target Met by<br />
LEA(Y/N)<br />
Overall N 17.15% 6.25%<br />
NA<br />
N<br />
N<br />
Note: For a district to qualify as having a disability subgroup it must have a minimum of 40 (n=40) students with disabilities in a school building.<br />
B) Participation<br />
Participation Rate: # of<br />
CWD Tested ÷ # of CWD<br />
Enrolled in grades tested.<br />
Participation Rate: Literacy<br />
Participation Rate: Math<br />
Note: - - denotes not applicable<br />
State<br />
Rate<br />
98.78%<br />
State<br />
Target<br />
95.00%<br />
LEA<br />
Rate<br />
100.00%<br />
Target Met<br />
by LEA (Y/N)<br />
98.61% 95.00% 100.00% Y<br />
Y<br />
C) Performance Proficiency<br />
Percent of CWD Scoring<br />
Proficient or Above<br />
Proficiency Rate: Literacy<br />
Proficiency Rate:<br />
Mathematics<br />
16.00%<br />
16.00%<br />
State<br />
Rate<br />
31.49%<br />
44.86%<br />
State<br />
Target<br />
45.22%<br />
51.14%<br />
LEA<br />
Rate<br />
36.36%<br />
45.45%<br />
NA<br />
NA<br />
Target<br />
Met by<br />
LEA (Y/N)<br />
N<br />
N<br />
Page 1 of 5
LEA: 6050 - JACKSONVILLE LIGHT HOUSE CHARTER SCHOOL<br />
Indicator 04: Out-of-School Suspensions and Expulsions (2009/10 school year)<br />
A) Suspension/Expulsion<br />
Percent difference of CWD with out-of- school suspensions and<br />
expulsions totaling greater than 10 days in a school year as<br />
compared to the same data for general education students in<br />
the district.<br />
B) Suspension/Expulsion by Race and Ethnicity<br />
Percent of districts that have: (a) a significant discrepancy, by race or<br />
ethnicity, in the rate of suspensions and expulsions of greater than 10<br />
days in a school year for children with IEPs; and (b) policies,<br />
procedures or practices that contribute to the significant discrepancy<br />
and do not comply with requirements relating to the development<br />
and implementation of IEPs, the use of positive behavioral<br />
interventions and supports, and procedural safeguards.<br />
Indicator 05: School Age (5-21) Least Restrictive Environment<br />
A) In the Regular Class 80% or more of the day<br />
Percent of CWD with<br />
IEPs receiving instruction<br />
in the regular class 80%<br />
or more of the day.<br />
State<br />
Rate<br />
State<br />
Target<br />
LEA<br />
Rate<br />
B) In the Regular Class less than 40% of the day<br />
Percent of CWD with<br />
IEPs receiving instruction<br />
in the regular class less<br />
than 60% of the day.<br />
53.87% 59.77%<br />
State<br />
Rate<br />
State<br />
Target<br />
12.42% 12.51%<br />
44.00%<br />
LEA<br />
Rate<br />
0.00%<br />
C) Other Settings outside the regular class<br />
Percent of CWD with IEPs served in<br />
public or private separate schools,<br />
residential placements, or<br />
homebound/hospital placements.<br />
State<br />
Rate<br />
State<br />
Target<br />
2.80% 2.56%<br />
Target Met<br />
by LEA (Y/N)<br />
N<br />
Target Met<br />
by LEA (Y/N)<br />
Y<br />
LEA<br />
Rate<br />
0.00%<br />
Target Met<br />
by LEA(Y/N)<br />
Indicator 06: Early Childhood (3-5) Least Restrictive Environment<br />
A) Regular Early Childhood Program<br />
Percent of children (aged 3 through 5) with IEPs attending a regular<br />
early childhood program and receiving the majority of special<br />
education and related services in the regular early childhood program<br />
Allowable<br />
Difference<br />
LEA: 6050 - JACKSONVILLE LIGHT HOUSE CHARTER SCHOOL<br />
Indicator 07: Preschool (3-5) Outcomes<br />
a) Percent of preschool CWD<br />
children who did not<br />
improve functioning.<br />
b) Percent of preschool CWD<br />
who improved but whose<br />
functioning remained below<br />
same age peers.<br />
c) Percent of preschool CWD<br />
who improved at a level<br />
nearer to same aged peers.<br />
d) Percent of preschool CWD<br />
who improved functioning to<br />
reach a level comparable to<br />
same age peers.<br />
e) Percent of preschool CWD<br />
children who maintain<br />
functioning at a level<br />
comparable to same aged<br />
peers.<br />
Summary<br />
Statements<br />
1) Of those preschool<br />
children who entered<br />
the preschool program<br />
below age expectations<br />
in each Outcome, the<br />
percent who<br />
substantially increased<br />
their rate of growth by<br />
the time they turned 6<br />
years of age or exited<br />
the program.<br />
2) The percent of<br />
preschool children who<br />
were functioning<br />
within age expectations<br />
in each Outcome by the<br />
time they turned 6<br />
years of age or exited<br />
A) Positive Social -Emotional<br />
Skills*<br />
State<br />
Rate<br />
A) Positive Social -<br />
Emotional Skills<br />
(Including social<br />
relationships)<br />
State<br />
Rate<br />
2.14%<br />
5.31%<br />
25.97%<br />
38.22%<br />
28.36%<br />
State<br />
Target<br />
LEA<br />
Rate<br />
LEA<br />
Rate<br />
— —<br />
— —<br />
— —<br />
— —<br />
— —<br />
Target<br />
Met by<br />
LEA(Y/N)<br />
B) Acquisition and Use of<br />
Knowledge and Skills<br />
(Including early language/<br />
communication and early literacy)<br />
B) Acquisition and Use of<br />
Knowledge and Skills **<br />
State<br />
Rate<br />
1.75%<br />
6.59%<br />
34.23%<br />
43.51%<br />
13.92%<br />
State<br />
Target<br />
LEA<br />
Rate<br />
Target<br />
Met by<br />
LEA(Y/N)<br />
C) Use of Appropriate Behaviors<br />
to Meet Their Needs<br />
State<br />
Rate<br />
State<br />
Target<br />
LEA<br />
Rate<br />
Target<br />
Met by<br />
LEA(Y/N)<br />
89.61% 90.50% — — N/A 90.31% 90.50% — — N/A 90.82% 92.50% — — N/A<br />
66.58% 69.50% — — N/A 57.43% 60.50% — — N/A 76.69% 78.50% — — N/A<br />
NOTE: * Including social relationships ** Including early language/ communication and early literacy<br />
Note: - - denotes not applicable<br />
State<br />
Rate<br />
LEA<br />
Rate<br />
— —<br />
— —<br />
— —<br />
— —<br />
— —<br />
C) Use of<br />
Appropriate<br />
Behaviors to<br />
Meet Their Needs<br />
State<br />
Rate<br />
4.51%<br />
17.34%<br />
41.72%<br />
34.97%<br />
LEA<br />
Rate<br />
1.46% — —<br />
— —<br />
— —<br />
— —<br />
— —<br />
Page 3 of 5
LEA: 6050 - JACKSONVILLE LIGHT HOUSE CHARTER SCHOOL<br />
Indicator 08: Parent Involvement<br />
Percent of surveyed<br />
parents who reported<br />
school facilitated parent<br />
involvement as a means<br />
of improving services<br />
and results for children<br />
with disabilities.<br />
Early Childhood<br />
(3-5)<br />
School Age<br />
(5-21)<br />
State<br />
Rate<br />
90.47%<br />
95.05%<br />
Indicator 09: Disproportionality - Eligibility<br />
Disproportionate representation of racial<br />
and ethnic groups in special education and<br />
related services that is a result of<br />
inappropriate identification (e.g.<br />
monitoring data, review of policies,<br />
practices, and procedures under 618(d),<br />
etc.).<br />
State<br />
Rate<br />
State<br />
Target<br />
88.00%<br />
96.00%<br />
State<br />
Target<br />
0.00% 0.00%<br />
LEA<br />
Rate<br />
— —<br />
— —<br />
Indicator 10: Disproportionality-Child with a Disability<br />
Disproportionate representation of racial<br />
and ethnic groups in specific disability<br />
categories that is a result of inappropriate<br />
identification (e.g. monitoring data, review<br />
of policies, practices, and procedures under<br />
618(d), etc.).<br />
Indicator 11: Child Find<br />
Percent of children with<br />
parental consent to evaluate<br />
who are evaluated within<br />
the State established timeline<br />
of 60 days.<br />
Overall<br />
(3-21)<br />
Early Childhood<br />
(3-5)<br />
School Age<br />
(5-21)<br />
State<br />
Rate<br />
0.00%<br />
Indicator 12: Early Childhood Transition<br />
Percent of children referred by Part C prior to<br />
age 3, who are found eligible for Part B, and<br />
who have an IEP developed and implemented<br />
by their third birthday.<br />
Note: - - denotes not applicable<br />
State<br />
Rate<br />
99.41%<br />
99.70%<br />
98.97%<br />
State<br />
Rate<br />
State<br />
Target<br />
0.00%<br />
State<br />
Target<br />
100.00%<br />
100.00%<br />
100.00%<br />
State<br />
Target<br />
Target Met by<br />
LEA (Y/N)<br />
Y<br />
Target Met by<br />
LEA (Y/N)<br />
Y<br />
LEA<br />
Rate<br />
100.00%<br />
— —<br />
100.00%<br />
LEA<br />
Rate<br />
Target Met by<br />
LEA (Y/N)<br />
N/A<br />
N<br />
Note: The target for Indicator 09 is to have zero percent<br />
(0%) of districts identified as having disproportionate<br />
representation as a result of inappropriate<br />
identification in eligibility.<br />
Note: The target for Indicator 10 is to have zero<br />
percent (0%) of districts identified as having<br />
disproportionate representation as a result of<br />
inappropriate identification in a disability<br />
category.<br />
Target Met by<br />
LEA (Y/N)<br />
N/A<br />
Y<br />
Target Met<br />
by LEA<br />
(Y/N)<br />
99.21% 100.00% - - N/A<br />
Y<br />
Note: * Indicates a zero reponse rate for the<br />
district.<br />
Page 4 of 5
LEA: 6050 - JACKSONVILLE LIGHT HOUSE CHARTER SCHOOL<br />
Indicator 13: Secondary Transition<br />
Percent of youth with disabilities aged 16 and<br />
up with an IEP that includes coordinated,<br />
measurable, annual IEP goals and transition<br />
services that will reasonably enable the student<br />
to meet the post-secondary goals.<br />
Indicator 14: Post-School Outcomes<br />
A. Percent of youth enrolled in higher<br />
education within one year of leaving high<br />
school.<br />
State<br />
Rate<br />
State<br />
Target<br />
Note: Data for this Indicator is from the on-site monitoring of LEAs for the given year.<br />
B. Percent of youth enrolled in higher<br />
education or competitively employed<br />
within one year of leaving high school.<br />
C. Percent of youth enrolled in higher<br />
education or in some other postsecondary<br />
education or training program; or<br />
competitively employed or in some other<br />
employment within one year of leaving<br />
high school.<br />
State<br />
Rate<br />
Indicator 20: Reported Data-Timely and Accurate*<br />
District submitted<br />
required data elements<br />
on or before due dates;<br />
made revisions within<br />
the alloted reveiw<br />
periods.<br />
Accurate and Timely<br />
Data Submission<br />
Overall (3-21)<br />
Early Childhood (3-5)<br />
School Age (5-21)<br />
State<br />
Target<br />
100.00%<br />
100.00%<br />
100.00%<br />
State<br />
Target<br />
LEA<br />
Rate<br />
LEA<br />
Rate<br />
Target Met by<br />
LEA (Y/N)<br />
Target Met<br />
by LEA<br />
(Y/N)<br />
Target Met<br />
by LEA<br />
(Y/N)<br />
*Data reviewed for timely and accurate submissions included all APSCN cycle data except for personnel<br />
Note: - - denotes not applicable<br />
96.19 100.00 — — N/A<br />
14.53<br />
State<br />
Rate<br />
49.42<br />
State<br />
Rate<br />
54.07<br />
13.00<br />
State<br />
Target<br />
49.00<br />
State<br />
Target<br />
60.00<br />
Y<br />
N/A<br />
Y<br />
— —<br />
LEA<br />
Rate<br />
— —<br />
LEA<br />
Rate<br />
— —<br />
N/A<br />
Target Met<br />
by LEA<br />
(Y/N)<br />
N/A<br />
Target Met<br />
by LEA<br />
(Y/N)<br />
N/A<br />
Page 5 of 5
<strong>ARKANSAS</strong> <strong>SPECIAL</strong> <strong>EDUCATION</strong><br />
<strong>DISTRICT</strong> <strong>ANNUAL</strong> PERFORMANCE REPORT<br />
2010/11 School Year<br />
Publication Date: March 2012<br />
Each State must have in place a State Performance Plan (SPP) to evaluate the State's efforts to meet the requirements and<br />
purposes of the implementation of the Individuals with Disabilities Education Act (IDEA). The SPP is a six-year plan, which<br />
describes Arkansas's performance on 20 indicators. The Office of Special Education Programs in the U. S. Department of<br />
Education requires that States report annually to the public on the performance of each local education agency (LEA) on 14 of<br />
20 indicators as compared with targets established by the State in the SPP. Arkansas will report indicators 1 through 14 and<br />
20 for each LEA serving children with disabilities (CWD). Any LEA not meeting targets on compliance indicators (0% for<br />
Indicators 4B, 09 & 10 and 100% for Indicators 11, 12, 13, and 20) are non-compliant with IDEA.<br />
There are no report changes for the 2010/11 school year profile; However, it is important to recognize that: .<br />
1. Indicator 01 (Graduation) is reported a year in arrear (2009/10 graduates) and is based on a four-year cohort. This<br />
means the rate is a measure of students who entered in ninth grade and graduate in four years. The calculation is a<br />
requirement under Title I of the Elementary and Secondary Education Act (ESEA).<br />
2. Indicator 02 (Drop out) is reported a year in arrear. This means the rate is a measure of students who dropped out in<br />
the 2009/10 school year. The Indicator 02 data are aligned with the Common Core of Data (CCD) requirements for<br />
grades 7-12.<br />
3. Indicator 04A and 4B (Suspension/Expulsion) is reported a year in arrear. This means the rate is a measure of<br />
students who had out-of-school suspensions and/or expulsions totaling more than 10 days.<br />
For a complete description of all the Indicators, please visit the special education website at<br />
http://arksped.k12.ar.us/sections/policy.html<br />
LEA: 6051 - URBAN COLLEGIATE PUBLIC CHARTER<br />
Indicator 01: Graduation Rates (2009/10 school year) Indicator 02: Dropout Rates (2009/10 school year)<br />
Percent of youth<br />
with IEPs<br />
graduating from<br />
high school with a<br />
regular diploma<br />
State<br />
Rate<br />
State<br />
Target<br />
75.76% 85.00%<br />
LEA<br />
Rate<br />
— —<br />
Target Met<br />
by LEA<br />
(Y/N)<br />
NA<br />
Percent of<br />
youth with<br />
IEPs dropping<br />
out of high<br />
school<br />
State<br />
Rate<br />
Indicator 03: Assessment on Statewide Benchmark Exam (grades 3-8, 11)<br />
A) Adequate Yearly Progress<br />
n=40<br />
Literacy<br />
Mathematics<br />
Met Disability Subgroup "n"<br />
for Reporting Purposes (Y/N)<br />
State Target for % of Districts Meeting<br />
AYP for Disability Subgroup<br />
State<br />
Target<br />
3.06% 4.20%<br />
LEA<br />
Rate<br />
0.00%<br />
% of Districts Meeting AYP<br />
for Disability Subgroup<br />
Target Met by<br />
LEA (Y/N)<br />
Y<br />
Target Met by<br />
LEA(Y/N)<br />
Overall N 17.15% 6.25%<br />
NA<br />
N<br />
N<br />
Note: For a district to qualify as having a disability subgroup it must have a minimum of 40 (n=40) students with disabilities in a school building.<br />
B) Participation<br />
Participation Rate: # of<br />
CWD Tested ÷ # of CWD<br />
Enrolled in grades tested.<br />
Participation Rate: Literacy<br />
Participation Rate: Math<br />
Note: - - denotes not applicable<br />
State<br />
Rate<br />
98.78%<br />
State<br />
Target<br />
95.00%<br />
LEA<br />
Rate<br />
— —<br />
Target Met<br />
by LEA (Y/N)<br />
N/A<br />
98.61% 95.00% — — N/A<br />
C) Performance Proficiency<br />
Percent of CWD Scoring<br />
Proficient or Above<br />
Proficiency Rate: Literacy<br />
Proficiency Rate:<br />
Mathematics<br />
16.00%<br />
16.00%<br />
State<br />
Rate<br />
31.49%<br />
44.86%<br />
State<br />
Target<br />
45.22%<br />
51.14%<br />
LEA<br />
Rate<br />
— —<br />
— —<br />
NA<br />
NA<br />
Target<br />
Met by<br />
LEA (Y/N)<br />
N/A<br />
N/A<br />
Page 1 of 5
LEA: 6051 - URBAN COLLEGIATE PUBLIC CHARTER<br />
Indicator 04: Out-of-School Suspensions and Expulsions (2009/10 school year)<br />
A) Suspension/Expulsion<br />
Percent difference of CWD with out-of- school suspensions and<br />
expulsions totaling greater than 10 days in a school year as<br />
compared to the same data for general education students in<br />
the district.<br />
B) Suspension/Expulsion by Race and Ethnicity<br />
Percent of districts that have: (a) a significant discrepancy, by race or<br />
ethnicity, in the rate of suspensions and expulsions of greater than 10<br />
days in a school year for children with IEPs; and (b) policies,<br />
procedures or practices that contribute to the significant discrepancy<br />
and do not comply with requirements relating to the development<br />
and implementation of IEPs, the use of positive behavioral<br />
interventions and supports, and procedural safeguards.<br />
Indicator 05: School Age (5-21) Least Restrictive Environment<br />
A) In the Regular Class 80% or more of the day<br />
Percent of CWD with<br />
IEPs receiving instruction<br />
in the regular class 80%<br />
or more of the day.<br />
State<br />
Rate<br />
State<br />
Target<br />
LEA<br />
Rate<br />
B) In the Regular Class less than 40% of the day<br />
Percent of CWD with<br />
IEPs receiving instruction<br />
in the regular class less<br />
than 60% of the day.<br />
53.87% 59.77%<br />
State<br />
Rate<br />
State<br />
Target<br />
12.42% 12.51%<br />
100.00%<br />
LEA<br />
Rate<br />
0.00%<br />
C) Other Settings outside the regular class<br />
Percent of CWD with IEPs served in<br />
public or private separate schools,<br />
residential placements, or<br />
homebound/hospital placements.<br />
State<br />
Rate<br />
State<br />
Target<br />
2.80% 2.56%<br />
Target Met<br />
by LEA (Y/N)<br />
Y<br />
Target Met<br />
by LEA (Y/N)<br />
Y<br />
LEA<br />
Rate<br />
0.00%<br />
Target Met<br />
by LEA(Y/N)<br />
Indicator 06: Early Childhood (3-5) Least Restrictive Environment<br />
A) Regular Early Childhood Program<br />
Percent of children (aged 3 through 5) with IEPs attending a regular<br />
early childhood program and receiving the majority of special<br />
education and related services in the regular early childhood program<br />
Allowable<br />
Difference<br />
LEA: 6051 - URBAN COLLEGIATE PUBLIC CHARTER<br />
Indicator 07: Preschool (3-5) Outcomes<br />
a) Percent of preschool CWD<br />
children who did not<br />
improve functioning.<br />
b) Percent of preschool CWD<br />
who improved but whose<br />
functioning remained below<br />
same age peers.<br />
c) Percent of preschool CWD<br />
who improved at a level<br />
nearer to same aged peers.<br />
d) Percent of preschool CWD<br />
who improved functioning to<br />
reach a level comparable to<br />
same age peers.<br />
e) Percent of preschool CWD<br />
children who maintain<br />
functioning at a level<br />
comparable to same aged<br />
peers.<br />
Summary<br />
Statements<br />
1) Of those preschool<br />
children who entered<br />
the preschool program<br />
below age expectations<br />
in each Outcome, the<br />
percent who<br />
substantially increased<br />
their rate of growth by<br />
the time they turned 6<br />
years of age or exited<br />
the program.<br />
2) The percent of<br />
preschool children who<br />
were functioning<br />
within age expectations<br />
in each Outcome by the<br />
time they turned 6<br />
years of age or exited<br />
A) Positive Social -Emotional<br />
Skills*<br />
State<br />
Rate<br />
A) Positive Social -<br />
Emotional Skills<br />
(Including social<br />
relationships)<br />
State<br />
Rate<br />
2.14%<br />
5.31%<br />
25.97%<br />
38.22%<br />
28.36%<br />
State<br />
Target<br />
LEA<br />
Rate<br />
LEA<br />
Rate<br />
— —<br />
— —<br />
— —<br />
— —<br />
— —<br />
Target<br />
Met by<br />
LEA(Y/N)<br />
B) Acquisition and Use of<br />
Knowledge and Skills<br />
(Including early language/<br />
communication and early literacy)<br />
B) Acquisition and Use of<br />
Knowledge and Skills **<br />
State<br />
Rate<br />
1.75%<br />
6.59%<br />
34.23%<br />
43.51%<br />
13.92%<br />
State<br />
Target<br />
LEA<br />
Rate<br />
Target<br />
Met by<br />
LEA(Y/N)<br />
C) Use of Appropriate Behaviors<br />
to Meet Their Needs<br />
State<br />
Rate<br />
State<br />
Target<br />
LEA<br />
Rate<br />
Target<br />
Met by<br />
LEA(Y/N)<br />
89.61% 90.50% — — N/A 90.31% 90.50% — — N/A 90.82% 92.50% — — N/A<br />
66.58% 69.50% — — N/A 57.43% 60.50% — — N/A 76.69% 78.50% — — N/A<br />
NOTE: * Including social relationships ** Including early language/ communication and early literacy<br />
Note: - - denotes not applicable<br />
State<br />
Rate<br />
LEA<br />
Rate<br />
— —<br />
— —<br />
— —<br />
— —<br />
— —<br />
C) Use of<br />
Appropriate<br />
Behaviors to<br />
Meet Their Needs<br />
State<br />
Rate<br />
4.51%<br />
17.34%<br />
41.72%<br />
34.97%<br />
LEA<br />
Rate<br />
1.46% — —<br />
— —<br />
— —<br />
— —<br />
— —<br />
Page 3 of 5
LEA: 6051 - URBAN COLLEGIATE PUBLIC CHARTER<br />
Indicator 08: Parent Involvement<br />
Percent of surveyed<br />
parents who reported<br />
school facilitated parent<br />
involvement as a means<br />
of improving services<br />
and results for children<br />
with disabilities.<br />
Early Childhood<br />
(3-5)<br />
School Age<br />
(5-21)<br />
State<br />
Rate<br />
90.47%<br />
95.05%<br />
Indicator 09: Disproportionality - Eligibility<br />
Disproportionate representation of racial<br />
and ethnic groups in special education and<br />
related services that is a result of<br />
inappropriate identification (e.g.<br />
monitoring data, review of policies,<br />
practices, and procedures under 618(d),<br />
etc.).<br />
State<br />
Rate<br />
State<br />
Target<br />
88.00%<br />
96.00%<br />
State<br />
Target<br />
0.00% 0.00%<br />
LEA<br />
Rate<br />
— —<br />
— —<br />
Indicator 10: Disproportionality-Child with a Disability<br />
Disproportionate representation of racial<br />
and ethnic groups in specific disability<br />
categories that is a result of inappropriate<br />
identification (e.g. monitoring data, review<br />
of policies, practices, and procedures under<br />
618(d), etc.).<br />
Indicator 11: Child Find<br />
Percent of children with<br />
parental consent to evaluate<br />
who are evaluated within<br />
the State established timeline<br />
of 60 days.<br />
Overall<br />
(3-21)<br />
Early Childhood<br />
(3-5)<br />
School Age<br />
(5-21)<br />
State<br />
Rate<br />
0.00%<br />
Indicator 12: Early Childhood Transition<br />
Percent of children referred by Part C prior to<br />
age 3, who are found eligible for Part B, and<br />
who have an IEP developed and implemented<br />
by their third birthday.<br />
Note: - - denotes not applicable<br />
State<br />
Rate<br />
99.41%<br />
99.70%<br />
98.97%<br />
State<br />
Rate<br />
State<br />
Target<br />
0.00%<br />
State<br />
Target<br />
100.00%<br />
100.00%<br />
100.00%<br />
State<br />
Target<br />
Target Met by<br />
LEA (Y/N)<br />
Y<br />
Target Met by<br />
LEA (Y/N)<br />
Y<br />
LEA<br />
Rate<br />
— —<br />
— —<br />
— —<br />
LEA<br />
Rate<br />
Target Met by<br />
LEA (Y/N)<br />
N/A<br />
N<br />
Note: The target for Indicator 09 is to have zero percent<br />
(0%) of districts identified as having disproportionate<br />
representation as a result of inappropriate<br />
identification in eligibility.<br />
Note: The target for Indicator 10 is to have zero<br />
percent (0%) of districts identified as having<br />
disproportionate representation as a result of<br />
inappropriate identification in a disability<br />
category.<br />
Target Met by<br />
LEA (Y/N)<br />
N/A<br />
N/A<br />
N/A<br />
Target Met<br />
by LEA<br />
(Y/N)<br />
99.21% 100.00% - - N/A<br />
Note: * Indicates a zero reponse rate for the<br />
district.<br />
Page 4 of 5
LEA: 6051 - URBAN COLLEGIATE PUBLIC CHARTER<br />
Indicator 13: Secondary Transition<br />
Percent of youth with disabilities aged 16 and<br />
up with an IEP that includes coordinated,<br />
measurable, annual IEP goals and transition<br />
services that will reasonably enable the student<br />
to meet the post-secondary goals.<br />
Indicator 14: Post-School Outcomes<br />
A. Percent of youth enrolled in higher<br />
education within one year of leaving high<br />
school.<br />
State<br />
Rate<br />
State<br />
Target<br />
Note: Data for this Indicator is from the on-site monitoring of LEAs for the given year.<br />
B. Percent of youth enrolled in higher<br />
education or competitively employed<br />
within one year of leaving high school.<br />
C. Percent of youth enrolled in higher<br />
education or in some other postsecondary<br />
education or training program; or<br />
competitively employed or in some other<br />
employment within one year of leaving<br />
high school.<br />
State<br />
Rate<br />
Indicator 20: Reported Data-Timely and Accurate*<br />
District submitted<br />
required data elements<br />
on or before due dates;<br />
made revisions within<br />
the alloted reveiw<br />
periods.<br />
Accurate and Timely<br />
Data Submission<br />
Overall (3-21)<br />
Early Childhood (3-5)<br />
School Age (5-21)<br />
State<br />
Target<br />
100.00%<br />
100.00%<br />
100.00%<br />
State<br />
Target<br />
LEA<br />
Rate<br />
LEA<br />
Rate<br />
Target Met by<br />
LEA (Y/N)<br />
Target Met<br />
by LEA<br />
(Y/N)<br />
Target Met<br />
by LEA<br />
(Y/N)<br />
*Data reviewed for timely and accurate submissions included all APSCN cycle data except for personnel<br />
Note: - - denotes not applicable<br />
96.19 100.00 — — N/A<br />
14.53<br />
State<br />
Rate<br />
49.42<br />
State<br />
Rate<br />
54.07<br />
13.00<br />
State<br />
Target<br />
49.00<br />
State<br />
Target<br />
60.00<br />
Y<br />
N/A<br />
Y<br />
— —<br />
LEA<br />
Rate<br />
— —<br />
LEA<br />
Rate<br />
— —<br />
N/A<br />
Target Met<br />
by LEA<br />
(Y/N)<br />
N/A<br />
Target Met<br />
by LEA<br />
(Y/N)<br />
N/A<br />
Page 5 of 5
LEA: 6091 - AR SCHOOL FOR THE BLIND<br />
<strong>ARKANSAS</strong> <strong>SPECIAL</strong> <strong>EDUCATION</strong><br />
<strong>DISTRICT</strong> <strong>ANNUAL</strong> PERFORMANCE REPORT<br />
2010/11 School Year<br />
Publication Date: March 2012<br />
Each State must have in place a State Performance Plan (SPP) to evaluate the State's efforts to meet the requirements and<br />
purposes of the implementation of the Individuals with Disabilities Education Act (IDEA). The SPP is a six-year plan, which<br />
describes Arkansas's performance on 20 indicators. The Office of Special Education Programs in the U. S. Department of<br />
Education requires that States report annually to the public on the performance of each local education agency (LEA) on 14 of<br />
20 indicators as compared with targets established by the State in the SPP. Arkansas will report indicators 1 through 14 and<br />
20 for each LEA serving children with disabilities (CWD). Any LEA not meeting targets on compliance indicators (0% for<br />
Indicators 4B, 09 & 10 and 100% for Indicators 11, 12, 13, and 20) are non-compliant with IDEA.<br />
There are no report changes for the 2010/11 school year profile; However, it is important to recognize that: .<br />
1. Indicator 01 (Graduation) is reported a year in arrear (2009/10 graduates) and is based on a four-year cohort. This<br />
means the rate is a measure of students who entered in ninth grade and graduate in four years. The calculation is a<br />
requirement under Title I of the Elementary and Secondary Education Act (ESEA).<br />
2. Indicator 02 (Drop out) is reported a year in arrear. This means the rate is a measure of students who dropped out in<br />
the 2009/10 school year. The Indicator 02 data are aligned with the Common Core of Data (CCD) requirements for<br />
grades 7-12.<br />
3. Indicator 04A and 4B (Suspension/Expulsion) is reported a year in arrear. This means the rate is a measure of<br />
students who had out-of-school suspensions and/or expulsions totaling more than 10 days.<br />
Percent of youth<br />
with IEPs<br />
graduating from<br />
high school with a<br />
regular diploma<br />
For a complete description of all the Indicators, please visit the special education website at<br />
http://arksped.k12.ar.us/sections/policy.html<br />
Indicator 01: Graduation Rates (2009/10 school year) Indicator 02: Dropout Rates (2009/10 school year)<br />
State<br />
Rate<br />
State<br />
Target<br />
75.76% 85.00%<br />
LEA<br />
Rate<br />
80.00%<br />
Target Met<br />
by LEA<br />
(Y/N)<br />
N<br />
Percent of<br />
youth with<br />
IEPs dropping<br />
out of high<br />
school<br />
State<br />
Rate<br />
Indicator 03: Assessment on Statewide Benchmark Exam (grades 3-8, 11)<br />
A) Adequate Yearly Progress<br />
n=40<br />
Literacy<br />
Mathematics<br />
Met Disability Subgroup "n"<br />
for Reporting Purposes (Y/N)<br />
State Target for % of Districts Meeting<br />
AYP for Disability Subgroup<br />
State<br />
Target<br />
3.06% 4.20%<br />
LEA<br />
Rate<br />
0.00%<br />
% of Districts Meeting AYP<br />
for Disability Subgroup<br />
Target Met by<br />
LEA (Y/N)<br />
Y<br />
Target Met by<br />
LEA(Y/N)<br />
Overall N 17.15% 6.25%<br />
NA<br />
N<br />
N<br />
Note: For a district to qualify as having a disability subgroup it must have a minimum of 40 (n=40) students with disabilities in a school building.<br />
B) Participation<br />
Participation Rate: # of<br />
CWD Tested ÷ # of CWD<br />
Enrolled in grades tested.<br />
Participation Rate: Literacy<br />
Participation Rate: Math<br />
Note: - - denotes not applicable<br />
State<br />
Rate<br />
98.78%<br />
State<br />
Target<br />
95.00%<br />
LEA<br />
Rate<br />
78.26%<br />
Target Met<br />
by LEA (Y/N)<br />
N<br />
98.61% 95.00% 78.57% N<br />
C) Performance Proficiency<br />
Percent of CWD Scoring<br />
Proficient or Above<br />
Proficiency Rate: Literacy<br />
Proficiency Rate:<br />
Mathematics<br />
16.00%<br />
16.00%<br />
State<br />
Rate<br />
31.49%<br />
44.86%<br />
State<br />
Target<br />
45.22%<br />
51.14%<br />
LEA<br />
Rate<br />
42.42%<br />
46.34%<br />
NA<br />
NA<br />
Target<br />
Met by<br />
LEA (Y/N)<br />
N<br />
N<br />
Page 1 of 5
LEA: 6091 - AR SCHOOL FOR THE BLIND<br />
Indicator 04: Out-of-School Suspensions and Expulsions (2009/10 school year)<br />
A) Suspension/Expulsion<br />
Percent difference of CWD with out-of- school suspensions and<br />
expulsions totaling greater than 10 days in a school year as<br />
compared to the same data for general education students in<br />
the district.<br />
B) Suspension/Expulsion by Race and Ethnicity<br />
Percent of districts that have: (a) a significant discrepancy, by race or<br />
ethnicity, in the rate of suspensions and expulsions of greater than 10<br />
days in a school year for children with IEPs; and (b) policies,<br />
procedures or practices that contribute to the significant discrepancy<br />
and do not comply with requirements relating to the development<br />
and implementation of IEPs, the use of positive behavioral<br />
interventions and supports, and procedural safeguards.<br />
Indicator 05: School Age (5-21) Least Restrictive Environment<br />
A) In the Regular Class 80% or more of the day<br />
Percent of CWD with<br />
IEPs receiving instruction<br />
in the regular class 80%<br />
or more of the day.<br />
State<br />
Rate<br />
State<br />
Target<br />
LEA<br />
Rate<br />
B) In the Regular Class less than 40% of the day<br />
Percent of CWD with<br />
IEPs receiving instruction<br />
in the regular class less<br />
than 60% of the day.<br />
53.87% 59.77%<br />
State<br />
Rate<br />
State<br />
Target<br />
12.42% 12.51%<br />
0.00%<br />
LEA<br />
Rate<br />
0.00%<br />
C) Other Settings outside the regular class<br />
Percent of CWD with IEPs served in<br />
public or private separate schools,<br />
residential placements, or<br />
homebound/hospital placements.<br />
State<br />
Rate<br />
State<br />
Target<br />
2.80% 2.56%<br />
Target Met<br />
by LEA (Y/N)<br />
N<br />
Target Met<br />
by LEA (Y/N)<br />
Y<br />
LEA<br />
Rate<br />
100.00%<br />
Target Met<br />
by LEA(Y/N)<br />
Indicator 06: Early Childhood (3-5) Least Restrictive Environment<br />
A) Regular Early Childhood Program<br />
Percent of children (aged 3 through 5) with IEPs attending a regular<br />
early childhood program and receiving the majority of special<br />
education and related services in the regular early childhood program<br />
Allowable<br />
Difference<br />
LEA: 6091 - AR SCHOOL FOR THE BLIND<br />
Indicator 07: Preschool (3-5) Outcomes<br />
a) Percent of preschool CWD<br />
children who did not<br />
improve functioning.<br />
b) Percent of preschool CWD<br />
who improved but whose<br />
functioning remained below<br />
same age peers.<br />
c) Percent of preschool CWD<br />
who improved at a level<br />
nearer to same aged peers.<br />
d) Percent of preschool CWD<br />
who improved functioning to<br />
reach a level comparable to<br />
same age peers.<br />
e) Percent of preschool CWD<br />
children who maintain<br />
functioning at a level<br />
comparable to same aged<br />
peers.<br />
Summary<br />
Statements<br />
1) Of those preschool<br />
children who entered<br />
the preschool program<br />
below age expectations<br />
in each Outcome, the<br />
percent who<br />
substantially increased<br />
their rate of growth by<br />
the time they turned 6<br />
years of age or exited<br />
the program.<br />
2) The percent of<br />
preschool children who<br />
were functioning<br />
within age expectations<br />
in each Outcome by the<br />
time they turned 6<br />
years of age or exited<br />
A) Positive Social -Emotional<br />
Skills*<br />
State<br />
Rate<br />
A) Positive Social -<br />
Emotional Skills<br />
(Including social<br />
relationships)<br />
State<br />
Rate<br />
2.14%<br />
5.31%<br />
25.97%<br />
38.22%<br />
28.36%<br />
State<br />
Target<br />
LEA<br />
Rate<br />
LEA<br />
Rate<br />
— —<br />
— —<br />
40.00%<br />
40.00%<br />
20.00%<br />
Target<br />
Met by<br />
LEA(Y/N)<br />
B) Acquisition and Use of<br />
Knowledge and Skills<br />
(Including early language/<br />
communication and early literacy)<br />
B) Acquisition and Use of<br />
Knowledge and Skills **<br />
State<br />
Rate<br />
1.75%<br />
6.59%<br />
34.23%<br />
43.51%<br />
13.92%<br />
State<br />
Target<br />
LEA<br />
Rate<br />
Target<br />
Met by<br />
LEA(Y/N)<br />
C) Use of Appropriate Behaviors<br />
to Meet Their Needs<br />
State<br />
Rate<br />
State<br />
Target<br />
LEA<br />
Rate<br />
Target<br />
Met by<br />
LEA(Y/N)<br />
89.61% 90.50% 100.00% Y 90.31% 90.50% 100.00% Y 90.82% 92.50% 100.00% Y<br />
66.58% 69.50% 60.00% N 57.43% 60.50% 80.00% Y 76.69% 78.50% 60.00% N<br />
NOTE: * Including social relationships ** Including early language/ communication and early literacy<br />
Note: - - denotes not applicable<br />
State<br />
Rate<br />
LEA<br />
Rate<br />
— —<br />
— —<br />
20.00%<br />
60.00%<br />
20.00%<br />
C) Use of<br />
Appropriate<br />
Behaviors to<br />
Meet Their Needs<br />
State<br />
Rate<br />
4.51%<br />
17.34%<br />
41.72%<br />
34.97%<br />
LEA<br />
Rate<br />
1.46% — —<br />
— —<br />
40.00%<br />
20.00%<br />
40.00%<br />
Page 3 of 5
LEA: 6091 - AR SCHOOL FOR THE BLIND<br />
Indicator 08: Parent Involvement<br />
Percent of surveyed<br />
parents who reported<br />
school facilitated parent<br />
involvement as a means<br />
of improving services<br />
and results for children<br />
with disabilities.<br />
Early Childhood<br />
(3-5)<br />
School Age<br />
(5-21)<br />
State<br />
Rate<br />
90.47%<br />
95.05%<br />
Indicator 09: Disproportionality - Eligibility<br />
Disproportionate representation of racial<br />
and ethnic groups in special education and<br />
related services that is a result of<br />
inappropriate identification (e.g.<br />
monitoring data, review of policies,<br />
practices, and procedures under 618(d),<br />
etc.).<br />
State<br />
Rate<br />
State<br />
Target<br />
88.00%<br />
96.00%<br />
State<br />
Target<br />
0.00% 0.00%<br />
LEA<br />
Rate<br />
100.00%<br />
79.17%<br />
Indicator 10: Disproportionality-Child with a Disability<br />
Disproportionate representation of racial<br />
and ethnic groups in specific disability<br />
categories that is a result of inappropriate<br />
identification (e.g. monitoring data, review<br />
of policies, practices, and procedures under<br />
618(d), etc.).<br />
Indicator 11: Child Find<br />
Percent of children with<br />
parental consent to evaluate<br />
who are evaluated within<br />
the State established timeline<br />
of 60 days.<br />
Overall<br />
(3-21)<br />
Early Childhood<br />
(3-5)<br />
School Age<br />
(5-21)<br />
State<br />
Rate<br />
0.00%<br />
Indicator 12: Early Childhood Transition<br />
Percent of children referred by Part C prior to<br />
age 3, who are found eligible for Part B, and<br />
who have an IEP developed and implemented<br />
by their third birthday.<br />
Note: - - denotes not applicable<br />
State<br />
Rate<br />
99.41%<br />
99.70%<br />
98.97%<br />
State<br />
Rate<br />
State<br />
Target<br />
0.00%<br />
State<br />
Target<br />
100.00%<br />
100.00%<br />
100.00%<br />
State<br />
Target<br />
Target Met by<br />
LEA (Y/N)<br />
Y<br />
Target Met by<br />
LEA (Y/N)<br />
Y<br />
LEA<br />
Rate<br />
— —<br />
— —<br />
— —<br />
LEA<br />
Rate<br />
Target Met by<br />
LEA (Y/N)<br />
Y<br />
N<br />
Note: The target for Indicator 09 is to have zero percent<br />
(0%) of districts identified as having disproportionate<br />
representation as a result of inappropriate<br />
identification in eligibility.<br />
Note: The target for Indicator 10 is to have zero<br />
percent (0%) of districts identified as having<br />
disproportionate representation as a result of<br />
inappropriate identification in a disability<br />
category.<br />
Target Met by<br />
LEA (Y/N)<br />
N/A<br />
N/A<br />
N/A<br />
Target Met<br />
by LEA<br />
(Y/N)<br />
99.21% 100.00% - - N/A<br />
Note: * Indicates a zero reponse rate for the<br />
district.<br />
Page 4 of 5
LEA: 6091 - AR SCHOOL FOR THE BLIND<br />
Indicator 13: Secondary Transition<br />
Percent of youth with disabilities aged 16 and<br />
up with an IEP that includes coordinated,<br />
measurable, annual IEP goals and transition<br />
services that will reasonably enable the student<br />
to meet the post-secondary goals.<br />
Indicator 14: Post-School Outcomes<br />
A. Percent of youth enrolled in higher<br />
education within one year of leaving high<br />
school.<br />
State<br />
Rate<br />
State<br />
Target<br />
Note: Data for this Indicator is from the on-site monitoring of LEAs for the given year.<br />
B. Percent of youth enrolled in higher<br />
education or competitively employed<br />
within one year of leaving high school.<br />
C. Percent of youth enrolled in higher<br />
education or in some other postsecondary<br />
education or training program; or<br />
competitively employed or in some other<br />
employment within one year of leaving<br />
high school.<br />
State<br />
Rate<br />
Indicator 20: Reported Data-Timely and Accurate*<br />
District submitted<br />
required data elements<br />
on or before due dates;<br />
made revisions within<br />
the alloted reveiw<br />
periods.<br />
Accurate and Timely<br />
Data Submission<br />
Overall (3-21)<br />
Early Childhood (3-5)<br />
School Age (5-21)<br />
State<br />
Target<br />
100.00%<br />
100.00%<br />
100.00%<br />
State<br />
Target<br />
LEA<br />
Rate<br />
LEA<br />
Rate<br />
Target Met by<br />
LEA (Y/N)<br />
Target Met<br />
by LEA<br />
(Y/N)<br />
Target Met<br />
by LEA<br />
(Y/N)<br />
*Data reviewed for timely and accurate submissions included all APSCN cycle data except for personnel<br />
Note: - - denotes not applicable<br />
96.19 100.00 — — N/A<br />
14.53<br />
State<br />
Rate<br />
49.42<br />
State<br />
Rate<br />
54.07<br />
13.00<br />
State<br />
Target<br />
49.00<br />
State<br />
Target<br />
60.00<br />
Y<br />
Y<br />
Y<br />
— —<br />
LEA<br />
Rate<br />
— —<br />
LEA<br />
Rate<br />
— —<br />
N/A<br />
Target Met<br />
by LEA<br />
(Y/N)<br />
N/A<br />
Target Met<br />
by LEA<br />
(Y/N)<br />
N/A<br />
Page 5 of 5
LEA: 6092 - AR SCHOOL FOR THE DEAF<br />
<strong>ARKANSAS</strong> <strong>SPECIAL</strong> <strong>EDUCATION</strong><br />
<strong>DISTRICT</strong> <strong>ANNUAL</strong> PERFORMANCE REPORT<br />
2010/11 School Year<br />
Publication Date: March 2012<br />
Each State must have in place a State Performance Plan (SPP) to evaluate the State's efforts to meet the requirements and<br />
purposes of the implementation of the Individuals with Disabilities Education Act (IDEA). The SPP is a six-year plan, which<br />
describes Arkansas's performance on 20 indicators. The Office of Special Education Programs in the U. S. Department of<br />
Education requires that States report annually to the public on the performance of each local education agency (LEA) on 14 of<br />
20 indicators as compared with targets established by the State in the SPP. Arkansas will report indicators 1 through 14 and<br />
20 for each LEA serving children with disabilities (CWD). Any LEA not meeting targets on compliance indicators (0% for<br />
Indicators 4B, 09 & 10 and 100% for Indicators 11, 12, 13, and 20) are non-compliant with IDEA.<br />
There are no report changes for the 2010/11 school year profile; However, it is important to recognize that: .<br />
1. Indicator 01 (Graduation) is reported a year in arrear (2009/10 graduates) and is based on a four-year cohort. This<br />
means the rate is a measure of students who entered in ninth grade and graduate in four years. The calculation is a<br />
requirement under Title I of the Elementary and Secondary Education Act (ESEA).<br />
2. Indicator 02 (Drop out) is reported a year in arrear. This means the rate is a measure of students who dropped out in<br />
the 2009/10 school year. The Indicator 02 data are aligned with the Common Core of Data (CCD) requirements for<br />
grades 7-12.<br />
3. Indicator 04A and 4B (Suspension/Expulsion) is reported a year in arrear. This means the rate is a measure of<br />
students who had out-of-school suspensions and/or expulsions totaling more than 10 days.<br />
Percent of youth<br />
with IEPs<br />
graduating from<br />
high school with a<br />
regular diploma<br />
For a complete description of all the Indicators, please visit the special education website at<br />
http://arksped.k12.ar.us/sections/policy.html<br />
Indicator 01: Graduation Rates (2009/10 school year) Indicator 02: Dropout Rates (2009/10 school year)<br />
State<br />
Rate<br />
State<br />
Target<br />
75.76% 85.00%<br />
LEA<br />
Rate<br />
100.00%<br />
Target Met<br />
by LEA<br />
(Y/N)<br />
Y<br />
Percent of<br />
youth with<br />
IEPs dropping<br />
out of high<br />
school<br />
State<br />
Rate<br />
Indicator 03: Assessment on Statewide Benchmark Exam (grades 3-8, 11)<br />
A) Adequate Yearly Progress<br />
n=40<br />
Literacy<br />
Mathematics<br />
Met Disability Subgroup "n"<br />
for Reporting Purposes (Y/N)<br />
State Target for % of Districts Meeting<br />
AYP for Disability Subgroup<br />
State<br />
Target<br />
3.06% 4.20%<br />
LEA<br />
Rate<br />
2.94%<br />
% of Districts Meeting AYP<br />
for Disability Subgroup<br />
Target Met by<br />
LEA (Y/N)<br />
Y<br />
Target Met by<br />
LEA(Y/N)<br />
Overall Y 17.15% 6.25%<br />
N<br />
Y<br />
Y<br />
Note: For a district to qualify as having a disability subgroup it must have a minimum of 40 (n=40) students with disabilities in a school building.<br />
B) Participation<br />
Participation Rate: # of<br />
CWD Tested ÷ # of CWD<br />
Enrolled in grades tested.<br />
Participation Rate: Literacy<br />
Participation Rate: Math<br />
Note: - - denotes not applicable<br />
State<br />
Rate<br />
98.78%<br />
State<br />
Target<br />
95.00%<br />
LEA<br />
Rate<br />
98.39%<br />
Target Met<br />
by LEA (Y/N)<br />
98.61% 95.00% 100.00% Y<br />
Y<br />
C) Performance Proficiency<br />
Percent of CWD Scoring<br />
Proficient or Above<br />
Proficiency Rate: Literacy<br />
Proficiency Rate:<br />
Mathematics<br />
16.00%<br />
16.00%<br />
State<br />
Rate<br />
31.49%<br />
44.86%<br />
State<br />
Target<br />
45.22%<br />
51.14%<br />
LEA<br />
Rate<br />
13.11%<br />
20.41%<br />
N<br />
N<br />
Target<br />
Met by<br />
LEA (Y/N)<br />
N<br />
N<br />
Page 1 of 5
LEA: 6092 - AR SCHOOL FOR THE DEAF<br />
Indicator 04: Out-of-School Suspensions and Expulsions (2009/10 school year)<br />
A) Suspension/Expulsion<br />
Percent difference of CWD with out-of- school suspensions and<br />
expulsions totaling greater than 10 days in a school year as<br />
compared to the same data for general education students in<br />
the district.<br />
B) Suspension/Expulsion by Race and Ethnicity<br />
Percent of districts that have: (a) a significant discrepancy, by race or<br />
ethnicity, in the rate of suspensions and expulsions of greater than 10<br />
days in a school year for children with IEPs; and (b) policies,<br />
procedures or practices that contribute to the significant discrepancy<br />
and do not comply with requirements relating to the development<br />
and implementation of IEPs, the use of positive behavioral<br />
interventions and supports, and procedural safeguards.<br />
Indicator 05: School Age (5-21) Least Restrictive Environment<br />
A) In the Regular Class 80% or more of the day<br />
Percent of CWD with<br />
IEPs receiving instruction<br />
in the regular class 80%<br />
or more of the day.<br />
State<br />
Rate<br />
State<br />
Target<br />
LEA<br />
Rate<br />
B) In the Regular Class less than 40% of the day<br />
Percent of CWD with<br />
IEPs receiving instruction<br />
in the regular class less<br />
than 60% of the day.<br />
53.87% 59.77%<br />
State<br />
Rate<br />
State<br />
Target<br />
12.42% 12.51%<br />
0.00%<br />
LEA<br />
Rate<br />
0.00%<br />
C) Other Settings outside the regular class<br />
Percent of CWD with IEPs served in<br />
public or private separate schools,<br />
residential placements, or<br />
homebound/hospital placements.<br />
State<br />
Rate<br />
State<br />
Target<br />
2.80% 2.56%<br />
Target Met<br />
by LEA (Y/N)<br />
N<br />
Target Met<br />
by LEA (Y/N)<br />
Y<br />
LEA<br />
Rate<br />
100.00%<br />
Target Met<br />
by LEA(Y/N)<br />
Indicator 06: Early Childhood (3-5) Least Restrictive Environment<br />
A) Regular Early Childhood Program<br />
Percent of children (aged 3 through 5) with IEPs attending a regular<br />
early childhood program and receiving the majority of special<br />
education and related services in the regular early childhood program<br />
Allowable<br />
Difference<br />
LEA: 6092 - AR SCHOOL FOR THE DEAF<br />
Indicator 07: Preschool (3-5) Outcomes<br />
a) Percent of preschool CWD<br />
children who did not<br />
improve functioning.<br />
b) Percent of preschool CWD<br />
who improved but whose<br />
functioning remained below<br />
same age peers.<br />
c) Percent of preschool CWD<br />
who improved at a level<br />
nearer to same aged peers.<br />
d) Percent of preschool CWD<br />
who improved functioning to<br />
reach a level comparable to<br />
same age peers.<br />
e) Percent of preschool CWD<br />
children who maintain<br />
functioning at a level<br />
comparable to same aged<br />
peers.<br />
Summary<br />
Statements<br />
1) Of those preschool<br />
children who entered<br />
the preschool program<br />
below age expectations<br />
in each Outcome, the<br />
percent who<br />
substantially increased<br />
their rate of growth by<br />
the time they turned 6<br />
years of age or exited<br />
the program.<br />
2) The percent of<br />
preschool children who<br />
were functioning<br />
within age expectations<br />
in each Outcome by the<br />
time they turned 6<br />
years of age or exited<br />
A) Positive Social -Emotional<br />
Skills*<br />
State<br />
Rate<br />
A) Positive Social -<br />
Emotional Skills<br />
(Including social<br />
relationships)<br />
State<br />
Rate<br />
2.14%<br />
5.31%<br />
25.97%<br />
38.22%<br />
28.36%<br />
State<br />
Target<br />
LEA<br />
Rate<br />
LEA<br />
Rate<br />
— —<br />
— —<br />
60.00%<br />
40.00%<br />
— —<br />
Target<br />
Met by<br />
LEA(Y/N)<br />
B) Acquisition and Use of<br />
Knowledge and Skills<br />
(Including early language/<br />
communication and early literacy)<br />
B) Acquisition and Use of<br />
Knowledge and Skills **<br />
State<br />
Rate<br />
1.75%<br />
6.59%<br />
34.23%<br />
43.51%<br />
13.92%<br />
State<br />
Target<br />
LEA<br />
Rate<br />
Target<br />
Met by<br />
LEA(Y/N)<br />
C) Use of Appropriate Behaviors<br />
to Meet Their Needs<br />
State<br />
Rate<br />
State<br />
Target<br />
LEA<br />
Rate<br />
Target<br />
Met by<br />
LEA(Y/N)<br />
89.61% 90.50% 100.00% Y 90.31% 90.50% 100.00% Y 90.82% 92.50% 100.00% Y<br />
66.58% 69.50% 40.00% N 57.43% 60.50% 40.00% N 76.69% 78.50% 40.00% N<br />
NOTE: * Including social relationships ** Including early language/ communication and early literacy<br />
Note: - - denotes not applicable<br />
State<br />
Rate<br />
LEA<br />
Rate<br />
— —<br />
— —<br />
60.00%<br />
40.00%<br />
— —<br />
C) Use of<br />
Appropriate<br />
Behaviors to<br />
Meet Their Needs<br />
State<br />
Rate<br />
4.51%<br />
17.34%<br />
41.72%<br />
34.97%<br />
LEA<br />
Rate<br />
1.46% — —<br />
— —<br />
60.00%<br />
40.00%<br />
— —<br />
Page 3 of 5
LEA: 6092 - AR SCHOOL FOR THE DEAF<br />
Indicator 08: Parent Involvement<br />
Percent of surveyed<br />
parents who reported<br />
school facilitated parent<br />
involvement as a means<br />
of improving services<br />
and results for children<br />
with disabilities.<br />
Early Childhood<br />
(3-5)<br />
School Age<br />
(5-21)<br />
State<br />
Rate<br />
90.47%<br />
95.05%<br />
Indicator 09: Disproportionality - Eligibility<br />
Disproportionate representation of racial<br />
and ethnic groups in special education and<br />
related services that is a result of<br />
inappropriate identification (e.g.<br />
monitoring data, review of policies,<br />
practices, and procedures under 618(d),<br />
etc.).<br />
State<br />
Rate<br />
State<br />
Target<br />
88.00%<br />
96.00%<br />
State<br />
Target<br />
0.00% 0.00%<br />
LEA<br />
Rate<br />
100.00%<br />
90.00%<br />
Indicator 10: Disproportionality-Child with a Disability<br />
Disproportionate representation of racial<br />
and ethnic groups in specific disability<br />
categories that is a result of inappropriate<br />
identification (e.g. monitoring data, review<br />
of policies, practices, and procedures under<br />
618(d), etc.).<br />
Indicator 11: Child Find<br />
Percent of children with<br />
parental consent to evaluate<br />
who are evaluated within<br />
the State established timeline<br />
of 60 days.<br />
Overall<br />
(3-21)<br />
Early Childhood<br />
(3-5)<br />
School Age<br />
(5-21)<br />
State<br />
Rate<br />
0.00%<br />
Indicator 12: Early Childhood Transition<br />
Percent of children referred by Part C prior to<br />
age 3, who are found eligible for Part B, and<br />
who have an IEP developed and implemented<br />
by their third birthday.<br />
Note: - - denotes not applicable<br />
State<br />
Rate<br />
99.41%<br />
99.70%<br />
98.97%<br />
State<br />
Rate<br />
State<br />
Target<br />
0.00%<br />
State<br />
Target<br />
100.00%<br />
100.00%<br />
100.00%<br />
State<br />
Target<br />
Target Met by<br />
LEA (Y/N)<br />
Y<br />
Target Met by<br />
LEA (Y/N)<br />
Y<br />
LEA<br />
Rate<br />
— —<br />
— —<br />
— —<br />
LEA<br />
Rate<br />
Target Met by<br />
LEA (Y/N)<br />
Y<br />
N<br />
Note: The target for Indicator 09 is to have zero percent<br />
(0%) of districts identified as having disproportionate<br />
representation as a result of inappropriate<br />
identification in eligibility.<br />
Note: The target for Indicator 10 is to have zero<br />
percent (0%) of districts identified as having<br />
disproportionate representation as a result of<br />
inappropriate identification in a disability<br />
category.<br />
Target Met by<br />
LEA (Y/N)<br />
N/A<br />
N/A<br />
N/A<br />
Target Met<br />
by LEA<br />
(Y/N)<br />
99.21% 100.00% - - N/A<br />
Note: * Indicates a zero reponse rate for the<br />
district.<br />
Page 4 of 5
LEA: 6092 - AR SCHOOL FOR THE DEAF<br />
Indicator 13: Secondary Transition<br />
Percent of youth with disabilities aged 16 and<br />
up with an IEP that includes coordinated,<br />
measurable, annual IEP goals and transition<br />
services that will reasonably enable the student<br />
to meet the post-secondary goals.<br />
Indicator 14: Post-School Outcomes<br />
A. Percent of youth enrolled in higher<br />
education within one year of leaving high<br />
school.<br />
State<br />
Rate<br />
State<br />
Target<br />
Note: Data for this Indicator is from the on-site monitoring of LEAs for the given year.<br />
B. Percent of youth enrolled in higher<br />
education or competitively employed<br />
within one year of leaving high school.<br />
C. Percent of youth enrolled in higher<br />
education or in some other postsecondary<br />
education or training program; or<br />
competitively employed or in some other<br />
employment within one year of leaving<br />
high school.<br />
State<br />
Rate<br />
Indicator 20: Reported Data-Timely and Accurate*<br />
District submitted<br />
required data elements<br />
on or before due dates;<br />
made revisions within<br />
the alloted reveiw<br />
periods.<br />
Accurate and Timely<br />
Data Submission<br />
Overall (3-21)<br />
Early Childhood (3-5)<br />
School Age (5-21)<br />
State<br />
Target<br />
100.00%<br />
100.00%<br />
100.00%<br />
State<br />
Target<br />
LEA<br />
Rate<br />
LEA<br />
Rate<br />
Target Met by<br />
LEA (Y/N)<br />
Target Met<br />
by LEA<br />
(Y/N)<br />
Target Met<br />
by LEA<br />
(Y/N)<br />
*Data reviewed for timely and accurate submissions included all APSCN cycle data except for personnel<br />
Note: - - denotes not applicable<br />
96.19 100.00 — — N/A<br />
14.53<br />
State<br />
Rate<br />
49.42<br />
State<br />
Rate<br />
54.07<br />
13.00<br />
State<br />
Target<br />
49.00<br />
State<br />
Target<br />
60.00<br />
Y<br />
Y<br />
Y<br />
— —<br />
LEA<br />
Rate<br />
— —<br />
LEA<br />
Rate<br />
— —<br />
N/A<br />
Target Met<br />
by LEA<br />
(Y/N)<br />
N/A<br />
Target Met<br />
by LEA<br />
(Y/N)<br />
N/A<br />
Page 5 of 5
LEA: 6102 - MAYNARD SCHOOL <strong>DISTRICT</strong><br />
<strong>ARKANSAS</strong> <strong>SPECIAL</strong> <strong>EDUCATION</strong><br />
<strong>DISTRICT</strong> <strong>ANNUAL</strong> PERFORMANCE REPORT<br />
2010/11 School Year<br />
Publication Date: March 2012<br />
Each State must have in place a State Performance Plan (SPP) to evaluate the State's efforts to meet the requirements and<br />
purposes of the implementation of the Individuals with Disabilities Education Act (IDEA). The SPP is a six-year plan, which<br />
describes Arkansas's performance on 20 indicators. The Office of Special Education Programs in the U. S. Department of<br />
Education requires that States report annually to the public on the performance of each local education agency (LEA) on 14 of<br />
20 indicators as compared with targets established by the State in the SPP. Arkansas will report indicators 1 through 14 and<br />
20 for each LEA serving children with disabilities (CWD). Any LEA not meeting targets on compliance indicators (0% for<br />
Indicators 4B, 09 & 10 and 100% for Indicators 11, 12, 13, and 20) are non-compliant with IDEA.<br />
There are no report changes for the 2010/11 school year profile; However, it is important to recognize that: .<br />
1. Indicator 01 (Graduation) is reported a year in arrear (2009/10 graduates) and is based on a four-year cohort. This<br />
means the rate is a measure of students who entered in ninth grade and graduate in four years. The calculation is a<br />
requirement under Title I of the Elementary and Secondary Education Act (ESEA).<br />
2. Indicator 02 (Drop out) is reported a year in arrear. This means the rate is a measure of students who dropped out in<br />
the 2009/10 school year. The Indicator 02 data are aligned with the Common Core of Data (CCD) requirements for<br />
grades 7-12.<br />
3. Indicator 04A and 4B (Suspension/Expulsion) is reported a year in arrear. This means the rate is a measure of<br />
students who had out-of-school suspensions and/or expulsions totaling more than 10 days.<br />
Percent of youth<br />
with IEPs<br />
graduating from<br />
high school with a<br />
regular diploma<br />
For a complete description of all the Indicators, please visit the special education website at<br />
http://arksped.k12.ar.us/sections/policy.html<br />
Indicator 01: Graduation Rates (2009/10 school year) Indicator 02: Dropout Rates (2009/10 school year)<br />
State<br />
Rate<br />
State<br />
Target<br />
75.76% 85.00%<br />
LEA<br />
Rate<br />
80.00%<br />
Target Met<br />
by LEA<br />
(Y/N)<br />
N<br />
Percent of<br />
youth with<br />
IEPs dropping<br />
out of high<br />
school<br />
State<br />
Rate<br />
Indicator 03: Assessment on Statewide Benchmark Exam (grades 3-8, 11)<br />
A) Adequate Yearly Progress<br />
n=40<br />
Literacy<br />
Mathematics<br />
Met Disability Subgroup "n"<br />
for Reporting Purposes (Y/N)<br />
State Target for % of Districts Meeting<br />
AYP for Disability Subgroup<br />
State<br />
Target<br />
3.06% 4.20%<br />
LEA<br />
Rate<br />
0.00%<br />
% of Districts Meeting AYP<br />
for Disability Subgroup<br />
Target Met by<br />
LEA (Y/N)<br />
Y<br />
Target Met by<br />
LEA(Y/N)<br />
Overall N 17.15% 6.25%<br />
NA<br />
N<br />
N<br />
Note: For a district to qualify as having a disability subgroup it must have a minimum of 40 (n=40) students with disabilities in a school building.<br />
B) Participation<br />
Participation Rate: # of<br />
CWD Tested ÷ # of CWD<br />
Enrolled in grades tested.<br />
Participation Rate: Literacy<br />
Participation Rate: Math<br />
Note: - - denotes not applicable<br />
State<br />
Rate<br />
98.78%<br />
State<br />
Target<br />
95.00%<br />
LEA<br />
Rate<br />
100.00%<br />
Target Met<br />
by LEA (Y/N)<br />
98.61% 95.00% 100.00% Y<br />
Y<br />
C) Performance Proficiency<br />
Percent of CWD Scoring<br />
Proficient or Above<br />
Proficiency Rate: Literacy<br />
Proficiency Rate:<br />
Mathematics<br />
16.00%<br />
16.00%<br />
State<br />
Rate<br />
31.49%<br />
44.86%<br />
State<br />
Target<br />
45.22%<br />
51.14%<br />
LEA<br />
Rate<br />
27.27%<br />
36.36%<br />
NA<br />
NA<br />
Target<br />
Met by<br />
LEA (Y/N)<br />
N<br />
N<br />
Page 1 of 5
LEA: 6102 - MAYNARD SCHOOL <strong>DISTRICT</strong><br />
Indicator 04: Out-of-School Suspensions and Expulsions (2009/10 school year)<br />
A) Suspension/Expulsion<br />
Percent difference of CWD with out-of- school suspensions and<br />
expulsions totaling greater than 10 days in a school year as<br />
compared to the same data for general education students in<br />
the district.<br />
B) Suspension/Expulsion by Race and Ethnicity<br />
Percent of districts that have: (a) a significant discrepancy, by race or<br />
ethnicity, in the rate of suspensions and expulsions of greater than 10<br />
days in a school year for children with IEPs; and (b) policies,<br />
procedures or practices that contribute to the significant discrepancy<br />
and do not comply with requirements relating to the development<br />
and implementation of IEPs, the use of positive behavioral<br />
interventions and supports, and procedural safeguards.<br />
Indicator 05: School Age (5-21) Least Restrictive Environment<br />
A) In the Regular Class 80% or more of the day<br />
Percent of CWD with<br />
IEPs receiving instruction<br />
in the regular class 80%<br />
or more of the day.<br />
State<br />
Rate<br />
State<br />
Target<br />
LEA<br />
Rate<br />
B) In the Regular Class less than 40% of the day<br />
Percent of CWD with<br />
IEPs receiving instruction<br />
in the regular class less<br />
than 60% of the day.<br />
53.87% 59.77%<br />
State<br />
Rate<br />
State<br />
Target<br />
12.42% 12.51%<br />
47.73%<br />
LEA<br />
Rate<br />
3.41%<br />
C) Other Settings outside the regular class<br />
Percent of CWD with IEPs served in<br />
public or private separate schools,<br />
residential placements, or<br />
homebound/hospital placements.<br />
State<br />
Rate<br />
State<br />
Target<br />
2.80% 2.56%<br />
Target Met<br />
by LEA (Y/N)<br />
N<br />
Target Met<br />
by LEA (Y/N)<br />
Y<br />
LEA<br />
Rate<br />
0.00%<br />
Target Met<br />
by LEA(Y/N)<br />
Indicator 06: Early Childhood (3-5) Least Restrictive Environment<br />
A) Regular Early Childhood Program<br />
Percent of children (aged 3 through 5) with IEPs attending a regular<br />
early childhood program and receiving the majority of special<br />
education and related services in the regular early childhood program<br />
Allowable<br />
Difference<br />
LEA: 6102 - MAYNARD SCHOOL <strong>DISTRICT</strong><br />
Indicator 07: Preschool (3-5) Outcomes<br />
a) Percent of preschool CWD<br />
children who did not<br />
improve functioning.<br />
b) Percent of preschool CWD<br />
who improved but whose<br />
functioning remained below<br />
same age peers.<br />
c) Percent of preschool CWD<br />
who improved at a level<br />
nearer to same aged peers.<br />
d) Percent of preschool CWD<br />
who improved functioning to<br />
reach a level comparable to<br />
same age peers.<br />
e) Percent of preschool CWD<br />
children who maintain<br />
functioning at a level<br />
comparable to same aged<br />
peers.<br />
Summary<br />
Statements<br />
1) Of those preschool<br />
children who entered<br />
the preschool program<br />
below age expectations<br />
in each Outcome, the<br />
percent who<br />
substantially increased<br />
their rate of growth by<br />
the time they turned 6<br />
years of age or exited<br />
the program.<br />
2) The percent of<br />
preschool children who<br />
were functioning<br />
within age expectations<br />
in each Outcome by the<br />
time they turned 6<br />
years of age or exited<br />
A) Positive Social -Emotional<br />
Skills*<br />
State<br />
Rate<br />
A) Positive Social -<br />
Emotional Skills<br />
(Including social<br />
relationships)<br />
State<br />
Rate<br />
2.14%<br />
5.31%<br />
25.97%<br />
38.22%<br />
28.36%<br />
State<br />
Target<br />
LEA<br />
Rate<br />
LEA<br />
Rate<br />
— —<br />
— —<br />
— —<br />
— —<br />
— —<br />
Target<br />
Met by<br />
LEA(Y/N)<br />
B) Acquisition and Use of<br />
Knowledge and Skills<br />
(Including early language/<br />
communication and early literacy)<br />
B) Acquisition and Use of<br />
Knowledge and Skills **<br />
State<br />
Rate<br />
1.75%<br />
6.59%<br />
34.23%<br />
43.51%<br />
13.92%<br />
State<br />
Target<br />
LEA<br />
Rate<br />
Target<br />
Met by<br />
LEA(Y/N)<br />
C) Use of Appropriate Behaviors<br />
to Meet Their Needs<br />
State<br />
Rate<br />
State<br />
Target<br />
LEA<br />
Rate<br />
Target<br />
Met by<br />
LEA(Y/N)<br />
89.61% 90.50% — — N/A 90.31% 90.50% — — N/A 90.82% 92.50% — — N/A<br />
66.58% 69.50% — — N/A 57.43% 60.50% — — N/A 76.69% 78.50% — — N/A<br />
NOTE: * Including social relationships ** Including early language/ communication and early literacy<br />
Note: - - denotes not applicable<br />
State<br />
Rate<br />
LEA<br />
Rate<br />
— —<br />
— —<br />
— —<br />
— —<br />
— —<br />
C) Use of<br />
Appropriate<br />
Behaviors to<br />
Meet Their Needs<br />
State<br />
Rate<br />
4.51%<br />
17.34%<br />
41.72%<br />
34.97%<br />
LEA<br />
Rate<br />
1.46% — —<br />
— —<br />
— —<br />
— —<br />
— —<br />
Page 3 of 5
LEA: 6102 - MAYNARD SCHOOL <strong>DISTRICT</strong><br />
Indicator 08: Parent Involvement<br />
Percent of surveyed<br />
parents who reported<br />
school facilitated parent<br />
involvement as a means<br />
of improving services<br />
and results for children<br />
with disabilities.<br />
Early Childhood<br />
(3-5)<br />
School Age<br />
(5-21)<br />
State<br />
Rate<br />
90.47%<br />
95.05%<br />
Indicator 09: Disproportionality - Eligibility<br />
Disproportionate representation of racial<br />
and ethnic groups in special education and<br />
related services that is a result of<br />
inappropriate identification (e.g.<br />
monitoring data, review of policies,<br />
practices, and procedures under 618(d),<br />
etc.).<br />
State<br />
Rate<br />
State<br />
Target<br />
88.00%<br />
96.00%<br />
State<br />
Target<br />
0.00% 0.00%<br />
LEA<br />
Rate<br />
— —<br />
97.14%<br />
Indicator 10: Disproportionality-Child with a Disability<br />
Disproportionate representation of racial<br />
and ethnic groups in specific disability<br />
categories that is a result of inappropriate<br />
identification (e.g. monitoring data, review<br />
of policies, practices, and procedures under<br />
618(d), etc.).<br />
Indicator 11: Child Find<br />
Percent of children with<br />
parental consent to evaluate<br />
who are evaluated within<br />
the State established timeline<br />
of 60 days.<br />
Overall<br />
(3-21)<br />
Early Childhood<br />
(3-5)<br />
School Age<br />
(5-21)<br />
State<br />
Rate<br />
0.00%<br />
Indicator 12: Early Childhood Transition<br />
Percent of children referred by Part C prior to<br />
age 3, who are found eligible for Part B, and<br />
who have an IEP developed and implemented<br />
by their third birthday.<br />
Note: - - denotes not applicable<br />
State<br />
Rate<br />
99.41%<br />
99.70%<br />
98.97%<br />
State<br />
Rate<br />
State<br />
Target<br />
0.00%<br />
State<br />
Target<br />
100.00%<br />
100.00%<br />
100.00%<br />
State<br />
Target<br />
Target Met by<br />
LEA (Y/N)<br />
Y<br />
Target Met by<br />
LEA (Y/N)<br />
Y<br />
LEA<br />
Rate<br />
100.00%<br />
— —<br />
100.00%<br />
LEA<br />
Rate<br />
Target Met by<br />
LEA (Y/N)<br />
N/A<br />
Y<br />
Note: The target for Indicator 09 is to have zero percent<br />
(0%) of districts identified as having disproportionate<br />
representation as a result of inappropriate<br />
identification in eligibility.<br />
Note: The target for Indicator 10 is to have zero<br />
percent (0%) of districts identified as having<br />
disproportionate representation as a result of<br />
inappropriate identification in a disability<br />
category.<br />
Target Met by<br />
LEA (Y/N)<br />
N/A<br />
Y<br />
Target Met<br />
by LEA<br />
(Y/N)<br />
99.21% 100.00% - - N/A<br />
Y<br />
Note: * Indicates a zero reponse rate for the<br />
district.<br />
Page 4 of 5
LEA: 6102 - MAYNARD SCHOOL <strong>DISTRICT</strong><br />
Indicator 13: Secondary Transition<br />
Percent of youth with disabilities aged 16 and<br />
up with an IEP that includes coordinated,<br />
measurable, annual IEP goals and transition<br />
services that will reasonably enable the student<br />
to meet the post-secondary goals.<br />
Indicator 14: Post-School Outcomes<br />
A. Percent of youth enrolled in higher<br />
education within one year of leaving high<br />
school.<br />
State<br />
Rate<br />
State<br />
Target<br />
Note: Data for this Indicator is from the on-site monitoring of LEAs for the given year.<br />
B. Percent of youth enrolled in higher<br />
education or competitively employed<br />
within one year of leaving high school.<br />
C. Percent of youth enrolled in higher<br />
education or in some other postsecondary<br />
education or training program; or<br />
competitively employed or in some other<br />
employment within one year of leaving<br />
high school.<br />
State<br />
Rate<br />
Indicator 20: Reported Data-Timely and Accurate*<br />
District submitted<br />
required data elements<br />
on or before due dates;<br />
made revisions within<br />
the alloted reveiw<br />
periods.<br />
Accurate and Timely<br />
Data Submission<br />
Overall (3-21)<br />
Early Childhood (3-5)<br />
School Age (5-21)<br />
State<br />
Target<br />
100.00%<br />
100.00%<br />
100.00%<br />
State<br />
Target<br />
LEA<br />
Rate<br />
LEA<br />
Rate<br />
Target Met by<br />
LEA (Y/N)<br />
Target Met<br />
by LEA<br />
(Y/N)<br />
Target Met<br />
by LEA<br />
(Y/N)<br />
*Data reviewed for timely and accurate submissions included all APSCN cycle data except for personnel<br />
Note: - - denotes not applicable<br />
96.19 100.00 — — N/A<br />
14.53<br />
State<br />
Rate<br />
49.42<br />
State<br />
Rate<br />
54.07<br />
13.00<br />
State<br />
Target<br />
49.00<br />
State<br />
Target<br />
60.00<br />
Y<br />
N/A<br />
Y<br />
0.00%<br />
LEA<br />
Rate<br />
0.00%<br />
LEA<br />
Rate<br />
0.00%<br />
N<br />
Target Met<br />
by LEA<br />
(Y/N)<br />
N<br />
Target Met<br />
by LEA<br />
(Y/N)<br />
N<br />
Page 5 of 5
<strong>ARKANSAS</strong> <strong>SPECIAL</strong> <strong>EDUCATION</strong><br />
<strong>DISTRICT</strong> <strong>ANNUAL</strong> PERFORMANCE REPORT<br />
2010/11 School Year<br />
Publication Date: March 2012<br />
Each State must have in place a State Performance Plan (SPP) to evaluate the State's efforts to meet the requirements and<br />
purposes of the implementation of the Individuals with Disabilities Education Act (IDEA). The SPP is a six-year plan, which<br />
describes Arkansas's performance on 20 indicators. The Office of Special Education Programs in the U. S. Department of<br />
Education requires that States report annually to the public on the performance of each local education agency (LEA) on 14 of<br />
20 indicators as compared with targets established by the State in the SPP. Arkansas will report indicators 1 through 14 and<br />
20 for each LEA serving children with disabilities (CWD). Any LEA not meeting targets on compliance indicators (0% for<br />
Indicators 4B, 09 & 10 and 100% for Indicators 11, 12, 13, and 20) are non-compliant with IDEA.<br />
There are no report changes for the 2010/11 school year profile; However, it is important to recognize that: .<br />
1. Indicator 01 (Graduation) is reported a year in arrear (2009/10 graduates) and is based on a four-year cohort. This<br />
means the rate is a measure of students who entered in ninth grade and graduate in four years. The calculation is a<br />
requirement under Title I of the Elementary and Secondary Education Act (ESEA).<br />
2. Indicator 02 (Drop out) is reported a year in arrear. This means the rate is a measure of students who dropped out in<br />
the 2009/10 school year. The Indicator 02 data are aligned with the Common Core of Data (CCD) requirements for<br />
grades 7-12.<br />
3. Indicator 04A and 4B (Suspension/Expulsion) is reported a year in arrear. This means the rate is a measure of<br />
students who had out-of-school suspensions and/or expulsions totaling more than 10 days.<br />
For a complete description of all the Indicators, please visit the special education website at<br />
http://arksped.k12.ar.us/sections/policy.html<br />
LEA: 6103 - POCAHONTAS SCHOOL <strong>DISTRICT</strong><br />
Indicator 01: Graduation Rates (2009/10 school year) Indicator 02: Dropout Rates (2009/10 school year)<br />
Percent of youth<br />
with IEPs<br />
graduating from<br />
high school with a<br />
regular diploma<br />
State<br />
Rate<br />
State<br />
Target<br />
75.76% 85.00%<br />
LEA<br />
Rate<br />
100.00%<br />
Target Met<br />
by LEA<br />
(Y/N)<br />
Y<br />
Percent of<br />
youth with<br />
IEPs dropping<br />
out of high<br />
school<br />
State<br />
Rate<br />
Indicator 03: Assessment on Statewide Benchmark Exam (grades 3-8, 11)<br />
A) Adequate Yearly Progress<br />
n=40<br />
Literacy<br />
Mathematics<br />
Met Disability Subgroup "n"<br />
for Reporting Purposes (Y/N)<br />
State Target for % of Districts Meeting<br />
AYP for Disability Subgroup<br />
State<br />
Target<br />
3.06% 4.20%<br />
LEA<br />
Rate<br />
3.03%<br />
% of Districts Meeting AYP<br />
for Disability Subgroup<br />
Target Met by<br />
LEA (Y/N)<br />
Y<br />
Target Met by<br />
LEA(Y/N)<br />
Overall N 17.15% 6.25%<br />
NA<br />
N<br />
N<br />
Note: For a district to qualify as having a disability subgroup it must have a minimum of 40 (n=40) students with disabilities in a school building.<br />
B) Participation<br />
Participation Rate: # of<br />
CWD Tested ÷ # of CWD<br />
Enrolled in grades tested.<br />
Participation Rate: Literacy<br />
Participation Rate: Math<br />
Note: - - denotes not applicable<br />
State<br />
Rate<br />
98.78%<br />
State<br />
Target<br />
95.00%<br />
LEA<br />
Rate<br />
99.11%<br />
Target Met<br />
by LEA (Y/N)<br />
98.61% 95.00% 99.17% Y<br />
Y<br />
C) Performance Proficiency<br />
Percent of CWD Scoring<br />
Proficient or Above<br />
Proficiency Rate: Literacy<br />
Proficiency Rate:<br />
Mathematics<br />
16.00%<br />
16.00%<br />
State<br />
Rate<br />
31.49%<br />
44.86%<br />
State<br />
Target<br />
45.22%<br />
51.14%<br />
LEA<br />
Rate<br />
46.46%<br />
66.36%<br />
NA<br />
NA<br />
Target<br />
Met by<br />
LEA (Y/N)<br />
Y<br />
Y<br />
Page 1 of 5
LEA: 6103 - POCAHONTAS SCHOOL <strong>DISTRICT</strong><br />
Indicator 04: Out-of-School Suspensions and Expulsions (2009/10 school year)<br />
A) Suspension/Expulsion<br />
Percent difference of CWD with out-of- school suspensions and<br />
expulsions totaling greater than 10 days in a school year as<br />
compared to the same data for general education students in<br />
the district.<br />
B) Suspension/Expulsion by Race and Ethnicity<br />
Percent of districts that have: (a) a significant discrepancy, by race or<br />
ethnicity, in the rate of suspensions and expulsions of greater than 10<br />
days in a school year for children with IEPs; and (b) policies,<br />
procedures or practices that contribute to the significant discrepancy<br />
and do not comply with requirements relating to the development<br />
and implementation of IEPs, the use of positive behavioral<br />
interventions and supports, and procedural safeguards.<br />
Indicator 05: School Age (5-21) Least Restrictive Environment<br />
A) In the Regular Class 80% or more of the day<br />
Percent of CWD with<br />
IEPs receiving instruction<br />
in the regular class 80%<br />
or more of the day.<br />
State<br />
Rate<br />
State<br />
Target<br />
LEA<br />
Rate<br />
B) In the Regular Class less than 40% of the day<br />
Percent of CWD with<br />
IEPs receiving instruction<br />
in the regular class less<br />
than 60% of the day.<br />
53.87% 59.77%<br />
State<br />
Rate<br />
State<br />
Target<br />
12.42% 12.51%<br />
60.85%<br />
LEA<br />
Rate<br />
12.79%<br />
C) Other Settings outside the regular class<br />
Percent of CWD with IEPs served in<br />
public or private separate schools,<br />
residential placements, or<br />
homebound/hospital placements.<br />
State<br />
Rate<br />
State<br />
Target<br />
2.80% 2.56%<br />
Target Met<br />
by LEA (Y/N)<br />
Y<br />
Target Met<br />
by LEA (Y/N)<br />
N<br />
LEA<br />
Rate<br />
1.94%<br />
Target Met<br />
by LEA(Y/N)<br />
Indicator 06: Early Childhood (3-5) Least Restrictive Environment<br />
A) Regular Early Childhood Program<br />
Percent of children (aged 3 through 5) with IEPs attending a regular<br />
early childhood program and receiving the majority of special<br />
education and related services in the regular early childhood program<br />
Allowable<br />
Difference<br />
LEA: 6103 - POCAHONTAS SCHOOL <strong>DISTRICT</strong><br />
Indicator 07: Preschool (3-5) Outcomes<br />
a) Percent of preschool CWD<br />
children who did not<br />
improve functioning.<br />
b) Percent of preschool CWD<br />
who improved but whose<br />
functioning remained below<br />
same age peers.<br />
c) Percent of preschool CWD<br />
who improved at a level<br />
nearer to same aged peers.<br />
d) Percent of preschool CWD<br />
who improved functioning to<br />
reach a level comparable to<br />
same age peers.<br />
e) Percent of preschool CWD<br />
children who maintain<br />
functioning at a level<br />
comparable to same aged<br />
peers.<br />
Summary<br />
Statements<br />
1) Of those preschool<br />
children who entered<br />
the preschool program<br />
below age expectations<br />
in each Outcome, the<br />
percent who<br />
substantially increased<br />
their rate of growth by<br />
the time they turned 6<br />
years of age or exited<br />
the program.<br />
2) The percent of<br />
preschool children who<br />
were functioning<br />
within age expectations<br />
in each Outcome by the<br />
time they turned 6<br />
years of age or exited<br />
A) Positive Social -Emotional<br />
Skills*<br />
State<br />
Rate<br />
A) Positive Social -<br />
Emotional Skills<br />
(Including social<br />
relationships)<br />
State<br />
Rate<br />
2.14%<br />
5.31%<br />
25.97%<br />
38.22%<br />
28.36%<br />
State<br />
Target<br />
LEA<br />
Rate<br />
LEA<br />
Rate<br />
— —<br />
— —<br />
— —<br />
16.00%<br />
84.00%<br />
Target<br />
Met by<br />
LEA(Y/N)<br />
B) Acquisition and Use of<br />
Knowledge and Skills<br />
(Including early language/<br />
communication and early literacy)<br />
B) Acquisition and Use of<br />
Knowledge and Skills **<br />
State<br />
Rate<br />
1.75%<br />
6.59%<br />
34.23%<br />
43.51%<br />
13.92%<br />
State<br />
Target<br />
LEA<br />
Rate<br />
Target<br />
Met by<br />
LEA(Y/N)<br />
C) Use of Appropriate Behaviors<br />
to Meet Their Needs<br />
State<br />
Rate<br />
State<br />
Target<br />
LEA<br />
Rate<br />
Target<br />
Met by<br />
LEA(Y/N)<br />
89.61% 90.50% 100.00% Y 90.31% 90.50% 95.83% Y 90.82% 92.50% 100.00% Y<br />
66.58% 69.50% 100.00% Y 57.43% 60.50% 96.00% Y 76.69% 78.50% 100.00% Y<br />
NOTE: * Including social relationships ** Including early language/ communication and early literacy<br />
Note: - - denotes not applicable<br />
State<br />
Rate<br />
LEA<br />
Rate<br />
— —<br />
4.00%<br />
— —<br />
92.00%<br />
4.00%<br />
C) Use of<br />
Appropriate<br />
Behaviors to<br />
Meet Their Needs<br />
State<br />
Rate<br />
4.51%<br />
17.34%<br />
41.72%<br />
34.97%<br />
LEA<br />
Rate<br />
1.46% — —<br />
— —<br />
— —<br />
16.00%<br />
84.00%<br />
Page 3 of 5
LEA: 6103 - POCAHONTAS SCHOOL <strong>DISTRICT</strong><br />
Indicator 08: Parent Involvement<br />
Percent of surveyed<br />
parents who reported<br />
school facilitated parent<br />
involvement as a means<br />
of improving services<br />
and results for children<br />
with disabilities.<br />
Early Childhood<br />
(3-5)<br />
School Age<br />
(5-21)<br />
State<br />
Rate<br />
90.47%<br />
95.05%<br />
Indicator 09: Disproportionality - Eligibility<br />
Disproportionate representation of racial<br />
and ethnic groups in special education and<br />
related services that is a result of<br />
inappropriate identification (e.g.<br />
monitoring data, review of policies,<br />
practices, and procedures under 618(d),<br />
etc.).<br />
State<br />
Rate<br />
State<br />
Target<br />
88.00%<br />
96.00%<br />
State<br />
Target<br />
0.00% 0.00%<br />
LEA<br />
Rate<br />
95.45%<br />
94.12%<br />
Indicator 10: Disproportionality-Child with a Disability<br />
Disproportionate representation of racial<br />
and ethnic groups in specific disability<br />
categories that is a result of inappropriate<br />
identification (e.g. monitoring data, review<br />
of policies, practices, and procedures under<br />
618(d), etc.).<br />
Indicator 11: Child Find<br />
Percent of children with<br />
parental consent to evaluate<br />
who are evaluated within<br />
the State established timeline<br />
of 60 days.<br />
Overall<br />
(3-21)<br />
Early Childhood<br />
(3-5)<br />
School Age<br />
(5-21)<br />
State<br />
Rate<br />
0.00%<br />
Indicator 12: Early Childhood Transition<br />
Percent of children referred by Part C prior to<br />
age 3, who are found eligible for Part B, and<br />
who have an IEP developed and implemented<br />
by their third birthday.<br />
Note: - - denotes not applicable<br />
State<br />
Rate<br />
99.41%<br />
99.70%<br />
98.97%<br />
State<br />
Rate<br />
State<br />
Target<br />
0.00%<br />
State<br />
Target<br />
100.00%<br />
100.00%<br />
100.00%<br />
State<br />
Target<br />
Target Met by<br />
LEA (Y/N)<br />
Y<br />
Target Met by<br />
LEA (Y/N)<br />
Y<br />
LEA<br />
Rate<br />
100.00%<br />
100.00%<br />
100.00%<br />
LEA<br />
Rate<br />
Target Met by<br />
LEA (Y/N)<br />
Y<br />
N<br />
Note: The target for Indicator 09 is to have zero percent<br />
(0%) of districts identified as having disproportionate<br />
representation as a result of inappropriate<br />
identification in eligibility.<br />
Note: The target for Indicator 10 is to have zero<br />
percent (0%) of districts identified as having<br />
disproportionate representation as a result of<br />
inappropriate identification in a disability<br />
category.<br />
Target Met by<br />
LEA (Y/N)<br />
Y<br />
Y<br />
Target Met<br />
by LEA<br />
(Y/N)<br />
99.21% 100.00% - - N/A<br />
Y<br />
Note: * Indicates a zero reponse rate for the<br />
district.<br />
Page 4 of 5
LEA: 6103 - POCAHONTAS SCHOOL <strong>DISTRICT</strong><br />
Indicator 13: Secondary Transition<br />
Percent of youth with disabilities aged 16 and<br />
up with an IEP that includes coordinated,<br />
measurable, annual IEP goals and transition<br />
services that will reasonably enable the student<br />
to meet the post-secondary goals.<br />
Indicator 14: Post-School Outcomes<br />
A. Percent of youth enrolled in higher<br />
education within one year of leaving high<br />
school.<br />
State<br />
Rate<br />
State<br />
Target<br />
Note: Data for this Indicator is from the on-site monitoring of LEAs for the given year.<br />
B. Percent of youth enrolled in higher<br />
education or competitively employed<br />
within one year of leaving high school.<br />
C. Percent of youth enrolled in higher<br />
education or in some other postsecondary<br />
education or training program; or<br />
competitively employed or in some other<br />
employment within one year of leaving<br />
high school.<br />
State<br />
Rate<br />
Indicator 20: Reported Data-Timely and Accurate*<br />
District submitted<br />
required data elements<br />
on or before due dates;<br />
made revisions within<br />
the alloted reveiw<br />
periods.<br />
Accurate and Timely<br />
Data Submission<br />
Overall (3-21)<br />
Early Childhood (3-5)<br />
School Age (5-21)<br />
State<br />
Target<br />
100.00%<br />
100.00%<br />
100.00%<br />
State<br />
Target<br />
LEA<br />
Rate<br />
LEA<br />
Rate<br />
Target Met by<br />
LEA (Y/N)<br />
Target Met<br />
by LEA<br />
(Y/N)<br />
Target Met<br />
by LEA<br />
(Y/N)<br />
*Data reviewed for timely and accurate submissions included all APSCN cycle data except for personnel<br />
Note: - - denotes not applicable<br />
96.19 100.00 — — N/A<br />
14.53<br />
State<br />
Rate<br />
49.42<br />
State<br />
Rate<br />
54.07<br />
13.00<br />
State<br />
Target<br />
49.00<br />
State<br />
Target<br />
60.00<br />
Y<br />
Y<br />
Y<br />
— —<br />
LEA<br />
Rate<br />
— —<br />
LEA<br />
Rate<br />
— —<br />
N/A<br />
Target Met<br />
by LEA<br />
(Y/N)<br />
N/A<br />
Target Met<br />
by LEA<br />
(Y/N)<br />
N/A<br />
Page 5 of 5
<strong>ARKANSAS</strong> <strong>SPECIAL</strong> <strong>EDUCATION</strong><br />
<strong>DISTRICT</strong> <strong>ANNUAL</strong> PERFORMANCE REPORT<br />
2010/11 School Year<br />
Publication Date: March 2012<br />
Each State must have in place a State Performance Plan (SPP) to evaluate the State's efforts to meet the requirements and<br />
purposes of the implementation of the Individuals with Disabilities Education Act (IDEA). The SPP is a six-year plan, which<br />
describes Arkansas's performance on 20 indicators. The Office of Special Education Programs in the U. S. Department of<br />
Education requires that States report annually to the public on the performance of each local education agency (LEA) on 14 of<br />
20 indicators as compared with targets established by the State in the SPP. Arkansas will report indicators 1 through 14 and<br />
20 for each LEA serving children with disabilities (CWD). Any LEA not meeting targets on compliance indicators (0% for<br />
Indicators 4B, 09 & 10 and 100% for Indicators 11, 12, 13, and 20) are non-compliant with IDEA.<br />
There are no report changes for the 2010/11 school year profile; However, it is important to recognize that: .<br />
1. Indicator 01 (Graduation) is reported a year in arrear (2009/10 graduates) and is based on a four-year cohort. This<br />
means the rate is a measure of students who entered in ninth grade and graduate in four years. The calculation is a<br />
requirement under Title I of the Elementary and Secondary Education Act (ESEA).<br />
2. Indicator 02 (Drop out) is reported a year in arrear. This means the rate is a measure of students who dropped out in<br />
the 2009/10 school year. The Indicator 02 data are aligned with the Common Core of Data (CCD) requirements for<br />
grades 7-12.<br />
3. Indicator 04A and 4B (Suspension/Expulsion) is reported a year in arrear. This means the rate is a measure of<br />
students who had out-of-school suspensions and/or expulsions totaling more than 10 days.<br />
For a complete description of all the Indicators, please visit the special education website at<br />
http://arksped.k12.ar.us/sections/policy.html<br />
LEA: 6201 - FORREST CITY SCHOOL <strong>DISTRICT</strong><br />
Indicator 01: Graduation Rates (2009/10 school year) Indicator 02: Dropout Rates (2009/10 school year)<br />
Percent of youth<br />
with IEPs<br />
graduating from<br />
high school with a<br />
regular diploma<br />
State<br />
Rate<br />
State<br />
Target<br />
75.76% 85.00%<br />
LEA<br />
Rate<br />
73.33%<br />
Target Met<br />
by LEA<br />
(Y/N)<br />
N<br />
Percent of<br />
youth with<br />
IEPs dropping<br />
out of high<br />
school<br />
State<br />
Rate<br />
Indicator 03: Assessment on Statewide Benchmark Exam (grades 3-8, 11)<br />
A) Adequate Yearly Progress<br />
n=40<br />
Literacy<br />
Mathematics<br />
Met Disability Subgroup "n"<br />
for Reporting Purposes (Y/N)<br />
State Target for % of Districts Meeting<br />
AYP for Disability Subgroup<br />
State<br />
Target<br />
3.06% 4.20%<br />
LEA<br />
Rate<br />
2.49%<br />
% of Districts Meeting AYP<br />
for Disability Subgroup<br />
Target Met by<br />
LEA (Y/N)<br />
Y<br />
Target Met by<br />
LEA(Y/N)<br />
Overall N 17.15% 6.25%<br />
NA<br />
N<br />
N<br />
Note: For a district to qualify as having a disability subgroup it must have a minimum of 40 (n=40) students with disabilities in a school building.<br />
B) Participation<br />
Participation Rate: # of<br />
CWD Tested ÷ # of CWD<br />
Enrolled in grades tested.<br />
Participation Rate: Literacy<br />
Participation Rate: Math<br />
Note: - - denotes not applicable<br />
State<br />
Rate<br />
98.78%<br />
State<br />
Target<br />
95.00%<br />
LEA<br />
Rate<br />
97.41%<br />
Target Met<br />
by LEA (Y/N)<br />
98.61% 95.00% 97.54% Y<br />
Y<br />
C) Performance Proficiency<br />
Percent of CWD Scoring<br />
Proficient or Above<br />
Proficiency Rate: Literacy<br />
Proficiency Rate:<br />
Mathematics<br />
16.00%<br />
16.00%<br />
State<br />
Rate<br />
31.49%<br />
44.86%<br />
State<br />
Target<br />
45.22%<br />
51.14%<br />
LEA<br />
Rate<br />
17.21%<br />
28.19%<br />
NA<br />
NA<br />
Target<br />
Met by<br />
LEA (Y/N)<br />
N<br />
N<br />
Page 1 of 5
LEA: 6201 - FORREST CITY SCHOOL <strong>DISTRICT</strong><br />
Indicator 04: Out-of-School Suspensions and Expulsions (2009/10 school year)<br />
A) Suspension/Expulsion<br />
Percent difference of CWD with out-of- school suspensions and<br />
expulsions totaling greater than 10 days in a school year as<br />
compared to the same data for general education students in<br />
the district.<br />
B) Suspension/Expulsion by Race and Ethnicity<br />
Percent of districts that have: (a) a significant discrepancy, by race or<br />
ethnicity, in the rate of suspensions and expulsions of greater than 10<br />
days in a school year for children with IEPs; and (b) policies,<br />
procedures or practices that contribute to the significant discrepancy<br />
and do not comply with requirements relating to the development<br />
and implementation of IEPs, the use of positive behavioral<br />
interventions and supports, and procedural safeguards.<br />
Indicator 05: School Age (5-21) Least Restrictive Environment<br />
A) In the Regular Class 80% or more of the day<br />
Percent of CWD with<br />
IEPs receiving instruction<br />
in the regular class 80%<br />
or more of the day.<br />
State<br />
Rate<br />
State<br />
Target<br />
LEA<br />
Rate<br />
B) In the Regular Class less than 40% of the day<br />
Percent of CWD with<br />
IEPs receiving instruction<br />
in the regular class less<br />
than 60% of the day.<br />
53.87% 59.77%<br />
State<br />
Rate<br />
State<br />
Target<br />
12.42% 12.51%<br />
60.20%<br />
LEA<br />
Rate<br />
10.57%<br />
C) Other Settings outside the regular class<br />
Percent of CWD with IEPs served in<br />
public or private separate schools,<br />
residential placements, or<br />
homebound/hospital placements.<br />
State<br />
Rate<br />
State<br />
Target<br />
2.80% 2.56%<br />
Target Met<br />
by LEA (Y/N)<br />
Y<br />
Target Met<br />
by LEA (Y/N)<br />
Y<br />
LEA<br />
Rate<br />
3.93%<br />
Target Met<br />
by LEA(Y/N)<br />
Indicator 06: Early Childhood (3-5) Least Restrictive Environment<br />
A) Regular Early Childhood Program<br />
Percent of children (aged 3 through 5) with IEPs attending a regular<br />
early childhood program and receiving the majority of special<br />
education and related services in the regular early childhood program<br />
Allowable<br />
Difference<br />
LEA: 6201 - FORREST CITY SCHOOL <strong>DISTRICT</strong><br />
Indicator 07: Preschool (3-5) Outcomes<br />
a) Percent of preschool CWD<br />
children who did not<br />
improve functioning.<br />
b) Percent of preschool CWD<br />
who improved but whose<br />
functioning remained below<br />
same age peers.<br />
c) Percent of preschool CWD<br />
who improved at a level<br />
nearer to same aged peers.<br />
d) Percent of preschool CWD<br />
who improved functioning to<br />
reach a level comparable to<br />
same age peers.<br />
e) Percent of preschool CWD<br />
children who maintain<br />
functioning at a level<br />
comparable to same aged<br />
peers.<br />
Summary<br />
Statements<br />
1) Of those preschool<br />
children who entered<br />
the preschool program<br />
below age expectations<br />
in each Outcome, the<br />
percent who<br />
substantially increased<br />
their rate of growth by<br />
the time they turned 6<br />
years of age or exited<br />
the program.<br />
2) The percent of<br />
preschool children who<br />
were functioning<br />
within age expectations<br />
in each Outcome by the<br />
time they turned 6<br />
years of age or exited<br />
A) Positive Social -Emotional<br />
Skills*<br />
State<br />
Rate<br />
A) Positive Social -<br />
Emotional Skills<br />
(Including social<br />
relationships)<br />
State<br />
Rate<br />
2.14%<br />
5.31%<br />
25.97%<br />
38.22%<br />
28.36%<br />
State<br />
Target<br />
LEA<br />
Rate<br />
LEA<br />
Rate<br />
— —<br />
— —<br />
— —<br />
— —<br />
— —<br />
Target<br />
Met by<br />
LEA(Y/N)<br />
B) Acquisition and Use of<br />
Knowledge and Skills<br />
(Including early language/<br />
communication and early literacy)<br />
B) Acquisition and Use of<br />
Knowledge and Skills **<br />
State<br />
Rate<br />
1.75%<br />
6.59%<br />
34.23%<br />
43.51%<br />
13.92%<br />
State<br />
Target<br />
LEA<br />
Rate<br />
Target<br />
Met by<br />
LEA(Y/N)<br />
C) Use of Appropriate Behaviors<br />
to Meet Their Needs<br />
State<br />
Rate<br />
State<br />
Target<br />
LEA<br />
Rate<br />
Target<br />
Met by<br />
LEA(Y/N)<br />
89.61% 90.50% — — N/A 90.31% 90.50% — — N/A 90.82% 92.50% — — N/A<br />
66.58% 69.50% — — N/A 57.43% 60.50% — — N/A 76.69% 78.50% — — N/A<br />
NOTE: * Including social relationships ** Including early language/ communication and early literacy<br />
Note: - - denotes not applicable<br />
State<br />
Rate<br />
LEA<br />
Rate<br />
— —<br />
— —<br />
— —<br />
— —<br />
— —<br />
C) Use of<br />
Appropriate<br />
Behaviors to<br />
Meet Their Needs<br />
State<br />
Rate<br />
4.51%<br />
17.34%<br />
41.72%<br />
34.97%<br />
LEA<br />
Rate<br />
1.46% — —<br />
— —<br />
— —<br />
— —<br />
— —<br />
Page 3 of 5
LEA: 6201 - FORREST CITY SCHOOL <strong>DISTRICT</strong><br />
Indicator 08: Parent Involvement<br />
Percent of surveyed<br />
parents who reported<br />
school facilitated parent<br />
involvement as a means<br />
of improving services<br />
and results for children<br />
with disabilities.<br />
Early Childhood<br />
(3-5)<br />
School Age<br />
(5-21)<br />
State<br />
Rate<br />
90.47%<br />
95.05%<br />
Indicator 09: Disproportionality - Eligibility<br />
Disproportionate representation of racial<br />
and ethnic groups in special education and<br />
related services that is a result of<br />
inappropriate identification (e.g.<br />
monitoring data, review of policies,<br />
practices, and procedures under 618(d),<br />
etc.).<br />
State<br />
Rate<br />
State<br />
Target<br />
88.00%<br />
96.00%<br />
State<br />
Target<br />
0.00% 0.00%<br />
LEA<br />
Rate<br />
— —<br />
96.98%<br />
Indicator 10: Disproportionality-Child with a Disability<br />
Disproportionate representation of racial<br />
and ethnic groups in specific disability<br />
categories that is a result of inappropriate<br />
identification (e.g. monitoring data, review<br />
of policies, practices, and procedures under<br />
618(d), etc.).<br />
Indicator 11: Child Find<br />
Percent of children with<br />
parental consent to evaluate<br />
who are evaluated within<br />
the State established timeline<br />
of 60 days.<br />
Overall<br />
(3-21)<br />
Early Childhood<br />
(3-5)<br />
School Age<br />
(5-21)<br />
State<br />
Rate<br />
0.00%<br />
Indicator 12: Early Childhood Transition<br />
Percent of children referred by Part C prior to<br />
age 3, who are found eligible for Part B, and<br />
who have an IEP developed and implemented<br />
by their third birthday.<br />
Note: - - denotes not applicable<br />
State<br />
Rate<br />
99.41%<br />
99.70%<br />
98.97%<br />
State<br />
Rate<br />
State<br />
Target<br />
0.00%<br />
State<br />
Target<br />
100.00%<br />
100.00%<br />
100.00%<br />
State<br />
Target<br />
Target Met by<br />
LEA (Y/N)<br />
Y<br />
Target Met by<br />
LEA (Y/N)<br />
Y<br />
LEA<br />
Rate<br />
89.66%<br />
— —<br />
89.66%<br />
LEA<br />
Rate<br />
Target Met by<br />
LEA (Y/N)<br />
N/A<br />
Y<br />
Note: The target for Indicator 09 is to have zero percent<br />
(0%) of districts identified as having disproportionate<br />
representation as a result of inappropriate<br />
identification in eligibility.<br />
Note: The target for Indicator 10 is to have zero<br />
percent (0%) of districts identified as having<br />
disproportionate representation as a result of<br />
inappropriate identification in a disability<br />
category.<br />
Target Met by<br />
LEA (Y/N)<br />
N/A<br />
N<br />
Target Met<br />
by LEA<br />
(Y/N)<br />
99.21% 100.00% - - N/A<br />
N<br />
Note: * Indicates a zero reponse rate for the<br />
district.<br />
Page 4 of 5
LEA: 6201 - FORREST CITY SCHOOL <strong>DISTRICT</strong><br />
Indicator 13: Secondary Transition<br />
Percent of youth with disabilities aged 16 and<br />
up with an IEP that includes coordinated,<br />
measurable, annual IEP goals and transition<br />
services that will reasonably enable the student<br />
to meet the post-secondary goals.<br />
Indicator 14: Post-School Outcomes<br />
A. Percent of youth enrolled in higher<br />
education within one year of leaving high<br />
school.<br />
State<br />
Rate<br />
State<br />
Target<br />
Note: Data for this Indicator is from the on-site monitoring of LEAs for the given year.<br />
B. Percent of youth enrolled in higher<br />
education or competitively employed<br />
within one year of leaving high school.<br />
C. Percent of youth enrolled in higher<br />
education or in some other postsecondary<br />
education or training program; or<br />
competitively employed or in some other<br />
employment within one year of leaving<br />
high school.<br />
State<br />
Rate<br />
Indicator 20: Reported Data-Timely and Accurate*<br />
District submitted<br />
required data elements<br />
on or before due dates;<br />
made revisions within<br />
the alloted reveiw<br />
periods.<br />
Accurate and Timely<br />
Data Submission<br />
Overall (3-21)<br />
Early Childhood (3-5)<br />
School Age (5-21)<br />
State<br />
Target<br />
100.00%<br />
100.00%<br />
100.00%<br />
State<br />
Target<br />
LEA<br />
Rate<br />
LEA<br />
Rate<br />
Target Met by<br />
LEA (Y/N)<br />
Target Met<br />
by LEA<br />
(Y/N)<br />
Target Met<br />
by LEA<br />
(Y/N)<br />
*Data reviewed for timely and accurate submissions included all APSCN cycle data except for personnel<br />
Note: - - denotes not applicable<br />
96.19 100.00 — — N/A<br />
14.53<br />
State<br />
Rate<br />
49.42<br />
State<br />
Rate<br />
54.07<br />
13.00<br />
State<br />
Target<br />
49.00<br />
State<br />
Target<br />
60.00<br />
Y<br />
N/A<br />
Y<br />
0.00%<br />
LEA<br />
Rate<br />
50.00%<br />
LEA<br />
Rate<br />
50.00%<br />
N<br />
Target Met<br />
by LEA<br />
(Y/N)<br />
Y<br />
Target Met<br />
by LEA<br />
(Y/N)<br />
N<br />
Page 5 of 5
LEA: 6202 - HUGHES SCHOOL <strong>DISTRICT</strong><br />
<strong>ARKANSAS</strong> <strong>SPECIAL</strong> <strong>EDUCATION</strong><br />
<strong>DISTRICT</strong> <strong>ANNUAL</strong> PERFORMANCE REPORT<br />
2010/11 School Year<br />
Publication Date: March 2012<br />
Each State must have in place a State Performance Plan (SPP) to evaluate the State's efforts to meet the requirements and<br />
purposes of the implementation of the Individuals with Disabilities Education Act (IDEA). The SPP is a six-year plan, which<br />
describes Arkansas's performance on 20 indicators. The Office of Special Education Programs in the U. S. Department of<br />
Education requires that States report annually to the public on the performance of each local education agency (LEA) on 14 of<br />
20 indicators as compared with targets established by the State in the SPP. Arkansas will report indicators 1 through 14 and<br />
20 for each LEA serving children with disabilities (CWD). Any LEA not meeting targets on compliance indicators (0% for<br />
Indicators 4B, 09 & 10 and 100% for Indicators 11, 12, 13, and 20) are non-compliant with IDEA.<br />
There are no report changes for the 2010/11 school year profile; However, it is important to recognize that: .<br />
1. Indicator 01 (Graduation) is reported a year in arrear (2009/10 graduates) and is based on a four-year cohort. This<br />
means the rate is a measure of students who entered in ninth grade and graduate in four years. The calculation is a<br />
requirement under Title I of the Elementary and Secondary Education Act (ESEA).<br />
2. Indicator 02 (Drop out) is reported a year in arrear. This means the rate is a measure of students who dropped out in<br />
the 2009/10 school year. The Indicator 02 data are aligned with the Common Core of Data (CCD) requirements for<br />
grades 7-12.<br />
3. Indicator 04A and 4B (Suspension/Expulsion) is reported a year in arrear. This means the rate is a measure of<br />
students who had out-of-school suspensions and/or expulsions totaling more than 10 days.<br />
Percent of youth<br />
with IEPs<br />
graduating from<br />
high school with a<br />
regular diploma<br />
For a complete description of all the Indicators, please visit the special education website at<br />
http://arksped.k12.ar.us/sections/policy.html<br />
Indicator 01: Graduation Rates (2009/10 school year) Indicator 02: Dropout Rates (2009/10 school year)<br />
State<br />
Rate<br />
State<br />
Target<br />
75.76% 85.00%<br />
LEA<br />
Rate<br />
75.00%<br />
Target Met<br />
by LEA<br />
(Y/N)<br />
N<br />
Percent of<br />
youth with<br />
IEPs dropping<br />
out of high<br />
school<br />
State<br />
Rate<br />
Indicator 03: Assessment on Statewide Benchmark Exam (grades 3-8, 11)<br />
A) Adequate Yearly Progress<br />
n=40<br />
Literacy<br />
Mathematics<br />
Met Disability Subgroup "n"<br />
for Reporting Purposes (Y/N)<br />
State Target for % of Districts Meeting<br />
AYP for Disability Subgroup<br />
State<br />
Target<br />
3.06% 4.20%<br />
LEA<br />
Rate<br />
0.00%<br />
% of Districts Meeting AYP<br />
for Disability Subgroup<br />
Target Met by<br />
LEA (Y/N)<br />
Y<br />
Target Met by<br />
LEA(Y/N)<br />
Overall N 17.15% 6.25%<br />
NA<br />
N<br />
N<br />
Note: For a district to qualify as having a disability subgroup it must have a minimum of 40 (n=40) students with disabilities in a school building.<br />
B) Participation<br />
Participation Rate: # of<br />
CWD Tested ÷ # of CWD<br />
Enrolled in grades tested.<br />
Participation Rate: Literacy<br />
Participation Rate: Math<br />
Note: - - denotes not applicable<br />
State<br />
Rate<br />
98.78%<br />
State<br />
Target<br />
95.00%<br />
LEA<br />
Rate<br />
100.00%<br />
Target Met<br />
by LEA (Y/N)<br />
98.61% 95.00% 100.00% Y<br />
Y<br />
C) Performance Proficiency<br />
Percent of CWD Scoring<br />
Proficient or Above<br />
Proficiency Rate: Literacy<br />
Proficiency Rate:<br />
Mathematics<br />
16.00%<br />
16.00%<br />
State<br />
Rate<br />
31.49%<br />
44.86%<br />
State<br />
Target<br />
45.22%<br />
51.14%<br />
LEA<br />
Rate<br />
10.71%<br />
24.14%<br />
NA<br />
NA<br />
Target<br />
Met by<br />
LEA (Y/N)<br />
N<br />
N<br />
Page 1 of 5
LEA: 6202 - HUGHES SCHOOL <strong>DISTRICT</strong><br />
Indicator 04: Out-of-School Suspensions and Expulsions (2009/10 school year)<br />
A) Suspension/Expulsion<br />
Percent difference of CWD with out-of- school suspensions and<br />
expulsions totaling greater than 10 days in a school year as<br />
compared to the same data for general education students in<br />
the district.<br />
B) Suspension/Expulsion by Race and Ethnicity<br />
Percent of districts that have: (a) a significant discrepancy, by race or<br />
ethnicity, in the rate of suspensions and expulsions of greater than 10<br />
days in a school year for children with IEPs; and (b) policies,<br />
procedures or practices that contribute to the significant discrepancy<br />
and do not comply with requirements relating to the development<br />
and implementation of IEPs, the use of positive behavioral<br />
interventions and supports, and procedural safeguards.<br />
Indicator 05: School Age (5-21) Least Restrictive Environment<br />
A) In the Regular Class 80% or more of the day<br />
Percent of CWD with<br />
IEPs receiving instruction<br />
in the regular class 80%<br />
or more of the day.<br />
State<br />
Rate<br />
State<br />
Target<br />
LEA<br />
Rate<br />
B) In the Regular Class less than 40% of the day<br />
Percent of CWD with<br />
IEPs receiving instruction<br />
in the regular class less<br />
than 60% of the day.<br />
53.87% 59.77%<br />
State<br />
Rate<br />
State<br />
Target<br />
12.42% 12.51%<br />
39.29%<br />
LEA<br />
Rate<br />
28.57%<br />
C) Other Settings outside the regular class<br />
Percent of CWD with IEPs served in<br />
public or private separate schools,<br />
residential placements, or<br />
homebound/hospital placements.<br />
State<br />
Rate<br />
State<br />
Target<br />
2.80% 2.56%<br />
Target Met<br />
by LEA (Y/N)<br />
N<br />
Target Met<br />
by LEA (Y/N)<br />
N<br />
LEA<br />
Rate<br />
0.00%<br />
Target Met<br />
by LEA(Y/N)<br />
Indicator 06: Early Childhood (3-5) Least Restrictive Environment<br />
A) Regular Early Childhood Program<br />
Percent of children (aged 3 through 5) with IEPs attending a regular<br />
early childhood program and receiving the majority of special<br />
education and related services in the regular early childhood program<br />
Allowable<br />
Difference<br />
LEA: 6202 - HUGHES SCHOOL <strong>DISTRICT</strong><br />
Indicator 07: Preschool (3-5) Outcomes<br />
a) Percent of preschool CWD<br />
children who did not<br />
improve functioning.<br />
b) Percent of preschool CWD<br />
who improved but whose<br />
functioning remained below<br />
same age peers.<br />
c) Percent of preschool CWD<br />
who improved at a level<br />
nearer to same aged peers.<br />
d) Percent of preschool CWD<br />
who improved functioning to<br />
reach a level comparable to<br />
same age peers.<br />
e) Percent of preschool CWD<br />
children who maintain<br />
functioning at a level<br />
comparable to same aged<br />
peers.<br />
Summary<br />
Statements<br />
1) Of those preschool<br />
children who entered<br />
the preschool program<br />
below age expectations<br />
in each Outcome, the<br />
percent who<br />
substantially increased<br />
their rate of growth by<br />
the time they turned 6<br />
years of age or exited<br />
the program.<br />
2) The percent of<br />
preschool children who<br />
were functioning<br />
within age expectations<br />
in each Outcome by the<br />
time they turned 6<br />
years of age or exited<br />
A) Positive Social -Emotional<br />
Skills*<br />
State<br />
Rate<br />
A) Positive Social -<br />
Emotional Skills<br />
(Including social<br />
relationships)<br />
State<br />
Rate<br />
2.14%<br />
5.31%<br />
25.97%<br />
38.22%<br />
28.36%<br />
State<br />
Target<br />
LEA<br />
Rate<br />
LEA<br />
Rate<br />
— —<br />
— —<br />
— —<br />
— —<br />
— —<br />
Target<br />
Met by<br />
LEA(Y/N)<br />
B) Acquisition and Use of<br />
Knowledge and Skills<br />
(Including early language/<br />
communication and early literacy)<br />
B) Acquisition and Use of<br />
Knowledge and Skills **<br />
State<br />
Rate<br />
1.75%<br />
6.59%<br />
34.23%<br />
43.51%<br />
13.92%<br />
State<br />
Target<br />
LEA<br />
Rate<br />
Target<br />
Met by<br />
LEA(Y/N)<br />
C) Use of Appropriate Behaviors<br />
to Meet Their Needs<br />
State<br />
Rate<br />
State<br />
Target<br />
LEA<br />
Rate<br />
Target<br />
Met by<br />
LEA(Y/N)<br />
89.61% 90.50% — — N/A 90.31% 90.50% — — N/A 90.82% 92.50% — — N/A<br />
66.58% 69.50% — — N/A 57.43% 60.50% — — N/A 76.69% 78.50% — — N/A<br />
NOTE: * Including social relationships ** Including early language/ communication and early literacy<br />
Note: - - denotes not applicable<br />
State<br />
Rate<br />
LEA<br />
Rate<br />
— —<br />
— —<br />
— —<br />
— —<br />
— —<br />
C) Use of<br />
Appropriate<br />
Behaviors to<br />
Meet Their Needs<br />
State<br />
Rate<br />
4.51%<br />
17.34%<br />
41.72%<br />
34.97%<br />
LEA<br />
Rate<br />
1.46% — —<br />
— —<br />
— —<br />
— —<br />
— —<br />
Page 3 of 5
LEA: 6202 - HUGHES SCHOOL <strong>DISTRICT</strong><br />
Indicator 08: Parent Involvement<br />
Percent of surveyed<br />
parents who reported<br />
school facilitated parent<br />
involvement as a means<br />
of improving services<br />
and results for children<br />
with disabilities.<br />
Early Childhood<br />
(3-5)<br />
School Age<br />
(5-21)<br />
State<br />
Rate<br />
90.47%<br />
95.05%<br />
Indicator 09: Disproportionality - Eligibility<br />
Disproportionate representation of racial<br />
and ethnic groups in special education and<br />
related services that is a result of<br />
inappropriate identification (e.g.<br />
monitoring data, review of policies,<br />
practices, and procedures under 618(d),<br />
etc.).<br />
State<br />
Rate<br />
State<br />
Target<br />
88.00%<br />
96.00%<br />
State<br />
Target<br />
0.00% 0.00%<br />
LEA<br />
Rate<br />
— —<br />
100.00%<br />
Indicator 10: Disproportionality-Child with a Disability<br />
Disproportionate representation of racial<br />
and ethnic groups in specific disability<br />
categories that is a result of inappropriate<br />
identification (e.g. monitoring data, review<br />
of policies, practices, and procedures under<br />
618(d), etc.).<br />
Indicator 11: Child Find<br />
Percent of children with<br />
parental consent to evaluate<br />
who are evaluated within<br />
the State established timeline<br />
of 60 days.<br />
Overall<br />
(3-21)<br />
Early Childhood<br />
(3-5)<br />
School Age<br />
(5-21)<br />
State<br />
Rate<br />
0.00%<br />
Indicator 12: Early Childhood Transition<br />
Percent of children referred by Part C prior to<br />
age 3, who are found eligible for Part B, and<br />
who have an IEP developed and implemented<br />
by their third birthday.<br />
Note: - - denotes not applicable<br />
State<br />
Rate<br />
99.41%<br />
99.70%<br />
98.97%<br />
State<br />
Rate<br />
State<br />
Target<br />
0.00%<br />
State<br />
Target<br />
100.00%<br />
100.00%<br />
100.00%<br />
State<br />
Target<br />
Target Met by<br />
LEA (Y/N)<br />
Y<br />
Target Met by<br />
LEA (Y/N)<br />
Y<br />
LEA<br />
Rate<br />
100.00%<br />
— —<br />
100.00%<br />
LEA<br />
Rate<br />
Target Met by<br />
LEA (Y/N)<br />
N/A<br />
Y<br />
Note: The target for Indicator 09 is to have zero percent<br />
(0%) of districts identified as having disproportionate<br />
representation as a result of inappropriate<br />
identification in eligibility.<br />
Note: The target for Indicator 10 is to have zero<br />
percent (0%) of districts identified as having<br />
disproportionate representation as a result of<br />
inappropriate identification in a disability<br />
category.<br />
Target Met by<br />
LEA (Y/N)<br />
N/A<br />
Y<br />
Target Met<br />
by LEA<br />
(Y/N)<br />
99.21% 100.00% - - N/A<br />
Y<br />
Note: * Indicates a zero reponse rate for the<br />
district.<br />
Page 4 of 5
LEA: 6202 - HUGHES SCHOOL <strong>DISTRICT</strong><br />
Indicator 13: Secondary Transition<br />
Percent of youth with disabilities aged 16 and<br />
up with an IEP that includes coordinated,<br />
measurable, annual IEP goals and transition<br />
services that will reasonably enable the student<br />
to meet the post-secondary goals.<br />
Indicator 14: Post-School Outcomes<br />
A. Percent of youth enrolled in higher<br />
education within one year of leaving high<br />
school.<br />
State<br />
Rate<br />
State<br />
Target<br />
Note: Data for this Indicator is from the on-site monitoring of LEAs for the given year.<br />
B. Percent of youth enrolled in higher<br />
education or competitively employed<br />
within one year of leaving high school.<br />
C. Percent of youth enrolled in higher<br />
education or in some other postsecondary<br />
education or training program; or<br />
competitively employed or in some other<br />
employment within one year of leaving<br />
high school.<br />
State<br />
Rate<br />
Indicator 20: Reported Data-Timely and Accurate*<br />
District submitted<br />
required data elements<br />
on or before due dates;<br />
made revisions within<br />
the alloted reveiw<br />
periods.<br />
Accurate and Timely<br />
Data Submission<br />
Overall (3-21)<br />
Early Childhood (3-5)<br />
School Age (5-21)<br />
State<br />
Target<br />
100.00%<br />
100.00%<br />
100.00%<br />
State<br />
Target<br />
LEA<br />
Rate<br />
LEA<br />
Rate<br />
Target Met by<br />
LEA (Y/N)<br />
Target Met<br />
by LEA<br />
(Y/N)<br />
Target Met<br />
by LEA<br />
(Y/N)<br />
*Data reviewed for timely and accurate submissions included all APSCN cycle data except for personnel<br />
Note: - - denotes not applicable<br />
96.19 100.00 100.00% Y<br />
14.53<br />
State<br />
Rate<br />
49.42<br />
State<br />
Rate<br />
54.07<br />
13.00<br />
State<br />
Target<br />
49.00<br />
State<br />
Target<br />
60.00<br />
Y<br />
N/A<br />
Y<br />
0.00%<br />
LEA<br />
Rate<br />
0.00%<br />
LEA<br />
Rate<br />
0.00%<br />
N<br />
Target Met<br />
by LEA<br />
(Y/N)<br />
N<br />
Target Met<br />
by LEA<br />
(Y/N)<br />
N<br />
Page 5 of 5
<strong>ARKANSAS</strong> <strong>SPECIAL</strong> <strong>EDUCATION</strong><br />
<strong>DISTRICT</strong> <strong>ANNUAL</strong> PERFORMANCE REPORT<br />
2010/11 School Year<br />
Publication Date: March 2012<br />
Each State must have in place a State Performance Plan (SPP) to evaluate the State's efforts to meet the requirements and<br />
purposes of the implementation of the Individuals with Disabilities Education Act (IDEA). The SPP is a six-year plan, which<br />
describes Arkansas's performance on 20 indicators. The Office of Special Education Programs in the U. S. Department of<br />
Education requires that States report annually to the public on the performance of each local education agency (LEA) on 14 of<br />
20 indicators as compared with targets established by the State in the SPP. Arkansas will report indicators 1 through 14 and<br />
20 for each LEA serving children with disabilities (CWD). Any LEA not meeting targets on compliance indicators (0% for<br />
Indicators 4B, 09 & 10 and 100% for Indicators 11, 12, 13, and 20) are non-compliant with IDEA.<br />
There are no report changes for the 2010/11 school year profile; However, it is important to recognize that: .<br />
1. Indicator 01 (Graduation) is reported a year in arrear (2009/10 graduates) and is based on a four-year cohort. This<br />
means the rate is a measure of students who entered in ninth grade and graduate in four years. The calculation is a<br />
requirement under Title I of the Elementary and Secondary Education Act (ESEA).<br />
2. Indicator 02 (Drop out) is reported a year in arrear. This means the rate is a measure of students who dropped out in<br />
the 2009/10 school year. The Indicator 02 data are aligned with the Common Core of Data (CCD) requirements for<br />
grades 7-12.<br />
3. Indicator 04A and 4B (Suspension/Expulsion) is reported a year in arrear. This means the rate is a measure of<br />
students who had out-of-school suspensions and/or expulsions totaling more than 10 days.<br />
For a complete description of all the Indicators, please visit the special education website at<br />
http://arksped.k12.ar.us/sections/policy.html<br />
LEA: 6205 - PALESTINE-WHEATLEY SCH. <strong>DISTRICT</strong><br />
Indicator 01: Graduation Rates (2009/10 school year) Indicator 02: Dropout Rates (2009/10 school year)<br />
Percent of youth<br />
with IEPs<br />
graduating from<br />
high school with a<br />
regular diploma<br />
State<br />
Rate<br />
State<br />
Target<br />
75.76% 85.00%<br />
LEA<br />
Rate<br />
100.00%<br />
Target Met<br />
by LEA<br />
(Y/N)<br />
Y<br />
Percent of<br />
youth with<br />
IEPs dropping<br />
out of high<br />
school<br />
State<br />
Rate<br />
Indicator 03: Assessment on Statewide Benchmark Exam (grades 3-8, 11)<br />
A) Adequate Yearly Progress<br />
n=40<br />
Literacy<br />
Mathematics<br />
Met Disability Subgroup "n"<br />
for Reporting Purposes (Y/N)<br />
State Target for % of Districts Meeting<br />
AYP for Disability Subgroup<br />
State<br />
Target<br />
3.06% 4.20%<br />
LEA<br />
Rate<br />
0.00%<br />
% of Districts Meeting AYP<br />
for Disability Subgroup<br />
Target Met by<br />
LEA (Y/N)<br />
Y<br />
Target Met by<br />
LEA(Y/N)<br />
Overall N 17.15% 6.25%<br />
NA<br />
N<br />
N<br />
Note: For a district to qualify as having a disability subgroup it must have a minimum of 40 (n=40) students with disabilities in a school building.<br />
B) Participation<br />
Participation Rate: # of<br />
CWD Tested ÷ # of CWD<br />
Enrolled in grades tested.<br />
Participation Rate: Literacy<br />
Participation Rate: Math<br />
Note: - - denotes not applicable<br />
State<br />
Rate<br />
98.78%<br />
State<br />
Target<br />
95.00%<br />
LEA<br />
Rate<br />
100.00%<br />
Target Met<br />
by LEA (Y/N)<br />
98.61% 95.00% 100.00% Y<br />
Y<br />
C) Performance Proficiency<br />
Percent of CWD Scoring<br />
Proficient or Above<br />
Proficiency Rate: Literacy<br />
Proficiency Rate:<br />
Mathematics<br />
16.00%<br />
16.00%<br />
State<br />
Rate<br />
31.49%<br />
44.86%<br />
State<br />
Target<br />
45.22%<br />
51.14%<br />
LEA<br />
Rate<br />
5.00%<br />
32.56%<br />
NA<br />
NA<br />
Target<br />
Met by<br />
LEA (Y/N)<br />
N<br />
N<br />
Page 1 of 5
LEA: 6205 - PALESTINE-WHEATLEY SCH. <strong>DISTRICT</strong><br />
Indicator 04: Out-of-School Suspensions and Expulsions (2009/10 school year)<br />
A) Suspension/Expulsion<br />
Percent difference of CWD with out-of- school suspensions and<br />
expulsions totaling greater than 10 days in a school year as<br />
compared to the same data for general education students in<br />
the district.<br />
B) Suspension/Expulsion by Race and Ethnicity<br />
Percent of districts that have: (a) a significant discrepancy, by race or<br />
ethnicity, in the rate of suspensions and expulsions of greater than 10<br />
days in a school year for children with IEPs; and (b) policies,<br />
procedures or practices that contribute to the significant discrepancy<br />
and do not comply with requirements relating to the development<br />
and implementation of IEPs, the use of positive behavioral<br />
interventions and supports, and procedural safeguards.<br />
Indicator 05: School Age (5-21) Least Restrictive Environment<br />
A) In the Regular Class 80% or more of the day<br />
Percent of CWD with<br />
IEPs receiving instruction<br />
in the regular class 80%<br />
or more of the day.<br />
State<br />
Rate<br />
State<br />
Target<br />
LEA<br />
Rate<br />
B) In the Regular Class less than 40% of the day<br />
Percent of CWD with<br />
IEPs receiving instruction<br />
in the regular class less<br />
than 60% of the day.<br />
53.87% 59.77%<br />
State<br />
Rate<br />
State<br />
Target<br />
12.42% 12.51%<br />
24.32%<br />
LEA<br />
Rate<br />
5.41%<br />
C) Other Settings outside the regular class<br />
Percent of CWD with IEPs served in<br />
public or private separate schools,<br />
residential placements, or<br />
homebound/hospital placements.<br />
State<br />
Rate<br />
State<br />
Target<br />
2.80% 2.56%<br />
Target Met<br />
by LEA (Y/N)<br />
N<br />
Target Met<br />
by LEA (Y/N)<br />
Y<br />
LEA<br />
Rate<br />
1.35%<br />
Target Met<br />
by LEA(Y/N)<br />
Indicator 06: Early Childhood (3-5) Least Restrictive Environment<br />
A) Regular Early Childhood Program<br />
Percent of children (aged 3 through 5) with IEPs attending a regular<br />
early childhood program and receiving the majority of special<br />
education and related services in the regular early childhood program<br />
Allowable<br />
Difference<br />
LEA: 6205 - PALESTINE-WHEATLEY SCH. <strong>DISTRICT</strong><br />
Indicator 07: Preschool (3-5) Outcomes<br />
a) Percent of preschool CWD<br />
children who did not<br />
improve functioning.<br />
b) Percent of preschool CWD<br />
who improved but whose<br />
functioning remained below<br />
same age peers.<br />
c) Percent of preschool CWD<br />
who improved at a level<br />
nearer to same aged peers.<br />
d) Percent of preschool CWD<br />
who improved functioning to<br />
reach a level comparable to<br />
same age peers.<br />
e) Percent of preschool CWD<br />
children who maintain<br />
functioning at a level<br />
comparable to same aged<br />
peers.<br />
Summary<br />
Statements<br />
1) Of those preschool<br />
children who entered<br />
the preschool program<br />
below age expectations<br />
in each Outcome, the<br />
percent who<br />
substantially increased<br />
their rate of growth by<br />
the time they turned 6<br />
years of age or exited<br />
the program.<br />
2) The percent of<br />
preschool children who<br />
were functioning<br />
within age expectations<br />
in each Outcome by the<br />
time they turned 6<br />
years of age or exited<br />
A) Positive Social -Emotional<br />
Skills*<br />
State<br />
Rate<br />
A) Positive Social -<br />
Emotional Skills<br />
(Including social<br />
relationships)<br />
State<br />
Rate<br />
2.14%<br />
5.31%<br />
25.97%<br />
38.22%<br />
28.36%<br />
State<br />
Target<br />
LEA<br />
Rate<br />
LEA<br />
Rate<br />
— —<br />
— —<br />
— —<br />
— —<br />
— —<br />
Target<br />
Met by<br />
LEA(Y/N)<br />
B) Acquisition and Use of<br />
Knowledge and Skills<br />
(Including early language/<br />
communication and early literacy)<br />
B) Acquisition and Use of<br />
Knowledge and Skills **<br />
State<br />
Rate<br />
1.75%<br />
6.59%<br />
34.23%<br />
43.51%<br />
13.92%<br />
State<br />
Target<br />
LEA<br />
Rate<br />
Target<br />
Met by<br />
LEA(Y/N)<br />
C) Use of Appropriate Behaviors<br />
to Meet Their Needs<br />
State<br />
Rate<br />
State<br />
Target<br />
LEA<br />
Rate<br />
Target<br />
Met by<br />
LEA(Y/N)<br />
89.61% 90.50% — — N/A 90.31% 90.50% — — N/A 90.82% 92.50% — — N/A<br />
66.58% 69.50% — — N/A 57.43% 60.50% — — N/A 76.69% 78.50% — — N/A<br />
NOTE: * Including social relationships ** Including early language/ communication and early literacy<br />
Note: - - denotes not applicable<br />
State<br />
Rate<br />
LEA<br />
Rate<br />
— —<br />
— —<br />
— —<br />
— —<br />
— —<br />
C) Use of<br />
Appropriate<br />
Behaviors to<br />
Meet Their Needs<br />
State<br />
Rate<br />
4.51%<br />
17.34%<br />
41.72%<br />
34.97%<br />
LEA<br />
Rate<br />
1.46% — —<br />
— —<br />
— —<br />
— —<br />
— —<br />
Page 3 of 5
LEA: 6205 - PALESTINE-WHEATLEY SCH. <strong>DISTRICT</strong><br />
Indicator 08: Parent Involvement<br />
Percent of surveyed<br />
parents who reported<br />
school facilitated parent<br />
involvement as a means<br />
of improving services<br />
and results for children<br />
with disabilities.<br />
Early Childhood<br />
(3-5)<br />
School Age<br />
(5-21)<br />
State<br />
Rate<br />
90.47%<br />
95.05%<br />
Indicator 09: Disproportionality - Eligibility<br />
Disproportionate representation of racial<br />
and ethnic groups in special education and<br />
related services that is a result of<br />
inappropriate identification (e.g.<br />
monitoring data, review of policies,<br />
practices, and procedures under 618(d),<br />
etc.).<br />
State<br />
Rate<br />
State<br />
Target<br />
88.00%<br />
96.00%<br />
State<br />
Target<br />
0.00% 0.00%<br />
LEA<br />
Rate<br />
— —<br />
— —<br />
Indicator 10: Disproportionality-Child with a Disability<br />
Disproportionate representation of racial<br />
and ethnic groups in specific disability<br />
categories that is a result of inappropriate<br />
identification (e.g. monitoring data, review<br />
of policies, practices, and procedures under<br />
618(d), etc.).<br />
Indicator 11: Child Find<br />
Percent of children with<br />
parental consent to evaluate<br />
who are evaluated within<br />
the State established timeline<br />
of 60 days.<br />
Overall<br />
(3-21)<br />
Early Childhood<br />
(3-5)<br />
School Age<br />
(5-21)<br />
State<br />
Rate<br />
0.00%<br />
Indicator 12: Early Childhood Transition<br />
Percent of children referred by Part C prior to<br />
age 3, who are found eligible for Part B, and<br />
who have an IEP developed and implemented<br />
by their third birthday.<br />
Note: - - denotes not applicable<br />
State<br />
Rate<br />
99.41%<br />
99.70%<br />
98.97%<br />
State<br />
Rate<br />
State<br />
Target<br />
0.00%<br />
State<br />
Target<br />
100.00%<br />
100.00%<br />
100.00%<br />
State<br />
Target<br />
Target Met by<br />
LEA (Y/N)<br />
Y<br />
Target Met by<br />
LEA (Y/N)<br />
Y<br />
LEA<br />
Rate<br />
100.00%<br />
— —<br />
100.00%<br />
LEA<br />
Rate<br />
Target Met by<br />
LEA (Y/N)<br />
N/A<br />
N<br />
Note: The target for Indicator 09 is to have zero percent<br />
(0%) of districts identified as having disproportionate<br />
representation as a result of inappropriate<br />
identification in eligibility.<br />
Note: The target for Indicator 10 is to have zero<br />
percent (0%) of districts identified as having<br />
disproportionate representation as a result of<br />
inappropriate identification in a disability<br />
category.<br />
Target Met by<br />
LEA (Y/N)<br />
N/A<br />
Y<br />
Target Met<br />
by LEA<br />
(Y/N)<br />
99.21% 100.00% - - N/A<br />
Y<br />
Note: * Indicates a zero reponse rate for the<br />
district.<br />
Page 4 of 5
LEA: 6205 - PALESTINE-WHEATLEY SCH. <strong>DISTRICT</strong><br />
Indicator 13: Secondary Transition<br />
Percent of youth with disabilities aged 16 and<br />
up with an IEP that includes coordinated,<br />
measurable, annual IEP goals and transition<br />
services that will reasonably enable the student<br />
to meet the post-secondary goals.<br />
Indicator 14: Post-School Outcomes<br />
A. Percent of youth enrolled in higher<br />
education within one year of leaving high<br />
school.<br />
State<br />
Rate<br />
State<br />
Target<br />
Note: Data for this Indicator is from the on-site monitoring of LEAs for the given year.<br />
B. Percent of youth enrolled in higher<br />
education or competitively employed<br />
within one year of leaving high school.<br />
C. Percent of youth enrolled in higher<br />
education or in some other postsecondary<br />
education or training program; or<br />
competitively employed or in some other<br />
employment within one year of leaving<br />
high school.<br />
State<br />
Rate<br />
Indicator 20: Reported Data-Timely and Accurate*<br />
District submitted<br />
required data elements<br />
on or before due dates;<br />
made revisions within<br />
the alloted reveiw<br />
periods.<br />
Accurate and Timely<br />
Data Submission<br />
Overall (3-21)<br />
Early Childhood (3-5)<br />
School Age (5-21)<br />
State<br />
Target<br />
100.00%<br />
100.00%<br />
100.00%<br />
State<br />
Target<br />
LEA<br />
Rate<br />
LEA<br />
Rate<br />
Target Met by<br />
LEA (Y/N)<br />
Target Met<br />
by LEA<br />
(Y/N)<br />
Target Met<br />
by LEA<br />
(Y/N)<br />
*Data reviewed for timely and accurate submissions included all APSCN cycle data except for personnel<br />
Note: - - denotes not applicable<br />
96.19 100.00 — — N/A<br />
14.53<br />
State<br />
Rate<br />
49.42<br />
State<br />
Rate<br />
54.07<br />
13.00<br />
State<br />
Target<br />
49.00<br />
State<br />
Target<br />
60.00<br />
Y<br />
N/A<br />
Y<br />
0.00%<br />
LEA<br />
Rate<br />
0.00%<br />
LEA<br />
Rate<br />
0.00%<br />
N<br />
Target Met<br />
by LEA<br />
(Y/N)<br />
N<br />
Target Met<br />
by LEA<br />
(Y/N)<br />
N<br />
Page 5 of 5
LEA: 6301 - BAUXITE SCHOOL <strong>DISTRICT</strong><br />
<strong>ARKANSAS</strong> <strong>SPECIAL</strong> <strong>EDUCATION</strong><br />
<strong>DISTRICT</strong> <strong>ANNUAL</strong> PERFORMANCE REPORT<br />
2010/11 School Year<br />
Publication Date: March 2012<br />
Each State must have in place a State Performance Plan (SPP) to evaluate the State's efforts to meet the requirements and<br />
purposes of the implementation of the Individuals with Disabilities Education Act (IDEA). The SPP is a six-year plan, which<br />
describes Arkansas's performance on 20 indicators. The Office of Special Education Programs in the U. S. Department of<br />
Education requires that States report annually to the public on the performance of each local education agency (LEA) on 14 of<br />
20 indicators as compared with targets established by the State in the SPP. Arkansas will report indicators 1 through 14 and<br />
20 for each LEA serving children with disabilities (CWD). Any LEA not meeting targets on compliance indicators (0% for<br />
Indicators 4B, 09 & 10 and 100% for Indicators 11, 12, 13, and 20) are non-compliant with IDEA.<br />
There are no report changes for the 2010/11 school year profile; However, it is important to recognize that: .<br />
1. Indicator 01 (Graduation) is reported a year in arrear (2009/10 graduates) and is based on a four-year cohort. This<br />
means the rate is a measure of students who entered in ninth grade and graduate in four years. The calculation is a<br />
requirement under Title I of the Elementary and Secondary Education Act (ESEA).<br />
2. Indicator 02 (Drop out) is reported a year in arrear. This means the rate is a measure of students who dropped out in<br />
the 2009/10 school year. The Indicator 02 data are aligned with the Common Core of Data (CCD) requirements for<br />
grades 7-12.<br />
3. Indicator 04A and 4B (Suspension/Expulsion) is reported a year in arrear. This means the rate is a measure of<br />
students who had out-of-school suspensions and/or expulsions totaling more than 10 days.<br />
Percent of youth<br />
with IEPs<br />
graduating from<br />
high school with a<br />
regular diploma<br />
For a complete description of all the Indicators, please visit the special education website at<br />
http://arksped.k12.ar.us/sections/policy.html<br />
Indicator 01: Graduation Rates (2009/10 school year) Indicator 02: Dropout Rates (2009/10 school year)<br />
State<br />
Rate<br />
State<br />
Target<br />
75.76% 85.00%<br />
LEA<br />
Rate<br />
93.75%<br />
Target Met<br />
by LEA<br />
(Y/N)<br />
Y<br />
Percent of<br />
youth with<br />
IEPs dropping<br />
out of high<br />
school<br />
State<br />
Rate<br />
Indicator 03: Assessment on Statewide Benchmark Exam (grades 3-8, 11)<br />
A) Adequate Yearly Progress<br />
n=40<br />
Literacy<br />
Mathematics<br />
Met Disability Subgroup "n"<br />
for Reporting Purposes (Y/N)<br />
State Target for % of Districts Meeting<br />
AYP for Disability Subgroup<br />
State<br />
Target<br />
3.06% 4.20%<br />
LEA<br />
Rate<br />
0.00%<br />
% of Districts Meeting AYP<br />
for Disability Subgroup<br />
Target Met by<br />
LEA (Y/N)<br />
Y<br />
Target Met by<br />
LEA(Y/N)<br />
Overall N 17.15% 6.25%<br />
NA<br />
N<br />
N<br />
Note: For a district to qualify as having a disability subgroup it must have a minimum of 40 (n=40) students with disabilities in a school building.<br />
B) Participation<br />
Participation Rate: # of<br />
CWD Tested ÷ # of CWD<br />
Enrolled in grades tested.<br />
Participation Rate: Literacy<br />
Participation Rate: Math<br />
Note: - - denotes not applicable<br />
State<br />
Rate<br />
98.78%<br />
State<br />
Target<br />
95.00%<br />
LEA<br />
Rate<br />
100.00%<br />
Target Met<br />
by LEA (Y/N)<br />
98.61% 95.00% 100.00% Y<br />
Y<br />
C) Performance Proficiency<br />
Percent of CWD Scoring<br />
Proficient or Above<br />
Proficiency Rate: Literacy<br />
Proficiency Rate:<br />
Mathematics<br />
16.00%<br />
16.00%<br />
State<br />
Rate<br />
31.49%<br />
44.86%<br />
State<br />
Target<br />
45.22%<br />
51.14%<br />
LEA<br />
Rate<br />
25.33%<br />
32.89%<br />
NA<br />
NA<br />
Target<br />
Met by<br />
LEA (Y/N)<br />
N<br />
N<br />
Page 1 of 5
LEA: 6301 - BAUXITE SCHOOL <strong>DISTRICT</strong><br />
Indicator 04: Out-of-School Suspensions and Expulsions (2009/10 school year)<br />
A) Suspension/Expulsion<br />
Percent difference of CWD with out-of- school suspensions and<br />
expulsions totaling greater than 10 days in a school year as<br />
compared to the same data for general education students in<br />
the district.<br />
B) Suspension/Expulsion by Race and Ethnicity<br />
Percent of districts that have: (a) a significant discrepancy, by race or<br />
ethnicity, in the rate of suspensions and expulsions of greater than 10<br />
days in a school year for children with IEPs; and (b) policies,<br />
procedures or practices that contribute to the significant discrepancy<br />
and do not comply with requirements relating to the development<br />
and implementation of IEPs, the use of positive behavioral<br />
interventions and supports, and procedural safeguards.<br />
Indicator 05: School Age (5-21) Least Restrictive Environment<br />
A) In the Regular Class 80% or more of the day<br />
Percent of CWD with<br />
IEPs receiving instruction<br />
in the regular class 80%<br />
or more of the day.<br />
State<br />
Rate<br />
State<br />
Target<br />
LEA<br />
Rate<br />
B) In the Regular Class less than 40% of the day<br />
Percent of CWD with<br />
IEPs receiving instruction<br />
in the regular class less<br />
than 60% of the day.<br />
53.87% 59.77%<br />
State<br />
Rate<br />
State<br />
Target<br />
12.42% 12.51%<br />
60.16%<br />
LEA<br />
Rate<br />
8.13%<br />
C) Other Settings outside the regular class<br />
Percent of CWD with IEPs served in<br />
public or private separate schools,<br />
residential placements, or<br />
homebound/hospital placements.<br />
State<br />
Rate<br />
State<br />
Target<br />
2.80% 2.56%<br />
Target Met<br />
by LEA (Y/N)<br />
Y<br />
Target Met<br />
by LEA (Y/N)<br />
Y<br />
LEA<br />
Rate<br />
0.81%<br />
Target Met<br />
by LEA(Y/N)<br />
Indicator 06: Early Childhood (3-5) Least Restrictive Environment<br />
A) Regular Early Childhood Program<br />
Percent of children (aged 3 through 5) with IEPs attending a regular<br />
early childhood program and receiving the majority of special<br />
education and related services in the regular early childhood program<br />
Allowable<br />
Difference<br />
LEA: 6301 - BAUXITE SCHOOL <strong>DISTRICT</strong><br />
Indicator 07: Preschool (3-5) Outcomes<br />
a) Percent of preschool CWD<br />
children who did not<br />
improve functioning.<br />
b) Percent of preschool CWD<br />
who improved but whose<br />
functioning remained below<br />
same age peers.<br />
c) Percent of preschool CWD<br />
who improved at a level<br />
nearer to same aged peers.<br />
d) Percent of preschool CWD<br />
who improved functioning to<br />
reach a level comparable to<br />
same age peers.<br />
e) Percent of preschool CWD<br />
children who maintain<br />
functioning at a level<br />
comparable to same aged<br />
peers.<br />
Summary<br />
Statements<br />
1) Of those preschool<br />
children who entered<br />
the preschool program<br />
below age expectations<br />
in each Outcome, the<br />
percent who<br />
substantially increased<br />
their rate of growth by<br />
the time they turned 6<br />
years of age or exited<br />
the program.<br />
2) The percent of<br />
preschool children who<br />
were functioning<br />
within age expectations<br />
in each Outcome by the<br />
time they turned 6<br />
years of age or exited<br />
A) Positive Social -Emotional<br />
Skills*<br />
State<br />
Rate<br />
A) Positive Social -<br />
Emotional Skills<br />
(Including social<br />
relationships)<br />
State<br />
Rate<br />
2.14%<br />
5.31%<br />
25.97%<br />
38.22%<br />
28.36%<br />
State<br />
Target<br />
LEA<br />
Rate<br />
LEA<br />
Rate<br />
— —<br />
— —<br />
— —<br />
— —<br />
— —<br />
Target<br />
Met by<br />
LEA(Y/N)<br />
B) Acquisition and Use of<br />
Knowledge and Skills<br />
(Including early language/<br />
communication and early literacy)<br />
B) Acquisition and Use of<br />
Knowledge and Skills **<br />
State<br />
Rate<br />
1.75%<br />
6.59%<br />
34.23%<br />
43.51%<br />
13.92%<br />
State<br />
Target<br />
LEA<br />
Rate<br />
Target<br />
Met by<br />
LEA(Y/N)<br />
C) Use of Appropriate Behaviors<br />
to Meet Their Needs<br />
State<br />
Rate<br />
State<br />
Target<br />
LEA<br />
Rate<br />
Target<br />
Met by<br />
LEA(Y/N)<br />
89.61% 90.50% — — N/A 90.31% 90.50% — — N/A 90.82% 92.50% — — N/A<br />
66.58% 69.50% — — N/A 57.43% 60.50% — — N/A 76.69% 78.50% — — N/A<br />
NOTE: * Including social relationships ** Including early language/ communication and early literacy<br />
Note: - - denotes not applicable<br />
State<br />
Rate<br />
LEA<br />
Rate<br />
— —<br />
— —<br />
— —<br />
— —<br />
— —<br />
C) Use of<br />
Appropriate<br />
Behaviors to<br />
Meet Their Needs<br />
State<br />
Rate<br />
4.51%<br />
17.34%<br />
41.72%<br />
34.97%<br />
LEA<br />
Rate<br />
1.46% — —<br />
— —<br />
— —<br />
— —<br />
— —<br />
Page 3 of 5
LEA: 6301 - BAUXITE SCHOOL <strong>DISTRICT</strong><br />
Indicator 08: Parent Involvement<br />
Percent of surveyed<br />
parents who reported<br />
school facilitated parent<br />
involvement as a means<br />
of improving services<br />
and results for children<br />
with disabilities.<br />
Early Childhood<br />
(3-5)<br />
School Age<br />
(5-21)<br />
State<br />
Rate<br />
90.47%<br />
95.05%<br />
Indicator 09: Disproportionality - Eligibility<br />
Disproportionate representation of racial<br />
and ethnic groups in special education and<br />
related services that is a result of<br />
inappropriate identification (e.g.<br />
monitoring data, review of policies,<br />
practices, and procedures under 618(d),<br />
etc.).<br />
State<br />
Rate<br />
State<br />
Target<br />
88.00%<br />
96.00%<br />
State<br />
Target<br />
0.00% 0.00%<br />
LEA<br />
Rate<br />
— —<br />
96.15%<br />
Indicator 10: Disproportionality-Child with a Disability<br />
Disproportionate representation of racial<br />
and ethnic groups in specific disability<br />
categories that is a result of inappropriate<br />
identification (e.g. monitoring data, review<br />
of policies, practices, and procedures under<br />
618(d), etc.).<br />
Indicator 11: Child Find<br />
Percent of children with<br />
parental consent to evaluate<br />
who are evaluated within<br />
the State established timeline<br />
of 60 days.<br />
Overall<br />
(3-21)<br />
Early Childhood<br />
(3-5)<br />
School Age<br />
(5-21)<br />
State<br />
Rate<br />
0.00%<br />
Indicator 12: Early Childhood Transition<br />
Percent of children referred by Part C prior to<br />
age 3, who are found eligible for Part B, and<br />
who have an IEP developed and implemented<br />
by their third birthday.<br />
Note: - - denotes not applicable<br />
State<br />
Rate<br />
99.41%<br />
99.70%<br />
98.97%<br />
State<br />
Rate<br />
State<br />
Target<br />
0.00%<br />
State<br />
Target<br />
100.00%<br />
100.00%<br />
100.00%<br />
State<br />
Target<br />
Target Met by<br />
LEA (Y/N)<br />
Y<br />
Target Met by<br />
LEA (Y/N)<br />
Y<br />
LEA<br />
Rate<br />
100.00%<br />
— —<br />
100.00%<br />
LEA<br />
Rate<br />
Target Met by<br />
LEA (Y/N)<br />
N/A<br />
Y<br />
Note: The target for Indicator 09 is to have zero percent<br />
(0%) of districts identified as having disproportionate<br />
representation as a result of inappropriate<br />
identification in eligibility.<br />
Note: The target for Indicator 10 is to have zero<br />
percent (0%) of districts identified as having<br />
disproportionate representation as a result of<br />
inappropriate identification in a disability<br />
category.<br />
Target Met by<br />
LEA (Y/N)<br />
N/A<br />
Y<br />
Target Met<br />
by LEA<br />
(Y/N)<br />
99.21% 100.00% - - N/A<br />
Y<br />
Note: * Indicates a zero reponse rate for the<br />
district.<br />
Page 4 of 5
LEA: 6301 - BAUXITE SCHOOL <strong>DISTRICT</strong><br />
Indicator 13: Secondary Transition<br />
Percent of youth with disabilities aged 16 and<br />
up with an IEP that includes coordinated,<br />
measurable, annual IEP goals and transition<br />
services that will reasonably enable the student<br />
to meet the post-secondary goals.<br />
Indicator 14: Post-School Outcomes<br />
A. Percent of youth enrolled in higher<br />
education within one year of leaving high<br />
school.<br />
State<br />
Rate<br />
State<br />
Target<br />
Note: Data for this Indicator is from the on-site monitoring of LEAs for the given year.<br />
B. Percent of youth enrolled in higher<br />
education or competitively employed<br />
within one year of leaving high school.<br />
C. Percent of youth enrolled in higher<br />
education or in some other postsecondary<br />
education or training program; or<br />
competitively employed or in some other<br />
employment within one year of leaving<br />
high school.<br />
State<br />
Rate<br />
Indicator 20: Reported Data-Timely and Accurate*<br />
District submitted<br />
required data elements<br />
on or before due dates;<br />
made revisions within<br />
the alloted reveiw<br />
periods.<br />
Accurate and Timely<br />
Data Submission<br />
Overall (3-21)<br />
Early Childhood (3-5)<br />
School Age (5-21)<br />
State<br />
Target<br />
100.00%<br />
100.00%<br />
100.00%<br />
State<br />
Target<br />
LEA<br />
Rate<br />
LEA<br />
Rate<br />
Target Met by<br />
LEA (Y/N)<br />
Target Met<br />
by LEA<br />
(Y/N)<br />
Target Met<br />
by LEA<br />
(Y/N)<br />
*Data reviewed for timely and accurate submissions included all APSCN cycle data except for personnel<br />
Note: - - denotes not applicable<br />
96.19 100.00 — — N/A<br />
14.53<br />
State<br />
Rate<br />
49.42<br />
State<br />
Rate<br />
54.07<br />
13.00<br />
State<br />
Target<br />
49.00<br />
State<br />
Target<br />
60.00<br />
Y<br />
N/A<br />
Y<br />
— —<br />
LEA<br />
Rate<br />
— —<br />
LEA<br />
Rate<br />
— —<br />
N/A<br />
Target Met<br />
by LEA<br />
(Y/N)<br />
N/A<br />
Target Met<br />
by LEA<br />
(Y/N)<br />
N/A<br />
Page 5 of 5
LEA: 6302 - BENTON SCHOOL <strong>DISTRICT</strong><br />
<strong>ARKANSAS</strong> <strong>SPECIAL</strong> <strong>EDUCATION</strong><br />
<strong>DISTRICT</strong> <strong>ANNUAL</strong> PERFORMANCE REPORT<br />
2010/11 School Year<br />
Publication Date: March 2012<br />
Each State must have in place a State Performance Plan (SPP) to evaluate the State's efforts to meet the requirements and<br />
purposes of the implementation of the Individuals with Disabilities Education Act (IDEA). The SPP is a six-year plan, which<br />
describes Arkansas's performance on 20 indicators. The Office of Special Education Programs in the U. S. Department of<br />
Education requires that States report annually to the public on the performance of each local education agency (LEA) on 14 of<br />
20 indicators as compared with targets established by the State in the SPP. Arkansas will report indicators 1 through 14 and<br />
20 for each LEA serving children with disabilities (CWD). Any LEA not meeting targets on compliance indicators (0% for<br />
Indicators 4B, 09 & 10 and 100% for Indicators 11, 12, 13, and 20) are non-compliant with IDEA.<br />
There are no report changes for the 2010/11 school year profile; However, it is important to recognize that: .<br />
1. Indicator 01 (Graduation) is reported a year in arrear (2009/10 graduates) and is based on a four-year cohort. This<br />
means the rate is a measure of students who entered in ninth grade and graduate in four years. The calculation is a<br />
requirement under Title I of the Elementary and Secondary Education Act (ESEA).<br />
2. Indicator 02 (Drop out) is reported a year in arrear. This means the rate is a measure of students who dropped out in<br />
the 2009/10 school year. The Indicator 02 data are aligned with the Common Core of Data (CCD) requirements for<br />
grades 7-12.<br />
3. Indicator 04A and 4B (Suspension/Expulsion) is reported a year in arrear. This means the rate is a measure of<br />
students who had out-of-school suspensions and/or expulsions totaling more than 10 days.<br />
Percent of youth<br />
with IEPs<br />
graduating from<br />
high school with a<br />
regular diploma<br />
For a complete description of all the Indicators, please visit the special education website at<br />
http://arksped.k12.ar.us/sections/policy.html<br />
Indicator 01: Graduation Rates (2009/10 school year) Indicator 02: Dropout Rates (2009/10 school year)<br />
State<br />
Rate<br />
State<br />
Target<br />
75.76% 85.00%<br />
LEA<br />
Rate<br />
74.47%<br />
Target Met<br />
by LEA<br />
(Y/N)<br />
N<br />
Percent of<br />
youth with<br />
IEPs dropping<br />
out of high<br />
school<br />
State<br />
Rate<br />
Indicator 03: Assessment on Statewide Benchmark Exam (grades 3-8, 11)<br />
A) Adequate Yearly Progress<br />
n=40<br />
Literacy<br />
Mathematics<br />
Met Disability Subgroup "n"<br />
for Reporting Purposes (Y/N)<br />
State Target for % of Districts Meeting<br />
AYP for Disability Subgroup<br />
State<br />
Target<br />
3.06% 4.20%<br />
LEA<br />
Rate<br />
4.24%<br />
% of Districts Meeting AYP<br />
for Disability Subgroup<br />
Target Met by<br />
LEA (Y/N)<br />
N<br />
Target Met by<br />
LEA(Y/N)<br />
Overall N 17.15% 6.25%<br />
NA<br />
N<br />
N<br />
Note: For a district to qualify as having a disability subgroup it must have a minimum of 40 (n=40) students with disabilities in a school building.<br />
B) Participation<br />
Participation Rate: # of<br />
CWD Tested ÷ # of CWD<br />
Enrolled in grades tested.<br />
Participation Rate: Literacy<br />
Participation Rate: Math<br />
Note: - - denotes not applicable<br />
State<br />
Rate<br />
98.78%<br />
State<br />
Target<br />
95.00%<br />
LEA<br />
Rate<br />
98.85%<br />
Target Met<br />
by LEA (Y/N)<br />
98.61% 95.00% 99.63% Y<br />
Y<br />
C) Performance Proficiency<br />
Percent of CWD Scoring<br />
Proficient or Above<br />
Proficiency Rate: Literacy<br />
Proficiency Rate:<br />
Mathematics<br />
16.00%<br />
16.00%<br />
State<br />
Rate<br />
31.49%<br />
44.86%<br />
State<br />
Target<br />
45.22%<br />
51.14%<br />
LEA<br />
Rate<br />
44.35%<br />
60.64%<br />
NA<br />
NA<br />
Target<br />
Met by<br />
LEA (Y/N)<br />
N<br />
Y<br />
Page 1 of 5
LEA: 6302 - BENTON SCHOOL <strong>DISTRICT</strong><br />
Indicator 04: Out-of-School Suspensions and Expulsions (2009/10 school year)<br />
A) Suspension/Expulsion<br />
Percent difference of CWD with out-of- school suspensions and<br />
expulsions totaling greater than 10 days in a school year as<br />
compared to the same data for general education students in<br />
the district.<br />
B) Suspension/Expulsion by Race and Ethnicity<br />
Percent of districts that have: (a) a significant discrepancy, by race or<br />
ethnicity, in the rate of suspensions and expulsions of greater than 10<br />
days in a school year for children with IEPs; and (b) policies,<br />
procedures or practices that contribute to the significant discrepancy<br />
and do not comply with requirements relating to the development<br />
and implementation of IEPs, the use of positive behavioral<br />
interventions and supports, and procedural safeguards.<br />
Indicator 05: School Age (5-21) Least Restrictive Environment<br />
A) In the Regular Class 80% or more of the day<br />
Percent of CWD with<br />
IEPs receiving instruction<br />
in the regular class 80%<br />
or more of the day.<br />
State<br />
Rate<br />
State<br />
Target<br />
LEA<br />
Rate<br />
B) In the Regular Class less than 40% of the day<br />
Percent of CWD with<br />
IEPs receiving instruction<br />
in the regular class less<br />
than 60% of the day.<br />
53.87% 59.77%<br />
State<br />
Rate<br />
State<br />
Target<br />
12.42% 12.51%<br />
55.56%<br />
LEA<br />
Rate<br />
13.00%<br />
C) Other Settings outside the regular class<br />
Percent of CWD with IEPs served in<br />
public or private separate schools,<br />
residential placements, or<br />
homebound/hospital placements.<br />
State<br />
Rate<br />
State<br />
Target<br />
2.80% 2.56%<br />
Target Met<br />
by LEA (Y/N)<br />
N<br />
Target Met<br />
by LEA (Y/N)<br />
N<br />
LEA<br />
Rate<br />
1.68%<br />
Target Met<br />
by LEA(Y/N)<br />
Indicator 06: Early Childhood (3-5) Least Restrictive Environment<br />
A) Regular Early Childhood Program<br />
Percent of children (aged 3 through 5) with IEPs attending a regular<br />
early childhood program and receiving the majority of special<br />
education and related services in the regular early childhood program<br />
Allowable<br />
Difference<br />
LEA: 6302 - BENTON SCHOOL <strong>DISTRICT</strong><br />
Indicator 07: Preschool (3-5) Outcomes<br />
a) Percent of preschool CWD<br />
children who did not<br />
improve functioning.<br />
b) Percent of preschool CWD<br />
who improved but whose<br />
functioning remained below<br />
same age peers.<br />
c) Percent of preschool CWD<br />
who improved at a level<br />
nearer to same aged peers.<br />
d) Percent of preschool CWD<br />
who improved functioning to<br />
reach a level comparable to<br />
same age peers.<br />
e) Percent of preschool CWD<br />
children who maintain<br />
functioning at a level<br />
comparable to same aged<br />
peers.<br />
Summary<br />
Statements<br />
1) Of those preschool<br />
children who entered<br />
the preschool program<br />
below age expectations<br />
in each Outcome, the<br />
percent who<br />
substantially increased<br />
their rate of growth by<br />
the time they turned 6<br />
years of age or exited<br />
the program.<br />
2) The percent of<br />
preschool children who<br />
were functioning<br />
within age expectations<br />
in each Outcome by the<br />
time they turned 6<br />
years of age or exited<br />
A) Positive Social -Emotional<br />
Skills*<br />
State<br />
Rate<br />
A) Positive Social -<br />
Emotional Skills<br />
(Including social<br />
relationships)<br />
State<br />
Rate<br />
2.14%<br />
5.31%<br />
25.97%<br />
38.22%<br />
28.36%<br />
State<br />
Target<br />
LEA<br />
Rate<br />
LEA<br />
Rate<br />
— —<br />
— —<br />
— —<br />
— —<br />
— —<br />
Target<br />
Met by<br />
LEA(Y/N)<br />
B) Acquisition and Use of<br />
Knowledge and Skills<br />
(Including early language/<br />
communication and early literacy)<br />
B) Acquisition and Use of<br />
Knowledge and Skills **<br />
State<br />
Rate<br />
1.75%<br />
6.59%<br />
34.23%<br />
43.51%<br />
13.92%<br />
State<br />
Target<br />
LEA<br />
Rate<br />
Target<br />
Met by<br />
LEA(Y/N)<br />
C) Use of Appropriate Behaviors<br />
to Meet Their Needs<br />
State<br />
Rate<br />
State<br />
Target<br />
LEA<br />
Rate<br />
Target<br />
Met by<br />
LEA(Y/N)<br />
89.61% 90.50% — — N/A 90.31% 90.50% — — N/A 90.82% 92.50% — — N/A<br />
66.58% 69.50% — — N/A 57.43% 60.50% — — N/A 76.69% 78.50% — — N/A<br />
NOTE: * Including social relationships ** Including early language/ communication and early literacy<br />
Note: - - denotes not applicable<br />
State<br />
Rate<br />
LEA<br />
Rate<br />
— —<br />
— —<br />
— —<br />
— —<br />
— —<br />
C) Use of<br />
Appropriate<br />
Behaviors to<br />
Meet Their Needs<br />
State<br />
Rate<br />
4.51%<br />
17.34%<br />
41.72%<br />
34.97%<br />
LEA<br />
Rate<br />
1.46% — —<br />
— —<br />
— —<br />
— —<br />
— —<br />
Page 3 of 5
LEA: 6302 - BENTON SCHOOL <strong>DISTRICT</strong><br />
Indicator 08: Parent Involvement<br />
Percent of surveyed<br />
parents who reported<br />
school facilitated parent<br />
involvement as a means<br />
of improving services<br />
and results for children<br />
with disabilities.<br />
Early Childhood<br />
(3-5)<br />
School Age<br />
(5-21)<br />
State<br />
Rate<br />
90.47%<br />
95.05%<br />
Indicator 09: Disproportionality - Eligibility<br />
Disproportionate representation of racial<br />
and ethnic groups in special education and<br />
related services that is a result of<br />
inappropriate identification (e.g.<br />
monitoring data, review of policies,<br />
practices, and procedures under 618(d),<br />
etc.).<br />
State<br />
Rate<br />
State<br />
Target<br />
88.00%<br />
96.00%<br />
State<br />
Target<br />
0.00% 0.00%<br />
LEA<br />
Rate<br />
— —<br />
97.85%<br />
Indicator 10: Disproportionality-Child with a Disability<br />
Disproportionate representation of racial<br />
and ethnic groups in specific disability<br />
categories that is a result of inappropriate<br />
identification (e.g. monitoring data, review<br />
of policies, practices, and procedures under<br />
618(d), etc.).<br />
Indicator 11: Child Find<br />
Percent of children with<br />
parental consent to evaluate<br />
who are evaluated within<br />
the State established timeline<br />
of 60 days.<br />
Overall<br />
(3-21)<br />
Early Childhood<br />
(3-5)<br />
School Age<br />
(5-21)<br />
State<br />
Rate<br />
0.00%<br />
Indicator 12: Early Childhood Transition<br />
Percent of children referred by Part C prior to<br />
age 3, who are found eligible for Part B, and<br />
who have an IEP developed and implemented<br />
by their third birthday.<br />
Note: - - denotes not applicable<br />
State<br />
Rate<br />
99.41%<br />
99.70%<br />
98.97%<br />
State<br />
Rate<br />
State<br />
Target<br />
0.00%<br />
State<br />
Target<br />
100.00%<br />
100.00%<br />
100.00%<br />
State<br />
Target<br />
Target Met by<br />
LEA (Y/N)<br />
Y<br />
Target Met by<br />
LEA (Y/N)<br />
Y<br />
LEA<br />
Rate<br />
100.00%<br />
— —<br />
100.00%<br />
LEA<br />
Rate<br />
Target Met by<br />
LEA (Y/N)<br />
N/A<br />
Y<br />
Note: The target for Indicator 09 is to have zero percent<br />
(0%) of districts identified as having disproportionate<br />
representation as a result of inappropriate<br />
identification in eligibility.<br />
Note: The target for Indicator 10 is to have zero<br />
percent (0%) of districts identified as having<br />
disproportionate representation as a result of<br />
inappropriate identification in a disability<br />
category.<br />
Target Met by<br />
LEA (Y/N)<br />
N/A<br />
Y<br />
Target Met<br />
by LEA<br />
(Y/N)<br />
99.21% 100.00% - - N/A<br />
Y<br />
Note: * Indicates a zero reponse rate for the<br />
district.<br />
Page 4 of 5
LEA: 6302 - BENTON SCHOOL <strong>DISTRICT</strong><br />
Indicator 13: Secondary Transition<br />
Percent of youth with disabilities aged 16 and<br />
up with an IEP that includes coordinated,<br />
measurable, annual IEP goals and transition<br />
services that will reasonably enable the student<br />
to meet the post-secondary goals.<br />
Indicator 14: Post-School Outcomes<br />
A. Percent of youth enrolled in higher<br />
education within one year of leaving high<br />
school.<br />
State<br />
Rate<br />
State<br />
Target<br />
Note: Data for this Indicator is from the on-site monitoring of LEAs for the given year.<br />
B. Percent of youth enrolled in higher<br />
education or competitively employed<br />
within one year of leaving high school.<br />
C. Percent of youth enrolled in higher<br />
education or in some other postsecondary<br />
education or training program; or<br />
competitively employed or in some other<br />
employment within one year of leaving<br />
high school.<br />
State<br />
Rate<br />
Indicator 20: Reported Data-Timely and Accurate*<br />
District submitted<br />
required data elements<br />
on or before due dates;<br />
made revisions within<br />
the alloted reveiw<br />
periods.<br />
Accurate and Timely<br />
Data Submission<br />
Overall (3-21)<br />
Early Childhood (3-5)<br />
School Age (5-21)<br />
State<br />
Target<br />
100.00%<br />
100.00%<br />
100.00%<br />
State<br />
Target<br />
LEA<br />
Rate<br />
LEA<br />
Rate<br />
Target Met by<br />
LEA (Y/N)<br />
Target Met<br />
by LEA<br />
(Y/N)<br />
Target Met<br />
by LEA<br />
(Y/N)<br />
*Data reviewed for timely and accurate submissions included all APSCN cycle data except for personnel<br />
Note: - - denotes not applicable<br />
96.19 100.00 — — N/A<br />
14.53<br />
State<br />
Rate<br />
49.42<br />
State<br />
Rate<br />
54.07<br />
13.00<br />
State<br />
Target<br />
49.00<br />
State<br />
Target<br />
60.00<br />
Y<br />
N/A<br />
Y<br />
— —<br />
LEA<br />
Rate<br />
— —<br />
LEA<br />
Rate<br />
— —<br />
N/A<br />
Target Met<br />
by LEA<br />
(Y/N)<br />
N/A<br />
Target Met<br />
by LEA<br />
(Y/N)<br />
N/A<br />
Page 5 of 5
LEA: 6303 - BRYANT SCHOOL <strong>DISTRICT</strong><br />
<strong>ARKANSAS</strong> <strong>SPECIAL</strong> <strong>EDUCATION</strong><br />
<strong>DISTRICT</strong> <strong>ANNUAL</strong> PERFORMANCE REPORT<br />
2010/11 School Year<br />
Publication Date: March 2012<br />
Each State must have in place a State Performance Plan (SPP) to evaluate the State's efforts to meet the requirements and<br />
purposes of the implementation of the Individuals with Disabilities Education Act (IDEA). The SPP is a six-year plan, which<br />
describes Arkansas's performance on 20 indicators. The Office of Special Education Programs in the U. S. Department of<br />
Education requires that States report annually to the public on the performance of each local education agency (LEA) on 14 of<br />
20 indicators as compared with targets established by the State in the SPP. Arkansas will report indicators 1 through 14 and<br />
20 for each LEA serving children with disabilities (CWD). Any LEA not meeting targets on compliance indicators (0% for<br />
Indicators 4B, 09 & 10 and 100% for Indicators 11, 12, 13, and 20) are non-compliant with IDEA.<br />
There are no report changes for the 2010/11 school year profile; However, it is important to recognize that: .<br />
1. Indicator 01 (Graduation) is reported a year in arrear (2009/10 graduates) and is based on a four-year cohort. This<br />
means the rate is a measure of students who entered in ninth grade and graduate in four years. The calculation is a<br />
requirement under Title I of the Elementary and Secondary Education Act (ESEA).<br />
2. Indicator 02 (Drop out) is reported a year in arrear. This means the rate is a measure of students who dropped out in<br />
the 2009/10 school year. The Indicator 02 data are aligned with the Common Core of Data (CCD) requirements for<br />
grades 7-12.<br />
3. Indicator 04A and 4B (Suspension/Expulsion) is reported a year in arrear. This means the rate is a measure of<br />
students who had out-of-school suspensions and/or expulsions totaling more than 10 days.<br />
Percent of youth<br />
with IEPs<br />
graduating from<br />
high school with a<br />
regular diploma<br />
For a complete description of all the Indicators, please visit the special education website at<br />
http://arksped.k12.ar.us/sections/policy.html<br />
Indicator 01: Graduation Rates (2009/10 school year) Indicator 02: Dropout Rates (2009/10 school year)<br />
State<br />
Rate<br />
State<br />
Target<br />
75.76% 85.00%<br />
LEA<br />
Rate<br />
62.50%<br />
Target Met<br />
by LEA<br />
(Y/N)<br />
N<br />
Percent of<br />
youth with<br />
IEPs dropping<br />
out of high<br />
school<br />
State<br />
Rate<br />
Indicator 03: Assessment on Statewide Benchmark Exam (grades 3-8, 11)<br />
A) Adequate Yearly Progress<br />
n=40<br />
Literacy<br />
Mathematics<br />
Met Disability Subgroup "n"<br />
for Reporting Purposes (Y/N)<br />
State Target for % of Districts Meeting<br />
AYP for Disability Subgroup<br />
State<br />
Target<br />
3.06% 4.20%<br />
LEA<br />
Rate<br />
2.58%<br />
% of Districts Meeting AYP<br />
for Disability Subgroup<br />
Target Met by<br />
LEA (Y/N)<br />
Y<br />
Target Met by<br />
LEA(Y/N)<br />
Overall N 17.15% 6.25%<br />
NA<br />
N<br />
N<br />
Note: For a district to qualify as having a disability subgroup it must have a minimum of 40 (n=40) students with disabilities in a school building.<br />
B) Participation<br />
Participation Rate: # of<br />
CWD Tested ÷ # of CWD<br />
Enrolled in grades tested.<br />
Participation Rate: Literacy<br />
Participation Rate: Math<br />
Note: - - denotes not applicable<br />
State<br />
Rate<br />
98.78%<br />
State<br />
Target<br />
95.00%<br />
LEA<br />
Rate<br />
96.44%<br />
Target Met<br />
by LEA (Y/N)<br />
98.61% 95.00% 98.05% Y<br />
Y<br />
C) Performance Proficiency<br />
Percent of CWD Scoring<br />
Proficient or Above<br />
Proficiency Rate: Literacy<br />
Proficiency Rate:<br />
Mathematics<br />
16.00%<br />
16.00%<br />
State<br />
Rate<br />
31.49%<br />
44.86%<br />
State<br />
Target<br />
45.22%<br />
51.14%<br />
LEA<br />
Rate<br />
43.76%<br />
59.91%<br />
NA<br />
NA<br />
Target<br />
Met by<br />
LEA (Y/N)<br />
N<br />
Y<br />
Page 1 of 5
LEA: 6303 - BRYANT SCHOOL <strong>DISTRICT</strong><br />
Indicator 04: Out-of-School Suspensions and Expulsions (2009/10 school year)<br />
A) Suspension/Expulsion<br />
Percent difference of CWD with out-of- school suspensions and<br />
expulsions totaling greater than 10 days in a school year as<br />
compared to the same data for general education students in<br />
the district.<br />
B) Suspension/Expulsion by Race and Ethnicity<br />
Percent of districts that have: (a) a significant discrepancy, by race or<br />
ethnicity, in the rate of suspensions and expulsions of greater than 10<br />
days in a school year for children with IEPs; and (b) policies,<br />
procedures or practices that contribute to the significant discrepancy<br />
and do not comply with requirements relating to the development<br />
and implementation of IEPs, the use of positive behavioral<br />
interventions and supports, and procedural safeguards.<br />
Indicator 05: School Age (5-21) Least Restrictive Environment<br />
A) In the Regular Class 80% or more of the day<br />
Percent of CWD with<br />
IEPs receiving instruction<br />
in the regular class 80%<br />
or more of the day.<br />
State<br />
Rate<br />
State<br />
Target<br />
LEA<br />
Rate<br />
B) In the Regular Class less than 40% of the day<br />
Percent of CWD with<br />
IEPs receiving instruction<br />
in the regular class less<br />
than 60% of the day.<br />
53.87% 59.77%<br />
State<br />
Rate<br />
State<br />
Target<br />
12.42% 12.51%<br />
53.35%<br />
LEA<br />
Rate<br />
16.13%<br />
C) Other Settings outside the regular class<br />
Percent of CWD with IEPs served in<br />
public or private separate schools,<br />
residential placements, or<br />
homebound/hospital placements.<br />
State<br />
Rate<br />
State<br />
Target<br />
2.80% 2.56%<br />
Target Met<br />
by LEA (Y/N)<br />
N<br />
Target Met<br />
by LEA (Y/N)<br />
N<br />
LEA<br />
Rate<br />
3.46%<br />
Target Met<br />
by LEA(Y/N)<br />
Indicator 06: Early Childhood (3-5) Least Restrictive Environment<br />
A) Regular Early Childhood Program<br />
Percent of children (aged 3 through 5) with IEPs attending a regular<br />
early childhood program and receiving the majority of special<br />
education and related services in the regular early childhood program<br />
Allowable<br />
Difference<br />
LEA: 6303 - BRYANT SCHOOL <strong>DISTRICT</strong><br />
Indicator 07: Preschool (3-5) Outcomes<br />
a) Percent of preschool CWD<br />
children who did not<br />
improve functioning.<br />
b) Percent of preschool CWD<br />
who improved but whose<br />
functioning remained below<br />
same age peers.<br />
c) Percent of preschool CWD<br />
who improved at a level<br />
nearer to same aged peers.<br />
d) Percent of preschool CWD<br />
who improved functioning to<br />
reach a level comparable to<br />
same age peers.<br />
e) Percent of preschool CWD<br />
children who maintain<br />
functioning at a level<br />
comparable to same aged<br />
peers.<br />
Summary<br />
Statements<br />
1) Of those preschool<br />
children who entered<br />
the preschool program<br />
below age expectations<br />
in each Outcome, the<br />
percent who<br />
substantially increased<br />
their rate of growth by<br />
the time they turned 6<br />
years of age or exited<br />
the program.<br />
2) The percent of<br />
preschool children who<br />
were functioning<br />
within age expectations<br />
in each Outcome by the<br />
time they turned 6<br />
years of age or exited<br />
A) Positive Social -Emotional<br />
Skills*<br />
State<br />
Rate<br />
A) Positive Social -<br />
Emotional Skills<br />
(Including social<br />
relationships)<br />
State<br />
Rate<br />
2.14%<br />
5.31%<br />
25.97%<br />
38.22%<br />
28.36%<br />
State<br />
Target<br />
LEA<br />
Rate<br />
LEA<br />
Rate<br />
— —<br />
— —<br />
— —<br />
— —<br />
— —<br />
Target<br />
Met by<br />
LEA(Y/N)<br />
B) Acquisition and Use of<br />
Knowledge and Skills<br />
(Including early language/<br />
communication and early literacy)<br />
B) Acquisition and Use of<br />
Knowledge and Skills **<br />
State<br />
Rate<br />
1.75%<br />
6.59%<br />
34.23%<br />
43.51%<br />
13.92%<br />
State<br />
Target<br />
LEA<br />
Rate<br />
Target<br />
Met by<br />
LEA(Y/N)<br />
C) Use of Appropriate Behaviors<br />
to Meet Their Needs<br />
State<br />
Rate<br />
State<br />
Target<br />
LEA<br />
Rate<br />
Target<br />
Met by<br />
LEA(Y/N)<br />
89.61% 90.50% — — N/A 90.31% 90.50% — — N/A 90.82% 92.50% — — N/A<br />
66.58% 69.50% — — N/A 57.43% 60.50% — — N/A 76.69% 78.50% — — N/A<br />
NOTE: * Including social relationships ** Including early language/ communication and early literacy<br />
Note: - - denotes not applicable<br />
State<br />
Rate<br />
LEA<br />
Rate<br />
— —<br />
— —<br />
— —<br />
— —<br />
— —<br />
C) Use of<br />
Appropriate<br />
Behaviors to<br />
Meet Their Needs<br />
State<br />
Rate<br />
4.51%<br />
17.34%<br />
41.72%<br />
34.97%<br />
LEA<br />
Rate<br />
1.46% — —<br />
— —<br />
— —<br />
— —<br />
— —<br />
Page 3 of 5
LEA: 6303 - BRYANT SCHOOL <strong>DISTRICT</strong><br />
Indicator 08: Parent Involvement<br />
Percent of surveyed<br />
parents who reported<br />
school facilitated parent<br />
involvement as a means<br />
of improving services<br />
and results for children<br />
with disabilities.<br />
Early Childhood<br />
(3-5)<br />
School Age<br />
(5-21)<br />
State<br />
Rate<br />
90.47%<br />
95.05%<br />
Indicator 09: Disproportionality - Eligibility<br />
Disproportionate representation of racial<br />
and ethnic groups in special education and<br />
related services that is a result of<br />
inappropriate identification (e.g.<br />
monitoring data, review of policies,<br />
practices, and procedures under 618(d),<br />
etc.).<br />
State<br />
Rate<br />
State<br />
Target<br />
88.00%<br />
96.00%<br />
State<br />
Target<br />
0.00% 0.00%<br />
LEA<br />
Rate<br />
— —<br />
90.22%<br />
Indicator 10: Disproportionality-Child with a Disability<br />
Disproportionate representation of racial<br />
and ethnic groups in specific disability<br />
categories that is a result of inappropriate<br />
identification (e.g. monitoring data, review<br />
of policies, practices, and procedures under<br />
618(d), etc.).<br />
Indicator 11: Child Find<br />
Percent of children with<br />
parental consent to evaluate<br />
who are evaluated within<br />
the State established timeline<br />
of 60 days.<br />
Overall<br />
(3-21)<br />
Early Childhood<br />
(3-5)<br />
School Age<br />
(5-21)<br />
State<br />
Rate<br />
0.00%<br />
Indicator 12: Early Childhood Transition<br />
Percent of children referred by Part C prior to<br />
age 3, who are found eligible for Part B, and<br />
who have an IEP developed and implemented<br />
by their third birthday.<br />
Note: - - denotes not applicable<br />
State<br />
Rate<br />
99.41%<br />
99.70%<br />
98.97%<br />
State<br />
Rate<br />
State<br />
Target<br />
0.00%<br />
State<br />
Target<br />
100.00%<br />
100.00%<br />
100.00%<br />
State<br />
Target<br />
Target Met by<br />
LEA (Y/N)<br />
Y<br />
Target Met by<br />
LEA (Y/N)<br />
Y<br />
LEA<br />
Rate<br />
100.00%<br />
— —<br />
100.00%<br />
LEA<br />
Rate<br />
Target Met by<br />
LEA (Y/N)<br />
N/A<br />
N<br />
Note: The target for Indicator 09 is to have zero percent<br />
(0%) of districts identified as having disproportionate<br />
representation as a result of inappropriate<br />
identification in eligibility.<br />
Note: The target for Indicator 10 is to have zero<br />
percent (0%) of districts identified as having<br />
disproportionate representation as a result of<br />
inappropriate identification in a disability<br />
category.<br />
Target Met by<br />
LEA (Y/N)<br />
N/A<br />
Y<br />
Target Met<br />
by LEA<br />
(Y/N)<br />
99.21% 100.00% - - N/A<br />
Y<br />
Note: * Indicates a zero reponse rate for the<br />
district.<br />
Page 4 of 5
LEA: 6303 - BRYANT SCHOOL <strong>DISTRICT</strong><br />
Indicator 13: Secondary Transition<br />
Percent of youth with disabilities aged 16 and<br />
up with an IEP that includes coordinated,<br />
measurable, annual IEP goals and transition<br />
services that will reasonably enable the student<br />
to meet the post-secondary goals.<br />
Indicator 14: Post-School Outcomes<br />
A. Percent of youth enrolled in higher<br />
education within one year of leaving high<br />
school.<br />
State<br />
Rate<br />
State<br />
Target<br />
Note: Data for this Indicator is from the on-site monitoring of LEAs for the given year.<br />
B. Percent of youth enrolled in higher<br />
education or competitively employed<br />
within one year of leaving high school.<br />
C. Percent of youth enrolled in higher<br />
education or in some other postsecondary<br />
education or training program; or<br />
competitively employed or in some other<br />
employment within one year of leaving<br />
high school.<br />
State<br />
Rate<br />
Indicator 20: Reported Data-Timely and Accurate*<br />
District submitted<br />
required data elements<br />
on or before due dates;<br />
made revisions within<br />
the alloted reveiw<br />
periods.<br />
Accurate and Timely<br />
Data Submission<br />
Overall (3-21)<br />
Early Childhood (3-5)<br />
School Age (5-21)<br />
State<br />
Target<br />
100.00%<br />
100.00%<br />
100.00%<br />
State<br />
Target<br />
LEA<br />
Rate<br />
LEA<br />
Rate<br />
Target Met by<br />
LEA (Y/N)<br />
Target Met<br />
by LEA<br />
(Y/N)<br />
Target Met<br />
by LEA<br />
(Y/N)<br />
*Data reviewed for timely and accurate submissions included all APSCN cycle data except for personnel<br />
Note: - - denotes not applicable<br />
96.19 100.00 — — N/A<br />
14.53<br />
State<br />
Rate<br />
49.42<br />
State<br />
Rate<br />
54.07<br />
13.00<br />
State<br />
Target<br />
49.00<br />
State<br />
Target<br />
60.00<br />
Y<br />
N/A<br />
Y<br />
— —<br />
LEA<br />
Rate<br />
— —<br />
LEA<br />
Rate<br />
— —<br />
N/A<br />
Target Met<br />
by LEA<br />
(Y/N)<br />
N/A<br />
Target Met<br />
by LEA<br />
(Y/N)<br />
N/A<br />
Page 5 of 5
<strong>ARKANSAS</strong> <strong>SPECIAL</strong> <strong>EDUCATION</strong><br />
<strong>DISTRICT</strong> <strong>ANNUAL</strong> PERFORMANCE REPORT<br />
2010/11 School Year<br />
Publication Date: March 2012<br />
Each State must have in place a State Performance Plan (SPP) to evaluate the State's efforts to meet the requirements and<br />
purposes of the implementation of the Individuals with Disabilities Education Act (IDEA). The SPP is a six-year plan, which<br />
describes Arkansas's performance on 20 indicators. The Office of Special Education Programs in the U. S. Department of<br />
Education requires that States report annually to the public on the performance of each local education agency (LEA) on 14 of<br />
20 indicators as compared with targets established by the State in the SPP. Arkansas will report indicators 1 through 14 and<br />
20 for each LEA serving children with disabilities (CWD). Any LEA not meeting targets on compliance indicators (0% for<br />
Indicators 4B, 09 & 10 and 100% for Indicators 11, 12, 13, and 20) are non-compliant with IDEA.<br />
There are no report changes for the 2010/11 school year profile; However, it is important to recognize that: .<br />
1. Indicator 01 (Graduation) is reported a year in arrear (2009/10 graduates) and is based on a four-year cohort. This<br />
means the rate is a measure of students who entered in ninth grade and graduate in four years. The calculation is a<br />
requirement under Title I of the Elementary and Secondary Education Act (ESEA).<br />
2. Indicator 02 (Drop out) is reported a year in arrear. This means the rate is a measure of students who dropped out in<br />
the 2009/10 school year. The Indicator 02 data are aligned with the Common Core of Data (CCD) requirements for<br />
grades 7-12.<br />
3. Indicator 04A and 4B (Suspension/Expulsion) is reported a year in arrear. This means the rate is a measure of<br />
students who had out-of-school suspensions and/or expulsions totaling more than 10 days.<br />
For a complete description of all the Indicators, please visit the special education website at<br />
http://arksped.k12.ar.us/sections/policy.html<br />
LEA: 6304 - HARMONY GROVE SCHOOL <strong>DISTRICT</strong><br />
Indicator 01: Graduation Rates (2009/10 school year) Indicator 02: Dropout Rates (2009/10 school year)<br />
Percent of youth<br />
with IEPs<br />
graduating from<br />
high school with a<br />
regular diploma<br />
State<br />
Rate<br />
State<br />
Target<br />
75.76% 85.00%<br />
LEA<br />
Rate<br />
62.50%<br />
Target Met<br />
by LEA<br />
(Y/N)<br />
N<br />
Percent of<br />
youth with<br />
IEPs dropping<br />
out of high<br />
school<br />
State<br />
Rate<br />
Indicator 03: Assessment on Statewide Benchmark Exam (grades 3-8, 11)<br />
A) Adequate Yearly Progress<br />
n=40<br />
Literacy<br />
Mathematics<br />
Met Disability Subgroup "n"<br />
for Reporting Purposes (Y/N)<br />
State Target for % of Districts Meeting<br />
AYP for Disability Subgroup<br />
State<br />
Target<br />
3.06% 4.20%<br />
LEA<br />
Rate<br />
6.45%<br />
% of Districts Meeting AYP<br />
for Disability Subgroup<br />
Target Met by<br />
LEA (Y/N)<br />
N<br />
Target Met by<br />
LEA(Y/N)<br />
Overall N 17.15% 6.25%<br />
NA<br />
N<br />
N<br />
Note: For a district to qualify as having a disability subgroup it must have a minimum of 40 (n=40) students with disabilities in a school building.<br />
B) Participation<br />
Participation Rate: # of<br />
CWD Tested ÷ # of CWD<br />
Enrolled in grades tested.<br />
Participation Rate: Literacy<br />
Participation Rate: Math<br />
Note: - - denotes not applicable<br />
State<br />
Rate<br />
98.78%<br />
State<br />
Target<br />
95.00%<br />
LEA<br />
Rate<br />
98.57%<br />
Target Met<br />
by LEA (Y/N)<br />
98.61% 95.00% 97.40% Y<br />
Y<br />
C) Performance Proficiency<br />
Percent of CWD Scoring<br />
Proficient or Above<br />
Proficiency Rate: Literacy<br />
Proficiency Rate:<br />
Mathematics<br />
16.00%<br />
16.00%<br />
State<br />
Rate<br />
31.49%<br />
44.86%<br />
State<br />
Target<br />
45.22%<br />
51.14%<br />
LEA<br />
Rate<br />
7.69%<br />
27.54%<br />
NA<br />
NA<br />
Target<br />
Met by<br />
LEA (Y/N)<br />
N<br />
N<br />
Page 1 of 5
LEA: 6304 - HARMONY GROVE SCHOOL <strong>DISTRICT</strong><br />
Indicator 04: Out-of-School Suspensions and Expulsions (2009/10 school year)<br />
A) Suspension/Expulsion<br />
Percent difference of CWD with out-of- school suspensions and<br />
expulsions totaling greater than 10 days in a school year as<br />
compared to the same data for general education students in<br />
the district.<br />
B) Suspension/Expulsion by Race and Ethnicity<br />
Percent of districts that have: (a) a significant discrepancy, by race or<br />
ethnicity, in the rate of suspensions and expulsions of greater than 10<br />
days in a school year for children with IEPs; and (b) policies,<br />
procedures or practices that contribute to the significant discrepancy<br />
and do not comply with requirements relating to the development<br />
and implementation of IEPs, the use of positive behavioral<br />
interventions and supports, and procedural safeguards.<br />
Indicator 05: School Age (5-21) Least Restrictive Environment<br />
A) In the Regular Class 80% or more of the day<br />
Percent of CWD with<br />
IEPs receiving instruction<br />
in the regular class 80%<br />
or more of the day.<br />
State<br />
Rate<br />
State<br />
Target<br />
LEA<br />
Rate<br />
B) In the Regular Class less than 40% of the day<br />
Percent of CWD with<br />
IEPs receiving instruction<br />
in the regular class less<br />
than 60% of the day.<br />
53.87% 59.77%<br />
State<br />
Rate<br />
State<br />
Target<br />
12.42% 12.51%<br />
50.72%<br />
LEA<br />
Rate<br />
3.62%<br />
C) Other Settings outside the regular class<br />
Percent of CWD with IEPs served in<br />
public or private separate schools,<br />
residential placements, or<br />
homebound/hospital placements.<br />
State<br />
Rate<br />
State<br />
Target<br />
2.80% 2.56%<br />
Target Met<br />
by LEA (Y/N)<br />
N<br />
Target Met<br />
by LEA (Y/N)<br />
Y<br />
LEA<br />
Rate<br />
9.42%<br />
Target Met<br />
by LEA(Y/N)<br />
Indicator 06: Early Childhood (3-5) Least Restrictive Environment<br />
A) Regular Early Childhood Program<br />
Percent of children (aged 3 through 5) with IEPs attending a regular<br />
early childhood program and receiving the majority of special<br />
education and related services in the regular early childhood program<br />
Allowable<br />
Difference<br />
LEA: 6304 - HARMONY GROVE SCHOOL <strong>DISTRICT</strong><br />
Indicator 07: Preschool (3-5) Outcomes<br />
a) Percent of preschool CWD<br />
children who did not<br />
improve functioning.<br />
b) Percent of preschool CWD<br />
who improved but whose<br />
functioning remained below<br />
same age peers.<br />
c) Percent of preschool CWD<br />
who improved at a level<br />
nearer to same aged peers.<br />
d) Percent of preschool CWD<br />
who improved functioning to<br />
reach a level comparable to<br />
same age peers.<br />
e) Percent of preschool CWD<br />
children who maintain<br />
functioning at a level<br />
comparable to same aged<br />
peers.<br />
Summary<br />
Statements<br />
1) Of those preschool<br />
children who entered<br />
the preschool program<br />
below age expectations<br />
in each Outcome, the<br />
percent who<br />
substantially increased<br />
their rate of growth by<br />
the time they turned 6<br />
years of age or exited<br />
the program.<br />
2) The percent of<br />
preschool children who<br />
were functioning<br />
within age expectations<br />
in each Outcome by the<br />
time they turned 6<br />
years of age or exited<br />
A) Positive Social -Emotional<br />
Skills*<br />
State<br />
Rate<br />
A) Positive Social -<br />
Emotional Skills<br />
(Including social<br />
relationships)<br />
State<br />
Rate<br />
2.14%<br />
5.31%<br />
25.97%<br />
38.22%<br />
28.36%<br />
State<br />
Target<br />
LEA<br />
Rate<br />
LEA<br />
Rate<br />
— —<br />
— —<br />
— —<br />
— —<br />
— —<br />
Target<br />
Met by<br />
LEA(Y/N)<br />
B) Acquisition and Use of<br />
Knowledge and Skills<br />
(Including early language/<br />
communication and early literacy)<br />
B) Acquisition and Use of<br />
Knowledge and Skills **<br />
State<br />
Rate<br />
1.75%<br />
6.59%<br />
34.23%<br />
43.51%<br />
13.92%<br />
State<br />
Target<br />
LEA<br />
Rate<br />
Target<br />
Met by<br />
LEA(Y/N)<br />
C) Use of Appropriate Behaviors<br />
to Meet Their Needs<br />
State<br />
Rate<br />
State<br />
Target<br />
LEA<br />
Rate<br />
Target<br />
Met by<br />
LEA(Y/N)<br />
89.61% 90.50% — — N/A 90.31% 90.50% — — N/A 90.82% 92.50% — — N/A<br />
66.58% 69.50% — — N/A 57.43% 60.50% — — N/A 76.69% 78.50% — — N/A<br />
NOTE: * Including social relationships ** Including early language/ communication and early literacy<br />
Note: - - denotes not applicable<br />
State<br />
Rate<br />
LEA<br />
Rate<br />
— —<br />
— —<br />
— —<br />
— —<br />
— —<br />
C) Use of<br />
Appropriate<br />
Behaviors to<br />
Meet Their Needs<br />
State<br />
Rate<br />
4.51%<br />
17.34%<br />
41.72%<br />
34.97%<br />
LEA<br />
Rate<br />
1.46% — —<br />
— —<br />
— —<br />
— —<br />
— —<br />
Page 3 of 5
LEA: 6304 - HARMONY GROVE SCHOOL <strong>DISTRICT</strong><br />
Indicator 08: Parent Involvement<br />
Percent of surveyed<br />
parents who reported<br />
school facilitated parent<br />
involvement as a means<br />
of improving services<br />
and results for children<br />
with disabilities.<br />
Early Childhood<br />
(3-5)<br />
School Age<br />
(5-21)<br />
State<br />
Rate<br />
90.47%<br />
95.05%<br />
Indicator 09: Disproportionality - Eligibility<br />
Disproportionate representation of racial<br />
and ethnic groups in special education and<br />
related services that is a result of<br />
inappropriate identification (e.g.<br />
monitoring data, review of policies,<br />
practices, and procedures under 618(d),<br />
etc.).<br />
State<br />
Rate<br />
State<br />
Target<br />
88.00%<br />
96.00%<br />
State<br />
Target<br />
0.00% 0.00%<br />
LEA<br />
Rate<br />
— —<br />
78.13%<br />
Indicator 10: Disproportionality-Child with a Disability<br />
Disproportionate representation of racial<br />
and ethnic groups in specific disability<br />
categories that is a result of inappropriate<br />
identification (e.g. monitoring data, review<br />
of policies, practices, and procedures under<br />
618(d), etc.).<br />
Indicator 11: Child Find<br />
Percent of children with<br />
parental consent to evaluate<br />
who are evaluated within<br />
the State established timeline<br />
of 60 days.<br />
Overall<br />
(3-21)<br />
Early Childhood<br />
(3-5)<br />
School Age<br />
(5-21)<br />
State<br />
Rate<br />
0.00%<br />
Indicator 12: Early Childhood Transition<br />
Percent of children referred by Part C prior to<br />
age 3, who are found eligible for Part B, and<br />
who have an IEP developed and implemented<br />
by their third birthday.<br />
Note: - - denotes not applicable<br />
State<br />
Rate<br />
99.41%<br />
99.70%<br />
98.97%<br />
State<br />
Rate<br />
State<br />
Target<br />
0.00%<br />
State<br />
Target<br />
100.00%<br />
100.00%<br />
100.00%<br />
State<br />
Target<br />
Target Met by<br />
LEA (Y/N)<br />
Y<br />
Target Met by<br />
LEA (Y/N)<br />
Y<br />
LEA<br />
Rate<br />
100.00%<br />
— —<br />
100.00%<br />
LEA<br />
Rate<br />
Target Met by<br />
LEA (Y/N)<br />
N/A<br />
N<br />
Note: The target for Indicator 09 is to have zero percent<br />
(0%) of districts identified as having disproportionate<br />
representation as a result of inappropriate<br />
identification in eligibility.<br />
Note: The target for Indicator 10 is to have zero<br />
percent (0%) of districts identified as having<br />
disproportionate representation as a result of<br />
inappropriate identification in a disability<br />
category.<br />
Target Met by<br />
LEA (Y/N)<br />
N/A<br />
Y<br />
Target Met<br />
by LEA<br />
(Y/N)<br />
99.21% 100.00% - - N/A<br />
Y<br />
Note: * Indicates a zero reponse rate for the<br />
district.<br />
Page 4 of 5
LEA: 6304 - HARMONY GROVE SCHOOL <strong>DISTRICT</strong><br />
Indicator 13: Secondary Transition<br />
Percent of youth with disabilities aged 16 and<br />
up with an IEP that includes coordinated,<br />
measurable, annual IEP goals and transition<br />
services that will reasonably enable the student<br />
to meet the post-secondary goals.<br />
Indicator 14: Post-School Outcomes<br />
A. Percent of youth enrolled in higher<br />
education within one year of leaving high<br />
school.<br />
State<br />
Rate<br />
State<br />
Target<br />
Note: Data for this Indicator is from the on-site monitoring of LEAs for the given year.<br />
B. Percent of youth enrolled in higher<br />
education or competitively employed<br />
within one year of leaving high school.<br />
C. Percent of youth enrolled in higher<br />
education or in some other postsecondary<br />
education or training program; or<br />
competitively employed or in some other<br />
employment within one year of leaving<br />
high school.<br />
State<br />
Rate<br />
Indicator 20: Reported Data-Timely and Accurate*<br />
District submitted<br />
required data elements<br />
on or before due dates;<br />
made revisions within<br />
the alloted reveiw<br />
periods.<br />
Accurate and Timely<br />
Data Submission<br />
Overall (3-21)<br />
Early Childhood (3-5)<br />
School Age (5-21)<br />
State<br />
Target<br />
100.00%<br />
100.00%<br />
100.00%<br />
State<br />
Target<br />
LEA<br />
Rate<br />
LEA<br />
Rate<br />
Target Met by<br />
LEA (Y/N)<br />
Target Met<br />
by LEA<br />
(Y/N)<br />
Target Met<br />
by LEA<br />
(Y/N)<br />
*Data reviewed for timely and accurate submissions included all APSCN cycle data except for personnel<br />
Note: - - denotes not applicable<br />
96.19 100.00 — — N/A<br />
14.53<br />
State<br />
Rate<br />
49.42<br />
State<br />
Rate<br />
54.07<br />
13.00<br />
State<br />
Target<br />
49.00<br />
State<br />
Target<br />
60.00<br />
Y<br />
N/A<br />
Y<br />
0.00%<br />
LEA<br />
Rate<br />
25.00%<br />
LEA<br />
Rate<br />
25.00%<br />
N<br />
Target Met<br />
by LEA<br />
(Y/N)<br />
N<br />
Target Met<br />
by LEA<br />
(Y/N)<br />
N<br />
Page 5 of 5
LEA: 6401 - WALDRON SCHOOL <strong>DISTRICT</strong><br />
<strong>ARKANSAS</strong> <strong>SPECIAL</strong> <strong>EDUCATION</strong><br />
<strong>DISTRICT</strong> <strong>ANNUAL</strong> PERFORMANCE REPORT<br />
2010/11 School Year<br />
Publication Date: March 2012<br />
Each State must have in place a State Performance Plan (SPP) to evaluate the State's efforts to meet the requirements and<br />
purposes of the implementation of the Individuals with Disabilities Education Act (IDEA). The SPP is a six-year plan, which<br />
describes Arkansas's performance on 20 indicators. The Office of Special Education Programs in the U. S. Department of<br />
Education requires that States report annually to the public on the performance of each local education agency (LEA) on 14 of<br />
20 indicators as compared with targets established by the State in the SPP. Arkansas will report indicators 1 through 14 and<br />
20 for each LEA serving children with disabilities (CWD). Any LEA not meeting targets on compliance indicators (0% for<br />
Indicators 4B, 09 & 10 and 100% for Indicators 11, 12, 13, and 20) are non-compliant with IDEA.<br />
There are no report changes for the 2010/11 school year profile; However, it is important to recognize that: .<br />
1. Indicator 01 (Graduation) is reported a year in arrear (2009/10 graduates) and is based on a four-year cohort. This<br />
means the rate is a measure of students who entered in ninth grade and graduate in four years. The calculation is a<br />
requirement under Title I of the Elementary and Secondary Education Act (ESEA).<br />
2. Indicator 02 (Drop out) is reported a year in arrear. This means the rate is a measure of students who dropped out in<br />
the 2009/10 school year. The Indicator 02 data are aligned with the Common Core of Data (CCD) requirements for<br />
grades 7-12.<br />
3. Indicator 04A and 4B (Suspension/Expulsion) is reported a year in arrear. This means the rate is a measure of<br />
students who had out-of-school suspensions and/or expulsions totaling more than 10 days.<br />
Percent of youth<br />
with IEPs<br />
graduating from<br />
high school with a<br />
regular diploma<br />
For a complete description of all the Indicators, please visit the special education website at<br />
http://arksped.k12.ar.us/sections/policy.html<br />
Indicator 01: Graduation Rates (2009/10 school year) Indicator 02: Dropout Rates (2009/10 school year)<br />
State<br />
Rate<br />
State<br />
Target<br />
75.76% 85.00%<br />
LEA<br />
Rate<br />
70.83%<br />
Target Met<br />
by LEA<br />
(Y/N)<br />
N<br />
Percent of<br />
youth with<br />
IEPs dropping<br />
out of high<br />
school<br />
State<br />
Rate<br />
Indicator 03: Assessment on Statewide Benchmark Exam (grades 3-8, 11)<br />
A) Adequate Yearly Progress<br />
n=40<br />
Literacy<br />
Mathematics<br />
Met Disability Subgroup "n"<br />
for Reporting Purposes (Y/N)<br />
State Target for % of Districts Meeting<br />
AYP for Disability Subgroup<br />
State<br />
Target<br />
3.06% 4.20%<br />
LEA<br />
Rate<br />
0.00%<br />
% of Districts Meeting AYP<br />
for Disability Subgroup<br />
Target Met by<br />
LEA (Y/N)<br />
Y<br />
Target Met by<br />
LEA(Y/N)<br />
Overall N 17.15% 6.25%<br />
NA<br />
N<br />
N<br />
Note: For a district to qualify as having a disability subgroup it must have a minimum of 40 (n=40) students with disabilities in a school building.<br />
B) Participation<br />
Participation Rate: # of<br />
CWD Tested ÷ # of CWD<br />
Enrolled in grades tested.<br />
Participation Rate: Literacy<br />
Participation Rate: Math<br />
Note: - - denotes not applicable<br />
State<br />
Rate<br />
98.78%<br />
State<br />
Target<br />
95.00%<br />
LEA<br />
Rate<br />
99.17%<br />
Target Met<br />
by LEA (Y/N)<br />
98.61% 95.00% 99.24% Y<br />
Y<br />
C) Performance Proficiency<br />
Percent of CWD Scoring<br />
Proficient or Above<br />
Proficiency Rate: Literacy<br />
Proficiency Rate:<br />
Mathematics<br />
16.00%<br />
16.00%<br />
State<br />
Rate<br />
31.49%<br />
44.86%<br />
State<br />
Target<br />
45.22%<br />
51.14%<br />
LEA<br />
Rate<br />
13.08%<br />
23.73%<br />
NA<br />
NA<br />
Target<br />
Met by<br />
LEA (Y/N)<br />
N<br />
N<br />
Page 1 of 5
LEA: 6401 - WALDRON SCHOOL <strong>DISTRICT</strong><br />
Indicator 04: Out-of-School Suspensions and Expulsions (2009/10 school year)<br />
A) Suspension/Expulsion<br />
Percent difference of CWD with out-of- school suspensions and<br />
expulsions totaling greater than 10 days in a school year as<br />
compared to the same data for general education students in<br />
the district.<br />
B) Suspension/Expulsion by Race and Ethnicity<br />
Percent of districts that have: (a) a significant discrepancy, by race or<br />
ethnicity, in the rate of suspensions and expulsions of greater than 10<br />
days in a school year for children with IEPs; and (b) policies,<br />
procedures or practices that contribute to the significant discrepancy<br />
and do not comply with requirements relating to the development<br />
and implementation of IEPs, the use of positive behavioral<br />
interventions and supports, and procedural safeguards.<br />
Indicator 05: School Age (5-21) Least Restrictive Environment<br />
A) In the Regular Class 80% or more of the day<br />
Percent of CWD with<br />
IEPs receiving instruction<br />
in the regular class 80%<br />
or more of the day.<br />
State<br />
Rate<br />
State<br />
Target<br />
LEA<br />
Rate<br />
B) In the Regular Class less than 40% of the day<br />
Percent of CWD with<br />
IEPs receiving instruction<br />
in the regular class less<br />
than 60% of the day.<br />
53.87% 59.77%<br />
State<br />
Rate<br />
State<br />
Target<br />
12.42% 12.51%<br />
73.26%<br />
LEA<br />
Rate<br />
1.60%<br />
C) Other Settings outside the regular class<br />
Percent of CWD with IEPs served in<br />
public or private separate schools,<br />
residential placements, or<br />
homebound/hospital placements.<br />
State<br />
Rate<br />
State<br />
Target<br />
2.80% 2.56%<br />
Target Met<br />
by LEA (Y/N)<br />
Y<br />
Target Met<br />
by LEA (Y/N)<br />
Y<br />
LEA<br />
Rate<br />
0.00%<br />
Target Met<br />
by LEA(Y/N)<br />
Indicator 06: Early Childhood (3-5) Least Restrictive Environment<br />
A) Regular Early Childhood Program<br />
Percent of children (aged 3 through 5) with IEPs attending a regular<br />
early childhood program and receiving the majority of special<br />
education and related services in the regular early childhood program<br />
Allowable<br />
Difference<br />
LEA: 6401 - WALDRON SCHOOL <strong>DISTRICT</strong><br />
Indicator 07: Preschool (3-5) Outcomes<br />
a) Percent of preschool CWD<br />
children who did not<br />
improve functioning.<br />
b) Percent of preschool CWD<br />
who improved but whose<br />
functioning remained below<br />
same age peers.<br />
c) Percent of preschool CWD<br />
who improved at a level<br />
nearer to same aged peers.<br />
d) Percent of preschool CWD<br />
who improved functioning to<br />
reach a level comparable to<br />
same age peers.<br />
e) Percent of preschool CWD<br />
children who maintain<br />
functioning at a level<br />
comparable to same aged<br />
peers.<br />
Summary<br />
Statements<br />
1) Of those preschool<br />
children who entered<br />
the preschool program<br />
below age expectations<br />
in each Outcome, the<br />
percent who<br />
substantially increased<br />
their rate of growth by<br />
the time they turned 6<br />
years of age or exited<br />
the program.<br />
2) The percent of<br />
preschool children who<br />
were functioning<br />
within age expectations<br />
in each Outcome by the<br />
time they turned 6<br />
years of age or exited<br />
A) Positive Social -Emotional<br />
Skills*<br />
State<br />
Rate<br />
A) Positive Social -<br />
Emotional Skills<br />
(Including social<br />
relationships)<br />
State<br />
Rate<br />
2.14%<br />
5.31%<br />
25.97%<br />
38.22%<br />
28.36%<br />
State<br />
Target<br />
LEA<br />
Rate<br />
LEA<br />
Rate<br />
— —<br />
— —<br />
— —<br />
— —<br />
— —<br />
Target<br />
Met by<br />
LEA(Y/N)<br />
B) Acquisition and Use of<br />
Knowledge and Skills<br />
(Including early language/<br />
communication and early literacy)<br />
B) Acquisition and Use of<br />
Knowledge and Skills **<br />
State<br />
Rate<br />
1.75%<br />
6.59%<br />
34.23%<br />
43.51%<br />
13.92%<br />
State<br />
Target<br />
LEA<br />
Rate<br />
Target<br />
Met by<br />
LEA(Y/N)<br />
C) Use of Appropriate Behaviors<br />
to Meet Their Needs<br />
State<br />
Rate<br />
State<br />
Target<br />
LEA<br />
Rate<br />
Target<br />
Met by<br />
LEA(Y/N)<br />
89.61% 90.50% — — N/A 90.31% 90.50% — — N/A 90.82% 92.50% — — N/A<br />
66.58% 69.50% — — N/A 57.43% 60.50% — — N/A 76.69% 78.50% — — N/A<br />
NOTE: * Including social relationships ** Including early language/ communication and early literacy<br />
Note: - - denotes not applicable<br />
State<br />
Rate<br />
LEA<br />
Rate<br />
— —<br />
— —<br />
— —<br />
— —<br />
— —<br />
C) Use of<br />
Appropriate<br />
Behaviors to<br />
Meet Their Needs<br />
State<br />
Rate<br />
4.51%<br />
17.34%<br />
41.72%<br />
34.97%<br />
LEA<br />
Rate<br />
1.46% — —<br />
— —<br />
— —<br />
— —<br />
— —<br />
Page 3 of 5
LEA: 6401 - WALDRON SCHOOL <strong>DISTRICT</strong><br />
Indicator 08: Parent Involvement<br />
Percent of surveyed<br />
parents who reported<br />
school facilitated parent<br />
involvement as a means<br />
of improving services<br />
and results for children<br />
with disabilities.<br />
Early Childhood<br />
(3-5)<br />
School Age<br />
(5-21)<br />
State<br />
Rate<br />
90.47%<br />
95.05%<br />
Indicator 09: Disproportionality - Eligibility<br />
Disproportionate representation of racial<br />
and ethnic groups in special education and<br />
related services that is a result of<br />
inappropriate identification (e.g.<br />
monitoring data, review of policies,<br />
practices, and procedures under 618(d),<br />
etc.).<br />
State<br />
Rate<br />
State<br />
Target<br />
88.00%<br />
96.00%<br />
State<br />
Target<br />
0.00% 0.00%<br />
LEA<br />
Rate<br />
— —<br />
94.96%<br />
Indicator 10: Disproportionality-Child with a Disability<br />
Disproportionate representation of racial<br />
and ethnic groups in specific disability<br />
categories that is a result of inappropriate<br />
identification (e.g. monitoring data, review<br />
of policies, practices, and procedures under<br />
618(d), etc.).<br />
Indicator 11: Child Find<br />
Percent of children with<br />
parental consent to evaluate<br />
who are evaluated within<br />
the State established timeline<br />
of 60 days.<br />
Overall<br />
(3-21)<br />
Early Childhood<br />
(3-5)<br />
School Age<br />
(5-21)<br />
State<br />
Rate<br />
0.00%<br />
Indicator 12: Early Childhood Transition<br />
Percent of children referred by Part C prior to<br />
age 3, who are found eligible for Part B, and<br />
who have an IEP developed and implemented<br />
by their third birthday.<br />
Note: - - denotes not applicable<br />
State<br />
Rate<br />
99.41%<br />
99.70%<br />
98.97%<br />
State<br />
Rate<br />
State<br />
Target<br />
0.00%<br />
State<br />
Target<br />
100.00%<br />
100.00%<br />
100.00%<br />
State<br />
Target<br />
Target Met by<br />
LEA (Y/N)<br />
Y<br />
Target Met by<br />
LEA (Y/N)<br />
Y<br />
LEA<br />
Rate<br />
100.00%<br />
— —<br />
100.00%<br />
LEA<br />
Rate<br />
Target Met by<br />
LEA (Y/N)<br />
N/A<br />
N<br />
Note: The target for Indicator 09 is to have zero percent<br />
(0%) of districts identified as having disproportionate<br />
representation as a result of inappropriate<br />
identification in eligibility.<br />
Note: The target for Indicator 10 is to have zero<br />
percent (0%) of districts identified as having<br />
disproportionate representation as a result of<br />
inappropriate identification in a disability<br />
category.<br />
Target Met by<br />
LEA (Y/N)<br />
N/A<br />
Y<br />
Target Met<br />
by LEA<br />
(Y/N)<br />
99.21% 100.00% - - N/A<br />
Y<br />
Note: * Indicates a zero reponse rate for the<br />
district.<br />
Page 4 of 5
LEA: 6401 - WALDRON SCHOOL <strong>DISTRICT</strong><br />
Indicator 13: Secondary Transition<br />
Percent of youth with disabilities aged 16 and<br />
up with an IEP that includes coordinated,<br />
measurable, annual IEP goals and transition<br />
services that will reasonably enable the student<br />
to meet the post-secondary goals.<br />
Indicator 14: Post-School Outcomes<br />
A. Percent of youth enrolled in higher<br />
education within one year of leaving high<br />
school.<br />
State<br />
Rate<br />
State<br />
Target<br />
Note: Data for this Indicator is from the on-site monitoring of LEAs for the given year.<br />
B. Percent of youth enrolled in higher<br />
education or competitively employed<br />
within one year of leaving high school.<br />
C. Percent of youth enrolled in higher<br />
education or in some other postsecondary<br />
education or training program; or<br />
competitively employed or in some other<br />
employment within one year of leaving<br />
high school.<br />
State<br />
Rate<br />
Indicator 20: Reported Data-Timely and Accurate*<br />
District submitted<br />
required data elements<br />
on or before due dates;<br />
made revisions within<br />
the alloted reveiw<br />
periods.<br />
Accurate and Timely<br />
Data Submission<br />
Overall (3-21)<br />
Early Childhood (3-5)<br />
School Age (5-21)<br />
State<br />
Target<br />
100.00%<br />
100.00%<br />
100.00%<br />
State<br />
Target<br />
LEA<br />
Rate<br />
LEA<br />
Rate<br />
Target Met by<br />
LEA (Y/N)<br />
Target Met<br />
by LEA<br />
(Y/N)<br />
Target Met<br />
by LEA<br />
(Y/N)<br />
*Data reviewed for timely and accurate submissions included all APSCN cycle data except for personnel<br />
Note: - - denotes not applicable<br />
96.19 100.00 — — N/A<br />
14.53<br />
State<br />
Rate<br />
49.42<br />
State<br />
Rate<br />
54.07<br />
13.00<br />
State<br />
Target<br />
49.00<br />
State<br />
Target<br />
60.00<br />
Y<br />
N/A<br />
Y<br />
— —<br />
LEA<br />
Rate<br />
— —<br />
LEA<br />
Rate<br />
— —<br />
N/A<br />
Target Met<br />
by LEA<br />
(Y/N)<br />
N/A<br />
Target Met<br />
by LEA<br />
(Y/N)<br />
N/A<br />
Page 5 of 5
<strong>ARKANSAS</strong> <strong>SPECIAL</strong> <strong>EDUCATION</strong><br />
<strong>DISTRICT</strong> <strong>ANNUAL</strong> PERFORMANCE REPORT<br />
2010/11 School Year<br />
Publication Date: March 2012<br />
Each State must have in place a State Performance Plan (SPP) to evaluate the State's efforts to meet the requirements and<br />
purposes of the implementation of the Individuals with Disabilities Education Act (IDEA). The SPP is a six-year plan, which<br />
describes Arkansas's performance on 20 indicators. The Office of Special Education Programs in the U. S. Department of<br />
Education requires that States report annually to the public on the performance of each local education agency (LEA) on 14 of<br />
20 indicators as compared with targets established by the State in the SPP. Arkansas will report indicators 1 through 14 and<br />
20 for each LEA serving children with disabilities (CWD). Any LEA not meeting targets on compliance indicators (0% for<br />
Indicators 4B, 09 & 10 and 100% for Indicators 11, 12, 13, and 20) are non-compliant with IDEA.<br />
There are no report changes for the 2010/11 school year profile; However, it is important to recognize that: .<br />
1. Indicator 01 (Graduation) is reported a year in arrear (2009/10 graduates) and is based on a four-year cohort. This<br />
means the rate is a measure of students who entered in ninth grade and graduate in four years. The calculation is a<br />
requirement under Title I of the Elementary and Secondary Education Act (ESEA).<br />
2. Indicator 02 (Drop out) is reported a year in arrear. This means the rate is a measure of students who dropped out in<br />
the 2009/10 school year. The Indicator 02 data are aligned with the Common Core of Data (CCD) requirements for<br />
grades 7-12.<br />
3. Indicator 04A and 4B (Suspension/Expulsion) is reported a year in arrear. This means the rate is a measure of<br />
students who had out-of-school suspensions and/or expulsions totaling more than 10 days.<br />
For a complete description of all the Indicators, please visit the special education website at<br />
http://arksped.k12.ar.us/sections/policy.html<br />
LEA: 6502 - SEARCY COUNTY SCHOOL <strong>DISTRICT</strong><br />
Indicator 01: Graduation Rates (2009/10 school year) Indicator 02: Dropout Rates (2009/10 school year)<br />
Percent of youth<br />
with IEPs<br />
graduating from<br />
high school with a<br />
regular diploma<br />
State<br />
Rate<br />
State<br />
Target<br />
75.76% 85.00%<br />
LEA<br />
Rate<br />
76.92%<br />
Target Met<br />
by LEA<br />
(Y/N)<br />
N<br />
Percent of<br />
youth with<br />
IEPs dropping<br />
out of high<br />
school<br />
State<br />
Rate<br />
Indicator 03: Assessment on Statewide Benchmark Exam (grades 3-8, 11)<br />
A) Adequate Yearly Progress<br />
n=40<br />
Literacy<br />
Mathematics<br />
Met Disability Subgroup "n"<br />
for Reporting Purposes (Y/N)<br />
State Target for % of Districts Meeting<br />
AYP for Disability Subgroup<br />
State<br />
Target<br />
3.06% 4.20%<br />
LEA<br />
Rate<br />
0.00%<br />
% of Districts Meeting AYP<br />
for Disability Subgroup<br />
Target Met by<br />
LEA (Y/N)<br />
Y<br />
Target Met by<br />
LEA(Y/N)<br />
Overall N 17.15% 6.25%<br />
NA<br />
N<br />
N<br />
Note: For a district to qualify as having a disability subgroup it must have a minimum of 40 (n=40) students with disabilities in a school building.<br />
B) Participation<br />
Participation Rate: # of<br />
CWD Tested ÷ # of CWD<br />
Enrolled in grades tested.<br />
Participation Rate: Literacy<br />
Participation Rate: Math<br />
Note: - - denotes not applicable<br />
State<br />
Rate<br />
98.78%<br />
State<br />
Target<br />
95.00%<br />
LEA<br />
Rate<br />
100.00%<br />
Target Met<br />
by LEA (Y/N)<br />
98.61% 95.00% 97.92% Y<br />
Y<br />
C) Performance Proficiency<br />
Percent of CWD Scoring<br />
Proficient or Above<br />
Proficiency Rate: Literacy<br />
Proficiency Rate:<br />
Mathematics<br />
16.00%<br />
16.00%<br />
State<br />
Rate<br />
31.49%<br />
44.86%<br />
State<br />
Target<br />
45.22%<br />
51.14%<br />
LEA<br />
Rate<br />
28.89%<br />
66.67%<br />
NA<br />
NA<br />
Target<br />
Met by<br />
LEA (Y/N)<br />
N<br />
Y<br />
Page 1 of 5
LEA: 6502 - SEARCY COUNTY SCHOOL <strong>DISTRICT</strong><br />
Indicator 04: Out-of-School Suspensions and Expulsions (2009/10 school year)<br />
A) Suspension/Expulsion<br />
Percent difference of CWD with out-of- school suspensions and<br />
expulsions totaling greater than 10 days in a school year as<br />
compared to the same data for general education students in<br />
the district.<br />
B) Suspension/Expulsion by Race and Ethnicity<br />
Percent of districts that have: (a) a significant discrepancy, by race or<br />
ethnicity, in the rate of suspensions and expulsions of greater than 10<br />
days in a school year for children with IEPs; and (b) policies,<br />
procedures or practices that contribute to the significant discrepancy<br />
and do not comply with requirements relating to the development<br />
and implementation of IEPs, the use of positive behavioral<br />
interventions and supports, and procedural safeguards.<br />
Indicator 05: School Age (5-21) Least Restrictive Environment<br />
A) In the Regular Class 80% or more of the day<br />
Percent of CWD with<br />
IEPs receiving instruction<br />
in the regular class 80%<br />
or more of the day.<br />
State<br />
Rate<br />
State<br />
Target<br />
LEA<br />
Rate<br />
B) In the Regular Class less than 40% of the day<br />
Percent of CWD with<br />
IEPs receiving instruction<br />
in the regular class less<br />
than 60% of the day.<br />
53.87% 59.77%<br />
State<br />
Rate<br />
State<br />
Target<br />
12.42% 12.51%<br />
81.48%<br />
LEA<br />
Rate<br />
0.00%<br />
C) Other Settings outside the regular class<br />
Percent of CWD with IEPs served in<br />
public or private separate schools,<br />
residential placements, or<br />
homebound/hospital placements.<br />
State<br />
Rate<br />
State<br />
Target<br />
2.80% 2.56%<br />
Target Met<br />
by LEA (Y/N)<br />
Y<br />
Target Met<br />
by LEA (Y/N)<br />
Y<br />
LEA<br />
Rate<br />
0.93%<br />
Target Met<br />
by LEA(Y/N)<br />
Indicator 06: Early Childhood (3-5) Least Restrictive Environment<br />
A) Regular Early Childhood Program<br />
Percent of children (aged 3 through 5) with IEPs attending a regular<br />
early childhood program and receiving the majority of special<br />
education and related services in the regular early childhood program<br />
Allowable<br />
Difference<br />
LEA: 6502 - SEARCY COUNTY SCHOOL <strong>DISTRICT</strong><br />
Indicator 07: Preschool (3-5) Outcomes<br />
a) Percent of preschool CWD<br />
children who did not<br />
improve functioning.<br />
b) Percent of preschool CWD<br />
who improved but whose<br />
functioning remained below<br />
same age peers.<br />
c) Percent of preschool CWD<br />
who improved at a level<br />
nearer to same aged peers.<br />
d) Percent of preschool CWD<br />
who improved functioning to<br />
reach a level comparable to<br />
same age peers.<br />
e) Percent of preschool CWD<br />
children who maintain<br />
functioning at a level<br />
comparable to same aged<br />
peers.<br />
Summary<br />
Statements<br />
1) Of those preschool<br />
children who entered<br />
the preschool program<br />
below age expectations<br />
in each Outcome, the<br />
percent who<br />
substantially increased<br />
their rate of growth by<br />
the time they turned 6<br />
years of age or exited<br />
the program.<br />
2) The percent of<br />
preschool children who<br />
were functioning<br />
within age expectations<br />
in each Outcome by the<br />
time they turned 6<br />
years of age or exited<br />
A) Positive Social -Emotional<br />
Skills*<br />
State<br />
Rate<br />
A) Positive Social -<br />
Emotional Skills<br />
(Including social<br />
relationships)<br />
State<br />
Rate<br />
2.14%<br />
5.31%<br />
25.97%<br />
38.22%<br />
28.36%<br />
State<br />
Target<br />
LEA<br />
Rate<br />
LEA<br />
Rate<br />
12.50%<br />
— —<br />
12.50%<br />
50.00%<br />
25.00%<br />
Target<br />
Met by<br />
LEA(Y/N)<br />
B) Acquisition and Use of<br />
Knowledge and Skills<br />
(Including early language/<br />
communication and early literacy)<br />
B) Acquisition and Use of<br />
Knowledge and Skills **<br />
State<br />
Rate<br />
1.75%<br />
6.59%<br />
34.23%<br />
43.51%<br />
13.92%<br />
State<br />
Target<br />
LEA<br />
Rate<br />
12.50%<br />
Target<br />
Met by<br />
LEA(Y/N)<br />
C) Use of Appropriate Behaviors<br />
to Meet Their Needs<br />
State<br />
Rate<br />
State<br />
Target<br />
LEA<br />
Rate<br />
Target<br />
Met by<br />
LEA(Y/N)<br />
89.61% 90.50% 83.33% N 90.31% 90.50% 80.00% N 90.82% 92.50% 83.33% N<br />
66.58% 69.50% 75.00% Y 57.43% 60.50% 62.50% Y 76.69% 78.50% 87.50% Y<br />
NOTE: * Including social relationships ** Including early language/ communication and early literacy<br />
Note: - - denotes not applicable<br />
State<br />
Rate<br />
LEA<br />
Rate<br />
— —<br />
25.00%<br />
25.00%<br />
37.50%<br />
C) Use of<br />
Appropriate<br />
Behaviors to<br />
Meet Their Needs<br />
State<br />
Rate<br />
4.51%<br />
17.34%<br />
41.72%<br />
34.97%<br />
LEA<br />
Rate<br />
1.46% 12.50%<br />
— —<br />
— —<br />
62.50%<br />
25.00%<br />
Page 3 of 5
LEA: 6502 - SEARCY COUNTY SCHOOL <strong>DISTRICT</strong><br />
Indicator 08: Parent Involvement<br />
Percent of surveyed<br />
parents who reported<br />
school facilitated parent<br />
involvement as a means<br />
of improving services<br />
and results for children<br />
with disabilities.<br />
Early Childhood<br />
(3-5)<br />
School Age<br />
(5-21)<br />
State<br />
Rate<br />
90.47%<br />
95.05%<br />
Indicator 09: Disproportionality - Eligibility<br />
Disproportionate representation of racial<br />
and ethnic groups in special education and<br />
related services that is a result of<br />
inappropriate identification (e.g.<br />
monitoring data, review of policies,<br />
practices, and procedures under 618(d),<br />
etc.).<br />
State<br />
Rate<br />
State<br />
Target<br />
88.00%<br />
96.00%<br />
State<br />
Target<br />
0.00% 0.00%<br />
LEA<br />
Rate<br />
100.00%<br />
96.46%<br />
Indicator 10: Disproportionality-Child with a Disability<br />
Disproportionate representation of racial<br />
and ethnic groups in specific disability<br />
categories that is a result of inappropriate<br />
identification (e.g. monitoring data, review<br />
of policies, practices, and procedures under<br />
618(d), etc.).<br />
Indicator 11: Child Find<br />
Percent of children with<br />
parental consent to evaluate<br />
who are evaluated within<br />
the State established timeline<br />
of 60 days.<br />
Overall<br />
(3-21)<br />
Early Childhood<br />
(3-5)<br />
School Age<br />
(5-21)<br />
State<br />
Rate<br />
0.00%<br />
Indicator 12: Early Childhood Transition<br />
Percent of children referred by Part C prior to<br />
age 3, who are found eligible for Part B, and<br />
who have an IEP developed and implemented<br />
by their third birthday.<br />
Note: - - denotes not applicable<br />
State<br />
Rate<br />
99.41%<br />
99.70%<br />
98.97%<br />
State<br />
Rate<br />
State<br />
Target<br />
0.00%<br />
State<br />
Target<br />
100.00%<br />
100.00%<br />
100.00%<br />
State<br />
Target<br />
Target Met by<br />
LEA (Y/N)<br />
Y<br />
Target Met by<br />
LEA (Y/N)<br />
Y<br />
LEA<br />
Rate<br />
100.00%<br />
100.00%<br />
100.00%<br />
LEA<br />
Rate<br />
Target Met by<br />
LEA (Y/N)<br />
Y<br />
Y<br />
Note: The target for Indicator 09 is to have zero percent<br />
(0%) of districts identified as having disproportionate<br />
representation as a result of inappropriate<br />
identification in eligibility.<br />
Note: The target for Indicator 10 is to have zero<br />
percent (0%) of districts identified as having<br />
disproportionate representation as a result of<br />
inappropriate identification in a disability<br />
category.<br />
Target Met by<br />
LEA (Y/N)<br />
Y<br />
Y<br />
Target Met<br />
by LEA<br />
(Y/N)<br />
99.21% 100.00% - - N/A<br />
Y<br />
Note: * Indicates a zero reponse rate for the<br />
district.<br />
Page 4 of 5
LEA: 6502 - SEARCY COUNTY SCHOOL <strong>DISTRICT</strong><br />
Indicator 13: Secondary Transition<br />
Percent of youth with disabilities aged 16 and<br />
up with an IEP that includes coordinated,<br />
measurable, annual IEP goals and transition<br />
services that will reasonably enable the student<br />
to meet the post-secondary goals.<br />
Indicator 14: Post-School Outcomes<br />
A. Percent of youth enrolled in higher<br />
education within one year of leaving high<br />
school.<br />
State<br />
Rate<br />
State<br />
Target<br />
Note: Data for this Indicator is from the on-site monitoring of LEAs for the given year.<br />
B. Percent of youth enrolled in higher<br />
education or competitively employed<br />
within one year of leaving high school.<br />
C. Percent of youth enrolled in higher<br />
education or in some other postsecondary<br />
education or training program; or<br />
competitively employed or in some other<br />
employment within one year of leaving<br />
high school.<br />
State<br />
Rate<br />
Indicator 20: Reported Data-Timely and Accurate*<br />
District submitted<br />
required data elements<br />
on or before due dates;<br />
made revisions within<br />
the alloted reveiw<br />
periods.<br />
Accurate and Timely<br />
Data Submission<br />
Overall (3-21)<br />
Early Childhood (3-5)<br />
School Age (5-21)<br />
State<br />
Target<br />
100.00%<br />
100.00%<br />
100.00%<br />
State<br />
Target<br />
LEA<br />
Rate<br />
LEA<br />
Rate<br />
Target Met by<br />
LEA (Y/N)<br />
Target Met<br />
by LEA<br />
(Y/N)<br />
Target Met<br />
by LEA<br />
(Y/N)<br />
*Data reviewed for timely and accurate submissions included all APSCN cycle data except for personnel<br />
Note: - - denotes not applicable<br />
96.19 100.00 — — N/A<br />
14.53<br />
State<br />
Rate<br />
49.42<br />
State<br />
Rate<br />
54.07<br />
13.00<br />
State<br />
Target<br />
49.00<br />
State<br />
Target<br />
60.00<br />
Y<br />
Y<br />
Y<br />
— —<br />
LEA<br />
Rate<br />
— —<br />
LEA<br />
Rate<br />
— —<br />
N/A<br />
Target Met<br />
by LEA<br />
(Y/N)<br />
N/A<br />
Target Met<br />
by LEA<br />
(Y/N)<br />
N/A<br />
Page 5 of 5
<strong>ARKANSAS</strong> <strong>SPECIAL</strong> <strong>EDUCATION</strong><br />
<strong>DISTRICT</strong> <strong>ANNUAL</strong> PERFORMANCE REPORT<br />
2010/11 School Year<br />
Publication Date: March 2012<br />
Each State must have in place a State Performance Plan (SPP) to evaluate the State's efforts to meet the requirements and<br />
purposes of the implementation of the Individuals with Disabilities Education Act (IDEA). The SPP is a six-year plan, which<br />
describes Arkansas's performance on 20 indicators. The Office of Special Education Programs in the U. S. Department of<br />
Education requires that States report annually to the public on the performance of each local education agency (LEA) on 14 of<br />
20 indicators as compared with targets established by the State in the SPP. Arkansas will report indicators 1 through 14 and<br />
20 for each LEA serving children with disabilities (CWD). Any LEA not meeting targets on compliance indicators (0% for<br />
Indicators 4B, 09 & 10 and 100% for Indicators 11, 12, 13, and 20) are non-compliant with IDEA.<br />
There are no report changes for the 2010/11 school year profile; However, it is important to recognize that: .<br />
1. Indicator 01 (Graduation) is reported a year in arrear (2009/10 graduates) and is based on a four-year cohort. This<br />
means the rate is a measure of students who entered in ninth grade and graduate in four years. The calculation is a<br />
requirement under Title I of the Elementary and Secondary Education Act (ESEA).<br />
2. Indicator 02 (Drop out) is reported a year in arrear. This means the rate is a measure of students who dropped out in<br />
the 2009/10 school year. The Indicator 02 data are aligned with the Common Core of Data (CCD) requirements for<br />
grades 7-12.<br />
3. Indicator 04A and 4B (Suspension/Expulsion) is reported a year in arrear. This means the rate is a measure of<br />
students who had out-of-school suspensions and/or expulsions totaling more than 10 days.<br />
For a complete description of all the Indicators, please visit the special education website at<br />
http://arksped.k12.ar.us/sections/policy.html<br />
LEA: 6505 - OZARK MOUNTAIN SCHOOL <strong>DISTRICT</strong><br />
Indicator 01: Graduation Rates (2009/10 school year) Indicator 02: Dropout Rates (2009/10 school year)<br />
Percent of youth<br />
with IEPs<br />
graduating from<br />
high school with a<br />
regular diploma<br />
State<br />
Rate<br />
State<br />
Target<br />
75.76% 85.00%<br />
LEA<br />
Rate<br />
84.21%<br />
Target Met<br />
by LEA<br />
(Y/N)<br />
N<br />
Percent of<br />
youth with<br />
IEPs dropping<br />
out of high<br />
school<br />
State<br />
Rate<br />
Indicator 03: Assessment on Statewide Benchmark Exam (grades 3-8, 11)<br />
A) Adequate Yearly Progress<br />
n=40<br />
Literacy<br />
Mathematics<br />
Met Disability Subgroup "n"<br />
for Reporting Purposes (Y/N)<br />
State Target for % of Districts Meeting<br />
AYP for Disability Subgroup<br />
State<br />
Target<br />
3.06% 4.20%<br />
LEA<br />
Rate<br />
0.00%<br />
% of Districts Meeting AYP<br />
for Disability Subgroup<br />
Target Met by<br />
LEA (Y/N)<br />
Y<br />
Target Met by<br />
LEA(Y/N)<br />
Overall N 17.15% 6.25%<br />
NA<br />
N<br />
N<br />
Note: For a district to qualify as having a disability subgroup it must have a minimum of 40 (n=40) students with disabilities in a school building.<br />
B) Participation<br />
Participation Rate: # of<br />
CWD Tested ÷ # of CWD<br />
Enrolled in grades tested.<br />
Participation Rate: Literacy<br />
Participation Rate: Math<br />
Note: - - denotes not applicable<br />
State<br />
Rate<br />
98.78%<br />
State<br />
Target<br />
95.00%<br />
LEA<br />
Rate<br />
100.00%<br />
Target Met<br />
by LEA (Y/N)<br />
98.61% 95.00% 100.00% Y<br />
Y<br />
C) Performance Proficiency<br />
Percent of CWD Scoring<br />
Proficient or Above<br />
Proficiency Rate: Literacy<br />
Proficiency Rate:<br />
Mathematics<br />
16.00%<br />
16.00%<br />
State<br />
Rate<br />
31.49%<br />
44.86%<br />
State<br />
Target<br />
45.22%<br />
51.14%<br />
LEA<br />
Rate<br />
26.47%<br />
35.38%<br />
NA<br />
NA<br />
Target<br />
Met by<br />
LEA (Y/N)<br />
N<br />
N<br />
Page 1 of 5
LEA: 6505 - OZARK MOUNTAIN SCHOOL <strong>DISTRICT</strong><br />
Indicator 04: Out-of-School Suspensions and Expulsions (2009/10 school year)<br />
A) Suspension/Expulsion<br />
Percent difference of CWD with out-of- school suspensions and<br />
expulsions totaling greater than 10 days in a school year as<br />
compared to the same data for general education students in<br />
the district.<br />
B) Suspension/Expulsion by Race and Ethnicity<br />
Percent of districts that have: (a) a significant discrepancy, by race or<br />
ethnicity, in the rate of suspensions and expulsions of greater than 10<br />
days in a school year for children with IEPs; and (b) policies,<br />
procedures or practices that contribute to the significant discrepancy<br />
and do not comply with requirements relating to the development<br />
and implementation of IEPs, the use of positive behavioral<br />
interventions and supports, and procedural safeguards.<br />
Indicator 05: School Age (5-21) Least Restrictive Environment<br />
A) In the Regular Class 80% or more of the day<br />
Percent of CWD with<br />
IEPs receiving instruction<br />
in the regular class 80%<br />
or more of the day.<br />
State<br />
Rate<br />
State<br />
Target<br />
LEA<br />
Rate<br />
B) In the Regular Class less than 40% of the day<br />
Percent of CWD with<br />
IEPs receiving instruction<br />
in the regular class less<br />
than 60% of the day.<br />
53.87% 59.77%<br />
State<br />
Rate<br />
State<br />
Target<br />
12.42% 12.51%<br />
54.37%<br />
LEA<br />
Rate<br />
3.88%<br />
C) Other Settings outside the regular class<br />
Percent of CWD with IEPs served in<br />
public or private separate schools,<br />
residential placements, or<br />
homebound/hospital placements.<br />
State<br />
Rate<br />
State<br />
Target<br />
2.80% 2.56%<br />
Target Met<br />
by LEA (Y/N)<br />
N<br />
Target Met<br />
by LEA (Y/N)<br />
Y<br />
LEA<br />
Rate<br />
0.00%<br />
Target Met<br />
by LEA(Y/N)<br />
Indicator 06: Early Childhood (3-5) Least Restrictive Environment<br />
A) Regular Early Childhood Program<br />
Percent of children (aged 3 through 5) with IEPs attending a regular<br />
early childhood program and receiving the majority of special<br />
education and related services in the regular early childhood program<br />
Allowable<br />
Difference<br />
LEA: 6505 - OZARK MOUNTAIN SCHOOL <strong>DISTRICT</strong><br />
Indicator 07: Preschool (3-5) Outcomes<br />
a) Percent of preschool CWD<br />
children who did not<br />
improve functioning.<br />
b) Percent of preschool CWD<br />
who improved but whose<br />
functioning remained below<br />
same age peers.<br />
c) Percent of preschool CWD<br />
who improved at a level<br />
nearer to same aged peers.<br />
d) Percent of preschool CWD<br />
who improved functioning to<br />
reach a level comparable to<br />
same age peers.<br />
e) Percent of preschool CWD<br />
children who maintain<br />
functioning at a level<br />
comparable to same aged<br />
peers.<br />
Summary<br />
Statements<br />
1) Of those preschool<br />
children who entered<br />
the preschool program<br />
below age expectations<br />
in each Outcome, the<br />
percent who<br />
substantially increased<br />
their rate of growth by<br />
the time they turned 6<br />
years of age or exited<br />
the program.<br />
2) The percent of<br />
preschool children who<br />
were functioning<br />
within age expectations<br />
in each Outcome by the<br />
time they turned 6<br />
years of age or exited<br />
A) Positive Social -Emotional<br />
Skills*<br />
State<br />
Rate<br />
A) Positive Social -<br />
Emotional Skills<br />
(Including social<br />
relationships)<br />
State<br />
Rate<br />
2.14%<br />
5.31%<br />
25.97%<br />
38.22%<br />
28.36%<br />
State<br />
Target<br />
LEA<br />
Rate<br />
LEA<br />
Rate<br />
— —<br />
— —<br />
— —<br />
— —<br />
— —<br />
Target<br />
Met by<br />
LEA(Y/N)<br />
B) Acquisition and Use of<br />
Knowledge and Skills<br />
(Including early language/<br />
communication and early literacy)<br />
B) Acquisition and Use of<br />
Knowledge and Skills **<br />
State<br />
Rate<br />
1.75%<br />
6.59%<br />
34.23%<br />
43.51%<br />
13.92%<br />
State<br />
Target<br />
LEA<br />
Rate<br />
Target<br />
Met by<br />
LEA(Y/N)<br />
C) Use of Appropriate Behaviors<br />
to Meet Their Needs<br />
State<br />
Rate<br />
State<br />
Target<br />
LEA<br />
Rate<br />
Target<br />
Met by<br />
LEA(Y/N)<br />
89.61% 90.50% — — N/A 90.31% 90.50% — — N/A 90.82% 92.50% — — N/A<br />
66.58% 69.50% — — N/A 57.43% 60.50% — — N/A 76.69% 78.50% — — N/A<br />
NOTE: * Including social relationships ** Including early language/ communication and early literacy<br />
Note: - - denotes not applicable<br />
State<br />
Rate<br />
LEA<br />
Rate<br />
— —<br />
— —<br />
— —<br />
— —<br />
— —<br />
C) Use of<br />
Appropriate<br />
Behaviors to<br />
Meet Their Needs<br />
State<br />
Rate<br />
4.51%<br />
17.34%<br />
41.72%<br />
34.97%<br />
LEA<br />
Rate<br />
1.46% — —<br />
— —<br />
— —<br />
— —<br />
— —<br />
Page 3 of 5
LEA: 6505 - OZARK MOUNTAIN SCHOOL <strong>DISTRICT</strong><br />
Indicator 08: Parent Involvement<br />
Percent of surveyed<br />
parents who reported<br />
school facilitated parent<br />
involvement as a means<br />
of improving services<br />
and results for children<br />
with disabilities.<br />
Early Childhood<br />
(3-5)<br />
School Age<br />
(5-21)<br />
State<br />
Rate<br />
90.47%<br />
95.05%<br />
Indicator 09: Disproportionality - Eligibility<br />
Disproportionate representation of racial<br />
and ethnic groups in special education and<br />
related services that is a result of<br />
inappropriate identification (e.g.<br />
monitoring data, review of policies,<br />
practices, and procedures under 618(d),<br />
etc.).<br />
State<br />
Rate<br />
State<br />
Target<br />
88.00%<br />
96.00%<br />
State<br />
Target<br />
0.00% 0.00%<br />
LEA<br />
Rate<br />
— —<br />
100.00%<br />
Indicator 10: Disproportionality-Child with a Disability<br />
Disproportionate representation of racial<br />
and ethnic groups in specific disability<br />
categories that is a result of inappropriate<br />
identification (e.g. monitoring data, review<br />
of policies, practices, and procedures under<br />
618(d), etc.).<br />
Indicator 11: Child Find<br />
Percent of children with<br />
parental consent to evaluate<br />
who are evaluated within<br />
the State established timeline<br />
of 60 days.<br />
Overall<br />
(3-21)<br />
Early Childhood<br />
(3-5)<br />
School Age<br />
(5-21)<br />
State<br />
Rate<br />
0.00%<br />
Indicator 12: Early Childhood Transition<br />
Percent of children referred by Part C prior to<br />
age 3, who are found eligible for Part B, and<br />
who have an IEP developed and implemented<br />
by their third birthday.<br />
Note: - - denotes not applicable<br />
State<br />
Rate<br />
99.41%<br />
99.70%<br />
98.97%<br />
State<br />
Rate<br />
State<br />
Target<br />
0.00%<br />
State<br />
Target<br />
100.00%<br />
100.00%<br />
100.00%<br />
State<br />
Target<br />
Target Met by<br />
LEA (Y/N)<br />
Y<br />
Target Met by<br />
LEA (Y/N)<br />
Y<br />
LEA<br />
Rate<br />
100.00%<br />
— —<br />
100.00%<br />
LEA<br />
Rate<br />
Target Met by<br />
LEA (Y/N)<br />
N/A<br />
Y<br />
Note: The target for Indicator 09 is to have zero percent<br />
(0%) of districts identified as having disproportionate<br />
representation as a result of inappropriate<br />
identification in eligibility.<br />
Note: The target for Indicator 10 is to have zero<br />
percent (0%) of districts identified as having<br />
disproportionate representation as a result of<br />
inappropriate identification in a disability<br />
category.<br />
Target Met by<br />
LEA (Y/N)<br />
N/A<br />
Y<br />
Target Met<br />
by LEA<br />
(Y/N)<br />
99.21% 100.00% - - N/A<br />
Y<br />
Note: * Indicates a zero reponse rate for the<br />
district.<br />
Page 4 of 5
LEA: 6505 - OZARK MOUNTAIN SCHOOL <strong>DISTRICT</strong><br />
Indicator 13: Secondary Transition<br />
Percent of youth with disabilities aged 16 and<br />
up with an IEP that includes coordinated,<br />
measurable, annual IEP goals and transition<br />
services that will reasonably enable the student<br />
to meet the post-secondary goals.<br />
Indicator 14: Post-School Outcomes<br />
A. Percent of youth enrolled in higher<br />
education within one year of leaving high<br />
school.<br />
State<br />
Rate<br />
State<br />
Target<br />
Note: Data for this Indicator is from the on-site monitoring of LEAs for the given year.<br />
B. Percent of youth enrolled in higher<br />
education or competitively employed<br />
within one year of leaving high school.<br />
C. Percent of youth enrolled in higher<br />
education or in some other postsecondary<br />
education or training program; or<br />
competitively employed or in some other<br />
employment within one year of leaving<br />
high school.<br />
State<br />
Rate<br />
Indicator 20: Reported Data-Timely and Accurate*<br />
District submitted<br />
required data elements<br />
on or before due dates;<br />
made revisions within<br />
the alloted reveiw<br />
periods.<br />
Accurate and Timely<br />
Data Submission<br />
Overall (3-21)<br />
Early Childhood (3-5)<br />
School Age (5-21)<br />
State<br />
Target<br />
100.00%<br />
100.00%<br />
100.00%<br />
State<br />
Target<br />
LEA<br />
Rate<br />
LEA<br />
Rate<br />
Target Met by<br />
LEA (Y/N)<br />
Target Met<br />
by LEA<br />
(Y/N)<br />
Target Met<br />
by LEA<br />
(Y/N)<br />
*Data reviewed for timely and accurate submissions included all APSCN cycle data except for personnel<br />
Note: - - denotes not applicable<br />
96.19 100.00 — — N/A<br />
14.53<br />
State<br />
Rate<br />
49.42<br />
State<br />
Rate<br />
54.07<br />
13.00<br />
State<br />
Target<br />
49.00<br />
State<br />
Target<br />
60.00<br />
Y<br />
N/A<br />
Y<br />
10.00%<br />
LEA<br />
Rate<br />
60.00%<br />
LEA<br />
Rate<br />
60.00%<br />
N<br />
Target Met<br />
by LEA<br />
(Y/N)<br />
Y<br />
Target Met<br />
by LEA<br />
(Y/N)<br />
Y<br />
Page 5 of 5
<strong>ARKANSAS</strong> <strong>SPECIAL</strong> <strong>EDUCATION</strong><br />
<strong>DISTRICT</strong> <strong>ANNUAL</strong> PERFORMANCE REPORT<br />
2010/11 School Year<br />
Publication Date: March 2012<br />
Each State must have in place a State Performance Plan (SPP) to evaluate the State's efforts to meet the requirements and<br />
purposes of the implementation of the Individuals with Disabilities Education Act (IDEA). The SPP is a six-year plan, which<br />
describes Arkansas's performance on 20 indicators. The Office of Special Education Programs in the U. S. Department of<br />
Education requires that States report annually to the public on the performance of each local education agency (LEA) on 14 of<br />
20 indicators as compared with targets established by the State in the SPP. Arkansas will report indicators 1 through 14 and<br />
20 for each LEA serving children with disabilities (CWD). Any LEA not meeting targets on compliance indicators (0% for<br />
Indicators 4B, 09 & 10 and 100% for Indicators 11, 12, 13, and 20) are non-compliant with IDEA.<br />
There are no report changes for the 2010/11 school year profile; However, it is important to recognize that: .<br />
1. Indicator 01 (Graduation) is reported a year in arrear (2009/10 graduates) and is based on a four-year cohort. This<br />
means the rate is a measure of students who entered in ninth grade and graduate in four years. The calculation is a<br />
requirement under Title I of the Elementary and Secondary Education Act (ESEA).<br />
2. Indicator 02 (Drop out) is reported a year in arrear. This means the rate is a measure of students who dropped out in<br />
the 2009/10 school year. The Indicator 02 data are aligned with the Common Core of Data (CCD) requirements for<br />
grades 7-12.<br />
3. Indicator 04A and 4B (Suspension/Expulsion) is reported a year in arrear. This means the rate is a measure of<br />
students who had out-of-school suspensions and/or expulsions totaling more than 10 days.<br />
For a complete description of all the Indicators, please visit the special education website at<br />
http://arksped.k12.ar.us/sections/policy.html<br />
LEA: 6601 - FORT SMITH SCHOOL <strong>DISTRICT</strong><br />
Indicator 01: Graduation Rates (2009/10 school year) Indicator 02: Dropout Rates (2009/10 school year)<br />
Percent of youth<br />
with IEPs<br />
graduating from<br />
high school with a<br />
regular diploma<br />
State<br />
Rate<br />
State<br />
Target<br />
75.76% 85.00%<br />
LEA<br />
Rate<br />
79.51%<br />
Target Met<br />
by LEA<br />
(Y/N)<br />
N<br />
Percent of<br />
youth with<br />
IEPs dropping<br />
out of high<br />
school<br />
State<br />
Rate<br />
Indicator 03: Assessment on Statewide Benchmark Exam (grades 3-8, 11)<br />
A) Adequate Yearly Progress<br />
n=40<br />
Literacy<br />
Mathematics<br />
Met Disability Subgroup "n"<br />
for Reporting Purposes (Y/N)<br />
State Target for % of Districts Meeting<br />
AYP for Disability Subgroup<br />
State<br />
Target<br />
3.06% 4.20%<br />
LEA<br />
Rate<br />
2.79%<br />
% of Districts Meeting AYP<br />
for Disability Subgroup<br />
Target Met by<br />
LEA (Y/N)<br />
Y<br />
Target Met by<br />
LEA(Y/N)<br />
Overall Y 17.15% 6.25%<br />
N<br />
Y<br />
Y<br />
Note: For a district to qualify as having a disability subgroup it must have a minimum of 40 (n=40) students with disabilities in a school building.<br />
B) Participation<br />
Participation Rate: # of<br />
CWD Tested ÷ # of CWD<br />
Enrolled in grades tested.<br />
Participation Rate: Literacy<br />
Participation Rate: Math<br />
Note: - - denotes not applicable<br />
State<br />
Rate<br />
98.78%<br />
State<br />
Target<br />
95.00%<br />
LEA<br />
Rate<br />
98.61%<br />
Target Met<br />
by LEA (Y/N)<br />
98.61% 95.00% 98.90% Y<br />
Y<br />
C) Performance Proficiency<br />
Percent of CWD Scoring<br />
Proficient or Above<br />
Proficiency Rate: Literacy<br />
Proficiency Rate:<br />
Mathematics<br />
16.00%<br />
16.00%<br />
State<br />
Rate<br />
31.49%<br />
44.86%<br />
State<br />
Target<br />
45.22%<br />
51.14%<br />
LEA<br />
Rate<br />
31.10%<br />
36.05%<br />
N<br />
N<br />
Target<br />
Met by<br />
LEA (Y/N)<br />
N<br />
N<br />
Page 1 of 5
LEA: 6601 - FORT SMITH SCHOOL <strong>DISTRICT</strong><br />
Indicator 04: Out-of-School Suspensions and Expulsions (2009/10 school year)<br />
A) Suspension/Expulsion<br />
Percent difference of CWD with out-of- school suspensions and<br />
expulsions totaling greater than 10 days in a school year as<br />
compared to the same data for general education students in<br />
the district.<br />
B) Suspension/Expulsion by Race and Ethnicity<br />
Percent of districts that have: (a) a significant discrepancy, by race or<br />
ethnicity, in the rate of suspensions and expulsions of greater than 10<br />
days in a school year for children with IEPs; and (b) policies,<br />
procedures or practices that contribute to the significant discrepancy<br />
and do not comply with requirements relating to the development<br />
and implementation of IEPs, the use of positive behavioral<br />
interventions and supports, and procedural safeguards.<br />
Indicator 05: School Age (5-21) Least Restrictive Environment<br />
A) In the Regular Class 80% or more of the day<br />
Percent of CWD with<br />
IEPs receiving instruction<br />
in the regular class 80%<br />
or more of the day.<br />
State<br />
Rate<br />
State<br />
Target<br />
LEA<br />
Rate<br />
B) In the Regular Class less than 40% of the day<br />
Percent of CWD with<br />
IEPs receiving instruction<br />
in the regular class less<br />
than 60% of the day.<br />
53.87% 59.77%<br />
State<br />
Rate<br />
State<br />
Target<br />
12.42% 12.51%<br />
59.66%<br />
LEA<br />
Rate<br />
21.28%<br />
C) Other Settings outside the regular class<br />
Percent of CWD with IEPs served in<br />
public or private separate schools,<br />
residential placements, or<br />
homebound/hospital placements.<br />
State<br />
Rate<br />
State<br />
Target<br />
2.80% 2.56%<br />
Target Met<br />
by LEA (Y/N)<br />
N<br />
Target Met<br />
by LEA (Y/N)<br />
N<br />
LEA<br />
Rate<br />
1.58%<br />
Target Met<br />
by LEA(Y/N)<br />
Indicator 06: Early Childhood (3-5) Least Restrictive Environment<br />
A) Regular Early Childhood Program<br />
Percent of children (aged 3 through 5) with IEPs attending a regular<br />
early childhood program and receiving the majority of special<br />
education and related services in the regular early childhood program<br />
Allowable<br />
Difference<br />
LEA: 6601 - FORT SMITH SCHOOL <strong>DISTRICT</strong><br />
Indicator 07: Preschool (3-5) Outcomes<br />
a) Percent of preschool CWD<br />
children who did not<br />
improve functioning.<br />
b) Percent of preschool CWD<br />
who improved but whose<br />
functioning remained below<br />
same age peers.<br />
c) Percent of preschool CWD<br />
who improved at a level<br />
nearer to same aged peers.<br />
d) Percent of preschool CWD<br />
who improved functioning to<br />
reach a level comparable to<br />
same age peers.<br />
e) Percent of preschool CWD<br />
children who maintain<br />
functioning at a level<br />
comparable to same aged<br />
peers.<br />
Summary<br />
Statements<br />
1) Of those preschool<br />
children who entered<br />
the preschool program<br />
below age expectations<br />
in each Outcome, the<br />
percent who<br />
substantially increased<br />
their rate of growth by<br />
the time they turned 6<br />
years of age or exited<br />
the program.<br />
2) The percent of<br />
preschool children who<br />
were functioning<br />
within age expectations<br />
in each Outcome by the<br />
time they turned 6<br />
years of age or exited<br />
A) Positive Social -Emotional<br />
Skills*<br />
State<br />
Rate<br />
A) Positive Social -<br />
Emotional Skills<br />
(Including social<br />
relationships)<br />
State<br />
Rate<br />
2.14%<br />
5.31%<br />
25.97%<br />
38.22%<br />
28.36%<br />
State<br />
Target<br />
LEA<br />
Rate<br />
LEA<br />
Rate<br />
— —<br />
3.61%<br />
34.94%<br />
43.37%<br />
18.07%<br />
Target<br />
Met by<br />
LEA(Y/N)<br />
B) Acquisition and Use of<br />
Knowledge and Skills<br />
(Including early language/<br />
communication and early literacy)<br />
B) Acquisition and Use of<br />
Knowledge and Skills **<br />
State<br />
Rate<br />
1.75%<br />
6.59%<br />
34.23%<br />
43.51%<br />
13.92%<br />
State<br />
Target<br />
LEA<br />
Rate<br />
Target<br />
Met by<br />
LEA(Y/N)<br />
C) Use of Appropriate Behaviors<br />
to Meet Their Needs<br />
State<br />
Rate<br />
State<br />
Target<br />
LEA<br />
Rate<br />
Target<br />
Met by<br />
LEA(Y/N)<br />
89.61% 90.50% 95.59% Y 90.31% 90.50% 90.54% Y 90.82% 92.50% 90.48% N<br />
66.58% 69.50% 61.45% N 57.43% 60.50% 49.40% N 76.69% 78.50% 75.90% N<br />
NOTE: * Including social relationships ** Including early language/ communication and early literacy<br />
Note: - - denotes not applicable<br />
State<br />
Rate<br />
LEA<br />
Rate<br />
— —<br />
8.43%<br />
42.17%<br />
38.55%<br />
10.84%<br />
C) Use of<br />
Appropriate<br />
Behaviors to<br />
Meet Their Needs<br />
State<br />
Rate<br />
4.51%<br />
17.34%<br />
41.72%<br />
34.97%<br />
LEA<br />
Rate<br />
1.46% — —<br />
7.23%<br />
16.87%<br />
51.81%<br />
24.10%<br />
Page 3 of 5
LEA: 6601 - FORT SMITH SCHOOL <strong>DISTRICT</strong><br />
Indicator 08: Parent Involvement<br />
Percent of surveyed<br />
parents who reported<br />
school facilitated parent<br />
involvement as a means<br />
of improving services<br />
and results for children<br />
with disabilities.<br />
Early Childhood<br />
(3-5)<br />
School Age<br />
(5-21)<br />
State<br />
Rate<br />
90.47%<br />
95.05%<br />
Indicator 09: Disproportionality - Eligibility<br />
Disproportionate representation of racial<br />
and ethnic groups in special education and<br />
related services that is a result of<br />
inappropriate identification (e.g.<br />
monitoring data, review of policies,<br />
practices, and procedures under 618(d),<br />
etc.).<br />
State<br />
Rate<br />
State<br />
Target<br />
88.00%<br />
96.00%<br />
State<br />
Target<br />
0.00% 0.00%<br />
LEA<br />
Rate<br />
93.75%<br />
92.86%<br />
Indicator 10: Disproportionality-Child with a Disability<br />
Disproportionate representation of racial<br />
and ethnic groups in specific disability<br />
categories that is a result of inappropriate<br />
identification (e.g. monitoring data, review<br />
of policies, practices, and procedures under<br />
618(d), etc.).<br />
Indicator 11: Child Find<br />
Percent of children with<br />
parental consent to evaluate<br />
who are evaluated within<br />
the State established timeline<br />
of 60 days.<br />
Overall<br />
(3-21)<br />
Early Childhood<br />
(3-5)<br />
School Age<br />
(5-21)<br />
State<br />
Rate<br />
0.00%<br />
Indicator 12: Early Childhood Transition<br />
Percent of children referred by Part C prior to<br />
age 3, who are found eligible for Part B, and<br />
who have an IEP developed and implemented<br />
by their third birthday.<br />
Note: - - denotes not applicable<br />
State<br />
Rate<br />
99.41%<br />
99.70%<br />
98.97%<br />
State<br />
Rate<br />
State<br />
Target<br />
0.00%<br />
State<br />
Target<br />
100.00%<br />
100.00%<br />
100.00%<br />
State<br />
Target<br />
Target Met by<br />
LEA (Y/N)<br />
Y<br />
Target Met by<br />
LEA (Y/N)<br />
Y<br />
LEA<br />
Rate<br />
99.70%<br />
99.70%<br />
99.70%<br />
LEA<br />
Rate<br />
Target Met by<br />
LEA (Y/N)<br />
Y<br />
N<br />
Note: The target for Indicator 09 is to have zero percent<br />
(0%) of districts identified as having disproportionate<br />
representation as a result of inappropriate<br />
identification in eligibility.<br />
Note: The target for Indicator 10 is to have zero<br />
percent (0%) of districts identified as having<br />
disproportionate representation as a result of<br />
inappropriate identification in a disability<br />
category.<br />
Target Met by<br />
LEA (Y/N)<br />
N<br />
N<br />
Target Met<br />
by LEA<br />
(Y/N)<br />
99.21% 100.00% - - N/A<br />
N<br />
Note: * Indicates a zero reponse rate for the<br />
district.<br />
Page 4 of 5
LEA: 6601 - FORT SMITH SCHOOL <strong>DISTRICT</strong><br />
Indicator 13: Secondary Transition<br />
Percent of youth with disabilities aged 16 and<br />
up with an IEP that includes coordinated,<br />
measurable, annual IEP goals and transition<br />
services that will reasonably enable the student<br />
to meet the post-secondary goals.<br />
Indicator 14: Post-School Outcomes<br />
A. Percent of youth enrolled in higher<br />
education within one year of leaving high<br />
school.<br />
State<br />
Rate<br />
State<br />
Target<br />
Note: Data for this Indicator is from the on-site monitoring of LEAs for the given year.<br />
B. Percent of youth enrolled in higher<br />
education or competitively employed<br />
within one year of leaving high school.<br />
C. Percent of youth enrolled in higher<br />
education or in some other postsecondary<br />
education or training program; or<br />
competitively employed or in some other<br />
employment within one year of leaving<br />
high school.<br />
State<br />
Rate<br />
Indicator 20: Reported Data-Timely and Accurate*<br />
District submitted<br />
required data elements<br />
on or before due dates;<br />
made revisions within<br />
the alloted reveiw<br />
periods.<br />
Accurate and Timely<br />
Data Submission<br />
Overall (3-21)<br />
Early Childhood (3-5)<br />
School Age (5-21)<br />
State<br />
Target<br />
100.00%<br />
100.00%<br />
100.00%<br />
State<br />
Target<br />
LEA<br />
Rate<br />
LEA<br />
Rate<br />
Target Met by<br />
LEA (Y/N)<br />
Target Met<br />
by LEA<br />
(Y/N)<br />
Target Met<br />
by LEA<br />
(Y/N)<br />
*Data reviewed for timely and accurate submissions included all APSCN cycle data except for personnel<br />
Note: - - denotes not applicable<br />
96.19 100.00 — — N/A<br />
14.53<br />
State<br />
Rate<br />
49.42<br />
State<br />
Rate<br />
54.07<br />
13.00<br />
State<br />
Target<br />
49.00<br />
State<br />
Target<br />
60.00<br />
Y<br />
Y<br />
Y<br />
— —<br />
LEA<br />
Rate<br />
— —<br />
LEA<br />
Rate<br />
— —<br />
N/A<br />
Target Met<br />
by LEA<br />
(Y/N)<br />
N/A<br />
Target Met<br />
by LEA<br />
(Y/N)<br />
N/A<br />
Page 5 of 5
<strong>ARKANSAS</strong> <strong>SPECIAL</strong> <strong>EDUCATION</strong><br />
<strong>DISTRICT</strong> <strong>ANNUAL</strong> PERFORMANCE REPORT<br />
2010/11 School Year<br />
Publication Date: March 2012<br />
Each State must have in place a State Performance Plan (SPP) to evaluate the State's efforts to meet the requirements and<br />
purposes of the implementation of the Individuals with Disabilities Education Act (IDEA). The SPP is a six-year plan, which<br />
describes Arkansas's performance on 20 indicators. The Office of Special Education Programs in the U. S. Department of<br />
Education requires that States report annually to the public on the performance of each local education agency (LEA) on 14 of<br />
20 indicators as compared with targets established by the State in the SPP. Arkansas will report indicators 1 through 14 and<br />
20 for each LEA serving children with disabilities (CWD). Any LEA not meeting targets on compliance indicators (0% for<br />
Indicators 4B, 09 & 10 and 100% for Indicators 11, 12, 13, and 20) are non-compliant with IDEA.<br />
There are no report changes for the 2010/11 school year profile; However, it is important to recognize that: .<br />
1. Indicator 01 (Graduation) is reported a year in arrear (2009/10 graduates) and is based on a four-year cohort. This<br />
means the rate is a measure of students who entered in ninth grade and graduate in four years. The calculation is a<br />
requirement under Title I of the Elementary and Secondary Education Act (ESEA).<br />
2. Indicator 02 (Drop out) is reported a year in arrear. This means the rate is a measure of students who dropped out in<br />
the 2009/10 school year. The Indicator 02 data are aligned with the Common Core of Data (CCD) requirements for<br />
grades 7-12.<br />
3. Indicator 04A and 4B (Suspension/Expulsion) is reported a year in arrear. This means the rate is a measure of<br />
students who had out-of-school suspensions and/or expulsions totaling more than 10 days.<br />
For a complete description of all the Indicators, please visit the special education website at<br />
http://arksped.k12.ar.us/sections/policy.html<br />
LEA: 6602 - GREENWOOD SCHOOL <strong>DISTRICT</strong><br />
Indicator 01: Graduation Rates (2009/10 school year) Indicator 02: Dropout Rates (2009/10 school year)<br />
Percent of youth<br />
with IEPs<br />
graduating from<br />
high school with a<br />
regular diploma<br />
State<br />
Rate<br />
State<br />
Target<br />
75.76% 85.00%<br />
LEA<br />
Rate<br />
100.00%<br />
Target Met<br />
by LEA<br />
(Y/N)<br />
Y<br />
Percent of<br />
youth with<br />
IEPs dropping<br />
out of high<br />
school<br />
State<br />
Rate<br />
Indicator 03: Assessment on Statewide Benchmark Exam (grades 3-8, 11)<br />
A) Adequate Yearly Progress<br />
n=40<br />
Literacy<br />
Mathematics<br />
Met Disability Subgroup "n"<br />
for Reporting Purposes (Y/N)<br />
State Target for % of Districts Meeting<br />
AYP for Disability Subgroup<br />
State<br />
Target<br />
3.06% 4.20%<br />
LEA<br />
Rate<br />
1.82%<br />
% of Districts Meeting AYP<br />
for Disability Subgroup<br />
Target Met by<br />
LEA (Y/N)<br />
Y<br />
Target Met by<br />
LEA(Y/N)<br />
Overall N 17.15% 6.25%<br />
NA<br />
N<br />
N<br />
Note: For a district to qualify as having a disability subgroup it must have a minimum of 40 (n=40) students with disabilities in a school building.<br />
B) Participation<br />
Participation Rate: # of<br />
CWD Tested ÷ # of CWD<br />
Enrolled in grades tested.<br />
Participation Rate: Literacy<br />
Participation Rate: Math<br />
Note: - - denotes not applicable<br />
State<br />
Rate<br />
98.78%<br />
State<br />
Target<br />
95.00%<br />
LEA<br />
Rate<br />
99.58%<br />
Target Met<br />
by LEA (Y/N)<br />
98.61% 95.00% 100.00% Y<br />
Y<br />
C) Performance Proficiency<br />
Percent of CWD Scoring<br />
Proficient or Above<br />
Proficiency Rate: Literacy<br />
Proficiency Rate:<br />
Mathematics<br />
16.00%<br />
16.00%<br />
State<br />
Rate<br />
31.49%<br />
44.86%<br />
State<br />
Target<br />
45.22%<br />
51.14%<br />
LEA<br />
Rate<br />
32.89%<br />
57.45%<br />
NA<br />
NA<br />
Target<br />
Met by<br />
LEA (Y/N)<br />
N<br />
Y<br />
Page 1 of 5
LEA: 6602 - GREENWOOD SCHOOL <strong>DISTRICT</strong><br />
Indicator 04: Out-of-School Suspensions and Expulsions (2009/10 school year)<br />
A) Suspension/Expulsion<br />
Percent difference of CWD with out-of- school suspensions and<br />
expulsions totaling greater than 10 days in a school year as<br />
compared to the same data for general education students in<br />
the district.<br />
B) Suspension/Expulsion by Race and Ethnicity<br />
Percent of districts that have: (a) a significant discrepancy, by race or<br />
ethnicity, in the rate of suspensions and expulsions of greater than 10<br />
days in a school year for children with IEPs; and (b) policies,<br />
procedures or practices that contribute to the significant discrepancy<br />
and do not comply with requirements relating to the development<br />
and implementation of IEPs, the use of positive behavioral<br />
interventions and supports, and procedural safeguards.<br />
Indicator 05: School Age (5-21) Least Restrictive Environment<br />
A) In the Regular Class 80% or more of the day<br />
Percent of CWD with<br />
IEPs receiving instruction<br />
in the regular class 80%<br />
or more of the day.<br />
State<br />
Rate<br />
State<br />
Target<br />
LEA<br />
Rate<br />
B) In the Regular Class less than 40% of the day<br />
Percent of CWD with<br />
IEPs receiving instruction<br />
in the regular class less<br />
than 60% of the day.<br />
53.87% 59.77%<br />
State<br />
Rate<br />
State<br />
Target<br />
12.42% 12.51%<br />
76.63%<br />
LEA<br />
Rate<br />
6.97%<br />
C) Other Settings outside the regular class<br />
Percent of CWD with IEPs served in<br />
public or private separate schools,<br />
residential placements, or<br />
homebound/hospital placements.<br />
State<br />
Rate<br />
State<br />
Target<br />
2.80% 2.56%<br />
Target Met<br />
by LEA (Y/N)<br />
Y<br />
Target Met<br />
by LEA (Y/N)<br />
Y<br />
LEA<br />
Rate<br />
0.22%<br />
Target Met<br />
by LEA(Y/N)<br />
Indicator 06: Early Childhood (3-5) Least Restrictive Environment<br />
A) Regular Early Childhood Program<br />
Percent of children (aged 3 through 5) with IEPs attending a regular<br />
early childhood program and receiving the majority of special<br />
education and related services in the regular early childhood program<br />
Allowable<br />
Difference<br />
LEA: 6602 - GREENWOOD SCHOOL <strong>DISTRICT</strong><br />
Indicator 07: Preschool (3-5) Outcomes<br />
a) Percent of preschool CWD<br />
children who did not<br />
improve functioning.<br />
b) Percent of preschool CWD<br />
who improved but whose<br />
functioning remained below<br />
same age peers.<br />
c) Percent of preschool CWD<br />
who improved at a level<br />
nearer to same aged peers.<br />
d) Percent of preschool CWD<br />
who improved functioning to<br />
reach a level comparable to<br />
same age peers.<br />
e) Percent of preschool CWD<br />
children who maintain<br />
functioning at a level<br />
comparable to same aged<br />
peers.<br />
Summary<br />
Statements<br />
1) Of those preschool<br />
children who entered<br />
the preschool program<br />
below age expectations<br />
in each Outcome, the<br />
percent who<br />
substantially increased<br />
their rate of growth by<br />
the time they turned 6<br />
years of age or exited<br />
the program.<br />
2) The percent of<br />
preschool children who<br />
were functioning<br />
within age expectations<br />
in each Outcome by the<br />
time they turned 6<br />
years of age or exited<br />
A) Positive Social -Emotional<br />
Skills*<br />
State<br />
Rate<br />
A) Positive Social -<br />
Emotional Skills<br />
(Including social<br />
relationships)<br />
State<br />
Rate<br />
2.14%<br />
5.31%<br />
25.97%<br />
38.22%<br />
28.36%<br />
State<br />
Target<br />
LEA<br />
Rate<br />
LEA<br />
Rate<br />
— —<br />
— —<br />
— —<br />
— —<br />
— —<br />
Target<br />
Met by<br />
LEA(Y/N)<br />
B) Acquisition and Use of<br />
Knowledge and Skills<br />
(Including early language/<br />
communication and early literacy)<br />
B) Acquisition and Use of<br />
Knowledge and Skills **<br />
State<br />
Rate<br />
1.75%<br />
6.59%<br />
34.23%<br />
43.51%<br />
13.92%<br />
State<br />
Target<br />
LEA<br />
Rate<br />
Target<br />
Met by<br />
LEA(Y/N)<br />
C) Use of Appropriate Behaviors<br />
to Meet Their Needs<br />
State<br />
Rate<br />
State<br />
Target<br />
LEA<br />
Rate<br />
Target<br />
Met by<br />
LEA(Y/N)<br />
89.61% 90.50% — — N/A 90.31% 90.50% — — N/A 90.82% 92.50% — — N/A<br />
66.58% 69.50% — — N/A 57.43% 60.50% — — N/A 76.69% 78.50% — — N/A<br />
NOTE: * Including social relationships ** Including early language/ communication and early literacy<br />
Note: - - denotes not applicable<br />
State<br />
Rate<br />
LEA<br />
Rate<br />
— —<br />
— —<br />
— —<br />
— —<br />
— —<br />
C) Use of<br />
Appropriate<br />
Behaviors to<br />
Meet Their Needs<br />
State<br />
Rate<br />
4.51%<br />
17.34%<br />
41.72%<br />
34.97%<br />
LEA<br />
Rate<br />
1.46% — —<br />
— —<br />
— —<br />
— —<br />
— —<br />
Page 3 of 5
LEA: 6602 - GREENWOOD SCHOOL <strong>DISTRICT</strong><br />
Indicator 08: Parent Involvement<br />
Percent of surveyed<br />
parents who reported<br />
school facilitated parent<br />
involvement as a means<br />
of improving services<br />
and results for children<br />
with disabilities.<br />
Early Childhood<br />
(3-5)<br />
School Age<br />
(5-21)<br />
State<br />
Rate<br />
90.47%<br />
95.05%<br />
Indicator 09: Disproportionality - Eligibility<br />
Disproportionate representation of racial<br />
and ethnic groups in special education and<br />
related services that is a result of<br />
inappropriate identification (e.g.<br />
monitoring data, review of policies,<br />
practices, and procedures under 618(d),<br />
etc.).<br />
State<br />
Rate<br />
State<br />
Target<br />
88.00%<br />
96.00%<br />
State<br />
Target<br />
0.00% 0.00%<br />
LEA<br />
Rate<br />
— —<br />
89.47%<br />
Indicator 10: Disproportionality-Child with a Disability<br />
Disproportionate representation of racial<br />
and ethnic groups in specific disability<br />
categories that is a result of inappropriate<br />
identification (e.g. monitoring data, review<br />
of policies, practices, and procedures under<br />
618(d), etc.).<br />
Indicator 11: Child Find<br />
Percent of children with<br />
parental consent to evaluate<br />
who are evaluated within<br />
the State established timeline<br />
of 60 days.<br />
Overall<br />
(3-21)<br />
Early Childhood<br />
(3-5)<br />
School Age<br />
(5-21)<br />
State<br />
Rate<br />
0.00%<br />
Indicator 12: Early Childhood Transition<br />
Percent of children referred by Part C prior to<br />
age 3, who are found eligible for Part B, and<br />
who have an IEP developed and implemented<br />
by their third birthday.<br />
Note: - - denotes not applicable<br />
State<br />
Rate<br />
99.41%<br />
99.70%<br />
98.97%<br />
State<br />
Rate<br />
State<br />
Target<br />
0.00%<br />
State<br />
Target<br />
100.00%<br />
100.00%<br />
100.00%<br />
State<br />
Target<br />
Target Met by<br />
LEA (Y/N)<br />
Y<br />
Target Met by<br />
LEA (Y/N)<br />
Y<br />
LEA<br />
Rate<br />
98.48%<br />
— —<br />
98.48%<br />
LEA<br />
Rate<br />
Target Met by<br />
LEA (Y/N)<br />
N/A<br />
N<br />
Note: The target for Indicator 09 is to have zero percent<br />
(0%) of districts identified as having disproportionate<br />
representation as a result of inappropriate<br />
identification in eligibility.<br />
Note: The target for Indicator 10 is to have zero<br />
percent (0%) of districts identified as having<br />
disproportionate representation as a result of<br />
inappropriate identification in a disability<br />
category.<br />
Target Met by<br />
LEA (Y/N)<br />
N/A<br />
N<br />
Target Met<br />
by LEA<br />
(Y/N)<br />
99.21% 100.00% - - N/A<br />
N<br />
Note: * Indicates a zero reponse rate for the<br />
district.<br />
Page 4 of 5
LEA: 6602 - GREENWOOD SCHOOL <strong>DISTRICT</strong><br />
Indicator 13: Secondary Transition<br />
Percent of youth with disabilities aged 16 and<br />
up with an IEP that includes coordinated,<br />
measurable, annual IEP goals and transition<br />
services that will reasonably enable the student<br />
to meet the post-secondary goals.<br />
Indicator 14: Post-School Outcomes<br />
A. Percent of youth enrolled in higher<br />
education within one year of leaving high<br />
school.<br />
State<br />
Rate<br />
State<br />
Target<br />
Note: Data for this Indicator is from the on-site monitoring of LEAs for the given year.<br />
B. Percent of youth enrolled in higher<br />
education or competitively employed<br />
within one year of leaving high school.<br />
C. Percent of youth enrolled in higher<br />
education or in some other postsecondary<br />
education or training program; or<br />
competitively employed or in some other<br />
employment within one year of leaving<br />
high school.<br />
State<br />
Rate<br />
Indicator 20: Reported Data-Timely and Accurate*<br />
District submitted<br />
required data elements<br />
on or before due dates;<br />
made revisions within<br />
the alloted reveiw<br />
periods.<br />
Accurate and Timely<br />
Data Submission<br />
Overall (3-21)<br />
Early Childhood (3-5)<br />
School Age (5-21)<br />
State<br />
Target<br />
100.00%<br />
100.00%<br />
100.00%<br />
State<br />
Target<br />
LEA<br />
Rate<br />
LEA<br />
Rate<br />
Target Met by<br />
LEA (Y/N)<br />
Target Met<br />
by LEA<br />
(Y/N)<br />
Target Met<br />
by LEA<br />
(Y/N)<br />
*Data reviewed for timely and accurate submissions included all APSCN cycle data except for personnel<br />
Note: - - denotes not applicable<br />
96.19 100.00 — — N/A<br />
14.53<br />
State<br />
Rate<br />
49.42<br />
State<br />
Rate<br />
54.07<br />
13.00<br />
State<br />
Target<br />
49.00<br />
State<br />
Target<br />
60.00<br />
Y<br />
N/A<br />
Y<br />
— —<br />
LEA<br />
Rate<br />
— —<br />
LEA<br />
Rate<br />
— —<br />
N/A<br />
Target Met<br />
by LEA<br />
(Y/N)<br />
N/A<br />
Target Met<br />
by LEA<br />
(Y/N)<br />
N/A<br />
Page 5 of 5
LEA: 6603 - HACKETT SCHOOL <strong>DISTRICT</strong><br />
<strong>ARKANSAS</strong> <strong>SPECIAL</strong> <strong>EDUCATION</strong><br />
<strong>DISTRICT</strong> <strong>ANNUAL</strong> PERFORMANCE REPORT<br />
2010/11 School Year<br />
Publication Date: March 2012<br />
Each State must have in place a State Performance Plan (SPP) to evaluate the State's efforts to meet the requirements and<br />
purposes of the implementation of the Individuals with Disabilities Education Act (IDEA). The SPP is a six-year plan, which<br />
describes Arkansas's performance on 20 indicators. The Office of Special Education Programs in the U. S. Department of<br />
Education requires that States report annually to the public on the performance of each local education agency (LEA) on 14 of<br />
20 indicators as compared with targets established by the State in the SPP. Arkansas will report indicators 1 through 14 and<br />
20 for each LEA serving children with disabilities (CWD). Any LEA not meeting targets on compliance indicators (0% for<br />
Indicators 4B, 09 & 10 and 100% for Indicators 11, 12, 13, and 20) are non-compliant with IDEA.<br />
There are no report changes for the 2010/11 school year profile; However, it is important to recognize that: .<br />
1. Indicator 01 (Graduation) is reported a year in arrear (2009/10 graduates) and is based on a four-year cohort. This<br />
means the rate is a measure of students who entered in ninth grade and graduate in four years. The calculation is a<br />
requirement under Title I of the Elementary and Secondary Education Act (ESEA).<br />
2. Indicator 02 (Drop out) is reported a year in arrear. This means the rate is a measure of students who dropped out in<br />
the 2009/10 school year. The Indicator 02 data are aligned with the Common Core of Data (CCD) requirements for<br />
grades 7-12.<br />
3. Indicator 04A and 4B (Suspension/Expulsion) is reported a year in arrear. This means the rate is a measure of<br />
students who had out-of-school suspensions and/or expulsions totaling more than 10 days.<br />
Percent of youth<br />
with IEPs<br />
graduating from<br />
high school with a<br />
regular diploma<br />
For a complete description of all the Indicators, please visit the special education website at<br />
http://arksped.k12.ar.us/sections/policy.html<br />
Indicator 01: Graduation Rates (2009/10 school year) Indicator 02: Dropout Rates (2009/10 school year)<br />
State<br />
Rate<br />
State<br />
Target<br />
75.76% 85.00%<br />
LEA<br />
Rate<br />
80.00%<br />
Target Met<br />
by LEA<br />
(Y/N)<br />
N<br />
Percent of<br />
youth with<br />
IEPs dropping<br />
out of high<br />
school<br />
State<br />
Rate<br />
Indicator 03: Assessment on Statewide Benchmark Exam (grades 3-8, 11)<br />
A) Adequate Yearly Progress<br />
n=40<br />
Literacy<br />
Mathematics<br />
Met Disability Subgroup "n"<br />
for Reporting Purposes (Y/N)<br />
State Target for % of Districts Meeting<br />
AYP for Disability Subgroup<br />
State<br />
Target<br />
3.06% 4.20%<br />
LEA<br />
Rate<br />
10.00%<br />
% of Districts Meeting AYP<br />
for Disability Subgroup<br />
Target Met by<br />
LEA (Y/N)<br />
N<br />
Target Met by<br />
LEA(Y/N)<br />
Overall N 17.15% 6.25%<br />
NA<br />
N<br />
N<br />
Note: For a district to qualify as having a disability subgroup it must have a minimum of 40 (n=40) students with disabilities in a school building.<br />
B) Participation<br />
Participation Rate: # of<br />
CWD Tested ÷ # of CWD<br />
Enrolled in grades tested.<br />
Participation Rate: Literacy<br />
Participation Rate: Math<br />
Note: - - denotes not applicable<br />
State<br />
Rate<br />
98.78%<br />
State<br />
Target<br />
95.00%<br />
LEA<br />
Rate<br />
100.00%<br />
Target Met<br />
by LEA (Y/N)<br />
98.61% 95.00% 100.00% Y<br />
Y<br />
C) Performance Proficiency<br />
Percent of CWD Scoring<br />
Proficient or Above<br />
Proficiency Rate: Literacy<br />
Proficiency Rate:<br />
Mathematics<br />
16.00%<br />
16.00%<br />
State<br />
Rate<br />
31.49%<br />
44.86%<br />
State<br />
Target<br />
45.22%<br />
51.14%<br />
LEA<br />
Rate<br />
22.45%<br />
26.92%<br />
NA<br />
NA<br />
Target<br />
Met by<br />
LEA (Y/N)<br />
N<br />
N<br />
Page 1 of 5
LEA: 6603 - HACKETT SCHOOL <strong>DISTRICT</strong><br />
Indicator 04: Out-of-School Suspensions and Expulsions (2009/10 school year)<br />
A) Suspension/Expulsion<br />
Percent difference of CWD with out-of- school suspensions and<br />
expulsions totaling greater than 10 days in a school year as<br />
compared to the same data for general education students in<br />
the district.<br />
B) Suspension/Expulsion by Race and Ethnicity<br />
Percent of districts that have: (a) a significant discrepancy, by race or<br />
ethnicity, in the rate of suspensions and expulsions of greater than 10<br />
days in a school year for children with IEPs; and (b) policies,<br />
procedures or practices that contribute to the significant discrepancy<br />
and do not comply with requirements relating to the development<br />
and implementation of IEPs, the use of positive behavioral<br />
interventions and supports, and procedural safeguards.<br />
Indicator 05: School Age (5-21) Least Restrictive Environment<br />
A) In the Regular Class 80% or more of the day<br />
Percent of CWD with<br />
IEPs receiving instruction<br />
in the regular class 80%<br />
or more of the day.<br />
State<br />
Rate<br />
State<br />
Target<br />
LEA<br />
Rate<br />
B) In the Regular Class less than 40% of the day<br />
Percent of CWD with<br />
IEPs receiving instruction<br />
in the regular class less<br />
than 60% of the day.<br />
53.87% 59.77%<br />
State<br />
Rate<br />
State<br />
Target<br />
12.42% 12.51%<br />
58.54%<br />
LEA<br />
Rate<br />
3.66%<br />
C) Other Settings outside the regular class<br />
Percent of CWD with IEPs served in<br />
public or private separate schools,<br />
residential placements, or<br />
homebound/hospital placements.<br />
State<br />
Rate<br />
State<br />
Target<br />
2.80% 2.56%<br />
Target Met<br />
by LEA (Y/N)<br />
N<br />
Target Met<br />
by LEA (Y/N)<br />
Y<br />
LEA<br />
Rate<br />
0.00%<br />
Target Met<br />
by LEA(Y/N)<br />
Indicator 06: Early Childhood (3-5) Least Restrictive Environment<br />
A) Regular Early Childhood Program<br />
Percent of children (aged 3 through 5) with IEPs attending a regular<br />
early childhood program and receiving the majority of special<br />
education and related services in the regular early childhood program<br />
Allowable<br />
Difference<br />
LEA: 6603 - HACKETT SCHOOL <strong>DISTRICT</strong><br />
Indicator 07: Preschool (3-5) Outcomes<br />
a) Percent of preschool CWD<br />
children who did not<br />
improve functioning.<br />
b) Percent of preschool CWD<br />
who improved but whose<br />
functioning remained below<br />
same age peers.<br />
c) Percent of preschool CWD<br />
who improved at a level<br />
nearer to same aged peers.<br />
d) Percent of preschool CWD<br />
who improved functioning to<br />
reach a level comparable to<br />
same age peers.<br />
e) Percent of preschool CWD<br />
children who maintain<br />
functioning at a level<br />
comparable to same aged<br />
peers.<br />
Summary<br />
Statements<br />
1) Of those preschool<br />
children who entered<br />
the preschool program<br />
below age expectations<br />
in each Outcome, the<br />
percent who<br />
substantially increased<br />
their rate of growth by<br />
the time they turned 6<br />
years of age or exited<br />
the program.<br />
2) The percent of<br />
preschool children who<br />
were functioning<br />
within age expectations<br />
in each Outcome by the<br />
time they turned 6<br />
years of age or exited<br />
A) Positive Social -Emotional<br />
Skills*<br />
State<br />
Rate<br />
A) Positive Social -<br />
Emotional Skills<br />
(Including social<br />
relationships)<br />
State<br />
Rate<br />
2.14%<br />
5.31%<br />
25.97%<br />
38.22%<br />
28.36%<br />
State<br />
Target<br />
LEA<br />
Rate<br />
LEA<br />
Rate<br />
— —<br />
— —<br />
— —<br />
— —<br />
— —<br />
Target<br />
Met by<br />
LEA(Y/N)<br />
B) Acquisition and Use of<br />
Knowledge and Skills<br />
(Including early language/<br />
communication and early literacy)<br />
B) Acquisition and Use of<br />
Knowledge and Skills **<br />
State<br />
Rate<br />
1.75%<br />
6.59%<br />
34.23%<br />
43.51%<br />
13.92%<br />
State<br />
Target<br />
LEA<br />
Rate<br />
Target<br />
Met by<br />
LEA(Y/N)<br />
C) Use of Appropriate Behaviors<br />
to Meet Their Needs<br />
State<br />
Rate<br />
State<br />
Target<br />
LEA<br />
Rate<br />
Target<br />
Met by<br />
LEA(Y/N)<br />
89.61% 90.50% — — N/A 90.31% 90.50% — — N/A 90.82% 92.50% — — N/A<br />
66.58% 69.50% — — N/A 57.43% 60.50% — — N/A 76.69% 78.50% — — N/A<br />
NOTE: * Including social relationships ** Including early language/ communication and early literacy<br />
Note: - - denotes not applicable<br />
State<br />
Rate<br />
LEA<br />
Rate<br />
— —<br />
— —<br />
— —<br />
— —<br />
— —<br />
C) Use of<br />
Appropriate<br />
Behaviors to<br />
Meet Their Needs<br />
State<br />
Rate<br />
4.51%<br />
17.34%<br />
41.72%<br />
34.97%<br />
LEA<br />
Rate<br />
1.46% — —<br />
— —<br />
— —<br />
— —<br />
— —<br />
Page 3 of 5
LEA: 6603 - HACKETT SCHOOL <strong>DISTRICT</strong><br />
Indicator 08: Parent Involvement<br />
Percent of surveyed<br />
parents who reported<br />
school facilitated parent<br />
involvement as a means<br />
of improving services<br />
and results for children<br />
with disabilities.<br />
Early Childhood<br />
(3-5)<br />
School Age<br />
(5-21)<br />
State<br />
Rate<br />
90.47%<br />
95.05%<br />
Indicator 09: Disproportionality - Eligibility<br />
Disproportionate representation of racial<br />
and ethnic groups in special education and<br />
related services that is a result of<br />
inappropriate identification (e.g.<br />
monitoring data, review of policies,<br />
practices, and procedures under 618(d),<br />
etc.).<br />
State<br />
Rate<br />
State<br />
Target<br />
88.00%<br />
96.00%<br />
State<br />
Target<br />
0.00% 0.00%<br />
LEA<br />
Rate<br />
— —<br />
91.89%<br />
Indicator 10: Disproportionality-Child with a Disability<br />
Disproportionate representation of racial<br />
and ethnic groups in specific disability<br />
categories that is a result of inappropriate<br />
identification (e.g. monitoring data, review<br />
of policies, practices, and procedures under<br />
618(d), etc.).<br />
Indicator 11: Child Find<br />
Percent of children with<br />
parental consent to evaluate<br />
who are evaluated within<br />
the State established timeline<br />
of 60 days.<br />
Overall<br />
(3-21)<br />
Early Childhood<br />
(3-5)<br />
School Age<br />
(5-21)<br />
State<br />
Rate<br />
0.00%<br />
Indicator 12: Early Childhood Transition<br />
Percent of children referred by Part C prior to<br />
age 3, who are found eligible for Part B, and<br />
who have an IEP developed and implemented<br />
by their third birthday.<br />
Note: - - denotes not applicable<br />
State<br />
Rate<br />
99.41%<br />
99.70%<br />
98.97%<br />
State<br />
Rate<br />
State<br />
Target<br />
0.00%<br />
State<br />
Target<br />
100.00%<br />
100.00%<br />
100.00%<br />
State<br />
Target<br />
Target Met by<br />
LEA (Y/N)<br />
Y<br />
Target Met by<br />
LEA (Y/N)<br />
Y<br />
LEA<br />
Rate<br />
100.00%<br />
— —<br />
100.00%<br />
LEA<br />
Rate<br />
Target Met by<br />
LEA (Y/N)<br />
N/A<br />
N<br />
Note: The target for Indicator 09 is to have zero percent<br />
(0%) of districts identified as having disproportionate<br />
representation as a result of inappropriate<br />
identification in eligibility.<br />
Note: The target for Indicator 10 is to have zero<br />
percent (0%) of districts identified as having<br />
disproportionate representation as a result of<br />
inappropriate identification in a disability<br />
category.<br />
Target Met by<br />
LEA (Y/N)<br />
N/A<br />
Y<br />
Target Met<br />
by LEA<br />
(Y/N)<br />
99.21% 100.00% - - N/A<br />
Y<br />
Note: * Indicates a zero reponse rate for the<br />
district.<br />
Page 4 of 5
LEA: 6603 - HACKETT SCHOOL <strong>DISTRICT</strong><br />
Indicator 13: Secondary Transition<br />
Percent of youth with disabilities aged 16 and<br />
up with an IEP that includes coordinated,<br />
measurable, annual IEP goals and transition<br />
services that will reasonably enable the student<br />
to meet the post-secondary goals.<br />
Indicator 14: Post-School Outcomes<br />
A. Percent of youth enrolled in higher<br />
education within one year of leaving high<br />
school.<br />
State<br />
Rate<br />
State<br />
Target<br />
Note: Data for this Indicator is from the on-site monitoring of LEAs for the given year.<br />
B. Percent of youth enrolled in higher<br />
education or competitively employed<br />
within one year of leaving high school.<br />
C. Percent of youth enrolled in higher<br />
education or in some other postsecondary<br />
education or training program; or<br />
competitively employed or in some other<br />
employment within one year of leaving<br />
high school.<br />
State<br />
Rate<br />
Indicator 20: Reported Data-Timely and Accurate*<br />
District submitted<br />
required data elements<br />
on or before due dates;<br />
made revisions within<br />
the alloted reveiw<br />
periods.<br />
Accurate and Timely<br />
Data Submission<br />
Overall (3-21)<br />
Early Childhood (3-5)<br />
School Age (5-21)<br />
State<br />
Target<br />
100.00%<br />
100.00%<br />
100.00%<br />
State<br />
Target<br />
LEA<br />
Rate<br />
LEA<br />
Rate<br />
Target Met by<br />
LEA (Y/N)<br />
Target Met<br />
by LEA<br />
(Y/N)<br />
Target Met<br />
by LEA<br />
(Y/N)<br />
*Data reviewed for timely and accurate submissions included all APSCN cycle data except for personnel<br />
Note: - - denotes not applicable<br />
96.19 100.00 — — N/A<br />
14.53<br />
State<br />
Rate<br />
49.42<br />
State<br />
Rate<br />
54.07<br />
13.00<br />
State<br />
Target<br />
49.00<br />
State<br />
Target<br />
60.00<br />
Y<br />
N/A<br />
Y<br />
— —<br />
LEA<br />
Rate<br />
— —<br />
LEA<br />
Rate<br />
— —<br />
N/A<br />
Target Met<br />
by LEA<br />
(Y/N)<br />
N/A<br />
Target Met<br />
by LEA<br />
(Y/N)<br />
N/A<br />
Page 5 of 5
LEA: 6604 - HARTFORD SCHOOL <strong>DISTRICT</strong><br />
<strong>ARKANSAS</strong> <strong>SPECIAL</strong> <strong>EDUCATION</strong><br />
<strong>DISTRICT</strong> <strong>ANNUAL</strong> PERFORMANCE REPORT<br />
2010/11 School Year<br />
Publication Date: March 2012<br />
Each State must have in place a State Performance Plan (SPP) to evaluate the State's efforts to meet the requirements and<br />
purposes of the implementation of the Individuals with Disabilities Education Act (IDEA). The SPP is a six-year plan, which<br />
describes Arkansas's performance on 20 indicators. The Office of Special Education Programs in the U. S. Department of<br />
Education requires that States report annually to the public on the performance of each local education agency (LEA) on 14 of<br />
20 indicators as compared with targets established by the State in the SPP. Arkansas will report indicators 1 through 14 and<br />
20 for each LEA serving children with disabilities (CWD). Any LEA not meeting targets on compliance indicators (0% for<br />
Indicators 4B, 09 & 10 and 100% for Indicators 11, 12, 13, and 20) are non-compliant with IDEA.<br />
There are no report changes for the 2010/11 school year profile; However, it is important to recognize that: .<br />
1. Indicator 01 (Graduation) is reported a year in arrear (2009/10 graduates) and is based on a four-year cohort. This<br />
means the rate is a measure of students who entered in ninth grade and graduate in four years. The calculation is a<br />
requirement under Title I of the Elementary and Secondary Education Act (ESEA).<br />
2. Indicator 02 (Drop out) is reported a year in arrear. This means the rate is a measure of students who dropped out in<br />
the 2009/10 school year. The Indicator 02 data are aligned with the Common Core of Data (CCD) requirements for<br />
grades 7-12.<br />
3. Indicator 04A and 4B (Suspension/Expulsion) is reported a year in arrear. This means the rate is a measure of<br />
students who had out-of-school suspensions and/or expulsions totaling more than 10 days.<br />
Percent of youth<br />
with IEPs<br />
graduating from<br />
high school with a<br />
regular diploma<br />
For a complete description of all the Indicators, please visit the special education website at<br />
http://arksped.k12.ar.us/sections/policy.html<br />
Indicator 01: Graduation Rates (2009/10 school year) Indicator 02: Dropout Rates (2009/10 school year)<br />
State<br />
Rate<br />
State<br />
Target<br />
75.76% 85.00%<br />
LEA<br />
Rate<br />
100.00%<br />
Target Met<br />
by LEA<br />
(Y/N)<br />
Y<br />
Percent of<br />
youth with<br />
IEPs dropping<br />
out of high<br />
school<br />
State<br />
Rate<br />
Indicator 03: Assessment on Statewide Benchmark Exam (grades 3-8, 11)<br />
A) Adequate Yearly Progress<br />
n=40<br />
Literacy<br />
Mathematics<br />
Met Disability Subgroup "n"<br />
for Reporting Purposes (Y/N)<br />
State Target for % of Districts Meeting<br />
AYP for Disability Subgroup<br />
State<br />
Target<br />
3.06% 4.20%<br />
LEA<br />
Rate<br />
0.00%<br />
% of Districts Meeting AYP<br />
for Disability Subgroup<br />
Target Met by<br />
LEA (Y/N)<br />
Y<br />
Target Met by<br />
LEA(Y/N)<br />
Overall N 17.15% 6.25%<br />
NA<br />
N<br />
N<br />
Note: For a district to qualify as having a disability subgroup it must have a minimum of 40 (n=40) students with disabilities in a school building.<br />
B) Participation<br />
Participation Rate: # of<br />
CWD Tested ÷ # of CWD<br />
Enrolled in grades tested.<br />
Participation Rate: Literacy<br />
Participation Rate: Math<br />
Note: - - denotes not applicable<br />
State<br />
Rate<br />
98.78%<br />
State<br />
Target<br />
95.00%<br />
LEA<br />
Rate<br />
96.97%<br />
Target Met<br />
by LEA (Y/N)<br />
98.61% 95.00% 96.97% Y<br />
Y<br />
C) Performance Proficiency<br />
Percent of CWD Scoring<br />
Proficient or Above<br />
Proficiency Rate: Literacy<br />
Proficiency Rate:<br />
Mathematics<br />
16.00%<br />
16.00%<br />
State<br />
Rate<br />
31.49%<br />
44.86%<br />
State<br />
Target<br />
45.22%<br />
51.14%<br />
LEA<br />
Rate<br />
23.08%<br />
26.92%<br />
NA<br />
NA<br />
Target<br />
Met by<br />
LEA (Y/N)<br />
N<br />
N<br />
Page 1 of 5
LEA: 6604 - HARTFORD SCHOOL <strong>DISTRICT</strong><br />
Indicator 04: Out-of-School Suspensions and Expulsions (2009/10 school year)<br />
A) Suspension/Expulsion<br />
Percent difference of CWD with out-of- school suspensions and<br />
expulsions totaling greater than 10 days in a school year as<br />
compared to the same data for general education students in<br />
the district.<br />
B) Suspension/Expulsion by Race and Ethnicity<br />
Percent of districts that have: (a) a significant discrepancy, by race or<br />
ethnicity, in the rate of suspensions and expulsions of greater than 10<br />
days in a school year for children with IEPs; and (b) policies,<br />
procedures or practices that contribute to the significant discrepancy<br />
and do not comply with requirements relating to the development<br />
and implementation of IEPs, the use of positive behavioral<br />
interventions and supports, and procedural safeguards.<br />
Indicator 05: School Age (5-21) Least Restrictive Environment<br />
A) In the Regular Class 80% or more of the day<br />
Percent of CWD with<br />
IEPs receiving instruction<br />
in the regular class 80%<br />
or more of the day.<br />
State<br />
Rate<br />
State<br />
Target<br />
LEA<br />
Rate<br />
B) In the Regular Class less than 40% of the day<br />
Percent of CWD with<br />
IEPs receiving instruction<br />
in the regular class less<br />
than 60% of the day.<br />
53.87% 59.77%<br />
State<br />
Rate<br />
State<br />
Target<br />
12.42% 12.51%<br />
55.74%<br />
LEA<br />
Rate<br />
11.48%<br />
C) Other Settings outside the regular class<br />
Percent of CWD with IEPs served in<br />
public or private separate schools,<br />
residential placements, or<br />
homebound/hospital placements.<br />
State<br />
Rate<br />
State<br />
Target<br />
2.80% 2.56%<br />
Target Met<br />
by LEA (Y/N)<br />
N<br />
Target Met<br />
by LEA (Y/N)<br />
Y<br />
LEA<br />
Rate<br />
1.64%<br />
Target Met<br />
by LEA(Y/N)<br />
Indicator 06: Early Childhood (3-5) Least Restrictive Environment<br />
A) Regular Early Childhood Program<br />
Percent of children (aged 3 through 5) with IEPs attending a regular<br />
early childhood program and receiving the majority of special<br />
education and related services in the regular early childhood program<br />
Allowable<br />
Difference<br />
LEA: 6604 - HARTFORD SCHOOL <strong>DISTRICT</strong><br />
Indicator 07: Preschool (3-5) Outcomes<br />
a) Percent of preschool CWD<br />
children who did not<br />
improve functioning.<br />
b) Percent of preschool CWD<br />
who improved but whose<br />
functioning remained below<br />
same age peers.<br />
c) Percent of preschool CWD<br />
who improved at a level<br />
nearer to same aged peers.<br />
d) Percent of preschool CWD<br />
who improved functioning to<br />
reach a level comparable to<br />
same age peers.<br />
e) Percent of preschool CWD<br />
children who maintain<br />
functioning at a level<br />
comparable to same aged<br />
peers.<br />
Summary<br />
Statements<br />
1) Of those preschool<br />
children who entered<br />
the preschool program<br />
below age expectations<br />
in each Outcome, the<br />
percent who<br />
substantially increased<br />
their rate of growth by<br />
the time they turned 6<br />
years of age or exited<br />
the program.<br />
2) The percent of<br />
preschool children who<br />
were functioning<br />
within age expectations<br />
in each Outcome by the<br />
time they turned 6<br />
years of age or exited<br />
A) Positive Social -Emotional<br />
Skills*<br />
State<br />
Rate<br />
A) Positive Social -<br />
Emotional Skills<br />
(Including social<br />
relationships)<br />
State<br />
Rate<br />
2.14%<br />
5.31%<br />
25.97%<br />
38.22%<br />
28.36%<br />
State<br />
Target<br />
LEA<br />
Rate<br />
LEA<br />
Rate<br />
— —<br />
— —<br />
— —<br />
— —<br />
— —<br />
Target<br />
Met by<br />
LEA(Y/N)<br />
B) Acquisition and Use of<br />
Knowledge and Skills<br />
(Including early language/<br />
communication and early literacy)<br />
B) Acquisition and Use of<br />
Knowledge and Skills **<br />
State<br />
Rate<br />
1.75%<br />
6.59%<br />
34.23%<br />
43.51%<br />
13.92%<br />
State<br />
Target<br />
LEA<br />
Rate<br />
Target<br />
Met by<br />
LEA(Y/N)<br />
C) Use of Appropriate Behaviors<br />
to Meet Their Needs<br />
State<br />
Rate<br />
State<br />
Target<br />
LEA<br />
Rate<br />
Target<br />
Met by<br />
LEA(Y/N)<br />
89.61% 90.50% — — N/A 90.31% 90.50% — — N/A 90.82% 92.50% — — N/A<br />
66.58% 69.50% — — N/A 57.43% 60.50% — — N/A 76.69% 78.50% — — N/A<br />
NOTE: * Including social relationships ** Including early language/ communication and early literacy<br />
Note: - - denotes not applicable<br />
State<br />
Rate<br />
LEA<br />
Rate<br />
— —<br />
— —<br />
— —<br />
— —<br />
— —<br />
C) Use of<br />
Appropriate<br />
Behaviors to<br />
Meet Their Needs<br />
State<br />
Rate<br />
4.51%<br />
17.34%<br />
41.72%<br />
34.97%<br />
LEA<br />
Rate<br />
1.46% — —<br />
— —<br />
— —<br />
— —<br />
— —<br />
Page 3 of 5
LEA: 6604 - HARTFORD SCHOOL <strong>DISTRICT</strong><br />
Indicator 08: Parent Involvement<br />
Percent of surveyed<br />
parents who reported<br />
school facilitated parent<br />
involvement as a means<br />
of improving services<br />
and results for children<br />
with disabilities.<br />
Early Childhood<br />
(3-5)<br />
School Age<br />
(5-21)<br />
State<br />
Rate<br />
90.47%<br />
95.05%<br />
Indicator 09: Disproportionality - Eligibility<br />
Disproportionate representation of racial<br />
and ethnic groups in special education and<br />
related services that is a result of<br />
inappropriate identification (e.g.<br />
monitoring data, review of policies,<br />
practices, and procedures under 618(d),<br />
etc.).<br />
State<br />
Rate<br />
State<br />
Target<br />
88.00%<br />
96.00%<br />
State<br />
Target<br />
0.00% 0.00%<br />
LEA<br />
Rate<br />
— —<br />
100.00%<br />
Indicator 10: Disproportionality-Child with a Disability<br />
Disproportionate representation of racial<br />
and ethnic groups in specific disability<br />
categories that is a result of inappropriate<br />
identification (e.g. monitoring data, review<br />
of policies, practices, and procedures under<br />
618(d), etc.).<br />
Indicator 11: Child Find<br />
Percent of children with<br />
parental consent to evaluate<br />
who are evaluated within<br />
the State established timeline<br />
of 60 days.<br />
Overall<br />
(3-21)<br />
Early Childhood<br />
(3-5)<br />
School Age<br />
(5-21)<br />
State<br />
Rate<br />
0.00%<br />
Indicator 12: Early Childhood Transition<br />
Percent of children referred by Part C prior to<br />
age 3, who are found eligible for Part B, and<br />
who have an IEP developed and implemented<br />
by their third birthday.<br />
Note: - - denotes not applicable<br />
State<br />
Rate<br />
99.41%<br />
99.70%<br />
98.97%<br />
State<br />
Rate<br />
State<br />
Target<br />
0.00%<br />
State<br />
Target<br />
100.00%<br />
100.00%<br />
100.00%<br />
State<br />
Target<br />
Target Met by<br />
LEA (Y/N)<br />
Y<br />
Target Met by<br />
LEA (Y/N)<br />
Y<br />
LEA<br />
Rate<br />
100.00%<br />
— —<br />
100.00%<br />
LEA<br />
Rate<br />
Target Met by<br />
LEA (Y/N)<br />
N/A<br />
Y<br />
Note: The target for Indicator 09 is to have zero percent<br />
(0%) of districts identified as having disproportionate<br />
representation as a result of inappropriate<br />
identification in eligibility.<br />
Note: The target for Indicator 10 is to have zero<br />
percent (0%) of districts identified as having<br />
disproportionate representation as a result of<br />
inappropriate identification in a disability<br />
category.<br />
Target Met by<br />
LEA (Y/N)<br />
N/A<br />
Y<br />
Target Met<br />
by LEA<br />
(Y/N)<br />
99.21% 100.00% - - N/A<br />
Y<br />
Note: * Indicates a zero reponse rate for the<br />
district.<br />
Page 4 of 5
LEA: 6604 - HARTFORD SCHOOL <strong>DISTRICT</strong><br />
Indicator 13: Secondary Transition<br />
Percent of youth with disabilities aged 16 and<br />
up with an IEP that includes coordinated,<br />
measurable, annual IEP goals and transition<br />
services that will reasonably enable the student<br />
to meet the post-secondary goals.<br />
Indicator 14: Post-School Outcomes<br />
A. Percent of youth enrolled in higher<br />
education within one year of leaving high<br />
school.<br />
State<br />
Rate<br />
State<br />
Target<br />
Note: Data for this Indicator is from the on-site monitoring of LEAs for the given year.<br />
B. Percent of youth enrolled in higher<br />
education or competitively employed<br />
within one year of leaving high school.<br />
C. Percent of youth enrolled in higher<br />
education or in some other postsecondary<br />
education or training program; or<br />
competitively employed or in some other<br />
employment within one year of leaving<br />
high school.<br />
State<br />
Rate<br />
Indicator 20: Reported Data-Timely and Accurate*<br />
District submitted<br />
required data elements<br />
on or before due dates;<br />
made revisions within<br />
the alloted reveiw<br />
periods.<br />
Accurate and Timely<br />
Data Submission<br />
Overall (3-21)<br />
Early Childhood (3-5)<br />
School Age (5-21)<br />
State<br />
Target<br />
100.00%<br />
100.00%<br />
100.00%<br />
State<br />
Target<br />
LEA<br />
Rate<br />
LEA<br />
Rate<br />
Target Met by<br />
LEA (Y/N)<br />
Target Met<br />
by LEA<br />
(Y/N)<br />
Target Met<br />
by LEA<br />
(Y/N)<br />
*Data reviewed for timely and accurate submissions included all APSCN cycle data except for personnel<br />
Note: - - denotes not applicable<br />
96.19 100.00 100.00% Y<br />
14.53<br />
State<br />
Rate<br />
49.42<br />
State<br />
Rate<br />
54.07<br />
13.00<br />
State<br />
Target<br />
49.00<br />
State<br />
Target<br />
60.00<br />
Y<br />
N/A<br />
Y<br />
— —<br />
LEA<br />
Rate<br />
— —<br />
LEA<br />
Rate<br />
— —<br />
N/A<br />
Target Met<br />
by LEA<br />
(Y/N)<br />
N/A<br />
Target Met<br />
by LEA<br />
(Y/N)<br />
N/A<br />
Page 5 of 5
LEA: 6605 - LAVACA SCHOOL <strong>DISTRICT</strong><br />
<strong>ARKANSAS</strong> <strong>SPECIAL</strong> <strong>EDUCATION</strong><br />
<strong>DISTRICT</strong> <strong>ANNUAL</strong> PERFORMANCE REPORT<br />
2010/11 School Year<br />
Publication Date: March 2012<br />
Each State must have in place a State Performance Plan (SPP) to evaluate the State's efforts to meet the requirements and<br />
purposes of the implementation of the Individuals with Disabilities Education Act (IDEA). The SPP is a six-year plan, which<br />
describes Arkansas's performance on 20 indicators. The Office of Special Education Programs in the U. S. Department of<br />
Education requires that States report annually to the public on the performance of each local education agency (LEA) on 14 of<br />
20 indicators as compared with targets established by the State in the SPP. Arkansas will report indicators 1 through 14 and<br />
20 for each LEA serving children with disabilities (CWD). Any LEA not meeting targets on compliance indicators (0% for<br />
Indicators 4B, 09 & 10 and 100% for Indicators 11, 12, 13, and 20) are non-compliant with IDEA.<br />
There are no report changes for the 2010/11 school year profile; However, it is important to recognize that: .<br />
1. Indicator 01 (Graduation) is reported a year in arrear (2009/10 graduates) and is based on a four-year cohort. This<br />
means the rate is a measure of students who entered in ninth grade and graduate in four years. The calculation is a<br />
requirement under Title I of the Elementary and Secondary Education Act (ESEA).<br />
2. Indicator 02 (Drop out) is reported a year in arrear. This means the rate is a measure of students who dropped out in<br />
the 2009/10 school year. The Indicator 02 data are aligned with the Common Core of Data (CCD) requirements for<br />
grades 7-12.<br />
3. Indicator 04A and 4B (Suspension/Expulsion) is reported a year in arrear. This means the rate is a measure of<br />
students who had out-of-school suspensions and/or expulsions totaling more than 10 days.<br />
Percent of youth<br />
with IEPs<br />
graduating from<br />
high school with a<br />
regular diploma<br />
For a complete description of all the Indicators, please visit the special education website at<br />
http://arksped.k12.ar.us/sections/policy.html<br />
Indicator 01: Graduation Rates (2009/10 school year) Indicator 02: Dropout Rates (2009/10 school year)<br />
State<br />
Rate<br />
State<br />
Target<br />
75.76% 85.00%<br />
LEA<br />
Rate<br />
44.44%<br />
Target Met<br />
by LEA<br />
(Y/N)<br />
N<br />
Percent of<br />
youth with<br />
IEPs dropping<br />
out of high<br />
school<br />
State<br />
Rate<br />
Indicator 03: Assessment on Statewide Benchmark Exam (grades 3-8, 11)<br />
A) Adequate Yearly Progress<br />
n=40<br />
Literacy<br />
Mathematics<br />
Met Disability Subgroup "n"<br />
for Reporting Purposes (Y/N)<br />
State Target for % of Districts Meeting<br />
AYP for Disability Subgroup<br />
State<br />
Target<br />
3.06% 4.20%<br />
LEA<br />
Rate<br />
0.00%<br />
% of Districts Meeting AYP<br />
for Disability Subgroup<br />
Target Met by<br />
LEA (Y/N)<br />
Y<br />
Target Met by<br />
LEA(Y/N)<br />
Overall N 17.15% 6.25%<br />
NA<br />
N<br />
N<br />
Note: For a district to qualify as having a disability subgroup it must have a minimum of 40 (n=40) students with disabilities in a school building.<br />
B) Participation<br />
Participation Rate: # of<br />
CWD Tested ÷ # of CWD<br />
Enrolled in grades tested.<br />
Participation Rate: Literacy<br />
Participation Rate: Math<br />
Note: - - denotes not applicable<br />
State<br />
Rate<br />
98.78%<br />
State<br />
Target<br />
95.00%<br />
LEA<br />
Rate<br />
95.92%<br />
Target Met<br />
by LEA (Y/N)<br />
98.61% 95.00% 95.92% Y<br />
Y<br />
C) Performance Proficiency<br />
Percent of CWD Scoring<br />
Proficient or Above<br />
Proficiency Rate: Literacy<br />
Proficiency Rate:<br />
Mathematics<br />
16.00%<br />
16.00%<br />
State<br />
Rate<br />
31.49%<br />
44.86%<br />
State<br />
Target<br />
45.22%<br />
51.14%<br />
LEA<br />
Rate<br />
25.58%<br />
41.30%<br />
NA<br />
NA<br />
Target<br />
Met by<br />
LEA (Y/N)<br />
N<br />
N<br />
Page 1 of 5
LEA: 6605 - LAVACA SCHOOL <strong>DISTRICT</strong><br />
Indicator 04: Out-of-School Suspensions and Expulsions (2009/10 school year)<br />
A) Suspension/Expulsion<br />
Percent difference of CWD with out-of- school suspensions and<br />
expulsions totaling greater than 10 days in a school year as<br />
compared to the same data for general education students in<br />
the district.<br />
B) Suspension/Expulsion by Race and Ethnicity<br />
Percent of districts that have: (a) a significant discrepancy, by race or<br />
ethnicity, in the rate of suspensions and expulsions of greater than 10<br />
days in a school year for children with IEPs; and (b) policies,<br />
procedures or practices that contribute to the significant discrepancy<br />
and do not comply with requirements relating to the development<br />
and implementation of IEPs, the use of positive behavioral<br />
interventions and supports, and procedural safeguards.<br />
Indicator 05: School Age (5-21) Least Restrictive Environment<br />
A) In the Regular Class 80% or more of the day<br />
Percent of CWD with<br />
IEPs receiving instruction<br />
in the regular class 80%<br />
or more of the day.<br />
State<br />
Rate<br />
State<br />
Target<br />
LEA<br />
Rate<br />
B) In the Regular Class less than 40% of the day<br />
Percent of CWD with<br />
IEPs receiving instruction<br />
in the regular class less<br />
than 60% of the day.<br />
53.87% 59.77%<br />
State<br />
Rate<br />
State<br />
Target<br />
12.42% 12.51%<br />
55.56%<br />
LEA<br />
Rate<br />
13.33%<br />
C) Other Settings outside the regular class<br />
Percent of CWD with IEPs served in<br />
public or private separate schools,<br />
residential placements, or<br />
homebound/hospital placements.<br />
State<br />
Rate<br />
State<br />
Target<br />
2.80% 2.56%<br />
Target Met<br />
by LEA (Y/N)<br />
N<br />
Target Met<br />
by LEA (Y/N)<br />
N<br />
LEA<br />
Rate<br />
1.11%<br />
Target Met<br />
by LEA(Y/N)<br />
Indicator 06: Early Childhood (3-5) Least Restrictive Environment<br />
A) Regular Early Childhood Program<br />
Percent of children (aged 3 through 5) with IEPs attending a regular<br />
early childhood program and receiving the majority of special<br />
education and related services in the regular early childhood program<br />
Allowable<br />
Difference<br />
LEA: 6605 - LAVACA SCHOOL <strong>DISTRICT</strong><br />
Indicator 07: Preschool (3-5) Outcomes<br />
a) Percent of preschool CWD<br />
children who did not<br />
improve functioning.<br />
b) Percent of preschool CWD<br />
who improved but whose<br />
functioning remained below<br />
same age peers.<br />
c) Percent of preschool CWD<br />
who improved at a level<br />
nearer to same aged peers.<br />
d) Percent of preschool CWD<br />
who improved functioning to<br />
reach a level comparable to<br />
same age peers.<br />
e) Percent of preschool CWD<br />
children who maintain<br />
functioning at a level<br />
comparable to same aged<br />
peers.<br />
Summary<br />
Statements<br />
1) Of those preschool<br />
children who entered<br />
the preschool program<br />
below age expectations<br />
in each Outcome, the<br />
percent who<br />
substantially increased<br />
their rate of growth by<br />
the time they turned 6<br />
years of age or exited<br />
the program.<br />
2) The percent of<br />
preschool children who<br />
were functioning<br />
within age expectations<br />
in each Outcome by the<br />
time they turned 6<br />
years of age or exited<br />
A) Positive Social -Emotional<br />
Skills*<br />
State<br />
Rate<br />
A) Positive Social -<br />
Emotional Skills<br />
(Including social<br />
relationships)<br />
State<br />
Rate<br />
2.14%<br />
5.31%<br />
25.97%<br />
38.22%<br />
28.36%<br />
State<br />
Target<br />
LEA<br />
Rate<br />
LEA<br />
Rate<br />
— —<br />
— —<br />
— —<br />
— —<br />
— —<br />
Target<br />
Met by<br />
LEA(Y/N)<br />
B) Acquisition and Use of<br />
Knowledge and Skills<br />
(Including early language/<br />
communication and early literacy)<br />
B) Acquisition and Use of<br />
Knowledge and Skills **<br />
State<br />
Rate<br />
1.75%<br />
6.59%<br />
34.23%<br />
43.51%<br />
13.92%<br />
State<br />
Target<br />
LEA<br />
Rate<br />
Target<br />
Met by<br />
LEA(Y/N)<br />
C) Use of Appropriate Behaviors<br />
to Meet Their Needs<br />
State<br />
Rate<br />
State<br />
Target<br />
LEA<br />
Rate<br />
Target<br />
Met by<br />
LEA(Y/N)<br />
89.61% 90.50% — — N/A 90.31% 90.50% — — N/A 90.82% 92.50% — — N/A<br />
66.58% 69.50% — — N/A 57.43% 60.50% — — N/A 76.69% 78.50% — — N/A<br />
NOTE: * Including social relationships ** Including early language/ communication and early literacy<br />
Note: - - denotes not applicable<br />
State<br />
Rate<br />
LEA<br />
Rate<br />
— —<br />
— —<br />
— —<br />
— —<br />
— —<br />
C) Use of<br />
Appropriate<br />
Behaviors to<br />
Meet Their Needs<br />
State<br />
Rate<br />
4.51%<br />
17.34%<br />
41.72%<br />
34.97%<br />
LEA<br />
Rate<br />
1.46% — —<br />
— —<br />
— —<br />
— —<br />
— —<br />
Page 3 of 5
LEA: 6605 - LAVACA SCHOOL <strong>DISTRICT</strong><br />
Indicator 08: Parent Involvement<br />
Percent of surveyed<br />
parents who reported<br />
school facilitated parent<br />
involvement as a means<br />
of improving services<br />
and results for children<br />
with disabilities.<br />
Early Childhood<br />
(3-5)<br />
School Age<br />
(5-21)<br />
State<br />
Rate<br />
90.47%<br />
95.05%<br />
Indicator 09: Disproportionality - Eligibility<br />
Disproportionate representation of racial<br />
and ethnic groups in special education and<br />
related services that is a result of<br />
inappropriate identification (e.g.<br />
monitoring data, review of policies,<br />
practices, and procedures under 618(d),<br />
etc.).<br />
State<br />
Rate<br />
State<br />
Target<br />
88.00%<br />
96.00%<br />
State<br />
Target<br />
0.00% 0.00%<br />
LEA<br />
Rate<br />
— —<br />
98.21%<br />
Indicator 10: Disproportionality-Child with a Disability<br />
Disproportionate representation of racial<br />
and ethnic groups in specific disability<br />
categories that is a result of inappropriate<br />
identification (e.g. monitoring data, review<br />
of policies, practices, and procedures under<br />
618(d), etc.).<br />
Indicator 11: Child Find<br />
Percent of children with<br />
parental consent to evaluate<br />
who are evaluated within<br />
the State established timeline<br />
of 60 days.<br />
Overall<br />
(3-21)<br />
Early Childhood<br />
(3-5)<br />
School Age<br />
(5-21)<br />
State<br />
Rate<br />
0.00%<br />
Indicator 12: Early Childhood Transition<br />
Percent of children referred by Part C prior to<br />
age 3, who are found eligible for Part B, and<br />
who have an IEP developed and implemented<br />
by their third birthday.<br />
Note: - - denotes not applicable<br />
State<br />
Rate<br />
99.41%<br />
99.70%<br />
98.97%<br />
State<br />
Rate<br />
State<br />
Target<br />
0.00%<br />
State<br />
Target<br />
100.00%<br />
100.00%<br />
100.00%<br />
State<br />
Target<br />
Target Met by<br />
LEA (Y/N)<br />
Y<br />
Target Met by<br />
LEA (Y/N)<br />
Y<br />
LEA<br />
Rate<br />
100.00%<br />
— —<br />
100.00%<br />
LEA<br />
Rate<br />
Target Met by<br />
LEA (Y/N)<br />
N/A<br />
Y<br />
Note: The target for Indicator 09 is to have zero percent<br />
(0%) of districts identified as having disproportionate<br />
representation as a result of inappropriate<br />
identification in eligibility.<br />
Note: The target for Indicator 10 is to have zero<br />
percent (0%) of districts identified as having<br />
disproportionate representation as a result of<br />
inappropriate identification in a disability<br />
category.<br />
Target Met by<br />
LEA (Y/N)<br />
N/A<br />
Y<br />
Target Met<br />
by LEA<br />
(Y/N)<br />
99.21% 100.00% - - N/A<br />
Y<br />
Note: * Indicates a zero reponse rate for the<br />
district.<br />
Page 4 of 5
LEA: 6605 - LAVACA SCHOOL <strong>DISTRICT</strong><br />
Indicator 13: Secondary Transition<br />
Percent of youth with disabilities aged 16 and<br />
up with an IEP that includes coordinated,<br />
measurable, annual IEP goals and transition<br />
services that will reasonably enable the student<br />
to meet the post-secondary goals.<br />
Indicator 14: Post-School Outcomes<br />
A. Percent of youth enrolled in higher<br />
education within one year of leaving high<br />
school.<br />
State<br />
Rate<br />
State<br />
Target<br />
Note: Data for this Indicator is from the on-site monitoring of LEAs for the given year.<br />
B. Percent of youth enrolled in higher<br />
education or competitively employed<br />
within one year of leaving high school.<br />
C. Percent of youth enrolled in higher<br />
education or in some other postsecondary<br />
education or training program; or<br />
competitively employed or in some other<br />
employment within one year of leaving<br />
high school.<br />
State<br />
Rate<br />
Indicator 20: Reported Data-Timely and Accurate*<br />
District submitted<br />
required data elements<br />
on or before due dates;<br />
made revisions within<br />
the alloted reveiw<br />
periods.<br />
Accurate and Timely<br />
Data Submission<br />
Overall (3-21)<br />
Early Childhood (3-5)<br />
School Age (5-21)<br />
State<br />
Target<br />
100.00%<br />
100.00%<br />
100.00%<br />
State<br />
Target<br />
LEA<br />
Rate<br />
LEA<br />
Rate<br />
Target Met by<br />
LEA (Y/N)<br />
Target Met<br />
by LEA<br />
(Y/N)<br />
Target Met<br />
by LEA<br />
(Y/N)<br />
*Data reviewed for timely and accurate submissions included all APSCN cycle data except for personnel<br />
Note: - - denotes not applicable<br />
96.19 100.00 — — N/A<br />
14.53<br />
State<br />
Rate<br />
49.42<br />
State<br />
Rate<br />
54.07<br />
13.00<br />
State<br />
Target<br />
49.00<br />
State<br />
Target<br />
60.00<br />
Y<br />
N/A<br />
Y<br />
— —<br />
LEA<br />
Rate<br />
— —<br />
LEA<br />
Rate<br />
— —<br />
N/A<br />
Target Met<br />
by LEA<br />
(Y/N)<br />
N/A<br />
Target Met<br />
by LEA<br />
(Y/N)<br />
N/A<br />
Page 5 of 5
LEA: 6606 - MANSFIELD SCHOOL <strong>DISTRICT</strong><br />
<strong>ARKANSAS</strong> <strong>SPECIAL</strong> <strong>EDUCATION</strong><br />
<strong>DISTRICT</strong> <strong>ANNUAL</strong> PERFORMANCE REPORT<br />
2010/11 School Year<br />
Publication Date: March 2012<br />
Each State must have in place a State Performance Plan (SPP) to evaluate the State's efforts to meet the requirements and<br />
purposes of the implementation of the Individuals with Disabilities Education Act (IDEA). The SPP is a six-year plan, which<br />
describes Arkansas's performance on 20 indicators. The Office of Special Education Programs in the U. S. Department of<br />
Education requires that States report annually to the public on the performance of each local education agency (LEA) on 14 of<br />
20 indicators as compared with targets established by the State in the SPP. Arkansas will report indicators 1 through 14 and<br />
20 for each LEA serving children with disabilities (CWD). Any LEA not meeting targets on compliance indicators (0% for<br />
Indicators 4B, 09 & 10 and 100% for Indicators 11, 12, 13, and 20) are non-compliant with IDEA.<br />
There are no report changes for the 2010/11 school year profile; However, it is important to recognize that: .<br />
1. Indicator 01 (Graduation) is reported a year in arrear (2009/10 graduates) and is based on a four-year cohort. This<br />
means the rate is a measure of students who entered in ninth grade and graduate in four years. The calculation is a<br />
requirement under Title I of the Elementary and Secondary Education Act (ESEA).<br />
2. Indicator 02 (Drop out) is reported a year in arrear. This means the rate is a measure of students who dropped out in<br />
the 2009/10 school year. The Indicator 02 data are aligned with the Common Core of Data (CCD) requirements for<br />
grades 7-12.<br />
3. Indicator 04A and 4B (Suspension/Expulsion) is reported a year in arrear. This means the rate is a measure of<br />
students who had out-of-school suspensions and/or expulsions totaling more than 10 days.<br />
Percent of youth<br />
with IEPs<br />
graduating from<br />
high school with a<br />
regular diploma<br />
For a complete description of all the Indicators, please visit the special education website at<br />
http://arksped.k12.ar.us/sections/policy.html<br />
Indicator 01: Graduation Rates (2009/10 school year) Indicator 02: Dropout Rates (2009/10 school year)<br />
State<br />
Rate<br />
State<br />
Target<br />
75.76% 85.00%<br />
LEA<br />
Rate<br />
91.67%<br />
Target Met<br />
by LEA<br />
(Y/N)<br />
Y<br />
Percent of<br />
youth with<br />
IEPs dropping<br />
out of high<br />
school<br />
State<br />
Rate<br />
Indicator 03: Assessment on Statewide Benchmark Exam (grades 3-8, 11)<br />
A) Adequate Yearly Progress<br />
n=40<br />
Literacy<br />
Mathematics<br />
Met Disability Subgroup "n"<br />
for Reporting Purposes (Y/N)<br />
State Target for % of Districts Meeting<br />
AYP for Disability Subgroup<br />
State<br />
Target<br />
3.06% 4.20%<br />
LEA<br />
Rate<br />
0.00%<br />
% of Districts Meeting AYP<br />
for Disability Subgroup<br />
Target Met by<br />
LEA (Y/N)<br />
Y<br />
Target Met by<br />
LEA(Y/N)<br />
Overall N 17.15% 6.25%<br />
NA<br />
N<br />
N<br />
Note: For a district to qualify as having a disability subgroup it must have a minimum of 40 (n=40) students with disabilities in a school building.<br />
B) Participation<br />
Participation Rate: # of<br />
CWD Tested ÷ # of CWD<br />
Enrolled in grades tested.<br />
Participation Rate: Literacy<br />
Participation Rate: Math<br />
Note: - - denotes not applicable<br />
State<br />
Rate<br />
98.78%<br />
State<br />
Target<br />
95.00%<br />
LEA<br />
Rate<br />
100.00%<br />
Target Met<br />
by LEA (Y/N)<br />
98.61% 95.00% 100.00% Y<br />
Y<br />
C) Performance Proficiency<br />
Percent of CWD Scoring<br />
Proficient or Above<br />
Proficiency Rate: Literacy<br />
Proficiency Rate:<br />
Mathematics<br />
16.00%<br />
16.00%<br />
State<br />
Rate<br />
31.49%<br />
44.86%<br />
State<br />
Target<br />
45.22%<br />
51.14%<br />
LEA<br />
Rate<br />
19.23%<br />
31.25%<br />
NA<br />
NA<br />
Target<br />
Met by<br />
LEA (Y/N)<br />
N<br />
N<br />
Page 1 of 5
LEA: 6606 - MANSFIELD SCHOOL <strong>DISTRICT</strong><br />
Indicator 04: Out-of-School Suspensions and Expulsions (2009/10 school year)<br />
A) Suspension/Expulsion<br />
Percent difference of CWD with out-of- school suspensions and<br />
expulsions totaling greater than 10 days in a school year as<br />
compared to the same data for general education students in<br />
the district.<br />
B) Suspension/Expulsion by Race and Ethnicity<br />
Percent of districts that have: (a) a significant discrepancy, by race or<br />
ethnicity, in the rate of suspensions and expulsions of greater than 10<br />
days in a school year for children with IEPs; and (b) policies,<br />
procedures or practices that contribute to the significant discrepancy<br />
and do not comply with requirements relating to the development<br />
and implementation of IEPs, the use of positive behavioral<br />
interventions and supports, and procedural safeguards.<br />
Indicator 05: School Age (5-21) Least Restrictive Environment<br />
A) In the Regular Class 80% or more of the day<br />
Percent of CWD with<br />
IEPs receiving instruction<br />
in the regular class 80%<br />
or more of the day.<br />
State<br />
Rate<br />
State<br />
Target<br />
LEA<br />
Rate<br />
B) In the Regular Class less than 40% of the day<br />
Percent of CWD with<br />
IEPs receiving instruction<br />
in the regular class less<br />
than 60% of the day.<br />
53.87% 59.77%<br />
State<br />
Rate<br />
State<br />
Target<br />
12.42% 12.51%<br />
66.96%<br />
LEA<br />
Rate<br />
9.82%<br />
C) Other Settings outside the regular class<br />
Percent of CWD with IEPs served in<br />
public or private separate schools,<br />
residential placements, or<br />
homebound/hospital placements.<br />
State<br />
Rate<br />
State<br />
Target<br />
2.80% 2.56%<br />
Target Met<br />
by LEA (Y/N)<br />
Y<br />
Target Met<br />
by LEA (Y/N)<br />
Y<br />
LEA<br />
Rate<br />
0.00%<br />
Target Met<br />
by LEA(Y/N)<br />
Indicator 06: Early Childhood (3-5) Least Restrictive Environment<br />
A) Regular Early Childhood Program<br />
Percent of children (aged 3 through 5) with IEPs attending a regular<br />
early childhood program and receiving the majority of special<br />
education and related services in the regular early childhood program<br />
Allowable<br />
Difference<br />
LEA: 6606 - MANSFIELD SCHOOL <strong>DISTRICT</strong><br />
Indicator 07: Preschool (3-5) Outcomes<br />
a) Percent of preschool CWD<br />
children who did not<br />
improve functioning.<br />
b) Percent of preschool CWD<br />
who improved but whose<br />
functioning remained below<br />
same age peers.<br />
c) Percent of preschool CWD<br />
who improved at a level<br />
nearer to same aged peers.<br />
d) Percent of preschool CWD<br />
who improved functioning to<br />
reach a level comparable to<br />
same age peers.<br />
e) Percent of preschool CWD<br />
children who maintain<br />
functioning at a level<br />
comparable to same aged<br />
peers.<br />
Summary<br />
Statements<br />
1) Of those preschool<br />
children who entered<br />
the preschool program<br />
below age expectations<br />
in each Outcome, the<br />
percent who<br />
substantially increased<br />
their rate of growth by<br />
the time they turned 6<br />
years of age or exited<br />
the program.<br />
2) The percent of<br />
preschool children who<br />
were functioning<br />
within age expectations<br />
in each Outcome by the<br />
time they turned 6<br />
years of age or exited<br />
A) Positive Social -Emotional<br />
Skills*<br />
State<br />
Rate<br />
A) Positive Social -<br />
Emotional Skills<br />
(Including social<br />
relationships)<br />
State<br />
Rate<br />
2.14%<br />
5.31%<br />
25.97%<br />
38.22%<br />
28.36%<br />
State<br />
Target<br />
LEA<br />
Rate<br />
LEA<br />
Rate<br />
— —<br />
— —<br />
— —<br />
— —<br />
— —<br />
Target<br />
Met by<br />
LEA(Y/N)<br />
B) Acquisition and Use of<br />
Knowledge and Skills<br />
(Including early language/<br />
communication and early literacy)<br />
B) Acquisition and Use of<br />
Knowledge and Skills **<br />
State<br />
Rate<br />
1.75%<br />
6.59%<br />
34.23%<br />
43.51%<br />
13.92%<br />
State<br />
Target<br />
LEA<br />
Rate<br />
Target<br />
Met by<br />
LEA(Y/N)<br />
C) Use of Appropriate Behaviors<br />
to Meet Their Needs<br />
State<br />
Rate<br />
State<br />
Target<br />
LEA<br />
Rate<br />
Target<br />
Met by<br />
LEA(Y/N)<br />
89.61% 90.50% — — N/A 90.31% 90.50% — — N/A 90.82% 92.50% — — N/A<br />
66.58% 69.50% — — N/A 57.43% 60.50% — — N/A 76.69% 78.50% — — N/A<br />
NOTE: * Including social relationships ** Including early language/ communication and early literacy<br />
Note: - - denotes not applicable<br />
State<br />
Rate<br />
LEA<br />
Rate<br />
— —<br />
— —<br />
— —<br />
— —<br />
— —<br />
C) Use of<br />
Appropriate<br />
Behaviors to<br />
Meet Their Needs<br />
State<br />
Rate<br />
4.51%<br />
17.34%<br />
41.72%<br />
34.97%<br />
LEA<br />
Rate<br />
1.46% — —<br />
— —<br />
— —<br />
— —<br />
— —<br />
Page 3 of 5
LEA: 6606 - MANSFIELD SCHOOL <strong>DISTRICT</strong><br />
Indicator 08: Parent Involvement<br />
Percent of surveyed<br />
parents who reported<br />
school facilitated parent<br />
involvement as a means<br />
of improving services<br />
and results for children<br />
with disabilities.<br />
Early Childhood<br />
(3-5)<br />
School Age<br />
(5-21)<br />
State<br />
Rate<br />
90.47%<br />
95.05%<br />
Indicator 09: Disproportionality - Eligibility<br />
Disproportionate representation of racial<br />
and ethnic groups in special education and<br />
related services that is a result of<br />
inappropriate identification (e.g.<br />
monitoring data, review of policies,<br />
practices, and procedures under 618(d),<br />
etc.).<br />
State<br />
Rate<br />
State<br />
Target<br />
88.00%<br />
96.00%<br />
State<br />
Target<br />
0.00% 0.00%<br />
LEA<br />
Rate<br />
— —<br />
100.00%<br />
Indicator 10: Disproportionality-Child with a Disability<br />
Disproportionate representation of racial<br />
and ethnic groups in specific disability<br />
categories that is a result of inappropriate<br />
identification (e.g. monitoring data, review<br />
of policies, practices, and procedures under<br />
618(d), etc.).<br />
Indicator 11: Child Find<br />
Percent of children with<br />
parental consent to evaluate<br />
who are evaluated within<br />
the State established timeline<br />
of 60 days.<br />
Overall<br />
(3-21)<br />
Early Childhood<br />
(3-5)<br />
School Age<br />
(5-21)<br />
State<br />
Rate<br />
0.00%<br />
Indicator 12: Early Childhood Transition<br />
Percent of children referred by Part C prior to<br />
age 3, who are found eligible for Part B, and<br />
who have an IEP developed and implemented<br />
by their third birthday.<br />
Note: - - denotes not applicable<br />
State<br />
Rate<br />
99.41%<br />
99.70%<br />
98.97%<br />
State<br />
Rate<br />
State<br />
Target<br />
0.00%<br />
State<br />
Target<br />
100.00%<br />
100.00%<br />
100.00%<br />
State<br />
Target<br />
Target Met by<br />
LEA (Y/N)<br />
Y<br />
Target Met by<br />
LEA (Y/N)<br />
Y<br />
LEA<br />
Rate<br />
100.00%<br />
— —<br />
100.00%<br />
LEA<br />
Rate<br />
Target Met by<br />
LEA (Y/N)<br />
N/A<br />
Y<br />
Note: The target for Indicator 09 is to have zero percent<br />
(0%) of districts identified as having disproportionate<br />
representation as a result of inappropriate<br />
identification in eligibility.<br />
Note: The target for Indicator 10 is to have zero<br />
percent (0%) of districts identified as having<br />
disproportionate representation as a result of<br />
inappropriate identification in a disability<br />
category.<br />
Target Met by<br />
LEA (Y/N)<br />
N/A<br />
Y<br />
Target Met<br />
by LEA<br />
(Y/N)<br />
99.21% 100.00% - - N/A<br />
Y<br />
Note: * Indicates a zero reponse rate for the<br />
district.<br />
Page 4 of 5
LEA: 6606 - MANSFIELD SCHOOL <strong>DISTRICT</strong><br />
Indicator 13: Secondary Transition<br />
Percent of youth with disabilities aged 16 and<br />
up with an IEP that includes coordinated,<br />
measurable, annual IEP goals and transition<br />
services that will reasonably enable the student<br />
to meet the post-secondary goals.<br />
Indicator 14: Post-School Outcomes<br />
A. Percent of youth enrolled in higher<br />
education within one year of leaving high<br />
school.<br />
State<br />
Rate<br />
State<br />
Target<br />
Note: Data for this Indicator is from the on-site monitoring of LEAs for the given year.<br />
B. Percent of youth enrolled in higher<br />
education or competitively employed<br />
within one year of leaving high school.<br />
C. Percent of youth enrolled in higher<br />
education or in some other postsecondary<br />
education or training program; or<br />
competitively employed or in some other<br />
employment within one year of leaving<br />
high school.<br />
State<br />
Rate<br />
Indicator 20: Reported Data-Timely and Accurate*<br />
District submitted<br />
required data elements<br />
on or before due dates;<br />
made revisions within<br />
the alloted reveiw<br />
periods.<br />
Accurate and Timely<br />
Data Submission<br />
Overall (3-21)<br />
Early Childhood (3-5)<br />
School Age (5-21)<br />
State<br />
Target<br />
100.00%<br />
100.00%<br />
100.00%<br />
State<br />
Target<br />
LEA<br />
Rate<br />
LEA<br />
Rate<br />
Target Met by<br />
LEA (Y/N)<br />
Target Met<br />
by LEA<br />
(Y/N)<br />
Target Met<br />
by LEA<br />
(Y/N)<br />
*Data reviewed for timely and accurate submissions included all APSCN cycle data except for personnel<br />
Note: - - denotes not applicable<br />
96.19 100.00 100.00% Y<br />
14.53<br />
State<br />
Rate<br />
49.42<br />
State<br />
Rate<br />
54.07<br />
13.00<br />
State<br />
Target<br />
49.00<br />
State<br />
Target<br />
60.00<br />
Y<br />
N/A<br />
Y<br />
— —<br />
LEA<br />
Rate<br />
— —<br />
LEA<br />
Rate<br />
— —<br />
N/A<br />
Target Met<br />
by LEA<br />
(Y/N)<br />
N/A<br />
Target Met<br />
by LEA<br />
(Y/N)<br />
N/A<br />
Page 5 of 5
LEA: 6701 - DEQUEEN SCHOOL <strong>DISTRICT</strong><br />
<strong>ARKANSAS</strong> <strong>SPECIAL</strong> <strong>EDUCATION</strong><br />
<strong>DISTRICT</strong> <strong>ANNUAL</strong> PERFORMANCE REPORT<br />
2010/11 School Year<br />
Publication Date: March 2012<br />
Each State must have in place a State Performance Plan (SPP) to evaluate the State's efforts to meet the requirements and<br />
purposes of the implementation of the Individuals with Disabilities Education Act (IDEA). The SPP is a six-year plan, which<br />
describes Arkansas's performance on 20 indicators. The Office of Special Education Programs in the U. S. Department of<br />
Education requires that States report annually to the public on the performance of each local education agency (LEA) on 14 of<br />
20 indicators as compared with targets established by the State in the SPP. Arkansas will report indicators 1 through 14 and<br />
20 for each LEA serving children with disabilities (CWD). Any LEA not meeting targets on compliance indicators (0% for<br />
Indicators 4B, 09 & 10 and 100% for Indicators 11, 12, 13, and 20) are non-compliant with IDEA.<br />
There are no report changes for the 2010/11 school year profile; However, it is important to recognize that: .<br />
1. Indicator 01 (Graduation) is reported a year in arrear (2009/10 graduates) and is based on a four-year cohort. This<br />
means the rate is a measure of students who entered in ninth grade and graduate in four years. The calculation is a<br />
requirement under Title I of the Elementary and Secondary Education Act (ESEA).<br />
2. Indicator 02 (Drop out) is reported a year in arrear. This means the rate is a measure of students who dropped out in<br />
the 2009/10 school year. The Indicator 02 data are aligned with the Common Core of Data (CCD) requirements for<br />
grades 7-12.<br />
3. Indicator 04A and 4B (Suspension/Expulsion) is reported a year in arrear. This means the rate is a measure of<br />
students who had out-of-school suspensions and/or expulsions totaling more than 10 days.<br />
Percent of youth<br />
with IEPs<br />
graduating from<br />
high school with a<br />
regular diploma<br />
For a complete description of all the Indicators, please visit the special education website at<br />
http://arksped.k12.ar.us/sections/policy.html<br />
Indicator 01: Graduation Rates (2009/10 school year) Indicator 02: Dropout Rates (2009/10 school year)<br />
State<br />
Rate<br />
State<br />
Target<br />
75.76% 85.00%<br />
LEA<br />
Rate<br />
78.95%<br />
Target Met<br />
by LEA<br />
(Y/N)<br />
N<br />
Percent of<br />
youth with<br />
IEPs dropping<br />
out of high<br />
school<br />
State<br />
Rate<br />
Indicator 03: Assessment on Statewide Benchmark Exam (grades 3-8, 11)<br />
A) Adequate Yearly Progress<br />
n=40<br />
Literacy<br />
Mathematics<br />
Met Disability Subgroup "n"<br />
for Reporting Purposes (Y/N)<br />
State Target for % of Districts Meeting<br />
AYP for Disability Subgroup<br />
State<br />
Target<br />
3.06% 4.20%<br />
LEA<br />
Rate<br />
0.00%<br />
% of Districts Meeting AYP<br />
for Disability Subgroup<br />
Target Met by<br />
LEA (Y/N)<br />
Y<br />
Target Met by<br />
LEA(Y/N)<br />
Overall N 17.15% 6.25%<br />
NA<br />
N<br />
N<br />
Note: For a district to qualify as having a disability subgroup it must have a minimum of 40 (n=40) students with disabilities in a school building.<br />
B) Participation<br />
Participation Rate: # of<br />
CWD Tested ÷ # of CWD<br />
Enrolled in grades tested.<br />
Participation Rate: Literacy<br />
Participation Rate: Math<br />
Note: - - denotes not applicable<br />
State<br />
Rate<br />
98.78%<br />
State<br />
Target<br />
95.00%<br />
LEA<br />
Rate<br />
97.96%<br />
Target Met<br />
by LEA (Y/N)<br />
98.61% 95.00% 98.94% Y<br />
Y<br />
C) Performance Proficiency<br />
Percent of CWD Scoring<br />
Proficient or Above<br />
Proficiency Rate: Literacy<br />
Proficiency Rate:<br />
Mathematics<br />
16.00%<br />
16.00%<br />
State<br />
Rate<br />
31.49%<br />
44.86%<br />
State<br />
Target<br />
45.22%<br />
51.14%<br />
LEA<br />
Rate<br />
37.08%<br />
47.67%<br />
NA<br />
NA<br />
Target<br />
Met by<br />
LEA (Y/N)<br />
N<br />
N<br />
Page 1 of 5
LEA: 6701 - DEQUEEN SCHOOL <strong>DISTRICT</strong><br />
Indicator 04: Out-of-School Suspensions and Expulsions (2009/10 school year)<br />
A) Suspension/Expulsion<br />
Percent difference of CWD with out-of- school suspensions and<br />
expulsions totaling greater than 10 days in a school year as<br />
compared to the same data for general education students in<br />
the district.<br />
B) Suspension/Expulsion by Race and Ethnicity<br />
Percent of districts that have: (a) a significant discrepancy, by race or<br />
ethnicity, in the rate of suspensions and expulsions of greater than 10<br />
days in a school year for children with IEPs; and (b) policies,<br />
procedures or practices that contribute to the significant discrepancy<br />
and do not comply with requirements relating to the development<br />
and implementation of IEPs, the use of positive behavioral<br />
interventions and supports, and procedural safeguards.<br />
Indicator 05: School Age (5-21) Least Restrictive Environment<br />
A) In the Regular Class 80% or more of the day<br />
Percent of CWD with<br />
IEPs receiving instruction<br />
in the regular class 80%<br />
or more of the day.<br />
State<br />
Rate<br />
State<br />
Target<br />
LEA<br />
Rate<br />
B) In the Regular Class less than 40% of the day<br />
Percent of CWD with<br />
IEPs receiving instruction<br />
in the regular class less<br />
than 60% of the day.<br />
53.87% 59.77%<br />
State<br />
Rate<br />
State<br />
Target<br />
12.42% 12.51%<br />
43.84%<br />
LEA<br />
Rate<br />
10.84%<br />
C) Other Settings outside the regular class<br />
Percent of CWD with IEPs served in<br />
public or private separate schools,<br />
residential placements, or<br />
homebound/hospital placements.<br />
State<br />
Rate<br />
State<br />
Target<br />
2.80% 2.56%<br />
Target Met<br />
by LEA (Y/N)<br />
N<br />
Target Met<br />
by LEA (Y/N)<br />
Y<br />
LEA<br />
Rate<br />
1.48%<br />
Target Met<br />
by LEA(Y/N)<br />
Indicator 06: Early Childhood (3-5) Least Restrictive Environment<br />
A) Regular Early Childhood Program<br />
Percent of children (aged 3 through 5) with IEPs attending a regular<br />
early childhood program and receiving the majority of special<br />
education and related services in the regular early childhood program<br />
Allowable<br />
Difference<br />
LEA: 6701 - DEQUEEN SCHOOL <strong>DISTRICT</strong><br />
Indicator 07: Preschool (3-5) Outcomes<br />
a) Percent of preschool CWD<br />
children who did not<br />
improve functioning.<br />
b) Percent of preschool CWD<br />
who improved but whose<br />
functioning remained below<br />
same age peers.<br />
c) Percent of preschool CWD<br />
who improved at a level<br />
nearer to same aged peers.<br />
d) Percent of preschool CWD<br />
who improved functioning to<br />
reach a level comparable to<br />
same age peers.<br />
e) Percent of preschool CWD<br />
children who maintain<br />
functioning at a level<br />
comparable to same aged<br />
peers.<br />
Summary<br />
Statements<br />
1) Of those preschool<br />
children who entered<br />
the preschool program<br />
below age expectations<br />
in each Outcome, the<br />
percent who<br />
substantially increased<br />
their rate of growth by<br />
the time they turned 6<br />
years of age or exited<br />
the program.<br />
2) The percent of<br />
preschool children who<br />
were functioning<br />
within age expectations<br />
in each Outcome by the<br />
time they turned 6<br />
years of age or exited<br />
A) Positive Social -Emotional<br />
Skills*<br />
State<br />
Rate<br />
A) Positive Social -<br />
Emotional Skills<br />
(Including social<br />
relationships)<br />
State<br />
Rate<br />
2.14%<br />
5.31%<br />
25.97%<br />
38.22%<br />
28.36%<br />
State<br />
Target<br />
LEA<br />
Rate<br />
LEA<br />
Rate<br />
— —<br />
— —<br />
— —<br />
— —<br />
— —<br />
Target<br />
Met by<br />
LEA(Y/N)<br />
B) Acquisition and Use of<br />
Knowledge and Skills<br />
(Including early language/<br />
communication and early literacy)<br />
B) Acquisition and Use of<br />
Knowledge and Skills **<br />
State<br />
Rate<br />
1.75%<br />
6.59%<br />
34.23%<br />
43.51%<br />
13.92%<br />
State<br />
Target<br />
LEA<br />
Rate<br />
Target<br />
Met by<br />
LEA(Y/N)<br />
C) Use of Appropriate Behaviors<br />
to Meet Their Needs<br />
State<br />
Rate<br />
State<br />
Target<br />
LEA<br />
Rate<br />
Target<br />
Met by<br />
LEA(Y/N)<br />
89.61% 90.50% — — N/A 90.31% 90.50% — — N/A 90.82% 92.50% — — N/A<br />
66.58% 69.50% — — N/A 57.43% 60.50% — — N/A 76.69% 78.50% — — N/A<br />
NOTE: * Including social relationships ** Including early language/ communication and early literacy<br />
Note: - - denotes not applicable<br />
State<br />
Rate<br />
LEA<br />
Rate<br />
— —<br />
— —<br />
— —<br />
— —<br />
— —<br />
C) Use of<br />
Appropriate<br />
Behaviors to<br />
Meet Their Needs<br />
State<br />
Rate<br />
4.51%<br />
17.34%<br />
41.72%<br />
34.97%<br />
LEA<br />
Rate<br />
1.46% — —<br />
— —<br />
— —<br />
— —<br />
— —<br />
Page 3 of 5
LEA: 6701 - DEQUEEN SCHOOL <strong>DISTRICT</strong><br />
Indicator 08: Parent Involvement<br />
Percent of surveyed<br />
parents who reported<br />
school facilitated parent<br />
involvement as a means<br />
of improving services<br />
and results for children<br />
with disabilities.<br />
Early Childhood<br />
(3-5)<br />
School Age<br />
(5-21)<br />
State<br />
Rate<br />
90.47%<br />
95.05%<br />
Indicator 09: Disproportionality - Eligibility<br />
Disproportionate representation of racial<br />
and ethnic groups in special education and<br />
related services that is a result of<br />
inappropriate identification (e.g.<br />
monitoring data, review of policies,<br />
practices, and procedures under 618(d),<br />
etc.).<br />
State<br />
Rate<br />
State<br />
Target<br />
88.00%<br />
96.00%<br />
State<br />
Target<br />
0.00% 0.00%<br />
LEA<br />
Rate<br />
— —<br />
99.15%<br />
Indicator 10: Disproportionality-Child with a Disability<br />
Disproportionate representation of racial<br />
and ethnic groups in specific disability<br />
categories that is a result of inappropriate<br />
identification (e.g. monitoring data, review<br />
of policies, practices, and procedures under<br />
618(d), etc.).<br />
Indicator 11: Child Find<br />
Percent of children with<br />
parental consent to evaluate<br />
who are evaluated within<br />
the State established timeline<br />
of 60 days.<br />
Overall<br />
(3-21)<br />
Early Childhood<br />
(3-5)<br />
School Age<br />
(5-21)<br />
State<br />
Rate<br />
0.00%<br />
Indicator 12: Early Childhood Transition<br />
Percent of children referred by Part C prior to<br />
age 3, who are found eligible for Part B, and<br />
who have an IEP developed and implemented<br />
by their third birthday.<br />
Note: - - denotes not applicable<br />
State<br />
Rate<br />
99.41%<br />
99.70%<br />
98.97%<br />
State<br />
Rate<br />
State<br />
Target<br />
0.00%<br />
State<br />
Target<br />
100.00%<br />
100.00%<br />
100.00%<br />
State<br />
Target<br />
Target Met by<br />
LEA (Y/N)<br />
Y<br />
Target Met by<br />
LEA (Y/N)<br />
Y<br />
LEA<br />
Rate<br />
100.00%<br />
— —<br />
100.00%<br />
LEA<br />
Rate<br />
Target Met by<br />
LEA (Y/N)<br />
N/A<br />
Y<br />
Note: The target for Indicator 09 is to have zero percent<br />
(0%) of districts identified as having disproportionate<br />
representation as a result of inappropriate<br />
identification in eligibility.<br />
Note: The target for Indicator 10 is to have zero<br />
percent (0%) of districts identified as having<br />
disproportionate representation as a result of<br />
inappropriate identification in a disability<br />
category.<br />
Target Met by<br />
LEA (Y/N)<br />
N/A<br />
Y<br />
Target Met<br />
by LEA<br />
(Y/N)<br />
99.21% 100.00% - - N/A<br />
Y<br />
Note: * Indicates a zero reponse rate for the<br />
district.<br />
Page 4 of 5
LEA: 6701 - DEQUEEN SCHOOL <strong>DISTRICT</strong><br />
Indicator 13: Secondary Transition<br />
Percent of youth with disabilities aged 16 and<br />
up with an IEP that includes coordinated,<br />
measurable, annual IEP goals and transition<br />
services that will reasonably enable the student<br />
to meet the post-secondary goals.<br />
Indicator 14: Post-School Outcomes<br />
A. Percent of youth enrolled in higher<br />
education within one year of leaving high<br />
school.<br />
State<br />
Rate<br />
State<br />
Target<br />
Note: Data for this Indicator is from the on-site monitoring of LEAs for the given year.<br />
B. Percent of youth enrolled in higher<br />
education or competitively employed<br />
within one year of leaving high school.<br />
C. Percent of youth enrolled in higher<br />
education or in some other postsecondary<br />
education or training program; or<br />
competitively employed or in some other<br />
employment within one year of leaving<br />
high school.<br />
State<br />
Rate<br />
Indicator 20: Reported Data-Timely and Accurate*<br />
District submitted<br />
required data elements<br />
on or before due dates;<br />
made revisions within<br />
the alloted reveiw<br />
periods.<br />
Accurate and Timely<br />
Data Submission<br />
Overall (3-21)<br />
Early Childhood (3-5)<br />
School Age (5-21)<br />
State<br />
Target<br />
100.00%<br />
100.00%<br />
100.00%<br />
State<br />
Target<br />
LEA<br />
Rate<br />
LEA<br />
Rate<br />
Target Met by<br />
LEA (Y/N)<br />
Target Met<br />
by LEA<br />
(Y/N)<br />
Target Met<br />
by LEA<br />
(Y/N)<br />
*Data reviewed for timely and accurate submissions included all APSCN cycle data except for personnel<br />
Note: - - denotes not applicable<br />
96.19 100.00 — — N/A<br />
14.53<br />
State<br />
Rate<br />
49.42<br />
State<br />
Rate<br />
54.07<br />
13.00<br />
State<br />
Target<br />
49.00<br />
State<br />
Target<br />
60.00<br />
Y<br />
N/A<br />
Y<br />
— —<br />
LEA<br />
Rate<br />
— —<br />
LEA<br />
Rate<br />
— —<br />
N/A<br />
Target Met<br />
by LEA<br />
(Y/N)<br />
N/A<br />
Target Met<br />
by LEA<br />
(Y/N)<br />
N/A<br />
Page 5 of 5
LEA: 6703 - HORATIO SCHOOL <strong>DISTRICT</strong><br />
<strong>ARKANSAS</strong> <strong>SPECIAL</strong> <strong>EDUCATION</strong><br />
<strong>DISTRICT</strong> <strong>ANNUAL</strong> PERFORMANCE REPORT<br />
2010/11 School Year<br />
Publication Date: March 2012<br />
Each State must have in place a State Performance Plan (SPP) to evaluate the State's efforts to meet the requirements and<br />
purposes of the implementation of the Individuals with Disabilities Education Act (IDEA). The SPP is a six-year plan, which<br />
describes Arkansas's performance on 20 indicators. The Office of Special Education Programs in the U. S. Department of<br />
Education requires that States report annually to the public on the performance of each local education agency (LEA) on 14 of<br />
20 indicators as compared with targets established by the State in the SPP. Arkansas will report indicators 1 through 14 and<br />
20 for each LEA serving children with disabilities (CWD). Any LEA not meeting targets on compliance indicators (0% for<br />
Indicators 4B, 09 & 10 and 100% for Indicators 11, 12, 13, and 20) are non-compliant with IDEA.<br />
There are no report changes for the 2010/11 school year profile; However, it is important to recognize that: .<br />
1. Indicator 01 (Graduation) is reported a year in arrear (2009/10 graduates) and is based on a four-year cohort. This<br />
means the rate is a measure of students who entered in ninth grade and graduate in four years. The calculation is a<br />
requirement under Title I of the Elementary and Secondary Education Act (ESEA).<br />
2. Indicator 02 (Drop out) is reported a year in arrear. This means the rate is a measure of students who dropped out in<br />
the 2009/10 school year. The Indicator 02 data are aligned with the Common Core of Data (CCD) requirements for<br />
grades 7-12.<br />
3. Indicator 04A and 4B (Suspension/Expulsion) is reported a year in arrear. This means the rate is a measure of<br />
students who had out-of-school suspensions and/or expulsions totaling more than 10 days.<br />
Percent of youth<br />
with IEPs<br />
graduating from<br />
high school with a<br />
regular diploma<br />
For a complete description of all the Indicators, please visit the special education website at<br />
http://arksped.k12.ar.us/sections/policy.html<br />
Indicator 01: Graduation Rates (2009/10 school year) Indicator 02: Dropout Rates (2009/10 school year)<br />
State<br />
Rate<br />
State<br />
Target<br />
75.76% 85.00%<br />
LEA<br />
Rate<br />
83.33%<br />
Target Met<br />
by LEA<br />
(Y/N)<br />
N<br />
Percent of<br />
youth with<br />
IEPs dropping<br />
out of high<br />
school<br />
State<br />
Rate<br />
Indicator 03: Assessment on Statewide Benchmark Exam (grades 3-8, 11)<br />
A) Adequate Yearly Progress<br />
n=40<br />
Literacy<br />
Mathematics<br />
Met Disability Subgroup "n"<br />
for Reporting Purposes (Y/N)<br />
State Target for % of Districts Meeting<br />
AYP for Disability Subgroup<br />
State<br />
Target<br />
3.06% 4.20%<br />
LEA<br />
Rate<br />
0.00%<br />
% of Districts Meeting AYP<br />
for Disability Subgroup<br />
Target Met by<br />
LEA (Y/N)<br />
Y<br />
Target Met by<br />
LEA(Y/N)<br />
Overall N 17.15% 6.25%<br />
NA<br />
N<br />
N<br />
Note: For a district to qualify as having a disability subgroup it must have a minimum of 40 (n=40) students with disabilities in a school building.<br />
B) Participation<br />
Participation Rate: # of<br />
CWD Tested ÷ # of CWD<br />
Enrolled in grades tested.<br />
Participation Rate: Literacy<br />
Participation Rate: Math<br />
Note: - - denotes not applicable<br />
State<br />
Rate<br />
98.78%<br />
State<br />
Target<br />
95.00%<br />
LEA<br />
Rate<br />
100.00%<br />
Target Met<br />
by LEA (Y/N)<br />
98.61% 95.00% 100.00% Y<br />
Y<br />
C) Performance Proficiency<br />
Percent of CWD Scoring<br />
Proficient or Above<br />
Proficiency Rate: Literacy<br />
Proficiency Rate:<br />
Mathematics<br />
16.00%<br />
16.00%<br />
State<br />
Rate<br />
31.49%<br />
44.86%<br />
State<br />
Target<br />
45.22%<br />
51.14%<br />
LEA<br />
Rate<br />
19.51%<br />
39.53%<br />
NA<br />
NA<br />
Target<br />
Met by<br />
LEA (Y/N)<br />
N<br />
N<br />
Page 1 of 5
LEA: 6703 - HORATIO SCHOOL <strong>DISTRICT</strong><br />
Indicator 04: Out-of-School Suspensions and Expulsions (2009/10 school year)<br />
A) Suspension/Expulsion<br />
Percent difference of CWD with out-of- school suspensions and<br />
expulsions totaling greater than 10 days in a school year as<br />
compared to the same data for general education students in<br />
the district.<br />
B) Suspension/Expulsion by Race and Ethnicity<br />
Percent of districts that have: (a) a significant discrepancy, by race or<br />
ethnicity, in the rate of suspensions and expulsions of greater than 10<br />
days in a school year for children with IEPs; and (b) policies,<br />
procedures or practices that contribute to the significant discrepancy<br />
and do not comply with requirements relating to the development<br />
and implementation of IEPs, the use of positive behavioral<br />
interventions and supports, and procedural safeguards.<br />
Indicator 05: School Age (5-21) Least Restrictive Environment<br />
A) In the Regular Class 80% or more of the day<br />
Percent of CWD with<br />
IEPs receiving instruction<br />
in the regular class 80%<br />
or more of the day.<br />
State<br />
Rate<br />
State<br />
Target<br />
LEA<br />
Rate<br />
B) In the Regular Class less than 40% of the day<br />
Percent of CWD with<br />
IEPs receiving instruction<br />
in the regular class less<br />
than 60% of the day.<br />
53.87% 59.77%<br />
State<br />
Rate<br />
State<br />
Target<br />
12.42% 12.51%<br />
54.95%<br />
LEA<br />
Rate<br />
0.00%<br />
C) Other Settings outside the regular class<br />
Percent of CWD with IEPs served in<br />
public or private separate schools,<br />
residential placements, or<br />
homebound/hospital placements.<br />
State<br />
Rate<br />
State<br />
Target<br />
2.80% 2.56%<br />
Target Met<br />
by LEA (Y/N)<br />
N<br />
Target Met<br />
by LEA (Y/N)<br />
Y<br />
LEA<br />
Rate<br />
0.00%<br />
Target Met<br />
by LEA(Y/N)<br />
Indicator 06: Early Childhood (3-5) Least Restrictive Environment<br />
A) Regular Early Childhood Program<br />
Percent of children (aged 3 through 5) with IEPs attending a regular<br />
early childhood program and receiving the majority of special<br />
education and related services in the regular early childhood program<br />
Allowable<br />
Difference<br />
LEA: 6703 - HORATIO SCHOOL <strong>DISTRICT</strong><br />
Indicator 07: Preschool (3-5) Outcomes<br />
a) Percent of preschool CWD<br />
children who did not<br />
improve functioning.<br />
b) Percent of preschool CWD<br />
who improved but whose<br />
functioning remained below<br />
same age peers.<br />
c) Percent of preschool CWD<br />
who improved at a level<br />
nearer to same aged peers.<br />
d) Percent of preschool CWD<br />
who improved functioning to<br />
reach a level comparable to<br />
same age peers.<br />
e) Percent of preschool CWD<br />
children who maintain<br />
functioning at a level<br />
comparable to same aged<br />
peers.<br />
Summary<br />
Statements<br />
1) Of those preschool<br />
children who entered<br />
the preschool program<br />
below age expectations<br />
in each Outcome, the<br />
percent who<br />
substantially increased<br />
their rate of growth by<br />
the time they turned 6<br />
years of age or exited<br />
the program.<br />
2) The percent of<br />
preschool children who<br />
were functioning<br />
within age expectations<br />
in each Outcome by the<br />
time they turned 6<br />
years of age or exited<br />
A) Positive Social -Emotional<br />
Skills*<br />
State<br />
Rate<br />
A) Positive Social -<br />
Emotional Skills<br />
(Including social<br />
relationships)<br />
State<br />
Rate<br />
2.14%<br />
5.31%<br />
25.97%<br />
38.22%<br />
28.36%<br />
State<br />
Target<br />
LEA<br />
Rate<br />
LEA<br />
Rate<br />
— —<br />
— —<br />
— —<br />
— —<br />
— —<br />
Target<br />
Met by<br />
LEA(Y/N)<br />
B) Acquisition and Use of<br />
Knowledge and Skills<br />
(Including early language/<br />
communication and early literacy)<br />
B) Acquisition and Use of<br />
Knowledge and Skills **<br />
State<br />
Rate<br />
1.75%<br />
6.59%<br />
34.23%<br />
43.51%<br />
13.92%<br />
State<br />
Target<br />
LEA<br />
Rate<br />
Target<br />
Met by<br />
LEA(Y/N)<br />
C) Use of Appropriate Behaviors<br />
to Meet Their Needs<br />
State<br />
Rate<br />
State<br />
Target<br />
LEA<br />
Rate<br />
Target<br />
Met by<br />
LEA(Y/N)<br />
89.61% 90.50% — — N/A 90.31% 90.50% — — N/A 90.82% 92.50% — — N/A<br />
66.58% 69.50% — — N/A 57.43% 60.50% — — N/A 76.69% 78.50% — — N/A<br />
NOTE: * Including social relationships ** Including early language/ communication and early literacy<br />
Note: - - denotes not applicable<br />
State<br />
Rate<br />
LEA<br />
Rate<br />
— —<br />
— —<br />
— —<br />
— —<br />
— —<br />
C) Use of<br />
Appropriate<br />
Behaviors to<br />
Meet Their Needs<br />
State<br />
Rate<br />
4.51%<br />
17.34%<br />
41.72%<br />
34.97%<br />
LEA<br />
Rate<br />
1.46% — —<br />
— —<br />
— —<br />
— —<br />
— —<br />
Page 3 of 5
LEA: 6703 - HORATIO SCHOOL <strong>DISTRICT</strong><br />
Indicator 08: Parent Involvement<br />
Percent of surveyed<br />
parents who reported<br />
school facilitated parent<br />
involvement as a means<br />
of improving services<br />
and results for children<br />
with disabilities.<br />
Early Childhood<br />
(3-5)<br />
School Age<br />
(5-21)<br />
State<br />
Rate<br />
90.47%<br />
95.05%<br />
Indicator 09: Disproportionality - Eligibility<br />
Disproportionate representation of racial<br />
and ethnic groups in special education and<br />
related services that is a result of<br />
inappropriate identification (e.g.<br />
monitoring data, review of policies,<br />
practices, and procedures under 618(d),<br />
etc.).<br />
State<br />
Rate<br />
State<br />
Target<br />
88.00%<br />
96.00%<br />
State<br />
Target<br />
0.00% 0.00%<br />
LEA<br />
Rate<br />
— —<br />
100.00%<br />
Indicator 10: Disproportionality-Child with a Disability<br />
Disproportionate representation of racial<br />
and ethnic groups in specific disability<br />
categories that is a result of inappropriate<br />
identification (e.g. monitoring data, review<br />
of policies, practices, and procedures under<br />
618(d), etc.).<br />
Indicator 11: Child Find<br />
Percent of children with<br />
parental consent to evaluate<br />
who are evaluated within<br />
the State established timeline<br />
of 60 days.<br />
Overall<br />
(3-21)<br />
Early Childhood<br />
(3-5)<br />
School Age<br />
(5-21)<br />
State<br />
Rate<br />
0.00%<br />
Indicator 12: Early Childhood Transition<br />
Percent of children referred by Part C prior to<br />
age 3, who are found eligible for Part B, and<br />
who have an IEP developed and implemented<br />
by their third birthday.<br />
Note: - - denotes not applicable<br />
State<br />
Rate<br />
99.41%<br />
99.70%<br />
98.97%<br />
State<br />
Rate<br />
State<br />
Target<br />
0.00%<br />
State<br />
Target<br />
100.00%<br />
100.00%<br />
100.00%<br />
State<br />
Target<br />
Target Met by<br />
LEA (Y/N)<br />
Y<br />
Target Met by<br />
LEA (Y/N)<br />
Y<br />
LEA<br />
Rate<br />
100.00%<br />
— —<br />
100.00%<br />
LEA<br />
Rate<br />
Target Met by<br />
LEA (Y/N)<br />
N/A<br />
Y<br />
Note: The target for Indicator 09 is to have zero percent<br />
(0%) of districts identified as having disproportionate<br />
representation as a result of inappropriate<br />
identification in eligibility.<br />
Note: The target for Indicator 10 is to have zero<br />
percent (0%) of districts identified as having<br />
disproportionate representation as a result of<br />
inappropriate identification in a disability<br />
category.<br />
Target Met by<br />
LEA (Y/N)<br />
N/A<br />
Y<br />
Target Met<br />
by LEA<br />
(Y/N)<br />
99.21% 100.00% - - N/A<br />
Y<br />
Note: * Indicates a zero reponse rate for the<br />
district.<br />
Page 4 of 5
LEA: 6703 - HORATIO SCHOOL <strong>DISTRICT</strong><br />
Indicator 13: Secondary Transition<br />
Percent of youth with disabilities aged 16 and<br />
up with an IEP that includes coordinated,<br />
measurable, annual IEP goals and transition<br />
services that will reasonably enable the student<br />
to meet the post-secondary goals.<br />
Indicator 14: Post-School Outcomes<br />
A. Percent of youth enrolled in higher<br />
education within one year of leaving high<br />
school.<br />
State<br />
Rate<br />
State<br />
Target<br />
Note: Data for this Indicator is from the on-site monitoring of LEAs for the given year.<br />
B. Percent of youth enrolled in higher<br />
education or competitively employed<br />
within one year of leaving high school.<br />
C. Percent of youth enrolled in higher<br />
education or in some other postsecondary<br />
education or training program; or<br />
competitively employed or in some other<br />
employment within one year of leaving<br />
high school.<br />
State<br />
Rate<br />
Indicator 20: Reported Data-Timely and Accurate*<br />
District submitted<br />
required data elements<br />
on or before due dates;<br />
made revisions within<br />
the alloted reveiw<br />
periods.<br />
Accurate and Timely<br />
Data Submission<br />
Overall (3-21)<br />
Early Childhood (3-5)<br />
School Age (5-21)<br />
State<br />
Target<br />
100.00%<br />
100.00%<br />
100.00%<br />
State<br />
Target<br />
LEA<br />
Rate<br />
LEA<br />
Rate<br />
Target Met by<br />
LEA (Y/N)<br />
Target Met<br />
by LEA<br />
(Y/N)<br />
Target Met<br />
by LEA<br />
(Y/N)<br />
*Data reviewed for timely and accurate submissions included all APSCN cycle data except for personnel<br />
Note: - - denotes not applicable<br />
96.19 100.00 100.00% Y<br />
14.53<br />
State<br />
Rate<br />
49.42<br />
State<br />
Rate<br />
54.07<br />
13.00<br />
State<br />
Target<br />
49.00<br />
State<br />
Target<br />
60.00<br />
Y<br />
N/A<br />
Y<br />
— —<br />
LEA<br />
Rate<br />
— —<br />
LEA<br />
Rate<br />
— —<br />
N/A<br />
Target Met<br />
by LEA<br />
(Y/N)<br />
N/A<br />
Target Met<br />
by LEA<br />
(Y/N)<br />
N/A<br />
Page 5 of 5
<strong>ARKANSAS</strong> <strong>SPECIAL</strong> <strong>EDUCATION</strong><br />
<strong>DISTRICT</strong> <strong>ANNUAL</strong> PERFORMANCE REPORT<br />
2010/11 School Year<br />
Publication Date: March 2012<br />
Each State must have in place a State Performance Plan (SPP) to evaluate the State's efforts to meet the requirements and<br />
purposes of the implementation of the Individuals with Disabilities Education Act (IDEA). The SPP is a six-year plan, which<br />
describes Arkansas's performance on 20 indicators. The Office of Special Education Programs in the U. S. Department of<br />
Education requires that States report annually to the public on the performance of each local education agency (LEA) on 14 of<br />
20 indicators as compared with targets established by the State in the SPP. Arkansas will report indicators 1 through 14 and<br />
20 for each LEA serving children with disabilities (CWD). Any LEA not meeting targets on compliance indicators (0% for<br />
Indicators 4B, 09 & 10 and 100% for Indicators 11, 12, 13, and 20) are non-compliant with IDEA.<br />
There are no report changes for the 2010/11 school year profile; However, it is important to recognize that: .<br />
1. Indicator 01 (Graduation) is reported a year in arrear (2009/10 graduates) and is based on a four-year cohort. This<br />
means the rate is a measure of students who entered in ninth grade and graduate in four years. The calculation is a<br />
requirement under Title I of the Elementary and Secondary Education Act (ESEA).<br />
2. Indicator 02 (Drop out) is reported a year in arrear. This means the rate is a measure of students who dropped out in<br />
the 2009/10 school year. The Indicator 02 data are aligned with the Common Core of Data (CCD) requirements for<br />
grades 7-12.<br />
3. Indicator 04A and 4B (Suspension/Expulsion) is reported a year in arrear. This means the rate is a measure of<br />
students who had out-of-school suspensions and/or expulsions totaling more than 10 days.<br />
For a complete description of all the Indicators, please visit the special education website at<br />
http://arksped.k12.ar.us/sections/policy.html<br />
LEA: 6720 - DEQUEEN/MENA <strong>EDUCATION</strong>AL CO-OP<br />
Indicator 01: Graduation Rates (2009/10 school year) Indicator 02: Dropout Rates (2009/10 school year)<br />
Percent of youth<br />
with IEPs<br />
graduating from<br />
high school with a<br />
regular diploma<br />
State<br />
Rate<br />
State<br />
Target<br />
75.76% 85.00%<br />
LEA<br />
Rate<br />
— —<br />
Target Met<br />
by LEA<br />
(Y/N)<br />
NA<br />
Percent of<br />
youth with<br />
IEPs dropping<br />
out of high<br />
school<br />
State<br />
Rate<br />
Indicator 03: Assessment on Statewide Benchmark Exam (grades 3-8, 11)<br />
A) Adequate Yearly Progress<br />
n=40<br />
Literacy<br />
Mathematics<br />
Met Disability Subgroup "n"<br />
for Reporting Purposes (Y/N)<br />
State Target for % of Districts Meeting<br />
AYP for Disability Subgroup<br />
State<br />
Target<br />
3.06% 4.20%<br />
LEA<br />
Rate<br />
— —<br />
% of Districts Meeting AYP<br />
for Disability Subgroup<br />
Target Met by<br />
LEA (Y/N)<br />
N/A<br />
Target Met by<br />
LEA(Y/N)<br />
Overall N/A 17.15% 6.25%<br />
N/A<br />
N/A<br />
N/A<br />
Note: For a district to qualify as having a disability subgroup it must have a minimum of 40 (n=40) students with disabilities in a school building.<br />
B) Participation<br />
Participation Rate: # of<br />
CWD Tested ÷ # of CWD<br />
Enrolled in grades tested.<br />
Participation Rate: Literacy<br />
Participation Rate: Math<br />
Note: - - denotes not applicable<br />
State<br />
Rate<br />
98.78%<br />
State<br />
Target<br />
95.00%<br />
LEA<br />
Rate<br />
— —<br />
Target Met<br />
by LEA (Y/N)<br />
N/A<br />
98.61% 95.00% — — N/A<br />
C) Performance Proficiency<br />
Percent of CWD Scoring<br />
Proficient or Above<br />
Proficiency Rate: Literacy<br />
Proficiency Rate:<br />
Mathematics<br />
16.00%<br />
16.00%<br />
State<br />
Rate<br />
31.49%<br />
44.86%<br />
State<br />
Target<br />
45.22%<br />
51.14%<br />
LEA<br />
Rate<br />
— —<br />
— —<br />
N/A<br />
N/A<br />
Target<br />
Met by<br />
LEA (Y/N)<br />
N/A<br />
N/A<br />
Page 1 of 5
LEA: 6720 - DEQUEEN/MENA <strong>EDUCATION</strong>AL CO-OP<br />
Indicator 04: Out-of-School Suspensions and Expulsions (2009/10 school year)<br />
A) Suspension/Expulsion<br />
Percent difference of CWD with out-of- school suspensions and<br />
expulsions totaling greater than 10 days in a school year as<br />
compared to the same data for general education students in<br />
the district.<br />
B) Suspension/Expulsion by Race and Ethnicity<br />
Percent of districts that have: (a) a significant discrepancy, by race or<br />
ethnicity, in the rate of suspensions and expulsions of greater than 10<br />
days in a school year for children with IEPs; and (b) policies,<br />
procedures or practices that contribute to the significant discrepancy<br />
and do not comply with requirements relating to the development<br />
and implementation of IEPs, the use of positive behavioral<br />
interventions and supports, and procedural safeguards.<br />
Indicator 05: School Age (5-21) Least Restrictive Environment<br />
A) In the Regular Class 80% or more of the day<br />
Percent of CWD with<br />
IEPs receiving instruction<br />
in the regular class 80%<br />
or more of the day.<br />
State<br />
Rate<br />
State<br />
Target<br />
LEA<br />
Rate<br />
B) In the Regular Class less than 40% of the day<br />
Percent of CWD with<br />
IEPs receiving instruction<br />
in the regular class less<br />
than 60% of the day.<br />
53.87% 59.77%<br />
State<br />
Rate<br />
State<br />
Target<br />
12.42% 12.51%<br />
— —<br />
LEA<br />
Rate<br />
— —<br />
C) Other Settings outside the regular class<br />
Percent of CWD with IEPs served in<br />
public or private separate schools,<br />
residential placements, or<br />
homebound/hospital placements.<br />
State<br />
Rate<br />
State<br />
Target<br />
2.80% 2.56%<br />
Target Met<br />
by LEA (Y/N)<br />
N/A<br />
Target Met<br />
by LEA (Y/N)<br />
N/A<br />
LEA<br />
Rate<br />
— —<br />
Target Met<br />
by LEA(Y/N)<br />
N/A<br />
Indicator 06: Early Childhood (3-5) Least Restrictive Environment<br />
A) Regular Early Childhood Program<br />
Percent of children (aged 3 through 5) with IEPs attending a regular<br />
early childhood program and receiving the majority of special<br />
education and related services in the regular early childhood program<br />
Allowable<br />
Difference<br />
LEA: 6720 - DEQUEEN/MENA <strong>EDUCATION</strong>AL CO-OP<br />
Indicator 07: Preschool (3-5) Outcomes<br />
a) Percent of preschool CWD<br />
children who did not<br />
improve functioning.<br />
b) Percent of preschool CWD<br />
who improved but whose<br />
functioning remained below<br />
same age peers.<br />
c) Percent of preschool CWD<br />
who improved at a level<br />
nearer to same aged peers.<br />
d) Percent of preschool CWD<br />
who improved functioning to<br />
reach a level comparable to<br />
same age peers.<br />
e) Percent of preschool CWD<br />
children who maintain<br />
functioning at a level<br />
comparable to same aged<br />
peers.<br />
Summary<br />
Statements<br />
1) Of those preschool<br />
children who entered<br />
the preschool program<br />
below age expectations<br />
in each Outcome, the<br />
percent who<br />
substantially increased<br />
their rate of growth by<br />
the time they turned 6<br />
years of age or exited<br />
the program.<br />
2) The percent of<br />
preschool children who<br />
were functioning<br />
within age expectations<br />
in each Outcome by the<br />
time they turned 6<br />
years of age or exited<br />
A) Positive Social -Emotional<br />
Skills*<br />
State<br />
Rate<br />
A) Positive Social -<br />
Emotional Skills<br />
(Including social<br />
relationships)<br />
State<br />
Rate<br />
2.14%<br />
5.31%<br />
25.97%<br />
38.22%<br />
28.36%<br />
State<br />
Target<br />
LEA<br />
Rate<br />
LEA<br />
Rate<br />
— —<br />
1.53%<br />
19.08%<br />
52.67%<br />
26.72%<br />
Target<br />
Met by<br />
LEA(Y/N)<br />
B) Acquisition and Use of<br />
Knowledge and Skills<br />
(Including early language/<br />
communication and early literacy)<br />
B) Acquisition and Use of<br />
Knowledge and Skills **<br />
State<br />
Rate<br />
1.75%<br />
6.59%<br />
34.23%<br />
43.51%<br />
13.92%<br />
State<br />
Target<br />
LEA<br />
Rate<br />
Target<br />
Met by<br />
LEA(Y/N)<br />
C) Use of Appropriate Behaviors<br />
to Meet Their Needs<br />
State<br />
Rate<br />
State<br />
Target<br />
LEA<br />
Rate<br />
Target<br />
Met by<br />
LEA(Y/N)<br />
89.61% 90.50% 97.92% Y 90.31% 90.50% 96.72% Y 90.82% 92.50% 97.65% Y<br />
66.58% 69.50% 79.39% Y 57.43% 60.50% 53.44% N 76.69% 78.50% 92.37% Y<br />
NOTE: * Including social relationships ** Including early language/ communication and early literacy<br />
Note: - - denotes not applicable<br />
State<br />
Rate<br />
LEA<br />
Rate<br />
— —<br />
3.05%<br />
43.51%<br />
46.56%<br />
6.87%<br />
C) Use of<br />
Appropriate<br />
Behaviors to<br />
Meet Their Needs<br />
State<br />
Rate<br />
4.51%<br />
17.34%<br />
41.72%<br />
34.97%<br />
LEA<br />
Rate<br />
1.46% — —<br />
1.53%<br />
6.11%<br />
57.25%<br />
35.11%<br />
Page 3 of 5
LEA: 6720 - DEQUEEN/MENA <strong>EDUCATION</strong>AL CO-OP<br />
Indicator 08: Parent Involvement<br />
Percent of surveyed<br />
parents who reported<br />
school facilitated parent<br />
involvement as a means<br />
of improving services<br />
and results for children<br />
with disabilities.<br />
Early Childhood<br />
(3-5)<br />
School Age<br />
(5-21)<br />
State<br />
Rate<br />
90.47%<br />
95.05%<br />
Indicator 09: Disproportionality - Eligibility<br />
Disproportionate representation of racial<br />
and ethnic groups in special education and<br />
related services that is a result of<br />
inappropriate identification (e.g.<br />
monitoring data, review of policies,<br />
practices, and procedures under 618(d),<br />
etc.).<br />
State<br />
Rate<br />
State<br />
Target<br />
88.00%<br />
96.00%<br />
State<br />
Target<br />
0.00% 0.00%<br />
LEA<br />
Rate<br />
82.65%<br />
— —<br />
Indicator 10: Disproportionality-Child with a Disability<br />
Disproportionate representation of racial<br />
and ethnic groups in specific disability<br />
categories that is a result of inappropriate<br />
identification (e.g. monitoring data, review<br />
of policies, practices, and procedures under<br />
618(d), etc.).<br />
Indicator 11: Child Find<br />
Percent of children with<br />
parental consent to evaluate<br />
who are evaluated within<br />
the State established timeline<br />
of 60 days.<br />
Overall<br />
(3-21)<br />
Early Childhood<br />
(3-5)<br />
School Age<br />
(5-21)<br />
State<br />
Rate<br />
0.00%<br />
Indicator 12: Early Childhood Transition<br />
Percent of children referred by Part C prior to<br />
age 3, who are found eligible for Part B, and<br />
who have an IEP developed and implemented<br />
by their third birthday.<br />
Note: - - denotes not applicable<br />
State<br />
Rate<br />
99.41%<br />
99.70%<br />
98.97%<br />
State<br />
Rate<br />
State<br />
Target<br />
0.00%<br />
State<br />
Target<br />
100.00%<br />
100.00%<br />
100.00%<br />
State<br />
Target<br />
Target Met by<br />
LEA (Y/N)<br />
N/A<br />
Target Met by<br />
LEA (Y/N)<br />
N/A<br />
LEA<br />
Rate<br />
100.00%<br />
100.00%<br />
— —<br />
LEA<br />
Rate<br />
Target Met by<br />
LEA (Y/N)<br />
N<br />
N/A<br />
Note: The target for Indicator 09 is to have zero percent<br />
(0%) of districts identified as having disproportionate<br />
representation as a result of inappropriate<br />
identification in eligibility.<br />
Note: The target for Indicator 10 is to have zero<br />
percent (0%) of districts identified as having<br />
disproportionate representation as a result of<br />
inappropriate identification in a disability<br />
category.<br />
Target Met by<br />
LEA (Y/N)<br />
Y<br />
N/A<br />
Target Met<br />
by LEA<br />
(Y/N)<br />
99.21% 100.00% - - N/A<br />
Y<br />
Note: * Indicates a zero reponse rate for the<br />
district.<br />
Page 4 of 5
LEA: 6720 - DEQUEEN/MENA <strong>EDUCATION</strong>AL CO-OP<br />
Indicator 13: Secondary Transition<br />
Percent of youth with disabilities aged 16 and<br />
up with an IEP that includes coordinated,<br />
measurable, annual IEP goals and transition<br />
services that will reasonably enable the student<br />
to meet the post-secondary goals.<br />
Indicator 14: Post-School Outcomes<br />
A. Percent of youth enrolled in higher<br />
education within one year of leaving high<br />
school.<br />
State<br />
Rate<br />
State<br />
Target<br />
Note: Data for this Indicator is from the on-site monitoring of LEAs for the given year.<br />
B. Percent of youth enrolled in higher<br />
education or competitively employed<br />
within one year of leaving high school.<br />
C. Percent of youth enrolled in higher<br />
education or in some other postsecondary<br />
education or training program; or<br />
competitively employed or in some other<br />
employment within one year of leaving<br />
high school.<br />
State<br />
Rate<br />
Indicator 20: Reported Data-Timely and Accurate*<br />
District submitted<br />
required data elements<br />
on or before due dates;<br />
made revisions within<br />
the alloted reveiw<br />
periods.<br />
Accurate and Timely<br />
Data Submission<br />
Overall (3-21)<br />
Early Childhood (3-5)<br />
School Age (5-21)<br />
State<br />
Target<br />
100.00%<br />
100.00%<br />
100.00%<br />
State<br />
Target<br />
LEA<br />
Rate<br />
LEA<br />
Rate<br />
Target Met by<br />
LEA (Y/N)<br />
Target Met<br />
by LEA<br />
(Y/N)<br />
Target Met<br />
by LEA<br />
(Y/N)<br />
*Data reviewed for timely and accurate submissions included all APSCN cycle data except for personnel<br />
Note: - - denotes not applicable<br />
96.19 100.00 — — N/A<br />
14.53<br />
State<br />
Rate<br />
49.42<br />
State<br />
Rate<br />
54.07<br />
13.00<br />
State<br />
Target<br />
49.00<br />
State<br />
Target<br />
60.00<br />
Y<br />
Y<br />
N/A<br />
— —<br />
LEA<br />
Rate<br />
— —<br />
LEA<br />
Rate<br />
— —<br />
N/A<br />
Target Met<br />
by LEA<br />
(Y/N)<br />
N/A<br />
Target Met<br />
by LEA<br />
(Y/N)<br />
N/A<br />
Page 5 of 5
LEA: 6802 - CAVE CITY SCHOOL <strong>DISTRICT</strong><br />
<strong>ARKANSAS</strong> <strong>SPECIAL</strong> <strong>EDUCATION</strong><br />
<strong>DISTRICT</strong> <strong>ANNUAL</strong> PERFORMANCE REPORT<br />
2010/11 School Year<br />
Publication Date: March 2012<br />
Each State must have in place a State Performance Plan (SPP) to evaluate the State's efforts to meet the requirements and<br />
purposes of the implementation of the Individuals with Disabilities Education Act (IDEA). The SPP is a six-year plan, which<br />
describes Arkansas's performance on 20 indicators. The Office of Special Education Programs in the U. S. Department of<br />
Education requires that States report annually to the public on the performance of each local education agency (LEA) on 14 of<br />
20 indicators as compared with targets established by the State in the SPP. Arkansas will report indicators 1 through 14 and<br />
20 for each LEA serving children with disabilities (CWD). Any LEA not meeting targets on compliance indicators (0% for<br />
Indicators 4B, 09 & 10 and 100% for Indicators 11, 12, 13, and 20) are non-compliant with IDEA.<br />
There are no report changes for the 2010/11 school year profile; However, it is important to recognize that: .<br />
1. Indicator 01 (Graduation) is reported a year in arrear (2009/10 graduates) and is based on a four-year cohort. This<br />
means the rate is a measure of students who entered in ninth grade and graduate in four years. The calculation is a<br />
requirement under Title I of the Elementary and Secondary Education Act (ESEA).<br />
2. Indicator 02 (Drop out) is reported a year in arrear. This means the rate is a measure of students who dropped out in<br />
the 2009/10 school year. The Indicator 02 data are aligned with the Common Core of Data (CCD) requirements for<br />
grades 7-12.<br />
3. Indicator 04A and 4B (Suspension/Expulsion) is reported a year in arrear. This means the rate is a measure of<br />
students who had out-of-school suspensions and/or expulsions totaling more than 10 days.<br />
Percent of youth<br />
with IEPs<br />
graduating from<br />
high school with a<br />
regular diploma<br />
For a complete description of all the Indicators, please visit the special education website at<br />
http://arksped.k12.ar.us/sections/policy.html<br />
Indicator 01: Graduation Rates (2009/10 school year) Indicator 02: Dropout Rates (2009/10 school year)<br />
State<br />
Rate<br />
State<br />
Target<br />
75.76% 85.00%<br />
LEA<br />
Rate<br />
100.00%<br />
Target Met<br />
by LEA<br />
(Y/N)<br />
Y<br />
Percent of<br />
youth with<br />
IEPs dropping<br />
out of high<br />
school<br />
State<br />
Rate<br />
Indicator 03: Assessment on Statewide Benchmark Exam (grades 3-8, 11)<br />
A) Adequate Yearly Progress<br />
n=40<br />
Literacy<br />
Mathematics<br />
Met Disability Subgroup "n"<br />
for Reporting Purposes (Y/N)<br />
State Target for % of Districts Meeting<br />
AYP for Disability Subgroup<br />
State<br />
Target<br />
3.06% 4.20%<br />
LEA<br />
Rate<br />
0.00%<br />
% of Districts Meeting AYP<br />
for Disability Subgroup<br />
Target Met by<br />
LEA (Y/N)<br />
Y<br />
Target Met by<br />
LEA(Y/N)<br />
Overall N 17.15% 6.25%<br />
NA<br />
N<br />
N<br />
Note: For a district to qualify as having a disability subgroup it must have a minimum of 40 (n=40) students with disabilities in a school building.<br />
B) Participation<br />
Participation Rate: # of<br />
CWD Tested ÷ # of CWD<br />
Enrolled in grades tested.<br />
Participation Rate: Literacy<br />
Participation Rate: Math<br />
Note: - - denotes not applicable<br />
State<br />
Rate<br />
98.78%<br />
State<br />
Target<br />
95.00%<br />
LEA<br />
Rate<br />
98.72%<br />
Target Met<br />
by LEA (Y/N)<br />
98.61% 95.00% 97.50% Y<br />
Y<br />
C) Performance Proficiency<br />
Percent of CWD Scoring<br />
Proficient or Above<br />
Proficiency Rate: Literacy<br />
Proficiency Rate:<br />
Mathematics<br />
16.00%<br />
16.00%<br />
State<br />
Rate<br />
31.49%<br />
44.86%<br />
State<br />
Target<br />
45.22%<br />
51.14%<br />
LEA<br />
Rate<br />
38.16%<br />
53.25%<br />
NA<br />
NA<br />
Target<br />
Met by<br />
LEA (Y/N)<br />
N<br />
Y<br />
Page 1 of 5
LEA: 6802 - CAVE CITY SCHOOL <strong>DISTRICT</strong><br />
Indicator 04: Out-of-School Suspensions and Expulsions (2009/10 school year)<br />
A) Suspension/Expulsion<br />
Percent difference of CWD with out-of- school suspensions and<br />
expulsions totaling greater than 10 days in a school year as<br />
compared to the same data for general education students in<br />
the district.<br />
B) Suspension/Expulsion by Race and Ethnicity<br />
Percent of districts that have: (a) a significant discrepancy, by race or<br />
ethnicity, in the rate of suspensions and expulsions of greater than 10<br />
days in a school year for children with IEPs; and (b) policies,<br />
procedures or practices that contribute to the significant discrepancy<br />
and do not comply with requirements relating to the development<br />
and implementation of IEPs, the use of positive behavioral<br />
interventions and supports, and procedural safeguards.<br />
Indicator 05: School Age (5-21) Least Restrictive Environment<br />
A) In the Regular Class 80% or more of the day<br />
Percent of CWD with<br />
IEPs receiving instruction<br />
in the regular class 80%<br />
or more of the day.<br />
State<br />
Rate<br />
State<br />
Target<br />
LEA<br />
Rate<br />
B) In the Regular Class less than 40% of the day<br />
Percent of CWD with<br />
IEPs receiving instruction<br />
in the regular class less<br />
than 60% of the day.<br />
53.87% 59.77%<br />
State<br />
Rate<br />
State<br />
Target<br />
12.42% 12.51%<br />
54.55%<br />
LEA<br />
Rate<br />
7.79%<br />
C) Other Settings outside the regular class<br />
Percent of CWD with IEPs served in<br />
public or private separate schools,<br />
residential placements, or<br />
homebound/hospital placements.<br />
State<br />
Rate<br />
State<br />
Target<br />
2.80% 2.56%<br />
Target Met<br />
by LEA (Y/N)<br />
N<br />
Target Met<br />
by LEA (Y/N)<br />
Y<br />
LEA<br />
Rate<br />
2.60%<br />
Target Met<br />
by LEA(Y/N)<br />
Indicator 06: Early Childhood (3-5) Least Restrictive Environment<br />
A) Regular Early Childhood Program<br />
Percent of children (aged 3 through 5) with IEPs attending a regular<br />
early childhood program and receiving the majority of special<br />
education and related services in the regular early childhood program<br />
Allowable<br />
Difference<br />
LEA: 6802 - CAVE CITY SCHOOL <strong>DISTRICT</strong><br />
Indicator 07: Preschool (3-5) Outcomes<br />
a) Percent of preschool CWD<br />
children who did not<br />
improve functioning.<br />
b) Percent of preschool CWD<br />
who improved but whose<br />
functioning remained below<br />
same age peers.<br />
c) Percent of preschool CWD<br />
who improved at a level<br />
nearer to same aged peers.<br />
d) Percent of preschool CWD<br />
who improved functioning to<br />
reach a level comparable to<br />
same age peers.<br />
e) Percent of preschool CWD<br />
children who maintain<br />
functioning at a level<br />
comparable to same aged<br />
peers.<br />
Summary<br />
Statements<br />
1) Of those preschool<br />
children who entered<br />
the preschool program<br />
below age expectations<br />
in each Outcome, the<br />
percent who<br />
substantially increased<br />
their rate of growth by<br />
the time they turned 6<br />
years of age or exited<br />
the program.<br />
2) The percent of<br />
preschool children who<br />
were functioning<br />
within age expectations<br />
in each Outcome by the<br />
time they turned 6<br />
years of age or exited<br />
A) Positive Social -Emotional<br />
Skills*<br />
State<br />
Rate<br />
A) Positive Social -<br />
Emotional Skills<br />
(Including social<br />
relationships)<br />
State<br />
Rate<br />
2.14%<br />
5.31%<br />
25.97%<br />
38.22%<br />
28.36%<br />
State<br />
Target<br />
LEA<br />
Rate<br />
LEA<br />
Rate<br />
— —<br />
— —<br />
— —<br />
— —<br />
— —<br />
Target<br />
Met by<br />
LEA(Y/N)<br />
B) Acquisition and Use of<br />
Knowledge and Skills<br />
(Including early language/<br />
communication and early literacy)<br />
B) Acquisition and Use of<br />
Knowledge and Skills **<br />
State<br />
Rate<br />
1.75%<br />
6.59%<br />
34.23%<br />
43.51%<br />
13.92%<br />
State<br />
Target<br />
LEA<br />
Rate<br />
Target<br />
Met by<br />
LEA(Y/N)<br />
C) Use of Appropriate Behaviors<br />
to Meet Their Needs<br />
State<br />
Rate<br />
State<br />
Target<br />
LEA<br />
Rate<br />
Target<br />
Met by<br />
LEA(Y/N)<br />
89.61% 90.50% — — N/A 90.31% 90.50% — — N/A 90.82% 92.50% — — N/A<br />
66.58% 69.50% — — N/A 57.43% 60.50% — — N/A 76.69% 78.50% — — N/A<br />
NOTE: * Including social relationships ** Including early language/ communication and early literacy<br />
Note: - - denotes not applicable<br />
State<br />
Rate<br />
LEA<br />
Rate<br />
— —<br />
— —<br />
— —<br />
— —<br />
— —<br />
C) Use of<br />
Appropriate<br />
Behaviors to<br />
Meet Their Needs<br />
State<br />
Rate<br />
4.51%<br />
17.34%<br />
41.72%<br />
34.97%<br />
LEA<br />
Rate<br />
1.46% — —<br />
— —<br />
— —<br />
— —<br />
— —<br />
Page 3 of 5
LEA: 6802 - CAVE CITY SCHOOL <strong>DISTRICT</strong><br />
Indicator 08: Parent Involvement<br />
Percent of surveyed<br />
parents who reported<br />
school facilitated parent<br />
involvement as a means<br />
of improving services<br />
and results for children<br />
with disabilities.<br />
Early Childhood<br />
(3-5)<br />
School Age<br />
(5-21)<br />
State<br />
Rate<br />
90.47%<br />
95.05%<br />
Indicator 09: Disproportionality - Eligibility<br />
Disproportionate representation of racial<br />
and ethnic groups in special education and<br />
related services that is a result of<br />
inappropriate identification (e.g.<br />
monitoring data, review of policies,<br />
practices, and procedures under 618(d),<br />
etc.).<br />
State<br />
Rate<br />
State<br />
Target<br />
88.00%<br />
96.00%<br />
State<br />
Target<br />
0.00% 0.00%<br />
LEA<br />
Rate<br />
— —<br />
98.25%<br />
Indicator 10: Disproportionality-Child with a Disability<br />
Disproportionate representation of racial<br />
and ethnic groups in specific disability<br />
categories that is a result of inappropriate<br />
identification (e.g. monitoring data, review<br />
of policies, practices, and procedures under<br />
618(d), etc.).<br />
Indicator 11: Child Find<br />
Percent of children with<br />
parental consent to evaluate<br />
who are evaluated within<br />
the State established timeline<br />
of 60 days.<br />
Overall<br />
(3-21)<br />
Early Childhood<br />
(3-5)<br />
School Age<br />
(5-21)<br />
State<br />
Rate<br />
0.00%<br />
Indicator 12: Early Childhood Transition<br />
Percent of children referred by Part C prior to<br />
age 3, who are found eligible for Part B, and<br />
who have an IEP developed and implemented<br />
by their third birthday.<br />
Note: - - denotes not applicable<br />
State<br />
Rate<br />
99.41%<br />
99.70%<br />
98.97%<br />
State<br />
Rate<br />
State<br />
Target<br />
0.00%<br />
State<br />
Target<br />
100.00%<br />
100.00%<br />
100.00%<br />
State<br />
Target<br />
Target Met by<br />
LEA (Y/N)<br />
Y<br />
Target Met by<br />
LEA (Y/N)<br />
Y<br />
LEA<br />
Rate<br />
100.00%<br />
— —<br />
100.00%<br />
LEA<br />
Rate<br />
Target Met by<br />
LEA (Y/N)<br />
N/A<br />
Y<br />
Note: The target for Indicator 09 is to have zero percent<br />
(0%) of districts identified as having disproportionate<br />
representation as a result of inappropriate<br />
identification in eligibility.<br />
Note: The target for Indicator 10 is to have zero<br />
percent (0%) of districts identified as having<br />
disproportionate representation as a result of<br />
inappropriate identification in a disability<br />
category.<br />
Target Met by<br />
LEA (Y/N)<br />
N/A<br />
Y<br />
Target Met<br />
by LEA<br />
(Y/N)<br />
99.21% 100.00% - - N/A<br />
Y<br />
Note: * Indicates a zero reponse rate for the<br />
district.<br />
Page 4 of 5
LEA: 6802 - CAVE CITY SCHOOL <strong>DISTRICT</strong><br />
Indicator 13: Secondary Transition<br />
Percent of youth with disabilities aged 16 and<br />
up with an IEP that includes coordinated,<br />
measurable, annual IEP goals and transition<br />
services that will reasonably enable the student<br />
to meet the post-secondary goals.<br />
Indicator 14: Post-School Outcomes<br />
A. Percent of youth enrolled in higher<br />
education within one year of leaving high<br />
school.<br />
State<br />
Rate<br />
State<br />
Target<br />
Note: Data for this Indicator is from the on-site monitoring of LEAs for the given year.<br />
B. Percent of youth enrolled in higher<br />
education or competitively employed<br />
within one year of leaving high school.<br />
C. Percent of youth enrolled in higher<br />
education or in some other postsecondary<br />
education or training program; or<br />
competitively employed or in some other<br />
employment within one year of leaving<br />
high school.<br />
State<br />
Rate<br />
Indicator 20: Reported Data-Timely and Accurate*<br />
District submitted<br />
required data elements<br />
on or before due dates;<br />
made revisions within<br />
the alloted reveiw<br />
periods.<br />
Accurate and Timely<br />
Data Submission<br />
Overall (3-21)<br />
Early Childhood (3-5)<br />
School Age (5-21)<br />
State<br />
Target<br />
100.00%<br />
100.00%<br />
100.00%<br />
State<br />
Target<br />
LEA<br />
Rate<br />
LEA<br />
Rate<br />
Target Met by<br />
LEA (Y/N)<br />
Target Met<br />
by LEA<br />
(Y/N)<br />
Target Met<br />
by LEA<br />
(Y/N)<br />
*Data reviewed for timely and accurate submissions included all APSCN cycle data except for personnel<br />
Note: - - denotes not applicable<br />
96.19 100.00 — — N/A<br />
14.53<br />
State<br />
Rate<br />
49.42<br />
State<br />
Rate<br />
54.07<br />
13.00<br />
State<br />
Target<br />
49.00<br />
State<br />
Target<br />
60.00<br />
Y<br />
N/A<br />
Y<br />
— —<br />
LEA<br />
Rate<br />
— —<br />
LEA<br />
Rate<br />
— —<br />
N/A<br />
Target Met<br />
by LEA<br />
(Y/N)<br />
N/A<br />
Target Met<br />
by LEA<br />
(Y/N)<br />
N/A<br />
Page 5 of 5
LEA: 6804 - HIGHLAND SCHOOL <strong>DISTRICT</strong><br />
<strong>ARKANSAS</strong> <strong>SPECIAL</strong> <strong>EDUCATION</strong><br />
<strong>DISTRICT</strong> <strong>ANNUAL</strong> PERFORMANCE REPORT<br />
2010/11 School Year<br />
Publication Date: March 2012<br />
Each State must have in place a State Performance Plan (SPP) to evaluate the State's efforts to meet the requirements and<br />
purposes of the implementation of the Individuals with Disabilities Education Act (IDEA). The SPP is a six-year plan, which<br />
describes Arkansas's performance on 20 indicators. The Office of Special Education Programs in the U. S. Department of<br />
Education requires that States report annually to the public on the performance of each local education agency (LEA) on 14 of<br />
20 indicators as compared with targets established by the State in the SPP. Arkansas will report indicators 1 through 14 and<br />
20 for each LEA serving children with disabilities (CWD). Any LEA not meeting targets on compliance indicators (0% for<br />
Indicators 4B, 09 & 10 and 100% for Indicators 11, 12, 13, and 20) are non-compliant with IDEA.<br />
There are no report changes for the 2010/11 school year profile; However, it is important to recognize that: .<br />
1. Indicator 01 (Graduation) is reported a year in arrear (2009/10 graduates) and is based on a four-year cohort. This<br />
means the rate is a measure of students who entered in ninth grade and graduate in four years. The calculation is a<br />
requirement under Title I of the Elementary and Secondary Education Act (ESEA).<br />
2. Indicator 02 (Drop out) is reported a year in arrear. This means the rate is a measure of students who dropped out in<br />
the 2009/10 school year. The Indicator 02 data are aligned with the Common Core of Data (CCD) requirements for<br />
grades 7-12.<br />
3. Indicator 04A and 4B (Suspension/Expulsion) is reported a year in arrear. This means the rate is a measure of<br />
students who had out-of-school suspensions and/or expulsions totaling more than 10 days.<br />
Percent of youth<br />
with IEPs<br />
graduating from<br />
high school with a<br />
regular diploma<br />
For a complete description of all the Indicators, please visit the special education website at<br />
http://arksped.k12.ar.us/sections/policy.html<br />
Indicator 01: Graduation Rates (2009/10 school year) Indicator 02: Dropout Rates (2009/10 school year)<br />
State<br />
Rate<br />
State<br />
Target<br />
75.76% 85.00%<br />
LEA<br />
Rate<br />
100.00%<br />
Target Met<br />
by LEA<br />
(Y/N)<br />
Y<br />
Percent of<br />
youth with<br />
IEPs dropping<br />
out of high<br />
school<br />
State<br />
Rate<br />
Indicator 03: Assessment on Statewide Benchmark Exam (grades 3-8, 11)<br />
A) Adequate Yearly Progress<br />
n=40<br />
Literacy<br />
Mathematics<br />
Met Disability Subgroup "n"<br />
for Reporting Purposes (Y/N)<br />
State Target for % of Districts Meeting<br />
AYP for Disability Subgroup<br />
State<br />
Target<br />
3.06% 4.20%<br />
LEA<br />
Rate<br />
0.00%<br />
% of Districts Meeting AYP<br />
for Disability Subgroup<br />
Target Met by<br />
LEA (Y/N)<br />
Y<br />
Target Met by<br />
LEA(Y/N)<br />
Overall N 17.15% 6.25%<br />
NA<br />
N<br />
N<br />
Note: For a district to qualify as having a disability subgroup it must have a minimum of 40 (n=40) students with disabilities in a school building.<br />
B) Participation<br />
Participation Rate: # of<br />
CWD Tested ÷ # of CWD<br />
Enrolled in grades tested.<br />
Participation Rate: Literacy<br />
Participation Rate: Math<br />
Note: - - denotes not applicable<br />
State<br />
Rate<br />
98.78%<br />
State<br />
Target<br />
95.00%<br />
LEA<br />
Rate<br />
100.00%<br />
Target Met<br />
by LEA (Y/N)<br />
98.61% 95.00% 97.92% Y<br />
Y<br />
C) Performance Proficiency<br />
Percent of CWD Scoring<br />
Proficient or Above<br />
Proficiency Rate: Literacy<br />
Proficiency Rate:<br />
Mathematics<br />
16.00%<br />
16.00%<br />
State<br />
Rate<br />
31.49%<br />
44.86%<br />
State<br />
Target<br />
45.22%<br />
51.14%<br />
LEA<br />
Rate<br />
40.26%<br />
47.62%<br />
NA<br />
NA<br />
Target<br />
Met by<br />
LEA (Y/N)<br />
N<br />
N<br />
Page 1 of 5
LEA: 6804 - HIGHLAND SCHOOL <strong>DISTRICT</strong><br />
Indicator 04: Out-of-School Suspensions and Expulsions (2009/10 school year)<br />
A) Suspension/Expulsion<br />
Percent difference of CWD with out-of- school suspensions and<br />
expulsions totaling greater than 10 days in a school year as<br />
compared to the same data for general education students in<br />
the district.<br />
B) Suspension/Expulsion by Race and Ethnicity<br />
Percent of districts that have: (a) a significant discrepancy, by race or<br />
ethnicity, in the rate of suspensions and expulsions of greater than 10<br />
days in a school year for children with IEPs; and (b) policies,<br />
procedures or practices that contribute to the significant discrepancy<br />
and do not comply with requirements relating to the development<br />
and implementation of IEPs, the use of positive behavioral<br />
interventions and supports, and procedural safeguards.<br />
Indicator 05: School Age (5-21) Least Restrictive Environment<br />
A) In the Regular Class 80% or more of the day<br />
Percent of CWD with<br />
IEPs receiving instruction<br />
in the regular class 80%<br />
or more of the day.<br />
State<br />
Rate<br />
State<br />
Target<br />
LEA<br />
Rate<br />
B) In the Regular Class less than 40% of the day<br />
Percent of CWD with<br />
IEPs receiving instruction<br />
in the regular class less<br />
than 60% of the day.<br />
53.87% 59.77%<br />
State<br />
Rate<br />
State<br />
Target<br />
12.42% 12.51%<br />
68.82%<br />
LEA<br />
Rate<br />
9.41%<br />
C) Other Settings outside the regular class<br />
Percent of CWD with IEPs served in<br />
public or private separate schools,<br />
residential placements, or<br />
homebound/hospital placements.<br />
State<br />
Rate<br />
State<br />
Target<br />
2.80% 2.56%<br />
Target Met<br />
by LEA (Y/N)<br />
Y<br />
Target Met<br />
by LEA (Y/N)<br />
Y<br />
LEA<br />
Rate<br />
1.18%<br />
Target Met<br />
by LEA(Y/N)<br />
Indicator 06: Early Childhood (3-5) Least Restrictive Environment<br />
A) Regular Early Childhood Program<br />
Percent of children (aged 3 through 5) with IEPs attending a regular<br />
early childhood program and receiving the majority of special<br />
education and related services in the regular early childhood program<br />
Allowable<br />
Difference<br />
LEA: 6804 - HIGHLAND SCHOOL <strong>DISTRICT</strong><br />
Indicator 07: Preschool (3-5) Outcomes<br />
a) Percent of preschool CWD<br />
children who did not<br />
improve functioning.<br />
b) Percent of preschool CWD<br />
who improved but whose<br />
functioning remained below<br />
same age peers.<br />
c) Percent of preschool CWD<br />
who improved at a level<br />
nearer to same aged peers.<br />
d) Percent of preschool CWD<br />
who improved functioning to<br />
reach a level comparable to<br />
same age peers.<br />
e) Percent of preschool CWD<br />
children who maintain<br />
functioning at a level<br />
comparable to same aged<br />
peers.<br />
Summary<br />
Statements<br />
1) Of those preschool<br />
children who entered<br />
the preschool program<br />
below age expectations<br />
in each Outcome, the<br />
percent who<br />
substantially increased<br />
their rate of growth by<br />
the time they turned 6<br />
years of age or exited<br />
the program.<br />
2) The percent of<br />
preschool children who<br />
were functioning<br />
within age expectations<br />
in each Outcome by the<br />
time they turned 6<br />
years of age or exited<br />
A) Positive Social -Emotional<br />
Skills*<br />
State<br />
Rate<br />
A) Positive Social -<br />
Emotional Skills<br />
(Including social<br />
relationships)<br />
State<br />
Rate<br />
2.14%<br />
5.31%<br />
25.97%<br />
38.22%<br />
28.36%<br />
State<br />
Target<br />
LEA<br />
Rate<br />
LEA<br />
Rate<br />
— —<br />
— —<br />
— —<br />
— —<br />
— —<br />
Target<br />
Met by<br />
LEA(Y/N)<br />
B) Acquisition and Use of<br />
Knowledge and Skills<br />
(Including early language/<br />
communication and early literacy)<br />
B) Acquisition and Use of<br />
Knowledge and Skills **<br />
State<br />
Rate<br />
1.75%<br />
6.59%<br />
34.23%<br />
43.51%<br />
13.92%<br />
State<br />
Target<br />
LEA<br />
Rate<br />
Target<br />
Met by<br />
LEA(Y/N)<br />
C) Use of Appropriate Behaviors<br />
to Meet Their Needs<br />
State<br />
Rate<br />
State<br />
Target<br />
LEA<br />
Rate<br />
Target<br />
Met by<br />
LEA(Y/N)<br />
89.61% 90.50% — — N/A 90.31% 90.50% — — N/A 90.82% 92.50% — — N/A<br />
66.58% 69.50% — — N/A 57.43% 60.50% — — N/A 76.69% 78.50% — — N/A<br />
NOTE: * Including social relationships ** Including early language/ communication and early literacy<br />
Note: - - denotes not applicable<br />
State<br />
Rate<br />
LEA<br />
Rate<br />
— —<br />
— —<br />
— —<br />
— —<br />
— —<br />
C) Use of<br />
Appropriate<br />
Behaviors to<br />
Meet Their Needs<br />
State<br />
Rate<br />
4.51%<br />
17.34%<br />
41.72%<br />
34.97%<br />
LEA<br />
Rate<br />
1.46% — —<br />
— —<br />
— —<br />
— —<br />
— —<br />
Page 3 of 5
LEA: 6804 - HIGHLAND SCHOOL <strong>DISTRICT</strong><br />
Indicator 08: Parent Involvement<br />
Percent of surveyed<br />
parents who reported<br />
school facilitated parent<br />
involvement as a means<br />
of improving services<br />
and results for children<br />
with disabilities.<br />
Early Childhood<br />
(3-5)<br />
School Age<br />
(5-21)<br />
State<br />
Rate<br />
90.47%<br />
95.05%<br />
Indicator 09: Disproportionality - Eligibility<br />
Disproportionate representation of racial<br />
and ethnic groups in special education and<br />
related services that is a result of<br />
inappropriate identification (e.g.<br />
monitoring data, review of policies,<br />
practices, and procedures under 618(d),<br />
etc.).<br />
State<br />
Rate<br />
State<br />
Target<br />
88.00%<br />
96.00%<br />
State<br />
Target<br />
0.00% 0.00%<br />
LEA<br />
Rate<br />
— —<br />
97.78%<br />
Indicator 10: Disproportionality-Child with a Disability<br />
Disproportionate representation of racial<br />
and ethnic groups in specific disability<br />
categories that is a result of inappropriate<br />
identification (e.g. monitoring data, review<br />
of policies, practices, and procedures under<br />
618(d), etc.).<br />
Indicator 11: Child Find<br />
Percent of children with<br />
parental consent to evaluate<br />
who are evaluated within<br />
the State established timeline<br />
of 60 days.<br />
Overall<br />
(3-21)<br />
Early Childhood<br />
(3-5)<br />
School Age<br />
(5-21)<br />
State<br />
Rate<br />
0.00%<br />
Indicator 12: Early Childhood Transition<br />
Percent of children referred by Part C prior to<br />
age 3, who are found eligible for Part B, and<br />
who have an IEP developed and implemented<br />
by their third birthday.<br />
Note: - - denotes not applicable<br />
State<br />
Rate<br />
99.41%<br />
99.70%<br />
98.97%<br />
State<br />
Rate<br />
State<br />
Target<br />
0.00%<br />
State<br />
Target<br />
100.00%<br />
100.00%<br />
100.00%<br />
State<br />
Target<br />
Target Met by<br />
LEA (Y/N)<br />
Y<br />
Target Met by<br />
LEA (Y/N)<br />
Y<br />
LEA<br />
Rate<br />
100.00%<br />
— —<br />
100.00%<br />
LEA<br />
Rate<br />
Target Met by<br />
LEA (Y/N)<br />
N/A<br />
Y<br />
Note: The target for Indicator 09 is to have zero percent<br />
(0%) of districts identified as having disproportionate<br />
representation as a result of inappropriate<br />
identification in eligibility.<br />
Note: The target for Indicator 10 is to have zero<br />
percent (0%) of districts identified as having<br />
disproportionate representation as a result of<br />
inappropriate identification in a disability<br />
category.<br />
Target Met by<br />
LEA (Y/N)<br />
N/A<br />
Y<br />
Target Met<br />
by LEA<br />
(Y/N)<br />
99.21% 100.00% - - N/A<br />
Y<br />
Note: * Indicates a zero reponse rate for the<br />
district.<br />
Page 4 of 5
LEA: 6804 - HIGHLAND SCHOOL <strong>DISTRICT</strong><br />
Indicator 13: Secondary Transition<br />
Percent of youth with disabilities aged 16 and<br />
up with an IEP that includes coordinated,<br />
measurable, annual IEP goals and transition<br />
services that will reasonably enable the student<br />
to meet the post-secondary goals.<br />
Indicator 14: Post-School Outcomes<br />
A. Percent of youth enrolled in higher<br />
education within one year of leaving high<br />
school.<br />
State<br />
Rate<br />
State<br />
Target<br />
Note: Data for this Indicator is from the on-site monitoring of LEAs for the given year.<br />
B. Percent of youth enrolled in higher<br />
education or competitively employed<br />
within one year of leaving high school.<br />
C. Percent of youth enrolled in higher<br />
education or in some other postsecondary<br />
education or training program; or<br />
competitively employed or in some other<br />
employment within one year of leaving<br />
high school.<br />
State<br />
Rate<br />
Indicator 20: Reported Data-Timely and Accurate*<br />
District submitted<br />
required data elements<br />
on or before due dates;<br />
made revisions within<br />
the alloted reveiw<br />
periods.<br />
Accurate and Timely<br />
Data Submission<br />
Overall (3-21)<br />
Early Childhood (3-5)<br />
School Age (5-21)<br />
State<br />
Target<br />
100.00%<br />
100.00%<br />
100.00%<br />
State<br />
Target<br />
LEA<br />
Rate<br />
LEA<br />
Rate<br />
Target Met by<br />
LEA (Y/N)<br />
Target Met<br />
by LEA<br />
(Y/N)<br />
Target Met<br />
by LEA<br />
(Y/N)<br />
*Data reviewed for timely and accurate submissions included all APSCN cycle data except for personnel<br />
Note: - - denotes not applicable<br />
96.19 100.00 — — N/A<br />
14.53<br />
State<br />
Rate<br />
49.42<br />
State<br />
Rate<br />
54.07<br />
13.00<br />
State<br />
Target<br />
49.00<br />
State<br />
Target<br />
60.00<br />
Y<br />
N/A<br />
Y<br />
— —<br />
LEA<br />
Rate<br />
— —<br />
LEA<br />
Rate<br />
— —<br />
N/A<br />
Target Met<br />
by LEA<br />
(Y/N)<br />
N/A<br />
Target Met<br />
by LEA<br />
(Y/N)<br />
N/A<br />
Page 5 of 5
<strong>ARKANSAS</strong> <strong>SPECIAL</strong> <strong>EDUCATION</strong><br />
<strong>DISTRICT</strong> <strong>ANNUAL</strong> PERFORMANCE REPORT<br />
2010/11 School Year<br />
Publication Date: March 2012<br />
Each State must have in place a State Performance Plan (SPP) to evaluate the State's efforts to meet the requirements and<br />
purposes of the implementation of the Individuals with Disabilities Education Act (IDEA). The SPP is a six-year plan, which<br />
describes Arkansas's performance on 20 indicators. The Office of Special Education Programs in the U. S. Department of<br />
Education requires that States report annually to the public on the performance of each local education agency (LEA) on 14 of<br />
20 indicators as compared with targets established by the State in the SPP. Arkansas will report indicators 1 through 14 and<br />
20 for each LEA serving children with disabilities (CWD). Any LEA not meeting targets on compliance indicators (0% for<br />
Indicators 4B, 09 & 10 and 100% for Indicators 11, 12, 13, and 20) are non-compliant with IDEA.<br />
There are no report changes for the 2010/11 school year profile; However, it is important to recognize that: .<br />
1. Indicator 01 (Graduation) is reported a year in arrear (2009/10 graduates) and is based on a four-year cohort. This<br />
means the rate is a measure of students who entered in ninth grade and graduate in four years. The calculation is a<br />
requirement under Title I of the Elementary and Secondary Education Act (ESEA).<br />
2. Indicator 02 (Drop out) is reported a year in arrear. This means the rate is a measure of students who dropped out in<br />
the 2009/10 school year. The Indicator 02 data are aligned with the Common Core of Data (CCD) requirements for<br />
grades 7-12.<br />
3. Indicator 04A and 4B (Suspension/Expulsion) is reported a year in arrear. This means the rate is a measure of<br />
students who had out-of-school suspensions and/or expulsions totaling more than 10 days.<br />
For a complete description of all the Indicators, please visit the special education website at<br />
http://arksped.k12.ar.us/sections/policy.html<br />
LEA: 6901 - MOUNTAIN VIEW SCHOOL <strong>DISTRICT</strong><br />
Indicator 01: Graduation Rates (2009/10 school year) Indicator 02: Dropout Rates (2009/10 school year)<br />
Percent of youth<br />
with IEPs<br />
graduating from<br />
high school with a<br />
regular diploma<br />
State<br />
Rate<br />
State<br />
Target<br />
75.76% 85.00%<br />
LEA<br />
Rate<br />
100.00%<br />
Target Met<br />
by LEA<br />
(Y/N)<br />
Y<br />
Percent of<br />
youth with<br />
IEPs dropping<br />
out of high<br />
school<br />
State<br />
Rate<br />
Indicator 03: Assessment on Statewide Benchmark Exam (grades 3-8, 11)<br />
A) Adequate Yearly Progress<br />
n=40<br />
Literacy<br />
Mathematics<br />
Met Disability Subgroup "n"<br />
for Reporting Purposes (Y/N)<br />
State Target for % of Districts Meeting<br />
AYP for Disability Subgroup<br />
State<br />
Target<br />
3.06% 4.20%<br />
LEA<br />
Rate<br />
0.00%<br />
% of Districts Meeting AYP<br />
for Disability Subgroup<br />
Target Met by<br />
LEA (Y/N)<br />
Y<br />
Target Met by<br />
LEA(Y/N)<br />
Overall N 17.15% 6.25%<br />
NA<br />
N<br />
N<br />
Note: For a district to qualify as having a disability subgroup it must have a minimum of 40 (n=40) students with disabilities in a school building.<br />
B) Participation<br />
Participation Rate: # of<br />
CWD Tested ÷ # of CWD<br />
Enrolled in grades tested.<br />
Participation Rate: Literacy<br />
Participation Rate: Math<br />
Note: - - denotes not applicable<br />
State<br />
Rate<br />
98.78%<br />
State<br />
Target<br />
95.00%<br />
LEA<br />
Rate<br />
100.00%<br />
Target Met<br />
by LEA (Y/N)<br />
98.61% 95.00% 100.00% Y<br />
Y<br />
C) Performance Proficiency<br />
Percent of CWD Scoring<br />
Proficient or Above<br />
Proficiency Rate: Literacy<br />
Proficiency Rate:<br />
Mathematics<br />
16.00%<br />
16.00%<br />
State<br />
Rate<br />
31.49%<br />
44.86%<br />
State<br />
Target<br />
45.22%<br />
51.14%<br />
LEA<br />
Rate<br />
44.00%<br />
42.86%<br />
NA<br />
NA<br />
Target<br />
Met by<br />
LEA (Y/N)<br />
N<br />
N<br />
Page 1 of 5
LEA: 6901 - MOUNTAIN VIEW SCHOOL <strong>DISTRICT</strong><br />
Indicator 04: Out-of-School Suspensions and Expulsions (2009/10 school year)<br />
A) Suspension/Expulsion<br />
Percent difference of CWD with out-of- school suspensions and<br />
expulsions totaling greater than 10 days in a school year as<br />
compared to the same data for general education students in<br />
the district.<br />
B) Suspension/Expulsion by Race and Ethnicity<br />
Percent of districts that have: (a) a significant discrepancy, by race or<br />
ethnicity, in the rate of suspensions and expulsions of greater than 10<br />
days in a school year for children with IEPs; and (b) policies,<br />
procedures or practices that contribute to the significant discrepancy<br />
and do not comply with requirements relating to the development<br />
and implementation of IEPs, the use of positive behavioral<br />
interventions and supports, and procedural safeguards.<br />
Indicator 05: School Age (5-21) Least Restrictive Environment<br />
A) In the Regular Class 80% or more of the day<br />
Percent of CWD with<br />
IEPs receiving instruction<br />
in the regular class 80%<br />
or more of the day.<br />
State<br />
Rate<br />
State<br />
Target<br />
LEA<br />
Rate<br />
B) In the Regular Class less than 40% of the day<br />
Percent of CWD with<br />
IEPs receiving instruction<br />
in the regular class less<br />
than 60% of the day.<br />
53.87% 59.77%<br />
State<br />
Rate<br />
State<br />
Target<br />
12.42% 12.51%<br />
58.30%<br />
LEA<br />
Rate<br />
20.18%<br />
C) Other Settings outside the regular class<br />
Percent of CWD with IEPs served in<br />
public or private separate schools,<br />
residential placements, or<br />
homebound/hospital placements.<br />
State<br />
Rate<br />
State<br />
Target<br />
2.80% 2.56%<br />
Target Met<br />
by LEA (Y/N)<br />
N<br />
Target Met<br />
by LEA (Y/N)<br />
N<br />
LEA<br />
Rate<br />
1.35%<br />
Target Met<br />
by LEA(Y/N)<br />
Indicator 06: Early Childhood (3-5) Least Restrictive Environment<br />
A) Regular Early Childhood Program<br />
Percent of children (aged 3 through 5) with IEPs attending a regular<br />
early childhood program and receiving the majority of special<br />
education and related services in the regular early childhood program<br />
Allowable<br />
Difference<br />
LEA: 6901 - MOUNTAIN VIEW SCHOOL <strong>DISTRICT</strong><br />
Indicator 07: Preschool (3-5) Outcomes<br />
a) Percent of preschool CWD<br />
children who did not<br />
improve functioning.<br />
b) Percent of preschool CWD<br />
who improved but whose<br />
functioning remained below<br />
same age peers.<br />
c) Percent of preschool CWD<br />
who improved at a level<br />
nearer to same aged peers.<br />
d) Percent of preschool CWD<br />
who improved functioning to<br />
reach a level comparable to<br />
same age peers.<br />
e) Percent of preschool CWD<br />
children who maintain<br />
functioning at a level<br />
comparable to same aged<br />
peers.<br />
Summary<br />
Statements<br />
1) Of those preschool<br />
children who entered<br />
the preschool program<br />
below age expectations<br />
in each Outcome, the<br />
percent who<br />
substantially increased<br />
their rate of growth by<br />
the time they turned 6<br />
years of age or exited<br />
the program.<br />
2) The percent of<br />
preschool children who<br />
were functioning<br />
within age expectations<br />
in each Outcome by the<br />
time they turned 6<br />
years of age or exited<br />
A) Positive Social -Emotional<br />
Skills*<br />
State<br />
Rate<br />
A) Positive Social -<br />
Emotional Skills<br />
(Including social<br />
relationships)<br />
State<br />
Rate<br />
2.14%<br />
5.31%<br />
25.97%<br />
38.22%<br />
28.36%<br />
State<br />
Target<br />
LEA<br />
Rate<br />
LEA<br />
Rate<br />
— —<br />
— —<br />
— —<br />
— —<br />
— —<br />
Target<br />
Met by<br />
LEA(Y/N)<br />
B) Acquisition and Use of<br />
Knowledge and Skills<br />
(Including early language/<br />
communication and early literacy)<br />
B) Acquisition and Use of<br />
Knowledge and Skills **<br />
State<br />
Rate<br />
1.75%<br />
6.59%<br />
34.23%<br />
43.51%<br />
13.92%<br />
State<br />
Target<br />
LEA<br />
Rate<br />
Target<br />
Met by<br />
LEA(Y/N)<br />
C) Use of Appropriate Behaviors<br />
to Meet Their Needs<br />
State<br />
Rate<br />
State<br />
Target<br />
LEA<br />
Rate<br />
Target<br />
Met by<br />
LEA(Y/N)<br />
89.61% 90.50% — — N/A 90.31% 90.50% — — N/A 90.82% 92.50% — — N/A<br />
66.58% 69.50% — — N/A 57.43% 60.50% — — N/A 76.69% 78.50% — — N/A<br />
NOTE: * Including social relationships ** Including early language/ communication and early literacy<br />
Note: - - denotes not applicable<br />
State<br />
Rate<br />
LEA<br />
Rate<br />
— —<br />
— —<br />
— —<br />
— —<br />
— —<br />
C) Use of<br />
Appropriate<br />
Behaviors to<br />
Meet Their Needs<br />
State<br />
Rate<br />
4.51%<br />
17.34%<br />
41.72%<br />
34.97%<br />
LEA<br />
Rate<br />
1.46% — —<br />
— —<br />
— —<br />
— —<br />
— —<br />
Page 3 of 5
LEA: 6901 - MOUNTAIN VIEW SCHOOL <strong>DISTRICT</strong><br />
Indicator 08: Parent Involvement<br />
Percent of surveyed<br />
parents who reported<br />
school facilitated parent<br />
involvement as a means<br />
of improving services<br />
and results for children<br />
with disabilities.<br />
Early Childhood<br />
(3-5)<br />
School Age<br />
(5-21)<br />
State<br />
Rate<br />
90.47%<br />
95.05%<br />
Indicator 09: Disproportionality - Eligibility<br />
Disproportionate representation of racial<br />
and ethnic groups in special education and<br />
related services that is a result of<br />
inappropriate identification (e.g.<br />
monitoring data, review of policies,<br />
practices, and procedures under 618(d),<br />
etc.).<br />
State<br />
Rate<br />
State<br />
Target<br />
88.00%<br />
96.00%<br />
State<br />
Target<br />
0.00% 0.00%<br />
LEA<br />
Rate<br />
— —<br />
96.47%<br />
Indicator 10: Disproportionality-Child with a Disability<br />
Disproportionate representation of racial<br />
and ethnic groups in specific disability<br />
categories that is a result of inappropriate<br />
identification (e.g. monitoring data, review<br />
of policies, practices, and procedures under<br />
618(d), etc.).<br />
Indicator 11: Child Find<br />
Percent of children with<br />
parental consent to evaluate<br />
who are evaluated within<br />
the State established timeline<br />
of 60 days.<br />
Overall<br />
(3-21)<br />
Early Childhood<br />
(3-5)<br />
School Age<br />
(5-21)<br />
State<br />
Rate<br />
0.00%<br />
Indicator 12: Early Childhood Transition<br />
Percent of children referred by Part C prior to<br />
age 3, who are found eligible for Part B, and<br />
who have an IEP developed and implemented<br />
by their third birthday.<br />
Note: - - denotes not applicable<br />
State<br />
Rate<br />
99.41%<br />
99.70%<br />
98.97%<br />
State<br />
Rate<br />
State<br />
Target<br />
0.00%<br />
State<br />
Target<br />
100.00%<br />
100.00%<br />
100.00%<br />
State<br />
Target<br />
Target Met by<br />
LEA (Y/N)<br />
Y<br />
Target Met by<br />
LEA (Y/N)<br />
Y<br />
LEA<br />
Rate<br />
100.00%<br />
— —<br />
100.00%<br />
LEA<br />
Rate<br />
Target Met by<br />
LEA (Y/N)<br />
N/A<br />
Y<br />
Note: The target for Indicator 09 is to have zero percent<br />
(0%) of districts identified as having disproportionate<br />
representation as a result of inappropriate<br />
identification in eligibility.<br />
Note: The target for Indicator 10 is to have zero<br />
percent (0%) of districts identified as having<br />
disproportionate representation as a result of<br />
inappropriate identification in a disability<br />
category.<br />
Target Met by<br />
LEA (Y/N)<br />
N/A<br />
Y<br />
Target Met<br />
by LEA<br />
(Y/N)<br />
99.21% 100.00% - - N/A<br />
Y<br />
Note: * Indicates a zero reponse rate for the<br />
district.<br />
Page 4 of 5
LEA: 6901 - MOUNTAIN VIEW SCHOOL <strong>DISTRICT</strong><br />
Indicator 13: Secondary Transition<br />
Percent of youth with disabilities aged 16 and<br />
up with an IEP that includes coordinated,<br />
measurable, annual IEP goals and transition<br />
services that will reasonably enable the student<br />
to meet the post-secondary goals.<br />
Indicator 14: Post-School Outcomes<br />
A. Percent of youth enrolled in higher<br />
education within one year of leaving high<br />
school.<br />
State<br />
Rate<br />
State<br />
Target<br />
Note: Data for this Indicator is from the on-site monitoring of LEAs for the given year.<br />
B. Percent of youth enrolled in higher<br />
education or competitively employed<br />
within one year of leaving high school.<br />
C. Percent of youth enrolled in higher<br />
education or in some other postsecondary<br />
education or training program; or<br />
competitively employed or in some other<br />
employment within one year of leaving<br />
high school.<br />
State<br />
Rate<br />
Indicator 20: Reported Data-Timely and Accurate*<br />
District submitted<br />
required data elements<br />
on or before due dates;<br />
made revisions within<br />
the alloted reveiw<br />
periods.<br />
Accurate and Timely<br />
Data Submission<br />
Overall (3-21)<br />
Early Childhood (3-5)<br />
School Age (5-21)<br />
State<br />
Target<br />
100.00%<br />
100.00%<br />
100.00%<br />
State<br />
Target<br />
LEA<br />
Rate<br />
LEA<br />
Rate<br />
Target Met by<br />
LEA (Y/N)<br />
Target Met<br />
by LEA<br />
(Y/N)<br />
Target Met<br />
by LEA<br />
(Y/N)<br />
*Data reviewed for timely and accurate submissions included all APSCN cycle data except for personnel<br />
Note: - - denotes not applicable<br />
96.19 100.00 — — N/A<br />
14.53<br />
State<br />
Rate<br />
49.42<br />
State<br />
Rate<br />
54.07<br />
13.00<br />
State<br />
Target<br />
49.00<br />
State<br />
Target<br />
60.00<br />
Y<br />
N/A<br />
Y<br />
14.29%<br />
LEA<br />
Rate<br />
28.57%<br />
LEA<br />
Rate<br />
28.57%<br />
Y<br />
Target Met<br />
by LEA<br />
(Y/N)<br />
N<br />
Target Met<br />
by LEA<br />
(Y/N)<br />
N<br />
Page 5 of 5
LEA: 7001 - EL DORADO SCHOOL <strong>DISTRICT</strong><br />
<strong>ARKANSAS</strong> <strong>SPECIAL</strong> <strong>EDUCATION</strong><br />
<strong>DISTRICT</strong> <strong>ANNUAL</strong> PERFORMANCE REPORT<br />
2010/11 School Year<br />
Publication Date: March 2012<br />
Each State must have in place a State Performance Plan (SPP) to evaluate the State's efforts to meet the requirements and<br />
purposes of the implementation of the Individuals with Disabilities Education Act (IDEA). The SPP is a six-year plan, which<br />
describes Arkansas's performance on 20 indicators. The Office of Special Education Programs in the U. S. Department of<br />
Education requires that States report annually to the public on the performance of each local education agency (LEA) on 14 of<br />
20 indicators as compared with targets established by the State in the SPP. Arkansas will report indicators 1 through 14 and<br />
20 for each LEA serving children with disabilities (CWD). Any LEA not meeting targets on compliance indicators (0% for<br />
Indicators 4B, 09 & 10 and 100% for Indicators 11, 12, 13, and 20) are non-compliant with IDEA.<br />
There are no report changes for the 2010/11 school year profile; However, it is important to recognize that: .<br />
1. Indicator 01 (Graduation) is reported a year in arrear (2009/10 graduates) and is based on a four-year cohort. This<br />
means the rate is a measure of students who entered in ninth grade and graduate in four years. The calculation is a<br />
requirement under Title I of the Elementary and Secondary Education Act (ESEA).<br />
2. Indicator 02 (Drop out) is reported a year in arrear. This means the rate is a measure of students who dropped out in<br />
the 2009/10 school year. The Indicator 02 data are aligned with the Common Core of Data (CCD) requirements for<br />
grades 7-12.<br />
3. Indicator 04A and 4B (Suspension/Expulsion) is reported a year in arrear. This means the rate is a measure of<br />
students who had out-of-school suspensions and/or expulsions totaling more than 10 days.<br />
Percent of youth<br />
with IEPs<br />
graduating from<br />
high school with a<br />
regular diploma<br />
For a complete description of all the Indicators, please visit the special education website at<br />
http://arksped.k12.ar.us/sections/policy.html<br />
Indicator 01: Graduation Rates (2009/10 school year) Indicator 02: Dropout Rates (2009/10 school year)<br />
State<br />
Rate<br />
State<br />
Target<br />
75.76% 85.00%<br />
LEA<br />
Rate<br />
72.22%<br />
Target Met<br />
by LEA<br />
(Y/N)<br />
N<br />
Percent of<br />
youth with<br />
IEPs dropping<br />
out of high<br />
school<br />
State<br />
Rate<br />
Indicator 03: Assessment on Statewide Benchmark Exam (grades 3-8, 11)<br />
A) Adequate Yearly Progress<br />
n=40<br />
Literacy<br />
Mathematics<br />
Met Disability Subgroup "n"<br />
for Reporting Purposes (Y/N)<br />
State Target for % of Districts Meeting<br />
AYP for Disability Subgroup<br />
State<br />
Target<br />
3.06% 4.20%<br />
LEA<br />
Rate<br />
1.90%<br />
% of Districts Meeting AYP<br />
for Disability Subgroup<br />
Target Met by<br />
LEA (Y/N)<br />
Y<br />
Target Met by<br />
LEA(Y/N)<br />
Overall N 17.15% 6.25%<br />
NA<br />
N<br />
N<br />
Note: For a district to qualify as having a disability subgroup it must have a minimum of 40 (n=40) students with disabilities in a school building.<br />
B) Participation<br />
Participation Rate: # of<br />
CWD Tested ÷ # of CWD<br />
Enrolled in grades tested.<br />
Participation Rate: Literacy<br />
Participation Rate: Math<br />
Note: - - denotes not applicable<br />
State<br />
Rate<br />
98.78%<br />
State<br />
Target<br />
95.00%<br />
LEA<br />
Rate<br />
98.78%<br />
Target Met<br />
by LEA (Y/N)<br />
98.61% 95.00% 98.82% Y<br />
Y<br />
C) Performance Proficiency<br />
Percent of CWD Scoring<br />
Proficient or Above<br />
Proficiency Rate: Literacy<br />
Proficiency Rate:<br />
Mathematics<br />
16.00%<br />
16.00%<br />
State<br />
Rate<br />
31.49%<br />
44.86%<br />
State<br />
Target<br />
45.22%<br />
51.14%<br />
LEA<br />
Rate<br />
37.74%<br />
45.06%<br />
NA<br />
NA<br />
Target<br />
Met by<br />
LEA (Y/N)<br />
N<br />
N<br />
Page 1 of 5
LEA: 7001 - EL DORADO SCHOOL <strong>DISTRICT</strong><br />
Indicator 04: Out-of-School Suspensions and Expulsions (2009/10 school year)<br />
A) Suspension/Expulsion<br />
Percent difference of CWD with out-of- school suspensions and<br />
expulsions totaling greater than 10 days in a school year as<br />
compared to the same data for general education students in<br />
the district.<br />
B) Suspension/Expulsion by Race and Ethnicity<br />
Percent of districts that have: (a) a significant discrepancy, by race or<br />
ethnicity, in the rate of suspensions and expulsions of greater than 10<br />
days in a school year for children with IEPs; and (b) policies,<br />
procedures or practices that contribute to the significant discrepancy<br />
and do not comply with requirements relating to the development<br />
and implementation of IEPs, the use of positive behavioral<br />
interventions and supports, and procedural safeguards.<br />
Indicator 05: School Age (5-21) Least Restrictive Environment<br />
A) In the Regular Class 80% or more of the day<br />
Percent of CWD with<br />
IEPs receiving instruction<br />
in the regular class 80%<br />
or more of the day.<br />
State<br />
Rate<br />
State<br />
Target<br />
LEA<br />
Rate<br />
B) In the Regular Class less than 40% of the day<br />
Percent of CWD with<br />
IEPs receiving instruction<br />
in the regular class less<br />
than 60% of the day.<br />
53.87% 59.77%<br />
State<br />
Rate<br />
State<br />
Target<br />
12.42% 12.51%<br />
74.04%<br />
LEA<br />
Rate<br />
17.70%<br />
C) Other Settings outside the regular class<br />
Percent of CWD with IEPs served in<br />
public or private separate schools,<br />
residential placements, or<br />
homebound/hospital placements.<br />
State<br />
Rate<br />
State<br />
Target<br />
2.80% 2.56%<br />
Target Met<br />
by LEA (Y/N)<br />
Y<br />
Target Met<br />
by LEA (Y/N)<br />
N<br />
LEA<br />
Rate<br />
0.00%<br />
Target Met<br />
by LEA(Y/N)<br />
Indicator 06: Early Childhood (3-5) Least Restrictive Environment<br />
A) Regular Early Childhood Program<br />
Percent of children (aged 3 through 5) with IEPs attending a regular<br />
early childhood program and receiving the majority of special<br />
education and related services in the regular early childhood program<br />
Allowable<br />
Difference<br />
LEA: 7001 - EL DORADO SCHOOL <strong>DISTRICT</strong><br />
Indicator 07: Preschool (3-5) Outcomes<br />
a) Percent of preschool CWD<br />
children who did not<br />
improve functioning.<br />
b) Percent of preschool CWD<br />
who improved but whose<br />
functioning remained below<br />
same age peers.<br />
c) Percent of preschool CWD<br />
who improved at a level<br />
nearer to same aged peers.<br />
d) Percent of preschool CWD<br />
who improved functioning to<br />
reach a level comparable to<br />
same age peers.<br />
e) Percent of preschool CWD<br />
children who maintain<br />
functioning at a level<br />
comparable to same aged<br />
peers.<br />
Summary<br />
Statements<br />
1) Of those preschool<br />
children who entered<br />
the preschool program<br />
below age expectations<br />
in each Outcome, the<br />
percent who<br />
substantially increased<br />
their rate of growth by<br />
the time they turned 6<br />
years of age or exited<br />
the program.<br />
2) The percent of<br />
preschool children who<br />
were functioning<br />
within age expectations<br />
in each Outcome by the<br />
time they turned 6<br />
years of age or exited<br />
A) Positive Social -Emotional<br />
Skills*<br />
State<br />
Rate<br />
A) Positive Social -<br />
Emotional Skills<br />
(Including social<br />
relationships)<br />
State<br />
Rate<br />
2.14%<br />
5.31%<br />
25.97%<br />
38.22%<br />
28.36%<br />
State<br />
Target<br />
LEA<br />
Rate<br />
LEA<br />
Rate<br />
— —<br />
— —<br />
— —<br />
— —<br />
— —<br />
Target<br />
Met by<br />
LEA(Y/N)<br />
B) Acquisition and Use of<br />
Knowledge and Skills<br />
(Including early language/<br />
communication and early literacy)<br />
B) Acquisition and Use of<br />
Knowledge and Skills **<br />
State<br />
Rate<br />
1.75%<br />
6.59%<br />
34.23%<br />
43.51%<br />
13.92%<br />
State<br />
Target<br />
LEA<br />
Rate<br />
Target<br />
Met by<br />
LEA(Y/N)<br />
C) Use of Appropriate Behaviors<br />
to Meet Their Needs<br />
State<br />
Rate<br />
State<br />
Target<br />
LEA<br />
Rate<br />
Target<br />
Met by<br />
LEA(Y/N)<br />
89.61% 90.50% — — N/A 90.31% 90.50% — — N/A 90.82% 92.50% — — N/A<br />
66.58% 69.50% — — N/A 57.43% 60.50% — — N/A 76.69% 78.50% — — N/A<br />
NOTE: * Including social relationships ** Including early language/ communication and early literacy<br />
Note: - - denotes not applicable<br />
State<br />
Rate<br />
LEA<br />
Rate<br />
— —<br />
— —<br />
— —<br />
— —<br />
— —<br />
C) Use of<br />
Appropriate<br />
Behaviors to<br />
Meet Their Needs<br />
State<br />
Rate<br />
4.51%<br />
17.34%<br />
41.72%<br />
34.97%<br />
LEA<br />
Rate<br />
1.46% — —<br />
— —<br />
— —<br />
— —<br />
— —<br />
Page 3 of 5
LEA: 7001 - EL DORADO SCHOOL <strong>DISTRICT</strong><br />
Indicator 08: Parent Involvement<br />
Percent of surveyed<br />
parents who reported<br />
school facilitated parent<br />
involvement as a means<br />
of improving services<br />
and results for children<br />
with disabilities.<br />
Early Childhood<br />
(3-5)<br />
School Age<br />
(5-21)<br />
State<br />
Rate<br />
90.47%<br />
95.05%<br />
Indicator 09: Disproportionality - Eligibility<br />
Disproportionate representation of racial<br />
and ethnic groups in special education and<br />
related services that is a result of<br />
inappropriate identification (e.g.<br />
monitoring data, review of policies,<br />
practices, and procedures under 618(d),<br />
etc.).<br />
State<br />
Rate<br />
State<br />
Target<br />
88.00%<br />
96.00%<br />
State<br />
Target<br />
0.00% 0.00%<br />
LEA<br />
Rate<br />
— —<br />
92.86%<br />
Indicator 10: Disproportionality-Child with a Disability<br />
Disproportionate representation of racial<br />
and ethnic groups in specific disability<br />
categories that is a result of inappropriate<br />
identification (e.g. monitoring data, review<br />
of policies, practices, and procedures under<br />
618(d), etc.).<br />
Indicator 11: Child Find<br />
Percent of children with<br />
parental consent to evaluate<br />
who are evaluated within<br />
the State established timeline<br />
of 60 days.<br />
Overall<br />
(3-21)<br />
Early Childhood<br />
(3-5)<br />
School Age<br />
(5-21)<br />
State<br />
Rate<br />
0.00%<br />
Indicator 12: Early Childhood Transition<br />
Percent of children referred by Part C prior to<br />
age 3, who are found eligible for Part B, and<br />
who have an IEP developed and implemented<br />
by their third birthday.<br />
Note: - - denotes not applicable<br />
State<br />
Rate<br />
99.41%<br />
99.70%<br />
98.97%<br />
State<br />
Rate<br />
State<br />
Target<br />
0.00%<br />
State<br />
Target<br />
100.00%<br />
100.00%<br />
100.00%<br />
State<br />
Target<br />
Target Met by<br />
LEA (Y/N)<br />
Y<br />
Target Met by<br />
LEA (Y/N)<br />
Y<br />
LEA<br />
Rate<br />
100.00%<br />
— —<br />
100.00%<br />
LEA<br />
Rate<br />
Target Met by<br />
LEA (Y/N)<br />
N/A<br />
N<br />
Note: The target for Indicator 09 is to have zero percent<br />
(0%) of districts identified as having disproportionate<br />
representation as a result of inappropriate<br />
identification in eligibility.<br />
Note: The target for Indicator 10 is to have zero<br />
percent (0%) of districts identified as having<br />
disproportionate representation as a result of<br />
inappropriate identification in a disability<br />
category.<br />
Target Met by<br />
LEA (Y/N)<br />
N/A<br />
Y<br />
Target Met<br />
by LEA<br />
(Y/N)<br />
99.21% 100.00% - - N/A<br />
Y<br />
Note: * Indicates a zero reponse rate for the<br />
district.<br />
Page 4 of 5
LEA: 7001 - EL DORADO SCHOOL <strong>DISTRICT</strong><br />
Indicator 13: Secondary Transition<br />
Percent of youth with disabilities aged 16 and<br />
up with an IEP that includes coordinated,<br />
measurable, annual IEP goals and transition<br />
services that will reasonably enable the student<br />
to meet the post-secondary goals.<br />
Indicator 14: Post-School Outcomes<br />
A. Percent of youth enrolled in higher<br />
education within one year of leaving high<br />
school.<br />
State<br />
Rate<br />
State<br />
Target<br />
Note: Data for this Indicator is from the on-site monitoring of LEAs for the given year.<br />
B. Percent of youth enrolled in higher<br />
education or competitively employed<br />
within one year of leaving high school.<br />
C. Percent of youth enrolled in higher<br />
education or in some other postsecondary<br />
education or training program; or<br />
competitively employed or in some other<br />
employment within one year of leaving<br />
high school.<br />
State<br />
Rate<br />
Indicator 20: Reported Data-Timely and Accurate*<br />
District submitted<br />
required data elements<br />
on or before due dates;<br />
made revisions within<br />
the alloted reveiw<br />
periods.<br />
Accurate and Timely<br />
Data Submission<br />
Overall (3-21)<br />
Early Childhood (3-5)<br />
School Age (5-21)<br />
State<br />
Target<br />
100.00%<br />
100.00%<br />
100.00%<br />
State<br />
Target<br />
LEA<br />
Rate<br />
LEA<br />
Rate<br />
Target Met by<br />
LEA (Y/N)<br />
Target Met<br />
by LEA<br />
(Y/N)<br />
Target Met<br />
by LEA<br />
(Y/N)<br />
*Data reviewed for timely and accurate submissions included all APSCN cycle data except for personnel<br />
Note: - - denotes not applicable<br />
96.19 100.00 — — N/A<br />
14.53<br />
State<br />
Rate<br />
49.42<br />
State<br />
Rate<br />
54.07<br />
13.00<br />
State<br />
Target<br />
49.00<br />
State<br />
Target<br />
60.00<br />
Y<br />
N/A<br />
Y<br />
— —<br />
LEA<br />
Rate<br />
— —<br />
LEA<br />
Rate<br />
— —<br />
N/A<br />
Target Met<br />
by LEA<br />
(Y/N)<br />
N/A<br />
Target Met<br />
by LEA<br />
(Y/N)<br />
N/A<br />
Page 5 of 5
<strong>ARKANSAS</strong> <strong>SPECIAL</strong> <strong>EDUCATION</strong><br />
<strong>DISTRICT</strong> <strong>ANNUAL</strong> PERFORMANCE REPORT<br />
2010/11 School Year<br />
Publication Date: March 2012<br />
Each State must have in place a State Performance Plan (SPP) to evaluate the State's efforts to meet the requirements and<br />
purposes of the implementation of the Individuals with Disabilities Education Act (IDEA). The SPP is a six-year plan, which<br />
describes Arkansas's performance on 20 indicators. The Office of Special Education Programs in the U. S. Department of<br />
Education requires that States report annually to the public on the performance of each local education agency (LEA) on 14 of<br />
20 indicators as compared with targets established by the State in the SPP. Arkansas will report indicators 1 through 14 and<br />
20 for each LEA serving children with disabilities (CWD). Any LEA not meeting targets on compliance indicators (0% for<br />
Indicators 4B, 09 & 10 and 100% for Indicators 11, 12, 13, and 20) are non-compliant with IDEA.<br />
There are no report changes for the 2010/11 school year profile; However, it is important to recognize that: .<br />
1. Indicator 01 (Graduation) is reported a year in arrear (2009/10 graduates) and is based on a four-year cohort. This<br />
means the rate is a measure of students who entered in ninth grade and graduate in four years. The calculation is a<br />
requirement under Title I of the Elementary and Secondary Education Act (ESEA).<br />
2. Indicator 02 (Drop out) is reported a year in arrear. This means the rate is a measure of students who dropped out in<br />
the 2009/10 school year. The Indicator 02 data are aligned with the Common Core of Data (CCD) requirements for<br />
grades 7-12.<br />
3. Indicator 04A and 4B (Suspension/Expulsion) is reported a year in arrear. This means the rate is a measure of<br />
students who had out-of-school suspensions and/or expulsions totaling more than 10 days.<br />
For a complete description of all the Indicators, please visit the special education website at<br />
http://arksped.k12.ar.us/sections/policy.html<br />
LEA: 7003 - JUNCTION CITY SCHOOL <strong>DISTRICT</strong><br />
Indicator 01: Graduation Rates (2009/10 school year) Indicator 02: Dropout Rates (2009/10 school year)<br />
Percent of youth<br />
with IEPs<br />
graduating from<br />
high school with a<br />
regular diploma<br />
State<br />
Rate<br />
State<br />
Target<br />
75.76% 85.00%<br />
LEA<br />
Rate<br />
100.00%<br />
Target Met<br />
by LEA<br />
(Y/N)<br />
Y<br />
Percent of<br />
youth with<br />
IEPs dropping<br />
out of high<br />
school<br />
State<br />
Rate<br />
Indicator 03: Assessment on Statewide Benchmark Exam (grades 3-8, 11)<br />
A) Adequate Yearly Progress<br />
n=40<br />
Literacy<br />
Mathematics<br />
Met Disability Subgroup "n"<br />
for Reporting Purposes (Y/N)<br />
State Target for % of Districts Meeting<br />
AYP for Disability Subgroup<br />
State<br />
Target<br />
3.06% 4.20%<br />
LEA<br />
Rate<br />
0.00%<br />
% of Districts Meeting AYP<br />
for Disability Subgroup<br />
Target Met by<br />
LEA (Y/N)<br />
Y<br />
Target Met by<br />
LEA(Y/N)<br />
Overall N 17.15% 6.25%<br />
NA<br />
N<br />
N<br />
Note: For a district to qualify as having a disability subgroup it must have a minimum of 40 (n=40) students with disabilities in a school building.<br />
B) Participation<br />
Participation Rate: # of<br />
CWD Tested ÷ # of CWD<br />
Enrolled in grades tested.<br />
Participation Rate: Literacy<br />
Participation Rate: Math<br />
Note: - - denotes not applicable<br />
State<br />
Rate<br />
98.78%<br />
State<br />
Target<br />
95.00%<br />
LEA<br />
Rate<br />
97.44%<br />
Target Met<br />
by LEA (Y/N)<br />
98.61% 95.00% 97.30% Y<br />
Y<br />
C) Performance Proficiency<br />
Percent of CWD Scoring<br />
Proficient or Above<br />
Proficiency Rate: Literacy<br />
Proficiency Rate:<br />
Mathematics<br />
16.00%<br />
16.00%<br />
State<br />
Rate<br />
31.49%<br />
44.86%<br />
State<br />
Target<br />
45.22%<br />
51.14%<br />
LEA<br />
Rate<br />
19.44%<br />
45.45%<br />
NA<br />
NA<br />
Target<br />
Met by<br />
LEA (Y/N)<br />
N<br />
N<br />
Page 1 of 5
LEA: 7003 - JUNCTION CITY SCHOOL <strong>DISTRICT</strong><br />
Indicator 04: Out-of-School Suspensions and Expulsions (2009/10 school year)<br />
A) Suspension/Expulsion<br />
Percent difference of CWD with out-of- school suspensions and<br />
expulsions totaling greater than 10 days in a school year as<br />
compared to the same data for general education students in<br />
the district.<br />
B) Suspension/Expulsion by Race and Ethnicity<br />
Percent of districts that have: (a) a significant discrepancy, by race or<br />
ethnicity, in the rate of suspensions and expulsions of greater than 10<br />
days in a school year for children with IEPs; and (b) policies,<br />
procedures or practices that contribute to the significant discrepancy<br />
and do not comply with requirements relating to the development<br />
and implementation of IEPs, the use of positive behavioral<br />
interventions and supports, and procedural safeguards.<br />
Indicator 05: School Age (5-21) Least Restrictive Environment<br />
A) In the Regular Class 80% or more of the day<br />
Percent of CWD with<br />
IEPs receiving instruction<br />
in the regular class 80%<br />
or more of the day.<br />
State<br />
Rate<br />
State<br />
Target<br />
LEA<br />
Rate<br />
B) In the Regular Class less than 40% of the day<br />
Percent of CWD with<br />
IEPs receiving instruction<br />
in the regular class less<br />
than 60% of the day.<br />
53.87% 59.77%<br />
State<br />
Rate<br />
State<br />
Target<br />
12.42% 12.51%<br />
72.22%<br />
LEA<br />
Rate<br />
5.56%<br />
C) Other Settings outside the regular class<br />
Percent of CWD with IEPs served in<br />
public or private separate schools,<br />
residential placements, or<br />
homebound/hospital placements.<br />
State<br />
Rate<br />
State<br />
Target<br />
2.80% 2.56%<br />
Target Met<br />
by LEA (Y/N)<br />
Y<br />
Target Met<br />
by LEA (Y/N)<br />
Y<br />
LEA<br />
Rate<br />
0.00%<br />
Target Met<br />
by LEA(Y/N)<br />
Indicator 06: Early Childhood (3-5) Least Restrictive Environment<br />
A) Regular Early Childhood Program<br />
Percent of children (aged 3 through 5) with IEPs attending a regular<br />
early childhood program and receiving the majority of special<br />
education and related services in the regular early childhood program<br />
Allowable<br />
Difference<br />
LEA: 7003 - JUNCTION CITY SCHOOL <strong>DISTRICT</strong><br />
Indicator 07: Preschool (3-5) Outcomes<br />
a) Percent of preschool CWD<br />
children who did not<br />
improve functioning.<br />
b) Percent of preschool CWD<br />
who improved but whose<br />
functioning remained below<br />
same age peers.<br />
c) Percent of preschool CWD<br />
who improved at a level<br />
nearer to same aged peers.<br />
d) Percent of preschool CWD<br />
who improved functioning to<br />
reach a level comparable to<br />
same age peers.<br />
e) Percent of preschool CWD<br />
children who maintain<br />
functioning at a level<br />
comparable to same aged<br />
peers.<br />
Summary<br />
Statements<br />
1) Of those preschool<br />
children who entered<br />
the preschool program<br />
below age expectations<br />
in each Outcome, the<br />
percent who<br />
substantially increased<br />
their rate of growth by<br />
the time they turned 6<br />
years of age or exited<br />
the program.<br />
2) The percent of<br />
preschool children who<br />
were functioning<br />
within age expectations<br />
in each Outcome by the<br />
time they turned 6<br />
years of age or exited<br />
A) Positive Social -Emotional<br />
Skills*<br />
State<br />
Rate<br />
A) Positive Social -<br />
Emotional Skills<br />
(Including social<br />
relationships)<br />
State<br />
Rate<br />
2.14%<br />
5.31%<br />
25.97%<br />
38.22%<br />
28.36%<br />
State<br />
Target<br />
LEA<br />
Rate<br />
LEA<br />
Rate<br />
— —<br />
— —<br />
— —<br />
— —<br />
— —<br />
Target<br />
Met by<br />
LEA(Y/N)<br />
B) Acquisition and Use of<br />
Knowledge and Skills<br />
(Including early language/<br />
communication and early literacy)<br />
B) Acquisition and Use of<br />
Knowledge and Skills **<br />
State<br />
Rate<br />
1.75%<br />
6.59%<br />
34.23%<br />
43.51%<br />
13.92%<br />
State<br />
Target<br />
LEA<br />
Rate<br />
Target<br />
Met by<br />
LEA(Y/N)<br />
C) Use of Appropriate Behaviors<br />
to Meet Their Needs<br />
State<br />
Rate<br />
State<br />
Target<br />
LEA<br />
Rate<br />
Target<br />
Met by<br />
LEA(Y/N)<br />
89.61% 90.50% — — N/A 90.31% 90.50% — — N/A 90.82% 92.50% — — N/A<br />
66.58% 69.50% — — N/A 57.43% 60.50% — — N/A 76.69% 78.50% — — N/A<br />
NOTE: * Including social relationships ** Including early language/ communication and early literacy<br />
Note: - - denotes not applicable<br />
State<br />
Rate<br />
LEA<br />
Rate<br />
— —<br />
— —<br />
— —<br />
— —<br />
— —<br />
C) Use of<br />
Appropriate<br />
Behaviors to<br />
Meet Their Needs<br />
State<br />
Rate<br />
4.51%<br />
17.34%<br />
41.72%<br />
34.97%<br />
LEA<br />
Rate<br />
1.46% — —<br />
— —<br />
— —<br />
— —<br />
— —<br />
Page 3 of 5
LEA: 7003 - JUNCTION CITY SCHOOL <strong>DISTRICT</strong><br />
Indicator 08: Parent Involvement<br />
Percent of surveyed<br />
parents who reported<br />
school facilitated parent<br />
involvement as a means<br />
of improving services<br />
and results for children<br />
with disabilities.<br />
Early Childhood<br />
(3-5)<br />
School Age<br />
(5-21)<br />
State<br />
Rate<br />
90.47%<br />
95.05%<br />
Indicator 09: Disproportionality - Eligibility<br />
Disproportionate representation of racial<br />
and ethnic groups in special education and<br />
related services that is a result of<br />
inappropriate identification (e.g.<br />
monitoring data, review of policies,<br />
practices, and procedures under 618(d),<br />
etc.).<br />
State<br />
Rate<br />
State<br />
Target<br />
88.00%<br />
96.00%<br />
State<br />
Target<br />
0.00% 0.00%<br />
LEA<br />
Rate<br />
— —<br />
100.00%<br />
Indicator 10: Disproportionality-Child with a Disability<br />
Disproportionate representation of racial<br />
and ethnic groups in specific disability<br />
categories that is a result of inappropriate<br />
identification (e.g. monitoring data, review<br />
of policies, practices, and procedures under<br />
618(d), etc.).<br />
Indicator 11: Child Find<br />
Percent of children with<br />
parental consent to evaluate<br />
who are evaluated within<br />
the State established timeline<br />
of 60 days.<br />
Overall<br />
(3-21)<br />
Early Childhood<br />
(3-5)<br />
School Age<br />
(5-21)<br />
State<br />
Rate<br />
0.00%<br />
Indicator 12: Early Childhood Transition<br />
Percent of children referred by Part C prior to<br />
age 3, who are found eligible for Part B, and<br />
who have an IEP developed and implemented<br />
by their third birthday.<br />
Note: - - denotes not applicable<br />
State<br />
Rate<br />
99.41%<br />
99.70%<br />
98.97%<br />
State<br />
Rate<br />
State<br />
Target<br />
0.00%<br />
State<br />
Target<br />
100.00%<br />
100.00%<br />
100.00%<br />
State<br />
Target<br />
Target Met by<br />
LEA (Y/N)<br />
Y<br />
Target Met by<br />
LEA (Y/N)<br />
Y<br />
LEA<br />
Rate<br />
100.00%<br />
— —<br />
100.00%<br />
LEA<br />
Rate<br />
Target Met by<br />
LEA (Y/N)<br />
N/A<br />
Y<br />
Note: The target for Indicator 09 is to have zero percent<br />
(0%) of districts identified as having disproportionate<br />
representation as a result of inappropriate<br />
identification in eligibility.<br />
Note: The target for Indicator 10 is to have zero<br />
percent (0%) of districts identified as having<br />
disproportionate representation as a result of<br />
inappropriate identification in a disability<br />
category.<br />
Target Met by<br />
LEA (Y/N)<br />
N/A<br />
Y<br />
Target Met<br />
by LEA<br />
(Y/N)<br />
99.21% 100.00% - - N/A<br />
Y<br />
Note: * Indicates a zero reponse rate for the<br />
district.<br />
Page 4 of 5
LEA: 7003 - JUNCTION CITY SCHOOL <strong>DISTRICT</strong><br />
Indicator 13: Secondary Transition<br />
Percent of youth with disabilities aged 16 and<br />
up with an IEP that includes coordinated,<br />
measurable, annual IEP goals and transition<br />
services that will reasonably enable the student<br />
to meet the post-secondary goals.<br />
Indicator 14: Post-School Outcomes<br />
A. Percent of youth enrolled in higher<br />
education within one year of leaving high<br />
school.<br />
State<br />
Rate<br />
State<br />
Target<br />
Note: Data for this Indicator is from the on-site monitoring of LEAs for the given year.<br />
B. Percent of youth enrolled in higher<br />
education or competitively employed<br />
within one year of leaving high school.<br />
C. Percent of youth enrolled in higher<br />
education or in some other postsecondary<br />
education or training program; or<br />
competitively employed or in some other<br />
employment within one year of leaving<br />
high school.<br />
State<br />
Rate<br />
Indicator 20: Reported Data-Timely and Accurate*<br />
District submitted<br />
required data elements<br />
on or before due dates;<br />
made revisions within<br />
the alloted reveiw<br />
periods.<br />
Accurate and Timely<br />
Data Submission<br />
Overall (3-21)<br />
Early Childhood (3-5)<br />
School Age (5-21)<br />
State<br />
Target<br />
100.00%<br />
100.00%<br />
100.00%<br />
State<br />
Target<br />
LEA<br />
Rate<br />
LEA<br />
Rate<br />
Target Met by<br />
LEA (Y/N)<br />
Target Met<br />
by LEA<br />
(Y/N)<br />
Target Met<br />
by LEA<br />
(Y/N)<br />
*Data reviewed for timely and accurate submissions included all APSCN cycle data except for personnel<br />
Note: - - denotes not applicable<br />
96.19 100.00 — — N/A<br />
14.53<br />
State<br />
Rate<br />
49.42<br />
State<br />
Rate<br />
54.07<br />
13.00<br />
State<br />
Target<br />
49.00<br />
State<br />
Target<br />
60.00<br />
Y<br />
N/A<br />
Y<br />
— —<br />
LEA<br />
Rate<br />
— —<br />
LEA<br />
Rate<br />
— —<br />
N/A<br />
Target Met<br />
by LEA<br />
(Y/N)<br />
N/A<br />
Target Met<br />
by LEA<br />
(Y/N)<br />
N/A<br />
Page 5 of 5
LEA: 7006 - NORPHLET SCHOOL <strong>DISTRICT</strong><br />
<strong>ARKANSAS</strong> <strong>SPECIAL</strong> <strong>EDUCATION</strong><br />
<strong>DISTRICT</strong> <strong>ANNUAL</strong> PERFORMANCE REPORT<br />
2010/11 School Year<br />
Publication Date: March 2012<br />
Each State must have in place a State Performance Plan (SPP) to evaluate the State's efforts to meet the requirements and<br />
purposes of the implementation of the Individuals with Disabilities Education Act (IDEA). The SPP is a six-year plan, which<br />
describes Arkansas's performance on 20 indicators. The Office of Special Education Programs in the U. S. Department of<br />
Education requires that States report annually to the public on the performance of each local education agency (LEA) on 14 of<br />
20 indicators as compared with targets established by the State in the SPP. Arkansas will report indicators 1 through 14 and<br />
20 for each LEA serving children with disabilities (CWD). Any LEA not meeting targets on compliance indicators (0% for<br />
Indicators 4B, 09 & 10 and 100% for Indicators 11, 12, 13, and 20) are non-compliant with IDEA.<br />
There are no report changes for the 2010/11 school year profile; However, it is important to recognize that: .<br />
1. Indicator 01 (Graduation) is reported a year in arrear (2009/10 graduates) and is based on a four-year cohort. This<br />
means the rate is a measure of students who entered in ninth grade and graduate in four years. The calculation is a<br />
requirement under Title I of the Elementary and Secondary Education Act (ESEA).<br />
2. Indicator 02 (Drop out) is reported a year in arrear. This means the rate is a measure of students who dropped out in<br />
the 2009/10 school year. The Indicator 02 data are aligned with the Common Core of Data (CCD) requirements for<br />
grades 7-12.<br />
3. Indicator 04A and 4B (Suspension/Expulsion) is reported a year in arrear. This means the rate is a measure of<br />
students who had out-of-school suspensions and/or expulsions totaling more than 10 days.<br />
Percent of youth<br />
with IEPs<br />
graduating from<br />
high school with a<br />
regular diploma<br />
For a complete description of all the Indicators, please visit the special education website at<br />
http://arksped.k12.ar.us/sections/policy.html<br />
Indicator 01: Graduation Rates (2009/10 school year) Indicator 02: Dropout Rates (2009/10 school year)<br />
State<br />
Rate<br />
State<br />
Target<br />
75.76% 85.00%<br />
LEA<br />
Rate<br />
100.00%<br />
Target Met<br />
by LEA<br />
(Y/N)<br />
Y<br />
Percent of<br />
youth with<br />
IEPs dropping<br />
out of high<br />
school<br />
State<br />
Rate<br />
Indicator 03: Assessment on Statewide Benchmark Exam (grades 3-8, 11)<br />
A) Adequate Yearly Progress<br />
n=40<br />
Literacy<br />
Mathematics<br />
Met Disability Subgroup "n"<br />
for Reporting Purposes (Y/N)<br />
State Target for % of Districts Meeting<br />
AYP for Disability Subgroup<br />
State<br />
Target<br />
3.06% 4.20%<br />
LEA<br />
Rate<br />
0.00%<br />
% of Districts Meeting AYP<br />
for Disability Subgroup<br />
Target Met by<br />
LEA (Y/N)<br />
Y<br />
Target Met by<br />
LEA(Y/N)<br />
Overall N 17.15% 6.25%<br />
NA<br />
N<br />
N<br />
Note: For a district to qualify as having a disability subgroup it must have a minimum of 40 (n=40) students with disabilities in a school building.<br />
B) Participation<br />
Participation Rate: # of<br />
CWD Tested ÷ # of CWD<br />
Enrolled in grades tested.<br />
Participation Rate: Literacy<br />
Participation Rate: Math<br />
Note: - - denotes not applicable<br />
State<br />
Rate<br />
98.78%<br />
State<br />
Target<br />
95.00%<br />
LEA<br />
Rate<br />
100.00%<br />
Target Met<br />
by LEA (Y/N)<br />
98.61% 95.00% 100.00% Y<br />
Y<br />
C) Performance Proficiency<br />
Percent of CWD Scoring<br />
Proficient or Above<br />
Proficiency Rate: Literacy<br />
Proficiency Rate:<br />
Mathematics<br />
16.00%<br />
16.00%<br />
State<br />
Rate<br />
31.49%<br />
44.86%<br />
State<br />
Target<br />
45.22%<br />
51.14%<br />
LEA<br />
Rate<br />
22.86%<br />
26.47%<br />
NA<br />
NA<br />
Target<br />
Met by<br />
LEA (Y/N)<br />
N<br />
N<br />
Page 1 of 5
LEA: 7006 - NORPHLET SCHOOL <strong>DISTRICT</strong><br />
Indicator 04: Out-of-School Suspensions and Expulsions (2009/10 school year)<br />
A) Suspension/Expulsion<br />
Percent difference of CWD with out-of- school suspensions and<br />
expulsions totaling greater than 10 days in a school year as<br />
compared to the same data for general education students in<br />
the district.<br />
B) Suspension/Expulsion by Race and Ethnicity<br />
Percent of districts that have: (a) a significant discrepancy, by race or<br />
ethnicity, in the rate of suspensions and expulsions of greater than 10<br />
days in a school year for children with IEPs; and (b) policies,<br />
procedures or practices that contribute to the significant discrepancy<br />
and do not comply with requirements relating to the development<br />
and implementation of IEPs, the use of positive behavioral<br />
interventions and supports, and procedural safeguards.<br />
Indicator 05: School Age (5-21) Least Restrictive Environment<br />
A) In the Regular Class 80% or more of the day<br />
Percent of CWD with<br />
IEPs receiving instruction<br />
in the regular class 80%<br />
or more of the day.<br />
State<br />
Rate<br />
State<br />
Target<br />
LEA<br />
Rate<br />
B) In the Regular Class less than 40% of the day<br />
Percent of CWD with<br />
IEPs receiving instruction<br />
in the regular class less<br />
than 60% of the day.<br />
53.87% 59.77%<br />
State<br />
Rate<br />
State<br />
Target<br />
12.42% 12.51%<br />
85.19%<br />
LEA<br />
Rate<br />
1.85%<br />
C) Other Settings outside the regular class<br />
Percent of CWD with IEPs served in<br />
public or private separate schools,<br />
residential placements, or<br />
homebound/hospital placements.<br />
State<br />
Rate<br />
State<br />
Target<br />
2.80% 2.56%<br />
Target Met<br />
by LEA (Y/N)<br />
Y<br />
Target Met<br />
by LEA (Y/N)<br />
Y<br />
LEA<br />
Rate<br />
0.00%<br />
Target Met<br />
by LEA(Y/N)<br />
Indicator 06: Early Childhood (3-5) Least Restrictive Environment<br />
A) Regular Early Childhood Program<br />
Percent of children (aged 3 through 5) with IEPs attending a regular<br />
early childhood program and receiving the majority of special<br />
education and related services in the regular early childhood program<br />
Allowable<br />
Difference<br />
LEA: 7006 - NORPHLET SCHOOL <strong>DISTRICT</strong><br />
Indicator 07: Preschool (3-5) Outcomes<br />
a) Percent of preschool CWD<br />
children who did not<br />
improve functioning.<br />
b) Percent of preschool CWD<br />
who improved but whose<br />
functioning remained below<br />
same age peers.<br />
c) Percent of preschool CWD<br />
who improved at a level<br />
nearer to same aged peers.<br />
d) Percent of preschool CWD<br />
who improved functioning to<br />
reach a level comparable to<br />
same age peers.<br />
e) Percent of preschool CWD<br />
children who maintain<br />
functioning at a level<br />
comparable to same aged<br />
peers.<br />
Summary<br />
Statements<br />
1) Of those preschool<br />
children who entered<br />
the preschool program<br />
below age expectations<br />
in each Outcome, the<br />
percent who<br />
substantially increased<br />
their rate of growth by<br />
the time they turned 6<br />
years of age or exited<br />
the program.<br />
2) The percent of<br />
preschool children who<br />
were functioning<br />
within age expectations<br />
in each Outcome by the<br />
time they turned 6<br />
years of age or exited<br />
A) Positive Social -Emotional<br />
Skills*<br />
State<br />
Rate<br />
A) Positive Social -<br />
Emotional Skills<br />
(Including social<br />
relationships)<br />
State<br />
Rate<br />
2.14%<br />
5.31%<br />
25.97%<br />
38.22%<br />
28.36%<br />
State<br />
Target<br />
LEA<br />
Rate<br />
LEA<br />
Rate<br />
— —<br />
— —<br />
— —<br />
— —<br />
— —<br />
Target<br />
Met by<br />
LEA(Y/N)<br />
B) Acquisition and Use of<br />
Knowledge and Skills<br />
(Including early language/<br />
communication and early literacy)<br />
B) Acquisition and Use of<br />
Knowledge and Skills **<br />
State<br />
Rate<br />
1.75%<br />
6.59%<br />
34.23%<br />
43.51%<br />
13.92%<br />
State<br />
Target<br />
LEA<br />
Rate<br />
Target<br />
Met by<br />
LEA(Y/N)<br />
C) Use of Appropriate Behaviors<br />
to Meet Their Needs<br />
State<br />
Rate<br />
State<br />
Target<br />
LEA<br />
Rate<br />
Target<br />
Met by<br />
LEA(Y/N)<br />
89.61% 90.50% — — N/A 90.31% 90.50% — — N/A 90.82% 92.50% — — N/A<br />
66.58% 69.50% — — N/A 57.43% 60.50% — — N/A 76.69% 78.50% — — N/A<br />
NOTE: * Including social relationships ** Including early language/ communication and early literacy<br />
Note: - - denotes not applicable<br />
State<br />
Rate<br />
LEA<br />
Rate<br />
— —<br />
— —<br />
— —<br />
— —<br />
— —<br />
C) Use of<br />
Appropriate<br />
Behaviors to<br />
Meet Their Needs<br />
State<br />
Rate<br />
4.51%<br />
17.34%<br />
41.72%<br />
34.97%<br />
LEA<br />
Rate<br />
1.46% — —<br />
— —<br />
— —<br />
— —<br />
— —<br />
Page 3 of 5
LEA: 7006 - NORPHLET SCHOOL <strong>DISTRICT</strong><br />
Indicator 08: Parent Involvement<br />
Percent of surveyed<br />
parents who reported<br />
school facilitated parent<br />
involvement as a means<br />
of improving services<br />
and results for children<br />
with disabilities.<br />
Early Childhood<br />
(3-5)<br />
School Age<br />
(5-21)<br />
State<br />
Rate<br />
90.47%<br />
95.05%<br />
Indicator 09: Disproportionality - Eligibility<br />
Disproportionate representation of racial<br />
and ethnic groups in special education and<br />
related services that is a result of<br />
inappropriate identification (e.g.<br />
monitoring data, review of policies,<br />
practices, and procedures under 618(d),<br />
etc.).<br />
State<br />
Rate<br />
State<br />
Target<br />
88.00%<br />
96.00%<br />
State<br />
Target<br />
0.00% 0.00%<br />
LEA<br />
Rate<br />
— —<br />
100.00%<br />
Indicator 10: Disproportionality-Child with a Disability<br />
Disproportionate representation of racial<br />
and ethnic groups in specific disability<br />
categories that is a result of inappropriate<br />
identification (e.g. monitoring data, review<br />
of policies, practices, and procedures under<br />
618(d), etc.).<br />
Indicator 11: Child Find<br />
Percent of children with<br />
parental consent to evaluate<br />
who are evaluated within<br />
the State established timeline<br />
of 60 days.<br />
Overall<br />
(3-21)<br />
Early Childhood<br />
(3-5)<br />
School Age<br />
(5-21)<br />
State<br />
Rate<br />
0.00%<br />
Indicator 12: Early Childhood Transition<br />
Percent of children referred by Part C prior to<br />
age 3, who are found eligible for Part B, and<br />
who have an IEP developed and implemented<br />
by their third birthday.<br />
Note: - - denotes not applicable<br />
State<br />
Rate<br />
99.41%<br />
99.70%<br />
98.97%<br />
State<br />
Rate<br />
State<br />
Target<br />
0.00%<br />
State<br />
Target<br />
100.00%<br />
100.00%<br />
100.00%<br />
State<br />
Target<br />
Target Met by<br />
LEA (Y/N)<br />
Y<br />
Target Met by<br />
LEA (Y/N)<br />
Y<br />
LEA<br />
Rate<br />
100.00%<br />
— —<br />
100.00%<br />
LEA<br />
Rate<br />
Target Met by<br />
LEA (Y/N)<br />
N/A<br />
Y<br />
Note: The target for Indicator 09 is to have zero percent<br />
(0%) of districts identified as having disproportionate<br />
representation as a result of inappropriate<br />
identification in eligibility.<br />
Note: The target for Indicator 10 is to have zero<br />
percent (0%) of districts identified as having<br />
disproportionate representation as a result of<br />
inappropriate identification in a disability<br />
category.<br />
Target Met by<br />
LEA (Y/N)<br />
N/A<br />
Y<br />
Target Met<br />
by LEA<br />
(Y/N)<br />
99.21% 100.00% - - N/A<br />
Y<br />
Note: * Indicates a zero reponse rate for the<br />
district.<br />
Page 4 of 5
LEA: 7006 - NORPHLET SCHOOL <strong>DISTRICT</strong><br />
Indicator 13: Secondary Transition<br />
Percent of youth with disabilities aged 16 and<br />
up with an IEP that includes coordinated,<br />
measurable, annual IEP goals and transition<br />
services that will reasonably enable the student<br />
to meet the post-secondary goals.<br />
Indicator 14: Post-School Outcomes<br />
A. Percent of youth enrolled in higher<br />
education within one year of leaving high<br />
school.<br />
State<br />
Rate<br />
State<br />
Target<br />
Note: Data for this Indicator is from the on-site monitoring of LEAs for the given year.<br />
B. Percent of youth enrolled in higher<br />
education or competitively employed<br />
within one year of leaving high school.<br />
C. Percent of youth enrolled in higher<br />
education or in some other postsecondary<br />
education or training program; or<br />
competitively employed or in some other<br />
employment within one year of leaving<br />
high school.<br />
State<br />
Rate<br />
Indicator 20: Reported Data-Timely and Accurate*<br />
District submitted<br />
required data elements<br />
on or before due dates;<br />
made revisions within<br />
the alloted reveiw<br />
periods.<br />
Accurate and Timely<br />
Data Submission<br />
Overall (3-21)<br />
Early Childhood (3-5)<br />
School Age (5-21)<br />
State<br />
Target<br />
100.00%<br />
100.00%<br />
100.00%<br />
State<br />
Target<br />
LEA<br />
Rate<br />
LEA<br />
Rate<br />
Target Met by<br />
LEA (Y/N)<br />
Target Met<br />
by LEA<br />
(Y/N)<br />
Target Met<br />
by LEA<br />
(Y/N)<br />
*Data reviewed for timely and accurate submissions included all APSCN cycle data except for personnel<br />
Note: - - denotes not applicable<br />
96.19 100.00 — — N/A<br />
14.53<br />
State<br />
Rate<br />
49.42<br />
State<br />
Rate<br />
54.07<br />
13.00<br />
State<br />
Target<br />
49.00<br />
State<br />
Target<br />
60.00<br />
Y<br />
N/A<br />
Y<br />
— —<br />
LEA<br />
Rate<br />
— —<br />
LEA<br />
Rate<br />
— —<br />
N/A<br />
Target Met<br />
by LEA<br />
(Y/N)<br />
N/A<br />
Target Met<br />
by LEA<br />
(Y/N)<br />
N/A<br />
Page 5 of 5
<strong>ARKANSAS</strong> <strong>SPECIAL</strong> <strong>EDUCATION</strong><br />
<strong>DISTRICT</strong> <strong>ANNUAL</strong> PERFORMANCE REPORT<br />
2010/11 School Year<br />
Publication Date: March 2012<br />
Each State must have in place a State Performance Plan (SPP) to evaluate the State's efforts to meet the requirements and<br />
purposes of the implementation of the Individuals with Disabilities Education Act (IDEA). The SPP is a six-year plan, which<br />
describes Arkansas's performance on 20 indicators. The Office of Special Education Programs in the U. S. Department of<br />
Education requires that States report annually to the public on the performance of each local education agency (LEA) on 14 of<br />
20 indicators as compared with targets established by the State in the SPP. Arkansas will report indicators 1 through 14 and<br />
20 for each LEA serving children with disabilities (CWD). Any LEA not meeting targets on compliance indicators (0% for<br />
Indicators 4B, 09 & 10 and 100% for Indicators 11, 12, 13, and 20) are non-compliant with IDEA.<br />
There are no report changes for the 2010/11 school year profile; However, it is important to recognize that: .<br />
1. Indicator 01 (Graduation) is reported a year in arrear (2009/10 graduates) and is based on a four-year cohort. This<br />
means the rate is a measure of students who entered in ninth grade and graduate in four years. The calculation is a<br />
requirement under Title I of the Elementary and Secondary Education Act (ESEA).<br />
2. Indicator 02 (Drop out) is reported a year in arrear. This means the rate is a measure of students who dropped out in<br />
the 2009/10 school year. The Indicator 02 data are aligned with the Common Core of Data (CCD) requirements for<br />
grades 7-12.<br />
3. Indicator 04A and 4B (Suspension/Expulsion) is reported a year in arrear. This means the rate is a measure of<br />
students who had out-of-school suspensions and/or expulsions totaling more than 10 days.<br />
For a complete description of all the Indicators, please visit the special education website at<br />
http://arksped.k12.ar.us/sections/policy.html<br />
LEA: 7007 - PARKERS CHAPEL SCHOOL <strong>DISTRICT</strong><br />
Indicator 01: Graduation Rates (2009/10 school year) Indicator 02: Dropout Rates (2009/10 school year)<br />
Percent of youth<br />
with IEPs<br />
graduating from<br />
high school with a<br />
regular diploma<br />
State<br />
Rate<br />
State<br />
Target<br />
75.76% 85.00%<br />
LEA<br />
Rate<br />
100.00%<br />
Target Met<br />
by LEA<br />
(Y/N)<br />
Y<br />
Percent of<br />
youth with<br />
IEPs dropping<br />
out of high<br />
school<br />
State<br />
Rate<br />
Indicator 03: Assessment on Statewide Benchmark Exam (grades 3-8, 11)<br />
A) Adequate Yearly Progress<br />
n=40<br />
Literacy<br />
Mathematics<br />
Met Disability Subgroup "n"<br />
for Reporting Purposes (Y/N)<br />
State Target for % of Districts Meeting<br />
AYP for Disability Subgroup<br />
State<br />
Target<br />
3.06% 4.20%<br />
LEA<br />
Rate<br />
0.00%<br />
% of Districts Meeting AYP<br />
for Disability Subgroup<br />
Target Met by<br />
LEA (Y/N)<br />
Y<br />
Target Met by<br />
LEA(Y/N)<br />
Overall N 17.15% 6.25%<br />
NA<br />
N<br />
N<br />
Note: For a district to qualify as having a disability subgroup it must have a minimum of 40 (n=40) students with disabilities in a school building.<br />
B) Participation<br />
Participation Rate: # of<br />
CWD Tested ÷ # of CWD<br />
Enrolled in grades tested.<br />
Participation Rate: Literacy<br />
Participation Rate: Math<br />
Note: - - denotes not applicable<br />
State<br />
Rate<br />
98.78%<br />
State<br />
Target<br />
95.00%<br />
LEA<br />
Rate<br />
100.00%<br />
Target Met<br />
by LEA (Y/N)<br />
98.61% 95.00% 100.00% Y<br />
Y<br />
C) Performance Proficiency<br />
Percent of CWD Scoring<br />
Proficient or Above<br />
Proficiency Rate: Literacy<br />
Proficiency Rate:<br />
Mathematics<br />
16.00%<br />
16.00%<br />
State<br />
Rate<br />
31.49%<br />
44.86%<br />
State<br />
Target<br />
45.22%<br />
51.14%<br />
LEA<br />
Rate<br />
47.73%<br />
53.49%<br />
NA<br />
NA<br />
Target<br />
Met by<br />
LEA (Y/N)<br />
Y<br />
Y<br />
Page 1 of 5
LEA: 7007 - PARKERS CHAPEL SCHOOL <strong>DISTRICT</strong><br />
Indicator 04: Out-of-School Suspensions and Expulsions (2009/10 school year)<br />
A) Suspension/Expulsion<br />
Percent difference of CWD with out-of- school suspensions and<br />
expulsions totaling greater than 10 days in a school year as<br />
compared to the same data for general education students in<br />
the district.<br />
B) Suspension/Expulsion by Race and Ethnicity<br />
Percent of districts that have: (a) a significant discrepancy, by race or<br />
ethnicity, in the rate of suspensions and expulsions of greater than 10<br />
days in a school year for children with IEPs; and (b) policies,<br />
procedures or practices that contribute to the significant discrepancy<br />
and do not comply with requirements relating to the development<br />
and implementation of IEPs, the use of positive behavioral<br />
interventions and supports, and procedural safeguards.<br />
Indicator 05: School Age (5-21) Least Restrictive Environment<br />
A) In the Regular Class 80% or more of the day<br />
Percent of CWD with<br />
IEPs receiving instruction<br />
in the regular class 80%<br />
or more of the day.<br />
State<br />
Rate<br />
State<br />
Target<br />
LEA<br />
Rate<br />
B) In the Regular Class less than 40% of the day<br />
Percent of CWD with<br />
IEPs receiving instruction<br />
in the regular class less<br />
than 60% of the day.<br />
53.87% 59.77%<br />
State<br />
Rate<br />
State<br />
Target<br />
12.42% 12.51%<br />
55.74%<br />
LEA<br />
Rate<br />
1.64%<br />
C) Other Settings outside the regular class<br />
Percent of CWD with IEPs served in<br />
public or private separate schools,<br />
residential placements, or<br />
homebound/hospital placements.<br />
State<br />
Rate<br />
State<br />
Target<br />
2.80% 2.56%<br />
Target Met<br />
by LEA (Y/N)<br />
N<br />
Target Met<br />
by LEA (Y/N)<br />
Y<br />
LEA<br />
Rate<br />
0.00%<br />
Target Met<br />
by LEA(Y/N)<br />
Indicator 06: Early Childhood (3-5) Least Restrictive Environment<br />
A) Regular Early Childhood Program<br />
Percent of children (aged 3 through 5) with IEPs attending a regular<br />
early childhood program and receiving the majority of special<br />
education and related services in the regular early childhood program<br />
Allowable<br />
Difference<br />
LEA: 7007 - PARKERS CHAPEL SCHOOL <strong>DISTRICT</strong><br />
Indicator 07: Preschool (3-5) Outcomes<br />
a) Percent of preschool CWD<br />
children who did not<br />
improve functioning.<br />
b) Percent of preschool CWD<br />
who improved but whose<br />
functioning remained below<br />
same age peers.<br />
c) Percent of preschool CWD<br />
who improved at a level<br />
nearer to same aged peers.<br />
d) Percent of preschool CWD<br />
who improved functioning to<br />
reach a level comparable to<br />
same age peers.<br />
e) Percent of preschool CWD<br />
children who maintain<br />
functioning at a level<br />
comparable to same aged<br />
peers.<br />
Summary<br />
Statements<br />
1) Of those preschool<br />
children who entered<br />
the preschool program<br />
below age expectations<br />
in each Outcome, the<br />
percent who<br />
substantially increased<br />
their rate of growth by<br />
the time they turned 6<br />
years of age or exited<br />
the program.<br />
2) The percent of<br />
preschool children who<br />
were functioning<br />
within age expectations<br />
in each Outcome by the<br />
time they turned 6<br />
years of age or exited<br />
A) Positive Social -Emotional<br />
Skills*<br />
State<br />
Rate<br />
A) Positive Social -<br />
Emotional Skills<br />
(Including social<br />
relationships)<br />
State<br />
Rate<br />
2.14%<br />
5.31%<br />
25.97%<br />
38.22%<br />
28.36%<br />
State<br />
Target<br />
LEA<br />
Rate<br />
LEA<br />
Rate<br />
— —<br />
— —<br />
— —<br />
— —<br />
— —<br />
Target<br />
Met by<br />
LEA(Y/N)<br />
B) Acquisition and Use of<br />
Knowledge and Skills<br />
(Including early language/<br />
communication and early literacy)<br />
B) Acquisition and Use of<br />
Knowledge and Skills **<br />
State<br />
Rate<br />
1.75%<br />
6.59%<br />
34.23%<br />
43.51%<br />
13.92%<br />
State<br />
Target<br />
LEA<br />
Rate<br />
Target<br />
Met by<br />
LEA(Y/N)<br />
C) Use of Appropriate Behaviors<br />
to Meet Their Needs<br />
State<br />
Rate<br />
State<br />
Target<br />
LEA<br />
Rate<br />
Target<br />
Met by<br />
LEA(Y/N)<br />
89.61% 90.50% — — N/A 90.31% 90.50% — — N/A 90.82% 92.50% — — N/A<br />
66.58% 69.50% — — N/A 57.43% 60.50% — — N/A 76.69% 78.50% — — N/A<br />
NOTE: * Including social relationships ** Including early language/ communication and early literacy<br />
Note: - - denotes not applicable<br />
State<br />
Rate<br />
LEA<br />
Rate<br />
— —<br />
— —<br />
— —<br />
— —<br />
— —<br />
C) Use of<br />
Appropriate<br />
Behaviors to<br />
Meet Their Needs<br />
State<br />
Rate<br />
4.51%<br />
17.34%<br />
41.72%<br />
34.97%<br />
LEA<br />
Rate<br />
1.46% — —<br />
— —<br />
— —<br />
— —<br />
— —<br />
Page 3 of 5
LEA: 7007 - PARKERS CHAPEL SCHOOL <strong>DISTRICT</strong><br />
Indicator 08: Parent Involvement<br />
Percent of surveyed<br />
parents who reported<br />
school facilitated parent<br />
involvement as a means<br />
of improving services<br />
and results for children<br />
with disabilities.<br />
Early Childhood<br />
(3-5)<br />
School Age<br />
(5-21)<br />
State<br />
Rate<br />
90.47%<br />
95.05%<br />
Indicator 09: Disproportionality - Eligibility<br />
Disproportionate representation of racial<br />
and ethnic groups in special education and<br />
related services that is a result of<br />
inappropriate identification (e.g.<br />
monitoring data, review of policies,<br />
practices, and procedures under 618(d),<br />
etc.).<br />
State<br />
Rate<br />
State<br />
Target<br />
88.00%<br />
96.00%<br />
State<br />
Target<br />
0.00% 0.00%<br />
LEA<br />
Rate<br />
— —<br />
100.00%<br />
Indicator 10: Disproportionality-Child with a Disability<br />
Disproportionate representation of racial<br />
and ethnic groups in specific disability<br />
categories that is a result of inappropriate<br />
identification (e.g. monitoring data, review<br />
of policies, practices, and procedures under<br />
618(d), etc.).<br />
Indicator 11: Child Find<br />
Percent of children with<br />
parental consent to evaluate<br />
who are evaluated within<br />
the State established timeline<br />
of 60 days.<br />
Overall<br />
(3-21)<br />
Early Childhood<br />
(3-5)<br />
School Age<br />
(5-21)<br />
State<br />
Rate<br />
0.00%<br />
Indicator 12: Early Childhood Transition<br />
Percent of children referred by Part C prior to<br />
age 3, who are found eligible for Part B, and<br />
who have an IEP developed and implemented<br />
by their third birthday.<br />
Note: - - denotes not applicable<br />
State<br />
Rate<br />
99.41%<br />
99.70%<br />
98.97%<br />
State<br />
Rate<br />
State<br />
Target<br />
0.00%<br />
State<br />
Target<br />
100.00%<br />
100.00%<br />
100.00%<br />
State<br />
Target<br />
Target Met by<br />
LEA (Y/N)<br />
Y<br />
Target Met by<br />
LEA (Y/N)<br />
Y<br />
LEA<br />
Rate<br />
100.00%<br />
— —<br />
100.00%<br />
LEA<br />
Rate<br />
Target Met by<br />
LEA (Y/N)<br />
N/A<br />
Y<br />
Note: The target for Indicator 09 is to have zero percent<br />
(0%) of districts identified as having disproportionate<br />
representation as a result of inappropriate<br />
identification in eligibility.<br />
Note: The target for Indicator 10 is to have zero<br />
percent (0%) of districts identified as having<br />
disproportionate representation as a result of<br />
inappropriate identification in a disability<br />
category.<br />
Target Met by<br />
LEA (Y/N)<br />
N/A<br />
Y<br />
Target Met<br />
by LEA<br />
(Y/N)<br />
99.21% 100.00% - - N/A<br />
Y<br />
Note: * Indicates a zero reponse rate for the<br />
district.<br />
Page 4 of 5
LEA: 7007 - PARKERS CHAPEL SCHOOL <strong>DISTRICT</strong><br />
Indicator 13: Secondary Transition<br />
Percent of youth with disabilities aged 16 and<br />
up with an IEP that includes coordinated,<br />
measurable, annual IEP goals and transition<br />
services that will reasonably enable the student<br />
to meet the post-secondary goals.<br />
Indicator 14: Post-School Outcomes<br />
A. Percent of youth enrolled in higher<br />
education within one year of leaving high<br />
school.<br />
State<br />
Rate<br />
State<br />
Target<br />
Note: Data for this Indicator is from the on-site monitoring of LEAs for the given year.<br />
B. Percent of youth enrolled in higher<br />
education or competitively employed<br />
within one year of leaving high school.<br />
C. Percent of youth enrolled in higher<br />
education or in some other postsecondary<br />
education or training program; or<br />
competitively employed or in some other<br />
employment within one year of leaving<br />
high school.<br />
State<br />
Rate<br />
Indicator 20: Reported Data-Timely and Accurate*<br />
District submitted<br />
required data elements<br />
on or before due dates;<br />
made revisions within<br />
the alloted reveiw<br />
periods.<br />
Accurate and Timely<br />
Data Submission<br />
Overall (3-21)<br />
Early Childhood (3-5)<br />
School Age (5-21)<br />
State<br />
Target<br />
100.00%<br />
100.00%<br />
100.00%<br />
State<br />
Target<br />
LEA<br />
Rate<br />
LEA<br />
Rate<br />
Target Met by<br />
LEA (Y/N)<br />
Target Met<br />
by LEA<br />
(Y/N)<br />
Target Met<br />
by LEA<br />
(Y/N)<br />
*Data reviewed for timely and accurate submissions included all APSCN cycle data except for personnel<br />
Note: - - denotes not applicable<br />
96.19 100.00 — — N/A<br />
14.53<br />
State<br />
Rate<br />
49.42<br />
State<br />
Rate<br />
54.07<br />
13.00<br />
State<br />
Target<br />
49.00<br />
State<br />
Target<br />
60.00<br />
Y<br />
N/A<br />
Y<br />
— —<br />
LEA<br />
Rate<br />
— —<br />
LEA<br />
Rate<br />
— —<br />
N/A<br />
Target Met<br />
by LEA<br />
(Y/N)<br />
N/A<br />
Target Met<br />
by LEA<br />
(Y/N)<br />
N/A<br />
Page 5 of 5
<strong>ARKANSAS</strong> <strong>SPECIAL</strong> <strong>EDUCATION</strong><br />
<strong>DISTRICT</strong> <strong>ANNUAL</strong> PERFORMANCE REPORT<br />
2010/11 School Year<br />
Publication Date: March 2012<br />
Each State must have in place a State Performance Plan (SPP) to evaluate the State's efforts to meet the requirements and<br />
purposes of the implementation of the Individuals with Disabilities Education Act (IDEA). The SPP is a six-year plan, which<br />
describes Arkansas's performance on 20 indicators. The Office of Special Education Programs in the U. S. Department of<br />
Education requires that States report annually to the public on the performance of each local education agency (LEA) on 14 of<br />
20 indicators as compared with targets established by the State in the SPP. Arkansas will report indicators 1 through 14 and<br />
20 for each LEA serving children with disabilities (CWD). Any LEA not meeting targets on compliance indicators (0% for<br />
Indicators 4B, 09 & 10 and 100% for Indicators 11, 12, 13, and 20) are non-compliant with IDEA.<br />
There are no report changes for the 2010/11 school year profile; However, it is important to recognize that: .<br />
1. Indicator 01 (Graduation) is reported a year in arrear (2009/10 graduates) and is based on a four-year cohort. This<br />
means the rate is a measure of students who entered in ninth grade and graduate in four years. The calculation is a<br />
requirement under Title I of the Elementary and Secondary Education Act (ESEA).<br />
2. Indicator 02 (Drop out) is reported a year in arrear. This means the rate is a measure of students who dropped out in<br />
the 2009/10 school year. The Indicator 02 data are aligned with the Common Core of Data (CCD) requirements for<br />
grades 7-12.<br />
3. Indicator 04A and 4B (Suspension/Expulsion) is reported a year in arrear. This means the rate is a measure of<br />
students who had out-of-school suspensions and/or expulsions totaling more than 10 days.<br />
For a complete description of all the Indicators, please visit the special education website at<br />
http://arksped.k12.ar.us/sections/policy.html<br />
LEA: 7008 - SMACKOVER SCHOOL <strong>DISTRICT</strong><br />
Indicator 01: Graduation Rates (2009/10 school year) Indicator 02: Dropout Rates (2009/10 school year)<br />
Percent of youth<br />
with IEPs<br />
graduating from<br />
high school with a<br />
regular diploma<br />
State<br />
Rate<br />
State<br />
Target<br />
75.76% 85.00%<br />
LEA<br />
Rate<br />
83.33%<br />
Target Met<br />
by LEA<br />
(Y/N)<br />
N<br />
Percent of<br />
youth with<br />
IEPs dropping<br />
out of high<br />
school<br />
State<br />
Rate<br />
Indicator 03: Assessment on Statewide Benchmark Exam (grades 3-8, 11)<br />
A) Adequate Yearly Progress<br />
n=40<br />
Literacy<br />
Mathematics<br />
Met Disability Subgroup "n"<br />
for Reporting Purposes (Y/N)<br />
State Target for % of Districts Meeting<br />
AYP for Disability Subgroup<br />
State<br />
Target<br />
3.06% 4.20%<br />
LEA<br />
Rate<br />
2.44%<br />
% of Districts Meeting AYP<br />
for Disability Subgroup<br />
Target Met by<br />
LEA (Y/N)<br />
Y<br />
Target Met by<br />
LEA(Y/N)<br />
Overall N 17.15% 6.25%<br />
NA<br />
N<br />
N<br />
Note: For a district to qualify as having a disability subgroup it must have a minimum of 40 (n=40) students with disabilities in a school building.<br />
B) Participation<br />
Participation Rate: # of<br />
CWD Tested ÷ # of CWD<br />
Enrolled in grades tested.<br />
Participation Rate: Literacy<br />
Participation Rate: Math<br />
Note: - - denotes not applicable<br />
State<br />
Rate<br />
98.78%<br />
State<br />
Target<br />
95.00%<br />
LEA<br />
Rate<br />
100.00%<br />
Target Met<br />
by LEA (Y/N)<br />
98.61% 95.00% 97.22% Y<br />
Y<br />
C) Performance Proficiency<br />
Percent of CWD Scoring<br />
Proficient or Above<br />
Proficiency Rate: Literacy<br />
Proficiency Rate:<br />
Mathematics<br />
16.00%<br />
16.00%<br />
State<br />
Rate<br />
31.49%<br />
44.86%<br />
State<br />
Target<br />
45.22%<br />
51.14%<br />
LEA<br />
Rate<br />
32.43%<br />
27.27%<br />
NA<br />
NA<br />
Target<br />
Met by<br />
LEA (Y/N)<br />
N<br />
N<br />
Page 1 of 5
LEA: 7008 - SMACKOVER SCHOOL <strong>DISTRICT</strong><br />
Indicator 04: Out-of-School Suspensions and Expulsions (2009/10 school year)<br />
A) Suspension/Expulsion<br />
Percent difference of CWD with out-of- school suspensions and<br />
expulsions totaling greater than 10 days in a school year as<br />
compared to the same data for general education students in<br />
the district.<br />
B) Suspension/Expulsion by Race and Ethnicity<br />
Percent of districts that have: (a) a significant discrepancy, by race or<br />
ethnicity, in the rate of suspensions and expulsions of greater than 10<br />
days in a school year for children with IEPs; and (b) policies,<br />
procedures or practices that contribute to the significant discrepancy<br />
and do not comply with requirements relating to the development<br />
and implementation of IEPs, the use of positive behavioral<br />
interventions and supports, and procedural safeguards.<br />
Indicator 05: School Age (5-21) Least Restrictive Environment<br />
A) In the Regular Class 80% or more of the day<br />
Percent of CWD with<br />
IEPs receiving instruction<br />
in the regular class 80%<br />
or more of the day.<br />
State<br />
Rate<br />
State<br />
Target<br />
LEA<br />
Rate<br />
B) In the Regular Class less than 40% of the day<br />
Percent of CWD with<br />
IEPs receiving instruction<br />
in the regular class less<br />
than 60% of the day.<br />
53.87% 59.77%<br />
State<br />
Rate<br />
State<br />
Target<br />
12.42% 12.51%<br />
63.01%<br />
LEA<br />
Rate<br />
4.11%<br />
C) Other Settings outside the regular class<br />
Percent of CWD with IEPs served in<br />
public or private separate schools,<br />
residential placements, or<br />
homebound/hospital placements.<br />
State<br />
Rate<br />
State<br />
Target<br />
2.80% 2.56%<br />
Target Met<br />
by LEA (Y/N)<br />
Y<br />
Target Met<br />
by LEA (Y/N)<br />
Y<br />
LEA<br />
Rate<br />
0.00%<br />
Target Met<br />
by LEA(Y/N)<br />
Indicator 06: Early Childhood (3-5) Least Restrictive Environment<br />
A) Regular Early Childhood Program<br />
Percent of children (aged 3 through 5) with IEPs attending a regular<br />
early childhood program and receiving the majority of special<br />
education and related services in the regular early childhood program<br />
Allowable<br />
Difference<br />
LEA: 7008 - SMACKOVER SCHOOL <strong>DISTRICT</strong><br />
Indicator 07: Preschool (3-5) Outcomes<br />
a) Percent of preschool CWD<br />
children who did not<br />
improve functioning.<br />
b) Percent of preschool CWD<br />
who improved but whose<br />
functioning remained below<br />
same age peers.<br />
c) Percent of preschool CWD<br />
who improved at a level<br />
nearer to same aged peers.<br />
d) Percent of preschool CWD<br />
who improved functioning to<br />
reach a level comparable to<br />
same age peers.<br />
e) Percent of preschool CWD<br />
children who maintain<br />
functioning at a level<br />
comparable to same aged<br />
peers.<br />
Summary<br />
Statements<br />
1) Of those preschool<br />
children who entered<br />
the preschool program<br />
below age expectations<br />
in each Outcome, the<br />
percent who<br />
substantially increased<br />
their rate of growth by<br />
the time they turned 6<br />
years of age or exited<br />
the program.<br />
2) The percent of<br />
preschool children who<br />
were functioning<br />
within age expectations<br />
in each Outcome by the<br />
time they turned 6<br />
years of age or exited<br />
A) Positive Social -Emotional<br />
Skills*<br />
State<br />
Rate<br />
A) Positive Social -<br />
Emotional Skills<br />
(Including social<br />
relationships)<br />
State<br />
Rate<br />
2.14%<br />
5.31%<br />
25.97%<br />
38.22%<br />
28.36%<br />
State<br />
Target<br />
LEA<br />
Rate<br />
LEA<br />
Rate<br />
— —<br />
— —<br />
— —<br />
— —<br />
— —<br />
Target<br />
Met by<br />
LEA(Y/N)<br />
B) Acquisition and Use of<br />
Knowledge and Skills<br />
(Including early language/<br />
communication and early literacy)<br />
B) Acquisition and Use of<br />
Knowledge and Skills **<br />
State<br />
Rate<br />
1.75%<br />
6.59%<br />
34.23%<br />
43.51%<br />
13.92%<br />
State<br />
Target<br />
LEA<br />
Rate<br />
Target<br />
Met by<br />
LEA(Y/N)<br />
C) Use of Appropriate Behaviors<br />
to Meet Their Needs<br />
State<br />
Rate<br />
State<br />
Target<br />
LEA<br />
Rate<br />
Target<br />
Met by<br />
LEA(Y/N)<br />
89.61% 90.50% — — N/A 90.31% 90.50% — — N/A 90.82% 92.50% — — N/A<br />
66.58% 69.50% — — N/A 57.43% 60.50% — — N/A 76.69% 78.50% — — N/A<br />
NOTE: * Including social relationships ** Including early language/ communication and early literacy<br />
Note: - - denotes not applicable<br />
State<br />
Rate<br />
LEA<br />
Rate<br />
— —<br />
— —<br />
— —<br />
— —<br />
— —<br />
C) Use of<br />
Appropriate<br />
Behaviors to<br />
Meet Their Needs<br />
State<br />
Rate<br />
4.51%<br />
17.34%<br />
41.72%<br />
34.97%<br />
LEA<br />
Rate<br />
1.46% — —<br />
— —<br />
— —<br />
— —<br />
— —<br />
Page 3 of 5
LEA: 7008 - SMACKOVER SCHOOL <strong>DISTRICT</strong><br />
Indicator 08: Parent Involvement<br />
Percent of surveyed<br />
parents who reported<br />
school facilitated parent<br />
involvement as a means<br />
of improving services<br />
and results for children<br />
with disabilities.<br />
Early Childhood<br />
(3-5)<br />
School Age<br />
(5-21)<br />
State<br />
Rate<br />
90.47%<br />
95.05%<br />
Indicator 09: Disproportionality - Eligibility<br />
Disproportionate representation of racial<br />
and ethnic groups in special education and<br />
related services that is a result of<br />
inappropriate identification (e.g.<br />
monitoring data, review of policies,<br />
practices, and procedures under 618(d),<br />
etc.).<br />
State<br />
Rate<br />
State<br />
Target<br />
88.00%<br />
96.00%<br />
State<br />
Target<br />
0.00% 0.00%<br />
LEA<br />
Rate<br />
— —<br />
100.00%<br />
Indicator 10: Disproportionality-Child with a Disability<br />
Disproportionate representation of racial<br />
and ethnic groups in specific disability<br />
categories that is a result of inappropriate<br />
identification (e.g. monitoring data, review<br />
of policies, practices, and procedures under<br />
618(d), etc.).<br />
Indicator 11: Child Find<br />
Percent of children with<br />
parental consent to evaluate<br />
who are evaluated within<br />
the State established timeline<br />
of 60 days.<br />
Overall<br />
(3-21)<br />
Early Childhood<br />
(3-5)<br />
School Age<br />
(5-21)<br />
State<br />
Rate<br />
0.00%<br />
Indicator 12: Early Childhood Transition<br />
Percent of children referred by Part C prior to<br />
age 3, who are found eligible for Part B, and<br />
who have an IEP developed and implemented<br />
by their third birthday.<br />
Note: - - denotes not applicable<br />
State<br />
Rate<br />
99.41%<br />
99.70%<br />
98.97%<br />
State<br />
Rate<br />
State<br />
Target<br />
0.00%<br />
State<br />
Target<br />
100.00%<br />
100.00%<br />
100.00%<br />
State<br />
Target<br />
Target Met by<br />
LEA (Y/N)<br />
Y<br />
Target Met by<br />
LEA (Y/N)<br />
Y<br />
LEA<br />
Rate<br />
100.00%<br />
— —<br />
100.00%<br />
LEA<br />
Rate<br />
Target Met by<br />
LEA (Y/N)<br />
N/A<br />
Y<br />
Note: The target for Indicator 09 is to have zero percent<br />
(0%) of districts identified as having disproportionate<br />
representation as a result of inappropriate<br />
identification in eligibility.<br />
Note: The target for Indicator 10 is to have zero<br />
percent (0%) of districts identified as having<br />
disproportionate representation as a result of<br />
inappropriate identification in a disability<br />
category.<br />
Target Met by<br />
LEA (Y/N)<br />
N/A<br />
Y<br />
Target Met<br />
by LEA<br />
(Y/N)<br />
99.21% 100.00% - - N/A<br />
Y<br />
Note: * Indicates a zero reponse rate for the<br />
district.<br />
Page 4 of 5
LEA: 7008 - SMACKOVER SCHOOL <strong>DISTRICT</strong><br />
Indicator 13: Secondary Transition<br />
Percent of youth with disabilities aged 16 and<br />
up with an IEP that includes coordinated,<br />
measurable, annual IEP goals and transition<br />
services that will reasonably enable the student<br />
to meet the post-secondary goals.<br />
Indicator 14: Post-School Outcomes<br />
A. Percent of youth enrolled in higher<br />
education within one year of leaving high<br />
school.<br />
State<br />
Rate<br />
State<br />
Target<br />
Note: Data for this Indicator is from the on-site monitoring of LEAs for the given year.<br />
B. Percent of youth enrolled in higher<br />
education or competitively employed<br />
within one year of leaving high school.<br />
C. Percent of youth enrolled in higher<br />
education or in some other postsecondary<br />
education or training program; or<br />
competitively employed or in some other<br />
employment within one year of leaving<br />
high school.<br />
State<br />
Rate<br />
Indicator 20: Reported Data-Timely and Accurate*<br />
District submitted<br />
required data elements<br />
on or before due dates;<br />
made revisions within<br />
the alloted reveiw<br />
periods.<br />
Accurate and Timely<br />
Data Submission<br />
Overall (3-21)<br />
Early Childhood (3-5)<br />
School Age (5-21)<br />
State<br />
Target<br />
100.00%<br />
100.00%<br />
100.00%<br />
State<br />
Target<br />
LEA<br />
Rate<br />
LEA<br />
Rate<br />
Target Met by<br />
LEA (Y/N)<br />
Target Met<br />
by LEA<br />
(Y/N)<br />
Target Met<br />
by LEA<br />
(Y/N)<br />
*Data reviewed for timely and accurate submissions included all APSCN cycle data except for personnel<br />
Note: - - denotes not applicable<br />
96.19 100.00 — — N/A<br />
14.53<br />
State<br />
Rate<br />
49.42<br />
State<br />
Rate<br />
54.07<br />
13.00<br />
State<br />
Target<br />
49.00<br />
State<br />
Target<br />
60.00<br />
Y<br />
N/A<br />
Y<br />
— —<br />
LEA<br />
Rate<br />
— —<br />
LEA<br />
Rate<br />
— —<br />
N/A<br />
Target Met<br />
by LEA<br />
(Y/N)<br />
N/A<br />
Target Met<br />
by LEA<br />
(Y/N)<br />
N/A<br />
Page 5 of 5
<strong>ARKANSAS</strong> <strong>SPECIAL</strong> <strong>EDUCATION</strong><br />
<strong>DISTRICT</strong> <strong>ANNUAL</strong> PERFORMANCE REPORT<br />
2010/11 School Year<br />
Publication Date: March 2012<br />
Each State must have in place a State Performance Plan (SPP) to evaluate the State's efforts to meet the requirements and<br />
purposes of the implementation of the Individuals with Disabilities Education Act (IDEA). The SPP is a six-year plan, which<br />
describes Arkansas's performance on 20 indicators. The Office of Special Education Programs in the U. S. Department of<br />
Education requires that States report annually to the public on the performance of each local education agency (LEA) on 14 of<br />
20 indicators as compared with targets established by the State in the SPP. Arkansas will report indicators 1 through 14 and<br />
20 for each LEA serving children with disabilities (CWD). Any LEA not meeting targets on compliance indicators (0% for<br />
Indicators 4B, 09 & 10 and 100% for Indicators 11, 12, 13, and 20) are non-compliant with IDEA.<br />
There are no report changes for the 2010/11 school year profile; However, it is important to recognize that: .<br />
1. Indicator 01 (Graduation) is reported a year in arrear (2009/10 graduates) and is based on a four-year cohort. This<br />
means the rate is a measure of students who entered in ninth grade and graduate in four years. The calculation is a<br />
requirement under Title I of the Elementary and Secondary Education Act (ESEA).<br />
2. Indicator 02 (Drop out) is reported a year in arrear. This means the rate is a measure of students who dropped out in<br />
the 2009/10 school year. The Indicator 02 data are aligned with the Common Core of Data (CCD) requirements for<br />
grades 7-12.<br />
3. Indicator 04A and 4B (Suspension/Expulsion) is reported a year in arrear. This means the rate is a measure of<br />
students who had out-of-school suspensions and/or expulsions totaling more than 10 days.<br />
For a complete description of all the Indicators, please visit the special education website at<br />
http://arksped.k12.ar.us/sections/policy.html<br />
LEA: 7009 - STRONG-HUTTIG SCHOOL <strong>DISTRICT</strong><br />
Indicator 01: Graduation Rates (2009/10 school year) Indicator 02: Dropout Rates (2009/10 school year)<br />
Percent of youth<br />
with IEPs<br />
graduating from<br />
high school with a<br />
regular diploma<br />
State<br />
Rate<br />
State<br />
Target<br />
75.76% 85.00%<br />
LEA<br />
Rate<br />
100.00%<br />
Target Met<br />
by LEA<br />
(Y/N)<br />
Y<br />
Percent of<br />
youth with<br />
IEPs dropping<br />
out of high<br />
school<br />
State<br />
Rate<br />
Indicator 03: Assessment on Statewide Benchmark Exam (grades 3-8, 11)<br />
A) Adequate Yearly Progress<br />
n=40<br />
Literacy<br />
Mathematics<br />
Met Disability Subgroup "n"<br />
for Reporting Purposes (Y/N)<br />
State Target for % of Districts Meeting<br />
AYP for Disability Subgroup<br />
State<br />
Target<br />
3.06% 4.20%<br />
LEA<br />
Rate<br />
0.00%<br />
% of Districts Meeting AYP<br />
for Disability Subgroup<br />
Target Met by<br />
LEA (Y/N)<br />
Y<br />
Target Met by<br />
LEA(Y/N)<br />
Overall N 17.15% 6.25%<br />
NA<br />
N<br />
N<br />
Note: For a district to qualify as having a disability subgroup it must have a minimum of 40 (n=40) students with disabilities in a school building.<br />
B) Participation<br />
Participation Rate: # of<br />
CWD Tested ÷ # of CWD<br />
Enrolled in grades tested.<br />
Participation Rate: Literacy<br />
Participation Rate: Math<br />
Note: - - denotes not applicable<br />
State<br />
Rate<br />
98.78%<br />
State<br />
Target<br />
95.00%<br />
LEA<br />
Rate<br />
100.00%<br />
Target Met<br />
by LEA (Y/N)<br />
98.61% 95.00% 100.00% Y<br />
Y<br />
C) Performance Proficiency<br />
Percent of CWD Scoring<br />
Proficient or Above<br />
Proficiency Rate: Literacy<br />
Proficiency Rate:<br />
Mathematics<br />
16.00%<br />
16.00%<br />
State<br />
Rate<br />
31.49%<br />
44.86%<br />
State<br />
Target<br />
45.22%<br />
51.14%<br />
LEA<br />
Rate<br />
20.69%<br />
34.48%<br />
NA<br />
NA<br />
Target<br />
Met by<br />
LEA (Y/N)<br />
N<br />
N<br />
Page 1 of 5
LEA: 7009 - STRONG-HUTTIG SCHOOL <strong>DISTRICT</strong><br />
Indicator 04: Out-of-School Suspensions and Expulsions (2009/10 school year)<br />
A) Suspension/Expulsion<br />
Percent difference of CWD with out-of- school suspensions and<br />
expulsions totaling greater than 10 days in a school year as<br />
compared to the same data for general education students in<br />
the district.<br />
B) Suspension/Expulsion by Race and Ethnicity<br />
Percent of districts that have: (a) a significant discrepancy, by race or<br />
ethnicity, in the rate of suspensions and expulsions of greater than 10<br />
days in a school year for children with IEPs; and (b) policies,<br />
procedures or practices that contribute to the significant discrepancy<br />
and do not comply with requirements relating to the development<br />
and implementation of IEPs, the use of positive behavioral<br />
interventions and supports, and procedural safeguards.<br />
Indicator 05: School Age (5-21) Least Restrictive Environment<br />
A) In the Regular Class 80% or more of the day<br />
Percent of CWD with<br />
IEPs receiving instruction<br />
in the regular class 80%<br />
or more of the day.<br />
State<br />
Rate<br />
State<br />
Target<br />
LEA<br />
Rate<br />
B) In the Regular Class less than 40% of the day<br />
Percent of CWD with<br />
IEPs receiving instruction<br />
in the regular class less<br />
than 60% of the day.<br />
53.87% 59.77%<br />
State<br />
Rate<br />
State<br />
Target<br />
12.42% 12.51%<br />
73.08%<br />
LEA<br />
Rate<br />
9.62%<br />
C) Other Settings outside the regular class<br />
Percent of CWD with IEPs served in<br />
public or private separate schools,<br />
residential placements, or<br />
homebound/hospital placements.<br />
State<br />
Rate<br />
State<br />
Target<br />
2.80% 2.56%<br />
Target Met<br />
by LEA (Y/N)<br />
Y<br />
Target Met<br />
by LEA (Y/N)<br />
Y<br />
LEA<br />
Rate<br />
0.00%<br />
Target Met<br />
by LEA(Y/N)<br />
Indicator 06: Early Childhood (3-5) Least Restrictive Environment<br />
A) Regular Early Childhood Program<br />
Percent of children (aged 3 through 5) with IEPs attending a regular<br />
early childhood program and receiving the majority of special<br />
education and related services in the regular early childhood program<br />
Allowable<br />
Difference<br />
LEA: 7009 - STRONG-HUTTIG SCHOOL <strong>DISTRICT</strong><br />
Indicator 07: Preschool (3-5) Outcomes<br />
a) Percent of preschool CWD<br />
children who did not<br />
improve functioning.<br />
b) Percent of preschool CWD<br />
who improved but whose<br />
functioning remained below<br />
same age peers.<br />
c) Percent of preschool CWD<br />
who improved at a level<br />
nearer to same aged peers.<br />
d) Percent of preschool CWD<br />
who improved functioning to<br />
reach a level comparable to<br />
same age peers.<br />
e) Percent of preschool CWD<br />
children who maintain<br />
functioning at a level<br />
comparable to same aged<br />
peers.<br />
Summary<br />
Statements<br />
1) Of those preschool<br />
children who entered<br />
the preschool program<br />
below age expectations<br />
in each Outcome, the<br />
percent who<br />
substantially increased<br />
their rate of growth by<br />
the time they turned 6<br />
years of age or exited<br />
the program.<br />
2) The percent of<br />
preschool children who<br />
were functioning<br />
within age expectations<br />
in each Outcome by the<br />
time they turned 6<br />
years of age or exited<br />
A) Positive Social -Emotional<br />
Skills*<br />
State<br />
Rate<br />
A) Positive Social -<br />
Emotional Skills<br />
(Including social<br />
relationships)<br />
State<br />
Rate<br />
2.14%<br />
5.31%<br />
25.97%<br />
38.22%<br />
28.36%<br />
State<br />
Target<br />
LEA<br />
Rate<br />
LEA<br />
Rate<br />
— —<br />
— —<br />
— —<br />
— —<br />
— —<br />
Target<br />
Met by<br />
LEA(Y/N)<br />
B) Acquisition and Use of<br />
Knowledge and Skills<br />
(Including early language/<br />
communication and early literacy)<br />
B) Acquisition and Use of<br />
Knowledge and Skills **<br />
State<br />
Rate<br />
1.75%<br />
6.59%<br />
34.23%<br />
43.51%<br />
13.92%<br />
State<br />
Target<br />
LEA<br />
Rate<br />
Target<br />
Met by<br />
LEA(Y/N)<br />
C) Use of Appropriate Behaviors<br />
to Meet Their Needs<br />
State<br />
Rate<br />
State<br />
Target<br />
LEA<br />
Rate<br />
Target<br />
Met by<br />
LEA(Y/N)<br />
89.61% 90.50% — — N/A 90.31% 90.50% — — N/A 90.82% 92.50% — — N/A<br />
66.58% 69.50% — — N/A 57.43% 60.50% — — N/A 76.69% 78.50% — — N/A<br />
NOTE: * Including social relationships ** Including early language/ communication and early literacy<br />
Note: - - denotes not applicable<br />
State<br />
Rate<br />
LEA<br />
Rate<br />
— —<br />
— —<br />
— —<br />
— —<br />
— —<br />
C) Use of<br />
Appropriate<br />
Behaviors to<br />
Meet Their Needs<br />
State<br />
Rate<br />
4.51%<br />
17.34%<br />
41.72%<br />
34.97%<br />
LEA<br />
Rate<br />
1.46% — —<br />
— —<br />
— —<br />
— —<br />
— —<br />
Page 3 of 5
LEA: 7009 - STRONG-HUTTIG SCHOOL <strong>DISTRICT</strong><br />
Indicator 08: Parent Involvement<br />
Percent of surveyed<br />
parents who reported<br />
school facilitated parent<br />
involvement as a means<br />
of improving services<br />
and results for children<br />
with disabilities.<br />
Early Childhood<br />
(3-5)<br />
School Age<br />
(5-21)<br />
State<br />
Rate<br />
90.47%<br />
95.05%<br />
Indicator 09: Disproportionality - Eligibility<br />
Disproportionate representation of racial<br />
and ethnic groups in special education and<br />
related services that is a result of<br />
inappropriate identification (e.g.<br />
monitoring data, review of policies,<br />
practices, and procedures under 618(d),<br />
etc.).<br />
State<br />
Rate<br />
State<br />
Target<br />
88.00%<br />
96.00%<br />
State<br />
Target<br />
0.00% 0.00%<br />
LEA<br />
Rate<br />
— —<br />
100.00%<br />
Indicator 10: Disproportionality-Child with a Disability<br />
Disproportionate representation of racial<br />
and ethnic groups in specific disability<br />
categories that is a result of inappropriate<br />
identification (e.g. monitoring data, review<br />
of policies, practices, and procedures under<br />
618(d), etc.).<br />
Indicator 11: Child Find<br />
Percent of children with<br />
parental consent to evaluate<br />
who are evaluated within<br />
the State established timeline<br />
of 60 days.<br />
Overall<br />
(3-21)<br />
Early Childhood<br />
(3-5)<br />
School Age<br />
(5-21)<br />
State<br />
Rate<br />
0.00%<br />
Indicator 12: Early Childhood Transition<br />
Percent of children referred by Part C prior to<br />
age 3, who are found eligible for Part B, and<br />
who have an IEP developed and implemented<br />
by their third birthday.<br />
Note: - - denotes not applicable<br />
State<br />
Rate<br />
99.41%<br />
99.70%<br />
98.97%<br />
State<br />
Rate<br />
State<br />
Target<br />
0.00%<br />
State<br />
Target<br />
100.00%<br />
100.00%<br />
100.00%<br />
State<br />
Target<br />
Target Met by<br />
LEA (Y/N)<br />
Y<br />
Target Met by<br />
LEA (Y/N)<br />
Y<br />
LEA<br />
Rate<br />
100.00%<br />
— —<br />
100.00%<br />
LEA<br />
Rate<br />
Target Met by<br />
LEA (Y/N)<br />
N/A<br />
Y<br />
Note: The target for Indicator 09 is to have zero percent<br />
(0%) of districts identified as having disproportionate<br />
representation as a result of inappropriate<br />
identification in eligibility.<br />
Note: The target for Indicator 10 is to have zero<br />
percent (0%) of districts identified as having<br />
disproportionate representation as a result of<br />
inappropriate identification in a disability<br />
category.<br />
Target Met by<br />
LEA (Y/N)<br />
N/A<br />
Y<br />
Target Met<br />
by LEA<br />
(Y/N)<br />
99.21% 100.00% - - N/A<br />
Y<br />
Note: * Indicates a zero reponse rate for the<br />
district.<br />
Page 4 of 5
LEA: 7009 - STRONG-HUTTIG SCHOOL <strong>DISTRICT</strong><br />
Indicator 13: Secondary Transition<br />
Percent of youth with disabilities aged 16 and<br />
up with an IEP that includes coordinated,<br />
measurable, annual IEP goals and transition<br />
services that will reasonably enable the student<br />
to meet the post-secondary goals.<br />
Indicator 14: Post-School Outcomes<br />
A. Percent of youth enrolled in higher<br />
education within one year of leaving high<br />
school.<br />
State<br />
Rate<br />
State<br />
Target<br />
Note: Data for this Indicator is from the on-site monitoring of LEAs for the given year.<br />
B. Percent of youth enrolled in higher<br />
education or competitively employed<br />
within one year of leaving high school.<br />
C. Percent of youth enrolled in higher<br />
education or in some other postsecondary<br />
education or training program; or<br />
competitively employed or in some other<br />
employment within one year of leaving<br />
high school.<br />
State<br />
Rate<br />
Indicator 20: Reported Data-Timely and Accurate*<br />
District submitted<br />
required data elements<br />
on or before due dates;<br />
made revisions within<br />
the alloted reveiw<br />
periods.<br />
Accurate and Timely<br />
Data Submission<br />
Overall (3-21)<br />
Early Childhood (3-5)<br />
School Age (5-21)<br />
State<br />
Target<br />
100.00%<br />
100.00%<br />
100.00%<br />
State<br />
Target<br />
LEA<br />
Rate<br />
LEA<br />
Rate<br />
Target Met by<br />
LEA (Y/N)<br />
Target Met<br />
by LEA<br />
(Y/N)<br />
Target Met<br />
by LEA<br />
(Y/N)<br />
*Data reviewed for timely and accurate submissions included all APSCN cycle data except for personnel<br />
Note: - - denotes not applicable<br />
96.19 100.00 100.00% Y<br />
14.53<br />
State<br />
Rate<br />
49.42<br />
State<br />
Rate<br />
54.07<br />
13.00<br />
State<br />
Target<br />
49.00<br />
State<br />
Target<br />
60.00<br />
Y<br />
N/A<br />
Y<br />
— —<br />
LEA<br />
Rate<br />
— —<br />
LEA<br />
Rate<br />
— —<br />
N/A<br />
Target Met<br />
by LEA<br />
(Y/N)<br />
N/A<br />
Target Met<br />
by LEA<br />
(Y/N)<br />
N/A<br />
Page 5 of 5
LEA: 7102 - CLINTON SCHOOL <strong>DISTRICT</strong><br />
<strong>ARKANSAS</strong> <strong>SPECIAL</strong> <strong>EDUCATION</strong><br />
<strong>DISTRICT</strong> <strong>ANNUAL</strong> PERFORMANCE REPORT<br />
2010/11 School Year<br />
Publication Date: March 2012<br />
Each State must have in place a State Performance Plan (SPP) to evaluate the State's efforts to meet the requirements and<br />
purposes of the implementation of the Individuals with Disabilities Education Act (IDEA). The SPP is a six-year plan, which<br />
describes Arkansas's performance on 20 indicators. The Office of Special Education Programs in the U. S. Department of<br />
Education requires that States report annually to the public on the performance of each local education agency (LEA) on 14 of<br />
20 indicators as compared with targets established by the State in the SPP. Arkansas will report indicators 1 through 14 and<br />
20 for each LEA serving children with disabilities (CWD). Any LEA not meeting targets on compliance indicators (0% for<br />
Indicators 4B, 09 & 10 and 100% for Indicators 11, 12, 13, and 20) are non-compliant with IDEA.<br />
There are no report changes for the 2010/11 school year profile; However, it is important to recognize that: .<br />
1. Indicator 01 (Graduation) is reported a year in arrear (2009/10 graduates) and is based on a four-year cohort. This<br />
means the rate is a measure of students who entered in ninth grade and graduate in four years. The calculation is a<br />
requirement under Title I of the Elementary and Secondary Education Act (ESEA).<br />
2. Indicator 02 (Drop out) is reported a year in arrear. This means the rate is a measure of students who dropped out in<br />
the 2009/10 school year. The Indicator 02 data are aligned with the Common Core of Data (CCD) requirements for<br />
grades 7-12.<br />
3. Indicator 04A and 4B (Suspension/Expulsion) is reported a year in arrear. This means the rate is a measure of<br />
students who had out-of-school suspensions and/or expulsions totaling more than 10 days.<br />
Percent of youth<br />
with IEPs<br />
graduating from<br />
high school with a<br />
regular diploma<br />
For a complete description of all the Indicators, please visit the special education website at<br />
http://arksped.k12.ar.us/sections/policy.html<br />
Indicator 01: Graduation Rates (2009/10 school year) Indicator 02: Dropout Rates (2009/10 school year)<br />
State<br />
Rate<br />
State<br />
Target<br />
75.76% 85.00%<br />
LEA<br />
Rate<br />
83.33%<br />
Target Met<br />
by LEA<br />
(Y/N)<br />
N<br />
Percent of<br />
youth with<br />
IEPs dropping<br />
out of high<br />
school<br />
State<br />
Rate<br />
Indicator 03: Assessment on Statewide Benchmark Exam (grades 3-8, 11)<br />
A) Adequate Yearly Progress<br />
n=40<br />
Literacy<br />
Mathematics<br />
Met Disability Subgroup "n"<br />
for Reporting Purposes (Y/N)<br />
State Target for % of Districts Meeting<br />
AYP for Disability Subgroup<br />
State<br />
Target<br />
3.06% 4.20%<br />
LEA<br />
Rate<br />
2.25%<br />
% of Districts Meeting AYP<br />
for Disability Subgroup<br />
Target Met by<br />
LEA (Y/N)<br />
Y<br />
Target Met by<br />
LEA(Y/N)<br />
Overall N 17.15% 6.25%<br />
NA<br />
N<br />
N<br />
Note: For a district to qualify as having a disability subgroup it must have a minimum of 40 (n=40) students with disabilities in a school building.<br />
B) Participation<br />
Participation Rate: # of<br />
CWD Tested ÷ # of CWD<br />
Enrolled in grades tested.<br />
Participation Rate: Literacy<br />
Participation Rate: Math<br />
Note: - - denotes not applicable<br />
State<br />
Rate<br />
98.78%<br />
State<br />
Target<br />
95.00%<br />
LEA<br />
Rate<br />
99.00%<br />
Target Met<br />
by LEA (Y/N)<br />
98.61% 95.00% 98.96% Y<br />
Y<br />
C) Performance Proficiency<br />
Percent of CWD Scoring<br />
Proficient or Above<br />
Proficiency Rate: Literacy<br />
Proficiency Rate:<br />
Mathematics<br />
16.00%<br />
16.00%<br />
State<br />
Rate<br />
31.49%<br />
44.86%<br />
State<br />
Target<br />
45.22%<br />
51.14%<br />
LEA<br />
Rate<br />
31.18%<br />
52.22%<br />
NA<br />
NA<br />
Target<br />
Met by<br />
LEA (Y/N)<br />
N<br />
Y<br />
Page 1 of 5
LEA: 7102 - CLINTON SCHOOL <strong>DISTRICT</strong><br />
Indicator 04: Out-of-School Suspensions and Expulsions (2009/10 school year)<br />
A) Suspension/Expulsion<br />
Percent difference of CWD with out-of- school suspensions and<br />
expulsions totaling greater than 10 days in a school year as<br />
compared to the same data for general education students in<br />
the district.<br />
B) Suspension/Expulsion by Race and Ethnicity<br />
Percent of districts that have: (a) a significant discrepancy, by race or<br />
ethnicity, in the rate of suspensions and expulsions of greater than 10<br />
days in a school year for children with IEPs; and (b) policies,<br />
procedures or practices that contribute to the significant discrepancy<br />
and do not comply with requirements relating to the development<br />
and implementation of IEPs, the use of positive behavioral<br />
interventions and supports, and procedural safeguards.<br />
Indicator 05: School Age (5-21) Least Restrictive Environment<br />
A) In the Regular Class 80% or more of the day<br />
Percent of CWD with<br />
IEPs receiving instruction<br />
in the regular class 80%<br />
or more of the day.<br />
State<br />
Rate<br />
State<br />
Target<br />
LEA<br />
Rate<br />
B) In the Regular Class less than 40% of the day<br />
Percent of CWD with<br />
IEPs receiving instruction<br />
in the regular class less<br />
than 60% of the day.<br />
53.87% 59.77%<br />
State<br />
Rate<br />
State<br />
Target<br />
12.42% 12.51%<br />
71.01%<br />
LEA<br />
Rate<br />
3.86%<br />
C) Other Settings outside the regular class<br />
Percent of CWD with IEPs served in<br />
public or private separate schools,<br />
residential placements, or<br />
homebound/hospital placements.<br />
State<br />
Rate<br />
State<br />
Target<br />
2.80% 2.56%<br />
Target Met<br />
by LEA (Y/N)<br />
Y<br />
Target Met<br />
by LEA (Y/N)<br />
Y<br />
LEA<br />
Rate<br />
1.93%<br />
Target Met<br />
by LEA(Y/N)<br />
Indicator 06: Early Childhood (3-5) Least Restrictive Environment<br />
A) Regular Early Childhood Program<br />
Percent of children (aged 3 through 5) with IEPs attending a regular<br />
early childhood program and receiving the majority of special<br />
education and related services in the regular early childhood program<br />
Allowable<br />
Difference<br />
LEA: 7102 - CLINTON SCHOOL <strong>DISTRICT</strong><br />
Indicator 07: Preschool (3-5) Outcomes<br />
a) Percent of preschool CWD<br />
children who did not<br />
improve functioning.<br />
b) Percent of preschool CWD<br />
who improved but whose<br />
functioning remained below<br />
same age peers.<br />
c) Percent of preschool CWD<br />
who improved at a level<br />
nearer to same aged peers.<br />
d) Percent of preschool CWD<br />
who improved functioning to<br />
reach a level comparable to<br />
same age peers.<br />
e) Percent of preschool CWD<br />
children who maintain<br />
functioning at a level<br />
comparable to same aged<br />
peers.<br />
Summary<br />
Statements<br />
1) Of those preschool<br />
children who entered<br />
the preschool program<br />
below age expectations<br />
in each Outcome, the<br />
percent who<br />
substantially increased<br />
their rate of growth by<br />
the time they turned 6<br />
years of age or exited<br />
the program.<br />
2) The percent of<br />
preschool children who<br />
were functioning<br />
within age expectations<br />
in each Outcome by the<br />
time they turned 6<br />
years of age or exited<br />
A) Positive Social -Emotional<br />
Skills*<br />
State<br />
Rate<br />
A) Positive Social -<br />
Emotional Skills<br />
(Including social<br />
relationships)<br />
State<br />
Rate<br />
2.14%<br />
5.31%<br />
25.97%<br />
38.22%<br />
28.36%<br />
State<br />
Target<br />
LEA<br />
Rate<br />
LEA<br />
Rate<br />
— —<br />
— —<br />
— —<br />
— —<br />
— —<br />
Target<br />
Met by<br />
LEA(Y/N)<br />
B) Acquisition and Use of<br />
Knowledge and Skills<br />
(Including early language/<br />
communication and early literacy)<br />
B) Acquisition and Use of<br />
Knowledge and Skills **<br />
State<br />
Rate<br />
1.75%<br />
6.59%<br />
34.23%<br />
43.51%<br />
13.92%<br />
State<br />
Target<br />
LEA<br />
Rate<br />
Target<br />
Met by<br />
LEA(Y/N)<br />
C) Use of Appropriate Behaviors<br />
to Meet Their Needs<br />
State<br />
Rate<br />
State<br />
Target<br />
LEA<br />
Rate<br />
Target<br />
Met by<br />
LEA(Y/N)<br />
89.61% 90.50% — — N/A 90.31% 90.50% — — N/A 90.82% 92.50% — — N/A<br />
66.58% 69.50% — — N/A 57.43% 60.50% — — N/A 76.69% 78.50% — — N/A<br />
NOTE: * Including social relationships ** Including early language/ communication and early literacy<br />
Note: - - denotes not applicable<br />
State<br />
Rate<br />
LEA<br />
Rate<br />
— —<br />
— —<br />
— —<br />
— —<br />
— —<br />
C) Use of<br />
Appropriate<br />
Behaviors to<br />
Meet Their Needs<br />
State<br />
Rate<br />
4.51%<br />
17.34%<br />
41.72%<br />
34.97%<br />
LEA<br />
Rate<br />
1.46% — —<br />
— —<br />
— —<br />
— —<br />
— —<br />
Page 3 of 5
LEA: 7102 - CLINTON SCHOOL <strong>DISTRICT</strong><br />
Indicator 08: Parent Involvement<br />
Percent of surveyed<br />
parents who reported<br />
school facilitated parent<br />
involvement as a means<br />
of improving services<br />
and results for children<br />
with disabilities.<br />
Early Childhood<br />
(3-5)<br />
School Age<br />
(5-21)<br />
State<br />
Rate<br />
90.47%<br />
95.05%<br />
Indicator 09: Disproportionality - Eligibility<br />
Disproportionate representation of racial<br />
and ethnic groups in special education and<br />
related services that is a result of<br />
inappropriate identification (e.g.<br />
monitoring data, review of policies,<br />
practices, and procedures under 618(d),<br />
etc.).<br />
State<br />
Rate<br />
State<br />
Target<br />
88.00%<br />
96.00%<br />
State<br />
Target<br />
0.00% 0.00%<br />
LEA<br />
Rate<br />
— —<br />
96.20%<br />
Indicator 10: Disproportionality-Child with a Disability<br />
Disproportionate representation of racial<br />
and ethnic groups in specific disability<br />
categories that is a result of inappropriate<br />
identification (e.g. monitoring data, review<br />
of policies, practices, and procedures under<br />
618(d), etc.).<br />
Indicator 11: Child Find<br />
Percent of children with<br />
parental consent to evaluate<br />
who are evaluated within<br />
the State established timeline<br />
of 60 days.<br />
Overall<br />
(3-21)<br />
Early Childhood<br />
(3-5)<br />
School Age<br />
(5-21)<br />
State<br />
Rate<br />
0.00%<br />
Indicator 12: Early Childhood Transition<br />
Percent of children referred by Part C prior to<br />
age 3, who are found eligible for Part B, and<br />
who have an IEP developed and implemented<br />
by their third birthday.<br />
Note: - - denotes not applicable<br />
State<br />
Rate<br />
99.41%<br />
99.70%<br />
98.97%<br />
State<br />
Rate<br />
State<br />
Target<br />
0.00%<br />
State<br />
Target<br />
100.00%<br />
100.00%<br />
100.00%<br />
State<br />
Target<br />
Target Met by<br />
LEA (Y/N)<br />
Y<br />
Target Met by<br />
LEA (Y/N)<br />
Y<br />
LEA<br />
Rate<br />
100.00%<br />
— —<br />
100.00%<br />
LEA<br />
Rate<br />
Target Met by<br />
LEA (Y/N)<br />
N/A<br />
Y<br />
Note: The target for Indicator 09 is to have zero percent<br />
(0%) of districts identified as having disproportionate<br />
representation as a result of inappropriate<br />
identification in eligibility.<br />
Note: The target for Indicator 10 is to have zero<br />
percent (0%) of districts identified as having<br />
disproportionate representation as a result of<br />
inappropriate identification in a disability<br />
category.<br />
Target Met by<br />
LEA (Y/N)<br />
N/A<br />
Y<br />
Target Met<br />
by LEA<br />
(Y/N)<br />
99.21% 100.00% - - N/A<br />
Y<br />
Note: * Indicates a zero reponse rate for the<br />
district.<br />
Page 4 of 5
LEA: 7102 - CLINTON SCHOOL <strong>DISTRICT</strong><br />
Indicator 13: Secondary Transition<br />
Percent of youth with disabilities aged 16 and<br />
up with an IEP that includes coordinated,<br />
measurable, annual IEP goals and transition<br />
services that will reasonably enable the student<br />
to meet the post-secondary goals.<br />
Indicator 14: Post-School Outcomes<br />
A. Percent of youth enrolled in higher<br />
education within one year of leaving high<br />
school.<br />
State<br />
Rate<br />
State<br />
Target<br />
Note: Data for this Indicator is from the on-site monitoring of LEAs for the given year.<br />
B. Percent of youth enrolled in higher<br />
education or competitively employed<br />
within one year of leaving high school.<br />
C. Percent of youth enrolled in higher<br />
education or in some other postsecondary<br />
education or training program; or<br />
competitively employed or in some other<br />
employment within one year of leaving<br />
high school.<br />
State<br />
Rate<br />
Indicator 20: Reported Data-Timely and Accurate*<br />
District submitted<br />
required data elements<br />
on or before due dates;<br />
made revisions within<br />
the alloted reveiw<br />
periods.<br />
Accurate and Timely<br />
Data Submission<br />
Overall (3-21)<br />
Early Childhood (3-5)<br />
School Age (5-21)<br />
State<br />
Target<br />
100.00%<br />
100.00%<br />
100.00%<br />
State<br />
Target<br />
LEA<br />
Rate<br />
LEA<br />
Rate<br />
Target Met by<br />
LEA (Y/N)<br />
Target Met<br />
by LEA<br />
(Y/N)<br />
Target Met<br />
by LEA<br />
(Y/N)<br />
*Data reviewed for timely and accurate submissions included all APSCN cycle data except for personnel<br />
Note: - - denotes not applicable<br />
96.19 100.00 — — N/A<br />
14.53<br />
State<br />
Rate<br />
49.42<br />
State<br />
Rate<br />
54.07<br />
13.00<br />
State<br />
Target<br />
49.00<br />
State<br />
Target<br />
60.00<br />
Y<br />
N/A<br />
Y<br />
14.29%<br />
LEA<br />
Rate<br />
57.14%<br />
LEA<br />
Rate<br />
57.14%<br />
Y<br />
Target Met<br />
by LEA<br />
(Y/N)<br />
Y<br />
Target Met<br />
by LEA<br />
(Y/N)<br />
N<br />
Page 5 of 5
LEA: 7104 - SHIRLEY SCHOOL <strong>DISTRICT</strong><br />
<strong>ARKANSAS</strong> <strong>SPECIAL</strong> <strong>EDUCATION</strong><br />
<strong>DISTRICT</strong> <strong>ANNUAL</strong> PERFORMANCE REPORT<br />
2010/11 School Year<br />
Publication Date: March 2012<br />
Each State must have in place a State Performance Plan (SPP) to evaluate the State's efforts to meet the requirements and<br />
purposes of the implementation of the Individuals with Disabilities Education Act (IDEA). The SPP is a six-year plan, which<br />
describes Arkansas's performance on 20 indicators. The Office of Special Education Programs in the U. S. Department of<br />
Education requires that States report annually to the public on the performance of each local education agency (LEA) on 14 of<br />
20 indicators as compared with targets established by the State in the SPP. Arkansas will report indicators 1 through 14 and<br />
20 for each LEA serving children with disabilities (CWD). Any LEA not meeting targets on compliance indicators (0% for<br />
Indicators 4B, 09 & 10 and 100% for Indicators 11, 12, 13, and 20) are non-compliant with IDEA.<br />
There are no report changes for the 2010/11 school year profile; However, it is important to recognize that: .<br />
1. Indicator 01 (Graduation) is reported a year in arrear (2009/10 graduates) and is based on a four-year cohort. This<br />
means the rate is a measure of students who entered in ninth grade and graduate in four years. The calculation is a<br />
requirement under Title I of the Elementary and Secondary Education Act (ESEA).<br />
2. Indicator 02 (Drop out) is reported a year in arrear. This means the rate is a measure of students who dropped out in<br />
the 2009/10 school year. The Indicator 02 data are aligned with the Common Core of Data (CCD) requirements for<br />
grades 7-12.<br />
3. Indicator 04A and 4B (Suspension/Expulsion) is reported a year in arrear. This means the rate is a measure of<br />
students who had out-of-school suspensions and/or expulsions totaling more than 10 days.<br />
Percent of youth<br />
with IEPs<br />
graduating from<br />
high school with a<br />
regular diploma<br />
For a complete description of all the Indicators, please visit the special education website at<br />
http://arksped.k12.ar.us/sections/policy.html<br />
Indicator 01: Graduation Rates (2009/10 school year) Indicator 02: Dropout Rates (2009/10 school year)<br />
State<br />
Rate<br />
State<br />
Target<br />
75.76% 85.00%<br />
LEA<br />
Rate<br />
80.00%<br />
Target Met<br />
by LEA<br />
(Y/N)<br />
N<br />
Percent of<br />
youth with<br />
IEPs dropping<br />
out of high<br />
school<br />
State<br />
Rate<br />
Indicator 03: Assessment on Statewide Benchmark Exam (grades 3-8, 11)<br />
A) Adequate Yearly Progress<br />
n=40<br />
Literacy<br />
Mathematics<br />
Met Disability Subgroup "n"<br />
for Reporting Purposes (Y/N)<br />
State Target for % of Districts Meeting<br />
AYP for Disability Subgroup<br />
State<br />
Target<br />
3.06% 4.20%<br />
LEA<br />
Rate<br />
0.00%<br />
% of Districts Meeting AYP<br />
for Disability Subgroup<br />
Target Met by<br />
LEA (Y/N)<br />
Y<br />
Target Met by<br />
LEA(Y/N)<br />
Overall N 17.15% 6.25%<br />
NA<br />
N<br />
N<br />
Note: For a district to qualify as having a disability subgroup it must have a minimum of 40 (n=40) students with disabilities in a school building.<br />
B) Participation<br />
Participation Rate: # of<br />
CWD Tested ÷ # of CWD<br />
Enrolled in grades tested.<br />
Participation Rate: Literacy<br />
Participation Rate: Math<br />
Note: - - denotes not applicable<br />
State<br />
Rate<br />
98.78%<br />
State<br />
Target<br />
95.00%<br />
LEA<br />
Rate<br />
100.00%<br />
Target Met<br />
by LEA (Y/N)<br />
98.61% 95.00% 100.00% Y<br />
Y<br />
C) Performance Proficiency<br />
Percent of CWD Scoring<br />
Proficient or Above<br />
Proficiency Rate: Literacy<br />
Proficiency Rate:<br />
Mathematics<br />
16.00%<br />
16.00%<br />
State<br />
Rate<br />
31.49%<br />
44.86%<br />
State<br />
Target<br />
45.22%<br />
51.14%<br />
LEA<br />
Rate<br />
23.81%<br />
31.11%<br />
NA<br />
NA<br />
Target<br />
Met by<br />
LEA (Y/N)<br />
N<br />
N<br />
Page 1 of 5
LEA: 7104 - SHIRLEY SCHOOL <strong>DISTRICT</strong><br />
Indicator 04: Out-of-School Suspensions and Expulsions (2009/10 school year)<br />
A) Suspension/Expulsion<br />
Percent difference of CWD with out-of- school suspensions and<br />
expulsions totaling greater than 10 days in a school year as<br />
compared to the same data for general education students in<br />
the district.<br />
B) Suspension/Expulsion by Race and Ethnicity<br />
Percent of districts that have: (a) a significant discrepancy, by race or<br />
ethnicity, in the rate of suspensions and expulsions of greater than 10<br />
days in a school year for children with IEPs; and (b) policies,<br />
procedures or practices that contribute to the significant discrepancy<br />
and do not comply with requirements relating to the development<br />
and implementation of IEPs, the use of positive behavioral<br />
interventions and supports, and procedural safeguards.<br />
Indicator 05: School Age (5-21) Least Restrictive Environment<br />
A) In the Regular Class 80% or more of the day<br />
Percent of CWD with<br />
IEPs receiving instruction<br />
in the regular class 80%<br />
or more of the day.<br />
State<br />
Rate<br />
State<br />
Target<br />
LEA<br />
Rate<br />
B) In the Regular Class less than 40% of the day<br />
Percent of CWD with<br />
IEPs receiving instruction<br />
in the regular class less<br />
than 60% of the day.<br />
53.87% 59.77%<br />
State<br />
Rate<br />
State<br />
Target<br />
12.42% 12.51%<br />
64.84%<br />
LEA<br />
Rate<br />
13.19%<br />
C) Other Settings outside the regular class<br />
Percent of CWD with IEPs served in<br />
public or private separate schools,<br />
residential placements, or<br />
homebound/hospital placements.<br />
State<br />
Rate<br />
State<br />
Target<br />
2.80% 2.56%<br />
Target Met<br />
by LEA (Y/N)<br />
Y<br />
Target Met<br />
by LEA (Y/N)<br />
N<br />
LEA<br />
Rate<br />
0.00%<br />
Target Met<br />
by LEA(Y/N)<br />
Indicator 06: Early Childhood (3-5) Least Restrictive Environment<br />
A) Regular Early Childhood Program<br />
Percent of children (aged 3 through 5) with IEPs attending a regular<br />
early childhood program and receiving the majority of special<br />
education and related services in the regular early childhood program<br />
Allowable<br />
Difference<br />
LEA: 7104 - SHIRLEY SCHOOL <strong>DISTRICT</strong><br />
Indicator 07: Preschool (3-5) Outcomes<br />
a) Percent of preschool CWD<br />
children who did not<br />
improve functioning.<br />
b) Percent of preschool CWD<br />
who improved but whose<br />
functioning remained below<br />
same age peers.<br />
c) Percent of preschool CWD<br />
who improved at a level<br />
nearer to same aged peers.<br />
d) Percent of preschool CWD<br />
who improved functioning to<br />
reach a level comparable to<br />
same age peers.<br />
e) Percent of preschool CWD<br />
children who maintain<br />
functioning at a level<br />
comparable to same aged<br />
peers.<br />
Summary<br />
Statements<br />
1) Of those preschool<br />
children who entered<br />
the preschool program<br />
below age expectations<br />
in each Outcome, the<br />
percent who<br />
substantially increased<br />
their rate of growth by<br />
the time they turned 6<br />
years of age or exited<br />
the program.<br />
2) The percent of<br />
preschool children who<br />
were functioning<br />
within age expectations<br />
in each Outcome by the<br />
time they turned 6<br />
years of age or exited<br />
A) Positive Social -Emotional<br />
Skills*<br />
State<br />
Rate<br />
A) Positive Social -<br />
Emotional Skills<br />
(Including social<br />
relationships)<br />
State<br />
Rate<br />
2.14%<br />
5.31%<br />
25.97%<br />
38.22%<br />
28.36%<br />
State<br />
Target<br />
LEA<br />
Rate<br />
LEA<br />
Rate<br />
— —<br />
— —<br />
— —<br />
— —<br />
— —<br />
Target<br />
Met by<br />
LEA(Y/N)<br />
B) Acquisition and Use of<br />
Knowledge and Skills<br />
(Including early language/<br />
communication and early literacy)<br />
B) Acquisition and Use of<br />
Knowledge and Skills **<br />
State<br />
Rate<br />
1.75%<br />
6.59%<br />
34.23%<br />
43.51%<br />
13.92%<br />
State<br />
Target<br />
LEA<br />
Rate<br />
Target<br />
Met by<br />
LEA(Y/N)<br />
C) Use of Appropriate Behaviors<br />
to Meet Their Needs<br />
State<br />
Rate<br />
State<br />
Target<br />
LEA<br />
Rate<br />
Target<br />
Met by<br />
LEA(Y/N)<br />
89.61% 90.50% — — N/A 90.31% 90.50% — — N/A 90.82% 92.50% — — N/A<br />
66.58% 69.50% — — N/A 57.43% 60.50% — — N/A 76.69% 78.50% — — N/A<br />
NOTE: * Including social relationships ** Including early language/ communication and early literacy<br />
Note: - - denotes not applicable<br />
State<br />
Rate<br />
LEA<br />
Rate<br />
— —<br />
— —<br />
— —<br />
— —<br />
— —<br />
C) Use of<br />
Appropriate<br />
Behaviors to<br />
Meet Their Needs<br />
State<br />
Rate<br />
4.51%<br />
17.34%<br />
41.72%<br />
34.97%<br />
LEA<br />
Rate<br />
1.46% — —<br />
— —<br />
— —<br />
— —<br />
— —<br />
Page 3 of 5
LEA: 7104 - SHIRLEY SCHOOL <strong>DISTRICT</strong><br />
Indicator 08: Parent Involvement<br />
Percent of surveyed<br />
parents who reported<br />
school facilitated parent<br />
involvement as a means<br />
of improving services<br />
and results for children<br />
with disabilities.<br />
Early Childhood<br />
(3-5)<br />
School Age<br />
(5-21)<br />
State<br />
Rate<br />
90.47%<br />
95.05%<br />
Indicator 09: Disproportionality - Eligibility<br />
Disproportionate representation of racial<br />
and ethnic groups in special education and<br />
related services that is a result of<br />
inappropriate identification (e.g.<br />
monitoring data, review of policies,<br />
practices, and procedures under 618(d),<br />
etc.).<br />
State<br />
Rate<br />
State<br />
Target<br />
88.00%<br />
96.00%<br />
State<br />
Target<br />
0.00% 0.00%<br />
LEA<br />
Rate<br />
— —<br />
100.00%<br />
Indicator 10: Disproportionality-Child with a Disability<br />
Disproportionate representation of racial<br />
and ethnic groups in specific disability<br />
categories that is a result of inappropriate<br />
identification (e.g. monitoring data, review<br />
of policies, practices, and procedures under<br />
618(d), etc.).<br />
Indicator 11: Child Find<br />
Percent of children with<br />
parental consent to evaluate<br />
who are evaluated within<br />
the State established timeline<br />
of 60 days.<br />
Overall<br />
(3-21)<br />
Early Childhood<br />
(3-5)<br />
School Age<br />
(5-21)<br />
State<br />
Rate<br />
0.00%<br />
Indicator 12: Early Childhood Transition<br />
Percent of children referred by Part C prior to<br />
age 3, who are found eligible for Part B, and<br />
who have an IEP developed and implemented<br />
by their third birthday.<br />
Note: - - denotes not applicable<br />
State<br />
Rate<br />
99.41%<br />
99.70%<br />
98.97%<br />
State<br />
Rate<br />
State<br />
Target<br />
0.00%<br />
State<br />
Target<br />
100.00%<br />
100.00%<br />
100.00%<br />
State<br />
Target<br />
Target Met by<br />
LEA (Y/N)<br />
Y<br />
Target Met by<br />
LEA (Y/N)<br />
Y<br />
LEA<br />
Rate<br />
100.00%<br />
— —<br />
100.00%<br />
LEA<br />
Rate<br />
Target Met by<br />
LEA (Y/N)<br />
N/A<br />
Y<br />
Note: The target for Indicator 09 is to have zero percent<br />
(0%) of districts identified as having disproportionate<br />
representation as a result of inappropriate<br />
identification in eligibility.<br />
Note: The target for Indicator 10 is to have zero<br />
percent (0%) of districts identified as having<br />
disproportionate representation as a result of<br />
inappropriate identification in a disability<br />
category.<br />
Target Met by<br />
LEA (Y/N)<br />
N/A<br />
Y<br />
Target Met<br />
by LEA<br />
(Y/N)<br />
99.21% 100.00% - - N/A<br />
Y<br />
Note: * Indicates a zero reponse rate for the<br />
district.<br />
Page 4 of 5
LEA: 7104 - SHIRLEY SCHOOL <strong>DISTRICT</strong><br />
Indicator 13: Secondary Transition<br />
Percent of youth with disabilities aged 16 and<br />
up with an IEP that includes coordinated,<br />
measurable, annual IEP goals and transition<br />
services that will reasonably enable the student<br />
to meet the post-secondary goals.<br />
Indicator 14: Post-School Outcomes<br />
A. Percent of youth enrolled in higher<br />
education within one year of leaving high<br />
school.<br />
State<br />
Rate<br />
State<br />
Target<br />
Note: Data for this Indicator is from the on-site monitoring of LEAs for the given year.<br />
B. Percent of youth enrolled in higher<br />
education or competitively employed<br />
within one year of leaving high school.<br />
C. Percent of youth enrolled in higher<br />
education or in some other postsecondary<br />
education or training program; or<br />
competitively employed or in some other<br />
employment within one year of leaving<br />
high school.<br />
State<br />
Rate<br />
Indicator 20: Reported Data-Timely and Accurate*<br />
District submitted<br />
required data elements<br />
on or before due dates;<br />
made revisions within<br />
the alloted reveiw<br />
periods.<br />
Accurate and Timely<br />
Data Submission<br />
Overall (3-21)<br />
Early Childhood (3-5)<br />
School Age (5-21)<br />
State<br />
Target<br />
100.00%<br />
100.00%<br />
100.00%<br />
State<br />
Target<br />
LEA<br />
Rate<br />
LEA<br />
Rate<br />
Target Met by<br />
LEA (Y/N)<br />
Target Met<br />
by LEA<br />
(Y/N)<br />
Target Met<br />
by LEA<br />
(Y/N)<br />
*Data reviewed for timely and accurate submissions included all APSCN cycle data except for personnel<br />
Note: - - denotes not applicable<br />
96.19 100.00 100.00% Y<br />
14.53<br />
State<br />
Rate<br />
49.42<br />
State<br />
Rate<br />
54.07<br />
13.00<br />
State<br />
Target<br />
49.00<br />
State<br />
Target<br />
60.00<br />
Y<br />
N/A<br />
Y<br />
— —<br />
LEA<br />
Rate<br />
— —<br />
LEA<br />
Rate<br />
— —<br />
N/A<br />
Target Met<br />
by LEA<br />
(Y/N)<br />
N/A<br />
Target Met<br />
by LEA<br />
(Y/N)<br />
N/A<br />
Page 5 of 5
LEA: 7105 - SOUTH SIDE SCHOOL <strong>DISTRICT</strong><br />
<strong>ARKANSAS</strong> <strong>SPECIAL</strong> <strong>EDUCATION</strong><br />
<strong>DISTRICT</strong> <strong>ANNUAL</strong> PERFORMANCE REPORT<br />
2010/11 School Year<br />
Publication Date: March 2012<br />
Each State must have in place a State Performance Plan (SPP) to evaluate the State's efforts to meet the requirements and<br />
purposes of the implementation of the Individuals with Disabilities Education Act (IDEA). The SPP is a six-year plan, which<br />
describes Arkansas's performance on 20 indicators. The Office of Special Education Programs in the U. S. Department of<br />
Education requires that States report annually to the public on the performance of each local education agency (LEA) on 14 of<br />
20 indicators as compared with targets established by the State in the SPP. Arkansas will report indicators 1 through 14 and<br />
20 for each LEA serving children with disabilities (CWD). Any LEA not meeting targets on compliance indicators (0% for<br />
Indicators 4B, 09 & 10 and 100% for Indicators 11, 12, 13, and 20) are non-compliant with IDEA.<br />
There are no report changes for the 2010/11 school year profile; However, it is important to recognize that: .<br />
1. Indicator 01 (Graduation) is reported a year in arrear (2009/10 graduates) and is based on a four-year cohort. This<br />
means the rate is a measure of students who entered in ninth grade and graduate in four years. The calculation is a<br />
requirement under Title I of the Elementary and Secondary Education Act (ESEA).<br />
2. Indicator 02 (Drop out) is reported a year in arrear. This means the rate is a measure of students who dropped out in<br />
the 2009/10 school year. The Indicator 02 data are aligned with the Common Core of Data (CCD) requirements for<br />
grades 7-12.<br />
3. Indicator 04A and 4B (Suspension/Expulsion) is reported a year in arrear. This means the rate is a measure of<br />
students who had out-of-school suspensions and/or expulsions totaling more than 10 days.<br />
Percent of youth<br />
with IEPs<br />
graduating from<br />
high school with a<br />
regular diploma<br />
For a complete description of all the Indicators, please visit the special education website at<br />
http://arksped.k12.ar.us/sections/policy.html<br />
Indicator 01: Graduation Rates (2009/10 school year) Indicator 02: Dropout Rates (2009/10 school year)<br />
State<br />
Rate<br />
State<br />
Target<br />
75.76% 85.00%<br />
LEA<br />
Rate<br />
71.43%<br />
Target Met<br />
by LEA<br />
(Y/N)<br />
N<br />
Percent of<br />
youth with<br />
IEPs dropping<br />
out of high<br />
school<br />
State<br />
Rate<br />
Indicator 03: Assessment on Statewide Benchmark Exam (grades 3-8, 11)<br />
A) Adequate Yearly Progress<br />
n=40<br />
Literacy<br />
Mathematics<br />
Met Disability Subgroup "n"<br />
for Reporting Purposes (Y/N)<br />
State Target for % of Districts Meeting<br />
AYP for Disability Subgroup<br />
State<br />
Target<br />
3.06% 4.20%<br />
LEA<br />
Rate<br />
9.68%<br />
% of Districts Meeting AYP<br />
for Disability Subgroup<br />
Target Met by<br />
LEA (Y/N)<br />
N<br />
Target Met by<br />
LEA(Y/N)<br />
Overall N 17.15% 6.25%<br />
NA<br />
N<br />
N<br />
Note: For a district to qualify as having a disability subgroup it must have a minimum of 40 (n=40) students with disabilities in a school building.<br />
B) Participation<br />
Participation Rate: # of<br />
CWD Tested ÷ # of CWD<br />
Enrolled in grades tested.<br />
Participation Rate: Literacy<br />
Participation Rate: Math<br />
Note: - - denotes not applicable<br />
State<br />
Rate<br />
98.78%<br />
State<br />
Target<br />
95.00%<br />
LEA<br />
Rate<br />
100.00%<br />
Target Met<br />
by LEA (Y/N)<br />
98.61% 95.00% 100.00% Y<br />
Y<br />
C) Performance Proficiency<br />
Percent of CWD Scoring<br />
Proficient or Above<br />
Proficiency Rate: Literacy<br />
Proficiency Rate:<br />
Mathematics<br />
16.00%<br />
16.00%<br />
State<br />
Rate<br />
31.49%<br />
44.86%<br />
State<br />
Target<br />
45.22%<br />
51.14%<br />
LEA<br />
Rate<br />
14.71%<br />
37.50%<br />
NA<br />
NA<br />
Target<br />
Met by<br />
LEA (Y/N)<br />
N<br />
N<br />
Page 1 of 5
LEA: 7105 - SOUTH SIDE SCHOOL <strong>DISTRICT</strong><br />
Indicator 04: Out-of-School Suspensions and Expulsions (2009/10 school year)<br />
A) Suspension/Expulsion<br />
Percent difference of CWD with out-of- school suspensions and<br />
expulsions totaling greater than 10 days in a school year as<br />
compared to the same data for general education students in<br />
the district.<br />
B) Suspension/Expulsion by Race and Ethnicity<br />
Percent of districts that have: (a) a significant discrepancy, by race or<br />
ethnicity, in the rate of suspensions and expulsions of greater than 10<br />
days in a school year for children with IEPs; and (b) policies,<br />
procedures or practices that contribute to the significant discrepancy<br />
and do not comply with requirements relating to the development<br />
and implementation of IEPs, the use of positive behavioral<br />
interventions and supports, and procedural safeguards.<br />
Indicator 05: School Age (5-21) Least Restrictive Environment<br />
A) In the Regular Class 80% or more of the day<br />
Percent of CWD with<br />
IEPs receiving instruction<br />
in the regular class 80%<br />
or more of the day.<br />
State<br />
Rate<br />
State<br />
Target<br />
LEA<br />
Rate<br />
B) In the Regular Class less than 40% of the day<br />
Percent of CWD with<br />
IEPs receiving instruction<br />
in the regular class less<br />
than 60% of the day.<br />
53.87% 59.77%<br />
State<br />
Rate<br />
State<br />
Target<br />
12.42% 12.51%<br />
60.26%<br />
LEA<br />
Rate<br />
3.85%<br />
C) Other Settings outside the regular class<br />
Percent of CWD with IEPs served in<br />
public or private separate schools,<br />
residential placements, or<br />
homebound/hospital placements.<br />
State<br />
Rate<br />
State<br />
Target<br />
2.80% 2.56%<br />
Target Met<br />
by LEA (Y/N)<br />
Y<br />
Target Met<br />
by LEA (Y/N)<br />
Y<br />
LEA<br />
Rate<br />
1.28%<br />
Target Met<br />
by LEA(Y/N)<br />
Indicator 06: Early Childhood (3-5) Least Restrictive Environment<br />
A) Regular Early Childhood Program<br />
Percent of children (aged 3 through 5) with IEPs attending a regular<br />
early childhood program and receiving the majority of special<br />
education and related services in the regular early childhood program<br />
Allowable<br />
Difference<br />
LEA: 7105 - SOUTH SIDE SCHOOL <strong>DISTRICT</strong><br />
Indicator 07: Preschool (3-5) Outcomes<br />
a) Percent of preschool CWD<br />
children who did not<br />
improve functioning.<br />
b) Percent of preschool CWD<br />
who improved but whose<br />
functioning remained below<br />
same age peers.<br />
c) Percent of preschool CWD<br />
who improved at a level<br />
nearer to same aged peers.<br />
d) Percent of preschool CWD<br />
who improved functioning to<br />
reach a level comparable to<br />
same age peers.<br />
e) Percent of preschool CWD<br />
children who maintain<br />
functioning at a level<br />
comparable to same aged<br />
peers.<br />
Summary<br />
Statements<br />
1) Of those preschool<br />
children who entered<br />
the preschool program<br />
below age expectations<br />
in each Outcome, the<br />
percent who<br />
substantially increased<br />
their rate of growth by<br />
the time they turned 6<br />
years of age or exited<br />
the program.<br />
2) The percent of<br />
preschool children who<br />
were functioning<br />
within age expectations<br />
in each Outcome by the<br />
time they turned 6<br />
years of age or exited<br />
A) Positive Social -Emotional<br />
Skills*<br />
State<br />
Rate<br />
A) Positive Social -<br />
Emotional Skills<br />
(Including social<br />
relationships)<br />
State<br />
Rate<br />
2.14%<br />
5.31%<br />
25.97%<br />
38.22%<br />
28.36%<br />
State<br />
Target<br />
LEA<br />
Rate<br />
LEA<br />
Rate<br />
— —<br />
— —<br />
— —<br />
— —<br />
— —<br />
Target<br />
Met by<br />
LEA(Y/N)<br />
B) Acquisition and Use of<br />
Knowledge and Skills<br />
(Including early language/<br />
communication and early literacy)<br />
B) Acquisition and Use of<br />
Knowledge and Skills **<br />
State<br />
Rate<br />
1.75%<br />
6.59%<br />
34.23%<br />
43.51%<br />
13.92%<br />
State<br />
Target<br />
LEA<br />
Rate<br />
Target<br />
Met by<br />
LEA(Y/N)<br />
C) Use of Appropriate Behaviors<br />
to Meet Their Needs<br />
State<br />
Rate<br />
State<br />
Target<br />
LEA<br />
Rate<br />
Target<br />
Met by<br />
LEA(Y/N)<br />
89.61% 90.50% — — N/A 90.31% 90.50% — — N/A 90.82% 92.50% — — N/A<br />
66.58% 69.50% — — N/A 57.43% 60.50% — — N/A 76.69% 78.50% — — N/A<br />
NOTE: * Including social relationships ** Including early language/ communication and early literacy<br />
Note: - - denotes not applicable<br />
State<br />
Rate<br />
LEA<br />
Rate<br />
— —<br />
— —<br />
— —<br />
— —<br />
— —<br />
C) Use of<br />
Appropriate<br />
Behaviors to<br />
Meet Their Needs<br />
State<br />
Rate<br />
4.51%<br />
17.34%<br />
41.72%<br />
34.97%<br />
LEA<br />
Rate<br />
1.46% — —<br />
— —<br />
— —<br />
— —<br />
— —<br />
Page 3 of 5
LEA: 7105 - SOUTH SIDE SCHOOL <strong>DISTRICT</strong><br />
Indicator 08: Parent Involvement<br />
Percent of surveyed<br />
parents who reported<br />
school facilitated parent<br />
involvement as a means<br />
of improving services<br />
and results for children<br />
with disabilities.<br />
Early Childhood<br />
(3-5)<br />
School Age<br />
(5-21)<br />
State<br />
Rate<br />
90.47%<br />
95.05%<br />
Indicator 09: Disproportionality - Eligibility<br />
Disproportionate representation of racial<br />
and ethnic groups in special education and<br />
related services that is a result of<br />
inappropriate identification (e.g.<br />
monitoring data, review of policies,<br />
practices, and procedures under 618(d),<br />
etc.).<br />
State<br />
Rate<br />
State<br />
Target<br />
88.00%<br />
96.00%<br />
State<br />
Target<br />
0.00% 0.00%<br />
LEA<br />
Rate<br />
— —<br />
93.02%<br />
Indicator 10: Disproportionality-Child with a Disability<br />
Disproportionate representation of racial<br />
and ethnic groups in specific disability<br />
categories that is a result of inappropriate<br />
identification (e.g. monitoring data, review<br />
of policies, practices, and procedures under<br />
618(d), etc.).<br />
Indicator 11: Child Find<br />
Percent of children with<br />
parental consent to evaluate<br />
who are evaluated within<br />
the State established timeline<br />
of 60 days.<br />
Overall<br />
(3-21)<br />
Early Childhood<br />
(3-5)<br />
School Age<br />
(5-21)<br />
State<br />
Rate<br />
0.00%<br />
Indicator 12: Early Childhood Transition<br />
Percent of children referred by Part C prior to<br />
age 3, who are found eligible for Part B, and<br />
who have an IEP developed and implemented<br />
by their third birthday.<br />
Note: - - denotes not applicable<br />
State<br />
Rate<br />
99.41%<br />
99.70%<br />
98.97%<br />
State<br />
Rate<br />
State<br />
Target<br />
0.00%<br />
State<br />
Target<br />
100.00%<br />
100.00%<br />
100.00%<br />
State<br />
Target<br />
Target Met by<br />
LEA (Y/N)<br />
Y<br />
Target Met by<br />
LEA (Y/N)<br />
Y<br />
LEA<br />
Rate<br />
100.00%<br />
— —<br />
100.00%<br />
LEA<br />
Rate<br />
Target Met by<br />
LEA (Y/N)<br />
N/A<br />
N<br />
Note: The target for Indicator 09 is to have zero percent<br />
(0%) of districts identified as having disproportionate<br />
representation as a result of inappropriate<br />
identification in eligibility.<br />
Note: The target for Indicator 10 is to have zero<br />
percent (0%) of districts identified as having<br />
disproportionate representation as a result of<br />
inappropriate identification in a disability<br />
category.<br />
Target Met by<br />
LEA (Y/N)<br />
N/A<br />
Y<br />
Target Met<br />
by LEA<br />
(Y/N)<br />
99.21% 100.00% - - N/A<br />
Y<br />
Note: * Indicates a zero reponse rate for the<br />
district.<br />
Page 4 of 5
LEA: 7105 - SOUTH SIDE SCHOOL <strong>DISTRICT</strong><br />
Indicator 13: Secondary Transition<br />
Percent of youth with disabilities aged 16 and<br />
up with an IEP that includes coordinated,<br />
measurable, annual IEP goals and transition<br />
services that will reasonably enable the student<br />
to meet the post-secondary goals.<br />
Indicator 14: Post-School Outcomes<br />
A. Percent of youth enrolled in higher<br />
education within one year of leaving high<br />
school.<br />
State<br />
Rate<br />
State<br />
Target<br />
Note: Data for this Indicator is from the on-site monitoring of LEAs for the given year.<br />
B. Percent of youth enrolled in higher<br />
education or competitively employed<br />
within one year of leaving high school.<br />
C. Percent of youth enrolled in higher<br />
education or in some other postsecondary<br />
education or training program; or<br />
competitively employed or in some other<br />
employment within one year of leaving<br />
high school.<br />
State<br />
Rate<br />
Indicator 20: Reported Data-Timely and Accurate*<br />
District submitted<br />
required data elements<br />
on or before due dates;<br />
made revisions within<br />
the alloted reveiw<br />
periods.<br />
Accurate and Timely<br />
Data Submission<br />
Overall (3-21)<br />
Early Childhood (3-5)<br />
School Age (5-21)<br />
State<br />
Target<br />
100.00%<br />
100.00%<br />
100.00%<br />
State<br />
Target<br />
LEA<br />
Rate<br />
LEA<br />
Rate<br />
Target Met by<br />
LEA (Y/N)<br />
Target Met<br />
by LEA<br />
(Y/N)<br />
Target Met<br />
by LEA<br />
(Y/N)<br />
*Data reviewed for timely and accurate submissions included all APSCN cycle data except for personnel<br />
Note: - - denotes not applicable<br />
96.19 100.00 — — N/A<br />
14.53<br />
State<br />
Rate<br />
49.42<br />
State<br />
Rate<br />
54.07<br />
13.00<br />
State<br />
Target<br />
49.00<br />
State<br />
Target<br />
60.00<br />
Y<br />
N/A<br />
Y<br />
— —<br />
LEA<br />
Rate<br />
— —<br />
LEA<br />
Rate<br />
— —<br />
N/A<br />
Target Met<br />
by LEA<br />
(Y/N)<br />
N/A<br />
Target Met<br />
by LEA<br />
(Y/N)<br />
N/A<br />
Page 5 of 5
LEA: 7201 - ELKINS SCHOOL <strong>DISTRICT</strong><br />
<strong>ARKANSAS</strong> <strong>SPECIAL</strong> <strong>EDUCATION</strong><br />
<strong>DISTRICT</strong> <strong>ANNUAL</strong> PERFORMANCE REPORT<br />
2010/11 School Year<br />
Publication Date: March 2012<br />
Each State must have in place a State Performance Plan (SPP) to evaluate the State's efforts to meet the requirements and<br />
purposes of the implementation of the Individuals with Disabilities Education Act (IDEA). The SPP is a six-year plan, which<br />
describes Arkansas's performance on 20 indicators. The Office of Special Education Programs in the U. S. Department of<br />
Education requires that States report annually to the public on the performance of each local education agency (LEA) on 14 of<br />
20 indicators as compared with targets established by the State in the SPP. Arkansas will report indicators 1 through 14 and<br />
20 for each LEA serving children with disabilities (CWD). Any LEA not meeting targets on compliance indicators (0% for<br />
Indicators 4B, 09 & 10 and 100% for Indicators 11, 12, 13, and 20) are non-compliant with IDEA.<br />
There are no report changes for the 2010/11 school year profile; However, it is important to recognize that: .<br />
1. Indicator 01 (Graduation) is reported a year in arrear (2009/10 graduates) and is based on a four-year cohort. This<br />
means the rate is a measure of students who entered in ninth grade and graduate in four years. The calculation is a<br />
requirement under Title I of the Elementary and Secondary Education Act (ESEA).<br />
2. Indicator 02 (Drop out) is reported a year in arrear. This means the rate is a measure of students who dropped out in<br />
the 2009/10 school year. The Indicator 02 data are aligned with the Common Core of Data (CCD) requirements for<br />
grades 7-12.<br />
3. Indicator 04A and 4B (Suspension/Expulsion) is reported a year in arrear. This means the rate is a measure of<br />
students who had out-of-school suspensions and/or expulsions totaling more than 10 days.<br />
Percent of youth<br />
with IEPs<br />
graduating from<br />
high school with a<br />
regular diploma<br />
For a complete description of all the Indicators, please visit the special education website at<br />
http://arksped.k12.ar.us/sections/policy.html<br />
Indicator 01: Graduation Rates (2009/10 school year) Indicator 02: Dropout Rates (2009/10 school year)<br />
State<br />
Rate<br />
State<br />
Target<br />
75.76% 85.00%<br />
LEA<br />
Rate<br />
75.00%<br />
Target Met<br />
by LEA<br />
(Y/N)<br />
N<br />
Percent of<br />
youth with<br />
IEPs dropping<br />
out of high<br />
school<br />
State<br />
Rate<br />
Indicator 03: Assessment on Statewide Benchmark Exam (grades 3-8, 11)<br />
A) Adequate Yearly Progress<br />
n=40<br />
Literacy<br />
Mathematics<br />
Met Disability Subgroup "n"<br />
for Reporting Purposes (Y/N)<br />
State Target for % of Districts Meeting<br />
AYP for Disability Subgroup<br />
State<br />
Target<br />
3.06% 4.20%<br />
LEA<br />
Rate<br />
6.06%<br />
% of Districts Meeting AYP<br />
for Disability Subgroup<br />
Target Met by<br />
LEA (Y/N)<br />
N<br />
Target Met by<br />
LEA(Y/N)<br />
Overall N 17.15% 6.25%<br />
NA<br />
N<br />
N<br />
Note: For a district to qualify as having a disability subgroup it must have a minimum of 40 (n=40) students with disabilities in a school building.<br />
B) Participation<br />
Participation Rate: # of<br />
CWD Tested ÷ # of CWD<br />
Enrolled in grades tested.<br />
Participation Rate: Literacy<br />
Participation Rate: Math<br />
Note: - - denotes not applicable<br />
State<br />
Rate<br />
98.78%<br />
State<br />
Target<br />
95.00%<br />
LEA<br />
Rate<br />
98.67%<br />
Target Met<br />
by LEA (Y/N)<br />
98.61% 95.00% 98.75% Y<br />
Y<br />
C) Performance Proficiency<br />
Percent of CWD Scoring<br />
Proficient or Above<br />
Proficiency Rate: Literacy<br />
Proficiency Rate:<br />
Mathematics<br />
16.00%<br />
16.00%<br />
State<br />
Rate<br />
31.49%<br />
44.86%<br />
State<br />
Target<br />
45.22%<br />
51.14%<br />
LEA<br />
Rate<br />
21.13%<br />
36.84%<br />
NA<br />
NA<br />
Target<br />
Met by<br />
LEA (Y/N)<br />
N<br />
N<br />
Page 1 of 5
LEA: 7201 - ELKINS SCHOOL <strong>DISTRICT</strong><br />
Indicator 04: Out-of-School Suspensions and Expulsions (2009/10 school year)<br />
A) Suspension/Expulsion<br />
Percent difference of CWD with out-of- school suspensions and<br />
expulsions totaling greater than 10 days in a school year as<br />
compared to the same data for general education students in<br />
the district.<br />
B) Suspension/Expulsion by Race and Ethnicity<br />
Percent of districts that have: (a) a significant discrepancy, by race or<br />
ethnicity, in the rate of suspensions and expulsions of greater than 10<br />
days in a school year for children with IEPs; and (b) policies,<br />
procedures or practices that contribute to the significant discrepancy<br />
and do not comply with requirements relating to the development<br />
and implementation of IEPs, the use of positive behavioral<br />
interventions and supports, and procedural safeguards.<br />
Indicator 05: School Age (5-21) Least Restrictive Environment<br />
A) In the Regular Class 80% or more of the day<br />
Percent of CWD with<br />
IEPs receiving instruction<br />
in the regular class 80%<br />
or more of the day.<br />
State<br />
Rate<br />
State<br />
Target<br />
LEA<br />
Rate<br />
B) In the Regular Class less than 40% of the day<br />
Percent of CWD with<br />
IEPs receiving instruction<br />
in the regular class less<br />
than 60% of the day.<br />
53.87% 59.77%<br />
State<br />
Rate<br />
State<br />
Target<br />
12.42% 12.51%<br />
56.39%<br />
LEA<br />
Rate<br />
11.28%<br />
C) Other Settings outside the regular class<br />
Percent of CWD with IEPs served in<br />
public or private separate schools,<br />
residential placements, or<br />
homebound/hospital placements.<br />
State<br />
Rate<br />
State<br />
Target<br />
2.80% 2.56%<br />
Target Met<br />
by LEA (Y/N)<br />
N<br />
Target Met<br />
by LEA (Y/N)<br />
Y<br />
LEA<br />
Rate<br />
1.50%<br />
Target Met<br />
by LEA(Y/N)<br />
Indicator 06: Early Childhood (3-5) Least Restrictive Environment<br />
A) Regular Early Childhood Program<br />
Percent of children (aged 3 through 5) with IEPs attending a regular<br />
early childhood program and receiving the majority of special<br />
education and related services in the regular early childhood program<br />
Allowable<br />
Difference<br />
LEA: 7201 - ELKINS SCHOOL <strong>DISTRICT</strong><br />
Indicator 07: Preschool (3-5) Outcomes<br />
a) Percent of preschool CWD<br />
children who did not<br />
improve functioning.<br />
b) Percent of preschool CWD<br />
who improved but whose<br />
functioning remained below<br />
same age peers.<br />
c) Percent of preschool CWD<br />
who improved at a level<br />
nearer to same aged peers.<br />
d) Percent of preschool CWD<br />
who improved functioning to<br />
reach a level comparable to<br />
same age peers.<br />
e) Percent of preschool CWD<br />
children who maintain<br />
functioning at a level<br />
comparable to same aged<br />
peers.<br />
Summary<br />
Statements<br />
1) Of those preschool<br />
children who entered<br />
the preschool program<br />
below age expectations<br />
in each Outcome, the<br />
percent who<br />
substantially increased<br />
their rate of growth by<br />
the time they turned 6<br />
years of age or exited<br />
the program.<br />
2) The percent of<br />
preschool children who<br />
were functioning<br />
within age expectations<br />
in each Outcome by the<br />
time they turned 6<br />
years of age or exited<br />
A) Positive Social -Emotional<br />
Skills*<br />
State<br />
Rate<br />
A) Positive Social -<br />
Emotional Skills<br />
(Including social<br />
relationships)<br />
State<br />
Rate<br />
2.14%<br />
5.31%<br />
25.97%<br />
38.22%<br />
28.36%<br />
State<br />
Target<br />
LEA<br />
Rate<br />
LEA<br />
Rate<br />
— —<br />
— —<br />
— —<br />
— —<br />
— —<br />
Target<br />
Met by<br />
LEA(Y/N)<br />
B) Acquisition and Use of<br />
Knowledge and Skills<br />
(Including early language/<br />
communication and early literacy)<br />
B) Acquisition and Use of<br />
Knowledge and Skills **<br />
State<br />
Rate<br />
1.75%<br />
6.59%<br />
34.23%<br />
43.51%<br />
13.92%<br />
State<br />
Target<br />
LEA<br />
Rate<br />
Target<br />
Met by<br />
LEA(Y/N)<br />
C) Use of Appropriate Behaviors<br />
to Meet Their Needs<br />
State<br />
Rate<br />
State<br />
Target<br />
LEA<br />
Rate<br />
Target<br />
Met by<br />
LEA(Y/N)<br />
89.61% 90.50% — — N/A 90.31% 90.50% — — N/A 90.82% 92.50% — — N/A<br />
66.58% 69.50% — — N/A 57.43% 60.50% — — N/A 76.69% 78.50% — — N/A<br />
NOTE: * Including social relationships ** Including early language/ communication and early literacy<br />
Note: - - denotes not applicable<br />
State<br />
Rate<br />
LEA<br />
Rate<br />
— —<br />
— —<br />
— —<br />
— —<br />
— —<br />
C) Use of<br />
Appropriate<br />
Behaviors to<br />
Meet Their Needs<br />
State<br />
Rate<br />
4.51%<br />
17.34%<br />
41.72%<br />
34.97%<br />
LEA<br />
Rate<br />
1.46% — —<br />
— —<br />
— —<br />
— —<br />
— —<br />
Page 3 of 5
LEA: 7201 - ELKINS SCHOOL <strong>DISTRICT</strong><br />
Indicator 08: Parent Involvement<br />
Percent of surveyed<br />
parents who reported<br />
school facilitated parent<br />
involvement as a means<br />
of improving services<br />
and results for children<br />
with disabilities.<br />
Early Childhood<br />
(3-5)<br />
School Age<br />
(5-21)<br />
State<br />
Rate<br />
90.47%<br />
95.05%<br />
Indicator 09: Disproportionality - Eligibility<br />
Disproportionate representation of racial<br />
and ethnic groups in special education and<br />
related services that is a result of<br />
inappropriate identification (e.g.<br />
monitoring data, review of policies,<br />
practices, and procedures under 618(d),<br />
etc.).<br />
State<br />
Rate<br />
State<br />
Target<br />
88.00%<br />
96.00%<br />
State<br />
Target<br />
0.00% 0.00%<br />
LEA<br />
Rate<br />
— —<br />
93.62%<br />
Indicator 10: Disproportionality-Child with a Disability<br />
Disproportionate representation of racial<br />
and ethnic groups in specific disability<br />
categories that is a result of inappropriate<br />
identification (e.g. monitoring data, review<br />
of policies, practices, and procedures under<br />
618(d), etc.).<br />
Indicator 11: Child Find<br />
Percent of children with<br />
parental consent to evaluate<br />
who are evaluated within<br />
the State established timeline<br />
of 60 days.<br />
Overall<br />
(3-21)<br />
Early Childhood<br />
(3-5)<br />
School Age<br />
(5-21)<br />
State<br />
Rate<br />
0.00%<br />
Indicator 12: Early Childhood Transition<br />
Percent of children referred by Part C prior to<br />
age 3, who are found eligible for Part B, and<br />
who have an IEP developed and implemented<br />
by their third birthday.<br />
Note: - - denotes not applicable<br />
State<br />
Rate<br />
99.41%<br />
99.70%<br />
98.97%<br />
State<br />
Rate<br />
State<br />
Target<br />
0.00%<br />
State<br />
Target<br />
100.00%<br />
100.00%<br />
100.00%<br />
State<br />
Target<br />
Target Met by<br />
LEA (Y/N)<br />
Y<br />
Target Met by<br />
LEA (Y/N)<br />
Y<br />
LEA<br />
Rate<br />
100.00%<br />
— —<br />
100.00%<br />
LEA<br />
Rate<br />
Target Met by<br />
LEA (Y/N)<br />
N/A<br />
N<br />
Note: The target for Indicator 09 is to have zero percent<br />
(0%) of districts identified as having disproportionate<br />
representation as a result of inappropriate<br />
identification in eligibility.<br />
Note: The target for Indicator 10 is to have zero<br />
percent (0%) of districts identified as having<br />
disproportionate representation as a result of<br />
inappropriate identification in a disability<br />
category.<br />
Target Met by<br />
LEA (Y/N)<br />
N/A<br />
Y<br />
Target Met<br />
by LEA<br />
(Y/N)<br />
99.21% 100.00% - - N/A<br />
Y<br />
Note: * Indicates a zero reponse rate for the<br />
district.<br />
Page 4 of 5
LEA: 7201 - ELKINS SCHOOL <strong>DISTRICT</strong><br />
Indicator 13: Secondary Transition<br />
Percent of youth with disabilities aged 16 and<br />
up with an IEP that includes coordinated,<br />
measurable, annual IEP goals and transition<br />
services that will reasonably enable the student<br />
to meet the post-secondary goals.<br />
Indicator 14: Post-School Outcomes<br />
A. Percent of youth enrolled in higher<br />
education within one year of leaving high<br />
school.<br />
State<br />
Rate<br />
State<br />
Target<br />
Note: Data for this Indicator is from the on-site monitoring of LEAs for the given year.<br />
B. Percent of youth enrolled in higher<br />
education or competitively employed<br />
within one year of leaving high school.<br />
C. Percent of youth enrolled in higher<br />
education or in some other postsecondary<br />
education or training program; or<br />
competitively employed or in some other<br />
employment within one year of leaving<br />
high school.<br />
State<br />
Rate<br />
Indicator 20: Reported Data-Timely and Accurate*<br />
District submitted<br />
required data elements<br />
on or before due dates;<br />
made revisions within<br />
the alloted reveiw<br />
periods.<br />
Accurate and Timely<br />
Data Submission<br />
Overall (3-21)<br />
Early Childhood (3-5)<br />
School Age (5-21)<br />
State<br />
Target<br />
100.00%<br />
100.00%<br />
100.00%<br />
State<br />
Target<br />
LEA<br />
Rate<br />
LEA<br />
Rate<br />
Target Met by<br />
LEA (Y/N)<br />
Target Met<br />
by LEA<br />
(Y/N)<br />
Target Met<br />
by LEA<br />
(Y/N)<br />
*Data reviewed for timely and accurate submissions included all APSCN cycle data except for personnel<br />
Note: - - denotes not applicable<br />
96.19 100.00 — — N/A<br />
14.53<br />
State<br />
Rate<br />
49.42<br />
State<br />
Rate<br />
54.07<br />
13.00<br />
State<br />
Target<br />
49.00<br />
State<br />
Target<br />
60.00<br />
Y<br />
N/A<br />
Y<br />
— —<br />
LEA<br />
Rate<br />
— —<br />
LEA<br />
Rate<br />
— —<br />
N/A<br />
Target Met<br />
by LEA<br />
(Y/N)<br />
N/A<br />
Target Met<br />
by LEA<br />
(Y/N)<br />
N/A<br />
Page 5 of 5
<strong>ARKANSAS</strong> <strong>SPECIAL</strong> <strong>EDUCATION</strong><br />
<strong>DISTRICT</strong> <strong>ANNUAL</strong> PERFORMANCE REPORT<br />
2010/11 School Year<br />
Publication Date: March 2012<br />
Each State must have in place a State Performance Plan (SPP) to evaluate the State's efforts to meet the requirements and<br />
purposes of the implementation of the Individuals with Disabilities Education Act (IDEA). The SPP is a six-year plan, which<br />
describes Arkansas's performance on 20 indicators. The Office of Special Education Programs in the U. S. Department of<br />
Education requires that States report annually to the public on the performance of each local education agency (LEA) on 14 of<br />
20 indicators as compared with targets established by the State in the SPP. Arkansas will report indicators 1 through 14 and<br />
20 for each LEA serving children with disabilities (CWD). Any LEA not meeting targets on compliance indicators (0% for<br />
Indicators 4B, 09 & 10 and 100% for Indicators 11, 12, 13, and 20) are non-compliant with IDEA.<br />
There are no report changes for the 2010/11 school year profile; However, it is important to recognize that: .<br />
1. Indicator 01 (Graduation) is reported a year in arrear (2009/10 graduates) and is based on a four-year cohort. This<br />
means the rate is a measure of students who entered in ninth grade and graduate in four years. The calculation is a<br />
requirement under Title I of the Elementary and Secondary Education Act (ESEA).<br />
2. Indicator 02 (Drop out) is reported a year in arrear. This means the rate is a measure of students who dropped out in<br />
the 2009/10 school year. The Indicator 02 data are aligned with the Common Core of Data (CCD) requirements for<br />
grades 7-12.<br />
3. Indicator 04A and 4B (Suspension/Expulsion) is reported a year in arrear. This means the rate is a measure of<br />
students who had out-of-school suspensions and/or expulsions totaling more than 10 days.<br />
For a complete description of all the Indicators, please visit the special education website at<br />
http://arksped.k12.ar.us/sections/policy.html<br />
LEA: 7202 - FARMINGTON SCHOOL <strong>DISTRICT</strong><br />
Indicator 01: Graduation Rates (2009/10 school year) Indicator 02: Dropout Rates (2009/10 school year)<br />
Percent of youth<br />
with IEPs<br />
graduating from<br />
high school with a<br />
regular diploma<br />
State<br />
Rate<br />
State<br />
Target<br />
75.76% 85.00%<br />
LEA<br />
Rate<br />
84.62%<br />
Target Met<br />
by LEA<br />
(Y/N)<br />
N<br />
Percent of<br />
youth with<br />
IEPs dropping<br />
out of high<br />
school<br />
State<br />
Rate<br />
Indicator 03: Assessment on Statewide Benchmark Exam (grades 3-8, 11)<br />
A) Adequate Yearly Progress<br />
n=40<br />
Literacy<br />
Mathematics<br />
Met Disability Subgroup "n"<br />
for Reporting Purposes (Y/N)<br />
State Target for % of Districts Meeting<br />
AYP for Disability Subgroup<br />
State<br />
Target<br />
3.06% 4.20%<br />
LEA<br />
Rate<br />
0.94%<br />
% of Districts Meeting AYP<br />
for Disability Subgroup<br />
Target Met by<br />
LEA (Y/N)<br />
Y<br />
Target Met by<br />
LEA(Y/N)<br />
Overall N 17.15% 6.25%<br />
NA<br />
N<br />
N<br />
Note: For a district to qualify as having a disability subgroup it must have a minimum of 40 (n=40) students with disabilities in a school building.<br />
B) Participation<br />
Participation Rate: # of<br />
CWD Tested ÷ # of CWD<br />
Enrolled in grades tested.<br />
Participation Rate: Literacy<br />
Participation Rate: Math<br />
Note: - - denotes not applicable<br />
State<br />
Rate<br />
98.78%<br />
State<br />
Target<br />
95.00%<br />
LEA<br />
Rate<br />
100.00%<br />
Target Met<br />
by LEA (Y/N)<br />
98.61% 95.00% 100.00% Y<br />
Y<br />
C) Performance Proficiency<br />
Percent of CWD Scoring<br />
Proficient or Above<br />
Proficiency Rate: Literacy<br />
Proficiency Rate:<br />
Mathematics<br />
16.00%<br />
16.00%<br />
State<br />
Rate<br />
31.49%<br />
44.86%<br />
State<br />
Target<br />
45.22%<br />
51.14%<br />
LEA<br />
Rate<br />
26.40%<br />
48.61%<br />
NA<br />
NA<br />
Target<br />
Met by<br />
LEA (Y/N)<br />
N<br />
N<br />
Page 1 of 5
LEA: 7202 - FARMINGTON SCHOOL <strong>DISTRICT</strong><br />
Indicator 04: Out-of-School Suspensions and Expulsions (2009/10 school year)<br />
A) Suspension/Expulsion<br />
Percent difference of CWD with out-of- school suspensions and<br />
expulsions totaling greater than 10 days in a school year as<br />
compared to the same data for general education students in<br />
the district.<br />
B) Suspension/Expulsion by Race and Ethnicity<br />
Percent of districts that have: (a) a significant discrepancy, by race or<br />
ethnicity, in the rate of suspensions and expulsions of greater than 10<br />
days in a school year for children with IEPs; and (b) policies,<br />
procedures or practices that contribute to the significant discrepancy<br />
and do not comply with requirements relating to the development<br />
and implementation of IEPs, the use of positive behavioral<br />
interventions and supports, and procedural safeguards.<br />
Indicator 05: School Age (5-21) Least Restrictive Environment<br />
A) In the Regular Class 80% or more of the day<br />
Percent of CWD with<br />
IEPs receiving instruction<br />
in the regular class 80%<br />
or more of the day.<br />
State<br />
Rate<br />
State<br />
Target<br />
LEA<br />
Rate<br />
B) In the Regular Class less than 40% of the day<br />
Percent of CWD with<br />
IEPs receiving instruction<br />
in the regular class less<br />
than 60% of the day.<br />
53.87% 59.77%<br />
State<br />
Rate<br />
State<br />
Target<br />
12.42% 12.51%<br />
63.14%<br />
LEA<br />
Rate<br />
8.63%<br />
C) Other Settings outside the regular class<br />
Percent of CWD with IEPs served in<br />
public or private separate schools,<br />
residential placements, or<br />
homebound/hospital placements.<br />
State<br />
Rate<br />
State<br />
Target<br />
2.80% 2.56%<br />
Target Met<br />
by LEA (Y/N)<br />
Y<br />
Target Met<br />
by LEA (Y/N)<br />
Y<br />
LEA<br />
Rate<br />
1.96%<br />
Target Met<br />
by LEA(Y/N)<br />
Indicator 06: Early Childhood (3-5) Least Restrictive Environment<br />
A) Regular Early Childhood Program<br />
Percent of children (aged 3 through 5) with IEPs attending a regular<br />
early childhood program and receiving the majority of special<br />
education and related services in the regular early childhood program<br />
Allowable<br />
Difference<br />
LEA: 7202 - FARMINGTON SCHOOL <strong>DISTRICT</strong><br />
Indicator 07: Preschool (3-5) Outcomes<br />
a) Percent of preschool CWD<br />
children who did not<br />
improve functioning.<br />
b) Percent of preschool CWD<br />
who improved but whose<br />
functioning remained below<br />
same age peers.<br />
c) Percent of preschool CWD<br />
who improved at a level<br />
nearer to same aged peers.<br />
d) Percent of preschool CWD<br />
who improved functioning to<br />
reach a level comparable to<br />
same age peers.<br />
e) Percent of preschool CWD<br />
children who maintain<br />
functioning at a level<br />
comparable to same aged<br />
peers.<br />
Summary<br />
Statements<br />
1) Of those preschool<br />
children who entered<br />
the preschool program<br />
below age expectations<br />
in each Outcome, the<br />
percent who<br />
substantially increased<br />
their rate of growth by<br />
the time they turned 6<br />
years of age or exited<br />
the program.<br />
2) The percent of<br />
preschool children who<br />
were functioning<br />
within age expectations<br />
in each Outcome by the<br />
time they turned 6<br />
years of age or exited<br />
A) Positive Social -Emotional<br />
Skills*<br />
State<br />
Rate<br />
A) Positive Social -<br />
Emotional Skills<br />
(Including social<br />
relationships)<br />
State<br />
Rate<br />
2.14%<br />
5.31%<br />
25.97%<br />
38.22%<br />
28.36%<br />
State<br />
Target<br />
LEA<br />
Rate<br />
LEA<br />
Rate<br />
— —<br />
— —<br />
— —<br />
— —<br />
— —<br />
Target<br />
Met by<br />
LEA(Y/N)<br />
B) Acquisition and Use of<br />
Knowledge and Skills<br />
(Including early language/<br />
communication and early literacy)<br />
B) Acquisition and Use of<br />
Knowledge and Skills **<br />
State<br />
Rate<br />
1.75%<br />
6.59%<br />
34.23%<br />
43.51%<br />
13.92%<br />
State<br />
Target<br />
LEA<br />
Rate<br />
Target<br />
Met by<br />
LEA(Y/N)<br />
C) Use of Appropriate Behaviors<br />
to Meet Their Needs<br />
State<br />
Rate<br />
State<br />
Target<br />
LEA<br />
Rate<br />
Target<br />
Met by<br />
LEA(Y/N)<br />
89.61% 90.50% — — N/A 90.31% 90.50% — — N/A 90.82% 92.50% — — N/A<br />
66.58% 69.50% — — N/A 57.43% 60.50% — — N/A 76.69% 78.50% — — N/A<br />
NOTE: * Including social relationships ** Including early language/ communication and early literacy<br />
Note: - - denotes not applicable<br />
State<br />
Rate<br />
LEA<br />
Rate<br />
— —<br />
— —<br />
— —<br />
— —<br />
— —<br />
C) Use of<br />
Appropriate<br />
Behaviors to<br />
Meet Their Needs<br />
State<br />
Rate<br />
4.51%<br />
17.34%<br />
41.72%<br />
34.97%<br />
LEA<br />
Rate<br />
1.46% — —<br />
— —<br />
— —<br />
— —<br />
— —<br />
Page 3 of 5
LEA: 7202 - FARMINGTON SCHOOL <strong>DISTRICT</strong><br />
Indicator 08: Parent Involvement<br />
Percent of surveyed<br />
parents who reported<br />
school facilitated parent<br />
involvement as a means<br />
of improving services<br />
and results for children<br />
with disabilities.<br />
Early Childhood<br />
(3-5)<br />
School Age<br />
(5-21)<br />
State<br />
Rate<br />
90.47%<br />
95.05%<br />
Indicator 09: Disproportionality - Eligibility<br />
Disproportionate representation of racial<br />
and ethnic groups in special education and<br />
related services that is a result of<br />
inappropriate identification (e.g.<br />
monitoring data, review of policies,<br />
practices, and procedures under 618(d),<br />
etc.).<br />
State<br />
Rate<br />
State<br />
Target<br />
88.00%<br />
96.00%<br />
State<br />
Target<br />
0.00% 0.00%<br />
LEA<br />
Rate<br />
— —<br />
96.20%<br />
Indicator 10: Disproportionality-Child with a Disability<br />
Disproportionate representation of racial<br />
and ethnic groups in specific disability<br />
categories that is a result of inappropriate<br />
identification (e.g. monitoring data, review<br />
of policies, practices, and procedures under<br />
618(d), etc.).<br />
Indicator 11: Child Find<br />
Percent of children with<br />
parental consent to evaluate<br />
who are evaluated within<br />
the State established timeline<br />
of 60 days.<br />
Overall<br />
(3-21)<br />
Early Childhood<br />
(3-5)<br />
School Age<br />
(5-21)<br />
State<br />
Rate<br />
0.00%<br />
Indicator 12: Early Childhood Transition<br />
Percent of children referred by Part C prior to<br />
age 3, who are found eligible for Part B, and<br />
who have an IEP developed and implemented<br />
by their third birthday.<br />
Note: - - denotes not applicable<br />
State<br />
Rate<br />
99.41%<br />
99.70%<br />
98.97%<br />
State<br />
Rate<br />
State<br />
Target<br />
0.00%<br />
State<br />
Target<br />
100.00%<br />
100.00%<br />
100.00%<br />
State<br />
Target<br />
Target Met by<br />
LEA (Y/N)<br />
Y<br />
Target Met by<br />
LEA (Y/N)<br />
Y<br />
LEA<br />
Rate<br />
100.00%<br />
— —<br />
100.00%<br />
LEA<br />
Rate<br />
Target Met by<br />
LEA (Y/N)<br />
N/A<br />
Y<br />
Note: The target for Indicator 09 is to have zero percent<br />
(0%) of districts identified as having disproportionate<br />
representation as a result of inappropriate<br />
identification in eligibility.<br />
Note: The target for Indicator 10 is to have zero<br />
percent (0%) of districts identified as having<br />
disproportionate representation as a result of<br />
inappropriate identification in a disability<br />
category.<br />
Target Met by<br />
LEA (Y/N)<br />
N/A<br />
Y<br />
Target Met<br />
by LEA<br />
(Y/N)<br />
99.21% 100.00% - - N/A<br />
Y<br />
Note: * Indicates a zero reponse rate for the<br />
district.<br />
Page 4 of 5
LEA: 7202 - FARMINGTON SCHOOL <strong>DISTRICT</strong><br />
Indicator 13: Secondary Transition<br />
Percent of youth with disabilities aged 16 and<br />
up with an IEP that includes coordinated,<br />
measurable, annual IEP goals and transition<br />
services that will reasonably enable the student<br />
to meet the post-secondary goals.<br />
Indicator 14: Post-School Outcomes<br />
A. Percent of youth enrolled in higher<br />
education within one year of leaving high<br />
school.<br />
State<br />
Rate<br />
State<br />
Target<br />
Note: Data for this Indicator is from the on-site monitoring of LEAs for the given year.<br />
B. Percent of youth enrolled in higher<br />
education or competitively employed<br />
within one year of leaving high school.<br />
C. Percent of youth enrolled in higher<br />
education or in some other postsecondary<br />
education or training program; or<br />
competitively employed or in some other<br />
employment within one year of leaving<br />
high school.<br />
State<br />
Rate<br />
Indicator 20: Reported Data-Timely and Accurate*<br />
District submitted<br />
required data elements<br />
on or before due dates;<br />
made revisions within<br />
the alloted reveiw<br />
periods.<br />
Accurate and Timely<br />
Data Submission<br />
Overall (3-21)<br />
Early Childhood (3-5)<br />
School Age (5-21)<br />
State<br />
Target<br />
100.00%<br />
100.00%<br />
100.00%<br />
State<br />
Target<br />
LEA<br />
Rate<br />
LEA<br />
Rate<br />
Target Met by<br />
LEA (Y/N)<br />
Target Met<br />
by LEA<br />
(Y/N)<br />
Target Met<br />
by LEA<br />
(Y/N)<br />
*Data reviewed for timely and accurate submissions included all APSCN cycle data except for personnel<br />
Note: - - denotes not applicable<br />
96.19 100.00 — — N/A<br />
14.53<br />
State<br />
Rate<br />
49.42<br />
State<br />
Rate<br />
54.07<br />
13.00<br />
State<br />
Target<br />
49.00<br />
State<br />
Target<br />
60.00<br />
Y<br />
N/A<br />
Y<br />
— —<br />
LEA<br />
Rate<br />
— —<br />
LEA<br />
Rate<br />
— —<br />
N/A<br />
Target Met<br />
by LEA<br />
(Y/N)<br />
N/A<br />
Target Met<br />
by LEA<br />
(Y/N)<br />
N/A<br />
Page 5 of 5
<strong>ARKANSAS</strong> <strong>SPECIAL</strong> <strong>EDUCATION</strong><br />
<strong>DISTRICT</strong> <strong>ANNUAL</strong> PERFORMANCE REPORT<br />
2010/11 School Year<br />
Publication Date: March 2012<br />
Each State must have in place a State Performance Plan (SPP) to evaluate the State's efforts to meet the requirements and<br />
purposes of the implementation of the Individuals with Disabilities Education Act (IDEA). The SPP is a six-year plan, which<br />
describes Arkansas's performance on 20 indicators. The Office of Special Education Programs in the U. S. Department of<br />
Education requires that States report annually to the public on the performance of each local education agency (LEA) on 14 of<br />
20 indicators as compared with targets established by the State in the SPP. Arkansas will report indicators 1 through 14 and<br />
20 for each LEA serving children with disabilities (CWD). Any LEA not meeting targets on compliance indicators (0% for<br />
Indicators 4B, 09 & 10 and 100% for Indicators 11, 12, 13, and 20) are non-compliant with IDEA.<br />
There are no report changes for the 2010/11 school year profile; However, it is important to recognize that: .<br />
1. Indicator 01 (Graduation) is reported a year in arrear (2009/10 graduates) and is based on a four-year cohort. This<br />
means the rate is a measure of students who entered in ninth grade and graduate in four years. The calculation is a<br />
requirement under Title I of the Elementary and Secondary Education Act (ESEA).<br />
2. Indicator 02 (Drop out) is reported a year in arrear. This means the rate is a measure of students who dropped out in<br />
the 2009/10 school year. The Indicator 02 data are aligned with the Common Core of Data (CCD) requirements for<br />
grades 7-12.<br />
3. Indicator 04A and 4B (Suspension/Expulsion) is reported a year in arrear. This means the rate is a measure of<br />
students who had out-of-school suspensions and/or expulsions totaling more than 10 days.<br />
For a complete description of all the Indicators, please visit the special education website at<br />
http://arksped.k12.ar.us/sections/policy.html<br />
LEA: 7203 - FAYETTEVILLE SCHOOL <strong>DISTRICT</strong><br />
Indicator 01: Graduation Rates (2009/10 school year) Indicator 02: Dropout Rates (2009/10 school year)<br />
Percent of youth<br />
with IEPs<br />
graduating from<br />
high school with a<br />
regular diploma<br />
State<br />
Rate<br />
State<br />
Target<br />
75.76% 85.00%<br />
LEA<br />
Rate<br />
73.33%<br />
Target Met<br />
by LEA<br />
(Y/N)<br />
N<br />
Percent of<br />
youth with<br />
IEPs dropping<br />
out of high<br />
school<br />
State<br />
Rate<br />
Indicator 03: Assessment on Statewide Benchmark Exam (grades 3-8, 11)<br />
A) Adequate Yearly Progress<br />
n=40<br />
Literacy<br />
Mathematics<br />
Met Disability Subgroup "n"<br />
for Reporting Purposes (Y/N)<br />
State Target for % of Districts Meeting<br />
AYP for Disability Subgroup<br />
State<br />
Target<br />
3.06% 4.20%<br />
LEA<br />
Rate<br />
1.29%<br />
% of Districts Meeting AYP<br />
for Disability Subgroup<br />
Target Met by<br />
LEA (Y/N)<br />
Y<br />
Target Met by<br />
LEA(Y/N)<br />
Overall Y 17.15% 6.25%<br />
N<br />
Y<br />
Y<br />
Note: For a district to qualify as having a disability subgroup it must have a minimum of 40 (n=40) students with disabilities in a school building.<br />
B) Participation<br />
Participation Rate: # of<br />
CWD Tested ÷ # of CWD<br />
Enrolled in grades tested.<br />
Participation Rate: Literacy<br />
Participation Rate: Math<br />
Note: - - denotes not applicable<br />
State<br />
Rate<br />
98.78%<br />
State<br />
Target<br />
95.00%<br />
LEA<br />
Rate<br />
97.85%<br />
Target Met<br />
by LEA (Y/N)<br />
98.61% 95.00% 98.17% Y<br />
Y<br />
C) Performance Proficiency<br />
Percent of CWD Scoring<br />
Proficient or Above<br />
Proficiency Rate: Literacy<br />
Proficiency Rate:<br />
Mathematics<br />
16.00%<br />
16.00%<br />
State<br />
Rate<br />
31.49%<br />
44.86%<br />
State<br />
Target<br />
45.22%<br />
51.14%<br />
LEA<br />
Rate<br />
40.77%<br />
52.26%<br />
N<br />
N<br />
Target<br />
Met by<br />
LEA (Y/N)<br />
N<br />
Y<br />
Page 1 of 5
LEA: 7203 - FAYETTEVILLE SCHOOL <strong>DISTRICT</strong><br />
Indicator 04: Out-of-School Suspensions and Expulsions (2009/10 school year)<br />
A) Suspension/Expulsion<br />
Percent difference of CWD with out-of- school suspensions and<br />
expulsions totaling greater than 10 days in a school year as<br />
compared to the same data for general education students in<br />
the district.<br />
B) Suspension/Expulsion by Race and Ethnicity<br />
Percent of districts that have: (a) a significant discrepancy, by race or<br />
ethnicity, in the rate of suspensions and expulsions of greater than 10<br />
days in a school year for children with IEPs; and (b) policies,<br />
procedures or practices that contribute to the significant discrepancy<br />
and do not comply with requirements relating to the development<br />
and implementation of IEPs, the use of positive behavioral<br />
interventions and supports, and procedural safeguards.<br />
Indicator 05: School Age (5-21) Least Restrictive Environment<br />
A) In the Regular Class 80% or more of the day<br />
Percent of CWD with<br />
IEPs receiving instruction<br />
in the regular class 80%<br />
or more of the day.<br />
State<br />
Rate<br />
State<br />
Target<br />
LEA<br />
Rate<br />
B) In the Regular Class less than 40% of the day<br />
Percent of CWD with<br />
IEPs receiving instruction<br />
in the regular class less<br />
than 60% of the day.<br />
53.87% 59.77%<br />
State<br />
Rate<br />
State<br />
Target<br />
12.42% 12.51%<br />
62.63%<br />
LEA<br />
Rate<br />
6.57%<br />
C) Other Settings outside the regular class<br />
Percent of CWD with IEPs served in<br />
public or private separate schools,<br />
residential placements, or<br />
homebound/hospital placements.<br />
State<br />
Rate<br />
State<br />
Target<br />
2.80% 2.56%<br />
Target Met<br />
by LEA (Y/N)<br />
Y<br />
Target Met<br />
by LEA (Y/N)<br />
Y<br />
LEA<br />
Rate<br />
3.33%<br />
Target Met<br />
by LEA(Y/N)<br />
Indicator 06: Early Childhood (3-5) Least Restrictive Environment<br />
A) Regular Early Childhood Program<br />
Percent of children (aged 3 through 5) with IEPs attending a regular<br />
early childhood program and receiving the majority of special<br />
education and related services in the regular early childhood program<br />
Allowable<br />
Difference<br />
LEA: 7203 - FAYETTEVILLE SCHOOL <strong>DISTRICT</strong><br />
Indicator 07: Preschool (3-5) Outcomes<br />
a) Percent of preschool CWD<br />
children who did not<br />
improve functioning.<br />
b) Percent of preschool CWD<br />
who improved but whose<br />
functioning remained below<br />
same age peers.<br />
c) Percent of preschool CWD<br />
who improved at a level<br />
nearer to same aged peers.<br />
d) Percent of preschool CWD<br />
who improved functioning to<br />
reach a level comparable to<br />
same age peers.<br />
e) Percent of preschool CWD<br />
children who maintain<br />
functioning at a level<br />
comparable to same aged<br />
peers.<br />
Summary<br />
Statements<br />
1) Of those preschool<br />
children who entered<br />
the preschool program<br />
below age expectations<br />
in each Outcome, the<br />
percent who<br />
substantially increased<br />
their rate of growth by<br />
the time they turned 6<br />
years of age or exited<br />
the program.<br />
2) The percent of<br />
preschool children who<br />
were functioning<br />
within age expectations<br />
in each Outcome by the<br />
time they turned 6<br />
years of age or exited<br />
A) Positive Social -Emotional<br />
Skills*<br />
State<br />
Rate<br />
A) Positive Social -<br />
Emotional Skills<br />
(Including social<br />
relationships)<br />
State<br />
Rate<br />
2.14%<br />
5.31%<br />
25.97%<br />
38.22%<br />
28.36%<br />
State<br />
Target<br />
LEA<br />
Rate<br />
LEA<br />
Rate<br />
— —<br />
— —<br />
— —<br />
— —<br />
— —<br />
Target<br />
Met by<br />
LEA(Y/N)<br />
B) Acquisition and Use of<br />
Knowledge and Skills<br />
(Including early language/<br />
communication and early literacy)<br />
B) Acquisition and Use of<br />
Knowledge and Skills **<br />
State<br />
Rate<br />
1.75%<br />
6.59%<br />
34.23%<br />
43.51%<br />
13.92%<br />
State<br />
Target<br />
LEA<br />
Rate<br />
Target<br />
Met by<br />
LEA(Y/N)<br />
C) Use of Appropriate Behaviors<br />
to Meet Their Needs<br />
State<br />
Rate<br />
State<br />
Target<br />
LEA<br />
Rate<br />
Target<br />
Met by<br />
LEA(Y/N)<br />
89.61% 90.50% — — N/A 90.31% 90.50% — — N/A 90.82% 92.50% — — N/A<br />
66.58% 69.50% — — N/A 57.43% 60.50% — — N/A 76.69% 78.50% — — N/A<br />
NOTE: * Including social relationships ** Including early language/ communication and early literacy<br />
Note: - - denotes not applicable<br />
State<br />
Rate<br />
LEA<br />
Rate<br />
— —<br />
— —<br />
— —<br />
— —<br />
— —<br />
C) Use of<br />
Appropriate<br />
Behaviors to<br />
Meet Their Needs<br />
State<br />
Rate<br />
4.51%<br />
17.34%<br />
41.72%<br />
34.97%<br />
LEA<br />
Rate<br />
1.46% — —<br />
— —<br />
— —<br />
— —<br />
— —<br />
Page 3 of 5
LEA: 7203 - FAYETTEVILLE SCHOOL <strong>DISTRICT</strong><br />
Indicator 08: Parent Involvement<br />
Percent of surveyed<br />
parents who reported<br />
school facilitated parent<br />
involvement as a means<br />
of improving services<br />
and results for children<br />
with disabilities.<br />
Early Childhood<br />
(3-5)<br />
School Age<br />
(5-21)<br />
State<br />
Rate<br />
90.47%<br />
95.05%<br />
Indicator 09: Disproportionality - Eligibility<br />
Disproportionate representation of racial<br />
and ethnic groups in special education and<br />
related services that is a result of<br />
inappropriate identification (e.g.<br />
monitoring data, review of policies,<br />
practices, and procedures under 618(d),<br />
etc.).<br />
State<br />
Rate<br />
State<br />
Target<br />
88.00%<br />
96.00%<br />
State<br />
Target<br />
0.00% 0.00%<br />
LEA<br />
Rate<br />
— —<br />
92.42%<br />
Indicator 10: Disproportionality-Child with a Disability<br />
Disproportionate representation of racial<br />
and ethnic groups in specific disability<br />
categories that is a result of inappropriate<br />
identification (e.g. monitoring data, review<br />
of policies, practices, and procedures under<br />
618(d), etc.).<br />
Indicator 11: Child Find<br />
Percent of children with<br />
parental consent to evaluate<br />
who are evaluated within<br />
the State established timeline<br />
of 60 days.<br />
Overall<br />
(3-21)<br />
Early Childhood<br />
(3-5)<br />
School Age<br />
(5-21)<br />
State<br />
Rate<br />
0.00%<br />
Indicator 12: Early Childhood Transition<br />
Percent of children referred by Part C prior to<br />
age 3, who are found eligible for Part B, and<br />
who have an IEP developed and implemented<br />
by their third birthday.<br />
Note: - - denotes not applicable<br />
State<br />
Rate<br />
99.41%<br />
99.70%<br />
98.97%<br />
State<br />
Rate<br />
State<br />
Target<br />
0.00%<br />
State<br />
Target<br />
100.00%<br />
100.00%<br />
100.00%<br />
State<br />
Target<br />
Target Met by<br />
LEA (Y/N)<br />
Y<br />
Target Met by<br />
LEA (Y/N)<br />
Y<br />
LEA<br />
Rate<br />
100.00%<br />
— —<br />
100.00%<br />
LEA<br />
Rate<br />
Target Met by<br />
LEA (Y/N)<br />
N/A<br />
N<br />
Note: The target for Indicator 09 is to have zero percent<br />
(0%) of districts identified as having disproportionate<br />
representation as a result of inappropriate<br />
identification in eligibility.<br />
Note: The target for Indicator 10 is to have zero<br />
percent (0%) of districts identified as having<br />
disproportionate representation as a result of<br />
inappropriate identification in a disability<br />
category.<br />
Target Met by<br />
LEA (Y/N)<br />
N/A<br />
Y<br />
Target Met<br />
by LEA<br />
(Y/N)<br />
99.21% 100.00% - - N/A<br />
Y<br />
Note: * Indicates a zero reponse rate for the<br />
district.<br />
Page 4 of 5
LEA: 7203 - FAYETTEVILLE SCHOOL <strong>DISTRICT</strong><br />
Indicator 13: Secondary Transition<br />
Percent of youth with disabilities aged 16 and<br />
up with an IEP that includes coordinated,<br />
measurable, annual IEP goals and transition<br />
services that will reasonably enable the student<br />
to meet the post-secondary goals.<br />
Indicator 14: Post-School Outcomes<br />
A. Percent of youth enrolled in higher<br />
education within one year of leaving high<br />
school.<br />
State<br />
Rate<br />
State<br />
Target<br />
Note: Data for this Indicator is from the on-site monitoring of LEAs for the given year.<br />
B. Percent of youth enrolled in higher<br />
education or competitively employed<br />
within one year of leaving high school.<br />
C. Percent of youth enrolled in higher<br />
education or in some other postsecondary<br />
education or training program; or<br />
competitively employed or in some other<br />
employment within one year of leaving<br />
high school.<br />
State<br />
Rate<br />
Indicator 20: Reported Data-Timely and Accurate*<br />
District submitted<br />
required data elements<br />
on or before due dates;<br />
made revisions within<br />
the alloted reveiw<br />
periods.<br />
Accurate and Timely<br />
Data Submission<br />
Overall (3-21)<br />
Early Childhood (3-5)<br />
School Age (5-21)<br />
State<br />
Target<br />
100.00%<br />
100.00%<br />
100.00%<br />
State<br />
Target<br />
LEA<br />
Rate<br />
LEA<br />
Rate<br />
Target Met by<br />
LEA (Y/N)<br />
Target Met<br />
by LEA<br />
(Y/N)<br />
Target Met<br />
by LEA<br />
(Y/N)<br />
*Data reviewed for timely and accurate submissions included all APSCN cycle data except for personnel<br />
Note: - - denotes not applicable<br />
96.19 100.00 100.00% Y<br />
14.53<br />
State<br />
Rate<br />
49.42<br />
State<br />
Rate<br />
54.07<br />
13.00<br />
State<br />
Target<br />
49.00<br />
State<br />
Target<br />
60.00<br />
Y<br />
N/A<br />
Y<br />
36.84%<br />
LEA<br />
Rate<br />
52.63%<br />
LEA<br />
Rate<br />
52.63%<br />
Y<br />
Target Met<br />
by LEA<br />
(Y/N)<br />
Y<br />
Target Met<br />
by LEA<br />
(Y/N)<br />
N<br />
Page 5 of 5
<strong>ARKANSAS</strong> <strong>SPECIAL</strong> <strong>EDUCATION</strong><br />
<strong>DISTRICT</strong> <strong>ANNUAL</strong> PERFORMANCE REPORT<br />
2010/11 School Year<br />
Publication Date: March 2012<br />
Each State must have in place a State Performance Plan (SPP) to evaluate the State's efforts to meet the requirements and<br />
purposes of the implementation of the Individuals with Disabilities Education Act (IDEA). The SPP is a six-year plan, which<br />
describes Arkansas's performance on 20 indicators. The Office of Special Education Programs in the U. S. Department of<br />
Education requires that States report annually to the public on the performance of each local education agency (LEA) on 14 of<br />
20 indicators as compared with targets established by the State in the SPP. Arkansas will report indicators 1 through 14 and<br />
20 for each LEA serving children with disabilities (CWD). Any LEA not meeting targets on compliance indicators (0% for<br />
Indicators 4B, 09 & 10 and 100% for Indicators 11, 12, 13, and 20) are non-compliant with IDEA.<br />
There are no report changes for the 2010/11 school year profile; However, it is important to recognize that: .<br />
1. Indicator 01 (Graduation) is reported a year in arrear (2009/10 graduates) and is based on a four-year cohort. This<br />
means the rate is a measure of students who entered in ninth grade and graduate in four years. The calculation is a<br />
requirement under Title I of the Elementary and Secondary Education Act (ESEA).<br />
2. Indicator 02 (Drop out) is reported a year in arrear. This means the rate is a measure of students who dropped out in<br />
the 2009/10 school year. The Indicator 02 data are aligned with the Common Core of Data (CCD) requirements for<br />
grades 7-12.<br />
3. Indicator 04A and 4B (Suspension/Expulsion) is reported a year in arrear. This means the rate is a measure of<br />
students who had out-of-school suspensions and/or expulsions totaling more than 10 days.<br />
For a complete description of all the Indicators, please visit the special education website at<br />
http://arksped.k12.ar.us/sections/policy.html<br />
LEA: 7204 - GREENLAND SCHOOL <strong>DISTRICT</strong><br />
Indicator 01: Graduation Rates (2009/10 school year) Indicator 02: Dropout Rates (2009/10 school year)<br />
Percent of youth<br />
with IEPs<br />
graduating from<br />
high school with a<br />
regular diploma<br />
State<br />
Rate<br />
State<br />
Target<br />
75.76% 85.00%<br />
LEA<br />
Rate<br />
50.00%<br />
Target Met<br />
by LEA<br />
(Y/N)<br />
N<br />
Percent of<br />
youth with<br />
IEPs dropping<br />
out of high<br />
school<br />
State<br />
Rate<br />
Indicator 03: Assessment on Statewide Benchmark Exam (grades 3-8, 11)<br />
A) Adequate Yearly Progress<br />
n=40<br />
Literacy<br />
Mathematics<br />
Met Disability Subgroup "n"<br />
for Reporting Purposes (Y/N)<br />
State Target for % of Districts Meeting<br />
AYP for Disability Subgroup<br />
State<br />
Target<br />
3.06% 4.20%<br />
LEA<br />
Rate<br />
11.63%<br />
% of Districts Meeting AYP<br />
for Disability Subgroup<br />
Target Met by<br />
LEA (Y/N)<br />
N<br />
Target Met by<br />
LEA(Y/N)<br />
Overall N 17.15% 6.25%<br />
NA<br />
N<br />
N<br />
Note: For a district to qualify as having a disability subgroup it must have a minimum of 40 (n=40) students with disabilities in a school building.<br />
B) Participation<br />
Participation Rate: # of<br />
CWD Tested ÷ # of CWD<br />
Enrolled in grades tested.<br />
Participation Rate: Literacy<br />
Participation Rate: Math<br />
Note: - - denotes not applicable<br />
State<br />
Rate<br />
98.78%<br />
State<br />
Target<br />
95.00%<br />
LEA<br />
Rate<br />
96.55%<br />
Target Met<br />
by LEA (Y/N)<br />
98.61% 95.00% 96.15% Y<br />
Y<br />
C) Performance Proficiency<br />
Percent of CWD Scoring<br />
Proficient or Above<br />
Proficiency Rate: Literacy<br />
Proficiency Rate:<br />
Mathematics<br />
16.00%<br />
16.00%<br />
State<br />
Rate<br />
31.49%<br />
44.86%<br />
State<br />
Target<br />
45.22%<br />
51.14%<br />
LEA<br />
Rate<br />
3.85%<br />
13.04%<br />
NA<br />
NA<br />
Target<br />
Met by<br />
LEA (Y/N)<br />
N<br />
N<br />
Page 1 of 5
LEA: 7204 - GREENLAND SCHOOL <strong>DISTRICT</strong><br />
Indicator 04: Out-of-School Suspensions and Expulsions (2009/10 school year)<br />
A) Suspension/Expulsion<br />
Percent difference of CWD with out-of- school suspensions and<br />
expulsions totaling greater than 10 days in a school year as<br />
compared to the same data for general education students in<br />
the district.<br />
B) Suspension/Expulsion by Race and Ethnicity<br />
Percent of districts that have: (a) a significant discrepancy, by race or<br />
ethnicity, in the rate of suspensions and expulsions of greater than 10<br />
days in a school year for children with IEPs; and (b) policies,<br />
procedures or practices that contribute to the significant discrepancy<br />
and do not comply with requirements relating to the development<br />
and implementation of IEPs, the use of positive behavioral<br />
interventions and supports, and procedural safeguards.<br />
Indicator 05: School Age (5-21) Least Restrictive Environment<br />
A) In the Regular Class 80% or more of the day<br />
Percent of CWD with<br />
IEPs receiving instruction<br />
in the regular class 80%<br />
or more of the day.<br />
State<br />
Rate<br />
State<br />
Target<br />
LEA<br />
Rate<br />
B) In the Regular Class less than 40% of the day<br />
Percent of CWD with<br />
IEPs receiving instruction<br />
in the regular class less<br />
than 60% of the day.<br />
53.87% 59.77%<br />
State<br />
Rate<br />
State<br />
Target<br />
12.42% 12.51%<br />
47.37%<br />
LEA<br />
Rate<br />
3.16%<br />
C) Other Settings outside the regular class<br />
Percent of CWD with IEPs served in<br />
public or private separate schools,<br />
residential placements, or<br />
homebound/hospital placements.<br />
State<br />
Rate<br />
State<br />
Target<br />
2.80% 2.56%<br />
Target Met<br />
by LEA (Y/N)<br />
N<br />
Target Met<br />
by LEA (Y/N)<br />
Y<br />
LEA<br />
Rate<br />
4.21%<br />
Target Met<br />
by LEA(Y/N)<br />
Indicator 06: Early Childhood (3-5) Least Restrictive Environment<br />
A) Regular Early Childhood Program<br />
Percent of children (aged 3 through 5) with IEPs attending a regular<br />
early childhood program and receiving the majority of special<br />
education and related services in the regular early childhood program<br />
Allowable<br />
Difference<br />
LEA: 7204 - GREENLAND SCHOOL <strong>DISTRICT</strong><br />
Indicator 07: Preschool (3-5) Outcomes<br />
a) Percent of preschool CWD<br />
children who did not<br />
improve functioning.<br />
b) Percent of preschool CWD<br />
who improved but whose<br />
functioning remained below<br />
same age peers.<br />
c) Percent of preschool CWD<br />
who improved at a level<br />
nearer to same aged peers.<br />
d) Percent of preschool CWD<br />
who improved functioning to<br />
reach a level comparable to<br />
same age peers.<br />
e) Percent of preschool CWD<br />
children who maintain<br />
functioning at a level<br />
comparable to same aged<br />
peers.<br />
Summary<br />
Statements<br />
1) Of those preschool<br />
children who entered<br />
the preschool program<br />
below age expectations<br />
in each Outcome, the<br />
percent who<br />
substantially increased<br />
their rate of growth by<br />
the time they turned 6<br />
years of age or exited<br />
the program.<br />
2) The percent of<br />
preschool children who<br />
were functioning<br />
within age expectations<br />
in each Outcome by the<br />
time they turned 6<br />
years of age or exited<br />
A) Positive Social -Emotional<br />
Skills*<br />
State<br />
Rate<br />
A) Positive Social -<br />
Emotional Skills<br />
(Including social<br />
relationships)<br />
State<br />
Rate<br />
2.14%<br />
5.31%<br />
25.97%<br />
38.22%<br />
28.36%<br />
State<br />
Target<br />
LEA<br />
Rate<br />
LEA<br />
Rate<br />
— —<br />
— —<br />
— —<br />
— —<br />
— —<br />
Target<br />
Met by<br />
LEA(Y/N)<br />
B) Acquisition and Use of<br />
Knowledge and Skills<br />
(Including early language/<br />
communication and early literacy)<br />
B) Acquisition and Use of<br />
Knowledge and Skills **<br />
State<br />
Rate<br />
1.75%<br />
6.59%<br />
34.23%<br />
43.51%<br />
13.92%<br />
State<br />
Target<br />
LEA<br />
Rate<br />
Target<br />
Met by<br />
LEA(Y/N)<br />
C) Use of Appropriate Behaviors<br />
to Meet Their Needs<br />
State<br />
Rate<br />
State<br />
Target<br />
LEA<br />
Rate<br />
Target<br />
Met by<br />
LEA(Y/N)<br />
89.61% 90.50% — — N/A 90.31% 90.50% — — N/A 90.82% 92.50% — — N/A<br />
66.58% 69.50% — — N/A 57.43% 60.50% — — N/A 76.69% 78.50% — — N/A<br />
NOTE: * Including social relationships ** Including early language/ communication and early literacy<br />
Note: - - denotes not applicable<br />
State<br />
Rate<br />
LEA<br />
Rate<br />
— —<br />
— —<br />
— —<br />
— —<br />
— —<br />
C) Use of<br />
Appropriate<br />
Behaviors to<br />
Meet Their Needs<br />
State<br />
Rate<br />
4.51%<br />
17.34%<br />
41.72%<br />
34.97%<br />
LEA<br />
Rate<br />
1.46% — —<br />
— —<br />
— —<br />
— —<br />
— —<br />
Page 3 of 5
LEA: 7204 - GREENLAND SCHOOL <strong>DISTRICT</strong><br />
Indicator 08: Parent Involvement<br />
Percent of surveyed<br />
parents who reported<br />
school facilitated parent<br />
involvement as a means<br />
of improving services<br />
and results for children<br />
with disabilities.<br />
Early Childhood<br />
(3-5)<br />
School Age<br />
(5-21)<br />
State<br />
Rate<br />
90.47%<br />
95.05%<br />
Indicator 09: Disproportionality - Eligibility<br />
Disproportionate representation of racial<br />
and ethnic groups in special education and<br />
related services that is a result of<br />
inappropriate identification (e.g.<br />
monitoring data, review of policies,<br />
practices, and procedures under 618(d),<br />
etc.).<br />
State<br />
Rate<br />
State<br />
Target<br />
88.00%<br />
96.00%<br />
State<br />
Target<br />
0.00% 0.00%<br />
LEA<br />
Rate<br />
— —<br />
96.67%<br />
Indicator 10: Disproportionality-Child with a Disability<br />
Disproportionate representation of racial<br />
and ethnic groups in specific disability<br />
categories that is a result of inappropriate<br />
identification (e.g. monitoring data, review<br />
of policies, practices, and procedures under<br />
618(d), etc.).<br />
Indicator 11: Child Find<br />
Percent of children with<br />
parental consent to evaluate<br />
who are evaluated within<br />
the State established timeline<br />
of 60 days.<br />
Overall<br />
(3-21)<br />
Early Childhood<br />
(3-5)<br />
School Age<br />
(5-21)<br />
State<br />
Rate<br />
0.00%<br />
Indicator 12: Early Childhood Transition<br />
Percent of children referred by Part C prior to<br />
age 3, who are found eligible for Part B, and<br />
who have an IEP developed and implemented<br />
by their third birthday.<br />
Note: - - denotes not applicable<br />
State<br />
Rate<br />
99.41%<br />
99.70%<br />
98.97%<br />
State<br />
Rate<br />
State<br />
Target<br />
0.00%<br />
State<br />
Target<br />
100.00%<br />
100.00%<br />
100.00%<br />
State<br />
Target<br />
Target Met by<br />
LEA (Y/N)<br />
Y<br />
Target Met by<br />
LEA (Y/N)<br />
Y<br />
LEA<br />
Rate<br />
100.00%<br />
— —<br />
100.00%<br />
LEA<br />
Rate<br />
Target Met by<br />
LEA (Y/N)<br />
N/A<br />
Y<br />
Note: The target for Indicator 09 is to have zero percent<br />
(0%) of districts identified as having disproportionate<br />
representation as a result of inappropriate<br />
identification in eligibility.<br />
Note: The target for Indicator 10 is to have zero<br />
percent (0%) of districts identified as having<br />
disproportionate representation as a result of<br />
inappropriate identification in a disability<br />
category.<br />
Target Met by<br />
LEA (Y/N)<br />
N/A<br />
Y<br />
Target Met<br />
by LEA<br />
(Y/N)<br />
99.21% 100.00% - - N/A<br />
Y<br />
Note: * Indicates a zero reponse rate for the<br />
district.<br />
Page 4 of 5
LEA: 7204 - GREENLAND SCHOOL <strong>DISTRICT</strong><br />
Indicator 13: Secondary Transition<br />
Percent of youth with disabilities aged 16 and<br />
up with an IEP that includes coordinated,<br />
measurable, annual IEP goals and transition<br />
services that will reasonably enable the student<br />
to meet the post-secondary goals.<br />
Indicator 14: Post-School Outcomes<br />
A. Percent of youth enrolled in higher<br />
education within one year of leaving high<br />
school.<br />
State<br />
Rate<br />
State<br />
Target<br />
Note: Data for this Indicator is from the on-site monitoring of LEAs for the given year.<br />
B. Percent of youth enrolled in higher<br />
education or competitively employed<br />
within one year of leaving high school.<br />
C. Percent of youth enrolled in higher<br />
education or in some other postsecondary<br />
education or training program; or<br />
competitively employed or in some other<br />
employment within one year of leaving<br />
high school.<br />
State<br />
Rate<br />
Indicator 20: Reported Data-Timely and Accurate*<br />
District submitted<br />
required data elements<br />
on or before due dates;<br />
made revisions within<br />
the alloted reveiw<br />
periods.<br />
Accurate and Timely<br />
Data Submission<br />
Overall (3-21)<br />
Early Childhood (3-5)<br />
School Age (5-21)<br />
State<br />
Target<br />
100.00%<br />
100.00%<br />
100.00%<br />
State<br />
Target<br />
LEA<br />
Rate<br />
LEA<br />
Rate<br />
Target Met by<br />
LEA (Y/N)<br />
Target Met<br />
by LEA<br />
(Y/N)<br />
Target Met<br />
by LEA<br />
(Y/N)<br />
*Data reviewed for timely and accurate submissions included all APSCN cycle data except for personnel<br />
Note: - - denotes not applicable<br />
96.19 100.00 — — N/A<br />
14.53<br />
State<br />
Rate<br />
49.42<br />
State<br />
Rate<br />
54.07<br />
13.00<br />
State<br />
Target<br />
49.00<br />
State<br />
Target<br />
60.00<br />
Y<br />
N/A<br />
Y<br />
— —<br />
LEA<br />
Rate<br />
— —<br />
LEA<br />
Rate<br />
— —<br />
N/A<br />
Target Met<br />
by LEA<br />
(Y/N)<br />
N/A<br />
Target Met<br />
by LEA<br />
(Y/N)<br />
N/A<br />
Page 5 of 5
LEA: 7205 - LINCOLN SCHOOL <strong>DISTRICT</strong><br />
<strong>ARKANSAS</strong> <strong>SPECIAL</strong> <strong>EDUCATION</strong><br />
<strong>DISTRICT</strong> <strong>ANNUAL</strong> PERFORMANCE REPORT<br />
2010/11 School Year<br />
Publication Date: March 2012<br />
Each State must have in place a State Performance Plan (SPP) to evaluate the State's efforts to meet the requirements and<br />
purposes of the implementation of the Individuals with Disabilities Education Act (IDEA). The SPP is a six-year plan, which<br />
describes Arkansas's performance on 20 indicators. The Office of Special Education Programs in the U. S. Department of<br />
Education requires that States report annually to the public on the performance of each local education agency (LEA) on 14 of<br />
20 indicators as compared with targets established by the State in the SPP. Arkansas will report indicators 1 through 14 and<br />
20 for each LEA serving children with disabilities (CWD). Any LEA not meeting targets on compliance indicators (0% for<br />
Indicators 4B, 09 & 10 and 100% for Indicators 11, 12, 13, and 20) are non-compliant with IDEA.<br />
There are no report changes for the 2010/11 school year profile; However, it is important to recognize that: .<br />
1. Indicator 01 (Graduation) is reported a year in arrear (2009/10 graduates) and is based on a four-year cohort. This<br />
means the rate is a measure of students who entered in ninth grade and graduate in four years. The calculation is a<br />
requirement under Title I of the Elementary and Secondary Education Act (ESEA).<br />
2. Indicator 02 (Drop out) is reported a year in arrear. This means the rate is a measure of students who dropped out in<br />
the 2009/10 school year. The Indicator 02 data are aligned with the Common Core of Data (CCD) requirements for<br />
grades 7-12.<br />
3. Indicator 04A and 4B (Suspension/Expulsion) is reported a year in arrear. This means the rate is a measure of<br />
students who had out-of-school suspensions and/or expulsions totaling more than 10 days.<br />
Percent of youth<br />
with IEPs<br />
graduating from<br />
high school with a<br />
regular diploma<br />
For a complete description of all the Indicators, please visit the special education website at<br />
http://arksped.k12.ar.us/sections/policy.html<br />
Indicator 01: Graduation Rates (2009/10 school year) Indicator 02: Dropout Rates (2009/10 school year)<br />
State<br />
Rate<br />
State<br />
Target<br />
75.76% 85.00%<br />
LEA<br />
Rate<br />
85.71%<br />
Target Met<br />
by LEA<br />
(Y/N)<br />
Y<br />
Percent of<br />
youth with<br />
IEPs dropping<br />
out of high<br />
school<br />
State<br />
Rate<br />
Indicator 03: Assessment on Statewide Benchmark Exam (grades 3-8, 11)<br />
A) Adequate Yearly Progress<br />
n=40<br />
Literacy<br />
Mathematics<br />
Met Disability Subgroup "n"<br />
for Reporting Purposes (Y/N)<br />
State Target for % of Districts Meeting<br />
AYP for Disability Subgroup<br />
State<br />
Target<br />
3.06% 4.20%<br />
LEA<br />
Rate<br />
3.23%<br />
% of Districts Meeting AYP<br />
for Disability Subgroup<br />
Target Met by<br />
LEA (Y/N)<br />
Y<br />
Target Met by<br />
LEA(Y/N)<br />
Overall N 17.15% 6.25%<br />
NA<br />
N<br />
N<br />
Note: For a district to qualify as having a disability subgroup it must have a minimum of 40 (n=40) students with disabilities in a school building.<br />
B) Participation<br />
Participation Rate: # of<br />
CWD Tested ÷ # of CWD<br />
Enrolled in grades tested.<br />
Participation Rate: Literacy<br />
Participation Rate: Math<br />
Note: - - denotes not applicable<br />
State<br />
Rate<br />
98.78%<br />
State<br />
Target<br />
95.00%<br />
LEA<br />
Rate<br />
100.00%<br />
Target Met<br />
by LEA (Y/N)<br />
98.61% 95.00% 100.00% Y<br />
Y<br />
C) Performance Proficiency<br />
Percent of CWD Scoring<br />
Proficient or Above<br />
Proficiency Rate: Literacy<br />
Proficiency Rate:<br />
Mathematics<br />
16.00%<br />
16.00%<br />
State<br />
Rate<br />
31.49%<br />
44.86%<br />
State<br />
Target<br />
45.22%<br />
51.14%<br />
LEA<br />
Rate<br />
17.50%<br />
25.68%<br />
NA<br />
NA<br />
Target<br />
Met by<br />
LEA (Y/N)<br />
N<br />
N<br />
Page 1 of 5
LEA: 7205 - LINCOLN SCHOOL <strong>DISTRICT</strong><br />
Indicator 04: Out-of-School Suspensions and Expulsions (2009/10 school year)<br />
A) Suspension/Expulsion<br />
Percent difference of CWD with out-of- school suspensions and<br />
expulsions totaling greater than 10 days in a school year as<br />
compared to the same data for general education students in<br />
the district.<br />
B) Suspension/Expulsion by Race and Ethnicity<br />
Percent of districts that have: (a) a significant discrepancy, by race or<br />
ethnicity, in the rate of suspensions and expulsions of greater than 10<br />
days in a school year for children with IEPs; and (b) policies,<br />
procedures or practices that contribute to the significant discrepancy<br />
and do not comply with requirements relating to the development<br />
and implementation of IEPs, the use of positive behavioral<br />
interventions and supports, and procedural safeguards.<br />
Indicator 05: School Age (5-21) Least Restrictive Environment<br />
A) In the Regular Class 80% or more of the day<br />
Percent of CWD with<br />
IEPs receiving instruction<br />
in the regular class 80%<br />
or more of the day.<br />
State<br />
Rate<br />
State<br />
Target<br />
LEA<br />
Rate<br />
B) In the Regular Class less than 40% of the day<br />
Percent of CWD with<br />
IEPs receiving instruction<br />
in the regular class less<br />
than 60% of the day.<br />
53.87% 59.77%<br />
State<br />
Rate<br />
State<br />
Target<br />
12.42% 12.51%<br />
43.90%<br />
LEA<br />
Rate<br />
7.32%<br />
C) Other Settings outside the regular class<br />
Percent of CWD with IEPs served in<br />
public or private separate schools,<br />
residential placements, or<br />
homebound/hospital placements.<br />
State<br />
Rate<br />
State<br />
Target<br />
2.80% 2.56%<br />
Target Met<br />
by LEA (Y/N)<br />
N<br />
Target Met<br />
by LEA (Y/N)<br />
Y<br />
LEA<br />
Rate<br />
1.83%<br />
Target Met<br />
by LEA(Y/N)<br />
Indicator 06: Early Childhood (3-5) Least Restrictive Environment<br />
A) Regular Early Childhood Program<br />
Percent of children (aged 3 through 5) with IEPs attending a regular<br />
early childhood program and receiving the majority of special<br />
education and related services in the regular early childhood program<br />
Allowable<br />
Difference<br />
LEA: 7205 - LINCOLN SCHOOL <strong>DISTRICT</strong><br />
Indicator 07: Preschool (3-5) Outcomes<br />
a) Percent of preschool CWD<br />
children who did not<br />
improve functioning.<br />
b) Percent of preschool CWD<br />
who improved but whose<br />
functioning remained below<br />
same age peers.<br />
c) Percent of preschool CWD<br />
who improved at a level<br />
nearer to same aged peers.<br />
d) Percent of preschool CWD<br />
who improved functioning to<br />
reach a level comparable to<br />
same age peers.<br />
e) Percent of preschool CWD<br />
children who maintain<br />
functioning at a level<br />
comparable to same aged<br />
peers.<br />
Summary<br />
Statements<br />
1) Of those preschool<br />
children who entered<br />
the preschool program<br />
below age expectations<br />
in each Outcome, the<br />
percent who<br />
substantially increased<br />
their rate of growth by<br />
the time they turned 6<br />
years of age or exited<br />
the program.<br />
2) The percent of<br />
preschool children who<br />
were functioning<br />
within age expectations<br />
in each Outcome by the<br />
time they turned 6<br />
years of age or exited<br />
A) Positive Social -Emotional<br />
Skills*<br />
State<br />
Rate<br />
A) Positive Social -<br />
Emotional Skills<br />
(Including social<br />
relationships)<br />
State<br />
Rate<br />
2.14%<br />
5.31%<br />
25.97%<br />
38.22%<br />
28.36%<br />
State<br />
Target<br />
LEA<br />
Rate<br />
LEA<br />
Rate<br />
— —<br />
— —<br />
— —<br />
— —<br />
— —<br />
Target<br />
Met by<br />
LEA(Y/N)<br />
B) Acquisition and Use of<br />
Knowledge and Skills<br />
(Including early language/<br />
communication and early literacy)<br />
B) Acquisition and Use of<br />
Knowledge and Skills **<br />
State<br />
Rate<br />
1.75%<br />
6.59%<br />
34.23%<br />
43.51%<br />
13.92%<br />
State<br />
Target<br />
LEA<br />
Rate<br />
Target<br />
Met by<br />
LEA(Y/N)<br />
C) Use of Appropriate Behaviors<br />
to Meet Their Needs<br />
State<br />
Rate<br />
State<br />
Target<br />
LEA<br />
Rate<br />
Target<br />
Met by<br />
LEA(Y/N)<br />
89.61% 90.50% — — N/A 90.31% 90.50% — — N/A 90.82% 92.50% — — N/A<br />
66.58% 69.50% — — N/A 57.43% 60.50% — — N/A 76.69% 78.50% — — N/A<br />
NOTE: * Including social relationships ** Including early language/ communication and early literacy<br />
Note: - - denotes not applicable<br />
State<br />
Rate<br />
LEA<br />
Rate<br />
— —<br />
— —<br />
— —<br />
— —<br />
— —<br />
C) Use of<br />
Appropriate<br />
Behaviors to<br />
Meet Their Needs<br />
State<br />
Rate<br />
4.51%<br />
17.34%<br />
41.72%<br />
34.97%<br />
LEA<br />
Rate<br />
1.46% — —<br />
— —<br />
— —<br />
— —<br />
— —<br />
Page 3 of 5
LEA: 7205 - LINCOLN SCHOOL <strong>DISTRICT</strong><br />
Indicator 08: Parent Involvement<br />
Percent of surveyed<br />
parents who reported<br />
school facilitated parent<br />
involvement as a means<br />
of improving services<br />
and results for children<br />
with disabilities.<br />
Early Childhood<br />
(3-5)<br />
School Age<br />
(5-21)<br />
State<br />
Rate<br />
90.47%<br />
95.05%<br />
Indicator 09: Disproportionality - Eligibility<br />
Disproportionate representation of racial<br />
and ethnic groups in special education and<br />
related services that is a result of<br />
inappropriate identification (e.g.<br />
monitoring data, review of policies,<br />
practices, and procedures under 618(d),<br />
etc.).<br />
State<br />
Rate<br />
State<br />
Target<br />
88.00%<br />
96.00%<br />
State<br />
Target<br />
0.00% 0.00%<br />
LEA<br />
Rate<br />
— —<br />
94.67%<br />
Indicator 10: Disproportionality-Child with a Disability<br />
Disproportionate representation of racial<br />
and ethnic groups in specific disability<br />
categories that is a result of inappropriate<br />
identification (e.g. monitoring data, review<br />
of policies, practices, and procedures under<br />
618(d), etc.).<br />
Indicator 11: Child Find<br />
Percent of children with<br />
parental consent to evaluate<br />
who are evaluated within<br />
the State established timeline<br />
of 60 days.<br />
Overall<br />
(3-21)<br />
Early Childhood<br />
(3-5)<br />
School Age<br />
(5-21)<br />
State<br />
Rate<br />
0.00%<br />
Indicator 12: Early Childhood Transition<br />
Percent of children referred by Part C prior to<br />
age 3, who are found eligible for Part B, and<br />
who have an IEP developed and implemented<br />
by their third birthday.<br />
Note: - - denotes not applicable<br />
State<br />
Rate<br />
99.41%<br />
99.70%<br />
98.97%<br />
State<br />
Rate<br />
State<br />
Target<br />
0.00%<br />
State<br />
Target<br />
100.00%<br />
100.00%<br />
100.00%<br />
State<br />
Target<br />
Target Met by<br />
LEA (Y/N)<br />
Y<br />
Target Met by<br />
LEA (Y/N)<br />
Y<br />
LEA<br />
Rate<br />
100.00%<br />
— —<br />
100.00%<br />
LEA<br />
Rate<br />
Target Met by<br />
LEA (Y/N)<br />
N/A<br />
N<br />
Note: The target for Indicator 09 is to have zero percent<br />
(0%) of districts identified as having disproportionate<br />
representation as a result of inappropriate<br />
identification in eligibility.<br />
Note: The target for Indicator 10 is to have zero<br />
percent (0%) of districts identified as having<br />
disproportionate representation as a result of<br />
inappropriate identification in a disability<br />
category.<br />
Target Met by<br />
LEA (Y/N)<br />
N/A<br />
Y<br />
Target Met<br />
by LEA<br />
(Y/N)<br />
99.21% 100.00% - - N/A<br />
Y<br />
Note: * Indicates a zero reponse rate for the<br />
district.<br />
Page 4 of 5
LEA: 7205 - LINCOLN SCHOOL <strong>DISTRICT</strong><br />
Indicator 13: Secondary Transition<br />
Percent of youth with disabilities aged 16 and<br />
up with an IEP that includes coordinated,<br />
measurable, annual IEP goals and transition<br />
services that will reasonably enable the student<br />
to meet the post-secondary goals.<br />
Indicator 14: Post-School Outcomes<br />
A. Percent of youth enrolled in higher<br />
education within one year of leaving high<br />
school.<br />
State<br />
Rate<br />
State<br />
Target<br />
Note: Data for this Indicator is from the on-site monitoring of LEAs for the given year.<br />
B. Percent of youth enrolled in higher<br />
education or competitively employed<br />
within one year of leaving high school.<br />
C. Percent of youth enrolled in higher<br />
education or in some other postsecondary<br />
education or training program; or<br />
competitively employed or in some other<br />
employment within one year of leaving<br />
high school.<br />
State<br />
Rate<br />
Indicator 20: Reported Data-Timely and Accurate*<br />
District submitted<br />
required data elements<br />
on or before due dates;<br />
made revisions within<br />
the alloted reveiw<br />
periods.<br />
Accurate and Timely<br />
Data Submission<br />
Overall (3-21)<br />
Early Childhood (3-5)<br />
School Age (5-21)<br />
State<br />
Target<br />
100.00%<br />
100.00%<br />
100.00%<br />
State<br />
Target<br />
LEA<br />
Rate<br />
LEA<br />
Rate<br />
Target Met by<br />
LEA (Y/N)<br />
Target Met<br />
by LEA<br />
(Y/N)<br />
Target Met<br />
by LEA<br />
(Y/N)<br />
*Data reviewed for timely and accurate submissions included all APSCN cycle data except for personnel<br />
Note: - - denotes not applicable<br />
96.19 100.00 100.00% Y<br />
14.53<br />
State<br />
Rate<br />
49.42<br />
State<br />
Rate<br />
54.07<br />
13.00<br />
State<br />
Target<br />
49.00<br />
State<br />
Target<br />
60.00<br />
Y<br />
N/A<br />
Y<br />
— —<br />
LEA<br />
Rate<br />
— —<br />
LEA<br />
Rate<br />
— —<br />
N/A<br />
Target Met<br />
by LEA<br />
(Y/N)<br />
N/A<br />
Target Met<br />
by LEA<br />
(Y/N)<br />
N/A<br />
Page 5 of 5
<strong>ARKANSAS</strong> <strong>SPECIAL</strong> <strong>EDUCATION</strong><br />
<strong>DISTRICT</strong> <strong>ANNUAL</strong> PERFORMANCE REPORT<br />
2010/11 School Year<br />
Publication Date: March 2012<br />
Each State must have in place a State Performance Plan (SPP) to evaluate the State's efforts to meet the requirements and<br />
purposes of the implementation of the Individuals with Disabilities Education Act (IDEA). The SPP is a six-year plan, which<br />
describes Arkansas's performance on 20 indicators. The Office of Special Education Programs in the U. S. Department of<br />
Education requires that States report annually to the public on the performance of each local education agency (LEA) on 14 of<br />
20 indicators as compared with targets established by the State in the SPP. Arkansas will report indicators 1 through 14 and<br />
20 for each LEA serving children with disabilities (CWD). Any LEA not meeting targets on compliance indicators (0% for<br />
Indicators 4B, 09 & 10 and 100% for Indicators 11, 12, 13, and 20) are non-compliant with IDEA.<br />
There are no report changes for the 2010/11 school year profile; However, it is important to recognize that: .<br />
1. Indicator 01 (Graduation) is reported a year in arrear (2009/10 graduates) and is based on a four-year cohort. This<br />
means the rate is a measure of students who entered in ninth grade and graduate in four years. The calculation is a<br />
requirement under Title I of the Elementary and Secondary Education Act (ESEA).<br />
2. Indicator 02 (Drop out) is reported a year in arrear. This means the rate is a measure of students who dropped out in<br />
the 2009/10 school year. The Indicator 02 data are aligned with the Common Core of Data (CCD) requirements for<br />
grades 7-12.<br />
3. Indicator 04A and 4B (Suspension/Expulsion) is reported a year in arrear. This means the rate is a measure of<br />
students who had out-of-school suspensions and/or expulsions totaling more than 10 days.<br />
For a complete description of all the Indicators, please visit the special education website at<br />
http://arksped.k12.ar.us/sections/policy.html<br />
LEA: 7206 - PRAIRIE GROVE SCHOOL <strong>DISTRICT</strong><br />
Indicator 01: Graduation Rates (2009/10 school year) Indicator 02: Dropout Rates (2009/10 school year)<br />
Percent of youth<br />
with IEPs<br />
graduating from<br />
high school with a<br />
regular diploma<br />
State<br />
Rate<br />
State<br />
Target<br />
75.76% 85.00%<br />
LEA<br />
Rate<br />
76.92%<br />
Target Met<br />
by LEA<br />
(Y/N)<br />
N<br />
Percent of<br />
youth with<br />
IEPs dropping<br />
out of high<br />
school<br />
State<br />
Rate<br />
Indicator 03: Assessment on Statewide Benchmark Exam (grades 3-8, 11)<br />
A) Adequate Yearly Progress<br />
n=40<br />
Literacy<br />
Mathematics<br />
Met Disability Subgroup "n"<br />
for Reporting Purposes (Y/N)<br />
State Target for % of Districts Meeting<br />
AYP for Disability Subgroup<br />
State<br />
Target<br />
3.06% 4.20%<br />
LEA<br />
Rate<br />
3.41%<br />
% of Districts Meeting AYP<br />
for Disability Subgroup<br />
Target Met by<br />
LEA (Y/N)<br />
Y<br />
Target Met by<br />
LEA(Y/N)<br />
Overall N 17.15% 6.25%<br />
NA<br />
N<br />
N<br />
Note: For a district to qualify as having a disability subgroup it must have a minimum of 40 (n=40) students with disabilities in a school building.<br />
B) Participation<br />
Participation Rate: # of<br />
CWD Tested ÷ # of CWD<br />
Enrolled in grades tested.<br />
Participation Rate: Literacy<br />
Participation Rate: Math<br />
Note: - - denotes not applicable<br />
State<br />
Rate<br />
98.78%<br />
State<br />
Target<br />
95.00%<br />
LEA<br />
Rate<br />
100.00%<br />
Target Met<br />
by LEA (Y/N)<br />
98.61% 95.00% 100.00% Y<br />
Y<br />
C) Performance Proficiency<br />
Percent of CWD Scoring<br />
Proficient or Above<br />
Proficiency Rate: Literacy<br />
Proficiency Rate:<br />
Mathematics<br />
16.00%<br />
16.00%<br />
State<br />
Rate<br />
31.49%<br />
44.86%<br />
State<br />
Target<br />
45.22%<br />
51.14%<br />
LEA<br />
Rate<br />
33.33%<br />
57.26%<br />
NA<br />
NA<br />
Target<br />
Met by<br />
LEA (Y/N)<br />
N<br />
Y<br />
Page 1 of 5
LEA: 7206 - PRAIRIE GROVE SCHOOL <strong>DISTRICT</strong><br />
Indicator 04: Out-of-School Suspensions and Expulsions (2009/10 school year)<br />
A) Suspension/Expulsion<br />
Percent difference of CWD with out-of- school suspensions and<br />
expulsions totaling greater than 10 days in a school year as<br />
compared to the same data for general education students in<br />
the district.<br />
B) Suspension/Expulsion by Race and Ethnicity<br />
Percent of districts that have: (a) a significant discrepancy, by race or<br />
ethnicity, in the rate of suspensions and expulsions of greater than 10<br />
days in a school year for children with IEPs; and (b) policies,<br />
procedures or practices that contribute to the significant discrepancy<br />
and do not comply with requirements relating to the development<br />
and implementation of IEPs, the use of positive behavioral<br />
interventions and supports, and procedural safeguards.<br />
Indicator 05: School Age (5-21) Least Restrictive Environment<br />
A) In the Regular Class 80% or more of the day<br />
Percent of CWD with<br />
IEPs receiving instruction<br />
in the regular class 80%<br />
or more of the day.<br />
State<br />
Rate<br />
State<br />
Target<br />
LEA<br />
Rate<br />
B) In the Regular Class less than 40% of the day<br />
Percent of CWD with<br />
IEPs receiving instruction<br />
in the regular class less<br />
than 60% of the day.<br />
53.87% 59.77%<br />
State<br />
Rate<br />
State<br />
Target<br />
12.42% 12.51%<br />
54.98%<br />
LEA<br />
Rate<br />
2.84%<br />
C) Other Settings outside the regular class<br />
Percent of CWD with IEPs served in<br />
public or private separate schools,<br />
residential placements, or<br />
homebound/hospital placements.<br />
State<br />
Rate<br />
State<br />
Target<br />
2.80% 2.56%<br />
Target Met<br />
by LEA (Y/N)<br />
N<br />
Target Met<br />
by LEA (Y/N)<br />
Y<br />
LEA<br />
Rate<br />
3.32%<br />
Target Met<br />
by LEA(Y/N)<br />
Indicator 06: Early Childhood (3-5) Least Restrictive Environment<br />
A) Regular Early Childhood Program<br />
Percent of children (aged 3 through 5) with IEPs attending a regular<br />
early childhood program and receiving the majority of special<br />
education and related services in the regular early childhood program<br />
Allowable<br />
Difference<br />
LEA: 7206 - PRAIRIE GROVE SCHOOL <strong>DISTRICT</strong><br />
Indicator 07: Preschool (3-5) Outcomes<br />
a) Percent of preschool CWD<br />
children who did not<br />
improve functioning.<br />
b) Percent of preschool CWD<br />
who improved but whose<br />
functioning remained below<br />
same age peers.<br />
c) Percent of preschool CWD<br />
who improved at a level<br />
nearer to same aged peers.<br />
d) Percent of preschool CWD<br />
who improved functioning to<br />
reach a level comparable to<br />
same age peers.<br />
e) Percent of preschool CWD<br />
children who maintain<br />
functioning at a level<br />
comparable to same aged<br />
peers.<br />
Summary<br />
Statements<br />
1) Of those preschool<br />
children who entered<br />
the preschool program<br />
below age expectations<br />
in each Outcome, the<br />
percent who<br />
substantially increased<br />
their rate of growth by<br />
the time they turned 6<br />
years of age or exited<br />
the program.<br />
2) The percent of<br />
preschool children who<br />
were functioning<br />
within age expectations<br />
in each Outcome by the<br />
time they turned 6<br />
years of age or exited<br />
A) Positive Social -Emotional<br />
Skills*<br />
State<br />
Rate<br />
A) Positive Social -<br />
Emotional Skills<br />
(Including social<br />
relationships)<br />
State<br />
Rate<br />
2.14%<br />
5.31%<br />
25.97%<br />
38.22%<br />
28.36%<br />
State<br />
Target<br />
LEA<br />
Rate<br />
LEA<br />
Rate<br />
— —<br />
— —<br />
— —<br />
— —<br />
— —<br />
Target<br />
Met by<br />
LEA(Y/N)<br />
B) Acquisition and Use of<br />
Knowledge and Skills<br />
(Including early language/<br />
communication and early literacy)<br />
B) Acquisition and Use of<br />
Knowledge and Skills **<br />
State<br />
Rate<br />
1.75%<br />
6.59%<br />
34.23%<br />
43.51%<br />
13.92%<br />
State<br />
Target<br />
LEA<br />
Rate<br />
Target<br />
Met by<br />
LEA(Y/N)<br />
C) Use of Appropriate Behaviors<br />
to Meet Their Needs<br />
State<br />
Rate<br />
State<br />
Target<br />
LEA<br />
Rate<br />
Target<br />
Met by<br />
LEA(Y/N)<br />
89.61% 90.50% — — N/A 90.31% 90.50% — — N/A 90.82% 92.50% — — N/A<br />
66.58% 69.50% — — N/A 57.43% 60.50% — — N/A 76.69% 78.50% — — N/A<br />
NOTE: * Including social relationships ** Including early language/ communication and early literacy<br />
Note: - - denotes not applicable<br />
State<br />
Rate<br />
LEA<br />
Rate<br />
— —<br />
— —<br />
— —<br />
— —<br />
— —<br />
C) Use of<br />
Appropriate<br />
Behaviors to<br />
Meet Their Needs<br />
State<br />
Rate<br />
4.51%<br />
17.34%<br />
41.72%<br />
34.97%<br />
LEA<br />
Rate<br />
1.46% — —<br />
— —<br />
— —<br />
— —<br />
— —<br />
Page 3 of 5
LEA: 7206 - PRAIRIE GROVE SCHOOL <strong>DISTRICT</strong><br />
Indicator 08: Parent Involvement<br />
Percent of surveyed<br />
parents who reported<br />
school facilitated parent<br />
involvement as a means<br />
of improving services<br />
and results for children<br />
with disabilities.<br />
Early Childhood<br />
(3-5)<br />
School Age<br />
(5-21)<br />
State<br />
Rate<br />
90.47%<br />
95.05%<br />
Indicator 09: Disproportionality - Eligibility<br />
Disproportionate representation of racial<br />
and ethnic groups in special education and<br />
related services that is a result of<br />
inappropriate identification (e.g.<br />
monitoring data, review of policies,<br />
practices, and procedures under 618(d),<br />
etc.).<br />
State<br />
Rate<br />
State<br />
Target<br />
88.00%<br />
96.00%<br />
State<br />
Target<br />
0.00% 0.00%<br />
LEA<br />
Rate<br />
— —<br />
94.20%<br />
Indicator 10: Disproportionality-Child with a Disability<br />
Disproportionate representation of racial<br />
and ethnic groups in specific disability<br />
categories that is a result of inappropriate<br />
identification (e.g. monitoring data, review<br />
of policies, practices, and procedures under<br />
618(d), etc.).<br />
Indicator 11: Child Find<br />
Percent of children with<br />
parental consent to evaluate<br />
who are evaluated within<br />
the State established timeline<br />
of 60 days.<br />
Overall<br />
(3-21)<br />
Early Childhood<br />
(3-5)<br />
School Age<br />
(5-21)<br />
State<br />
Rate<br />
0.00%<br />
Indicator 12: Early Childhood Transition<br />
Percent of children referred by Part C prior to<br />
age 3, who are found eligible for Part B, and<br />
who have an IEP developed and implemented<br />
by their third birthday.<br />
Note: - - denotes not applicable<br />
State<br />
Rate<br />
99.41%<br />
99.70%<br />
98.97%<br />
State<br />
Rate<br />
State<br />
Target<br />
0.00%<br />
State<br />
Target<br />
100.00%<br />
100.00%<br />
100.00%<br />
State<br />
Target<br />
Target Met by<br />
LEA (Y/N)<br />
Y<br />
Target Met by<br />
LEA (Y/N)<br />
Y<br />
LEA<br />
Rate<br />
100.00%<br />
— —<br />
100.00%<br />
LEA<br />
Rate<br />
Target Met by<br />
LEA (Y/N)<br />
N/A<br />
N<br />
Note: The target for Indicator 09 is to have zero percent<br />
(0%) of districts identified as having disproportionate<br />
representation as a result of inappropriate<br />
identification in eligibility.<br />
Note: The target for Indicator 10 is to have zero<br />
percent (0%) of districts identified as having<br />
disproportionate representation as a result of<br />
inappropriate identification in a disability<br />
category.<br />
Target Met by<br />
LEA (Y/N)<br />
N/A<br />
Y<br />
Target Met<br />
by LEA<br />
(Y/N)<br />
99.21% 100.00% - - N/A<br />
Y<br />
Note: * Indicates a zero reponse rate for the<br />
district.<br />
Page 4 of 5
LEA: 7206 - PRAIRIE GROVE SCHOOL <strong>DISTRICT</strong><br />
Indicator 13: Secondary Transition<br />
Percent of youth with disabilities aged 16 and<br />
up with an IEP that includes coordinated,<br />
measurable, annual IEP goals and transition<br />
services that will reasonably enable the student<br />
to meet the post-secondary goals.<br />
Indicator 14: Post-School Outcomes<br />
A. Percent of youth enrolled in higher<br />
education within one year of leaving high<br />
school.<br />
State<br />
Rate<br />
State<br />
Target<br />
Note: Data for this Indicator is from the on-site monitoring of LEAs for the given year.<br />
B. Percent of youth enrolled in higher<br />
education or competitively employed<br />
within one year of leaving high school.<br />
C. Percent of youth enrolled in higher<br />
education or in some other postsecondary<br />
education or training program; or<br />
competitively employed or in some other<br />
employment within one year of leaving<br />
high school.<br />
State<br />
Rate<br />
Indicator 20: Reported Data-Timely and Accurate*<br />
District submitted<br />
required data elements<br />
on or before due dates;<br />
made revisions within<br />
the alloted reveiw<br />
periods.<br />
Accurate and Timely<br />
Data Submission<br />
Overall (3-21)<br />
Early Childhood (3-5)<br />
School Age (5-21)<br />
State<br />
Target<br />
100.00%<br />
100.00%<br />
100.00%<br />
State<br />
Target<br />
LEA<br />
Rate<br />
LEA<br />
Rate<br />
Target Met by<br />
LEA (Y/N)<br />
Target Met<br />
by LEA<br />
(Y/N)<br />
Target Met<br />
by LEA<br />
(Y/N)<br />
*Data reviewed for timely and accurate submissions included all APSCN cycle data except for personnel<br />
Note: - - denotes not applicable<br />
96.19 100.00 — — N/A<br />
14.53<br />
State<br />
Rate<br />
49.42<br />
State<br />
Rate<br />
54.07<br />
13.00<br />
State<br />
Target<br />
49.00<br />
State<br />
Target<br />
60.00<br />
Y<br />
N/A<br />
Y<br />
— —<br />
LEA<br />
Rate<br />
— —<br />
LEA<br />
Rate<br />
— —<br />
N/A<br />
Target Met<br />
by LEA<br />
(Y/N)<br />
N/A<br />
Target Met<br />
by LEA<br />
(Y/N)<br />
N/A<br />
Page 5 of 5
<strong>ARKANSAS</strong> <strong>SPECIAL</strong> <strong>EDUCATION</strong><br />
<strong>DISTRICT</strong> <strong>ANNUAL</strong> PERFORMANCE REPORT<br />
2010/11 School Year<br />
Publication Date: March 2012<br />
Each State must have in place a State Performance Plan (SPP) to evaluate the State's efforts to meet the requirements and<br />
purposes of the implementation of the Individuals with Disabilities Education Act (IDEA). The SPP is a six-year plan, which<br />
describes Arkansas's performance on 20 indicators. The Office of Special Education Programs in the U. S. Department of<br />
Education requires that States report annually to the public on the performance of each local education agency (LEA) on 14 of<br />
20 indicators as compared with targets established by the State in the SPP. Arkansas will report indicators 1 through 14 and<br />
20 for each LEA serving children with disabilities (CWD). Any LEA not meeting targets on compliance indicators (0% for<br />
Indicators 4B, 09 & 10 and 100% for Indicators 11, 12, 13, and 20) are non-compliant with IDEA.<br />
There are no report changes for the 2010/11 school year profile; However, it is important to recognize that: .<br />
1. Indicator 01 (Graduation) is reported a year in arrear (2009/10 graduates) and is based on a four-year cohort. This<br />
means the rate is a measure of students who entered in ninth grade and graduate in four years. The calculation is a<br />
requirement under Title I of the Elementary and Secondary Education Act (ESEA).<br />
2. Indicator 02 (Drop out) is reported a year in arrear. This means the rate is a measure of students who dropped out in<br />
the 2009/10 school year. The Indicator 02 data are aligned with the Common Core of Data (CCD) requirements for<br />
grades 7-12.<br />
3. Indicator 04A and 4B (Suspension/Expulsion) is reported a year in arrear. This means the rate is a measure of<br />
students who had out-of-school suspensions and/or expulsions totaling more than 10 days.<br />
For a complete description of all the Indicators, please visit the special education website at<br />
http://arksped.k12.ar.us/sections/policy.html<br />
LEA: 7207 - SPRINGDALE SCHOOL <strong>DISTRICT</strong><br />
Indicator 01: Graduation Rates (2009/10 school year) Indicator 02: Dropout Rates (2009/10 school year)<br />
Percent of youth<br />
with IEPs<br />
graduating from<br />
high school with a<br />
regular diploma<br />
State<br />
Rate<br />
State<br />
Target<br />
75.76% 85.00%<br />
LEA<br />
Rate<br />
67.62%<br />
Target Met<br />
by LEA<br />
(Y/N)<br />
N<br />
Percent of<br />
youth with<br />
IEPs dropping<br />
out of high<br />
school<br />
State<br />
Rate<br />
Indicator 03: Assessment on Statewide Benchmark Exam (grades 3-8, 11)<br />
A) Adequate Yearly Progress<br />
n=40<br />
Literacy<br />
Mathematics<br />
Met Disability Subgroup "n"<br />
for Reporting Purposes (Y/N)<br />
State Target for % of Districts Meeting<br />
AYP for Disability Subgroup<br />
State<br />
Target<br />
3.06% 4.20%<br />
LEA<br />
Rate<br />
1.87%<br />
% of Districts Meeting AYP<br />
for Disability Subgroup<br />
Target Met by<br />
LEA (Y/N)<br />
Y<br />
Target Met by<br />
LEA(Y/N)<br />
Overall Y 17.15% 6.25%<br />
N<br />
Y<br />
Y<br />
Note: For a district to qualify as having a disability subgroup it must have a minimum of 40 (n=40) students with disabilities in a school building.<br />
B) Participation<br />
Participation Rate: # of<br />
CWD Tested ÷ # of CWD<br />
Enrolled in grades tested.<br />
Participation Rate: Literacy<br />
Participation Rate: Math<br />
Note: - - denotes not applicable<br />
State<br />
Rate<br />
98.78%<br />
State<br />
Target<br />
95.00%<br />
LEA<br />
Rate<br />
98.38%<br />
Target Met<br />
by LEA (Y/N)<br />
98.61% 95.00% 98.21% Y<br />
Y<br />
C) Performance Proficiency<br />
Percent of CWD Scoring<br />
Proficient or Above<br />
Proficiency Rate: Literacy<br />
Proficiency Rate:<br />
Mathematics<br />
16.00%<br />
16.00%<br />
State<br />
Rate<br />
31.49%<br />
44.86%<br />
State<br />
Target<br />
45.22%<br />
51.14%<br />
LEA<br />
Rate<br />
35.64%<br />
50.67%<br />
N<br />
N<br />
Target<br />
Met by<br />
LEA (Y/N)<br />
N<br />
N<br />
Page 1 of 5
LEA: 7207 - SPRINGDALE SCHOOL <strong>DISTRICT</strong><br />
Indicator 04: Out-of-School Suspensions and Expulsions (2009/10 school year)<br />
A) Suspension/Expulsion<br />
Percent difference of CWD with out-of- school suspensions and<br />
expulsions totaling greater than 10 days in a school year as<br />
compared to the same data for general education students in<br />
the district.<br />
B) Suspension/Expulsion by Race and Ethnicity<br />
Percent of districts that have: (a) a significant discrepancy, by race or<br />
ethnicity, in the rate of suspensions and expulsions of greater than 10<br />
days in a school year for children with IEPs; and (b) policies,<br />
procedures or practices that contribute to the significant discrepancy<br />
and do not comply with requirements relating to the development<br />
and implementation of IEPs, the use of positive behavioral<br />
interventions and supports, and procedural safeguards.<br />
Indicator 05: School Age (5-21) Least Restrictive Environment<br />
A) In the Regular Class 80% or more of the day<br />
Percent of CWD with<br />
IEPs receiving instruction<br />
in the regular class 80%<br />
or more of the day.<br />
State<br />
Rate<br />
State<br />
Target<br />
LEA<br />
Rate<br />
B) In the Regular Class less than 40% of the day<br />
Percent of CWD with<br />
IEPs receiving instruction<br />
in the regular class less<br />
than 60% of the day.<br />
53.87% 59.77%<br />
State<br />
Rate<br />
State<br />
Target<br />
12.42% 12.51%<br />
59.84%<br />
LEA<br />
Rate<br />
12.25%<br />
C) Other Settings outside the regular class<br />
Percent of CWD with IEPs served in<br />
public or private separate schools,<br />
residential placements, or<br />
homebound/hospital placements.<br />
State<br />
Rate<br />
State<br />
Target<br />
2.80% 2.56%<br />
Target Met<br />
by LEA (Y/N)<br />
Y<br />
Target Met<br />
by LEA (Y/N)<br />
Y<br />
LEA<br />
Rate<br />
5.31%<br />
Target Met<br />
by LEA(Y/N)<br />
Indicator 06: Early Childhood (3-5) Least Restrictive Environment<br />
A) Regular Early Childhood Program<br />
Percent of children (aged 3 through 5) with IEPs attending a regular<br />
early childhood program and receiving the majority of special<br />
education and related services in the regular early childhood program<br />
Allowable<br />
Difference<br />
LEA: 7207 - SPRINGDALE SCHOOL <strong>DISTRICT</strong><br />
Indicator 07: Preschool (3-5) Outcomes<br />
a) Percent of preschool CWD<br />
children who did not<br />
improve functioning.<br />
b) Percent of preschool CWD<br />
who improved but whose<br />
functioning remained below<br />
same age peers.<br />
c) Percent of preschool CWD<br />
who improved at a level<br />
nearer to same aged peers.<br />
d) Percent of preschool CWD<br />
who improved functioning to<br />
reach a level comparable to<br />
same age peers.<br />
e) Percent of preschool CWD<br />
children who maintain<br />
functioning at a level<br />
comparable to same aged<br />
peers.<br />
Summary<br />
Statements<br />
1) Of those preschool<br />
children who entered<br />
the preschool program<br />
below age expectations<br />
in each Outcome, the<br />
percent who<br />
substantially increased<br />
their rate of growth by<br />
the time they turned 6<br />
years of age or exited<br />
the program.<br />
2) The percent of<br />
preschool children who<br />
were functioning<br />
within age expectations<br />
in each Outcome by the<br />
time they turned 6<br />
years of age or exited<br />
A) Positive Social -Emotional<br />
Skills*<br />
State<br />
Rate<br />
A) Positive Social -<br />
Emotional Skills<br />
(Including social<br />
relationships)<br />
State<br />
Rate<br />
2.14%<br />
5.31%<br />
25.97%<br />
38.22%<br />
28.36%<br />
State<br />
Target<br />
LEA<br />
Rate<br />
LEA<br />
Rate<br />
— —<br />
— —<br />
— —<br />
— —<br />
— —<br />
Target<br />
Met by<br />
LEA(Y/N)<br />
B) Acquisition and Use of<br />
Knowledge and Skills<br />
(Including early language/<br />
communication and early literacy)<br />
B) Acquisition and Use of<br />
Knowledge and Skills **<br />
State<br />
Rate<br />
1.75%<br />
6.59%<br />
34.23%<br />
43.51%<br />
13.92%<br />
State<br />
Target<br />
LEA<br />
Rate<br />
Target<br />
Met by<br />
LEA(Y/N)<br />
C) Use of Appropriate Behaviors<br />
to Meet Their Needs<br />
State<br />
Rate<br />
State<br />
Target<br />
LEA<br />
Rate<br />
Target<br />
Met by<br />
LEA(Y/N)<br />
89.61% 90.50% — — N/A 90.31% 90.50% — — N/A 90.82% 92.50% — — N/A<br />
66.58% 69.50% — — N/A 57.43% 60.50% — — N/A 76.69% 78.50% — — N/A<br />
NOTE: * Including social relationships ** Including early language/ communication and early literacy<br />
Note: - - denotes not applicable<br />
State<br />
Rate<br />
LEA<br />
Rate<br />
— —<br />
— —<br />
— —<br />
— —<br />
— —<br />
C) Use of<br />
Appropriate<br />
Behaviors to<br />
Meet Their Needs<br />
State<br />
Rate<br />
4.51%<br />
17.34%<br />
41.72%<br />
34.97%<br />
LEA<br />
Rate<br />
1.46% — —<br />
— —<br />
— —<br />
— —<br />
— —<br />
Page 3 of 5
LEA: 7207 - SPRINGDALE SCHOOL <strong>DISTRICT</strong><br />
Indicator 08: Parent Involvement<br />
Percent of surveyed<br />
parents who reported<br />
school facilitated parent<br />
involvement as a means<br />
of improving services<br />
and results for children<br />
with disabilities.<br />
Early Childhood<br />
(3-5)<br />
School Age<br />
(5-21)<br />
State<br />
Rate<br />
90.47%<br />
95.05%<br />
Indicator 09: Disproportionality - Eligibility<br />
Disproportionate representation of racial<br />
and ethnic groups in special education and<br />
related services that is a result of<br />
inappropriate identification (e.g.<br />
monitoring data, review of policies,<br />
practices, and procedures under 618(d),<br />
etc.).<br />
State<br />
Rate<br />
State<br />
Target<br />
88.00%<br />
96.00%<br />
State<br />
Target<br />
0.00% 0.00%<br />
LEA<br />
Rate<br />
— —<br />
93.00%<br />
Indicator 10: Disproportionality-Child with a Disability<br />
Disproportionate representation of racial<br />
and ethnic groups in specific disability<br />
categories that is a result of inappropriate<br />
identification (e.g. monitoring data, review<br />
of policies, practices, and procedures under<br />
618(d), etc.).<br />
Indicator 11: Child Find<br />
Percent of children with<br />
parental consent to evaluate<br />
who are evaluated within<br />
the State established timeline<br />
of 60 days.<br />
Overall<br />
(3-21)<br />
Early Childhood<br />
(3-5)<br />
School Age<br />
(5-21)<br />
State<br />
Rate<br />
0.00%<br />
Indicator 12: Early Childhood Transition<br />
Percent of children referred by Part C prior to<br />
age 3, who are found eligible for Part B, and<br />
who have an IEP developed and implemented<br />
by their third birthday.<br />
Note: - - denotes not applicable<br />
State<br />
Rate<br />
99.41%<br />
99.70%<br />
98.97%<br />
State<br />
Rate<br />
State<br />
Target<br />
0.00%<br />
State<br />
Target<br />
100.00%<br />
100.00%<br />
100.00%<br />
State<br />
Target<br />
Target Met by<br />
LEA (Y/N)<br />
Y<br />
Target Met by<br />
LEA (Y/N)<br />
Y<br />
LEA<br />
Rate<br />
99.63%<br />
— —<br />
99.63%<br />
LEA<br />
Rate<br />
Target Met by<br />
LEA (Y/N)<br />
N/A<br />
N<br />
Note: The target for Indicator 09 is to have zero percent<br />
(0%) of districts identified as having disproportionate<br />
representation as a result of inappropriate<br />
identification in eligibility.<br />
Note: The target for Indicator 10 is to have zero<br />
percent (0%) of districts identified as having<br />
disproportionate representation as a result of<br />
inappropriate identification in a disability<br />
category.<br />
Target Met by<br />
LEA (Y/N)<br />
N/A<br />
N<br />
Target Met<br />
by LEA<br />
(Y/N)<br />
99.21% 100.00% - - N/A<br />
N<br />
Note: * Indicates a zero reponse rate for the<br />
district.<br />
Page 4 of 5
LEA: 7207 - SPRINGDALE SCHOOL <strong>DISTRICT</strong><br />
Indicator 13: Secondary Transition<br />
Percent of youth with disabilities aged 16 and<br />
up with an IEP that includes coordinated,<br />
measurable, annual IEP goals and transition<br />
services that will reasonably enable the student<br />
to meet the post-secondary goals.<br />
Indicator 14: Post-School Outcomes<br />
A. Percent of youth enrolled in higher<br />
education within one year of leaving high<br />
school.<br />
State<br />
Rate<br />
State<br />
Target<br />
Note: Data for this Indicator is from the on-site monitoring of LEAs for the given year.<br />
B. Percent of youth enrolled in higher<br />
education or competitively employed<br />
within one year of leaving high school.<br />
C. Percent of youth enrolled in higher<br />
education or in some other postsecondary<br />
education or training program; or<br />
competitively employed or in some other<br />
employment within one year of leaving<br />
high school.<br />
State<br />
Rate<br />
Indicator 20: Reported Data-Timely and Accurate*<br />
District submitted<br />
required data elements<br />
on or before due dates;<br />
made revisions within<br />
the alloted reveiw<br />
periods.<br />
Accurate and Timely<br />
Data Submission<br />
Overall (3-21)<br />
Early Childhood (3-5)<br />
School Age (5-21)<br />
State<br />
Target<br />
100.00%<br />
100.00%<br />
100.00%<br />
State<br />
Target<br />
LEA<br />
Rate<br />
LEA<br />
Rate<br />
Target Met by<br />
LEA (Y/N)<br />
Target Met<br />
by LEA<br />
(Y/N)<br />
Target Met<br />
by LEA<br />
(Y/N)<br />
*Data reviewed for timely and accurate submissions included all APSCN cycle data except for personnel<br />
Note: - - denotes not applicable<br />
96.19 100.00 — — N/A<br />
14.53<br />
State<br />
Rate<br />
49.42<br />
State<br />
Rate<br />
54.07<br />
13.00<br />
State<br />
Target<br />
49.00<br />
State<br />
Target<br />
60.00<br />
Y<br />
N/A<br />
Y<br />
— —<br />
LEA<br />
Rate<br />
— —<br />
LEA<br />
Rate<br />
— —<br />
N/A<br />
Target Met<br />
by LEA<br />
(Y/N)<br />
N/A<br />
Target Met<br />
by LEA<br />
(Y/N)<br />
N/A<br />
Page 5 of 5
LEA: 7208 - WEST FORK SCHOOL <strong>DISTRICT</strong><br />
<strong>ARKANSAS</strong> <strong>SPECIAL</strong> <strong>EDUCATION</strong><br />
<strong>DISTRICT</strong> <strong>ANNUAL</strong> PERFORMANCE REPORT<br />
2010/11 School Year<br />
Publication Date: March 2012<br />
Each State must have in place a State Performance Plan (SPP) to evaluate the State's efforts to meet the requirements and<br />
purposes of the implementation of the Individuals with Disabilities Education Act (IDEA). The SPP is a six-year plan, which<br />
describes Arkansas's performance on 20 indicators. The Office of Special Education Programs in the U. S. Department of<br />
Education requires that States report annually to the public on the performance of each local education agency (LEA) on 14 of<br />
20 indicators as compared with targets established by the State in the SPP. Arkansas will report indicators 1 through 14 and<br />
20 for each LEA serving children with disabilities (CWD). Any LEA not meeting targets on compliance indicators (0% for<br />
Indicators 4B, 09 & 10 and 100% for Indicators 11, 12, 13, and 20) are non-compliant with IDEA.<br />
There are no report changes for the 2010/11 school year profile; However, it is important to recognize that: .<br />
1. Indicator 01 (Graduation) is reported a year in arrear (2009/10 graduates) and is based on a four-year cohort. This<br />
means the rate is a measure of students who entered in ninth grade and graduate in four years. The calculation is a<br />
requirement under Title I of the Elementary and Secondary Education Act (ESEA).<br />
2. Indicator 02 (Drop out) is reported a year in arrear. This means the rate is a measure of students who dropped out in<br />
the 2009/10 school year. The Indicator 02 data are aligned with the Common Core of Data (CCD) requirements for<br />
grades 7-12.<br />
3. Indicator 04A and 4B (Suspension/Expulsion) is reported a year in arrear. This means the rate is a measure of<br />
students who had out-of-school suspensions and/or expulsions totaling more than 10 days.<br />
Percent of youth<br />
with IEPs<br />
graduating from<br />
high school with a<br />
regular diploma<br />
For a complete description of all the Indicators, please visit the special education website at<br />
http://arksped.k12.ar.us/sections/policy.html<br />
Indicator 01: Graduation Rates (2009/10 school year) Indicator 02: Dropout Rates (2009/10 school year)<br />
State<br />
Rate<br />
State<br />
Target<br />
75.76% 85.00%<br />
LEA<br />
Rate<br />
100.00%<br />
Target Met<br />
by LEA<br />
(Y/N)<br />
Y<br />
Percent of<br />
youth with<br />
IEPs dropping<br />
out of high<br />
school<br />
State<br />
Rate<br />
Indicator 03: Assessment on Statewide Benchmark Exam (grades 3-8, 11)<br />
A) Adequate Yearly Progress<br />
n=40<br />
Literacy<br />
Mathematics<br />
Met Disability Subgroup "n"<br />
for Reporting Purposes (Y/N)<br />
State Target for % of Districts Meeting<br />
AYP for Disability Subgroup<br />
State<br />
Target<br />
3.06% 4.20%<br />
LEA<br />
Rate<br />
3.85%<br />
% of Districts Meeting AYP<br />
for Disability Subgroup<br />
Target Met by<br />
LEA (Y/N)<br />
Y<br />
Target Met by<br />
LEA(Y/N)<br />
Overall N 17.15% 6.25%<br />
NA<br />
N<br />
N<br />
Note: For a district to qualify as having a disability subgroup it must have a minimum of 40 (n=40) students with disabilities in a school building.<br />
B) Participation<br />
Participation Rate: # of<br />
CWD Tested ÷ # of CWD<br />
Enrolled in grades tested.<br />
Participation Rate: Literacy<br />
Participation Rate: Math<br />
Note: - - denotes not applicable<br />
State<br />
Rate<br />
98.78%<br />
State<br />
Target<br />
95.00%<br />
LEA<br />
Rate<br />
98.67%<br />
Target Met<br />
by LEA (Y/N)<br />
98.61% 95.00% 98.81% Y<br />
Y<br />
C) Performance Proficiency<br />
Percent of CWD Scoring<br />
Proficient or Above<br />
Proficiency Rate: Literacy<br />
Proficiency Rate:<br />
Mathematics<br />
16.00%<br />
16.00%<br />
State<br />
Rate<br />
31.49%<br />
44.86%<br />
State<br />
Target<br />
45.22%<br />
51.14%<br />
LEA<br />
Rate<br />
25.35%<br />
43.04%<br />
NA<br />
NA<br />
Target<br />
Met by<br />
LEA (Y/N)<br />
N<br />
N<br />
Page 1 of 5
LEA: 7208 - WEST FORK SCHOOL <strong>DISTRICT</strong><br />
Indicator 04: Out-of-School Suspensions and Expulsions (2009/10 school year)<br />
A) Suspension/Expulsion<br />
Percent difference of CWD with out-of- school suspensions and<br />
expulsions totaling greater than 10 days in a school year as<br />
compared to the same data for general education students in<br />
the district.<br />
B) Suspension/Expulsion by Race and Ethnicity<br />
Percent of districts that have: (a) a significant discrepancy, by race or<br />
ethnicity, in the rate of suspensions and expulsions of greater than 10<br />
days in a school year for children with IEPs; and (b) policies,<br />
procedures or practices that contribute to the significant discrepancy<br />
and do not comply with requirements relating to the development<br />
and implementation of IEPs, the use of positive behavioral<br />
interventions and supports, and procedural safeguards.<br />
Indicator 05: School Age (5-21) Least Restrictive Environment<br />
A) In the Regular Class 80% or more of the day<br />
Percent of CWD with<br />
IEPs receiving instruction<br />
in the regular class 80%<br />
or more of the day.<br />
State<br />
Rate<br />
State<br />
Target<br />
LEA<br />
Rate<br />
B) In the Regular Class less than 40% of the day<br />
Percent of CWD with<br />
IEPs receiving instruction<br />
in the regular class less<br />
than 60% of the day.<br />
53.87% 59.77%<br />
State<br />
Rate<br />
State<br />
Target<br />
12.42% 12.51%<br />
68.50%<br />
LEA<br />
Rate<br />
7.09%<br />
C) Other Settings outside the regular class<br />
Percent of CWD with IEPs served in<br />
public or private separate schools,<br />
residential placements, or<br />
homebound/hospital placements.<br />
State<br />
Rate<br />
State<br />
Target<br />
2.80% 2.56%<br />
Target Met<br />
by LEA (Y/N)<br />
Y<br />
Target Met<br />
by LEA (Y/N)<br />
Y<br />
LEA<br />
Rate<br />
2.36%<br />
Target Met<br />
by LEA(Y/N)<br />
Indicator 06: Early Childhood (3-5) Least Restrictive Environment<br />
A) Regular Early Childhood Program<br />
Percent of children (aged 3 through 5) with IEPs attending a regular<br />
early childhood program and receiving the majority of special<br />
education and related services in the regular early childhood program<br />
Allowable<br />
Difference<br />
LEA: 7208 - WEST FORK SCHOOL <strong>DISTRICT</strong><br />
Indicator 07: Preschool (3-5) Outcomes<br />
a) Percent of preschool CWD<br />
children who did not<br />
improve functioning.<br />
b) Percent of preschool CWD<br />
who improved but whose<br />
functioning remained below<br />
same age peers.<br />
c) Percent of preschool CWD<br />
who improved at a level<br />
nearer to same aged peers.<br />
d) Percent of preschool CWD<br />
who improved functioning to<br />
reach a level comparable to<br />
same age peers.<br />
e) Percent of preschool CWD<br />
children who maintain<br />
functioning at a level<br />
comparable to same aged<br />
peers.<br />
Summary<br />
Statements<br />
1) Of those preschool<br />
children who entered<br />
the preschool program<br />
below age expectations<br />
in each Outcome, the<br />
percent who<br />
substantially increased<br />
their rate of growth by<br />
the time they turned 6<br />
years of age or exited<br />
the program.<br />
2) The percent of<br />
preschool children who<br />
were functioning<br />
within age expectations<br />
in each Outcome by the<br />
time they turned 6<br />
years of age or exited<br />
A) Positive Social -Emotional<br />
Skills*<br />
State<br />
Rate<br />
A) Positive Social -<br />
Emotional Skills<br />
(Including social<br />
relationships)<br />
State<br />
Rate<br />
2.14%<br />
5.31%<br />
25.97%<br />
38.22%<br />
28.36%<br />
State<br />
Target<br />
LEA<br />
Rate<br />
LEA<br />
Rate<br />
— —<br />
— —<br />
— —<br />
— —<br />
— —<br />
Target<br />
Met by<br />
LEA(Y/N)<br />
B) Acquisition and Use of<br />
Knowledge and Skills<br />
(Including early language/<br />
communication and early literacy)<br />
B) Acquisition and Use of<br />
Knowledge and Skills **<br />
State<br />
Rate<br />
1.75%<br />
6.59%<br />
34.23%<br />
43.51%<br />
13.92%<br />
State<br />
Target<br />
LEA<br />
Rate<br />
Target<br />
Met by<br />
LEA(Y/N)<br />
C) Use of Appropriate Behaviors<br />
to Meet Their Needs<br />
State<br />
Rate<br />
State<br />
Target<br />
LEA<br />
Rate<br />
Target<br />
Met by<br />
LEA(Y/N)<br />
89.61% 90.50% — — N/A 90.31% 90.50% — — N/A 90.82% 92.50% — — N/A<br />
66.58% 69.50% — — N/A 57.43% 60.50% — — N/A 76.69% 78.50% — — N/A<br />
NOTE: * Including social relationships ** Including early language/ communication and early literacy<br />
Note: - - denotes not applicable<br />
State<br />
Rate<br />
LEA<br />
Rate<br />
— —<br />
— —<br />
— —<br />
— —<br />
— —<br />
C) Use of<br />
Appropriate<br />
Behaviors to<br />
Meet Their Needs<br />
State<br />
Rate<br />
4.51%<br />
17.34%<br />
41.72%<br />
34.97%<br />
LEA<br />
Rate<br />
1.46% — —<br />
— —<br />
— —<br />
— —<br />
— —<br />
Page 3 of 5
LEA: 7208 - WEST FORK SCHOOL <strong>DISTRICT</strong><br />
Indicator 08: Parent Involvement<br />
Percent of surveyed<br />
parents who reported<br />
school facilitated parent<br />
involvement as a means<br />
of improving services<br />
and results for children<br />
with disabilities.<br />
Early Childhood<br />
(3-5)<br />
School Age<br />
(5-21)<br />
State<br />
Rate<br />
90.47%<br />
95.05%<br />
Indicator 09: Disproportionality - Eligibility<br />
Disproportionate representation of racial<br />
and ethnic groups in special education and<br />
related services that is a result of<br />
inappropriate identification (e.g.<br />
monitoring data, review of policies,<br />
practices, and procedures under 618(d),<br />
etc.).<br />
State<br />
Rate<br />
State<br />
Target<br />
88.00%<br />
96.00%<br />
State<br />
Target<br />
0.00% 0.00%<br />
LEA<br />
Rate<br />
— —<br />
92.86%<br />
Indicator 10: Disproportionality-Child with a Disability<br />
Disproportionate representation of racial<br />
and ethnic groups in specific disability<br />
categories that is a result of inappropriate<br />
identification (e.g. monitoring data, review<br />
of policies, practices, and procedures under<br />
618(d), etc.).<br />
Indicator 11: Child Find<br />
Percent of children with<br />
parental consent to evaluate<br />
who are evaluated within<br />
the State established timeline<br />
of 60 days.<br />
Overall<br />
(3-21)<br />
Early Childhood<br />
(3-5)<br />
School Age<br />
(5-21)<br />
State<br />
Rate<br />
0.00%<br />
Indicator 12: Early Childhood Transition<br />
Percent of children referred by Part C prior to<br />
age 3, who are found eligible for Part B, and<br />
who have an IEP developed and implemented<br />
by their third birthday.<br />
Note: - - denotes not applicable<br />
State<br />
Rate<br />
99.41%<br />
99.70%<br />
98.97%<br />
State<br />
Rate<br />
State<br />
Target<br />
0.00%<br />
State<br />
Target<br />
100.00%<br />
100.00%<br />
100.00%<br />
State<br />
Target<br />
Target Met by<br />
LEA (Y/N)<br />
Y<br />
Target Met by<br />
LEA (Y/N)<br />
Y<br />
LEA<br />
Rate<br />
100.00%<br />
— —<br />
100.00%<br />
LEA<br />
Rate<br />
Target Met by<br />
LEA (Y/N)<br />
N/A<br />
N<br />
Note: The target for Indicator 09 is to have zero percent<br />
(0%) of districts identified as having disproportionate<br />
representation as a result of inappropriate<br />
identification in eligibility.<br />
Note: The target for Indicator 10 is to have zero<br />
percent (0%) of districts identified as having<br />
disproportionate representation as a result of<br />
inappropriate identification in a disability<br />
category.<br />
Target Met by<br />
LEA (Y/N)<br />
N/A<br />
Y<br />
Target Met<br />
by LEA<br />
(Y/N)<br />
99.21% 100.00% - - N/A<br />
Y<br />
Note: * Indicates a zero reponse rate for the<br />
district.<br />
Page 4 of 5
LEA: 7208 - WEST FORK SCHOOL <strong>DISTRICT</strong><br />
Indicator 13: Secondary Transition<br />
Percent of youth with disabilities aged 16 and<br />
up with an IEP that includes coordinated,<br />
measurable, annual IEP goals and transition<br />
services that will reasonably enable the student<br />
to meet the post-secondary goals.<br />
Indicator 14: Post-School Outcomes<br />
A. Percent of youth enrolled in higher<br />
education within one year of leaving high<br />
school.<br />
State<br />
Rate<br />
State<br />
Target<br />
Note: Data for this Indicator is from the on-site monitoring of LEAs for the given year.<br />
B. Percent of youth enrolled in higher<br />
education or competitively employed<br />
within one year of leaving high school.<br />
C. Percent of youth enrolled in higher<br />
education or in some other postsecondary<br />
education or training program; or<br />
competitively employed or in some other<br />
employment within one year of leaving<br />
high school.<br />
State<br />
Rate<br />
Indicator 20: Reported Data-Timely and Accurate*<br />
District submitted<br />
required data elements<br />
on or before due dates;<br />
made revisions within<br />
the alloted reveiw<br />
periods.<br />
Accurate and Timely<br />
Data Submission<br />
Overall (3-21)<br />
Early Childhood (3-5)<br />
School Age (5-21)<br />
State<br />
Target<br />
100.00%<br />
100.00%<br />
100.00%<br />
State<br />
Target<br />
LEA<br />
Rate<br />
LEA<br />
Rate<br />
Target Met by<br />
LEA (Y/N)<br />
Target Met<br />
by LEA<br />
(Y/N)<br />
Target Met<br />
by LEA<br />
(Y/N)<br />
*Data reviewed for timely and accurate submissions included all APSCN cycle data except for personnel<br />
Note: - - denotes not applicable<br />
96.19 100.00 100.00% Y<br />
14.53<br />
State<br />
Rate<br />
49.42<br />
State<br />
Rate<br />
54.07<br />
13.00<br />
State<br />
Target<br />
49.00<br />
State<br />
Target<br />
60.00<br />
Y<br />
N/A<br />
Y<br />
— —<br />
LEA<br />
Rate<br />
— —<br />
LEA<br />
Rate<br />
— —<br />
N/A<br />
Target Met<br />
by LEA<br />
(Y/N)<br />
N/A<br />
Target Met<br />
by LEA<br />
(Y/N)<br />
N/A<br />
Page 5 of 5
<strong>ARKANSAS</strong> <strong>SPECIAL</strong> <strong>EDUCATION</strong><br />
<strong>DISTRICT</strong> <strong>ANNUAL</strong> PERFORMANCE REPORT<br />
2010/11 School Year<br />
Publication Date: March 2012<br />
Each State must have in place a State Performance Plan (SPP) to evaluate the State's efforts to meet the requirements and<br />
purposes of the implementation of the Individuals with Disabilities Education Act (IDEA). The SPP is a six-year plan, which<br />
describes Arkansas's performance on 20 indicators. The Office of Special Education Programs in the U. S. Department of<br />
Education requires that States report annually to the public on the performance of each local education agency (LEA) on 14 of<br />
20 indicators as compared with targets established by the State in the SPP. Arkansas will report indicators 1 through 14 and<br />
20 for each LEA serving children with disabilities (CWD). Any LEA not meeting targets on compliance indicators (0% for<br />
Indicators 4B, 09 & 10 and 100% for Indicators 11, 12, 13, and 20) are non-compliant with IDEA.<br />
There are no report changes for the 2010/11 school year profile; However, it is important to recognize that: .<br />
1. Indicator 01 (Graduation) is reported a year in arrear (2009/10 graduates) and is based on a four-year cohort. This<br />
means the rate is a measure of students who entered in ninth grade and graduate in four years. The calculation is a<br />
requirement under Title I of the Elementary and Secondary Education Act (ESEA).<br />
2. Indicator 02 (Drop out) is reported a year in arrear. This means the rate is a measure of students who dropped out in<br />
the 2009/10 school year. The Indicator 02 data are aligned with the Common Core of Data (CCD) requirements for<br />
grades 7-12.<br />
3. Indicator 04A and 4B (Suspension/Expulsion) is reported a year in arrear. This means the rate is a measure of<br />
students who had out-of-school suspensions and/or expulsions totaling more than 10 days.<br />
For a complete description of all the Indicators, please visit the special education website at<br />
http://arksped.k12.ar.us/sections/policy.html<br />
LEA: 7221 - NORTHWEST <strong>ARKANSAS</strong> <strong>EDUCATION</strong> SERVICE CENTER<br />
Indicator 01: Graduation Rates (2009/10 school year) Indicator 02: Dropout Rates (2009/10 school year)<br />
Percent of youth<br />
with IEPs<br />
graduating from<br />
high school with a<br />
regular diploma<br />
State<br />
Rate<br />
State<br />
Target<br />
75.76% 85.00%<br />
LEA<br />
Rate<br />
— —<br />
Target Met<br />
by LEA<br />
(Y/N)<br />
NA<br />
Percent of<br />
youth with<br />
IEPs dropping<br />
out of high<br />
school<br />
State<br />
Rate<br />
Indicator 03: Assessment on Statewide Benchmark Exam (grades 3-8, 11)<br />
A) Adequate Yearly Progress<br />
n=40<br />
Literacy<br />
Mathematics<br />
Met Disability Subgroup "n"<br />
for Reporting Purposes (Y/N)<br />
State Target for % of Districts Meeting<br />
AYP for Disability Subgroup<br />
State<br />
Target<br />
3.06% 4.20%<br />
LEA<br />
Rate<br />
— —<br />
% of Districts Meeting AYP<br />
for Disability Subgroup<br />
Target Met by<br />
LEA (Y/N)<br />
N/A<br />
Target Met by<br />
LEA(Y/N)<br />
Overall N/A 17.15% 6.25%<br />
N/A<br />
N/A<br />
N/A<br />
Note: For a district to qualify as having a disability subgroup it must have a minimum of 40 (n=40) students with disabilities in a school building.<br />
B) Participation<br />
Participation Rate: # of<br />
CWD Tested ÷ # of CWD<br />
Enrolled in grades tested.<br />
Participation Rate: Literacy<br />
Participation Rate: Math<br />
Note: - - denotes not applicable<br />
State<br />
Rate<br />
98.78%<br />
State<br />
Target<br />
95.00%<br />
LEA<br />
Rate<br />
— —<br />
Target Met<br />
by LEA (Y/N)<br />
N/A<br />
98.61% 95.00% — — N/A<br />
C) Performance Proficiency<br />
Percent of CWD Scoring<br />
Proficient or Above<br />
Proficiency Rate: Literacy<br />
Proficiency Rate:<br />
Mathematics<br />
16.00%<br />
16.00%<br />
State<br />
Rate<br />
31.49%<br />
44.86%<br />
State<br />
Target<br />
45.22%<br />
51.14%<br />
LEA<br />
Rate<br />
— —<br />
— —<br />
N/A<br />
N/A<br />
Target<br />
Met by<br />
LEA (Y/N)<br />
N/A<br />
N/A<br />
Page 1 of 5
LEA: 7221 - NORTHWEST <strong>ARKANSAS</strong> <strong>EDUCATION</strong> SERVICE CENTER<br />
Indicator 04: Out-of-School Suspensions and Expulsions (2009/10 school year)<br />
A) Suspension/Expulsion<br />
Percent difference of CWD with out-of- school suspensions and<br />
expulsions totaling greater than 10 days in a school year as<br />
compared to the same data for general education students in<br />
the district.<br />
B) Suspension/Expulsion by Race and Ethnicity<br />
Percent of districts that have: (a) a significant discrepancy, by race or<br />
ethnicity, in the rate of suspensions and expulsions of greater than 10<br />
days in a school year for children with IEPs; and (b) policies,<br />
procedures or practices that contribute to the significant discrepancy<br />
and do not comply with requirements relating to the development<br />
and implementation of IEPs, the use of positive behavioral<br />
interventions and supports, and procedural safeguards.<br />
Indicator 05: School Age (5-21) Least Restrictive Environment<br />
A) In the Regular Class 80% or more of the day<br />
Percent of CWD with<br />
IEPs receiving instruction<br />
in the regular class 80%<br />
or more of the day.<br />
State<br />
Rate<br />
State<br />
Target<br />
LEA<br />
Rate<br />
B) In the Regular Class less than 40% of the day<br />
Percent of CWD with<br />
IEPs receiving instruction<br />
in the regular class less<br />
than 60% of the day.<br />
53.87% 59.77%<br />
State<br />
Rate<br />
State<br />
Target<br />
12.42% 12.51%<br />
— —<br />
LEA<br />
Rate<br />
— —<br />
C) Other Settings outside the regular class<br />
Percent of CWD with IEPs served in<br />
public or private separate schools,<br />
residential placements, or<br />
homebound/hospital placements.<br />
State<br />
Rate<br />
State<br />
Target<br />
2.80% 2.56%<br />
Target Met<br />
by LEA (Y/N)<br />
N/A<br />
Target Met<br />
by LEA (Y/N)<br />
N/A<br />
LEA<br />
Rate<br />
— —<br />
Target Met<br />
by LEA(Y/N)<br />
N/A<br />
Indicator 06: Early Childhood (3-5) Least Restrictive Environment<br />
A) Regular Early Childhood Program<br />
Percent of children (aged 3 through 5) with IEPs attending a regular<br />
early childhood program and receiving the majority of special<br />
education and related services in the regular early childhood program<br />
Allowable<br />
Difference<br />
LEA: 7221 - NORTHWEST <strong>ARKANSAS</strong> <strong>EDUCATION</strong> SERVICE CENTER<br />
Indicator 07: Preschool (3-5) Outcomes<br />
a) Percent of preschool CWD<br />
children who did not<br />
improve functioning.<br />
b) Percent of preschool CWD<br />
who improved but whose<br />
functioning remained below<br />
same age peers.<br />
c) Percent of preschool CWD<br />
who improved at a level<br />
nearer to same aged peers.<br />
d) Percent of preschool CWD<br />
who improved functioning to<br />
reach a level comparable to<br />
same age peers.<br />
e) Percent of preschool CWD<br />
children who maintain<br />
functioning at a level<br />
comparable to same aged<br />
peers.<br />
Summary<br />
Statements<br />
1) Of those preschool<br />
children who entered<br />
the preschool program<br />
below age expectations<br />
in each Outcome, the<br />
percent who<br />
substantially increased<br />
their rate of growth by<br />
the time they turned 6<br />
years of age or exited<br />
the program.<br />
2) The percent of<br />
preschool children who<br />
were functioning<br />
within age expectations<br />
in each Outcome by the<br />
time they turned 6<br />
years of age or exited<br />
A) Positive Social -Emotional<br />
Skills*<br />
State<br />
Rate<br />
A) Positive Social -<br />
Emotional Skills<br />
(Including social<br />
relationships)<br />
State<br />
Rate<br />
2.14%<br />
5.31%<br />
25.97%<br />
38.22%<br />
28.36%<br />
State<br />
Target<br />
LEA<br />
Rate<br />
LEA<br />
Rate<br />
— —<br />
7.73%<br />
25.45%<br />
18.18%<br />
48.64%<br />
Target<br />
Met by<br />
LEA(Y/N)<br />
B) Acquisition and Use of<br />
Knowledge and Skills<br />
(Including early language/<br />
communication and early literacy)<br />
B) Acquisition and Use of<br />
Knowledge and Skills **<br />
State<br />
Rate<br />
1.75%<br />
6.59%<br />
34.23%<br />
43.51%<br />
13.92%<br />
State<br />
Target<br />
LEA<br />
Rate<br />
Target<br />
Met by<br />
LEA(Y/N)<br />
C) Use of Appropriate Behaviors<br />
to Meet Their Needs<br />
State<br />
Rate<br />
State<br />
Target<br />
LEA<br />
Rate<br />
Target<br />
Met by<br />
LEA(Y/N)<br />
89.61% 90.50% 84.96% N 90.31% 90.50% 90.20% N 90.82% 92.50% 88.73% N<br />
66.58% 69.50% 66.82% N 57.43% 60.50% 49.09% N 76.69% 78.50% 84.55% Y<br />
NOTE: * Including social relationships ** Including early language/ communication and early literacy<br />
Note: - - denotes not applicable<br />
State<br />
Rate<br />
LEA<br />
Rate<br />
— —<br />
9.09%<br />
41.82%<br />
41.82%<br />
7.27%<br />
C) Use of<br />
Appropriate<br />
Behaviors to<br />
Meet Their Needs<br />
State<br />
Rate<br />
4.51%<br />
17.34%<br />
41.72%<br />
34.97%<br />
LEA<br />
Rate<br />
1.46% — —<br />
3.64%<br />
11.82%<br />
16.82%<br />
67.73%<br />
Page 3 of 5
LEA: 7221 - NORTHWEST <strong>ARKANSAS</strong> <strong>EDUCATION</strong> SERVICE CENTER<br />
Indicator 08: Parent Involvement<br />
Percent of surveyed<br />
parents who reported<br />
school facilitated parent<br />
involvement as a means<br />
of improving services<br />
and results for children<br />
with disabilities.<br />
Early Childhood<br />
(3-5)<br />
School Age<br />
(5-21)<br />
State<br />
Rate<br />
90.47%<br />
95.05%<br />
Indicator 09: Disproportionality - Eligibility<br />
Disproportionate representation of racial<br />
and ethnic groups in special education and<br />
related services that is a result of<br />
inappropriate identification (e.g.<br />
monitoring data, review of policies,<br />
practices, and procedures under 618(d),<br />
etc.).<br />
State<br />
Rate<br />
State<br />
Target<br />
88.00%<br />
96.00%<br />
State<br />
Target<br />
0.00% 0.00%<br />
LEA<br />
Rate<br />
82.61%<br />
— —<br />
Indicator 10: Disproportionality-Child with a Disability<br />
Disproportionate representation of racial<br />
and ethnic groups in specific disability<br />
categories that is a result of inappropriate<br />
identification (e.g. monitoring data, review<br />
of policies, practices, and procedures under<br />
618(d), etc.).<br />
Indicator 11: Child Find<br />
Percent of children with<br />
parental consent to evaluate<br />
who are evaluated within<br />
the State established timeline<br />
of 60 days.<br />
Overall<br />
(3-21)<br />
Early Childhood<br />
(3-5)<br />
School Age<br />
(5-21)<br />
State<br />
Rate<br />
0.00%<br />
Indicator 12: Early Childhood Transition<br />
Percent of children referred by Part C prior to<br />
age 3, who are found eligible for Part B, and<br />
who have an IEP developed and implemented<br />
by their third birthday.<br />
Note: - - denotes not applicable<br />
State<br />
Rate<br />
99.41%<br />
99.70%<br />
98.97%<br />
State<br />
Rate<br />
State<br />
Target<br />
0.00%<br />
State<br />
Target<br />
100.00%<br />
100.00%<br />
100.00%<br />
State<br />
Target<br />
Target Met by<br />
LEA (Y/N)<br />
N/A<br />
Target Met by<br />
LEA (Y/N)<br />
N/A<br />
LEA<br />
Rate<br />
100.00%<br />
100.00%<br />
— —<br />
LEA<br />
Rate<br />
Target Met by<br />
LEA (Y/N)<br />
N<br />
N/A<br />
Note: The target for Indicator 09 is to have zero percent<br />
(0%) of districts identified as having disproportionate<br />
representation as a result of inappropriate<br />
identification in eligibility.<br />
Note: The target for Indicator 10 is to have zero<br />
percent (0%) of districts identified as having<br />
disproportionate representation as a result of<br />
inappropriate identification in a disability<br />
category.<br />
Target Met by<br />
LEA (Y/N)<br />
Y<br />
N/A<br />
Target Met<br />
by LEA<br />
(Y/N)<br />
99.21% 100.00% 100.00% Y<br />
Y<br />
Note: * Indicates a zero reponse rate for the<br />
district.<br />
Page 4 of 5
LEA: 7221 - NORTHWEST <strong>ARKANSAS</strong> <strong>EDUCATION</strong> SERVICE CENTER<br />
Indicator 13: Secondary Transition<br />
Percent of youth with disabilities aged 16 and<br />
up with an IEP that includes coordinated,<br />
measurable, annual IEP goals and transition<br />
services that will reasonably enable the student<br />
to meet the post-secondary goals.<br />
Indicator 14: Post-School Outcomes<br />
A. Percent of youth enrolled in higher<br />
education within one year of leaving high<br />
school.<br />
State<br />
Rate<br />
State<br />
Target<br />
Note: Data for this Indicator is from the on-site monitoring of LEAs for the given year.<br />
B. Percent of youth enrolled in higher<br />
education or competitively employed<br />
within one year of leaving high school.<br />
C. Percent of youth enrolled in higher<br />
education or in some other postsecondary<br />
education or training program; or<br />
competitively employed or in some other<br />
employment within one year of leaving<br />
high school.<br />
State<br />
Rate<br />
Indicator 20: Reported Data-Timely and Accurate*<br />
District submitted<br />
required data elements<br />
on or before due dates;<br />
made revisions within<br />
the alloted reveiw<br />
periods.<br />
Accurate and Timely<br />
Data Submission<br />
Overall (3-21)<br />
Early Childhood (3-5)<br />
School Age (5-21)<br />
State<br />
Target<br />
100.00%<br />
100.00%<br />
100.00%<br />
State<br />
Target<br />
LEA<br />
Rate<br />
LEA<br />
Rate<br />
Target Met by<br />
LEA (Y/N)<br />
Target Met<br />
by LEA<br />
(Y/N)<br />
Target Met<br />
by LEA<br />
(Y/N)<br />
*Data reviewed for timely and accurate submissions included all APSCN cycle data except for personnel<br />
Note: - - denotes not applicable<br />
96.19 100.00 — — N/A<br />
14.53<br />
State<br />
Rate<br />
49.42<br />
State<br />
Rate<br />
54.07<br />
13.00<br />
State<br />
Target<br />
49.00<br />
State<br />
Target<br />
60.00<br />
Y<br />
Y<br />
N/A<br />
— —<br />
LEA<br />
Rate<br />
— —<br />
LEA<br />
Rate<br />
— —<br />
N/A<br />
Target Met<br />
by LEA<br />
(Y/N)<br />
N/A<br />
Target Met<br />
by LEA<br />
(Y/N)<br />
N/A<br />
Page 5 of 5
LEA: 7301 - BALD KNOB SCHOOL <strong>DISTRICT</strong><br />
<strong>ARKANSAS</strong> <strong>SPECIAL</strong> <strong>EDUCATION</strong><br />
<strong>DISTRICT</strong> <strong>ANNUAL</strong> PERFORMANCE REPORT<br />
2010/11 School Year<br />
Publication Date: March 2012<br />
Each State must have in place a State Performance Plan (SPP) to evaluate the State's efforts to meet the requirements and<br />
purposes of the implementation of the Individuals with Disabilities Education Act (IDEA). The SPP is a six-year plan, which<br />
describes Arkansas's performance on 20 indicators. The Office of Special Education Programs in the U. S. Department of<br />
Education requires that States report annually to the public on the performance of each local education agency (LEA) on 14 of<br />
20 indicators as compared with targets established by the State in the SPP. Arkansas will report indicators 1 through 14 and<br />
20 for each LEA serving children with disabilities (CWD). Any LEA not meeting targets on compliance indicators (0% for<br />
Indicators 4B, 09 & 10 and 100% for Indicators 11, 12, 13, and 20) are non-compliant with IDEA.<br />
There are no report changes for the 2010/11 school year profile; However, it is important to recognize that: .<br />
1. Indicator 01 (Graduation) is reported a year in arrear (2009/10 graduates) and is based on a four-year cohort. This<br />
means the rate is a measure of students who entered in ninth grade and graduate in four years. The calculation is a<br />
requirement under Title I of the Elementary and Secondary Education Act (ESEA).<br />
2. Indicator 02 (Drop out) is reported a year in arrear. This means the rate is a measure of students who dropped out in<br />
the 2009/10 school year. The Indicator 02 data are aligned with the Common Core of Data (CCD) requirements for<br />
grades 7-12.<br />
3. Indicator 04A and 4B (Suspension/Expulsion) is reported a year in arrear. This means the rate is a measure of<br />
students who had out-of-school suspensions and/or expulsions totaling more than 10 days.<br />
Percent of youth<br />
with IEPs<br />
graduating from<br />
high school with a<br />
regular diploma<br />
For a complete description of all the Indicators, please visit the special education website at<br />
http://arksped.k12.ar.us/sections/policy.html<br />
Indicator 01: Graduation Rates (2009/10 school year) Indicator 02: Dropout Rates (2009/10 school year)<br />
State<br />
Rate<br />
State<br />
Target<br />
75.76% 85.00%<br />
LEA<br />
Rate<br />
75.00%<br />
Target Met<br />
by LEA<br />
(Y/N)<br />
N<br />
Percent of<br />
youth with<br />
IEPs dropping<br />
out of high<br />
school<br />
State<br />
Rate<br />
Indicator 03: Assessment on Statewide Benchmark Exam (grades 3-8, 11)<br />
A) Adequate Yearly Progress<br />
n=40<br />
Literacy<br />
Mathematics<br />
Met Disability Subgroup "n"<br />
for Reporting Purposes (Y/N)<br />
State Target for % of Districts Meeting<br />
AYP for Disability Subgroup<br />
State<br />
Target<br />
3.06% 4.20%<br />
LEA<br />
Rate<br />
3.61%<br />
% of Districts Meeting AYP<br />
for Disability Subgroup<br />
Target Met by<br />
LEA (Y/N)<br />
Y<br />
Target Met by<br />
LEA(Y/N)<br />
Overall N 17.15% 6.25%<br />
NA<br />
N<br />
N<br />
Note: For a district to qualify as having a disability subgroup it must have a minimum of 40 (n=40) students with disabilities in a school building.<br />
B) Participation<br />
Participation Rate: # of<br />
CWD Tested ÷ # of CWD<br />
Enrolled in grades tested.<br />
Participation Rate: Literacy<br />
Participation Rate: Math<br />
Note: - - denotes not applicable<br />
State<br />
Rate<br />
98.78%<br />
State<br />
Target<br />
95.00%<br />
LEA<br />
Rate<br />
97.62%<br />
Target Met<br />
by LEA (Y/N)<br />
98.61% 95.00% 98.75% Y<br />
Y<br />
C) Performance Proficiency<br />
Percent of CWD Scoring<br />
Proficient or Above<br />
Proficiency Rate: Literacy<br />
Proficiency Rate:<br />
Mathematics<br />
16.00%<br />
16.00%<br />
State<br />
Rate<br />
31.49%<br />
44.86%<br />
State<br />
Target<br />
45.22%<br />
51.14%<br />
LEA<br />
Rate<br />
37.18%<br />
48.68%<br />
NA<br />
NA<br />
Target<br />
Met by<br />
LEA (Y/N)<br />
N<br />
N<br />
Page 1 of 5
LEA: 7301 - BALD KNOB SCHOOL <strong>DISTRICT</strong><br />
Indicator 04: Out-of-School Suspensions and Expulsions (2009/10 school year)<br />
A) Suspension/Expulsion<br />
Percent difference of CWD with out-of- school suspensions and<br />
expulsions totaling greater than 10 days in a school year as<br />
compared to the same data for general education students in<br />
the district.<br />
B) Suspension/Expulsion by Race and Ethnicity<br />
Percent of districts that have: (a) a significant discrepancy, by race or<br />
ethnicity, in the rate of suspensions and expulsions of greater than 10<br />
days in a school year for children with IEPs; and (b) policies,<br />
procedures or practices that contribute to the significant discrepancy<br />
and do not comply with requirements relating to the development<br />
and implementation of IEPs, the use of positive behavioral<br />
interventions and supports, and procedural safeguards.<br />
Indicator 05: School Age (5-21) Least Restrictive Environment<br />
A) In the Regular Class 80% or more of the day<br />
Percent of CWD with<br />
IEPs receiving instruction<br />
in the regular class 80%<br />
or more of the day.<br />
State<br />
Rate<br />
State<br />
Target<br />
LEA<br />
Rate<br />
B) In the Regular Class less than 40% of the day<br />
Percent of CWD with<br />
IEPs receiving instruction<br />
in the regular class less<br />
than 60% of the day.<br />
53.87% 59.77%<br />
State<br />
Rate<br />
State<br />
Target<br />
12.42% 12.51%<br />
59.52%<br />
LEA<br />
Rate<br />
17.26%<br />
C) Other Settings outside the regular class<br />
Percent of CWD with IEPs served in<br />
public or private separate schools,<br />
residential placements, or<br />
homebound/hospital placements.<br />
State<br />
Rate<br />
State<br />
Target<br />
2.80% 2.56%<br />
Target Met<br />
by LEA (Y/N)<br />
N<br />
Target Met<br />
by LEA (Y/N)<br />
N<br />
LEA<br />
Rate<br />
1.79%<br />
Target Met<br />
by LEA(Y/N)<br />
Indicator 06: Early Childhood (3-5) Least Restrictive Environment<br />
A) Regular Early Childhood Program<br />
Percent of children (aged 3 through 5) with IEPs attending a regular<br />
early childhood program and receiving the majority of special<br />
education and related services in the regular early childhood program<br />
Allowable<br />
Difference<br />
LEA: 7301 - BALD KNOB SCHOOL <strong>DISTRICT</strong><br />
Indicator 07: Preschool (3-5) Outcomes<br />
a) Percent of preschool CWD<br />
children who did not<br />
improve functioning.<br />
b) Percent of preschool CWD<br />
who improved but whose<br />
functioning remained below<br />
same age peers.<br />
c) Percent of preschool CWD<br />
who improved at a level<br />
nearer to same aged peers.<br />
d) Percent of preschool CWD<br />
who improved functioning to<br />
reach a level comparable to<br />
same age peers.<br />
e) Percent of preschool CWD<br />
children who maintain<br />
functioning at a level<br />
comparable to same aged<br />
peers.<br />
Summary<br />
Statements<br />
1) Of those preschool<br />
children who entered<br />
the preschool program<br />
below age expectations<br />
in each Outcome, the<br />
percent who<br />
substantially increased<br />
their rate of growth by<br />
the time they turned 6<br />
years of age or exited<br />
the program.<br />
2) The percent of<br />
preschool children who<br />
were functioning<br />
within age expectations<br />
in each Outcome by the<br />
time they turned 6<br />
years of age or exited<br />
A) Positive Social -Emotional<br />
Skills*<br />
State<br />
Rate<br />
A) Positive Social -<br />
Emotional Skills<br />
(Including social<br />
relationships)<br />
State<br />
Rate<br />
2.14%<br />
5.31%<br />
25.97%<br />
38.22%<br />
28.36%<br />
State<br />
Target<br />
LEA<br />
Rate<br />
LEA<br />
Rate<br />
— —<br />
— —<br />
— —<br />
— —<br />
— —<br />
Target<br />
Met by<br />
LEA(Y/N)<br />
B) Acquisition and Use of<br />
Knowledge and Skills<br />
(Including early language/<br />
communication and early literacy)<br />
B) Acquisition and Use of<br />
Knowledge and Skills **<br />
State<br />
Rate<br />
1.75%<br />
6.59%<br />
34.23%<br />
43.51%<br />
13.92%<br />
State<br />
Target<br />
LEA<br />
Rate<br />
Target<br />
Met by<br />
LEA(Y/N)<br />
C) Use of Appropriate Behaviors<br />
to Meet Their Needs<br />
State<br />
Rate<br />
State<br />
Target<br />
LEA<br />
Rate<br />
Target<br />
Met by<br />
LEA(Y/N)<br />
89.61% 90.50% — — N/A 90.31% 90.50% — — N/A 90.82% 92.50% — — N/A<br />
66.58% 69.50% — — N/A 57.43% 60.50% — — N/A 76.69% 78.50% — — N/A<br />
NOTE: * Including social relationships ** Including early language/ communication and early literacy<br />
Note: - - denotes not applicable<br />
State<br />
Rate<br />
LEA<br />
Rate<br />
— —<br />
— —<br />
— —<br />
— —<br />
— —<br />
C) Use of<br />
Appropriate<br />
Behaviors to<br />
Meet Their Needs<br />
State<br />
Rate<br />
4.51%<br />
17.34%<br />
41.72%<br />
34.97%<br />
LEA<br />
Rate<br />
1.46% — —<br />
— —<br />
— —<br />
— —<br />
— —<br />
Page 3 of 5
LEA: 7301 - BALD KNOB SCHOOL <strong>DISTRICT</strong><br />
Indicator 08: Parent Involvement<br />
Percent of surveyed<br />
parents who reported<br />
school facilitated parent<br />
involvement as a means<br />
of improving services<br />
and results for children<br />
with disabilities.<br />
Early Childhood<br />
(3-5)<br />
School Age<br />
(5-21)<br />
State<br />
Rate<br />
90.47%<br />
95.05%<br />
Indicator 09: Disproportionality - Eligibility<br />
Disproportionate representation of racial<br />
and ethnic groups in special education and<br />
related services that is a result of<br />
inappropriate identification (e.g.<br />
monitoring data, review of policies,<br />
practices, and procedures under 618(d),<br />
etc.).<br />
State<br />
Rate<br />
State<br />
Target<br />
88.00%<br />
96.00%<br />
State<br />
Target<br />
0.00% 0.00%<br />
LEA<br />
Rate<br />
— —<br />
92.86%<br />
Indicator 10: Disproportionality-Child with a Disability<br />
Disproportionate representation of racial<br />
and ethnic groups in specific disability<br />
categories that is a result of inappropriate<br />
identification (e.g. monitoring data, review<br />
of policies, practices, and procedures under<br />
618(d), etc.).<br />
Indicator 11: Child Find<br />
Percent of children with<br />
parental consent to evaluate<br />
who are evaluated within<br />
the State established timeline<br />
of 60 days.<br />
Overall<br />
(3-21)<br />
Early Childhood<br />
(3-5)<br />
School Age<br />
(5-21)<br />
State<br />
Rate<br />
0.00%<br />
Indicator 12: Early Childhood Transition<br />
Percent of children referred by Part C prior to<br />
age 3, who are found eligible for Part B, and<br />
who have an IEP developed and implemented<br />
by their third birthday.<br />
Note: - - denotes not applicable<br />
State<br />
Rate<br />
99.41%<br />
99.70%<br />
98.97%<br />
State<br />
Rate<br />
State<br />
Target<br />
0.00%<br />
State<br />
Target<br />
100.00%<br />
100.00%<br />
100.00%<br />
State<br />
Target<br />
Target Met by<br />
LEA (Y/N)<br />
Y<br />
Target Met by<br />
LEA (Y/N)<br />
Y<br />
LEA<br />
Rate<br />
100.00%<br />
— —<br />
100.00%<br />
LEA<br />
Rate<br />
Target Met by<br />
LEA (Y/N)<br />
N/A<br />
N<br />
Note: The target for Indicator 09 is to have zero percent<br />
(0%) of districts identified as having disproportionate<br />
representation as a result of inappropriate<br />
identification in eligibility.<br />
Note: The target for Indicator 10 is to have zero<br />
percent (0%) of districts identified as having<br />
disproportionate representation as a result of<br />
inappropriate identification in a disability<br />
category.<br />
Target Met by<br />
LEA (Y/N)<br />
N/A<br />
Y<br />
Target Met<br />
by LEA<br />
(Y/N)<br />
99.21% 100.00% - - N/A<br />
Y<br />
Note: * Indicates a zero reponse rate for the<br />
district.<br />
Page 4 of 5
LEA: 7301 - BALD KNOB SCHOOL <strong>DISTRICT</strong><br />
Indicator 13: Secondary Transition<br />
Percent of youth with disabilities aged 16 and<br />
up with an IEP that includes coordinated,<br />
measurable, annual IEP goals and transition<br />
services that will reasonably enable the student<br />
to meet the post-secondary goals.<br />
Indicator 14: Post-School Outcomes<br />
A. Percent of youth enrolled in higher<br />
education within one year of leaving high<br />
school.<br />
State<br />
Rate<br />
State<br />
Target<br />
Note: Data for this Indicator is from the on-site monitoring of LEAs for the given year.<br />
B. Percent of youth enrolled in higher<br />
education or competitively employed<br />
within one year of leaving high school.<br />
C. Percent of youth enrolled in higher<br />
education or in some other postsecondary<br />
education or training program; or<br />
competitively employed or in some other<br />
employment within one year of leaving<br />
high school.<br />
State<br />
Rate<br />
Indicator 20: Reported Data-Timely and Accurate*<br />
District submitted<br />
required data elements<br />
on or before due dates;<br />
made revisions within<br />
the alloted reveiw<br />
periods.<br />
Accurate and Timely<br />
Data Submission<br />
Overall (3-21)<br />
Early Childhood (3-5)<br />
School Age (5-21)<br />
State<br />
Target<br />
100.00%<br />
100.00%<br />
100.00%<br />
State<br />
Target<br />
LEA<br />
Rate<br />
LEA<br />
Rate<br />
Target Met by<br />
LEA (Y/N)<br />
Target Met<br />
by LEA<br />
(Y/N)<br />
Target Met<br />
by LEA<br />
(Y/N)<br />
*Data reviewed for timely and accurate submissions included all APSCN cycle data except for personnel<br />
Note: - - denotes not applicable<br />
96.19 100.00 — — N/A<br />
14.53<br />
State<br />
Rate<br />
49.42<br />
State<br />
Rate<br />
54.07<br />
13.00<br />
State<br />
Target<br />
49.00<br />
State<br />
Target<br />
60.00<br />
Y<br />
N/A<br />
Y<br />
0.00%<br />
LEA<br />
Rate<br />
100.00%<br />
LEA<br />
Rate<br />
100.00%<br />
N<br />
Target Met<br />
by LEA<br />
(Y/N)<br />
Y<br />
Target Met<br />
by LEA<br />
(Y/N)<br />
Y<br />
Page 5 of 5
LEA: 7302 - BEEBE SCHOOL <strong>DISTRICT</strong><br />
<strong>ARKANSAS</strong> <strong>SPECIAL</strong> <strong>EDUCATION</strong><br />
<strong>DISTRICT</strong> <strong>ANNUAL</strong> PERFORMANCE REPORT<br />
2010/11 School Year<br />
Publication Date: March 2012<br />
Each State must have in place a State Performance Plan (SPP) to evaluate the State's efforts to meet the requirements and<br />
purposes of the implementation of the Individuals with Disabilities Education Act (IDEA). The SPP is a six-year plan, which<br />
describes Arkansas's performance on 20 indicators. The Office of Special Education Programs in the U. S. Department of<br />
Education requires that States report annually to the public on the performance of each local education agency (LEA) on 14 of<br />
20 indicators as compared with targets established by the State in the SPP. Arkansas will report indicators 1 through 14 and<br />
20 for each LEA serving children with disabilities (CWD). Any LEA not meeting targets on compliance indicators (0% for<br />
Indicators 4B, 09 & 10 and 100% for Indicators 11, 12, 13, and 20) are non-compliant with IDEA.<br />
There are no report changes for the 2010/11 school year profile; However, it is important to recognize that: .<br />
1. Indicator 01 (Graduation) is reported a year in arrear (2009/10 graduates) and is based on a four-year cohort. This<br />
means the rate is a measure of students who entered in ninth grade and graduate in four years. The calculation is a<br />
requirement under Title I of the Elementary and Secondary Education Act (ESEA).<br />
2. Indicator 02 (Drop out) is reported a year in arrear. This means the rate is a measure of students who dropped out in<br />
the 2009/10 school year. The Indicator 02 data are aligned with the Common Core of Data (CCD) requirements for<br />
grades 7-12.<br />
3. Indicator 04A and 4B (Suspension/Expulsion) is reported a year in arrear. This means the rate is a measure of<br />
students who had out-of-school suspensions and/or expulsions totaling more than 10 days.<br />
Percent of youth<br />
with IEPs<br />
graduating from<br />
high school with a<br />
regular diploma<br />
For a complete description of all the Indicators, please visit the special education website at<br />
http://arksped.k12.ar.us/sections/policy.html<br />
Indicator 01: Graduation Rates (2009/10 school year) Indicator 02: Dropout Rates (2009/10 school year)<br />
State<br />
Rate<br />
State<br />
Target<br />
75.76% 85.00%<br />
LEA<br />
Rate<br />
59.38%<br />
Target Met<br />
by LEA<br />
(Y/N)<br />
N<br />
Percent of<br />
youth with<br />
IEPs dropping<br />
out of high<br />
school<br />
State<br />
Rate<br />
Indicator 03: Assessment on Statewide Benchmark Exam (grades 3-8, 11)<br />
A) Adequate Yearly Progress<br />
n=40<br />
Literacy<br />
Mathematics<br />
Met Disability Subgroup "n"<br />
for Reporting Purposes (Y/N)<br />
State Target for % of Districts Meeting<br />
AYP for Disability Subgroup<br />
State<br />
Target<br />
3.06% 4.20%<br />
LEA<br />
Rate<br />
2.54%<br />
% of Districts Meeting AYP<br />
for Disability Subgroup<br />
Target Met by<br />
LEA (Y/N)<br />
Y<br />
Target Met by<br />
LEA(Y/N)<br />
Overall N 17.15% 6.25%<br />
NA<br />
N<br />
N<br />
Note: For a district to qualify as having a disability subgroup it must have a minimum of 40 (n=40) students with disabilities in a school building.<br />
B) Participation<br />
Participation Rate: # of<br />
CWD Tested ÷ # of CWD<br />
Enrolled in grades tested.<br />
Participation Rate: Literacy<br />
Participation Rate: Math<br />
Note: - - denotes not applicable<br />
State<br />
Rate<br />
98.78%<br />
State<br />
Target<br />
95.00%<br />
LEA<br />
Rate<br />
100.00%<br />
Target Met<br />
by LEA (Y/N)<br />
98.61% 95.00% 98.87% Y<br />
Y<br />
C) Performance Proficiency<br />
Percent of CWD Scoring<br />
Proficient or Above<br />
Proficiency Rate: Literacy<br />
Proficiency Rate:<br />
Mathematics<br />
16.00%<br />
16.00%<br />
State<br />
Rate<br />
31.49%<br />
44.86%<br />
State<br />
Target<br />
45.22%<br />
51.14%<br />
LEA<br />
Rate<br />
44.44%<br />
49.79%<br />
NA<br />
NA<br />
Target<br />
Met by<br />
LEA (Y/N)<br />
N<br />
N<br />
Page 1 of 5
LEA: 7302 - BEEBE SCHOOL <strong>DISTRICT</strong><br />
Indicator 04: Out-of-School Suspensions and Expulsions (2009/10 school year)<br />
A) Suspension/Expulsion<br />
Percent difference of CWD with out-of- school suspensions and<br />
expulsions totaling greater than 10 days in a school year as<br />
compared to the same data for general education students in<br />
the district.<br />
B) Suspension/Expulsion by Race and Ethnicity<br />
Percent of districts that have: (a) a significant discrepancy, by race or<br />
ethnicity, in the rate of suspensions and expulsions of greater than 10<br />
days in a school year for children with IEPs; and (b) policies,<br />
procedures or practices that contribute to the significant discrepancy<br />
and do not comply with requirements relating to the development<br />
and implementation of IEPs, the use of positive behavioral<br />
interventions and supports, and procedural safeguards.<br />
Indicator 05: School Age (5-21) Least Restrictive Environment<br />
A) In the Regular Class 80% or more of the day<br />
Percent of CWD with<br />
IEPs receiving instruction<br />
in the regular class 80%<br />
or more of the day.<br />
State<br />
Rate<br />
State<br />
Target<br />
LEA<br />
Rate<br />
B) In the Regular Class less than 40% of the day<br />
Percent of CWD with<br />
IEPs receiving instruction<br />
in the regular class less<br />
than 60% of the day.<br />
53.87% 59.77%<br />
State<br />
Rate<br />
State<br />
Target<br />
12.42% 12.51%<br />
54.46%<br />
LEA<br />
Rate<br />
7.95%<br />
C) Other Settings outside the regular class<br />
Percent of CWD with IEPs served in<br />
public or private separate schools,<br />
residential placements, or<br />
homebound/hospital placements.<br />
State<br />
Rate<br />
State<br />
Target<br />
2.80% 2.56%<br />
Target Met<br />
by LEA (Y/N)<br />
N<br />
Target Met<br />
by LEA (Y/N)<br />
Y<br />
LEA<br />
Rate<br />
0.48%<br />
Target Met<br />
by LEA(Y/N)<br />
Indicator 06: Early Childhood (3-5) Least Restrictive Environment<br />
A) Regular Early Childhood Program<br />
Percent of children (aged 3 through 5) with IEPs attending a regular<br />
early childhood program and receiving the majority of special<br />
education and related services in the regular early childhood program<br />
Allowable<br />
Difference<br />
LEA: 7302 - BEEBE SCHOOL <strong>DISTRICT</strong><br />
Indicator 07: Preschool (3-5) Outcomes<br />
a) Percent of preschool CWD<br />
children who did not<br />
improve functioning.<br />
b) Percent of preschool CWD<br />
who improved but whose<br />
functioning remained below<br />
same age peers.<br />
c) Percent of preschool CWD<br />
who improved at a level<br />
nearer to same aged peers.<br />
d) Percent of preschool CWD<br />
who improved functioning to<br />
reach a level comparable to<br />
same age peers.<br />
e) Percent of preschool CWD<br />
children who maintain<br />
functioning at a level<br />
comparable to same aged<br />
peers.<br />
Summary<br />
Statements<br />
1) Of those preschool<br />
children who entered<br />
the preschool program<br />
below age expectations<br />
in each Outcome, the<br />
percent who<br />
substantially increased<br />
their rate of growth by<br />
the time they turned 6<br />
years of age or exited<br />
the program.<br />
2) The percent of<br />
preschool children who<br />
were functioning<br />
within age expectations<br />
in each Outcome by the<br />
time they turned 6<br />
years of age or exited<br />
A) Positive Social -Emotional<br />
Skills*<br />
State<br />
Rate<br />
A) Positive Social -<br />
Emotional Skills<br />
(Including social<br />
relationships)<br />
State<br />
Rate<br />
2.14%<br />
5.31%<br />
25.97%<br />
38.22%<br />
28.36%<br />
State<br />
Target<br />
LEA<br />
Rate<br />
LEA<br />
Rate<br />
— —<br />
— —<br />
— —<br />
— —<br />
— —<br />
Target<br />
Met by<br />
LEA(Y/N)<br />
B) Acquisition and Use of<br />
Knowledge and Skills<br />
(Including early language/<br />
communication and early literacy)<br />
B) Acquisition and Use of<br />
Knowledge and Skills **<br />
State<br />
Rate<br />
1.75%<br />
6.59%<br />
34.23%<br />
43.51%<br />
13.92%<br />
State<br />
Target<br />
LEA<br />
Rate<br />
Target<br />
Met by<br />
LEA(Y/N)<br />
C) Use of Appropriate Behaviors<br />
to Meet Their Needs<br />
State<br />
Rate<br />
State<br />
Target<br />
LEA<br />
Rate<br />
Target<br />
Met by<br />
LEA(Y/N)<br />
89.61% 90.50% — — N/A 90.31% 90.50% — — N/A 90.82% 92.50% — — N/A<br />
66.58% 69.50% — — N/A 57.43% 60.50% — — N/A 76.69% 78.50% — — N/A<br />
NOTE: * Including social relationships ** Including early language/ communication and early literacy<br />
Note: - - denotes not applicable<br />
State<br />
Rate<br />
LEA<br />
Rate<br />
— —<br />
— —<br />
— —<br />
— —<br />
— —<br />
C) Use of<br />
Appropriate<br />
Behaviors to<br />
Meet Their Needs<br />
State<br />
Rate<br />
4.51%<br />
17.34%<br />
41.72%<br />
34.97%<br />
LEA<br />
Rate<br />
1.46% — —<br />
— —<br />
— —<br />
— —<br />
— —<br />
Page 3 of 5
LEA: 7302 - BEEBE SCHOOL <strong>DISTRICT</strong><br />
Indicator 08: Parent Involvement<br />
Percent of surveyed<br />
parents who reported<br />
school facilitated parent<br />
involvement as a means<br />
of improving services<br />
and results for children<br />
with disabilities.<br />
Early Childhood<br />
(3-5)<br />
School Age<br />
(5-21)<br />
State<br />
Rate<br />
90.47%<br />
95.05%<br />
Indicator 09: Disproportionality - Eligibility<br />
Disproportionate representation of racial<br />
and ethnic groups in special education and<br />
related services that is a result of<br />
inappropriate identification (e.g.<br />
monitoring data, review of policies,<br />
practices, and procedures under 618(d),<br />
etc.).<br />
State<br />
Rate<br />
State<br />
Target<br />
88.00%<br />
96.00%<br />
State<br />
Target<br />
0.00% 0.00%<br />
LEA<br />
Rate<br />
— —<br />
100.00%<br />
Indicator 10: Disproportionality-Child with a Disability<br />
Disproportionate representation of racial<br />
and ethnic groups in specific disability<br />
categories that is a result of inappropriate<br />
identification (e.g. monitoring data, review<br />
of policies, practices, and procedures under<br />
618(d), etc.).<br />
Indicator 11: Child Find<br />
Percent of children with<br />
parental consent to evaluate<br />
who are evaluated within<br />
the State established timeline<br />
of 60 days.<br />
Overall<br />
(3-21)<br />
Early Childhood<br />
(3-5)<br />
School Age<br />
(5-21)<br />
State<br />
Rate<br />
0.00%<br />
Indicator 12: Early Childhood Transition<br />
Percent of children referred by Part C prior to<br />
age 3, who are found eligible for Part B, and<br />
who have an IEP developed and implemented<br />
by their third birthday.<br />
Note: - - denotes not applicable<br />
State<br />
Rate<br />
99.41%<br />
99.70%<br />
98.97%<br />
State<br />
Rate<br />
State<br />
Target<br />
0.00%<br />
State<br />
Target<br />
100.00%<br />
100.00%<br />
100.00%<br />
State<br />
Target<br />
Target Met by<br />
LEA (Y/N)<br />
Y<br />
Target Met by<br />
LEA (Y/N)<br />
Y<br />
LEA<br />
Rate<br />
100.00%<br />
— —<br />
100.00%<br />
LEA<br />
Rate<br />
Target Met by<br />
LEA (Y/N)<br />
N/A<br />
Y<br />
Note: The target for Indicator 09 is to have zero percent<br />
(0%) of districts identified as having disproportionate<br />
representation as a result of inappropriate<br />
identification in eligibility.<br />
Note: The target for Indicator 10 is to have zero<br />
percent (0%) of districts identified as having<br />
disproportionate representation as a result of<br />
inappropriate identification in a disability<br />
category.<br />
Target Met by<br />
LEA (Y/N)<br />
N/A<br />
Y<br />
Target Met<br />
by LEA<br />
(Y/N)<br />
99.21% 100.00% - - N/A<br />
Y<br />
Note: * Indicates a zero reponse rate for the<br />
district.<br />
Page 4 of 5
LEA: 7302 - BEEBE SCHOOL <strong>DISTRICT</strong><br />
Indicator 13: Secondary Transition<br />
Percent of youth with disabilities aged 16 and<br />
up with an IEP that includes coordinated,<br />
measurable, annual IEP goals and transition<br />
services that will reasonably enable the student<br />
to meet the post-secondary goals.<br />
Indicator 14: Post-School Outcomes<br />
A. Percent of youth enrolled in higher<br />
education within one year of leaving high<br />
school.<br />
State<br />
Rate<br />
State<br />
Target<br />
Note: Data for this Indicator is from the on-site monitoring of LEAs for the given year.<br />
B. Percent of youth enrolled in higher<br />
education or competitively employed<br />
within one year of leaving high school.<br />
C. Percent of youth enrolled in higher<br />
education or in some other postsecondary<br />
education or training program; or<br />
competitively employed or in some other<br />
employment within one year of leaving<br />
high school.<br />
State<br />
Rate<br />
Indicator 20: Reported Data-Timely and Accurate*<br />
District submitted<br />
required data elements<br />
on or before due dates;<br />
made revisions within<br />
the alloted reveiw<br />
periods.<br />
Accurate and Timely<br />
Data Submission<br />
Overall (3-21)<br />
Early Childhood (3-5)<br />
School Age (5-21)<br />
State<br />
Target<br />
100.00%<br />
100.00%<br />
100.00%<br />
State<br />
Target<br />
LEA<br />
Rate<br />
LEA<br />
Rate<br />
Target Met by<br />
LEA (Y/N)<br />
Target Met<br />
by LEA<br />
(Y/N)<br />
Target Met<br />
by LEA<br />
(Y/N)<br />
*Data reviewed for timely and accurate submissions included all APSCN cycle data except for personnel<br />
Note: - - denotes not applicable<br />
96.19 100.00 — — N/A<br />
14.53<br />
State<br />
Rate<br />
49.42<br />
State<br />
Rate<br />
54.07<br />
13.00<br />
State<br />
Target<br />
49.00<br />
State<br />
Target<br />
60.00<br />
Y<br />
N/A<br />
Y<br />
— —<br />
LEA<br />
Rate<br />
— —<br />
LEA<br />
Rate<br />
— —<br />
N/A<br />
Target Met<br />
by LEA<br />
(Y/N)<br />
N/A<br />
Target Met<br />
by LEA<br />
(Y/N)<br />
N/A<br />
Page 5 of 5
LEA: 7303 - BRADFORD SCHOOL <strong>DISTRICT</strong><br />
<strong>ARKANSAS</strong> <strong>SPECIAL</strong> <strong>EDUCATION</strong><br />
<strong>DISTRICT</strong> <strong>ANNUAL</strong> PERFORMANCE REPORT<br />
2010/11 School Year<br />
Publication Date: March 2012<br />
Each State must have in place a State Performance Plan (SPP) to evaluate the State's efforts to meet the requirements and<br />
purposes of the implementation of the Individuals with Disabilities Education Act (IDEA). The SPP is a six-year plan, which<br />
describes Arkansas's performance on 20 indicators. The Office of Special Education Programs in the U. S. Department of<br />
Education requires that States report annually to the public on the performance of each local education agency (LEA) on 14 of<br />
20 indicators as compared with targets established by the State in the SPP. Arkansas will report indicators 1 through 14 and<br />
20 for each LEA serving children with disabilities (CWD). Any LEA not meeting targets on compliance indicators (0% for<br />
Indicators 4B, 09 & 10 and 100% for Indicators 11, 12, 13, and 20) are non-compliant with IDEA.<br />
There are no report changes for the 2010/11 school year profile; However, it is important to recognize that: .<br />
1. Indicator 01 (Graduation) is reported a year in arrear (2009/10 graduates) and is based on a four-year cohort. This<br />
means the rate is a measure of students who entered in ninth grade and graduate in four years. The calculation is a<br />
requirement under Title I of the Elementary and Secondary Education Act (ESEA).<br />
2. Indicator 02 (Drop out) is reported a year in arrear. This means the rate is a measure of students who dropped out in<br />
the 2009/10 school year. The Indicator 02 data are aligned with the Common Core of Data (CCD) requirements for<br />
grades 7-12.<br />
3. Indicator 04A and 4B (Suspension/Expulsion) is reported a year in arrear. This means the rate is a measure of<br />
students who had out-of-school suspensions and/or expulsions totaling more than 10 days.<br />
Percent of youth<br />
with IEPs<br />
graduating from<br />
high school with a<br />
regular diploma<br />
For a complete description of all the Indicators, please visit the special education website at<br />
http://arksped.k12.ar.us/sections/policy.html<br />
Indicator 01: Graduation Rates (2009/10 school year) Indicator 02: Dropout Rates (2009/10 school year)<br />
State<br />
Rate<br />
State<br />
Target<br />
75.76% 85.00%<br />
LEA<br />
Rate<br />
100.00%<br />
Target Met<br />
by LEA<br />
(Y/N)<br />
Y<br />
Percent of<br />
youth with<br />
IEPs dropping<br />
out of high<br />
school<br />
State<br />
Rate<br />
Indicator 03: Assessment on Statewide Benchmark Exam (grades 3-8, 11)<br />
A) Adequate Yearly Progress<br />
n=40<br />
Literacy<br />
Mathematics<br />
Met Disability Subgroup "n"<br />
for Reporting Purposes (Y/N)<br />
State Target for % of Districts Meeting<br />
AYP for Disability Subgroup<br />
State<br />
Target<br />
3.06% 4.20%<br />
LEA<br />
Rate<br />
0.00%<br />
% of Districts Meeting AYP<br />
for Disability Subgroup<br />
Target Met by<br />
LEA (Y/N)<br />
Y<br />
Target Met by<br />
LEA(Y/N)<br />
Overall N 17.15% 6.25%<br />
NA<br />
N<br />
N<br />
Note: For a district to qualify as having a disability subgroup it must have a minimum of 40 (n=40) students with disabilities in a school building.<br />
B) Participation<br />
Participation Rate: # of<br />
CWD Tested ÷ # of CWD<br />
Enrolled in grades tested.<br />
Participation Rate: Literacy<br />
Participation Rate: Math<br />
Note: - - denotes not applicable<br />
State<br />
Rate<br />
98.78%<br />
State<br />
Target<br />
95.00%<br />
LEA<br />
Rate<br />
100.00%<br />
Target Met<br />
by LEA (Y/N)<br />
98.61% 95.00% 100.00% Y<br />
Y<br />
C) Performance Proficiency<br />
Percent of CWD Scoring<br />
Proficient or Above<br />
Proficiency Rate: Literacy<br />
Proficiency Rate:<br />
Mathematics<br />
16.00%<br />
16.00%<br />
State<br />
Rate<br />
31.49%<br />
44.86%<br />
State<br />
Target<br />
45.22%<br />
51.14%<br />
LEA<br />
Rate<br />
38.46%<br />
70.37%<br />
NA<br />
NA<br />
Target<br />
Met by<br />
LEA (Y/N)<br />
N<br />
Y<br />
Page 1 of 5
LEA: 7303 - BRADFORD SCHOOL <strong>DISTRICT</strong><br />
Indicator 04: Out-of-School Suspensions and Expulsions (2009/10 school year)<br />
A) Suspension/Expulsion<br />
Percent difference of CWD with out-of- school suspensions and<br />
expulsions totaling greater than 10 days in a school year as<br />
compared to the same data for general education students in<br />
the district.<br />
B) Suspension/Expulsion by Race and Ethnicity<br />
Percent of districts that have: (a) a significant discrepancy, by race or<br />
ethnicity, in the rate of suspensions and expulsions of greater than 10<br />
days in a school year for children with IEPs; and (b) policies,<br />
procedures or practices that contribute to the significant discrepancy<br />
and do not comply with requirements relating to the development<br />
and implementation of IEPs, the use of positive behavioral<br />
interventions and supports, and procedural safeguards.<br />
Indicator 05: School Age (5-21) Least Restrictive Environment<br />
A) In the Regular Class 80% or more of the day<br />
Percent of CWD with<br />
IEPs receiving instruction<br />
in the regular class 80%<br />
or more of the day.<br />
State<br />
Rate<br />
State<br />
Target<br />
LEA<br />
Rate<br />
B) In the Regular Class less than 40% of the day<br />
Percent of CWD with<br />
IEPs receiving instruction<br />
in the regular class less<br />
than 60% of the day.<br />
53.87% 59.77%<br />
State<br />
Rate<br />
State<br />
Target<br />
12.42% 12.51%<br />
76.67%<br />
LEA<br />
Rate<br />
0.00%<br />
C) Other Settings outside the regular class<br />
Percent of CWD with IEPs served in<br />
public or private separate schools,<br />
residential placements, or<br />
homebound/hospital placements.<br />
State<br />
Rate<br />
State<br />
Target<br />
2.80% 2.56%<br />
Target Met<br />
by LEA (Y/N)<br />
Y<br />
Target Met<br />
by LEA (Y/N)<br />
Y<br />
LEA<br />
Rate<br />
8.33%<br />
Target Met<br />
by LEA(Y/N)<br />
Indicator 06: Early Childhood (3-5) Least Restrictive Environment<br />
A) Regular Early Childhood Program<br />
Percent of children (aged 3 through 5) with IEPs attending a regular<br />
early childhood program and receiving the majority of special<br />
education and related services in the regular early childhood program<br />
Allowable<br />
Difference<br />
LEA: 7303 - BRADFORD SCHOOL <strong>DISTRICT</strong><br />
Indicator 07: Preschool (3-5) Outcomes<br />
a) Percent of preschool CWD<br />
children who did not<br />
improve functioning.<br />
b) Percent of preschool CWD<br />
who improved but whose<br />
functioning remained below<br />
same age peers.<br />
c) Percent of preschool CWD<br />
who improved at a level<br />
nearer to same aged peers.<br />
d) Percent of preschool CWD<br />
who improved functioning to<br />
reach a level comparable to<br />
same age peers.<br />
e) Percent of preschool CWD<br />
children who maintain<br />
functioning at a level<br />
comparable to same aged<br />
peers.<br />
Summary<br />
Statements<br />
1) Of those preschool<br />
children who entered<br />
the preschool program<br />
below age expectations<br />
in each Outcome, the<br />
percent who<br />
substantially increased<br />
their rate of growth by<br />
the time they turned 6<br />
years of age or exited<br />
the program.<br />
2) The percent of<br />
preschool children who<br />
were functioning<br />
within age expectations<br />
in each Outcome by the<br />
time they turned 6<br />
years of age or exited<br />
A) Positive Social -Emotional<br />
Skills*<br />
State<br />
Rate<br />
A) Positive Social -<br />
Emotional Skills<br />
(Including social<br />
relationships)<br />
State<br />
Rate<br />
2.14%<br />
5.31%<br />
25.97%<br />
38.22%<br />
28.36%<br />
State<br />
Target<br />
LEA<br />
Rate<br />
LEA<br />
Rate<br />
— —<br />
— —<br />
— —<br />
— —<br />
— —<br />
Target<br />
Met by<br />
LEA(Y/N)<br />
B) Acquisition and Use of<br />
Knowledge and Skills<br />
(Including early language/<br />
communication and early literacy)<br />
B) Acquisition and Use of<br />
Knowledge and Skills **<br />
State<br />
Rate<br />
1.75%<br />
6.59%<br />
34.23%<br />
43.51%<br />
13.92%<br />
State<br />
Target<br />
LEA<br />
Rate<br />
Target<br />
Met by<br />
LEA(Y/N)<br />
C) Use of Appropriate Behaviors<br />
to Meet Their Needs<br />
State<br />
Rate<br />
State<br />
Target<br />
LEA<br />
Rate<br />
Target<br />
Met by<br />
LEA(Y/N)<br />
89.61% 90.50% — — N/A 90.31% 90.50% — — N/A 90.82% 92.50% — — N/A<br />
66.58% 69.50% — — N/A 57.43% 60.50% — — N/A 76.69% 78.50% — — N/A<br />
NOTE: * Including social relationships ** Including early language/ communication and early literacy<br />
Note: - - denotes not applicable<br />
State<br />
Rate<br />
LEA<br />
Rate<br />
— —<br />
— —<br />
— —<br />
— —<br />
— —<br />
C) Use of<br />
Appropriate<br />
Behaviors to<br />
Meet Their Needs<br />
State<br />
Rate<br />
4.51%<br />
17.34%<br />
41.72%<br />
34.97%<br />
LEA<br />
Rate<br />
1.46% — —<br />
— —<br />
— —<br />
— —<br />
— —<br />
Page 3 of 5
LEA: 7303 - BRADFORD SCHOOL <strong>DISTRICT</strong><br />
Indicator 08: Parent Involvement<br />
Percent of surveyed<br />
parents who reported<br />
school facilitated parent<br />
involvement as a means<br />
of improving services<br />
and results for children<br />
with disabilities.<br />
Early Childhood<br />
(3-5)<br />
School Age<br />
(5-21)<br />
State<br />
Rate<br />
90.47%<br />
95.05%<br />
Indicator 09: Disproportionality - Eligibility<br />
Disproportionate representation of racial<br />
and ethnic groups in special education and<br />
related services that is a result of<br />
inappropriate identification (e.g.<br />
monitoring data, review of policies,<br />
practices, and procedures under 618(d),<br />
etc.).<br />
State<br />
Rate<br />
State<br />
Target<br />
88.00%<br />
96.00%<br />
State<br />
Target<br />
0.00% 0.00%<br />
LEA<br />
Rate<br />
— —<br />
100.00%<br />
Indicator 10: Disproportionality-Child with a Disability<br />
Disproportionate representation of racial<br />
and ethnic groups in specific disability<br />
categories that is a result of inappropriate<br />
identification (e.g. monitoring data, review<br />
of policies, practices, and procedures under<br />
618(d), etc.).<br />
Indicator 11: Child Find<br />
Percent of children with<br />
parental consent to evaluate<br />
who are evaluated within<br />
the State established timeline<br />
of 60 days.<br />
Overall<br />
(3-21)<br />
Early Childhood<br />
(3-5)<br />
School Age<br />
(5-21)<br />
State<br />
Rate<br />
0.00%<br />
Indicator 12: Early Childhood Transition<br />
Percent of children referred by Part C prior to<br />
age 3, who are found eligible for Part B, and<br />
who have an IEP developed and implemented<br />
by their third birthday.<br />
Note: - - denotes not applicable<br />
State<br />
Rate<br />
99.41%<br />
99.70%<br />
98.97%<br />
State<br />
Rate<br />
State<br />
Target<br />
0.00%<br />
State<br />
Target<br />
100.00%<br />
100.00%<br />
100.00%<br />
State<br />
Target<br />
Target Met by<br />
LEA (Y/N)<br />
Y<br />
Target Met by<br />
LEA (Y/N)<br />
Y<br />
LEA<br />
Rate<br />
100.00%<br />
— —<br />
100.00%<br />
LEA<br />
Rate<br />
Target Met by<br />
LEA (Y/N)<br />
N/A<br />
Y<br />
Note: The target for Indicator 09 is to have zero percent<br />
(0%) of districts identified as having disproportionate<br />
representation as a result of inappropriate<br />
identification in eligibility.<br />
Note: The target for Indicator 10 is to have zero<br />
percent (0%) of districts identified as having<br />
disproportionate representation as a result of<br />
inappropriate identification in a disability<br />
category.<br />
Target Met by<br />
LEA (Y/N)<br />
N/A<br />
Y<br />
Target Met<br />
by LEA<br />
(Y/N)<br />
99.21% 100.00% - - N/A<br />
Y<br />
Note: * Indicates a zero reponse rate for the<br />
district.<br />
Page 4 of 5
LEA: 7303 - BRADFORD SCHOOL <strong>DISTRICT</strong><br />
Indicator 13: Secondary Transition<br />
Percent of youth with disabilities aged 16 and<br />
up with an IEP that includes coordinated,<br />
measurable, annual IEP goals and transition<br />
services that will reasonably enable the student<br />
to meet the post-secondary goals.<br />
Indicator 14: Post-School Outcomes<br />
A. Percent of youth enrolled in higher<br />
education within one year of leaving high<br />
school.<br />
State<br />
Rate<br />
State<br />
Target<br />
Note: Data for this Indicator is from the on-site monitoring of LEAs for the given year.<br />
B. Percent of youth enrolled in higher<br />
education or competitively employed<br />
within one year of leaving high school.<br />
C. Percent of youth enrolled in higher<br />
education or in some other postsecondary<br />
education or training program; or<br />
competitively employed or in some other<br />
employment within one year of leaving<br />
high school.<br />
State<br />
Rate<br />
Indicator 20: Reported Data-Timely and Accurate*<br />
District submitted<br />
required data elements<br />
on or before due dates;<br />
made revisions within<br />
the alloted reveiw<br />
periods.<br />
Accurate and Timely<br />
Data Submission<br />
Overall (3-21)<br />
Early Childhood (3-5)<br />
School Age (5-21)<br />
State<br />
Target<br />
100.00%<br />
100.00%<br />
100.00%<br />
State<br />
Target<br />
LEA<br />
Rate<br />
LEA<br />
Rate<br />
Target Met by<br />
LEA (Y/N)<br />
Target Met<br />
by LEA<br />
(Y/N)<br />
Target Met<br />
by LEA<br />
(Y/N)<br />
*Data reviewed for timely and accurate submissions included all APSCN cycle data except for personnel<br />
Note: - - denotes not applicable<br />
96.19 100.00 — — N/A<br />
14.53<br />
State<br />
Rate<br />
49.42<br />
State<br />
Rate<br />
54.07<br />
13.00<br />
State<br />
Target<br />
49.00<br />
State<br />
Target<br />
60.00<br />
Y<br />
N/A<br />
Y<br />
— —<br />
LEA<br />
Rate<br />
— —<br />
LEA<br />
Rate<br />
— —<br />
N/A<br />
Target Met<br />
by LEA<br />
(Y/N)<br />
N/A<br />
Target Met<br />
by LEA<br />
(Y/N)<br />
N/A<br />
Page 5 of 5
<strong>ARKANSAS</strong> <strong>SPECIAL</strong> <strong>EDUCATION</strong><br />
<strong>DISTRICT</strong> <strong>ANNUAL</strong> PERFORMANCE REPORT<br />
2010/11 School Year<br />
Publication Date: March 2012<br />
Each State must have in place a State Performance Plan (SPP) to evaluate the State's efforts to meet the requirements and<br />
purposes of the implementation of the Individuals with Disabilities Education Act (IDEA). The SPP is a six-year plan, which<br />
describes Arkansas's performance on 20 indicators. The Office of Special Education Programs in the U. S. Department of<br />
Education requires that States report annually to the public on the performance of each local education agency (LEA) on 14 of<br />
20 indicators as compared with targets established by the State in the SPP. Arkansas will report indicators 1 through 14 and<br />
20 for each LEA serving children with disabilities (CWD). Any LEA not meeting targets on compliance indicators (0% for<br />
Indicators 4B, 09 & 10 and 100% for Indicators 11, 12, 13, and 20) are non-compliant with IDEA.<br />
There are no report changes for the 2010/11 school year profile; However, it is important to recognize that: .<br />
1. Indicator 01 (Graduation) is reported a year in arrear (2009/10 graduates) and is based on a four-year cohort. This<br />
means the rate is a measure of students who entered in ninth grade and graduate in four years. The calculation is a<br />
requirement under Title I of the Elementary and Secondary Education Act (ESEA).<br />
2. Indicator 02 (Drop out) is reported a year in arrear. This means the rate is a measure of students who dropped out in<br />
the 2009/10 school year. The Indicator 02 data are aligned with the Common Core of Data (CCD) requirements for<br />
grades 7-12.<br />
3. Indicator 04A and 4B (Suspension/Expulsion) is reported a year in arrear. This means the rate is a measure of<br />
students who had out-of-school suspensions and/or expulsions totaling more than 10 days.<br />
For a complete description of all the Indicators, please visit the special education website at<br />
http://arksped.k12.ar.us/sections/policy.html<br />
LEA: 7304 - WHITE CO. CENTRAL SCHOOL <strong>DISTRICT</strong><br />
Indicator 01: Graduation Rates (2009/10 school year) Indicator 02: Dropout Rates (2009/10 school year)<br />
Percent of youth<br />
with IEPs<br />
graduating from<br />
high school with a<br />
regular diploma<br />
State<br />
Rate<br />
State<br />
Target<br />
75.76% 85.00%<br />
LEA<br />
Rate<br />
100.00%<br />
Target Met<br />
by LEA<br />
(Y/N)<br />
Y<br />
Percent of<br />
youth with<br />
IEPs dropping<br />
out of high<br />
school<br />
State<br />
Rate<br />
Indicator 03: Assessment on Statewide Benchmark Exam (grades 3-8, 11)<br />
A) Adequate Yearly Progress<br />
n=40<br />
Literacy<br />
Mathematics<br />
Met Disability Subgroup "n"<br />
for Reporting Purposes (Y/N)<br />
State Target for % of Districts Meeting<br />
AYP for Disability Subgroup<br />
State<br />
Target<br />
3.06% 4.20%<br />
LEA<br />
Rate<br />
2.70%<br />
% of Districts Meeting AYP<br />
for Disability Subgroup<br />
Target Met by<br />
LEA (Y/N)<br />
Y<br />
Target Met by<br />
LEA(Y/N)<br />
Overall N 17.15% 6.25%<br />
NA<br />
N<br />
N<br />
Note: For a district to qualify as having a disability subgroup it must have a minimum of 40 (n=40) students with disabilities in a school building.<br />
B) Participation<br />
Participation Rate: # of<br />
CWD Tested ÷ # of CWD<br />
Enrolled in grades tested.<br />
Participation Rate: Literacy<br />
Participation Rate: Math<br />
Note: - - denotes not applicable<br />
State<br />
Rate<br />
98.78%<br />
State<br />
Target<br />
95.00%<br />
LEA<br />
Rate<br />
100.00%<br />
Target Met<br />
by LEA (Y/N)<br />
98.61% 95.00% 100.00% Y<br />
Y<br />
C) Performance Proficiency<br />
Percent of CWD Scoring<br />
Proficient or Above<br />
Proficiency Rate: Literacy<br />
Proficiency Rate:<br />
Mathematics<br />
16.00%<br />
16.00%<br />
State<br />
Rate<br />
31.49%<br />
44.86%<br />
State<br />
Target<br />
45.22%<br />
51.14%<br />
LEA<br />
Rate<br />
24.24%<br />
41.18%<br />
NA<br />
NA<br />
Target<br />
Met by<br />
LEA (Y/N)<br />
N<br />
N<br />
Page 1 of 5
LEA: 7304 - WHITE CO. CENTRAL SCHOOL <strong>DISTRICT</strong><br />
Indicator 04: Out-of-School Suspensions and Expulsions (2009/10 school year)<br />
A) Suspension/Expulsion<br />
Percent difference of CWD with out-of- school suspensions and<br />
expulsions totaling greater than 10 days in a school year as<br />
compared to the same data for general education students in<br />
the district.<br />
B) Suspension/Expulsion by Race and Ethnicity<br />
Percent of districts that have: (a) a significant discrepancy, by race or<br />
ethnicity, in the rate of suspensions and expulsions of greater than 10<br />
days in a school year for children with IEPs; and (b) policies,<br />
procedures or practices that contribute to the significant discrepancy<br />
and do not comply with requirements relating to the development<br />
and implementation of IEPs, the use of positive behavioral<br />
interventions and supports, and procedural safeguards.<br />
Indicator 05: School Age (5-21) Least Restrictive Environment<br />
A) In the Regular Class 80% or more of the day<br />
Percent of CWD with<br />
IEPs receiving instruction<br />
in the regular class 80%<br />
or more of the day.<br />
State<br />
Rate<br />
State<br />
Target<br />
LEA<br />
Rate<br />
B) In the Regular Class less than 40% of the day<br />
Percent of CWD with<br />
IEPs receiving instruction<br />
in the regular class less<br />
than 60% of the day.<br />
53.87% 59.77%<br />
State<br />
Rate<br />
State<br />
Target<br />
12.42% 12.51%<br />
67.74%<br />
LEA<br />
Rate<br />
11.29%<br />
C) Other Settings outside the regular class<br />
Percent of CWD with IEPs served in<br />
public or private separate schools,<br />
residential placements, or<br />
homebound/hospital placements.<br />
State<br />
Rate<br />
State<br />
Target<br />
2.80% 2.56%<br />
Target Met<br />
by LEA (Y/N)<br />
Y<br />
Target Met<br />
by LEA (Y/N)<br />
Y<br />
LEA<br />
Rate<br />
1.61%<br />
Target Met<br />
by LEA(Y/N)<br />
Indicator 06: Early Childhood (3-5) Least Restrictive Environment<br />
A) Regular Early Childhood Program<br />
Percent of children (aged 3 through 5) with IEPs attending a regular<br />
early childhood program and receiving the majority of special<br />
education and related services in the regular early childhood program<br />
Allowable<br />
Difference<br />
LEA: 7304 - WHITE CO. CENTRAL SCHOOL <strong>DISTRICT</strong><br />
Indicator 07: Preschool (3-5) Outcomes<br />
a) Percent of preschool CWD<br />
children who did not<br />
improve functioning.<br />
b) Percent of preschool CWD<br />
who improved but whose<br />
functioning remained below<br />
same age peers.<br />
c) Percent of preschool CWD<br />
who improved at a level<br />
nearer to same aged peers.<br />
d) Percent of preschool CWD<br />
who improved functioning to<br />
reach a level comparable to<br />
same age peers.<br />
e) Percent of preschool CWD<br />
children who maintain<br />
functioning at a level<br />
comparable to same aged<br />
peers.<br />
Summary<br />
Statements<br />
1) Of those preschool<br />
children who entered<br />
the preschool program<br />
below age expectations<br />
in each Outcome, the<br />
percent who<br />
substantially increased<br />
their rate of growth by<br />
the time they turned 6<br />
years of age or exited<br />
the program.<br />
2) The percent of<br />
preschool children who<br />
were functioning<br />
within age expectations<br />
in each Outcome by the<br />
time they turned 6<br />
years of age or exited<br />
A) Positive Social -Emotional<br />
Skills*<br />
State<br />
Rate<br />
A) Positive Social -<br />
Emotional Skills<br />
(Including social<br />
relationships)<br />
State<br />
Rate<br />
2.14%<br />
5.31%<br />
25.97%<br />
38.22%<br />
28.36%<br />
State<br />
Target<br />
LEA<br />
Rate<br />
LEA<br />
Rate<br />
— —<br />
— —<br />
— —<br />
— —<br />
— —<br />
Target<br />
Met by<br />
LEA(Y/N)<br />
B) Acquisition and Use of<br />
Knowledge and Skills<br />
(Including early language/<br />
communication and early literacy)<br />
B) Acquisition and Use of<br />
Knowledge and Skills **<br />
State<br />
Rate<br />
1.75%<br />
6.59%<br />
34.23%<br />
43.51%<br />
13.92%<br />
State<br />
Target<br />
LEA<br />
Rate<br />
Target<br />
Met by<br />
LEA(Y/N)<br />
C) Use of Appropriate Behaviors<br />
to Meet Their Needs<br />
State<br />
Rate<br />
State<br />
Target<br />
LEA<br />
Rate<br />
Target<br />
Met by<br />
LEA(Y/N)<br />
89.61% 90.50% — — N/A 90.31% 90.50% — — N/A 90.82% 92.50% — — N/A<br />
66.58% 69.50% — — N/A 57.43% 60.50% — — N/A 76.69% 78.50% — — N/A<br />
NOTE: * Including social relationships ** Including early language/ communication and early literacy<br />
Note: - - denotes not applicable<br />
State<br />
Rate<br />
LEA<br />
Rate<br />
— —<br />
— —<br />
— —<br />
— —<br />
— —<br />
C) Use of<br />
Appropriate<br />
Behaviors to<br />
Meet Their Needs<br />
State<br />
Rate<br />
4.51%<br />
17.34%<br />
41.72%<br />
34.97%<br />
LEA<br />
Rate<br />
1.46% — —<br />
— —<br />
— —<br />
— —<br />
— —<br />
Page 3 of 5
LEA: 7304 - WHITE CO. CENTRAL SCHOOL <strong>DISTRICT</strong><br />
Indicator 08: Parent Involvement<br />
Percent of surveyed<br />
parents who reported<br />
school facilitated parent<br />
involvement as a means<br />
of improving services<br />
and results for children<br />
with disabilities.<br />
Early Childhood<br />
(3-5)<br />
School Age<br />
(5-21)<br />
State<br />
Rate<br />
90.47%<br />
95.05%<br />
Indicator 09: Disproportionality - Eligibility<br />
Disproportionate representation of racial<br />
and ethnic groups in special education and<br />
related services that is a result of<br />
inappropriate identification (e.g.<br />
monitoring data, review of policies,<br />
practices, and procedures under 618(d),<br />
etc.).<br />
State<br />
Rate<br />
State<br />
Target<br />
88.00%<br />
96.00%<br />
State<br />
Target<br />
0.00% 0.00%<br />
LEA<br />
Rate<br />
— —<br />
100.00%<br />
Indicator 10: Disproportionality-Child with a Disability<br />
Disproportionate representation of racial<br />
and ethnic groups in specific disability<br />
categories that is a result of inappropriate<br />
identification (e.g. monitoring data, review<br />
of policies, practices, and procedures under<br />
618(d), etc.).<br />
Indicator 11: Child Find<br />
Percent of children with<br />
parental consent to evaluate<br />
who are evaluated within<br />
the State established timeline<br />
of 60 days.<br />
Overall<br />
(3-21)<br />
Early Childhood<br />
(3-5)<br />
School Age<br />
(5-21)<br />
State<br />
Rate<br />
0.00%<br />
Indicator 12: Early Childhood Transition<br />
Percent of children referred by Part C prior to<br />
age 3, who are found eligible for Part B, and<br />
who have an IEP developed and implemented<br />
by their third birthday.<br />
Note: - - denotes not applicable<br />
State<br />
Rate<br />
99.41%<br />
99.70%<br />
98.97%<br />
State<br />
Rate<br />
State<br />
Target<br />
0.00%<br />
State<br />
Target<br />
100.00%<br />
100.00%<br />
100.00%<br />
State<br />
Target<br />
Target Met by<br />
LEA (Y/N)<br />
Y<br />
Target Met by<br />
LEA (Y/N)<br />
Y<br />
LEA<br />
Rate<br />
100.00%<br />
— —<br />
100.00%<br />
LEA<br />
Rate<br />
Target Met by<br />
LEA (Y/N)<br />
N/A<br />
Y<br />
Note: The target for Indicator 09 is to have zero percent<br />
(0%) of districts identified as having disproportionate<br />
representation as a result of inappropriate<br />
identification in eligibility.<br />
Note: The target for Indicator 10 is to have zero<br />
percent (0%) of districts identified as having<br />
disproportionate representation as a result of<br />
inappropriate identification in a disability<br />
category.<br />
Target Met by<br />
LEA (Y/N)<br />
N/A<br />
Y<br />
Target Met<br />
by LEA<br />
(Y/N)<br />
99.21% 100.00% - - N/A<br />
Y<br />
Note: * Indicates a zero reponse rate for the<br />
district.<br />
Page 4 of 5
LEA: 7304 - WHITE CO. CENTRAL SCHOOL <strong>DISTRICT</strong><br />
Indicator 13: Secondary Transition<br />
Percent of youth with disabilities aged 16 and<br />
up with an IEP that includes coordinated,<br />
measurable, annual IEP goals and transition<br />
services that will reasonably enable the student<br />
to meet the post-secondary goals.<br />
Indicator 14: Post-School Outcomes<br />
A. Percent of youth enrolled in higher<br />
education within one year of leaving high<br />
school.<br />
State<br />
Rate<br />
State<br />
Target<br />
Note: Data for this Indicator is from the on-site monitoring of LEAs for the given year.<br />
B. Percent of youth enrolled in higher<br />
education or competitively employed<br />
within one year of leaving high school.<br />
C. Percent of youth enrolled in higher<br />
education or in some other postsecondary<br />
education or training program; or<br />
competitively employed or in some other<br />
employment within one year of leaving<br />
high school.<br />
State<br />
Rate<br />
Indicator 20: Reported Data-Timely and Accurate*<br />
District submitted<br />
required data elements<br />
on or before due dates;<br />
made revisions within<br />
the alloted reveiw<br />
periods.<br />
Accurate and Timely<br />
Data Submission<br />
Overall (3-21)<br />
Early Childhood (3-5)<br />
School Age (5-21)<br />
State<br />
Target<br />
100.00%<br />
100.00%<br />
100.00%<br />
State<br />
Target<br />
LEA<br />
Rate<br />
LEA<br />
Rate<br />
Target Met by<br />
LEA (Y/N)<br />
Target Met<br />
by LEA<br />
(Y/N)<br />
Target Met<br />
by LEA<br />
(Y/N)<br />
*Data reviewed for timely and accurate submissions included all APSCN cycle data except for personnel<br />
Note: - - denotes not applicable<br />
96.19 100.00 — — N/A<br />
14.53<br />
State<br />
Rate<br />
49.42<br />
State<br />
Rate<br />
54.07<br />
13.00<br />
State<br />
Target<br />
49.00<br />
State<br />
Target<br />
60.00<br />
Y<br />
N/A<br />
Y<br />
— —<br />
LEA<br />
Rate<br />
— —<br />
LEA<br />
Rate<br />
— —<br />
N/A<br />
Target Met<br />
by LEA<br />
(Y/N)<br />
N/A<br />
Target Met<br />
by LEA<br />
(Y/N)<br />
N/A<br />
Page 5 of 5
LEA: 7307 - RIVERVIEW SCHOOL <strong>DISTRICT</strong><br />
<strong>ARKANSAS</strong> <strong>SPECIAL</strong> <strong>EDUCATION</strong><br />
<strong>DISTRICT</strong> <strong>ANNUAL</strong> PERFORMANCE REPORT<br />
2010/11 School Year<br />
Publication Date: March 2012<br />
Each State must have in place a State Performance Plan (SPP) to evaluate the State's efforts to meet the requirements and<br />
purposes of the implementation of the Individuals with Disabilities Education Act (IDEA). The SPP is a six-year plan, which<br />
describes Arkansas's performance on 20 indicators. The Office of Special Education Programs in the U. S. Department of<br />
Education requires that States report annually to the public on the performance of each local education agency (LEA) on 14 of<br />
20 indicators as compared with targets established by the State in the SPP. Arkansas will report indicators 1 through 14 and<br />
20 for each LEA serving children with disabilities (CWD). Any LEA not meeting targets on compliance indicators (0% for<br />
Indicators 4B, 09 & 10 and 100% for Indicators 11, 12, 13, and 20) are non-compliant with IDEA.<br />
There are no report changes for the 2010/11 school year profile; However, it is important to recognize that: .<br />
1. Indicator 01 (Graduation) is reported a year in arrear (2009/10 graduates) and is based on a four-year cohort. This<br />
means the rate is a measure of students who entered in ninth grade and graduate in four years. The calculation is a<br />
requirement under Title I of the Elementary and Secondary Education Act (ESEA).<br />
2. Indicator 02 (Drop out) is reported a year in arrear. This means the rate is a measure of students who dropped out in<br />
the 2009/10 school year. The Indicator 02 data are aligned with the Common Core of Data (CCD) requirements for<br />
grades 7-12.<br />
3. Indicator 04A and 4B (Suspension/Expulsion) is reported a year in arrear. This means the rate is a measure of<br />
students who had out-of-school suspensions and/or expulsions totaling more than 10 days.<br />
Percent of youth<br />
with IEPs<br />
graduating from<br />
high school with a<br />
regular diploma<br />
For a complete description of all the Indicators, please visit the special education website at<br />
http://arksped.k12.ar.us/sections/policy.html<br />
Indicator 01: Graduation Rates (2009/10 school year) Indicator 02: Dropout Rates (2009/10 school year)<br />
State<br />
Rate<br />
State<br />
Target<br />
75.76% 85.00%<br />
LEA<br />
Rate<br />
72.73%<br />
Target Met<br />
by LEA<br />
(Y/N)<br />
N<br />
Percent of<br />
youth with<br />
IEPs dropping<br />
out of high<br />
school<br />
State<br />
Rate<br />
Indicator 03: Assessment on Statewide Benchmark Exam (grades 3-8, 11)<br />
A) Adequate Yearly Progress<br />
n=40<br />
Literacy<br />
Mathematics<br />
Met Disability Subgroup "n"<br />
for Reporting Purposes (Y/N)<br />
State Target for % of Districts Meeting<br />
AYP for Disability Subgroup<br />
State<br />
Target<br />
3.06% 4.20%<br />
LEA<br />
Rate<br />
0.00%<br />
% of Districts Meeting AYP<br />
for Disability Subgroup<br />
Target Met by<br />
LEA (Y/N)<br />
Y<br />
Target Met by<br />
LEA(Y/N)<br />
Overall N 17.15% 6.25%<br />
NA<br />
N<br />
N<br />
Note: For a district to qualify as having a disability subgroup it must have a minimum of 40 (n=40) students with disabilities in a school building.<br />
B) Participation<br />
Participation Rate: # of<br />
CWD Tested ÷ # of CWD<br />
Enrolled in grades tested.<br />
Participation Rate: Literacy<br />
Participation Rate: Math<br />
Note: - - denotes not applicable<br />
State<br />
Rate<br />
98.78%<br />
State<br />
Target<br />
95.00%<br />
LEA<br />
Rate<br />
100.00%<br />
Target Met<br />
by LEA (Y/N)<br />
98.61% 95.00% 98.90% Y<br />
Y<br />
C) Performance Proficiency<br />
Percent of CWD Scoring<br />
Proficient or Above<br />
Proficiency Rate: Literacy<br />
Proficiency Rate:<br />
Mathematics<br />
16.00%<br />
16.00%<br />
State<br />
Rate<br />
31.49%<br />
44.86%<br />
State<br />
Target<br />
45.22%<br />
51.14%<br />
LEA<br />
Rate<br />
29.73%<br />
31.25%<br />
NA<br />
NA<br />
Target<br />
Met by<br />
LEA (Y/N)<br />
N<br />
N<br />
Page 1 of 5
LEA: 7307 - RIVERVIEW SCHOOL <strong>DISTRICT</strong><br />
Indicator 04: Out-of-School Suspensions and Expulsions (2009/10 school year)<br />
A) Suspension/Expulsion<br />
Percent difference of CWD with out-of- school suspensions and<br />
expulsions totaling greater than 10 days in a school year as<br />
compared to the same data for general education students in<br />
the district.<br />
B) Suspension/Expulsion by Race and Ethnicity<br />
Percent of districts that have: (a) a significant discrepancy, by race or<br />
ethnicity, in the rate of suspensions and expulsions of greater than 10<br />
days in a school year for children with IEPs; and (b) policies,<br />
procedures or practices that contribute to the significant discrepancy<br />
and do not comply with requirements relating to the development<br />
and implementation of IEPs, the use of positive behavioral<br />
interventions and supports, and procedural safeguards.<br />
Indicator 05: School Age (5-21) Least Restrictive Environment<br />
A) In the Regular Class 80% or more of the day<br />
Percent of CWD with<br />
IEPs receiving instruction<br />
in the regular class 80%<br />
or more of the day.<br />
State<br />
Rate<br />
State<br />
Target<br />
LEA<br />
Rate<br />
B) In the Regular Class less than 40% of the day<br />
Percent of CWD with<br />
IEPs receiving instruction<br />
in the regular class less<br />
than 60% of the day.<br />
53.87% 59.77%<br />
State<br />
Rate<br />
State<br />
Target<br />
12.42% 12.51%<br />
56.67%<br />
LEA<br />
Rate<br />
8.89%<br />
C) Other Settings outside the regular class<br />
Percent of CWD with IEPs served in<br />
public or private separate schools,<br />
residential placements, or<br />
homebound/hospital placements.<br />
State<br />
Rate<br />
State<br />
Target<br />
2.80% 2.56%<br />
Target Met<br />
by LEA (Y/N)<br />
N<br />
Target Met<br />
by LEA (Y/N)<br />
Y<br />
LEA<br />
Rate<br />
2.22%<br />
Target Met<br />
by LEA(Y/N)<br />
Indicator 06: Early Childhood (3-5) Least Restrictive Environment<br />
A) Regular Early Childhood Program<br />
Percent of children (aged 3 through 5) with IEPs attending a regular<br />
early childhood program and receiving the majority of special<br />
education and related services in the regular early childhood program<br />
Allowable<br />
Difference<br />
LEA: 7307 - RIVERVIEW SCHOOL <strong>DISTRICT</strong><br />
Indicator 07: Preschool (3-5) Outcomes<br />
a) Percent of preschool CWD<br />
children who did not<br />
improve functioning.<br />
b) Percent of preschool CWD<br />
who improved but whose<br />
functioning remained below<br />
same age peers.<br />
c) Percent of preschool CWD<br />
who improved at a level<br />
nearer to same aged peers.<br />
d) Percent of preschool CWD<br />
who improved functioning to<br />
reach a level comparable to<br />
same age peers.<br />
e) Percent of preschool CWD<br />
children who maintain<br />
functioning at a level<br />
comparable to same aged<br />
peers.<br />
Summary<br />
Statements<br />
1) Of those preschool<br />
children who entered<br />
the preschool program<br />
below age expectations<br />
in each Outcome, the<br />
percent who<br />
substantially increased<br />
their rate of growth by<br />
the time they turned 6<br />
years of age or exited<br />
the program.<br />
2) The percent of<br />
preschool children who<br />
were functioning<br />
within age expectations<br />
in each Outcome by the<br />
time they turned 6<br />
years of age or exited<br />
A) Positive Social -Emotional<br />
Skills*<br />
State<br />
Rate<br />
A) Positive Social -<br />
Emotional Skills<br />
(Including social<br />
relationships)<br />
State<br />
Rate<br />
2.14%<br />
5.31%<br />
25.97%<br />
38.22%<br />
28.36%<br />
State<br />
Target<br />
LEA<br />
Rate<br />
LEA<br />
Rate<br />
— —<br />
— —<br />
— —<br />
— —<br />
— —<br />
Target<br />
Met by<br />
LEA(Y/N)<br />
B) Acquisition and Use of<br />
Knowledge and Skills<br />
(Including early language/<br />
communication and early literacy)<br />
B) Acquisition and Use of<br />
Knowledge and Skills **<br />
State<br />
Rate<br />
1.75%<br />
6.59%<br />
34.23%<br />
43.51%<br />
13.92%<br />
State<br />
Target<br />
LEA<br />
Rate<br />
Target<br />
Met by<br />
LEA(Y/N)<br />
C) Use of Appropriate Behaviors<br />
to Meet Their Needs<br />
State<br />
Rate<br />
State<br />
Target<br />
LEA<br />
Rate<br />
Target<br />
Met by<br />
LEA(Y/N)<br />
89.61% 90.50% — — N/A 90.31% 90.50% — — N/A 90.82% 92.50% — — N/A<br />
66.58% 69.50% — — N/A 57.43% 60.50% — — N/A 76.69% 78.50% — — N/A<br />
NOTE: * Including social relationships ** Including early language/ communication and early literacy<br />
Note: - - denotes not applicable<br />
State<br />
Rate<br />
LEA<br />
Rate<br />
— —<br />
— —<br />
— —<br />
— —<br />
— —<br />
C) Use of<br />
Appropriate<br />
Behaviors to<br />
Meet Their Needs<br />
State<br />
Rate<br />
4.51%<br />
17.34%<br />
41.72%<br />
34.97%<br />
LEA<br />
Rate<br />
1.46% — —<br />
— —<br />
— —<br />
— —<br />
— —<br />
Page 3 of 5
LEA: 7307 - RIVERVIEW SCHOOL <strong>DISTRICT</strong><br />
Indicator 08: Parent Involvement<br />
Percent of surveyed<br />
parents who reported<br />
school facilitated parent<br />
involvement as a means<br />
of improving services<br />
and results for children<br />
with disabilities.<br />
Early Childhood<br />
(3-5)<br />
School Age<br />
(5-21)<br />
State<br />
Rate<br />
90.47%<br />
95.05%<br />
Indicator 09: Disproportionality - Eligibility<br />
Disproportionate representation of racial<br />
and ethnic groups in special education and<br />
related services that is a result of<br />
inappropriate identification (e.g.<br />
monitoring data, review of policies,<br />
practices, and procedures under 618(d),<br />
etc.).<br />
State<br />
Rate<br />
State<br />
Target<br />
88.00%<br />
96.00%<br />
State<br />
Target<br />
0.00% 0.00%<br />
LEA<br />
Rate<br />
— —<br />
94.55%<br />
Indicator 10: Disproportionality-Child with a Disability<br />
Disproportionate representation of racial<br />
and ethnic groups in specific disability<br />
categories that is a result of inappropriate<br />
identification (e.g. monitoring data, review<br />
of policies, practices, and procedures under<br />
618(d), etc.).<br />
Indicator 11: Child Find<br />
Percent of children with<br />
parental consent to evaluate<br />
who are evaluated within<br />
the State established timeline<br />
of 60 days.<br />
Overall<br />
(3-21)<br />
Early Childhood<br />
(3-5)<br />
School Age<br />
(5-21)<br />
State<br />
Rate<br />
0.00%<br />
Indicator 12: Early Childhood Transition<br />
Percent of children referred by Part C prior to<br />
age 3, who are found eligible for Part B, and<br />
who have an IEP developed and implemented<br />
by their third birthday.<br />
Note: - - denotes not applicable<br />
State<br />
Rate<br />
99.41%<br />
99.70%<br />
98.97%<br />
State<br />
Rate<br />
State<br />
Target<br />
0.00%<br />
State<br />
Target<br />
100.00%<br />
100.00%<br />
100.00%<br />
State<br />
Target<br />
Target Met by<br />
LEA (Y/N)<br />
Y<br />
Target Met by<br />
LEA (Y/N)<br />
Y<br />
LEA<br />
Rate<br />
100.00%<br />
— —<br />
100.00%<br />
LEA<br />
Rate<br />
Target Met by<br />
LEA (Y/N)<br />
N/A<br />
N<br />
Note: The target for Indicator 09 is to have zero percent<br />
(0%) of districts identified as having disproportionate<br />
representation as a result of inappropriate<br />
identification in eligibility.<br />
Note: The target for Indicator 10 is to have zero<br />
percent (0%) of districts identified as having<br />
disproportionate representation as a result of<br />
inappropriate identification in a disability<br />
category.<br />
Target Met by<br />
LEA (Y/N)<br />
N/A<br />
Y<br />
Target Met<br />
by LEA<br />
(Y/N)<br />
99.21% 100.00% - - N/A<br />
Y<br />
Note: * Indicates a zero reponse rate for the<br />
district.<br />
Page 4 of 5
LEA: 7307 - RIVERVIEW SCHOOL <strong>DISTRICT</strong><br />
Indicator 13: Secondary Transition<br />
Percent of youth with disabilities aged 16 and<br />
up with an IEP that includes coordinated,<br />
measurable, annual IEP goals and transition<br />
services that will reasonably enable the student<br />
to meet the post-secondary goals.<br />
Indicator 14: Post-School Outcomes<br />
A. Percent of youth enrolled in higher<br />
education within one year of leaving high<br />
school.<br />
State<br />
Rate<br />
State<br />
Target<br />
Note: Data for this Indicator is from the on-site monitoring of LEAs for the given year.<br />
B. Percent of youth enrolled in higher<br />
education or competitively employed<br />
within one year of leaving high school.<br />
C. Percent of youth enrolled in higher<br />
education or in some other postsecondary<br />
education or training program; or<br />
competitively employed or in some other<br />
employment within one year of leaving<br />
high school.<br />
State<br />
Rate<br />
Indicator 20: Reported Data-Timely and Accurate*<br />
District submitted<br />
required data elements<br />
on or before due dates;<br />
made revisions within<br />
the alloted reveiw<br />
periods.<br />
Accurate and Timely<br />
Data Submission<br />
Overall (3-21)<br />
Early Childhood (3-5)<br />
School Age (5-21)<br />
State<br />
Target<br />
100.00%<br />
100.00%<br />
100.00%<br />
State<br />
Target<br />
LEA<br />
Rate<br />
LEA<br />
Rate<br />
Target Met by<br />
LEA (Y/N)<br />
Target Met<br />
by LEA<br />
(Y/N)<br />
Target Met<br />
by LEA<br />
(Y/N)<br />
*Data reviewed for timely and accurate submissions included all APSCN cycle data except for personnel<br />
Note: - - denotes not applicable<br />
96.19 100.00 — — N/A<br />
14.53<br />
State<br />
Rate<br />
49.42<br />
State<br />
Rate<br />
54.07<br />
13.00<br />
State<br />
Target<br />
49.00<br />
State<br />
Target<br />
60.00<br />
Y<br />
N/A<br />
Y<br />
— —<br />
LEA<br />
Rate<br />
— —<br />
LEA<br />
Rate<br />
— —<br />
N/A<br />
Target Met<br />
by LEA<br />
(Y/N)<br />
N/A<br />
Target Met<br />
by LEA<br />
(Y/N)<br />
N/A<br />
Page 5 of 5
LEA: 7309 - PANGBURN SCHOOL <strong>DISTRICT</strong><br />
<strong>ARKANSAS</strong> <strong>SPECIAL</strong> <strong>EDUCATION</strong><br />
<strong>DISTRICT</strong> <strong>ANNUAL</strong> PERFORMANCE REPORT<br />
2010/11 School Year<br />
Publication Date: March 2012<br />
Each State must have in place a State Performance Plan (SPP) to evaluate the State's efforts to meet the requirements and<br />
purposes of the implementation of the Individuals with Disabilities Education Act (IDEA). The SPP is a six-year plan, which<br />
describes Arkansas's performance on 20 indicators. The Office of Special Education Programs in the U. S. Department of<br />
Education requires that States report annually to the public on the performance of each local education agency (LEA) on 14 of<br />
20 indicators as compared with targets established by the State in the SPP. Arkansas will report indicators 1 through 14 and<br />
20 for each LEA serving children with disabilities (CWD). Any LEA not meeting targets on compliance indicators (0% for<br />
Indicators 4B, 09 & 10 and 100% for Indicators 11, 12, 13, and 20) are non-compliant with IDEA.<br />
There are no report changes for the 2010/11 school year profile; However, it is important to recognize that: .<br />
1. Indicator 01 (Graduation) is reported a year in arrear (2009/10 graduates) and is based on a four-year cohort. This<br />
means the rate is a measure of students who entered in ninth grade and graduate in four years. The calculation is a<br />
requirement under Title I of the Elementary and Secondary Education Act (ESEA).<br />
2. Indicator 02 (Drop out) is reported a year in arrear. This means the rate is a measure of students who dropped out in<br />
the 2009/10 school year. The Indicator 02 data are aligned with the Common Core of Data (CCD) requirements for<br />
grades 7-12.<br />
3. Indicator 04A and 4B (Suspension/Expulsion) is reported a year in arrear. This means the rate is a measure of<br />
students who had out-of-school suspensions and/or expulsions totaling more than 10 days.<br />
Percent of youth<br />
with IEPs<br />
graduating from<br />
high school with a<br />
regular diploma<br />
For a complete description of all the Indicators, please visit the special education website at<br />
http://arksped.k12.ar.us/sections/policy.html<br />
Indicator 01: Graduation Rates (2009/10 school year) Indicator 02: Dropout Rates (2009/10 school year)<br />
State<br />
Rate<br />
State<br />
Target<br />
75.76% 85.00%<br />
LEA<br />
Rate<br />
90.91%<br />
Target Met<br />
by LEA<br />
(Y/N)<br />
Y<br />
Percent of<br />
youth with<br />
IEPs dropping<br />
out of high<br />
school<br />
State<br />
Rate<br />
Indicator 03: Assessment on Statewide Benchmark Exam (grades 3-8, 11)<br />
A) Adequate Yearly Progress<br />
n=40<br />
Literacy<br />
Mathematics<br />
Met Disability Subgroup "n"<br />
for Reporting Purposes (Y/N)<br />
State Target for % of Districts Meeting<br />
AYP for Disability Subgroup<br />
State<br />
Target<br />
3.06% 4.20%<br />
LEA<br />
Rate<br />
3.57%<br />
% of Districts Meeting AYP<br />
for Disability Subgroup<br />
Target Met by<br />
LEA (Y/N)<br />
Y<br />
Target Met by<br />
LEA(Y/N)<br />
Overall N 17.15% 6.25%<br />
NA<br />
N<br />
N<br />
Note: For a district to qualify as having a disability subgroup it must have a minimum of 40 (n=40) students with disabilities in a school building.<br />
B) Participation<br />
Participation Rate: # of<br />
CWD Tested ÷ # of CWD<br />
Enrolled in grades tested.<br />
Participation Rate: Literacy<br />
Participation Rate: Math<br />
Note: - - denotes not applicable<br />
State<br />
Rate<br />
98.78%<br />
State<br />
Target<br />
95.00%<br />
LEA<br />
Rate<br />
100.00%<br />
Target Met<br />
by LEA (Y/N)<br />
98.61% 95.00% 100.00% Y<br />
Y<br />
C) Performance Proficiency<br />
Percent of CWD Scoring<br />
Proficient or Above<br />
Proficiency Rate: Literacy<br />
Proficiency Rate:<br />
Mathematics<br />
16.00%<br />
16.00%<br />
State<br />
Rate<br />
31.49%<br />
44.86%<br />
State<br />
Target<br />
45.22%<br />
51.14%<br />
LEA<br />
Rate<br />
44.44%<br />
46.88%<br />
NA<br />
NA<br />
Target<br />
Met by<br />
LEA (Y/N)<br />
N<br />
N<br />
Page 1 of 5
LEA: 7309 - PANGBURN SCHOOL <strong>DISTRICT</strong><br />
Indicator 04: Out-of-School Suspensions and Expulsions (2009/10 school year)<br />
A) Suspension/Expulsion<br />
Percent difference of CWD with out-of- school suspensions and<br />
expulsions totaling greater than 10 days in a school year as<br />
compared to the same data for general education students in<br />
the district.<br />
B) Suspension/Expulsion by Race and Ethnicity<br />
Percent of districts that have: (a) a significant discrepancy, by race or<br />
ethnicity, in the rate of suspensions and expulsions of greater than 10<br />
days in a school year for children with IEPs; and (b) policies,<br />
procedures or practices that contribute to the significant discrepancy<br />
and do not comply with requirements relating to the development<br />
and implementation of IEPs, the use of positive behavioral<br />
interventions and supports, and procedural safeguards.<br />
Indicator 05: School Age (5-21) Least Restrictive Environment<br />
A) In the Regular Class 80% or more of the day<br />
Percent of CWD with<br />
IEPs receiving instruction<br />
in the regular class 80%<br />
or more of the day.<br />
State<br />
Rate<br />
State<br />
Target<br />
LEA<br />
Rate<br />
B) In the Regular Class less than 40% of the day<br />
Percent of CWD with<br />
IEPs receiving instruction<br />
in the regular class less<br />
than 60% of the day.<br />
53.87% 59.77%<br />
State<br />
Rate<br />
State<br />
Target<br />
12.42% 12.51%<br />
61.33%<br />
LEA<br />
Rate<br />
0.00%<br />
C) Other Settings outside the regular class<br />
Percent of CWD with IEPs served in<br />
public or private separate schools,<br />
residential placements, or<br />
homebound/hospital placements.<br />
State<br />
Rate<br />
State<br />
Target<br />
2.80% 2.56%<br />
Target Met<br />
by LEA (Y/N)<br />
Y<br />
Target Met<br />
by LEA (Y/N)<br />
Y<br />
LEA<br />
Rate<br />
5.33%<br />
Target Met<br />
by LEA(Y/N)<br />
Indicator 06: Early Childhood (3-5) Least Restrictive Environment<br />
A) Regular Early Childhood Program<br />
Percent of children (aged 3 through 5) with IEPs attending a regular<br />
early childhood program and receiving the majority of special<br />
education and related services in the regular early childhood program<br />
Allowable<br />
Difference<br />
LEA: 7309 - PANGBURN SCHOOL <strong>DISTRICT</strong><br />
Indicator 07: Preschool (3-5) Outcomes<br />
a) Percent of preschool CWD<br />
children who did not<br />
improve functioning.<br />
b) Percent of preschool CWD<br />
who improved but whose<br />
functioning remained below<br />
same age peers.<br />
c) Percent of preschool CWD<br />
who improved at a level<br />
nearer to same aged peers.<br />
d) Percent of preschool CWD<br />
who improved functioning to<br />
reach a level comparable to<br />
same age peers.<br />
e) Percent of preschool CWD<br />
children who maintain<br />
functioning at a level<br />
comparable to same aged<br />
peers.<br />
Summary<br />
Statements<br />
1) Of those preschool<br />
children who entered<br />
the preschool program<br />
below age expectations<br />
in each Outcome, the<br />
percent who<br />
substantially increased<br />
their rate of growth by<br />
the time they turned 6<br />
years of age or exited<br />
the program.<br />
2) The percent of<br />
preschool children who<br />
were functioning<br />
within age expectations<br />
in each Outcome by the<br />
time they turned 6<br />
years of age or exited<br />
A) Positive Social -Emotional<br />
Skills*<br />
State<br />
Rate<br />
A) Positive Social -<br />
Emotional Skills<br />
(Including social<br />
relationships)<br />
State<br />
Rate<br />
2.14%<br />
5.31%<br />
25.97%<br />
38.22%<br />
28.36%<br />
State<br />
Target<br />
LEA<br />
Rate<br />
LEA<br />
Rate<br />
— —<br />
— —<br />
— —<br />
— —<br />
— —<br />
Target<br />
Met by<br />
LEA(Y/N)<br />
B) Acquisition and Use of<br />
Knowledge and Skills<br />
(Including early language/<br />
communication and early literacy)<br />
B) Acquisition and Use of<br />
Knowledge and Skills **<br />
State<br />
Rate<br />
1.75%<br />
6.59%<br />
34.23%<br />
43.51%<br />
13.92%<br />
State<br />
Target<br />
LEA<br />
Rate<br />
Target<br />
Met by<br />
LEA(Y/N)<br />
C) Use of Appropriate Behaviors<br />
to Meet Their Needs<br />
State<br />
Rate<br />
State<br />
Target<br />
LEA<br />
Rate<br />
Target<br />
Met by<br />
LEA(Y/N)<br />
89.61% 90.50% — — N/A 90.31% 90.50% — — N/A 90.82% 92.50% — — N/A<br />
66.58% 69.50% — — N/A 57.43% 60.50% — — N/A 76.69% 78.50% — — N/A<br />
NOTE: * Including social relationships ** Including early language/ communication and early literacy<br />
Note: - - denotes not applicable<br />
State<br />
Rate<br />
LEA<br />
Rate<br />
— —<br />
— —<br />
— —<br />
— —<br />
— —<br />
C) Use of<br />
Appropriate<br />
Behaviors to<br />
Meet Their Needs<br />
State<br />
Rate<br />
4.51%<br />
17.34%<br />
41.72%<br />
34.97%<br />
LEA<br />
Rate<br />
1.46% — —<br />
— —<br />
— —<br />
— —<br />
— —<br />
Page 3 of 5
LEA: 7309 - PANGBURN SCHOOL <strong>DISTRICT</strong><br />
Indicator 08: Parent Involvement<br />
Percent of surveyed<br />
parents who reported<br />
school facilitated parent<br />
involvement as a means<br />
of improving services<br />
and results for children<br />
with disabilities.<br />
Early Childhood<br />
(3-5)<br />
School Age<br />
(5-21)<br />
State<br />
Rate<br />
90.47%<br />
95.05%<br />
Indicator 09: Disproportionality - Eligibility<br />
Disproportionate representation of racial<br />
and ethnic groups in special education and<br />
related services that is a result of<br />
inappropriate identification (e.g.<br />
monitoring data, review of policies,<br />
practices, and procedures under 618(d),<br />
etc.).<br />
State<br />
Rate<br />
State<br />
Target<br />
88.00%<br />
96.00%<br />
State<br />
Target<br />
0.00% 0.00%<br />
LEA<br />
Rate<br />
— —<br />
100.00%<br />
Indicator 10: Disproportionality-Child with a Disability<br />
Disproportionate representation of racial<br />
and ethnic groups in specific disability<br />
categories that is a result of inappropriate<br />
identification (e.g. monitoring data, review<br />
of policies, practices, and procedures under<br />
618(d), etc.).<br />
Indicator 11: Child Find<br />
Percent of children with<br />
parental consent to evaluate<br />
who are evaluated within<br />
the State established timeline<br />
of 60 days.<br />
Overall<br />
(3-21)<br />
Early Childhood<br />
(3-5)<br />
School Age<br />
(5-21)<br />
State<br />
Rate<br />
0.00%<br />
Indicator 12: Early Childhood Transition<br />
Percent of children referred by Part C prior to<br />
age 3, who are found eligible for Part B, and<br />
who have an IEP developed and implemented<br />
by their third birthday.<br />
Note: - - denotes not applicable<br />
State<br />
Rate<br />
99.41%<br />
99.70%<br />
98.97%<br />
State<br />
Rate<br />
State<br />
Target<br />
0.00%<br />
State<br />
Target<br />
100.00%<br />
100.00%<br />
100.00%<br />
State<br />
Target<br />
Target Met by<br />
LEA (Y/N)<br />
Y<br />
Target Met by<br />
LEA (Y/N)<br />
Y<br />
LEA<br />
Rate<br />
100.00%<br />
— —<br />
100.00%<br />
LEA<br />
Rate<br />
Target Met by<br />
LEA (Y/N)<br />
N/A<br />
Y<br />
Note: The target for Indicator 09 is to have zero percent<br />
(0%) of districts identified as having disproportionate<br />
representation as a result of inappropriate<br />
identification in eligibility.<br />
Note: The target for Indicator 10 is to have zero<br />
percent (0%) of districts identified as having<br />
disproportionate representation as a result of<br />
inappropriate identification in a disability<br />
category.<br />
Target Met by<br />
LEA (Y/N)<br />
N/A<br />
Y<br />
Target Met<br />
by LEA<br />
(Y/N)<br />
99.21% 100.00% - - N/A<br />
Y<br />
Note: * Indicates a zero reponse rate for the<br />
district.<br />
Page 4 of 5
LEA: 7309 - PANGBURN SCHOOL <strong>DISTRICT</strong><br />
Indicator 13: Secondary Transition<br />
Percent of youth with disabilities aged 16 and<br />
up with an IEP that includes coordinated,<br />
measurable, annual IEP goals and transition<br />
services that will reasonably enable the student<br />
to meet the post-secondary goals.<br />
Indicator 14: Post-School Outcomes<br />
A. Percent of youth enrolled in higher<br />
education within one year of leaving high<br />
school.<br />
State<br />
Rate<br />
State<br />
Target<br />
Note: Data for this Indicator is from the on-site monitoring of LEAs for the given year.<br />
B. Percent of youth enrolled in higher<br />
education or competitively employed<br />
within one year of leaving high school.<br />
C. Percent of youth enrolled in higher<br />
education or in some other postsecondary<br />
education or training program; or<br />
competitively employed or in some other<br />
employment within one year of leaving<br />
high school.<br />
State<br />
Rate<br />
Indicator 20: Reported Data-Timely and Accurate*<br />
District submitted<br />
required data elements<br />
on or before due dates;<br />
made revisions within<br />
the alloted reveiw<br />
periods.<br />
Accurate and Timely<br />
Data Submission<br />
Overall (3-21)<br />
Early Childhood (3-5)<br />
School Age (5-21)<br />
State<br />
Target<br />
100.00%<br />
100.00%<br />
100.00%<br />
State<br />
Target<br />
LEA<br />
Rate<br />
LEA<br />
Rate<br />
Target Met by<br />
LEA (Y/N)<br />
Target Met<br />
by LEA<br />
(Y/N)<br />
Target Met<br />
by LEA<br />
(Y/N)<br />
*Data reviewed for timely and accurate submissions included all APSCN cycle data except for personnel<br />
Note: - - denotes not applicable<br />
96.19 100.00 — — N/A<br />
14.53<br />
State<br />
Rate<br />
49.42<br />
State<br />
Rate<br />
54.07<br />
13.00<br />
State<br />
Target<br />
49.00<br />
State<br />
Target<br />
60.00<br />
Y<br />
N/A<br />
Y<br />
— —<br />
LEA<br />
Rate<br />
— —<br />
LEA<br />
Rate<br />
— —<br />
N/A<br />
Target Met<br />
by LEA<br />
(Y/N)<br />
N/A<br />
Target Met<br />
by LEA<br />
(Y/N)<br />
N/A<br />
Page 5 of 5
LEA: 7310 - ROSE BUD SCHOOL <strong>DISTRICT</strong><br />
<strong>ARKANSAS</strong> <strong>SPECIAL</strong> <strong>EDUCATION</strong><br />
<strong>DISTRICT</strong> <strong>ANNUAL</strong> PERFORMANCE REPORT<br />
2010/11 School Year<br />
Publication Date: March 2012<br />
Each State must have in place a State Performance Plan (SPP) to evaluate the State's efforts to meet the requirements and<br />
purposes of the implementation of the Individuals with Disabilities Education Act (IDEA). The SPP is a six-year plan, which<br />
describes Arkansas's performance on 20 indicators. The Office of Special Education Programs in the U. S. Department of<br />
Education requires that States report annually to the public on the performance of each local education agency (LEA) on 14 of<br />
20 indicators as compared with targets established by the State in the SPP. Arkansas will report indicators 1 through 14 and<br />
20 for each LEA serving children with disabilities (CWD). Any LEA not meeting targets on compliance indicators (0% for<br />
Indicators 4B, 09 & 10 and 100% for Indicators 11, 12, 13, and 20) are non-compliant with IDEA.<br />
There are no report changes for the 2010/11 school year profile; However, it is important to recognize that: .<br />
1. Indicator 01 (Graduation) is reported a year in arrear (2009/10 graduates) and is based on a four-year cohort. This<br />
means the rate is a measure of students who entered in ninth grade and graduate in four years. The calculation is a<br />
requirement under Title I of the Elementary and Secondary Education Act (ESEA).<br />
2. Indicator 02 (Drop out) is reported a year in arrear. This means the rate is a measure of students who dropped out in<br />
the 2009/10 school year. The Indicator 02 data are aligned with the Common Core of Data (CCD) requirements for<br />
grades 7-12.<br />
3. Indicator 04A and 4B (Suspension/Expulsion) is reported a year in arrear. This means the rate is a measure of<br />
students who had out-of-school suspensions and/or expulsions totaling more than 10 days.<br />
Percent of youth<br />
with IEPs<br />
graduating from<br />
high school with a<br />
regular diploma<br />
For a complete description of all the Indicators, please visit the special education website at<br />
http://arksped.k12.ar.us/sections/policy.html<br />
Indicator 01: Graduation Rates (2009/10 school year) Indicator 02: Dropout Rates (2009/10 school year)<br />
State<br />
Rate<br />
State<br />
Target<br />
75.76% 85.00%<br />
LEA<br />
Rate<br />
100.00%<br />
Target Met<br />
by LEA<br />
(Y/N)<br />
Y<br />
Percent of<br />
youth with<br />
IEPs dropping<br />
out of high<br />
school<br />
State<br />
Rate<br />
Indicator 03: Assessment on Statewide Benchmark Exam (grades 3-8, 11)<br />
A) Adequate Yearly Progress<br />
n=40<br />
Literacy<br />
Mathematics<br />
Met Disability Subgroup "n"<br />
for Reporting Purposes (Y/N)<br />
State Target for % of Districts Meeting<br />
AYP for Disability Subgroup<br />
State<br />
Target<br />
3.06% 4.20%<br />
LEA<br />
Rate<br />
4.62%<br />
% of Districts Meeting AYP<br />
for Disability Subgroup<br />
Target Met by<br />
LEA (Y/N)<br />
N<br />
Target Met by<br />
LEA(Y/N)<br />
Overall N 17.15% 6.25%<br />
NA<br />
N<br />
N<br />
Note: For a district to qualify as having a disability subgroup it must have a minimum of 40 (n=40) students with disabilities in a school building.<br />
B) Participation<br />
Participation Rate: # of<br />
CWD Tested ÷ # of CWD<br />
Enrolled in grades tested.<br />
Participation Rate: Literacy<br />
Participation Rate: Math<br />
Note: - - denotes not applicable<br />
State<br />
Rate<br />
98.78%<br />
State<br />
Target<br />
95.00%<br />
LEA<br />
Rate<br />
98.21%<br />
Target Met<br />
by LEA (Y/N)<br />
98.61% 95.00% 98.04% Y<br />
Y<br />
C) Performance Proficiency<br />
Percent of CWD Scoring<br />
Proficient or Above<br />
Proficiency Rate: Literacy<br />
Proficiency Rate:<br />
Mathematics<br />
16.00%<br />
16.00%<br />
State<br />
Rate<br />
31.49%<br />
44.86%<br />
State<br />
Target<br />
45.22%<br />
51.14%<br />
LEA<br />
Rate<br />
24.07%<br />
52.00%<br />
NA<br />
NA<br />
Target<br />
Met by<br />
LEA (Y/N)<br />
N<br />
Y<br />
Page 1 of 5
LEA: 7310 - ROSE BUD SCHOOL <strong>DISTRICT</strong><br />
Indicator 04: Out-of-School Suspensions and Expulsions (2009/10 school year)<br />
A) Suspension/Expulsion<br />
Percent difference of CWD with out-of- school suspensions and<br />
expulsions totaling greater than 10 days in a school year as<br />
compared to the same data for general education students in<br />
the district.<br />
B) Suspension/Expulsion by Race and Ethnicity<br />
Percent of districts that have: (a) a significant discrepancy, by race or<br />
ethnicity, in the rate of suspensions and expulsions of greater than 10<br />
days in a school year for children with IEPs; and (b) policies,<br />
procedures or practices that contribute to the significant discrepancy<br />
and do not comply with requirements relating to the development<br />
and implementation of IEPs, the use of positive behavioral<br />
interventions and supports, and procedural safeguards.<br />
Indicator 05: School Age (5-21) Least Restrictive Environment<br />
A) In the Regular Class 80% or more of the day<br />
Percent of CWD with<br />
IEPs receiving instruction<br />
in the regular class 80%<br />
or more of the day.<br />
State<br />
Rate<br />
State<br />
Target<br />
LEA<br />
Rate<br />
B) In the Regular Class less than 40% of the day<br />
Percent of CWD with<br />
IEPs receiving instruction<br />
in the regular class less<br />
than 60% of the day.<br />
53.87% 59.77%<br />
State<br />
Rate<br />
State<br />
Target<br />
12.42% 12.51%<br />
66.02%<br />
LEA<br />
Rate<br />
0.97%<br />
C) Other Settings outside the regular class<br />
Percent of CWD with IEPs served in<br />
public or private separate schools,<br />
residential placements, or<br />
homebound/hospital placements.<br />
State<br />
Rate<br />
State<br />
Target<br />
2.80% 2.56%<br />
Target Met<br />
by LEA (Y/N)<br />
Y<br />
Target Met<br />
by LEA (Y/N)<br />
Y<br />
LEA<br />
Rate<br />
0.00%<br />
Target Met<br />
by LEA(Y/N)<br />
Indicator 06: Early Childhood (3-5) Least Restrictive Environment<br />
A) Regular Early Childhood Program<br />
Percent of children (aged 3 through 5) with IEPs attending a regular<br />
early childhood program and receiving the majority of special<br />
education and related services in the regular early childhood program<br />
Allowable<br />
Difference<br />
LEA: 7310 - ROSE BUD SCHOOL <strong>DISTRICT</strong><br />
Indicator 07: Preschool (3-5) Outcomes<br />
a) Percent of preschool CWD<br />
children who did not<br />
improve functioning.<br />
b) Percent of preschool CWD<br />
who improved but whose<br />
functioning remained below<br />
same age peers.<br />
c) Percent of preschool CWD<br />
who improved at a level<br />
nearer to same aged peers.<br />
d) Percent of preschool CWD<br />
who improved functioning to<br />
reach a level comparable to<br />
same age peers.<br />
e) Percent of preschool CWD<br />
children who maintain<br />
functioning at a level<br />
comparable to same aged<br />
peers.<br />
Summary<br />
Statements<br />
1) Of those preschool<br />
children who entered<br />
the preschool program<br />
below age expectations<br />
in each Outcome, the<br />
percent who<br />
substantially increased<br />
their rate of growth by<br />
the time they turned 6<br />
years of age or exited<br />
the program.<br />
2) The percent of<br />
preschool children who<br />
were functioning<br />
within age expectations<br />
in each Outcome by the<br />
time they turned 6<br />
years of age or exited<br />
A) Positive Social -Emotional<br />
Skills*<br />
State<br />
Rate<br />
A) Positive Social -<br />
Emotional Skills<br />
(Including social<br />
relationships)<br />
State<br />
Rate<br />
2.14%<br />
5.31%<br />
25.97%<br />
38.22%<br />
28.36%<br />
State<br />
Target<br />
LEA<br />
Rate<br />
LEA<br />
Rate<br />
— —<br />
— —<br />
— —<br />
— —<br />
— —<br />
Target<br />
Met by<br />
LEA(Y/N)<br />
B) Acquisition and Use of<br />
Knowledge and Skills<br />
(Including early language/<br />
communication and early literacy)<br />
B) Acquisition and Use of<br />
Knowledge and Skills **<br />
State<br />
Rate<br />
1.75%<br />
6.59%<br />
34.23%<br />
43.51%<br />
13.92%<br />
State<br />
Target<br />
LEA<br />
Rate<br />
Target<br />
Met by<br />
LEA(Y/N)<br />
C) Use of Appropriate Behaviors<br />
to Meet Their Needs<br />
State<br />
Rate<br />
State<br />
Target<br />
LEA<br />
Rate<br />
Target<br />
Met by<br />
LEA(Y/N)<br />
89.61% 90.50% — — N/A 90.31% 90.50% — — N/A 90.82% 92.50% — — N/A<br />
66.58% 69.50% — — N/A 57.43% 60.50% — — N/A 76.69% 78.50% — — N/A<br />
NOTE: * Including social relationships ** Including early language/ communication and early literacy<br />
Note: - - denotes not applicable<br />
State<br />
Rate<br />
LEA<br />
Rate<br />
— —<br />
— —<br />
— —<br />
— —<br />
— —<br />
C) Use of<br />
Appropriate<br />
Behaviors to<br />
Meet Their Needs<br />
State<br />
Rate<br />
4.51%<br />
17.34%<br />
41.72%<br />
34.97%<br />
LEA<br />
Rate<br />
1.46% — —<br />
— —<br />
— —<br />
— —<br />
— —<br />
Page 3 of 5
LEA: 7310 - ROSE BUD SCHOOL <strong>DISTRICT</strong><br />
Indicator 08: Parent Involvement<br />
Percent of surveyed<br />
parents who reported<br />
school facilitated parent<br />
involvement as a means<br />
of improving services<br />
and results for children<br />
with disabilities.<br />
Early Childhood<br />
(3-5)<br />
School Age<br />
(5-21)<br />
State<br />
Rate<br />
90.47%<br />
95.05%<br />
Indicator 09: Disproportionality - Eligibility<br />
Disproportionate representation of racial<br />
and ethnic groups in special education and<br />
related services that is a result of<br />
inappropriate identification (e.g.<br />
monitoring data, review of policies,<br />
practices, and procedures under 618(d),<br />
etc.).<br />
State<br />
Rate<br />
State<br />
Target<br />
88.00%<br />
96.00%<br />
State<br />
Target<br />
0.00% 0.00%<br />
LEA<br />
Rate<br />
— —<br />
100.00%<br />
Indicator 10: Disproportionality-Child with a Disability<br />
Disproportionate representation of racial<br />
and ethnic groups in specific disability<br />
categories that is a result of inappropriate<br />
identification (e.g. monitoring data, review<br />
of policies, practices, and procedures under<br />
618(d), etc.).<br />
Indicator 11: Child Find<br />
Percent of children with<br />
parental consent to evaluate<br />
who are evaluated within<br />
the State established timeline<br />
of 60 days.<br />
Overall<br />
(3-21)<br />
Early Childhood<br />
(3-5)<br />
School Age<br />
(5-21)<br />
State<br />
Rate<br />
0.00%<br />
Indicator 12: Early Childhood Transition<br />
Percent of children referred by Part C prior to<br />
age 3, who are found eligible for Part B, and<br />
who have an IEP developed and implemented<br />
by their third birthday.<br />
Note: - - denotes not applicable<br />
State<br />
Rate<br />
99.41%<br />
99.70%<br />
98.97%<br />
State<br />
Rate<br />
State<br />
Target<br />
0.00%<br />
State<br />
Target<br />
100.00%<br />
100.00%<br />
100.00%<br />
State<br />
Target<br />
Target Met by<br />
LEA (Y/N)<br />
Y<br />
Target Met by<br />
LEA (Y/N)<br />
Y<br />
LEA<br />
Rate<br />
100.00%<br />
— —<br />
100.00%<br />
LEA<br />
Rate<br />
Target Met by<br />
LEA (Y/N)<br />
N/A<br />
Y<br />
Note: The target for Indicator 09 is to have zero percent<br />
(0%) of districts identified as having disproportionate<br />
representation as a result of inappropriate<br />
identification in eligibility.<br />
Note: The target for Indicator 10 is to have zero<br />
percent (0%) of districts identified as having<br />
disproportionate representation as a result of<br />
inappropriate identification in a disability<br />
category.<br />
Target Met by<br />
LEA (Y/N)<br />
N/A<br />
Y<br />
Target Met<br />
by LEA<br />
(Y/N)<br />
99.21% 100.00% - - N/A<br />
Y<br />
Note: * Indicates a zero reponse rate for the<br />
district.<br />
Page 4 of 5
LEA: 7310 - ROSE BUD SCHOOL <strong>DISTRICT</strong><br />
Indicator 13: Secondary Transition<br />
Percent of youth with disabilities aged 16 and<br />
up with an IEP that includes coordinated,<br />
measurable, annual IEP goals and transition<br />
services that will reasonably enable the student<br />
to meet the post-secondary goals.<br />
Indicator 14: Post-School Outcomes<br />
A. Percent of youth enrolled in higher<br />
education within one year of leaving high<br />
school.<br />
State<br />
Rate<br />
State<br />
Target<br />
Note: Data for this Indicator is from the on-site monitoring of LEAs for the given year.<br />
B. Percent of youth enrolled in higher<br />
education or competitively employed<br />
within one year of leaving high school.<br />
C. Percent of youth enrolled in higher<br />
education or in some other postsecondary<br />
education or training program; or<br />
competitively employed or in some other<br />
employment within one year of leaving<br />
high school.<br />
State<br />
Rate<br />
Indicator 20: Reported Data-Timely and Accurate*<br />
District submitted<br />
required data elements<br />
on or before due dates;<br />
made revisions within<br />
the alloted reveiw<br />
periods.<br />
Accurate and Timely<br />
Data Submission<br />
Overall (3-21)<br />
Early Childhood (3-5)<br />
School Age (5-21)<br />
State<br />
Target<br />
100.00%<br />
100.00%<br />
100.00%<br />
State<br />
Target<br />
LEA<br />
Rate<br />
LEA<br />
Rate<br />
Target Met by<br />
LEA (Y/N)<br />
Target Met<br />
by LEA<br />
(Y/N)<br />
Target Met<br />
by LEA<br />
(Y/N)<br />
*Data reviewed for timely and accurate submissions included all APSCN cycle data except for personnel<br />
Note: - - denotes not applicable<br />
96.19 100.00 — — N/A<br />
14.53<br />
State<br />
Rate<br />
49.42<br />
State<br />
Rate<br />
54.07<br />
13.00<br />
State<br />
Target<br />
49.00<br />
State<br />
Target<br />
60.00<br />
Y<br />
N/A<br />
Y<br />
— —<br />
LEA<br />
Rate<br />
— —<br />
LEA<br />
Rate<br />
— —<br />
N/A<br />
Target Met<br />
by LEA<br />
(Y/N)<br />
N/A<br />
Target Met<br />
by LEA<br />
(Y/N)<br />
N/A<br />
Page 5 of 5
LEA: 7311 - SEARCY SCHOOL <strong>DISTRICT</strong><br />
<strong>ARKANSAS</strong> <strong>SPECIAL</strong> <strong>EDUCATION</strong><br />
<strong>DISTRICT</strong> <strong>ANNUAL</strong> PERFORMANCE REPORT<br />
2010/11 School Year<br />
Publication Date: March 2012<br />
Each State must have in place a State Performance Plan (SPP) to evaluate the State's efforts to meet the requirements and<br />
purposes of the implementation of the Individuals with Disabilities Education Act (IDEA). The SPP is a six-year plan, which<br />
describes Arkansas's performance on 20 indicators. The Office of Special Education Programs in the U. S. Department of<br />
Education requires that States report annually to the public on the performance of each local education agency (LEA) on 14 of<br />
20 indicators as compared with targets established by the State in the SPP. Arkansas will report indicators 1 through 14 and<br />
20 for each LEA serving children with disabilities (CWD). Any LEA not meeting targets on compliance indicators (0% for<br />
Indicators 4B, 09 & 10 and 100% for Indicators 11, 12, 13, and 20) are non-compliant with IDEA.<br />
There are no report changes for the 2010/11 school year profile; However, it is important to recognize that: .<br />
1. Indicator 01 (Graduation) is reported a year in arrear (2009/10 graduates) and is based on a four-year cohort. This<br />
means the rate is a measure of students who entered in ninth grade and graduate in four years. The calculation is a<br />
requirement under Title I of the Elementary and Secondary Education Act (ESEA).<br />
2. Indicator 02 (Drop out) is reported a year in arrear. This means the rate is a measure of students who dropped out in<br />
the 2009/10 school year. The Indicator 02 data are aligned with the Common Core of Data (CCD) requirements for<br />
grades 7-12.<br />
3. Indicator 04A and 4B (Suspension/Expulsion) is reported a year in arrear. This means the rate is a measure of<br />
students who had out-of-school suspensions and/or expulsions totaling more than 10 days.<br />
Percent of youth<br />
with IEPs<br />
graduating from<br />
high school with a<br />
regular diploma<br />
For a complete description of all the Indicators, please visit the special education website at<br />
http://arksped.k12.ar.us/sections/policy.html<br />
Indicator 01: Graduation Rates (2009/10 school year) Indicator 02: Dropout Rates (2009/10 school year)<br />
State<br />
Rate<br />
State<br />
Target<br />
75.76% 85.00%<br />
LEA<br />
Rate<br />
72.41%<br />
Target Met<br />
by LEA<br />
(Y/N)<br />
N<br />
Percent of<br />
youth with<br />
IEPs dropping<br />
out of high<br />
school<br />
State<br />
Rate<br />
Indicator 03: Assessment on Statewide Benchmark Exam (grades 3-8, 11)<br />
A) Adequate Yearly Progress<br />
n=40<br />
Literacy<br />
Mathematics<br />
Met Disability Subgroup "n"<br />
for Reporting Purposes (Y/N)<br />
State Target for % of Districts Meeting<br />
AYP for Disability Subgroup<br />
State<br />
Target<br />
3.06% 4.20%<br />
LEA<br />
Rate<br />
3.87%<br />
% of Districts Meeting AYP<br />
for Disability Subgroup<br />
Target Met by<br />
LEA (Y/N)<br />
Y<br />
Target Met by<br />
LEA(Y/N)<br />
Overall N 17.15% 6.25%<br />
NA<br />
N<br />
N<br />
Note: For a district to qualify as having a disability subgroup it must have a minimum of 40 (n=40) students with disabilities in a school building.<br />
B) Participation<br />
Participation Rate: # of<br />
CWD Tested ÷ # of CWD<br />
Enrolled in grades tested.<br />
Participation Rate: Literacy<br />
Participation Rate: Math<br />
Note: - - denotes not applicable<br />
State<br />
Rate<br />
98.78%<br />
State<br />
Target<br />
95.00%<br />
LEA<br />
Rate<br />
99.53%<br />
Target Met<br />
by LEA (Y/N)<br />
98.61% 95.00% 99.07% Y<br />
Y<br />
C) Performance Proficiency<br />
Percent of CWD Scoring<br />
Proficient or Above<br />
Proficiency Rate: Literacy<br />
Proficiency Rate:<br />
Mathematics<br />
16.00%<br />
16.00%<br />
State<br />
Rate<br />
31.49%<br />
44.86%<br />
State<br />
Target<br />
45.22%<br />
51.14%<br />
LEA<br />
Rate<br />
46.63%<br />
57.44%<br />
NA<br />
NA<br />
Target<br />
Met by<br />
LEA (Y/N)<br />
Y<br />
Y<br />
Page 1 of 5
LEA: 7311 - SEARCY SCHOOL <strong>DISTRICT</strong><br />
Indicator 04: Out-of-School Suspensions and Expulsions (2009/10 school year)<br />
A) Suspension/Expulsion<br />
Percent difference of CWD with out-of- school suspensions and<br />
expulsions totaling greater than 10 days in a school year as<br />
compared to the same data for general education students in<br />
the district.<br />
B) Suspension/Expulsion by Race and Ethnicity<br />
Percent of districts that have: (a) a significant discrepancy, by race or<br />
ethnicity, in the rate of suspensions and expulsions of greater than 10<br />
days in a school year for children with IEPs; and (b) policies,<br />
procedures or practices that contribute to the significant discrepancy<br />
and do not comply with requirements relating to the development<br />
and implementation of IEPs, the use of positive behavioral<br />
interventions and supports, and procedural safeguards.<br />
Indicator 05: School Age (5-21) Least Restrictive Environment<br />
A) In the Regular Class 80% or more of the day<br />
Percent of CWD with<br />
IEPs receiving instruction<br />
in the regular class 80%<br />
or more of the day.<br />
State<br />
Rate<br />
State<br />
Target<br />
LEA<br />
Rate<br />
B) In the Regular Class less than 40% of the day<br />
Percent of CWD with<br />
IEPs receiving instruction<br />
in the regular class less<br />
than 60% of the day.<br />
53.87% 59.77%<br />
State<br />
Rate<br />
State<br />
Target<br />
12.42% 12.51%<br />
43.80%<br />
LEA<br />
Rate<br />
9.49%<br />
C) Other Settings outside the regular class<br />
Percent of CWD with IEPs served in<br />
public or private separate schools,<br />
residential placements, or<br />
homebound/hospital placements.<br />
State<br />
Rate<br />
State<br />
Target<br />
2.80% 2.56%<br />
Target Met<br />
by LEA (Y/N)<br />
N<br />
Target Met<br />
by LEA (Y/N)<br />
Y<br />
LEA<br />
Rate<br />
5.84%<br />
Target Met<br />
by LEA(Y/N)<br />
Indicator 06: Early Childhood (3-5) Least Restrictive Environment<br />
A) Regular Early Childhood Program<br />
Percent of children (aged 3 through 5) with IEPs attending a regular<br />
early childhood program and receiving the majority of special<br />
education and related services in the regular early childhood program<br />
Allowable<br />
Difference<br />
LEA: 7311 - SEARCY SCHOOL <strong>DISTRICT</strong><br />
Indicator 07: Preschool (3-5) Outcomes<br />
a) Percent of preschool CWD<br />
children who did not<br />
improve functioning.<br />
b) Percent of preschool CWD<br />
who improved but whose<br />
functioning remained below<br />
same age peers.<br />
c) Percent of preschool CWD<br />
who improved at a level<br />
nearer to same aged peers.<br />
d) Percent of preschool CWD<br />
who improved functioning to<br />
reach a level comparable to<br />
same age peers.<br />
e) Percent of preschool CWD<br />
children who maintain<br />
functioning at a level<br />
comparable to same aged<br />
peers.<br />
Summary<br />
Statements<br />
1) Of those preschool<br />
children who entered<br />
the preschool program<br />
below age expectations<br />
in each Outcome, the<br />
percent who<br />
substantially increased<br />
their rate of growth by<br />
the time they turned 6<br />
years of age or exited<br />
the program.<br />
2) The percent of<br />
preschool children who<br />
were functioning<br />
within age expectations<br />
in each Outcome by the<br />
time they turned 6<br />
years of age or exited<br />
A) Positive Social -Emotional<br />
Skills*<br />
State<br />
Rate<br />
A) Positive Social -<br />
Emotional Skills<br />
(Including social<br />
relationships)<br />
State<br />
Rate<br />
2.14%<br />
5.31%<br />
25.97%<br />
38.22%<br />
28.36%<br />
State<br />
Target<br />
LEA<br />
Rate<br />
LEA<br />
Rate<br />
— —<br />
— —<br />
— —<br />
— —<br />
— —<br />
Target<br />
Met by<br />
LEA(Y/N)<br />
B) Acquisition and Use of<br />
Knowledge and Skills<br />
(Including early language/<br />
communication and early literacy)<br />
B) Acquisition and Use of<br />
Knowledge and Skills **<br />
State<br />
Rate<br />
1.75%<br />
6.59%<br />
34.23%<br />
43.51%<br />
13.92%<br />
State<br />
Target<br />
LEA<br />
Rate<br />
Target<br />
Met by<br />
LEA(Y/N)<br />
C) Use of Appropriate Behaviors<br />
to Meet Their Needs<br />
State<br />
Rate<br />
State<br />
Target<br />
LEA<br />
Rate<br />
Target<br />
Met by<br />
LEA(Y/N)<br />
89.61% 90.50% — — N/A 90.31% 90.50% — — N/A 90.82% 92.50% — — N/A<br />
66.58% 69.50% — — N/A 57.43% 60.50% — — N/A 76.69% 78.50% — — N/A<br />
NOTE: * Including social relationships ** Including early language/ communication and early literacy<br />
Note: - - denotes not applicable<br />
State<br />
Rate<br />
LEA<br />
Rate<br />
— —<br />
— —<br />
— —<br />
— —<br />
— —<br />
C) Use of<br />
Appropriate<br />
Behaviors to<br />
Meet Their Needs<br />
State<br />
Rate<br />
4.51%<br />
17.34%<br />
41.72%<br />
34.97%<br />
LEA<br />
Rate<br />
1.46% — —<br />
— —<br />
— —<br />
— —<br />
— —<br />
Page 3 of 5
LEA: 7311 - SEARCY SCHOOL <strong>DISTRICT</strong><br />
Indicator 08: Parent Involvement<br />
Percent of surveyed<br />
parents who reported<br />
school facilitated parent<br />
involvement as a means<br />
of improving services<br />
and results for children<br />
with disabilities.<br />
Early Childhood<br />
(3-5)<br />
School Age<br />
(5-21)<br />
State<br />
Rate<br />
90.47%<br />
95.05%<br />
Indicator 09: Disproportionality - Eligibility<br />
Disproportionate representation of racial<br />
and ethnic groups in special education and<br />
related services that is a result of<br />
inappropriate identification (e.g.<br />
monitoring data, review of policies,<br />
practices, and procedures under 618(d),<br />
etc.).<br />
State<br />
Rate<br />
State<br />
Target<br />
88.00%<br />
96.00%<br />
State<br />
Target<br />
0.00% 0.00%<br />
LEA<br />
Rate<br />
— —<br />
97.20%<br />
Indicator 10: Disproportionality-Child with a Disability<br />
Disproportionate representation of racial<br />
and ethnic groups in specific disability<br />
categories that is a result of inappropriate<br />
identification (e.g. monitoring data, review<br />
of policies, practices, and procedures under<br />
618(d), etc.).<br />
Indicator 11: Child Find<br />
Percent of children with<br />
parental consent to evaluate<br />
who are evaluated within<br />
the State established timeline<br />
of 60 days.<br />
Overall<br />
(3-21)<br />
Early Childhood<br />
(3-5)<br />
School Age<br />
(5-21)<br />
State<br />
Rate<br />
0.00%<br />
Indicator 12: Early Childhood Transition<br />
Percent of children referred by Part C prior to<br />
age 3, who are found eligible for Part B, and<br />
who have an IEP developed and implemented<br />
by their third birthday.<br />
Note: - - denotes not applicable<br />
State<br />
Rate<br />
99.41%<br />
99.70%<br />
98.97%<br />
State<br />
Rate<br />
State<br />
Target<br />
0.00%<br />
State<br />
Target<br />
100.00%<br />
100.00%<br />
100.00%<br />
State<br />
Target<br />
Target Met by<br />
LEA (Y/N)<br />
Y<br />
Target Met by<br />
LEA (Y/N)<br />
Y<br />
LEA<br />
Rate<br />
100.00%<br />
— —<br />
100.00%<br />
LEA<br />
Rate<br />
Target Met by<br />
LEA (Y/N)<br />
N/A<br />
Y<br />
Note: The target for Indicator 09 is to have zero percent<br />
(0%) of districts identified as having disproportionate<br />
representation as a result of inappropriate<br />
identification in eligibility.<br />
Note: The target for Indicator 10 is to have zero<br />
percent (0%) of districts identified as having<br />
disproportionate representation as a result of<br />
inappropriate identification in a disability<br />
category.<br />
Target Met by<br />
LEA (Y/N)<br />
N/A<br />
Y<br />
Target Met<br />
by LEA<br />
(Y/N)<br />
99.21% 100.00% - - N/A<br />
Y<br />
Note: * Indicates a zero reponse rate for the<br />
district.<br />
Page 4 of 5
LEA: 7311 - SEARCY SCHOOL <strong>DISTRICT</strong><br />
Indicator 13: Secondary Transition<br />
Percent of youth with disabilities aged 16 and<br />
up with an IEP that includes coordinated,<br />
measurable, annual IEP goals and transition<br />
services that will reasonably enable the student<br />
to meet the post-secondary goals.<br />
Indicator 14: Post-School Outcomes<br />
A. Percent of youth enrolled in higher<br />
education within one year of leaving high<br />
school.<br />
State<br />
Rate<br />
State<br />
Target<br />
Note: Data for this Indicator is from the on-site monitoring of LEAs for the given year.<br />
B. Percent of youth enrolled in higher<br />
education or competitively employed<br />
within one year of leaving high school.<br />
C. Percent of youth enrolled in higher<br />
education or in some other postsecondary<br />
education or training program; or<br />
competitively employed or in some other<br />
employment within one year of leaving<br />
high school.<br />
State<br />
Rate<br />
Indicator 20: Reported Data-Timely and Accurate*<br />
District submitted<br />
required data elements<br />
on or before due dates;<br />
made revisions within<br />
the alloted reveiw<br />
periods.<br />
Accurate and Timely<br />
Data Submission<br />
Overall (3-21)<br />
Early Childhood (3-5)<br />
School Age (5-21)<br />
State<br />
Target<br />
100.00%<br />
100.00%<br />
100.00%<br />
State<br />
Target<br />
LEA<br />
Rate<br />
LEA<br />
Rate<br />
Target Met by<br />
LEA (Y/N)<br />
Target Met<br />
by LEA<br />
(Y/N)<br />
Target Met<br />
by LEA<br />
(Y/N)<br />
*Data reviewed for timely and accurate submissions included all APSCN cycle data except for personnel<br />
Note: - - denotes not applicable<br />
96.19 100.00 100.00% Y<br />
14.53<br />
State<br />
Rate<br />
49.42<br />
State<br />
Rate<br />
54.07<br />
13.00<br />
State<br />
Target<br />
49.00<br />
State<br />
Target<br />
60.00<br />
Y<br />
N/A<br />
Y<br />
— —<br />
LEA<br />
Rate<br />
— —<br />
LEA<br />
Rate<br />
— —<br />
N/A<br />
Target Met<br />
by LEA<br />
(Y/N)<br />
N/A<br />
Target Met<br />
by LEA<br />
(Y/N)<br />
N/A<br />
Page 5 of 5
<strong>ARKANSAS</strong> <strong>SPECIAL</strong> <strong>EDUCATION</strong><br />
<strong>DISTRICT</strong> <strong>ANNUAL</strong> PERFORMANCE REPORT<br />
2010/11 School Year<br />
Publication Date: March 2012<br />
Each State must have in place a State Performance Plan (SPP) to evaluate the State's efforts to meet the requirements and<br />
purposes of the implementation of the Individuals with Disabilities Education Act (IDEA). The SPP is a six-year plan, which<br />
describes Arkansas's performance on 20 indicators. The Office of Special Education Programs in the U. S. Department of<br />
Education requires that States report annually to the public on the performance of each local education agency (LEA) on 14 of<br />
20 indicators as compared with targets established by the State in the SPP. Arkansas will report indicators 1 through 14 and<br />
20 for each LEA serving children with disabilities (CWD). Any LEA not meeting targets on compliance indicators (0% for<br />
Indicators 4B, 09 & 10 and 100% for Indicators 11, 12, 13, and 20) are non-compliant with IDEA.<br />
There are no report changes for the 2010/11 school year profile; However, it is important to recognize that: .<br />
1. Indicator 01 (Graduation) is reported a year in arrear (2009/10 graduates) and is based on a four-year cohort. This<br />
means the rate is a measure of students who entered in ninth grade and graduate in four years. The calculation is a<br />
requirement under Title I of the Elementary and Secondary Education Act (ESEA).<br />
2. Indicator 02 (Drop out) is reported a year in arrear. This means the rate is a measure of students who dropped out in<br />
the 2009/10 school year. The Indicator 02 data are aligned with the Common Core of Data (CCD) requirements for<br />
grades 7-12.<br />
3. Indicator 04A and 4B (Suspension/Expulsion) is reported a year in arrear. This means the rate is a measure of<br />
students who had out-of-school suspensions and/or expulsions totaling more than 10 days.<br />
For a complete description of all the Indicators, please visit the special education website at<br />
http://arksped.k12.ar.us/sections/policy.html<br />
LEA: 7320 - WILBUR D. MILLS <strong>EDUCATION</strong> SERVICE CO-OP<br />
Indicator 01: Graduation Rates (2009/10 school year) Indicator 02: Dropout Rates (2009/10 school year)<br />
Percent of youth<br />
with IEPs<br />
graduating from<br />
high school with a<br />
regular diploma<br />
State<br />
Rate<br />
State<br />
Target<br />
75.76% 85.00%<br />
LEA<br />
Rate<br />
— —<br />
Target Met<br />
by LEA<br />
(Y/N)<br />
NA<br />
Percent of<br />
youth with<br />
IEPs dropping<br />
out of high<br />
school<br />
State<br />
Rate<br />
Indicator 03: Assessment on Statewide Benchmark Exam (grades 3-8, 11)<br />
A) Adequate Yearly Progress<br />
n=40<br />
Literacy<br />
Mathematics<br />
Met Disability Subgroup "n"<br />
for Reporting Purposes (Y/N)<br />
State Target for % of Districts Meeting<br />
AYP for Disability Subgroup<br />
State<br />
Target<br />
3.06% 4.20%<br />
LEA<br />
Rate<br />
— —<br />
% of Districts Meeting AYP<br />
for Disability Subgroup<br />
Target Met by<br />
LEA (Y/N)<br />
N/A<br />
Target Met by<br />
LEA(Y/N)<br />
Overall N/A 17.15% 6.25%<br />
N/A<br />
N/A<br />
N/A<br />
Note: For a district to qualify as having a disability subgroup it must have a minimum of 40 (n=40) students with disabilities in a school building.<br />
B) Participation<br />
Participation Rate: # of<br />
CWD Tested ÷ # of CWD<br />
Enrolled in grades tested.<br />
Participation Rate: Literacy<br />
Participation Rate: Math<br />
Note: - - denotes not applicable<br />
State<br />
Rate<br />
98.78%<br />
State<br />
Target<br />
95.00%<br />
LEA<br />
Rate<br />
— —<br />
Target Met<br />
by LEA (Y/N)<br />
N/A<br />
98.61% 95.00% — — N/A<br />
C) Performance Proficiency<br />
Percent of CWD Scoring<br />
Proficient or Above<br />
Proficiency Rate: Literacy<br />
Proficiency Rate:<br />
Mathematics<br />
16.00%<br />
16.00%<br />
State<br />
Rate<br />
31.49%<br />
44.86%<br />
State<br />
Target<br />
45.22%<br />
51.14%<br />
LEA<br />
Rate<br />
— —<br />
— —<br />
N/A<br />
N/A<br />
Target<br />
Met by<br />
LEA (Y/N)<br />
N/A<br />
N/A<br />
Page 1 of 5
LEA: 7320 - WILBUR D. MILLS <strong>EDUCATION</strong> SERVICE CO-OP<br />
Indicator 04: Out-of-School Suspensions and Expulsions (2009/10 school year)<br />
A) Suspension/Expulsion<br />
Percent difference of CWD with out-of- school suspensions and<br />
expulsions totaling greater than 10 days in a school year as<br />
compared to the same data for general education students in<br />
the district.<br />
B) Suspension/Expulsion by Race and Ethnicity<br />
Percent of districts that have: (a) a significant discrepancy, by race or<br />
ethnicity, in the rate of suspensions and expulsions of greater than 10<br />
days in a school year for children with IEPs; and (b) policies,<br />
procedures or practices that contribute to the significant discrepancy<br />
and do not comply with requirements relating to the development<br />
and implementation of IEPs, the use of positive behavioral<br />
interventions and supports, and procedural safeguards.<br />
Indicator 05: School Age (5-21) Least Restrictive Environment<br />
A) In the Regular Class 80% or more of the day<br />
Percent of CWD with<br />
IEPs receiving instruction<br />
in the regular class 80%<br />
or more of the day.<br />
State<br />
Rate<br />
State<br />
Target<br />
LEA<br />
Rate<br />
B) In the Regular Class less than 40% of the day<br />
Percent of CWD with<br />
IEPs receiving instruction<br />
in the regular class less<br />
than 60% of the day.<br />
53.87% 59.77%<br />
State<br />
Rate<br />
State<br />
Target<br />
12.42% 12.51%<br />
— —<br />
LEA<br />
Rate<br />
— —<br />
C) Other Settings outside the regular class<br />
Percent of CWD with IEPs served in<br />
public or private separate schools,<br />
residential placements, or<br />
homebound/hospital placements.<br />
State<br />
Rate<br />
State<br />
Target<br />
2.80% 2.56%<br />
Target Met<br />
by LEA (Y/N)<br />
N/A<br />
Target Met<br />
by LEA (Y/N)<br />
N/A<br />
LEA<br />
Rate<br />
— —<br />
Target Met<br />
by LEA(Y/N)<br />
N/A<br />
Indicator 06: Early Childhood (3-5) Least Restrictive Environment<br />
A) Regular Early Childhood Program<br />
Percent of children (aged 3 through 5) with IEPs attending a regular<br />
early childhood program and receiving the majority of special<br />
education and related services in the regular early childhood program<br />
Allowable<br />
Difference<br />
LEA: 7320 - WILBUR D. MILLS <strong>EDUCATION</strong> SERVICE CO-OP<br />
Indicator 07: Preschool (3-5) Outcomes<br />
a) Percent of preschool CWD<br />
children who did not<br />
improve functioning.<br />
b) Percent of preschool CWD<br />
who improved but whose<br />
functioning remained below<br />
same age peers.<br />
c) Percent of preschool CWD<br />
who improved at a level<br />
nearer to same aged peers.<br />
d) Percent of preschool CWD<br />
who improved functioning to<br />
reach a level comparable to<br />
same age peers.<br />
e) Percent of preschool CWD<br />
children who maintain<br />
functioning at a level<br />
comparable to same aged<br />
peers.<br />
Summary<br />
Statements<br />
1) Of those preschool<br />
children who entered<br />
the preschool program<br />
below age expectations<br />
in each Outcome, the<br />
percent who<br />
substantially increased<br />
their rate of growth by<br />
the time they turned 6<br />
years of age or exited<br />
the program.<br />
2) The percent of<br />
preschool children who<br />
were functioning<br />
within age expectations<br />
in each Outcome by the<br />
time they turned 6<br />
years of age or exited<br />
A) Positive Social -Emotional<br />
Skills*<br />
State<br />
Rate<br />
A) Positive Social -<br />
Emotional Skills<br />
(Including social<br />
relationships)<br />
State<br />
Rate<br />
2.14%<br />
5.31%<br />
25.97%<br />
38.22%<br />
28.36%<br />
State<br />
Target<br />
LEA<br />
Rate<br />
LEA<br />
Rate<br />
— —<br />
9.05%<br />
11.56%<br />
45.73%<br />
33.67%<br />
Target<br />
Met by<br />
LEA(Y/N)<br />
B) Acquisition and Use of<br />
Knowledge and Skills<br />
(Including early language/<br />
communication and early literacy)<br />
B) Acquisition and Use of<br />
Knowledge and Skills **<br />
State<br />
Rate<br />
1.75%<br />
6.59%<br />
34.23%<br />
43.51%<br />
13.92%<br />
State<br />
Target<br />
LEA<br />
Rate<br />
Target<br />
Met by<br />
LEA(Y/N)<br />
C) Use of Appropriate Behaviors<br />
to Meet Their Needs<br />
State<br />
Rate<br />
State<br />
Target<br />
LEA<br />
Rate<br />
Target<br />
Met by<br />
LEA(Y/N)<br />
89.61% 90.50% 86.36% N 90.31% 90.50% 89.00% N 90.82% 92.50% 90.43% N<br />
66.58% 69.50% 79.40% Y 57.43% 60.50% 84.42% Y 76.69% 78.50% 89.95% Y<br />
NOTE: * Including social relationships ** Including early language/ communication and early literacy<br />
Note: - - denotes not applicable<br />
State<br />
Rate<br />
LEA<br />
Rate<br />
— —<br />
5.53%<br />
10.05%<br />
34.67%<br />
49.75%<br />
C) Use of<br />
Appropriate<br />
Behaviors to<br />
Meet Their Needs<br />
State<br />
Rate<br />
4.51%<br />
17.34%<br />
41.72%<br />
34.97%<br />
LEA<br />
Rate<br />
1.46% — —<br />
4.52%<br />
5.53%<br />
37.19%<br />
52.76%<br />
Page 3 of 5
LEA: 7320 - WILBUR D. MILLS <strong>EDUCATION</strong> SERVICE CO-OP<br />
Indicator 08: Parent Involvement<br />
Percent of surveyed<br />
parents who reported<br />
school facilitated parent<br />
involvement as a means<br />
of improving services<br />
and results for children<br />
with disabilities.<br />
Early Childhood<br />
(3-5)<br />
School Age<br />
(5-21)<br />
State<br />
Rate<br />
90.47%<br />
95.05%<br />
Indicator 09: Disproportionality - Eligibility<br />
Disproportionate representation of racial<br />
and ethnic groups in special education and<br />
related services that is a result of<br />
inappropriate identification (e.g.<br />
monitoring data, review of policies,<br />
practices, and procedures under 618(d),<br />
etc.).<br />
State<br />
Rate<br />
State<br />
Target<br />
88.00%<br />
96.00%<br />
State<br />
Target<br />
0.00% 0.00%<br />
LEA<br />
Rate<br />
94.29%<br />
— —<br />
Indicator 10: Disproportionality-Child with a Disability<br />
Disproportionate representation of racial<br />
and ethnic groups in specific disability<br />
categories that is a result of inappropriate<br />
identification (e.g. monitoring data, review<br />
of policies, practices, and procedures under<br />
618(d), etc.).<br />
Indicator 11: Child Find<br />
Percent of children with<br />
parental consent to evaluate<br />
who are evaluated within<br />
the State established timeline<br />
of 60 days.<br />
Overall<br />
(3-21)<br />
Early Childhood<br />
(3-5)<br />
School Age<br />
(5-21)<br />
State<br />
Rate<br />
0.00%<br />
Indicator 12: Early Childhood Transition<br />
Percent of children referred by Part C prior to<br />
age 3, who are found eligible for Part B, and<br />
who have an IEP developed and implemented<br />
by their third birthday.<br />
Note: - - denotes not applicable<br />
State<br />
Rate<br />
99.41%<br />
99.70%<br />
98.97%<br />
State<br />
Rate<br />
State<br />
Target<br />
0.00%<br />
State<br />
Target<br />
100.00%<br />
100.00%<br />
100.00%<br />
State<br />
Target<br />
Target Met by<br />
LEA (Y/N)<br />
N/A<br />
Target Met by<br />
LEA (Y/N)<br />
N/A<br />
LEA<br />
Rate<br />
99.77%<br />
99.77%<br />
— —<br />
LEA<br />
Rate<br />
Target Met by<br />
LEA (Y/N)<br />
Y<br />
N/A<br />
Note: The target for Indicator 09 is to have zero percent<br />
(0%) of districts identified as having disproportionate<br />
representation as a result of inappropriate<br />
identification in eligibility.<br />
Note: The target for Indicator 10 is to have zero<br />
percent (0%) of districts identified as having<br />
disproportionate representation as a result of<br />
inappropriate identification in a disability<br />
category.<br />
Target Met by<br />
LEA (Y/N)<br />
N<br />
N/A<br />
Target Met<br />
by LEA<br />
(Y/N)<br />
99.21% 100.00% - - N/A<br />
N<br />
Note: * Indicates a zero reponse rate for the<br />
district.<br />
Page 4 of 5
LEA: 7320 - WILBUR D. MILLS <strong>EDUCATION</strong> SERVICE CO-OP<br />
Indicator 13: Secondary Transition<br />
Percent of youth with disabilities aged 16 and<br />
up with an IEP that includes coordinated,<br />
measurable, annual IEP goals and transition<br />
services that will reasonably enable the student<br />
to meet the post-secondary goals.<br />
Indicator 14: Post-School Outcomes<br />
A. Percent of youth enrolled in higher<br />
education within one year of leaving high<br />
school.<br />
State<br />
Rate<br />
State<br />
Target<br />
Note: Data for this Indicator is from the on-site monitoring of LEAs for the given year.<br />
B. Percent of youth enrolled in higher<br />
education or competitively employed<br />
within one year of leaving high school.<br />
C. Percent of youth enrolled in higher<br />
education or in some other postsecondary<br />
education or training program; or<br />
competitively employed or in some other<br />
employment within one year of leaving<br />
high school.<br />
State<br />
Rate<br />
Indicator 20: Reported Data-Timely and Accurate*<br />
District submitted<br />
required data elements<br />
on or before due dates;<br />
made revisions within<br />
the alloted reveiw<br />
periods.<br />
Accurate and Timely<br />
Data Submission<br />
Overall (3-21)<br />
Early Childhood (3-5)<br />
School Age (5-21)<br />
State<br />
Target<br />
100.00%<br />
100.00%<br />
100.00%<br />
State<br />
Target<br />
LEA<br />
Rate<br />
LEA<br />
Rate<br />
Target Met by<br />
LEA (Y/N)<br />
Target Met<br />
by LEA<br />
(Y/N)<br />
Target Met<br />
by LEA<br />
(Y/N)<br />
*Data reviewed for timely and accurate submissions included all APSCN cycle data except for personnel<br />
Note: - - denotes not applicable<br />
96.19 100.00 — — N/A<br />
14.53<br />
State<br />
Rate<br />
49.42<br />
State<br />
Rate<br />
54.07<br />
13.00<br />
State<br />
Target<br />
49.00<br />
State<br />
Target<br />
60.00<br />
Y<br />
Y<br />
N/A<br />
— —<br />
LEA<br />
Rate<br />
— —<br />
LEA<br />
Rate<br />
— —<br />
N/A<br />
Target Met<br />
by LEA<br />
(Y/N)<br />
N/A<br />
Target Met<br />
by LEA<br />
(Y/N)<br />
N/A<br />
Page 5 of 5
LEA: 7401 - AUGUSTA SCHOOL <strong>DISTRICT</strong><br />
<strong>ARKANSAS</strong> <strong>SPECIAL</strong> <strong>EDUCATION</strong><br />
<strong>DISTRICT</strong> <strong>ANNUAL</strong> PERFORMANCE REPORT<br />
2010/11 School Year<br />
Publication Date: March 2012<br />
Each State must have in place a State Performance Plan (SPP) to evaluate the State's efforts to meet the requirements and<br />
purposes of the implementation of the Individuals with Disabilities Education Act (IDEA). The SPP is a six-year plan, which<br />
describes Arkansas's performance on 20 indicators. The Office of Special Education Programs in the U. S. Department of<br />
Education requires that States report annually to the public on the performance of each local education agency (LEA) on 14 of<br />
20 indicators as compared with targets established by the State in the SPP. Arkansas will report indicators 1 through 14 and<br />
20 for each LEA serving children with disabilities (CWD). Any LEA not meeting targets on compliance indicators (0% for<br />
Indicators 4B, 09 & 10 and 100% for Indicators 11, 12, 13, and 20) are non-compliant with IDEA.<br />
There are no report changes for the 2010/11 school year profile; However, it is important to recognize that: .<br />
1. Indicator 01 (Graduation) is reported a year in arrear (2009/10 graduates) and is based on a four-year cohort. This<br />
means the rate is a measure of students who entered in ninth grade and graduate in four years. The calculation is a<br />
requirement under Title I of the Elementary and Secondary Education Act (ESEA).<br />
2. Indicator 02 (Drop out) is reported a year in arrear. This means the rate is a measure of students who dropped out in<br />
the 2009/10 school year. The Indicator 02 data are aligned with the Common Core of Data (CCD) requirements for<br />
grades 7-12.<br />
3. Indicator 04A and 4B (Suspension/Expulsion) is reported a year in arrear. This means the rate is a measure of<br />
students who had out-of-school suspensions and/or expulsions totaling more than 10 days.<br />
Percent of youth<br />
with IEPs<br />
graduating from<br />
high school with a<br />
regular diploma<br />
For a complete description of all the Indicators, please visit the special education website at<br />
http://arksped.k12.ar.us/sections/policy.html<br />
Indicator 01: Graduation Rates (2009/10 school year) Indicator 02: Dropout Rates (2009/10 school year)<br />
State<br />
Rate<br />
State<br />
Target<br />
75.76% 85.00%<br />
LEA<br />
Rate<br />
100.00%<br />
Target Met<br />
by LEA<br />
(Y/N)<br />
Y<br />
Percent of<br />
youth with<br />
IEPs dropping<br />
out of high<br />
school<br />
State<br />
Rate<br />
Indicator 03: Assessment on Statewide Benchmark Exam (grades 3-8, 11)<br />
A) Adequate Yearly Progress<br />
n=40<br />
Literacy<br />
Mathematics<br />
Met Disability Subgroup "n"<br />
for Reporting Purposes (Y/N)<br />
State Target for % of Districts Meeting<br />
AYP for Disability Subgroup<br />
State<br />
Target<br />
3.06% 4.20%<br />
LEA<br />
Rate<br />
3.51%<br />
% of Districts Meeting AYP<br />
for Disability Subgroup<br />
Target Met by<br />
LEA (Y/N)<br />
Y<br />
Target Met by<br />
LEA(Y/N)<br />
Overall N 17.15% 6.25%<br />
NA<br />
N<br />
N<br />
Note: For a district to qualify as having a disability subgroup it must have a minimum of 40 (n=40) students with disabilities in a school building.<br />
B) Participation<br />
Participation Rate: # of<br />
CWD Tested ÷ # of CWD<br />
Enrolled in grades tested.<br />
Participation Rate: Literacy<br />
Participation Rate: Math<br />
Note: - - denotes not applicable<br />
State<br />
Rate<br />
98.78%<br />
State<br />
Target<br />
95.00%<br />
LEA<br />
Rate<br />
97.87%<br />
Target Met<br />
by LEA (Y/N)<br />
98.61% 95.00% 100.00% Y<br />
Y<br />
C) Performance Proficiency<br />
Percent of CWD Scoring<br />
Proficient or Above<br />
Proficiency Rate: Literacy<br />
Proficiency Rate:<br />
Mathematics<br />
16.00%<br />
16.00%<br />
State<br />
Rate<br />
31.49%<br />
44.86%<br />
State<br />
Target<br />
45.22%<br />
51.14%<br />
LEA<br />
Rate<br />
9.30%<br />
45.00%<br />
NA<br />
NA<br />
Target<br />
Met by<br />
LEA (Y/N)<br />
N<br />
N<br />
Page 1 of 5
LEA: 7401 - AUGUSTA SCHOOL <strong>DISTRICT</strong><br />
Indicator 04: Out-of-School Suspensions and Expulsions (2009/10 school year)<br />
A) Suspension/Expulsion<br />
Percent difference of CWD with out-of- school suspensions and<br />
expulsions totaling greater than 10 days in a school year as<br />
compared to the same data for general education students in<br />
the district.<br />
B) Suspension/Expulsion by Race and Ethnicity<br />
Percent of districts that have: (a) a significant discrepancy, by race or<br />
ethnicity, in the rate of suspensions and expulsions of greater than 10<br />
days in a school year for children with IEPs; and (b) policies,<br />
procedures or practices that contribute to the significant discrepancy<br />
and do not comply with requirements relating to the development<br />
and implementation of IEPs, the use of positive behavioral<br />
interventions and supports, and procedural safeguards.<br />
Indicator 05: School Age (5-21) Least Restrictive Environment<br />
A) In the Regular Class 80% or more of the day<br />
Percent of CWD with<br />
IEPs receiving instruction<br />
in the regular class 80%<br />
or more of the day.<br />
State<br />
Rate<br />
State<br />
Target<br />
LEA<br />
Rate<br />
B) In the Regular Class less than 40% of the day<br />
Percent of CWD with<br />
IEPs receiving instruction<br />
in the regular class less<br />
than 60% of the day.<br />
53.87% 59.77%<br />
State<br />
Rate<br />
State<br />
Target<br />
12.42% 12.51%<br />
62.35%<br />
LEA<br />
Rate<br />
10.59%<br />
C) Other Settings outside the regular class<br />
Percent of CWD with IEPs served in<br />
public or private separate schools,<br />
residential placements, or<br />
homebound/hospital placements.<br />
State<br />
Rate<br />
State<br />
Target<br />
2.80% 2.56%<br />
Target Met<br />
by LEA (Y/N)<br />
Y<br />
Target Met<br />
by LEA (Y/N)<br />
Y<br />
LEA<br />
Rate<br />
3.53%<br />
Target Met<br />
by LEA(Y/N)<br />
Indicator 06: Early Childhood (3-5) Least Restrictive Environment<br />
A) Regular Early Childhood Program<br />
Percent of children (aged 3 through 5) with IEPs attending a regular<br />
early childhood program and receiving the majority of special<br />
education and related services in the regular early childhood program<br />
Allowable<br />
Difference<br />
LEA: 7401 - AUGUSTA SCHOOL <strong>DISTRICT</strong><br />
Indicator 07: Preschool (3-5) Outcomes<br />
a) Percent of preschool CWD<br />
children who did not<br />
improve functioning.<br />
b) Percent of preschool CWD<br />
who improved but whose<br />
functioning remained below<br />
same age peers.<br />
c) Percent of preschool CWD<br />
who improved at a level<br />
nearer to same aged peers.<br />
d) Percent of preschool CWD<br />
who improved functioning to<br />
reach a level comparable to<br />
same age peers.<br />
e) Percent of preschool CWD<br />
children who maintain<br />
functioning at a level<br />
comparable to same aged<br />
peers.<br />
Summary<br />
Statements<br />
1) Of those preschool<br />
children who entered<br />
the preschool program<br />
below age expectations<br />
in each Outcome, the<br />
percent who<br />
substantially increased<br />
their rate of growth by<br />
the time they turned 6<br />
years of age or exited<br />
the program.<br />
2) The percent of<br />
preschool children who<br />
were functioning<br />
within age expectations<br />
in each Outcome by the<br />
time they turned 6<br />
years of age or exited<br />
A) Positive Social -Emotional<br />
Skills*<br />
State<br />
Rate<br />
A) Positive Social -<br />
Emotional Skills<br />
(Including social<br />
relationships)<br />
State<br />
Rate<br />
2.14%<br />
5.31%<br />
25.97%<br />
38.22%<br />
28.36%<br />
State<br />
Target<br />
LEA<br />
Rate<br />
LEA<br />
Rate<br />
— —<br />
— —<br />
— —<br />
— —<br />
— —<br />
Target<br />
Met by<br />
LEA(Y/N)<br />
B) Acquisition and Use of<br />
Knowledge and Skills<br />
(Including early language/<br />
communication and early literacy)<br />
B) Acquisition and Use of<br />
Knowledge and Skills **<br />
State<br />
Rate<br />
1.75%<br />
6.59%<br />
34.23%<br />
43.51%<br />
13.92%<br />
State<br />
Target<br />
LEA<br />
Rate<br />
Target<br />
Met by<br />
LEA(Y/N)<br />
C) Use of Appropriate Behaviors<br />
to Meet Their Needs<br />
State<br />
Rate<br />
State<br />
Target<br />
LEA<br />
Rate<br />
Target<br />
Met by<br />
LEA(Y/N)<br />
89.61% 90.50% — — N/A 90.31% 90.50% — — N/A 90.82% 92.50% — — N/A<br />
66.58% 69.50% — — N/A 57.43% 60.50% — — N/A 76.69% 78.50% — — N/A<br />
NOTE: * Including social relationships ** Including early language/ communication and early literacy<br />
Note: - - denotes not applicable<br />
State<br />
Rate<br />
LEA<br />
Rate<br />
— —<br />
— —<br />
— —<br />
— —<br />
— —<br />
C) Use of<br />
Appropriate<br />
Behaviors to<br />
Meet Their Needs<br />
State<br />
Rate<br />
4.51%<br />
17.34%<br />
41.72%<br />
34.97%<br />
LEA<br />
Rate<br />
1.46% — —<br />
— —<br />
— —<br />
— —<br />
— —<br />
Page 3 of 5
LEA: 7401 - AUGUSTA SCHOOL <strong>DISTRICT</strong><br />
Indicator 08: Parent Involvement<br />
Percent of surveyed<br />
parents who reported<br />
school facilitated parent<br />
involvement as a means<br />
of improving services<br />
and results for children<br />
with disabilities.<br />
Early Childhood<br />
(3-5)<br />
School Age<br />
(5-21)<br />
State<br />
Rate<br />
90.47%<br />
95.05%<br />
Indicator 09: Disproportionality - Eligibility<br />
Disproportionate representation of racial<br />
and ethnic groups in special education and<br />
related services that is a result of<br />
inappropriate identification (e.g.<br />
monitoring data, review of policies,<br />
practices, and procedures under 618(d),<br />
etc.).<br />
State<br />
Rate<br />
State<br />
Target<br />
88.00%<br />
96.00%<br />
State<br />
Target<br />
0.00% 0.00%<br />
LEA<br />
Rate<br />
— —<br />
— —<br />
Indicator 10: Disproportionality-Child with a Disability<br />
Disproportionate representation of racial<br />
and ethnic groups in specific disability<br />
categories that is a result of inappropriate<br />
identification (e.g. monitoring data, review<br />
of policies, practices, and procedures under<br />
618(d), etc.).<br />
Indicator 11: Child Find<br />
Percent of children with<br />
parental consent to evaluate<br />
who are evaluated within<br />
the State established timeline<br />
of 60 days.<br />
Overall<br />
(3-21)<br />
Early Childhood<br />
(3-5)<br />
School Age<br />
(5-21)<br />
State<br />
Rate<br />
0.00%<br />
Indicator 12: Early Childhood Transition<br />
Percent of children referred by Part C prior to<br />
age 3, who are found eligible for Part B, and<br />
who have an IEP developed and implemented<br />
by their third birthday.<br />
Note: - - denotes not applicable<br />
State<br />
Rate<br />
99.41%<br />
99.70%<br />
98.97%<br />
State<br />
Rate<br />
State<br />
Target<br />
0.00%<br />
State<br />
Target<br />
100.00%<br />
100.00%<br />
100.00%<br />
State<br />
Target<br />
Target Met by<br />
LEA (Y/N)<br />
Y<br />
Target Met by<br />
LEA (Y/N)<br />
Y<br />
LEA<br />
Rate<br />
100.00%<br />
— —<br />
100.00%<br />
LEA<br />
Rate<br />
Target Met by<br />
LEA (Y/N)<br />
N/A<br />
N<br />
Note: The target for Indicator 09 is to have zero percent<br />
(0%) of districts identified as having disproportionate<br />
representation as a result of inappropriate<br />
identification in eligibility.<br />
Note: The target for Indicator 10 is to have zero<br />
percent (0%) of districts identified as having<br />
disproportionate representation as a result of<br />
inappropriate identification in a disability<br />
category.<br />
Target Met by<br />
LEA (Y/N)<br />
N/A<br />
Y<br />
Target Met<br />
by LEA<br />
(Y/N)<br />
99.21% 100.00% - - N/A<br />
Y<br />
Note: * Indicates a zero reponse rate for the<br />
district.<br />
Page 4 of 5
LEA: 7401 - AUGUSTA SCHOOL <strong>DISTRICT</strong><br />
Indicator 13: Secondary Transition<br />
Percent of youth with disabilities aged 16 and<br />
up with an IEP that includes coordinated,<br />
measurable, annual IEP goals and transition<br />
services that will reasonably enable the student<br />
to meet the post-secondary goals.<br />
Indicator 14: Post-School Outcomes<br />
A. Percent of youth enrolled in higher<br />
education within one year of leaving high<br />
school.<br />
State<br />
Rate<br />
State<br />
Target<br />
Note: Data for this Indicator is from the on-site monitoring of LEAs for the given year.<br />
B. Percent of youth enrolled in higher<br />
education or competitively employed<br />
within one year of leaving high school.<br />
C. Percent of youth enrolled in higher<br />
education or in some other postsecondary<br />
education or training program; or<br />
competitively employed or in some other<br />
employment within one year of leaving<br />
high school.<br />
State<br />
Rate<br />
Indicator 20: Reported Data-Timely and Accurate*<br />
District submitted<br />
required data elements<br />
on or before due dates;<br />
made revisions within<br />
the alloted reveiw<br />
periods.<br />
Accurate and Timely<br />
Data Submission<br />
Overall (3-21)<br />
Early Childhood (3-5)<br />
School Age (5-21)<br />
State<br />
Target<br />
100.00%<br />
100.00%<br />
100.00%<br />
State<br />
Target<br />
LEA<br />
Rate<br />
LEA<br />
Rate<br />
Target Met by<br />
LEA (Y/N)<br />
Target Met<br />
by LEA<br />
(Y/N)<br />
Target Met<br />
by LEA<br />
(Y/N)<br />
*Data reviewed for timely and accurate submissions included all APSCN cycle data except for personnel<br />
Note: - - denotes not applicable<br />
96.19 100.00 — — N/A<br />
14.53<br />
State<br />
Rate<br />
49.42<br />
State<br />
Rate<br />
54.07<br />
13.00<br />
State<br />
Target<br />
49.00<br />
State<br />
Target<br />
60.00<br />
Y<br />
Y<br />
Y<br />
25.00%<br />
LEA<br />
Rate<br />
100.00%<br />
LEA<br />
Rate<br />
100.00%<br />
Y<br />
Target Met<br />
by LEA<br />
(Y/N)<br />
Y<br />
Target Met<br />
by LEA<br />
(Y/N)<br />
Y<br />
Page 5 of 5
LEA: 7403 - MCCRORY SCHOOL <strong>DISTRICT</strong><br />
<strong>ARKANSAS</strong> <strong>SPECIAL</strong> <strong>EDUCATION</strong><br />
<strong>DISTRICT</strong> <strong>ANNUAL</strong> PERFORMANCE REPORT<br />
2010/11 School Year<br />
Publication Date: March 2012<br />
Each State must have in place a State Performance Plan (SPP) to evaluate the State's efforts to meet the requirements and<br />
purposes of the implementation of the Individuals with Disabilities Education Act (IDEA). The SPP is a six-year plan, which<br />
describes Arkansas's performance on 20 indicators. The Office of Special Education Programs in the U. S. Department of<br />
Education requires that States report annually to the public on the performance of each local education agency (LEA) on 14 of<br />
20 indicators as compared with targets established by the State in the SPP. Arkansas will report indicators 1 through 14 and<br />
20 for each LEA serving children with disabilities (CWD). Any LEA not meeting targets on compliance indicators (0% for<br />
Indicators 4B, 09 & 10 and 100% for Indicators 11, 12, 13, and 20) are non-compliant with IDEA.<br />
There are no report changes for the 2010/11 school year profile; However, it is important to recognize that: .<br />
1. Indicator 01 (Graduation) is reported a year in arrear (2009/10 graduates) and is based on a four-year cohort. This<br />
means the rate is a measure of students who entered in ninth grade and graduate in four years. The calculation is a<br />
requirement under Title I of the Elementary and Secondary Education Act (ESEA).<br />
2. Indicator 02 (Drop out) is reported a year in arrear. This means the rate is a measure of students who dropped out in<br />
the 2009/10 school year. The Indicator 02 data are aligned with the Common Core of Data (CCD) requirements for<br />
grades 7-12.<br />
3. Indicator 04A and 4B (Suspension/Expulsion) is reported a year in arrear. This means the rate is a measure of<br />
students who had out-of-school suspensions and/or expulsions totaling more than 10 days.<br />
Percent of youth<br />
with IEPs<br />
graduating from<br />
high school with a<br />
regular diploma<br />
For a complete description of all the Indicators, please visit the special education website at<br />
http://arksped.k12.ar.us/sections/policy.html<br />
Indicator 01: Graduation Rates (2009/10 school year) Indicator 02: Dropout Rates (2009/10 school year)<br />
State<br />
Rate<br />
State<br />
Target<br />
75.76% 85.00%<br />
LEA<br />
Rate<br />
77.78%<br />
Target Met<br />
by LEA<br />
(Y/N)<br />
N<br />
Percent of<br />
youth with<br />
IEPs dropping<br />
out of high<br />
school<br />
State<br />
Rate<br />
Indicator 03: Assessment on Statewide Benchmark Exam (grades 3-8, 11)<br />
A) Adequate Yearly Progress<br />
n=40<br />
Literacy<br />
Mathematics<br />
Met Disability Subgroup "n"<br />
for Reporting Purposes (Y/N)<br />
State Target for % of Districts Meeting<br />
AYP for Disability Subgroup<br />
State<br />
Target<br />
3.06% 4.20%<br />
LEA<br />
Rate<br />
5.45%<br />
% of Districts Meeting AYP<br />
for Disability Subgroup<br />
Target Met by<br />
LEA (Y/N)<br />
N<br />
Target Met by<br />
LEA(Y/N)<br />
Overall N 17.15% 6.25%<br />
NA<br />
N<br />
N<br />
Note: For a district to qualify as having a disability subgroup it must have a minimum of 40 (n=40) students with disabilities in a school building.<br />
B) Participation<br />
Participation Rate: # of<br />
CWD Tested ÷ # of CWD<br />
Enrolled in grades tested.<br />
Participation Rate: Literacy<br />
Participation Rate: Math<br />
Note: - - denotes not applicable<br />
State<br />
Rate<br />
98.78%<br />
State<br />
Target<br />
95.00%<br />
LEA<br />
Rate<br />
100.00%<br />
Target Met<br />
by LEA (Y/N)<br />
98.61% 95.00% 100.00% Y<br />
Y<br />
C) Performance Proficiency<br />
Percent of CWD Scoring<br />
Proficient or Above<br />
Proficiency Rate: Literacy<br />
Proficiency Rate:<br />
Mathematics<br />
16.00%<br />
16.00%<br />
State<br />
Rate<br />
31.49%<br />
44.86%<br />
State<br />
Target<br />
45.22%<br />
51.14%<br />
LEA<br />
Rate<br />
19.61%<br />
32.65%<br />
NA<br />
NA<br />
Target<br />
Met by<br />
LEA (Y/N)<br />
N<br />
N<br />
Page 1 of 5
LEA: 7403 - MCCRORY SCHOOL <strong>DISTRICT</strong><br />
Indicator 04: Out-of-School Suspensions and Expulsions (2009/10 school year)<br />
A) Suspension/Expulsion<br />
Percent difference of CWD with out-of- school suspensions and<br />
expulsions totaling greater than 10 days in a school year as<br />
compared to the same data for general education students in<br />
the district.<br />
B) Suspension/Expulsion by Race and Ethnicity<br />
Percent of districts that have: (a) a significant discrepancy, by race or<br />
ethnicity, in the rate of suspensions and expulsions of greater than 10<br />
days in a school year for children with IEPs; and (b) policies,<br />
procedures or practices that contribute to the significant discrepancy<br />
and do not comply with requirements relating to the development<br />
and implementation of IEPs, the use of positive behavioral<br />
interventions and supports, and procedural safeguards.<br />
Indicator 05: School Age (5-21) Least Restrictive Environment<br />
A) In the Regular Class 80% or more of the day<br />
Percent of CWD with<br />
IEPs receiving instruction<br />
in the regular class 80%<br />
or more of the day.<br />
State<br />
Rate<br />
State<br />
Target<br />
LEA<br />
Rate<br />
B) In the Regular Class less than 40% of the day<br />
Percent of CWD with<br />
IEPs receiving instruction<br />
in the regular class less<br />
than 60% of the day.<br />
53.87% 59.77%<br />
State<br />
Rate<br />
State<br />
Target<br />
12.42% 12.51%<br />
57.00%<br />
LEA<br />
Rate<br />
11.00%<br />
C) Other Settings outside the regular class<br />
Percent of CWD with IEPs served in<br />
public or private separate schools,<br />
residential placements, or<br />
homebound/hospital placements.<br />
State<br />
Rate<br />
State<br />
Target<br />
2.80% 2.56%<br />
Target Met<br />
by LEA (Y/N)<br />
N<br />
Target Met<br />
by LEA (Y/N)<br />
Y<br />
LEA<br />
Rate<br />
1.00%<br />
Target Met<br />
by LEA(Y/N)<br />
Indicator 06: Early Childhood (3-5) Least Restrictive Environment<br />
A) Regular Early Childhood Program<br />
Percent of children (aged 3 through 5) with IEPs attending a regular<br />
early childhood program and receiving the majority of special<br />
education and related services in the regular early childhood program<br />
Allowable<br />
Difference<br />
LEA: 7403 - MCCRORY SCHOOL <strong>DISTRICT</strong><br />
Indicator 07: Preschool (3-5) Outcomes<br />
a) Percent of preschool CWD<br />
children who did not<br />
improve functioning.<br />
b) Percent of preschool CWD<br />
who improved but whose<br />
functioning remained below<br />
same age peers.<br />
c) Percent of preschool CWD<br />
who improved at a level<br />
nearer to same aged peers.<br />
d) Percent of preschool CWD<br />
who improved functioning to<br />
reach a level comparable to<br />
same age peers.<br />
e) Percent of preschool CWD<br />
children who maintain<br />
functioning at a level<br />
comparable to same aged<br />
peers.<br />
Summary<br />
Statements<br />
1) Of those preschool<br />
children who entered<br />
the preschool program<br />
below age expectations<br />
in each Outcome, the<br />
percent who<br />
substantially increased<br />
their rate of growth by<br />
the time they turned 6<br />
years of age or exited<br />
the program.<br />
2) The percent of<br />
preschool children who<br />
were functioning<br />
within age expectations<br />
in each Outcome by the<br />
time they turned 6<br />
years of age or exited<br />
A) Positive Social -Emotional<br />
Skills*<br />
State<br />
Rate<br />
A) Positive Social -<br />
Emotional Skills<br />
(Including social<br />
relationships)<br />
State<br />
Rate<br />
2.14%<br />
5.31%<br />
25.97%<br />
38.22%<br />
28.36%<br />
State<br />
Target<br />
LEA<br />
Rate<br />
LEA<br />
Rate<br />
— —<br />
— —<br />
— —<br />
— —<br />
— —<br />
Target<br />
Met by<br />
LEA(Y/N)<br />
B) Acquisition and Use of<br />
Knowledge and Skills<br />
(Including early language/<br />
communication and early literacy)<br />
B) Acquisition and Use of<br />
Knowledge and Skills **<br />
State<br />
Rate<br />
1.75%<br />
6.59%<br />
34.23%<br />
43.51%<br />
13.92%<br />
State<br />
Target<br />
LEA<br />
Rate<br />
Target<br />
Met by<br />
LEA(Y/N)<br />
C) Use of Appropriate Behaviors<br />
to Meet Their Needs<br />
State<br />
Rate<br />
State<br />
Target<br />
LEA<br />
Rate<br />
Target<br />
Met by<br />
LEA(Y/N)<br />
89.61% 90.50% — — N/A 90.31% 90.50% — — N/A 90.82% 92.50% — — N/A<br />
66.58% 69.50% — — N/A 57.43% 60.50% — — N/A 76.69% 78.50% — — N/A<br />
NOTE: * Including social relationships ** Including early language/ communication and early literacy<br />
Note: - - denotes not applicable<br />
State<br />
Rate<br />
LEA<br />
Rate<br />
— —<br />
— —<br />
— —<br />
— —<br />
— —<br />
C) Use of<br />
Appropriate<br />
Behaviors to<br />
Meet Their Needs<br />
State<br />
Rate<br />
4.51%<br />
17.34%<br />
41.72%<br />
34.97%<br />
LEA<br />
Rate<br />
1.46% — —<br />
— —<br />
— —<br />
— —<br />
— —<br />
Page 3 of 5
LEA: 7403 - MCCRORY SCHOOL <strong>DISTRICT</strong><br />
Indicator 08: Parent Involvement<br />
Percent of surveyed<br />
parents who reported<br />
school facilitated parent<br />
involvement as a means<br />
of improving services<br />
and results for children<br />
with disabilities.<br />
Early Childhood<br />
(3-5)<br />
School Age<br />
(5-21)<br />
State<br />
Rate<br />
90.47%<br />
95.05%<br />
Indicator 09: Disproportionality - Eligibility<br />
Disproportionate representation of racial<br />
and ethnic groups in special education and<br />
related services that is a result of<br />
inappropriate identification (e.g.<br />
monitoring data, review of policies,<br />
practices, and procedures under 618(d),<br />
etc.).<br />
State<br />
Rate<br />
State<br />
Target<br />
88.00%<br />
96.00%<br />
State<br />
Target<br />
0.00% 0.00%<br />
LEA<br />
Rate<br />
— —<br />
— —<br />
Indicator 10: Disproportionality-Child with a Disability<br />
Disproportionate representation of racial<br />
and ethnic groups in specific disability<br />
categories that is a result of inappropriate<br />
identification (e.g. monitoring data, review<br />
of policies, practices, and procedures under<br />
618(d), etc.).<br />
Indicator 11: Child Find<br />
Percent of children with<br />
parental consent to evaluate<br />
who are evaluated within<br />
the State established timeline<br />
of 60 days.<br />
Overall<br />
(3-21)<br />
Early Childhood<br />
(3-5)<br />
School Age<br />
(5-21)<br />
State<br />
Rate<br />
0.00%<br />
Indicator 12: Early Childhood Transition<br />
Percent of children referred by Part C prior to<br />
age 3, who are found eligible for Part B, and<br />
who have an IEP developed and implemented<br />
by their third birthday.<br />
Note: - - denotes not applicable<br />
State<br />
Rate<br />
99.41%<br />
99.70%<br />
98.97%<br />
State<br />
Rate<br />
State<br />
Target<br />
0.00%<br />
State<br />
Target<br />
100.00%<br />
100.00%<br />
100.00%<br />
State<br />
Target<br />
Target Met by<br />
LEA (Y/N)<br />
Y<br />
Target Met by<br />
LEA (Y/N)<br />
Y<br />
LEA<br />
Rate<br />
100.00%<br />
— —<br />
100.00%<br />
LEA<br />
Rate<br />
Target Met by<br />
LEA (Y/N)<br />
N/A<br />
N<br />
Note: The target for Indicator 09 is to have zero percent<br />
(0%) of districts identified as having disproportionate<br />
representation as a result of inappropriate<br />
identification in eligibility.<br />
Note: The target for Indicator 10 is to have zero<br />
percent (0%) of districts identified as having<br />
disproportionate representation as a result of<br />
inappropriate identification in a disability<br />
category.<br />
Target Met by<br />
LEA (Y/N)<br />
N/A<br />
Y<br />
Target Met<br />
by LEA<br />
(Y/N)<br />
99.21% 100.00% - - N/A<br />
Y<br />
Note: * Indicates a zero reponse rate for the<br />
district.<br />
Page 4 of 5
LEA: 7403 - MCCRORY SCHOOL <strong>DISTRICT</strong><br />
Indicator 13: Secondary Transition<br />
Percent of youth with disabilities aged 16 and<br />
up with an IEP that includes coordinated,<br />
measurable, annual IEP goals and transition<br />
services that will reasonably enable the student<br />
to meet the post-secondary goals.<br />
Indicator 14: Post-School Outcomes<br />
A. Percent of youth enrolled in higher<br />
education within one year of leaving high<br />
school.<br />
State<br />
Rate<br />
State<br />
Target<br />
Note: Data for this Indicator is from the on-site monitoring of LEAs for the given year.<br />
B. Percent of youth enrolled in higher<br />
education or competitively employed<br />
within one year of leaving high school.<br />
C. Percent of youth enrolled in higher<br />
education or in some other postsecondary<br />
education or training program; or<br />
competitively employed or in some other<br />
employment within one year of leaving<br />
high school.<br />
State<br />
Rate<br />
Indicator 20: Reported Data-Timely and Accurate*<br />
District submitted<br />
required data elements<br />
on or before due dates;<br />
made revisions within<br />
the alloted reveiw<br />
periods.<br />
Accurate and Timely<br />
Data Submission<br />
Overall (3-21)<br />
Early Childhood (3-5)<br />
School Age (5-21)<br />
State<br />
Target<br />
100.00%<br />
100.00%<br />
100.00%<br />
State<br />
Target<br />
LEA<br />
Rate<br />
LEA<br />
Rate<br />
Target Met by<br />
LEA (Y/N)<br />
Target Met<br />
by LEA<br />
(Y/N)<br />
Target Met<br />
by LEA<br />
(Y/N)<br />
*Data reviewed for timely and accurate submissions included all APSCN cycle data except for personnel<br />
Note: - - denotes not applicable<br />
96.19 100.00 — — N/A<br />
14.53<br />
State<br />
Rate<br />
49.42<br />
State<br />
Rate<br />
54.07<br />
13.00<br />
State<br />
Target<br />
49.00<br />
State<br />
Target<br />
60.00<br />
Y<br />
N/A<br />
Y<br />
— —<br />
LEA<br />
Rate<br />
— —<br />
LEA<br />
Rate<br />
— —<br />
N/A<br />
Target Met<br />
by LEA<br />
(Y/N)<br />
N/A<br />
Target Met<br />
by LEA<br />
(Y/N)<br />
N/A<br />
Page 5 of 5
LEA: 7503 - DANVILLE SCHOOL <strong>DISTRICT</strong><br />
<strong>ARKANSAS</strong> <strong>SPECIAL</strong> <strong>EDUCATION</strong><br />
<strong>DISTRICT</strong> <strong>ANNUAL</strong> PERFORMANCE REPORT<br />
2010/11 School Year<br />
Publication Date: March 2012<br />
Each State must have in place a State Performance Plan (SPP) to evaluate the State's efforts to meet the requirements and<br />
purposes of the implementation of the Individuals with Disabilities Education Act (IDEA). The SPP is a six-year plan, which<br />
describes Arkansas's performance on 20 indicators. The Office of Special Education Programs in the U. S. Department of<br />
Education requires that States report annually to the public on the performance of each local education agency (LEA) on 14 of<br />
20 indicators as compared with targets established by the State in the SPP. Arkansas will report indicators 1 through 14 and<br />
20 for each LEA serving children with disabilities (CWD). Any LEA not meeting targets on compliance indicators (0% for<br />
Indicators 4B, 09 & 10 and 100% for Indicators 11, 12, 13, and 20) are non-compliant with IDEA.<br />
There are no report changes for the 2010/11 school year profile; However, it is important to recognize that: .<br />
1. Indicator 01 (Graduation) is reported a year in arrear (2009/10 graduates) and is based on a four-year cohort. This<br />
means the rate is a measure of students who entered in ninth grade and graduate in four years. The calculation is a<br />
requirement under Title I of the Elementary and Secondary Education Act (ESEA).<br />
2. Indicator 02 (Drop out) is reported a year in arrear. This means the rate is a measure of students who dropped out in<br />
the 2009/10 school year. The Indicator 02 data are aligned with the Common Core of Data (CCD) requirements for<br />
grades 7-12.<br />
3. Indicator 04A and 4B (Suspension/Expulsion) is reported a year in arrear. This means the rate is a measure of<br />
students who had out-of-school suspensions and/or expulsions totaling more than 10 days.<br />
Percent of youth<br />
with IEPs<br />
graduating from<br />
high school with a<br />
regular diploma<br />
For a complete description of all the Indicators, please visit the special education website at<br />
http://arksped.k12.ar.us/sections/policy.html<br />
Indicator 01: Graduation Rates (2009/10 school year) Indicator 02: Dropout Rates (2009/10 school year)<br />
State<br />
Rate<br />
State<br />
Target<br />
75.76% 85.00%<br />
LEA<br />
Rate<br />
88.89%<br />
Target Met<br />
by LEA<br />
(Y/N)<br />
Y<br />
Percent of<br />
youth with<br />
IEPs dropping<br />
out of high<br />
school<br />
State<br />
Rate<br />
Indicator 03: Assessment on Statewide Benchmark Exam (grades 3-8, 11)<br />
A) Adequate Yearly Progress<br />
n=40<br />
Literacy<br />
Mathematics<br />
Met Disability Subgroup "n"<br />
for Reporting Purposes (Y/N)<br />
State Target for % of Districts Meeting<br />
AYP for Disability Subgroup<br />
State<br />
Target<br />
3.06% 4.20%<br />
LEA<br />
Rate<br />
1.67%<br />
% of Districts Meeting AYP<br />
for Disability Subgroup<br />
Target Met by<br />
LEA (Y/N)<br />
Y<br />
Target Met by<br />
LEA(Y/N)<br />
Overall N 17.15% 6.25%<br />
NA<br />
N<br />
N<br />
Note: For a district to qualify as having a disability subgroup it must have a minimum of 40 (n=40) students with disabilities in a school building.<br />
B) Participation<br />
Participation Rate: # of<br />
CWD Tested ÷ # of CWD<br />
Enrolled in grades tested.<br />
Participation Rate: Literacy<br />
Participation Rate: Math<br />
Note: - - denotes not applicable<br />
State<br />
Rate<br />
98.78%<br />
State<br />
Target<br />
95.00%<br />
LEA<br />
Rate<br />
98.31%<br />
Target Met<br />
by LEA (Y/N)<br />
98.61% 95.00% 98.39% Y<br />
Y<br />
C) Performance Proficiency<br />
Percent of CWD Scoring<br />
Proficient or Above<br />
Proficiency Rate: Literacy<br />
Proficiency Rate:<br />
Mathematics<br />
16.00%<br />
16.00%<br />
State<br />
Rate<br />
31.49%<br />
44.86%<br />
State<br />
Target<br />
45.22%<br />
51.14%<br />
LEA<br />
Rate<br />
31.58%<br />
51.67%<br />
NA<br />
NA<br />
Target<br />
Met by<br />
LEA (Y/N)<br />
N<br />
Y<br />
Page 1 of 5
LEA: 7503 - DANVILLE SCHOOL <strong>DISTRICT</strong><br />
Indicator 04: Out-of-School Suspensions and Expulsions (2009/10 school year)<br />
A) Suspension/Expulsion<br />
Percent difference of CWD with out-of- school suspensions and<br />
expulsions totaling greater than 10 days in a school year as<br />
compared to the same data for general education students in<br />
the district.<br />
B) Suspension/Expulsion by Race and Ethnicity<br />
Percent of districts that have: (a) a significant discrepancy, by race or<br />
ethnicity, in the rate of suspensions and expulsions of greater than 10<br />
days in a school year for children with IEPs; and (b) policies,<br />
procedures or practices that contribute to the significant discrepancy<br />
and do not comply with requirements relating to the development<br />
and implementation of IEPs, the use of positive behavioral<br />
interventions and supports, and procedural safeguards.<br />
Indicator 05: School Age (5-21) Least Restrictive Environment<br />
A) In the Regular Class 80% or more of the day<br />
Percent of CWD with<br />
IEPs receiving instruction<br />
in the regular class 80%<br />
or more of the day.<br />
State<br />
Rate<br />
State<br />
Target<br />
LEA<br />
Rate<br />
B) In the Regular Class less than 40% of the day<br />
Percent of CWD with<br />
IEPs receiving instruction<br />
in the regular class less<br />
than 60% of the day.<br />
53.87% 59.77%<br />
State<br />
Rate<br />
State<br />
Target<br />
12.42% 12.51%<br />
57.98%<br />
LEA<br />
Rate<br />
10.92%<br />
C) Other Settings outside the regular class<br />
Percent of CWD with IEPs served in<br />
public or private separate schools,<br />
residential placements, or<br />
homebound/hospital placements.<br />
State<br />
Rate<br />
State<br />
Target<br />
2.80% 2.56%<br />
Target Met<br />
by LEA (Y/N)<br />
N<br />
Target Met<br />
by LEA (Y/N)<br />
Y<br />
LEA<br />
Rate<br />
3.36%<br />
Target Met<br />
by LEA(Y/N)<br />
Indicator 06: Early Childhood (3-5) Least Restrictive Environment<br />
A) Regular Early Childhood Program<br />
Percent of children (aged 3 through 5) with IEPs attending a regular<br />
early childhood program and receiving the majority of special<br />
education and related services in the regular early childhood program<br />
Allowable<br />
Difference<br />
LEA: 7503 - DANVILLE SCHOOL <strong>DISTRICT</strong><br />
Indicator 07: Preschool (3-5) Outcomes<br />
a) Percent of preschool CWD<br />
children who did not<br />
improve functioning.<br />
b) Percent of preschool CWD<br />
who improved but whose<br />
functioning remained below<br />
same age peers.<br />
c) Percent of preschool CWD<br />
who improved at a level<br />
nearer to same aged peers.<br />
d) Percent of preschool CWD<br />
who improved functioning to<br />
reach a level comparable to<br />
same age peers.<br />
e) Percent of preschool CWD<br />
children who maintain<br />
functioning at a level<br />
comparable to same aged<br />
peers.<br />
Summary<br />
Statements<br />
1) Of those preschool<br />
children who entered<br />
the preschool program<br />
below age expectations<br />
in each Outcome, the<br />
percent who<br />
substantially increased<br />
their rate of growth by<br />
the time they turned 6<br />
years of age or exited<br />
the program.<br />
2) The percent of<br />
preschool children who<br />
were functioning<br />
within age expectations<br />
in each Outcome by the<br />
time they turned 6<br />
years of age or exited<br />
A) Positive Social -Emotional<br />
Skills*<br />
State<br />
Rate<br />
A) Positive Social -<br />
Emotional Skills<br />
(Including social<br />
relationships)<br />
State<br />
Rate<br />
2.14%<br />
5.31%<br />
25.97%<br />
38.22%<br />
28.36%<br />
State<br />
Target<br />
LEA<br />
Rate<br />
LEA<br />
Rate<br />
— —<br />
— —<br />
— —<br />
— —<br />
— —<br />
Target<br />
Met by<br />
LEA(Y/N)<br />
B) Acquisition and Use of<br />
Knowledge and Skills<br />
(Including early language/<br />
communication and early literacy)<br />
B) Acquisition and Use of<br />
Knowledge and Skills **<br />
State<br />
Rate<br />
1.75%<br />
6.59%<br />
34.23%<br />
43.51%<br />
13.92%<br />
State<br />
Target<br />
LEA<br />
Rate<br />
Target<br />
Met by<br />
LEA(Y/N)<br />
C) Use of Appropriate Behaviors<br />
to Meet Their Needs<br />
State<br />
Rate<br />
State<br />
Target<br />
LEA<br />
Rate<br />
Target<br />
Met by<br />
LEA(Y/N)<br />
89.61% 90.50% — — N/A 90.31% 90.50% — — N/A 90.82% 92.50% — — N/A<br />
66.58% 69.50% — — N/A 57.43% 60.50% — — N/A 76.69% 78.50% — — N/A<br />
NOTE: * Including social relationships ** Including early language/ communication and early literacy<br />
Note: - - denotes not applicable<br />
State<br />
Rate<br />
LEA<br />
Rate<br />
— —<br />
— —<br />
— —<br />
— —<br />
— —<br />
C) Use of<br />
Appropriate<br />
Behaviors to<br />
Meet Their Needs<br />
State<br />
Rate<br />
4.51%<br />
17.34%<br />
41.72%<br />
34.97%<br />
LEA<br />
Rate<br />
1.46% — —<br />
— —<br />
— —<br />
— —<br />
— —<br />
Page 3 of 5
LEA: 7503 - DANVILLE SCHOOL <strong>DISTRICT</strong><br />
Indicator 08: Parent Involvement<br />
Percent of surveyed<br />
parents who reported<br />
school facilitated parent<br />
involvement as a means<br />
of improving services<br />
and results for children<br />
with disabilities.<br />
Early Childhood<br />
(3-5)<br />
School Age<br />
(5-21)<br />
State<br />
Rate<br />
90.47%<br />
95.05%<br />
Indicator 09: Disproportionality - Eligibility<br />
Disproportionate representation of racial<br />
and ethnic groups in special education and<br />
related services that is a result of<br />
inappropriate identification (e.g.<br />
monitoring data, review of policies,<br />
practices, and procedures under 618(d),<br />
etc.).<br />
State<br />
Rate<br />
State<br />
Target<br />
88.00%<br />
96.00%<br />
State<br />
Target<br />
0.00% 0.00%<br />
LEA<br />
Rate<br />
— —<br />
100.00%<br />
Indicator 10: Disproportionality-Child with a Disability<br />
Disproportionate representation of racial<br />
and ethnic groups in specific disability<br />
categories that is a result of inappropriate<br />
identification (e.g. monitoring data, review<br />
of policies, practices, and procedures under<br />
618(d), etc.).<br />
Indicator 11: Child Find<br />
Percent of children with<br />
parental consent to evaluate<br />
who are evaluated within<br />
the State established timeline<br />
of 60 days.<br />
Overall<br />
(3-21)<br />
Early Childhood<br />
(3-5)<br />
School Age<br />
(5-21)<br />
State<br />
Rate<br />
0.00%<br />
Indicator 12: Early Childhood Transition<br />
Percent of children referred by Part C prior to<br />
age 3, who are found eligible for Part B, and<br />
who have an IEP developed and implemented<br />
by their third birthday.<br />
Note: - - denotes not applicable<br />
State<br />
Rate<br />
99.41%<br />
99.70%<br />
98.97%<br />
State<br />
Rate<br />
State<br />
Target<br />
0.00%<br />
State<br />
Target<br />
100.00%<br />
100.00%<br />
100.00%<br />
State<br />
Target<br />
Target Met by<br />
LEA (Y/N)<br />
Y<br />
Target Met by<br />
LEA (Y/N)<br />
Y<br />
LEA<br />
Rate<br />
92.31%<br />
— —<br />
92.31%<br />
LEA<br />
Rate<br />
Target Met by<br />
LEA (Y/N)<br />
N/A<br />
Y<br />
Note: The target for Indicator 09 is to have zero percent<br />
(0%) of districts identified as having disproportionate<br />
representation as a result of inappropriate<br />
identification in eligibility.<br />
Note: The target for Indicator 10 is to have zero<br />
percent (0%) of districts identified as having<br />
disproportionate representation as a result of<br />
inappropriate identification in a disability<br />
category.<br />
Target Met by<br />
LEA (Y/N)<br />
N/A<br />
N<br />
Target Met<br />
by LEA<br />
(Y/N)<br />
99.21% 100.00% - - N/A<br />
N<br />
Note: * Indicates a zero reponse rate for the<br />
district.<br />
Page 4 of 5
LEA: 7503 - DANVILLE SCHOOL <strong>DISTRICT</strong><br />
Indicator 13: Secondary Transition<br />
Percent of youth with disabilities aged 16 and<br />
up with an IEP that includes coordinated,<br />
measurable, annual IEP goals and transition<br />
services that will reasonably enable the student<br />
to meet the post-secondary goals.<br />
Indicator 14: Post-School Outcomes<br />
A. Percent of youth enrolled in higher<br />
education within one year of leaving high<br />
school.<br />
State<br />
Rate<br />
State<br />
Target<br />
Note: Data for this Indicator is from the on-site monitoring of LEAs for the given year.<br />
B. Percent of youth enrolled in higher<br />
education or competitively employed<br />
within one year of leaving high school.<br />
C. Percent of youth enrolled in higher<br />
education or in some other postsecondary<br />
education or training program; or<br />
competitively employed or in some other<br />
employment within one year of leaving<br />
high school.<br />
State<br />
Rate<br />
Indicator 20: Reported Data-Timely and Accurate*<br />
District submitted<br />
required data elements<br />
on or before due dates;<br />
made revisions within<br />
the alloted reveiw<br />
periods.<br />
Accurate and Timely<br />
Data Submission<br />
Overall (3-21)<br />
Early Childhood (3-5)<br />
School Age (5-21)<br />
State<br />
Target<br />
100.00%<br />
100.00%<br />
100.00%<br />
State<br />
Target<br />
LEA<br />
Rate<br />
LEA<br />
Rate<br />
Target Met by<br />
LEA (Y/N)<br />
Target Met<br />
by LEA<br />
(Y/N)<br />
Target Met<br />
by LEA<br />
(Y/N)<br />
*Data reviewed for timely and accurate submissions included all APSCN cycle data except for personnel<br />
Note: - - denotes not applicable<br />
96.19 100.00 100.00% Y<br />
14.53<br />
State<br />
Rate<br />
49.42<br />
State<br />
Rate<br />
54.07<br />
13.00<br />
State<br />
Target<br />
49.00<br />
State<br />
Target<br />
60.00<br />
Y<br />
N/A<br />
Y<br />
— —<br />
LEA<br />
Rate<br />
— —<br />
LEA<br />
Rate<br />
— —<br />
N/A<br />
Target Met<br />
by LEA<br />
(Y/N)<br />
N/A<br />
Target Met<br />
by LEA<br />
(Y/N)<br />
N/A<br />
Page 5 of 5
<strong>ARKANSAS</strong> <strong>SPECIAL</strong> <strong>EDUCATION</strong><br />
<strong>DISTRICT</strong> <strong>ANNUAL</strong> PERFORMANCE REPORT<br />
2010/11 School Year<br />
Publication Date: March 2012<br />
Each State must have in place a State Performance Plan (SPP) to evaluate the State's efforts to meet the requirements and<br />
purposes of the implementation of the Individuals with Disabilities Education Act (IDEA). The SPP is a six-year plan, which<br />
describes Arkansas's performance on 20 indicators. The Office of Special Education Programs in the U. S. Department of<br />
Education requires that States report annually to the public on the performance of each local education agency (LEA) on 14 of<br />
20 indicators as compared with targets established by the State in the SPP. Arkansas will report indicators 1 through 14 and<br />
20 for each LEA serving children with disabilities (CWD). Any LEA not meeting targets on compliance indicators (0% for<br />
Indicators 4B, 09 & 10 and 100% for Indicators 11, 12, 13, and 20) are non-compliant with IDEA.<br />
There are no report changes for the 2010/11 school year profile; However, it is important to recognize that: .<br />
1. Indicator 01 (Graduation) is reported a year in arrear (2009/10 graduates) and is based on a four-year cohort. This<br />
means the rate is a measure of students who entered in ninth grade and graduate in four years. The calculation is a<br />
requirement under Title I of the Elementary and Secondary Education Act (ESEA).<br />
2. Indicator 02 (Drop out) is reported a year in arrear. This means the rate is a measure of students who dropped out in<br />
the 2009/10 school year. The Indicator 02 data are aligned with the Common Core of Data (CCD) requirements for<br />
grades 7-12.<br />
3. Indicator 04A and 4B (Suspension/Expulsion) is reported a year in arrear. This means the rate is a measure of<br />
students who had out-of-school suspensions and/or expulsions totaling more than 10 days.<br />
For a complete description of all the Indicators, please visit the special education website at<br />
http://arksped.k12.ar.us/sections/policy.html<br />
LEA: 7504 - DARDANELLE SCHOOL <strong>DISTRICT</strong><br />
Indicator 01: Graduation Rates (2009/10 school year) Indicator 02: Dropout Rates (2009/10 school year)<br />
Percent of youth<br />
with IEPs<br />
graduating from<br />
high school with a<br />
regular diploma<br />
State<br />
Rate<br />
State<br />
Target<br />
75.76% 85.00%<br />
LEA<br />
Rate<br />
73.68%<br />
Target Met<br />
by LEA<br />
(Y/N)<br />
N<br />
Percent of<br />
youth with<br />
IEPs dropping<br />
out of high<br />
school<br />
State<br />
Rate<br />
Indicator 03: Assessment on Statewide Benchmark Exam (grades 3-8, 11)<br />
A) Adequate Yearly Progress<br />
n=40<br />
Literacy<br />
Mathematics<br />
Met Disability Subgroup "n"<br />
for Reporting Purposes (Y/N)<br />
State Target for % of Districts Meeting<br />
AYP for Disability Subgroup<br />
State<br />
Target<br />
3.06% 4.20%<br />
LEA<br />
Rate<br />
1.72%<br />
% of Districts Meeting AYP<br />
for Disability Subgroup<br />
Target Met by<br />
LEA (Y/N)<br />
Y<br />
Target Met by<br />
LEA(Y/N)<br />
Overall Y 17.15% 6.25%<br />
N<br />
Y<br />
Y<br />
Note: For a district to qualify as having a disability subgroup it must have a minimum of 40 (n=40) students with disabilities in a school building.<br />
B) Participation<br />
Participation Rate: # of<br />
CWD Tested ÷ # of CWD<br />
Enrolled in grades tested.<br />
Participation Rate: Literacy<br />
Participation Rate: Math<br />
Note: - - denotes not applicable<br />
State<br />
Rate<br />
98.78%<br />
State<br />
Target<br />
95.00%<br />
LEA<br />
Rate<br />
98.63%<br />
Target Met<br />
by LEA (Y/N)<br />
98.61% 95.00% 98.73% Y<br />
Y<br />
C) Performance Proficiency<br />
Percent of CWD Scoring<br />
Proficient or Above<br />
Proficiency Rate: Literacy<br />
Proficiency Rate:<br />
Mathematics<br />
16.00%<br />
16.00%<br />
State<br />
Rate<br />
31.49%<br />
44.86%<br />
State<br />
Target<br />
45.22%<br />
51.14%<br />
LEA<br />
Rate<br />
57.35%<br />
63.27%<br />
N<br />
N<br />
Target<br />
Met by<br />
LEA (Y/N)<br />
Y<br />
Y<br />
Page 1 of 5
LEA: 7504 - DARDANELLE SCHOOL <strong>DISTRICT</strong><br />
Indicator 04: Out-of-School Suspensions and Expulsions (2009/10 school year)<br />
A) Suspension/Expulsion<br />
Percent difference of CWD with out-of- school suspensions and<br />
expulsions totaling greater than 10 days in a school year as<br />
compared to the same data for general education students in<br />
the district.<br />
B) Suspension/Expulsion by Race and Ethnicity<br />
Percent of districts that have: (a) a significant discrepancy, by race or<br />
ethnicity, in the rate of suspensions and expulsions of greater than 10<br />
days in a school year for children with IEPs; and (b) policies,<br />
procedures or practices that contribute to the significant discrepancy<br />
and do not comply with requirements relating to the development<br />
and implementation of IEPs, the use of positive behavioral<br />
interventions and supports, and procedural safeguards.<br />
Indicator 05: School Age (5-21) Least Restrictive Environment<br />
A) In the Regular Class 80% or more of the day<br />
Percent of CWD with<br />
IEPs receiving instruction<br />
in the regular class 80%<br />
or more of the day.<br />
State<br />
Rate<br />
State<br />
Target<br />
LEA<br />
Rate<br />
B) In the Regular Class less than 40% of the day<br />
Percent of CWD with<br />
IEPs receiving instruction<br />
in the regular class less<br />
than 60% of the day.<br />
53.87% 59.77%<br />
State<br />
Rate<br />
State<br />
Target<br />
12.42% 12.51%<br />
46.42%<br />
LEA<br />
Rate<br />
22.26%<br />
C) Other Settings outside the regular class<br />
Percent of CWD with IEPs served in<br />
public or private separate schools,<br />
residential placements, or<br />
homebound/hospital placements.<br />
State<br />
Rate<br />
State<br />
Target<br />
2.80% 2.56%<br />
Target Met<br />
by LEA (Y/N)<br />
N<br />
Target Met<br />
by LEA (Y/N)<br />
N<br />
LEA<br />
Rate<br />
0.75%<br />
Target Met<br />
by LEA(Y/N)<br />
Indicator 06: Early Childhood (3-5) Least Restrictive Environment<br />
A) Regular Early Childhood Program<br />
Percent of children (aged 3 through 5) with IEPs attending a regular<br />
early childhood program and receiving the majority of special<br />
education and related services in the regular early childhood program<br />
Allowable<br />
Difference<br />
LEA: 7504 - DARDANELLE SCHOOL <strong>DISTRICT</strong><br />
Indicator 07: Preschool (3-5) Outcomes<br />
a) Percent of preschool CWD<br />
children who did not<br />
improve functioning.<br />
b) Percent of preschool CWD<br />
who improved but whose<br />
functioning remained below<br />
same age peers.<br />
c) Percent of preschool CWD<br />
who improved at a level<br />
nearer to same aged peers.<br />
d) Percent of preschool CWD<br />
who improved functioning to<br />
reach a level comparable to<br />
same age peers.<br />
e) Percent of preschool CWD<br />
children who maintain<br />
functioning at a level<br />
comparable to same aged<br />
peers.<br />
Summary<br />
Statements<br />
1) Of those preschool<br />
children who entered<br />
the preschool program<br />
below age expectations<br />
in each Outcome, the<br />
percent who<br />
substantially increased<br />
their rate of growth by<br />
the time they turned 6<br />
years of age or exited<br />
the program.<br />
2) The percent of<br />
preschool children who<br />
were functioning<br />
within age expectations<br />
in each Outcome by the<br />
time they turned 6<br />
years of age or exited<br />
A) Positive Social -Emotional<br />
Skills*<br />
State<br />
Rate<br />
A) Positive Social -<br />
Emotional Skills<br />
(Including social<br />
relationships)<br />
State<br />
Rate<br />
2.14%<br />
5.31%<br />
25.97%<br />
38.22%<br />
28.36%<br />
State<br />
Target<br />
LEA<br />
Rate<br />
LEA<br />
Rate<br />
— —<br />
— —<br />
— —<br />
— —<br />
— —<br />
Target<br />
Met by<br />
LEA(Y/N)<br />
B) Acquisition and Use of<br />
Knowledge and Skills<br />
(Including early language/<br />
communication and early literacy)<br />
B) Acquisition and Use of<br />
Knowledge and Skills **<br />
State<br />
Rate<br />
1.75%<br />
6.59%<br />
34.23%<br />
43.51%<br />
13.92%<br />
State<br />
Target<br />
LEA<br />
Rate<br />
Target<br />
Met by<br />
LEA(Y/N)<br />
C) Use of Appropriate Behaviors<br />
to Meet Their Needs<br />
State<br />
Rate<br />
State<br />
Target<br />
LEA<br />
Rate<br />
Target<br />
Met by<br />
LEA(Y/N)<br />
89.61% 90.50% — — N/A 90.31% 90.50% — — N/A 90.82% 92.50% — — N/A<br />
66.58% 69.50% — — N/A 57.43% 60.50% — — N/A 76.69% 78.50% — — N/A<br />
NOTE: * Including social relationships ** Including early language/ communication and early literacy<br />
Note: - - denotes not applicable<br />
State<br />
Rate<br />
LEA<br />
Rate<br />
— —<br />
— —<br />
— —<br />
— —<br />
— —<br />
C) Use of<br />
Appropriate<br />
Behaviors to<br />
Meet Their Needs<br />
State<br />
Rate<br />
4.51%<br />
17.34%<br />
41.72%<br />
34.97%<br />
LEA<br />
Rate<br />
1.46% — —<br />
— —<br />
— —<br />
— —<br />
— —<br />
Page 3 of 5
LEA: 7504 - DARDANELLE SCHOOL <strong>DISTRICT</strong><br />
Indicator 08: Parent Involvement<br />
Percent of surveyed<br />
parents who reported<br />
school facilitated parent<br />
involvement as a means<br />
of improving services<br />
and results for children<br />
with disabilities.<br />
Early Childhood<br />
(3-5)<br />
School Age<br />
(5-21)<br />
State<br />
Rate<br />
90.47%<br />
95.05%<br />
Indicator 09: Disproportionality - Eligibility<br />
Disproportionate representation of racial<br />
and ethnic groups in special education and<br />
related services that is a result of<br />
inappropriate identification (e.g.<br />
monitoring data, review of policies,<br />
practices, and procedures under 618(d),<br />
etc.).<br />
State<br />
Rate<br />
State<br />
Target<br />
88.00%<br />
96.00%<br />
State<br />
Target<br />
0.00% 0.00%<br />
LEA<br />
Rate<br />
— —<br />
90.99%<br />
Indicator 10: Disproportionality-Child with a Disability<br />
Disproportionate representation of racial<br />
and ethnic groups in specific disability<br />
categories that is a result of inappropriate<br />
identification (e.g. monitoring data, review<br />
of policies, practices, and procedures under<br />
618(d), etc.).<br />
Indicator 11: Child Find<br />
Percent of children with<br />
parental consent to evaluate<br />
who are evaluated within<br />
the State established timeline<br />
of 60 days.<br />
Overall<br />
(3-21)<br />
Early Childhood<br />
(3-5)<br />
School Age<br />
(5-21)<br />
State<br />
Rate<br />
0.00%<br />
Indicator 12: Early Childhood Transition<br />
Percent of children referred by Part C prior to<br />
age 3, who are found eligible for Part B, and<br />
who have an IEP developed and implemented<br />
by their third birthday.<br />
Note: - - denotes not applicable<br />
State<br />
Rate<br />
99.41%<br />
99.70%<br />
98.97%<br />
State<br />
Rate<br />
State<br />
Target<br />
0.00%<br />
State<br />
Target<br />
100.00%<br />
100.00%<br />
100.00%<br />
State<br />
Target<br />
Target Met by<br />
LEA (Y/N)<br />
Y<br />
Target Met by<br />
LEA (Y/N)<br />
Y<br />
LEA<br />
Rate<br />
100.00%<br />
— —<br />
100.00%<br />
LEA<br />
Rate<br />
Target Met by<br />
LEA (Y/N)<br />
N/A<br />
N<br />
Note: The target for Indicator 09 is to have zero percent<br />
(0%) of districts identified as having disproportionate<br />
representation as a result of inappropriate<br />
identification in eligibility.<br />
Note: The target for Indicator 10 is to have zero<br />
percent (0%) of districts identified as having<br />
disproportionate representation as a result of<br />
inappropriate identification in a disability<br />
category.<br />
Target Met by<br />
LEA (Y/N)<br />
N/A<br />
Y<br />
Target Met<br />
by LEA<br />
(Y/N)<br />
99.21% 100.00% - - N/A<br />
Y<br />
Note: * Indicates a zero reponse rate for the<br />
district.<br />
Page 4 of 5
LEA: 7504 - DARDANELLE SCHOOL <strong>DISTRICT</strong><br />
Indicator 13: Secondary Transition<br />
Percent of youth with disabilities aged 16 and<br />
up with an IEP that includes coordinated,<br />
measurable, annual IEP goals and transition<br />
services that will reasonably enable the student<br />
to meet the post-secondary goals.<br />
Indicator 14: Post-School Outcomes<br />
A. Percent of youth enrolled in higher<br />
education within one year of leaving high<br />
school.<br />
State<br />
Rate<br />
State<br />
Target<br />
Note: Data for this Indicator is from the on-site monitoring of LEAs for the given year.<br />
B. Percent of youth enrolled in higher<br />
education or competitively employed<br />
within one year of leaving high school.<br />
C. Percent of youth enrolled in higher<br />
education or in some other postsecondary<br />
education or training program; or<br />
competitively employed or in some other<br />
employment within one year of leaving<br />
high school.<br />
State<br />
Rate<br />
Indicator 20: Reported Data-Timely and Accurate*<br />
District submitted<br />
required data elements<br />
on or before due dates;<br />
made revisions within<br />
the alloted reveiw<br />
periods.<br />
Accurate and Timely<br />
Data Submission<br />
Overall (3-21)<br />
Early Childhood (3-5)<br />
School Age (5-21)<br />
State<br />
Target<br />
100.00%<br />
100.00%<br />
100.00%<br />
State<br />
Target<br />
LEA<br />
Rate<br />
LEA<br />
Rate<br />
Target Met by<br />
LEA (Y/N)<br />
Target Met<br />
by LEA<br />
(Y/N)<br />
Target Met<br />
by LEA<br />
(Y/N)<br />
*Data reviewed for timely and accurate submissions included all APSCN cycle data except for personnel<br />
Note: - - denotes not applicable<br />
96.19 100.00 — — N/A<br />
14.53<br />
State<br />
Rate<br />
49.42<br />
State<br />
Rate<br />
54.07<br />
13.00<br />
State<br />
Target<br />
49.00<br />
State<br />
Target<br />
60.00<br />
Y<br />
N/A<br />
Y<br />
— —<br />
LEA<br />
Rate<br />
— —<br />
LEA<br />
Rate<br />
— —<br />
N/A<br />
Target Met<br />
by LEA<br />
(Y/N)<br />
N/A<br />
Target Met<br />
by LEA<br />
(Y/N)<br />
N/A<br />
Page 5 of 5
<strong>ARKANSAS</strong> <strong>SPECIAL</strong> <strong>EDUCATION</strong><br />
<strong>DISTRICT</strong> <strong>ANNUAL</strong> PERFORMANCE REPORT<br />
2010/11 School Year<br />
Publication Date: March 2012<br />
Each State must have in place a State Performance Plan (SPP) to evaluate the State's efforts to meet the requirements and<br />
purposes of the implementation of the Individuals with Disabilities Education Act (IDEA). The SPP is a six-year plan, which<br />
describes Arkansas's performance on 20 indicators. The Office of Special Education Programs in the U. S. Department of<br />
Education requires that States report annually to the public on the performance of each local education agency (LEA) on 14 of<br />
20 indicators as compared with targets established by the State in the SPP. Arkansas will report indicators 1 through 14 and<br />
20 for each LEA serving children with disabilities (CWD). Any LEA not meeting targets on compliance indicators (0% for<br />
Indicators 4B, 09 & 10 and 100% for Indicators 11, 12, 13, and 20) are non-compliant with IDEA.<br />
There are no report changes for the 2010/11 school year profile; However, it is important to recognize that: .<br />
1. Indicator 01 (Graduation) is reported a year in arrear (2009/10 graduates) and is based on a four-year cohort. This<br />
means the rate is a measure of students who entered in ninth grade and graduate in four years. The calculation is a<br />
requirement under Title I of the Elementary and Secondary Education Act (ESEA).<br />
2. Indicator 02 (Drop out) is reported a year in arrear. This means the rate is a measure of students who dropped out in<br />
the 2009/10 school year. The Indicator 02 data are aligned with the Common Core of Data (CCD) requirements for<br />
grades 7-12.<br />
3. Indicator 04A and 4B (Suspension/Expulsion) is reported a year in arrear. This means the rate is a measure of<br />
students who had out-of-school suspensions and/or expulsions totaling more than 10 days.<br />
For a complete description of all the Indicators, please visit the special education website at<br />
http://arksped.k12.ar.us/sections/policy.html<br />
LEA: 7509 - WESTERN YELL CO. SCHOOL <strong>DISTRICT</strong><br />
Indicator 01: Graduation Rates (2009/10 school year) Indicator 02: Dropout Rates (2009/10 school year)<br />
Percent of youth<br />
with IEPs<br />
graduating from<br />
high school with a<br />
regular diploma<br />
State<br />
Rate<br />
State<br />
Target<br />
75.76% 85.00%<br />
LEA<br />
Rate<br />
90.00%<br />
Target Met<br />
by LEA<br />
(Y/N)<br />
Y<br />
Percent of<br />
youth with<br />
IEPs dropping<br />
out of high<br />
school<br />
State<br />
Rate<br />
Indicator 03: Assessment on Statewide Benchmark Exam (grades 3-8, 11)<br />
A) Adequate Yearly Progress<br />
n=40<br />
Literacy<br />
Mathematics<br />
Met Disability Subgroup "n"<br />
for Reporting Purposes (Y/N)<br />
State Target for % of Districts Meeting<br />
AYP for Disability Subgroup<br />
State<br />
Target<br />
3.06% 4.20%<br />
LEA<br />
Rate<br />
0.00%<br />
% of Districts Meeting AYP<br />
for Disability Subgroup<br />
Target Met by<br />
LEA (Y/N)<br />
Y<br />
Target Met by<br />
LEA(Y/N)<br />
Overall N 17.15% 6.25%<br />
NA<br />
N<br />
N<br />
Note: For a district to qualify as having a disability subgroup it must have a minimum of 40 (n=40) students with disabilities in a school building.<br />
B) Participation<br />
Participation Rate: # of<br />
CWD Tested ÷ # of CWD<br />
Enrolled in grades tested.<br />
Participation Rate: Literacy<br />
Participation Rate: Math<br />
Note: - - denotes not applicable<br />
State<br />
Rate<br />
98.78%<br />
State<br />
Target<br />
95.00%<br />
LEA<br />
Rate<br />
96.61%<br />
Target Met<br />
by LEA (Y/N)<br />
98.61% 95.00% 98.21% Y<br />
Y<br />
C) Performance Proficiency<br />
Percent of CWD Scoring<br />
Proficient or Above<br />
Proficiency Rate: Literacy<br />
Proficiency Rate:<br />
Mathematics<br />
16.00%<br />
16.00%<br />
State<br />
Rate<br />
31.49%<br />
44.86%<br />
State<br />
Target<br />
45.22%<br />
51.14%<br />
LEA<br />
Rate<br />
34.00%<br />
48.00%<br />
NA<br />
NA<br />
Target<br />
Met by<br />
LEA (Y/N)<br />
N<br />
N<br />
Page 1 of 5
LEA: 7509 - WESTERN YELL CO. SCHOOL <strong>DISTRICT</strong><br />
Indicator 04: Out-of-School Suspensions and Expulsions (2009/10 school year)<br />
A) Suspension/Expulsion<br />
Percent difference of CWD with out-of- school suspensions and<br />
expulsions totaling greater than 10 days in a school year as<br />
compared to the same data for general education students in<br />
the district.<br />
B) Suspension/Expulsion by Race and Ethnicity<br />
Percent of districts that have: (a) a significant discrepancy, by race or<br />
ethnicity, in the rate of suspensions and expulsions of greater than 10<br />
days in a school year for children with IEPs; and (b) policies,<br />
procedures or practices that contribute to the significant discrepancy<br />
and do not comply with requirements relating to the development<br />
and implementation of IEPs, the use of positive behavioral<br />
interventions and supports, and procedural safeguards.<br />
Indicator 05: School Age (5-21) Least Restrictive Environment<br />
A) In the Regular Class 80% or more of the day<br />
Percent of CWD with<br />
IEPs receiving instruction<br />
in the regular class 80%<br />
or more of the day.<br />
State<br />
Rate<br />
State<br />
Target<br />
LEA<br />
Rate<br />
B) In the Regular Class less than 40% of the day<br />
Percent of CWD with<br />
IEPs receiving instruction<br />
in the regular class less<br />
than 60% of the day.<br />
53.87% 59.77%<br />
State<br />
Rate<br />
State<br />
Target<br />
12.42% 12.51%<br />
54.32%<br />
LEA<br />
Rate<br />
1.23%<br />
C) Other Settings outside the regular class<br />
Percent of CWD with IEPs served in<br />
public or private separate schools,<br />
residential placements, or<br />
homebound/hospital placements.<br />
State<br />
Rate<br />
State<br />
Target<br />
2.80% 2.56%<br />
Target Met<br />
by LEA (Y/N)<br />
N<br />
Target Met<br />
by LEA (Y/N)<br />
Y<br />
LEA<br />
Rate<br />
0.00%<br />
Target Met<br />
by LEA(Y/N)<br />
Indicator 06: Early Childhood (3-5) Least Restrictive Environment<br />
A) Regular Early Childhood Program<br />
Percent of children (aged 3 through 5) with IEPs attending a regular<br />
early childhood program and receiving the majority of special<br />
education and related services in the regular early childhood program<br />
Allowable<br />
Difference<br />
LEA: 7509 - WESTERN YELL CO. SCHOOL <strong>DISTRICT</strong><br />
Indicator 07: Preschool (3-5) Outcomes<br />
a) Percent of preschool CWD<br />
children who did not<br />
improve functioning.<br />
b) Percent of preschool CWD<br />
who improved but whose<br />
functioning remained below<br />
same age peers.<br />
c) Percent of preschool CWD<br />
who improved at a level<br />
nearer to same aged peers.<br />
d) Percent of preschool CWD<br />
who improved functioning to<br />
reach a level comparable to<br />
same age peers.<br />
e) Percent of preschool CWD<br />
children who maintain<br />
functioning at a level<br />
comparable to same aged<br />
peers.<br />
Summary<br />
Statements<br />
1) Of those preschool<br />
children who entered<br />
the preschool program<br />
below age expectations<br />
in each Outcome, the<br />
percent who<br />
substantially increased<br />
their rate of growth by<br />
the time they turned 6<br />
years of age or exited<br />
the program.<br />
2) The percent of<br />
preschool children who<br />
were functioning<br />
within age expectations<br />
in each Outcome by the<br />
time they turned 6<br />
years of age or exited<br />
A) Positive Social -Emotional<br />
Skills*<br />
State<br />
Rate<br />
A) Positive Social -<br />
Emotional Skills<br />
(Including social<br />
relationships)<br />
State<br />
Rate<br />
2.14%<br />
5.31%<br />
25.97%<br />
38.22%<br />
28.36%<br />
State<br />
Target<br />
LEA<br />
Rate<br />
LEA<br />
Rate<br />
— —<br />
— —<br />
— —<br />
— —<br />
— —<br />
Target<br />
Met by<br />
LEA(Y/N)<br />
B) Acquisition and Use of<br />
Knowledge and Skills<br />
(Including early language/<br />
communication and early literacy)<br />
B) Acquisition and Use of<br />
Knowledge and Skills **<br />
State<br />
Rate<br />
1.75%<br />
6.59%<br />
34.23%<br />
43.51%<br />
13.92%<br />
State<br />
Target<br />
LEA<br />
Rate<br />
Target<br />
Met by<br />
LEA(Y/N)<br />
C) Use of Appropriate Behaviors<br />
to Meet Their Needs<br />
State<br />
Rate<br />
State<br />
Target<br />
LEA<br />
Rate<br />
Target<br />
Met by<br />
LEA(Y/N)<br />
89.61% 90.50% — — N/A 90.31% 90.50% — — N/A 90.82% 92.50% — — N/A<br />
66.58% 69.50% — — N/A 57.43% 60.50% — — N/A 76.69% 78.50% — — N/A<br />
NOTE: * Including social relationships ** Including early language/ communication and early literacy<br />
Note: - - denotes not applicable<br />
State<br />
Rate<br />
LEA<br />
Rate<br />
— —<br />
— —<br />
— —<br />
— —<br />
— —<br />
C) Use of<br />
Appropriate<br />
Behaviors to<br />
Meet Their Needs<br />
State<br />
Rate<br />
4.51%<br />
17.34%<br />
41.72%<br />
34.97%<br />
LEA<br />
Rate<br />
1.46% — —<br />
— —<br />
— —<br />
— —<br />
— —<br />
Page 3 of 5
LEA: 7509 - WESTERN YELL CO. SCHOOL <strong>DISTRICT</strong><br />
Indicator 08: Parent Involvement<br />
Percent of surveyed<br />
parents who reported<br />
school facilitated parent<br />
involvement as a means<br />
of improving services<br />
and results for children<br />
with disabilities.<br />
Early Childhood<br />
(3-5)<br />
School Age<br />
(5-21)<br />
State<br />
Rate<br />
90.47%<br />
95.05%<br />
Indicator 09: Disproportionality - Eligibility<br />
Disproportionate representation of racial<br />
and ethnic groups in special education and<br />
related services that is a result of<br />
inappropriate identification (e.g.<br />
monitoring data, review of policies,<br />
practices, and procedures under 618(d),<br />
etc.).<br />
State<br />
Rate<br />
State<br />
Target<br />
88.00%<br />
96.00%<br />
State<br />
Target<br />
0.00% 0.00%<br />
LEA<br />
Rate<br />
— —<br />
100.00%<br />
Indicator 10: Disproportionality-Child with a Disability<br />
Disproportionate representation of racial<br />
and ethnic groups in specific disability<br />
categories that is a result of inappropriate<br />
identification (e.g. monitoring data, review<br />
of policies, practices, and procedures under<br />
618(d), etc.).<br />
Indicator 11: Child Find<br />
Percent of children with<br />
parental consent to evaluate<br />
who are evaluated within<br />
the State established timeline<br />
of 60 days.<br />
Overall<br />
(3-21)<br />
Early Childhood<br />
(3-5)<br />
School Age<br />
(5-21)<br />
State<br />
Rate<br />
0.00%<br />
Indicator 12: Early Childhood Transition<br />
Percent of children referred by Part C prior to<br />
age 3, who are found eligible for Part B, and<br />
who have an IEP developed and implemented<br />
by their third birthday.<br />
Note: - - denotes not applicable<br />
State<br />
Rate<br />
99.41%<br />
99.70%<br />
98.97%<br />
State<br />
Rate<br />
State<br />
Target<br />
0.00%<br />
State<br />
Target<br />
100.00%<br />
100.00%<br />
100.00%<br />
State<br />
Target<br />
Target Met by<br />
LEA (Y/N)<br />
Y<br />
Target Met by<br />
LEA (Y/N)<br />
Y<br />
LEA<br />
Rate<br />
100.00%<br />
— —<br />
100.00%<br />
LEA<br />
Rate<br />
Target Met by<br />
LEA (Y/N)<br />
N/A<br />
Y<br />
Note: The target for Indicator 09 is to have zero percent<br />
(0%) of districts identified as having disproportionate<br />
representation as a result of inappropriate<br />
identification in eligibility.<br />
Note: The target for Indicator 10 is to have zero<br />
percent (0%) of districts identified as having<br />
disproportionate representation as a result of<br />
inappropriate identification in a disability<br />
category.<br />
Target Met by<br />
LEA (Y/N)<br />
N/A<br />
Y<br />
Target Met<br />
by LEA<br />
(Y/N)<br />
99.21% 100.00% - - N/A<br />
Y<br />
Note: * Indicates a zero reponse rate for the<br />
district.<br />
Page 4 of 5
LEA: 7509 - WESTERN YELL CO. SCHOOL <strong>DISTRICT</strong><br />
Indicator 13: Secondary Transition<br />
Percent of youth with disabilities aged 16 and<br />
up with an IEP that includes coordinated,<br />
measurable, annual IEP goals and transition<br />
services that will reasonably enable the student<br />
to meet the post-secondary goals.<br />
Indicator 14: Post-School Outcomes<br />
A. Percent of youth enrolled in higher<br />
education within one year of leaving high<br />
school.<br />
State<br />
Rate<br />
State<br />
Target<br />
Note: Data for this Indicator is from the on-site monitoring of LEAs for the given year.<br />
B. Percent of youth enrolled in higher<br />
education or competitively employed<br />
within one year of leaving high school.<br />
C. Percent of youth enrolled in higher<br />
education or in some other postsecondary<br />
education or training program; or<br />
competitively employed or in some other<br />
employment within one year of leaving<br />
high school.<br />
State<br />
Rate<br />
Indicator 20: Reported Data-Timely and Accurate*<br />
District submitted<br />
required data elements<br />
on or before due dates;<br />
made revisions within<br />
the alloted reveiw<br />
periods.<br />
Accurate and Timely<br />
Data Submission<br />
Overall (3-21)<br />
Early Childhood (3-5)<br />
School Age (5-21)<br />
State<br />
Target<br />
100.00%<br />
100.00%<br />
100.00%<br />
State<br />
Target<br />
LEA<br />
Rate<br />
LEA<br />
Rate<br />
Target Met by<br />
LEA (Y/N)<br />
Target Met<br />
by LEA<br />
(Y/N)<br />
Target Met<br />
by LEA<br />
(Y/N)<br />
*Data reviewed for timely and accurate submissions included all APSCN cycle data except for personnel<br />
Note: - - denotes not applicable<br />
96.19 100.00 — — N/A<br />
14.53<br />
State<br />
Rate<br />
49.42<br />
State<br />
Rate<br />
54.07<br />
13.00<br />
State<br />
Target<br />
49.00<br />
State<br />
Target<br />
60.00<br />
Y<br />
N/A<br />
Y<br />
— —<br />
LEA<br />
Rate<br />
— —<br />
LEA<br />
Rate<br />
— —<br />
N/A<br />
Target Met<br />
by LEA<br />
(Y/N)<br />
N/A<br />
Target Met<br />
by LEA<br />
(Y/N)<br />
N/A<br />
Page 5 of 5
<strong>ARKANSAS</strong> <strong>SPECIAL</strong> <strong>EDUCATION</strong><br />
<strong>DISTRICT</strong> <strong>ANNUAL</strong> PERFORMANCE REPORT<br />
2010/11 School Year<br />
Publication Date: March 2012<br />
Each State must have in place a State Performance Plan (SPP) to evaluate the State's efforts to meet the requirements and<br />
purposes of the implementation of the Individuals with Disabilities Education Act (IDEA). The SPP is a six-year plan, which<br />
describes Arkansas's performance on 20 indicators. The Office of Special Education Programs in the U. S. Department of<br />
Education requires that States report annually to the public on the performance of each local education agency (LEA) on 14 of<br />
20 indicators as compared with targets established by the State in the SPP. Arkansas will report indicators 1 through 14 and<br />
20 for each LEA serving children with disabilities (CWD). Any LEA not meeting targets on compliance indicators (0% for<br />
Indicators 4B, 09 & 10 and 100% for Indicators 11, 12, 13, and 20) are non-compliant with IDEA.<br />
There are no report changes for the 2010/11 school year profile; However, it is important to recognize that: .<br />
1. Indicator 01 (Graduation) is reported a year in arrear (2009/10 graduates) and is based on a four-year cohort. This<br />
means the rate is a measure of students who entered in ninth grade and graduate in four years. The calculation is a<br />
requirement under Title I of the Elementary and Secondary Education Act (ESEA).<br />
2. Indicator 02 (Drop out) is reported a year in arrear. This means the rate is a measure of students who dropped out in<br />
the 2009/10 school year. The Indicator 02 data are aligned with the Common Core of Data (CCD) requirements for<br />
grades 7-12.<br />
3. Indicator 04A and 4B (Suspension/Expulsion) is reported a year in arrear. This means the rate is a measure of<br />
students who had out-of-school suspensions and/or expulsions totaling more than 10 days.<br />
For a complete description of all the Indicators, please visit the special education website at<br />
http://arksped.k12.ar.us/sections/policy.html<br />
LEA: 7510 - TWO RIVERS SCHOOL <strong>DISTRICT</strong><br />
Indicator 01: Graduation Rates (2009/10 school year) Indicator 02: Dropout Rates (2009/10 school year)<br />
Percent of youth<br />
with IEPs<br />
graduating from<br />
high school with a<br />
regular diploma<br />
State<br />
Rate<br />
State<br />
Target<br />
75.76% 85.00%<br />
LEA<br />
Rate<br />
66.67%<br />
Target Met<br />
by LEA<br />
(Y/N)<br />
N<br />
Percent of<br />
youth with<br />
IEPs dropping<br />
out of high<br />
school<br />
State<br />
Rate<br />
Indicator 03: Assessment on Statewide Benchmark Exam (grades 3-8, 11)<br />
A) Adequate Yearly Progress<br />
n=40<br />
Literacy<br />
Mathematics<br />
Met Disability Subgroup "n"<br />
for Reporting Purposes (Y/N)<br />
State Target for % of Districts Meeting<br />
AYP for Disability Subgroup<br />
State<br />
Target<br />
3.06% 4.20%<br />
LEA<br />
Rate<br />
7.59%<br />
% of Districts Meeting AYP<br />
for Disability Subgroup<br />
Target Met by<br />
LEA (Y/N)<br />
N<br />
Target Met by<br />
LEA(Y/N)<br />
Overall Y 17.15% 6.25%<br />
N<br />
Y<br />
Y<br />
Note: For a district to qualify as having a disability subgroup it must have a minimum of 40 (n=40) students with disabilities in a school building.<br />
B) Participation<br />
Participation Rate: # of<br />
CWD Tested ÷ # of CWD<br />
Enrolled in grades tested.<br />
Participation Rate: Literacy<br />
Participation Rate: Math<br />
Note: - - denotes not applicable<br />
State<br />
Rate<br />
98.78%<br />
State<br />
Target<br />
95.00%<br />
LEA<br />
Rate<br />
100.00%<br />
Target Met<br />
by LEA (Y/N)<br />
98.61% 95.00% 100.00% Y<br />
Y<br />
C) Performance Proficiency<br />
Percent of CWD Scoring<br />
Proficient or Above<br />
Proficiency Rate: Literacy<br />
Proficiency Rate:<br />
Mathematics<br />
16.00%<br />
16.00%<br />
State<br />
Rate<br />
31.49%<br />
44.86%<br />
State<br />
Target<br />
45.22%<br />
51.14%<br />
LEA<br />
Rate<br />
22.99%<br />
45.78%<br />
Y<br />
N<br />
Target<br />
Met by<br />
LEA (Y/N)<br />
N<br />
N<br />
Page 1 of 5
LEA: 7510 - TWO RIVERS SCHOOL <strong>DISTRICT</strong><br />
Indicator 04: Out-of-School Suspensions and Expulsions (2009/10 school year)<br />
A) Suspension/Expulsion<br />
Percent difference of CWD with out-of- school suspensions and<br />
expulsions totaling greater than 10 days in a school year as<br />
compared to the same data for general education students in<br />
the district.<br />
B) Suspension/Expulsion by Race and Ethnicity<br />
Percent of districts that have: (a) a significant discrepancy, by race or<br />
ethnicity, in the rate of suspensions and expulsions of greater than 10<br />
days in a school year for children with IEPs; and (b) policies,<br />
procedures or practices that contribute to the significant discrepancy<br />
and do not comply with requirements relating to the development<br />
and implementation of IEPs, the use of positive behavioral<br />
interventions and supports, and procedural safeguards.<br />
Indicator 05: School Age (5-21) Least Restrictive Environment<br />
A) In the Regular Class 80% or more of the day<br />
Percent of CWD with<br />
IEPs receiving instruction<br />
in the regular class 80%<br />
or more of the day.<br />
State<br />
Rate<br />
State<br />
Target<br />
LEA<br />
Rate<br />
B) In the Regular Class less than 40% of the day<br />
Percent of CWD with<br />
IEPs receiving instruction<br />
in the regular class less<br />
than 60% of the day.<br />
53.87% 59.77%<br />
State<br />
Rate<br />
State<br />
Target<br />
12.42% 12.51%<br />
58.99%<br />
LEA<br />
Rate<br />
10.67%<br />
C) Other Settings outside the regular class<br />
Percent of CWD with IEPs served in<br />
public or private separate schools,<br />
residential placements, or<br />
homebound/hospital placements.<br />
State<br />
Rate<br />
State<br />
Target<br />
2.80% 2.56%<br />
Target Met<br />
by LEA (Y/N)<br />
N<br />
Target Met<br />
by LEA (Y/N)<br />
Y<br />
LEA<br />
Rate<br />
0.00%<br />
Target Met<br />
by LEA(Y/N)<br />
Indicator 06: Early Childhood (3-5) Least Restrictive Environment<br />
A) Regular Early Childhood Program<br />
Percent of children (aged 3 through 5) with IEPs attending a regular<br />
early childhood program and receiving the majority of special<br />
education and related services in the regular early childhood program<br />
Allowable<br />
Difference<br />
LEA: 7510 - TWO RIVERS SCHOOL <strong>DISTRICT</strong><br />
Indicator 07: Preschool (3-5) Outcomes<br />
a) Percent of preschool CWD<br />
children who did not<br />
improve functioning.<br />
b) Percent of preschool CWD<br />
who improved but whose<br />
functioning remained below<br />
same age peers.<br />
c) Percent of preschool CWD<br />
who improved at a level<br />
nearer to same aged peers.<br />
d) Percent of preschool CWD<br />
who improved functioning to<br />
reach a level comparable to<br />
same age peers.<br />
e) Percent of preschool CWD<br />
children who maintain<br />
functioning at a level<br />
comparable to same aged<br />
peers.<br />
Summary<br />
Statements<br />
1) Of those preschool<br />
children who entered<br />
the preschool program<br />
below age expectations<br />
in each Outcome, the<br />
percent who<br />
substantially increased<br />
their rate of growth by<br />
the time they turned 6<br />
years of age or exited<br />
the program.<br />
2) The percent of<br />
preschool children who<br />
were functioning<br />
within age expectations<br />
in each Outcome by the<br />
time they turned 6<br />
years of age or exited<br />
A) Positive Social -Emotional<br />
Skills*<br />
State<br />
Rate<br />
A) Positive Social -<br />
Emotional Skills<br />
(Including social<br />
relationships)<br />
State<br />
Rate<br />
2.14%<br />
5.31%<br />
25.97%<br />
38.22%<br />
28.36%<br />
State<br />
Target<br />
LEA<br />
Rate<br />
LEA<br />
Rate<br />
— —<br />
— —<br />
— —<br />
— —<br />
— —<br />
Target<br />
Met by<br />
LEA(Y/N)<br />
B) Acquisition and Use of<br />
Knowledge and Skills<br />
(Including early language/<br />
communication and early literacy)<br />
B) Acquisition and Use of<br />
Knowledge and Skills **<br />
State<br />
Rate<br />
1.75%<br />
6.59%<br />
34.23%<br />
43.51%<br />
13.92%<br />
State<br />
Target<br />
LEA<br />
Rate<br />
Target<br />
Met by<br />
LEA(Y/N)<br />
C) Use of Appropriate Behaviors<br />
to Meet Their Needs<br />
State<br />
Rate<br />
State<br />
Target<br />
LEA<br />
Rate<br />
Target<br />
Met by<br />
LEA(Y/N)<br />
89.61% 90.50% — — N/A 90.31% 90.50% — — N/A 90.82% 92.50% — — N/A<br />
66.58% 69.50% — — N/A 57.43% 60.50% — — N/A 76.69% 78.50% — — N/A<br />
NOTE: * Including social relationships ** Including early language/ communication and early literacy<br />
Note: - - denotes not applicable<br />
State<br />
Rate<br />
LEA<br />
Rate<br />
— —<br />
— —<br />
— —<br />
— —<br />
— —<br />
C) Use of<br />
Appropriate<br />
Behaviors to<br />
Meet Their Needs<br />
State<br />
Rate<br />
4.51%<br />
17.34%<br />
41.72%<br />
34.97%<br />
LEA<br />
Rate<br />
1.46% — —<br />
— —<br />
— —<br />
— —<br />
— —<br />
Page 3 of 5
LEA: 7510 - TWO RIVERS SCHOOL <strong>DISTRICT</strong><br />
Indicator 08: Parent Involvement<br />
Percent of surveyed<br />
parents who reported<br />
school facilitated parent<br />
involvement as a means<br />
of improving services<br />
and results for children<br />
with disabilities.<br />
Early Childhood<br />
(3-5)<br />
School Age<br />
(5-21)<br />
State<br />
Rate<br />
90.47%<br />
95.05%<br />
Indicator 09: Disproportionality - Eligibility<br />
Disproportionate representation of racial<br />
and ethnic groups in special education and<br />
related services that is a result of<br />
inappropriate identification (e.g.<br />
monitoring data, review of policies,<br />
practices, and procedures under 618(d),<br />
etc.).<br />
State<br />
Rate<br />
State<br />
Target<br />
88.00%<br />
96.00%<br />
State<br />
Target<br />
0.00% 0.00%<br />
LEA<br />
Rate<br />
— —<br />
87.50%<br />
Indicator 10: Disproportionality-Child with a Disability<br />
Disproportionate representation of racial<br />
and ethnic groups in specific disability<br />
categories that is a result of inappropriate<br />
identification (e.g. monitoring data, review<br />
of policies, practices, and procedures under<br />
618(d), etc.).<br />
Indicator 11: Child Find<br />
Percent of children with<br />
parental consent to evaluate<br />
who are evaluated within<br />
the State established timeline<br />
of 60 days.<br />
Overall<br />
(3-21)<br />
Early Childhood<br />
(3-5)<br />
School Age<br />
(5-21)<br />
State<br />
Rate<br />
0.00%<br />
Indicator 12: Early Childhood Transition<br />
Percent of children referred by Part C prior to<br />
age 3, who are found eligible for Part B, and<br />
who have an IEP developed and implemented<br />
by their third birthday.<br />
Note: - - denotes not applicable<br />
State<br />
Rate<br />
99.41%<br />
99.70%<br />
98.97%<br />
State<br />
Rate<br />
State<br />
Target<br />
0.00%<br />
State<br />
Target<br />
100.00%<br />
100.00%<br />
100.00%<br />
State<br />
Target<br />
Target Met by<br />
LEA (Y/N)<br />
Y<br />
Target Met by<br />
LEA (Y/N)<br />
Y<br />
LEA<br />
Rate<br />
100.00%<br />
— —<br />
100.00%<br />
LEA<br />
Rate<br />
Target Met by<br />
LEA (Y/N)<br />
N/A<br />
N<br />
Note: The target for Indicator 09 is to have zero percent<br />
(0%) of districts identified as having disproportionate<br />
representation as a result of inappropriate<br />
identification in eligibility.<br />
Note: The target for Indicator 10 is to have zero<br />
percent (0%) of districts identified as having<br />
disproportionate representation as a result of<br />
inappropriate identification in a disability<br />
category.<br />
Target Met by<br />
LEA (Y/N)<br />
N/A<br />
Y<br />
Target Met<br />
by LEA<br />
(Y/N)<br />
99.21% 100.00% - - N/A<br />
Y<br />
Note: * Indicates a zero reponse rate for the<br />
district.<br />
Page 4 of 5
LEA: 7510 - TWO RIVERS SCHOOL <strong>DISTRICT</strong><br />
Indicator 13: Secondary Transition<br />
Percent of youth with disabilities aged 16 and<br />
up with an IEP that includes coordinated,<br />
measurable, annual IEP goals and transition<br />
services that will reasonably enable the student<br />
to meet the post-secondary goals.<br />
Indicator 14: Post-School Outcomes<br />
A. Percent of youth enrolled in higher<br />
education within one year of leaving high<br />
school.<br />
State<br />
Rate<br />
State<br />
Target<br />
Note: Data for this Indicator is from the on-site monitoring of LEAs for the given year.<br />
B. Percent of youth enrolled in higher<br />
education or competitively employed<br />
within one year of leaving high school.<br />
C. Percent of youth enrolled in higher<br />
education or in some other postsecondary<br />
education or training program; or<br />
competitively employed or in some other<br />
employment within one year of leaving<br />
high school.<br />
State<br />
Rate<br />
Indicator 20: Reported Data-Timely and Accurate*<br />
District submitted<br />
required data elements<br />
on or before due dates;<br />
made revisions within<br />
the alloted reveiw<br />
periods.<br />
Accurate and Timely<br />
Data Submission<br />
Overall (3-21)<br />
Early Childhood (3-5)<br />
School Age (5-21)<br />
State<br />
Target<br />
100.00%<br />
100.00%<br />
100.00%<br />
State<br />
Target<br />
LEA<br />
Rate<br />
LEA<br />
Rate<br />
Target Met by<br />
LEA (Y/N)<br />
Target Met<br />
by LEA<br />
(Y/N)<br />
Target Met<br />
by LEA<br />
(Y/N)<br />
*Data reviewed for timely and accurate submissions included all APSCN cycle data except for personnel<br />
Note: - - denotes not applicable<br />
96.19 100.00 100.00% Y<br />
14.53<br />
State<br />
Rate<br />
49.42<br />
State<br />
Rate<br />
54.07<br />
13.00<br />
State<br />
Target<br />
49.00<br />
State<br />
Target<br />
60.00<br />
Y<br />
N/A<br />
Y<br />
— —<br />
LEA<br />
Rate<br />
— —<br />
LEA<br />
Rate<br />
— —<br />
N/A<br />
Target Met<br />
by LEA<br />
(Y/N)<br />
N/A<br />
Target Met<br />
by LEA<br />
(Y/N)<br />
N/A<br />
Page 5 of 5
<strong>ARKANSAS</strong> <strong>SPECIAL</strong> <strong>EDUCATION</strong><br />
<strong>DISTRICT</strong> <strong>ANNUAL</strong> PERFORMANCE REPORT<br />
2010/11 School Year<br />
Publication Date: March 2012<br />
Each State must have in place a State Performance Plan (SPP) to evaluate the State's efforts to meet the requirements and<br />
purposes of the implementation of the Individuals with Disabilities Education Act (IDEA). The SPP is a six-year plan, which<br />
describes Arkansas's performance on 20 indicators. The Office of Special Education Programs in the U. S. Department of<br />
Education requires that States report annually to the public on the performance of each local education agency (LEA) on 14 of<br />
20 indicators as compared with targets established by the State in the SPP. Arkansas will report indicators 1 through 14 and<br />
20 for each LEA serving children with disabilities (CWD). Any LEA not meeting targets on compliance indicators (0% for<br />
Indicators 4B, 09 & 10 and 100% for Indicators 11, 12, 13, and 20) are non-compliant with IDEA.<br />
There are no report changes for the 2010/11 school year profile; However, it is important to recognize that: .<br />
1. Indicator 01 (Graduation) is reported a year in arrear (2009/10 graduates) and is based on a four-year cohort. This<br />
means the rate is a measure of students who entered in ninth grade and graduate in four years. The calculation is a<br />
requirement under Title I of the Elementary and Secondary Education Act (ESEA).<br />
2. Indicator 02 (Drop out) is reported a year in arrear. This means the rate is a measure of students who dropped out in<br />
the 2009/10 school year. The Indicator 02 data are aligned with the Common Core of Data (CCD) requirements for<br />
grades 7-12.<br />
3. Indicator 04A and 4B (Suspension/Expulsion) is reported a year in arrear. This means the rate is a measure of<br />
students who had out-of-school suspensions and/or expulsions totaling more than 10 days.<br />
For a complete description of all the Indicators, please visit the special education website at<br />
http://arksped.k12.ar.us/sections/policy.html<br />
LEA: 9150 - DHS: DIVISION of DEVELOPMENTAL DISABILITIES SERVICES<br />
Indicator 01: Graduation Rates (2009/10 school year) Indicator 02: Dropout Rates (2009/10 school year)<br />
Percent of youth<br />
with IEPs<br />
graduating from<br />
high school with a<br />
regular diploma<br />
State<br />
Rate<br />
State<br />
Target<br />
75.76% 85.00%<br />
LEA<br />
Rate<br />
— —<br />
Target Met<br />
by LEA<br />
(Y/N)<br />
NA<br />
Percent of<br />
youth with<br />
IEPs dropping<br />
out of high<br />
school<br />
State<br />
Rate<br />
Indicator 03: Assessment on Statewide Benchmark Exam (grades 3-8, 11)<br />
A) Adequate Yearly Progress<br />
n=40<br />
Literacy<br />
Mathematics<br />
Met Disability Subgroup "n"<br />
for Reporting Purposes (Y/N)<br />
State Target for % of Districts Meeting<br />
AYP for Disability Subgroup<br />
State<br />
Target<br />
3.06% 4.20%<br />
LEA<br />
Rate<br />
— —<br />
% of Districts Meeting AYP<br />
for Disability Subgroup<br />
Target Met by<br />
LEA (Y/N)<br />
N/A<br />
Target Met by<br />
LEA(Y/N)<br />
Overall 17.15% 6.25%<br />
N/A<br />
Note: For a district to qualify as having a disability subgroup it must have a minimum of 40 (n=40) students with disabilities in a school building.<br />
B) Participation<br />
Participation Rate: # of<br />
CWD Tested ÷ # of CWD<br />
Enrolled in grades tested.<br />
Participation Rate: Literacy<br />
Participation Rate: Math<br />
Note: - - denotes not applicable<br />
State<br />
Rate<br />
98.78%<br />
State<br />
Target<br />
95.00%<br />
LEA<br />
Rate<br />
— —<br />
Target Met<br />
by LEA (Y/N)<br />
N/A<br />
98.61% 95.00% — — N/A<br />
C) Performance Proficiency<br />
Percent of CWD Scoring<br />
Proficient or Above<br />
Proficiency Rate: Literacy<br />
Proficiency Rate:<br />
Mathematics<br />
16.00%<br />
16.00%<br />
State<br />
Rate<br />
31.49%<br />
44.86%<br />
State<br />
Target<br />
45.22%<br />
51.14%<br />
LEA<br />
Rate<br />
— —<br />
— —<br />
N/A<br />
N/A<br />
Target<br />
Met by<br />
LEA (Y/N)<br />
N/A<br />
N/A<br />
Page 1 of 5
LEA: 9150 - DHS: DIVISION of DEVELOPMENTAL DISABILITIES SERVICES<br />
Indicator 04: Out-of-School Suspensions and Expulsions (2009/10 school year)<br />
A) Suspension/Expulsion<br />
Percent difference of CWD with out-of- school suspensions and<br />
expulsions totaling greater than 10 days in a school year as<br />
compared to the same data for general education students in<br />
the district.<br />
B) Suspension/Expulsion by Race and Ethnicity<br />
Percent of districts that have: (a) a significant discrepancy, by race or<br />
ethnicity, in the rate of suspensions and expulsions of greater than 10<br />
days in a school year for children with IEPs; and (b) policies,<br />
procedures or practices that contribute to the significant discrepancy<br />
and do not comply with requirements relating to the development<br />
and implementation of IEPs, the use of positive behavioral<br />
interventions and supports, and procedural safeguards.<br />
Indicator 05: School Age (5-21) Least Restrictive Environment<br />
A) In the Regular Class 80% or more of the day<br />
Percent of CWD with<br />
IEPs receiving instruction<br />
in the regular class 80%<br />
or more of the day.<br />
State<br />
Rate<br />
State<br />
Target<br />
LEA<br />
Rate<br />
B) In the Regular Class less than 40% of the day<br />
Percent of CWD with<br />
IEPs receiving instruction<br />
in the regular class less<br />
than 60% of the day.<br />
53.87% 59.77%<br />
State<br />
Rate<br />
State<br />
Target<br />
12.42% 12.51%<br />
— —<br />
LEA<br />
Rate<br />
— —<br />
C) Other Settings outside the regular class<br />
Percent of CWD with IEPs served in<br />
public or private separate schools,<br />
residential placements, or<br />
homebound/hospital placements.<br />
State<br />
Rate<br />
State<br />
Target<br />
2.80% 2.56%<br />
Target Met<br />
by LEA (Y/N)<br />
N/A<br />
Target Met<br />
by LEA (Y/N)<br />
N/A<br />
LEA<br />
Rate<br />
100.00%<br />
Target Met<br />
by LEA(Y/N)<br />
Indicator 06: Early Childhood (3-5) Least Restrictive Environment<br />
A) Regular Early Childhood Program<br />
Percent of children (aged 3 through 5) with IEPs attending a regular<br />
early childhood program and receiving the majority of special<br />
education and related services in the regular early childhood program<br />
Allowable<br />
Difference<br />
LEA: 9150 - DHS: DIVISION of DEVELOPMENTAL DISABILITIES SERVICES<br />
Indicator 07: Preschool (3-5) Outcomes<br />
a) Percent of preschool CWD<br />
children who did not<br />
improve functioning.<br />
b) Percent of preschool CWD<br />
who improved but whose<br />
functioning remained below<br />
same age peers.<br />
c) Percent of preschool CWD<br />
who improved at a level<br />
nearer to same aged peers.<br />
d) Percent of preschool CWD<br />
who improved functioning to<br />
reach a level comparable to<br />
same age peers.<br />
e) Percent of preschool CWD<br />
children who maintain<br />
functioning at a level<br />
comparable to same aged<br />
peers.<br />
Summary<br />
Statements<br />
1) Of those preschool<br />
children who entered<br />
the preschool program<br />
below age expectations<br />
in each Outcome, the<br />
percent who<br />
substantially increased<br />
their rate of growth by<br />
the time they turned 6<br />
years of age or exited<br />
the program.<br />
2) The percent of<br />
preschool children who<br />
were functioning<br />
within age expectations<br />
in each Outcome by the<br />
time they turned 6<br />
years of age or exited<br />
A) Positive Social -Emotional<br />
Skills*<br />
State<br />
Rate<br />
A) Positive Social -<br />
Emotional Skills<br />
(Including social<br />
relationships)<br />
State<br />
Rate<br />
2.14%<br />
5.31%<br />
25.97%<br />
38.22%<br />
28.36%<br />
State<br />
Target<br />
LEA<br />
Rate<br />
LEA<br />
Rate<br />
3.54%<br />
7.30%<br />
51.07%<br />
34.12%<br />
3.86%<br />
Target<br />
Met by<br />
LEA(Y/N)<br />
B) Acquisition and Use of<br />
Knowledge and Skills<br />
(Including early language/<br />
communication and early literacy)<br />
B) Acquisition and Use of<br />
Knowledge and Skills **<br />
State<br />
Rate<br />
1.75%<br />
6.59%<br />
34.23%<br />
43.51%<br />
13.92%<br />
State<br />
Target<br />
LEA<br />
Rate<br />
Target<br />
Met by<br />
LEA(Y/N)<br />
C) Use of Appropriate Behaviors<br />
to Meet Their Needs<br />
State<br />
Rate<br />
State<br />
Target<br />
LEA<br />
Rate<br />
Target<br />
Met by<br />
LEA(Y/N)<br />
89.61% 90.50% 88.72% N 90.31% 90.50% 88.52% N 90.82% 92.50% 90.48% N<br />
66.58% 69.50% 38.02% N 57.43% 60.50% 34.37% N 76.69% 78.50% 50.59% N<br />
NOTE: * Including social relationships ** Including early language/ communication and early literacy<br />
Note: - - denotes not applicable<br />
State<br />
Rate<br />
LEA<br />
Rate<br />
3.65%<br />
7.40%<br />
54.51%<br />
30.69%<br />
3.65%<br />
C) Use of<br />
Appropriate<br />
Behaviors to<br />
Meet Their Needs<br />
State<br />
Rate<br />
4.51%<br />
17.34%<br />
41.72%<br />
34.97%<br />
LEA<br />
Rate<br />
1.46% 2.47%<br />
6.33%<br />
40.56%<br />
43.03%<br />
7.51%<br />
Page 3 of 5
LEA: 9150 - DHS: DIVISION of DEVELOPMENTAL DISABILITIES SERVICES<br />
Indicator 08: Parent Involvement<br />
Percent of surveyed<br />
parents who reported<br />
school facilitated parent<br />
involvement as a means<br />
of improving services<br />
and results for children<br />
with disabilities.<br />
Early Childhood<br />
(3-5)<br />
School Age<br />
(5-21)<br />
State<br />
Rate<br />
90.47%<br />
95.05%<br />
Indicator 09: Disproportionality - Eligibility<br />
Disproportionate representation of racial<br />
and ethnic groups in special education and<br />
related services that is a result of<br />
inappropriate identification (e.g.<br />
monitoring data, review of policies,<br />
practices, and procedures under 618(d),<br />
etc.).<br />
State<br />
Rate<br />
State<br />
Target<br />
88.00%<br />
96.00%<br />
State<br />
Target<br />
0.00% 0.00%<br />
LEA<br />
Rate<br />
88.64%<br />
100.00%<br />
Indicator 10: Disproportionality-Child with a Disability<br />
Disproportionate representation of racial<br />
and ethnic groups in specific disability<br />
categories that is a result of inappropriate<br />
identification (e.g. monitoring data, review<br />
of policies, practices, and procedures under<br />
618(d), etc.).<br />
Indicator 11: Child Find<br />
Percent of children with<br />
parental consent to evaluate<br />
who are evaluated within<br />
the State established timeline<br />
of 60 days.<br />
Overall<br />
(3-21)<br />
Early Childhood<br />
(3-5)<br />
School Age<br />
(5-21)<br />
State<br />
Rate<br />
0.00%<br />
Indicator 12: Early Childhood Transition<br />
Percent of children referred by Part C prior to<br />
age 3, who are found eligible for Part B, and<br />
who have an IEP developed and implemented<br />
by their third birthday.<br />
Note: - - denotes not applicable<br />
State<br />
Rate<br />
99.41%<br />
99.70%<br />
98.97%<br />
State<br />
Rate<br />
State<br />
Target<br />
0.00%<br />
State<br />
Target<br />
100.00%<br />
100.00%<br />
100.00%<br />
State<br />
Target<br />
Target Met by<br />
LEA (Y/N)<br />
N/A<br />
Target Met by<br />
LEA (Y/N)<br />
N/A<br />
LEA<br />
Rate<br />
99.10%<br />
99.10%<br />
— —<br />
LEA<br />
Rate<br />
Target Met by<br />
LEA (Y/N)<br />
Y<br />
Y<br />
Note: The target for Indicator 09 is to have zero percent<br />
(0%) of districts identified as having disproportionate<br />
representation as a result of inappropriate<br />
identification in eligibility.<br />
Note: The target for Indicator 10 is to have zero<br />
percent (0%) of districts identified as having<br />
disproportionate representation as a result of<br />
inappropriate identification in a disability<br />
category.<br />
Target Met by<br />
LEA (Y/N)<br />
N<br />
N/A<br />
Target Met<br />
by LEA<br />
(Y/N)<br />
99.21% 100.00% 99.01% N<br />
N<br />
Note: * Indicates a zero reponse rate for the<br />
district.<br />
Page 4 of 5
LEA: 9150 - DHS: DIVISION of DEVELOPMENTAL DISABILITIES SERVICES<br />
Indicator 13: Secondary Transition<br />
Percent of youth with disabilities aged 16 and<br />
up with an IEP that includes coordinated,<br />
measurable, annual IEP goals and transition<br />
services that will reasonably enable the student<br />
to meet the post-secondary goals.<br />
Indicator 14: Post-School Outcomes<br />
A. Percent of youth enrolled in higher<br />
education within one year of leaving high<br />
school.<br />
State<br />
Rate<br />
State<br />
Target<br />
Note: Data for this Indicator is from the on-site monitoring of LEAs for the given year.<br />
B. Percent of youth enrolled in higher<br />
education or competitively employed<br />
within one year of leaving high school.<br />
C. Percent of youth enrolled in higher<br />
education or in some other postsecondary<br />
education or training program; or<br />
competitively employed or in some other<br />
employment within one year of leaving<br />
high school.<br />
State<br />
Rate<br />
Indicator 20: Reported Data-Timely and Accurate*<br />
District submitted<br />
required data elements<br />
on or before due dates;<br />
made revisions within<br />
the alloted reveiw<br />
periods.<br />
Accurate and Timely<br />
Data Submission<br />
Overall (3-21)<br />
Early Childhood (3-5)<br />
School Age (5-21)<br />
State<br />
Target<br />
100.00%<br />
100.00%<br />
100.00%<br />
State<br />
Target<br />
LEA<br />
Rate<br />
LEA<br />
Rate<br />
Target Met by<br />
LEA (Y/N)<br />
Target Met<br />
by LEA<br />
(Y/N)<br />
Target Met<br />
by LEA<br />
(Y/N)<br />
*Data reviewed for timely and accurate submissions included all APSCN cycle data except for personnel<br />
Note: - - denotes not applicable<br />
96.19 100.00 — — N/A<br />
14.53<br />
State<br />
Rate<br />
49.42<br />
State<br />
Rate<br />
54.07<br />
13.00<br />
State<br />
Target<br />
49.00<br />
State<br />
Target<br />
60.00<br />
N<br />
N<br />
Y<br />
— —<br />
LEA<br />
Rate<br />
— —<br />
LEA<br />
Rate<br />
— —<br />
N/A<br />
Target Met<br />
by LEA<br />
(Y/N)<br />
N/A<br />
Target Met<br />
by LEA<br />
(Y/N)<br />
N/A<br />
Page 5 of 5