- Page 1 and 2: LEA: 0101 - DEWITT SCHOOL DISTRICT
- Page 3 and 4: LEA: 0101 - DEWITT SCHOOL DISTRICT
- Page 5 and 6: LEA: 0101 - DEWITT SCHOOL DISTRICT
- Page 7 and 8: LEA: 0104 - STUTTGART SCHOOL DISTRI
- Page 9 and 10: LEA: 0104 - STUTTGART SCHOOL DISTRI
- Page 11 and 12: LEA: 0201 - CROSSETT SCHOOL DISTRIC
- Page 13 and 14: LEA: 0201 - CROSSETT SCHOOL DISTRIC
- Page 15: LEA: 0201 - CROSSETT SCHOOL DISTRIC
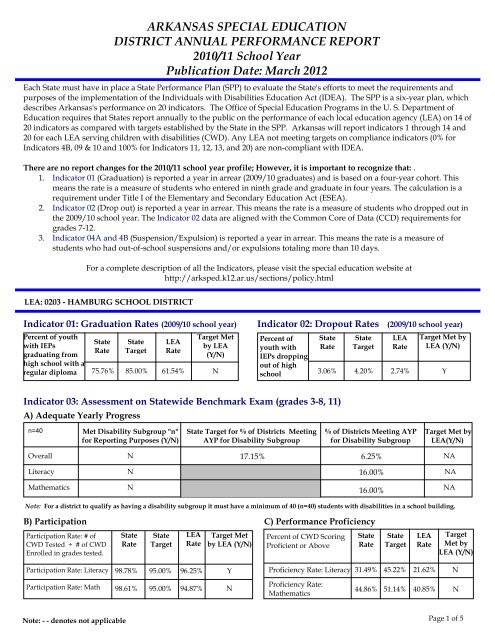
- Page 19 and 20: LEA: 0203 - HAMBURG SCHOOL DISTRICT
- Page 21 and 22: LEA: 0302 - COTTER SCHOOL DISTRICT
- Page 23 and 24: LEA: 0302 - COTTER SCHOOL DISTRICT
- Page 25 and 26: LEA: 0302 - COTTER SCHOOL DISTRICT
- Page 27 and 28: LEA: 0303 - MOUNTAIN HOME SCHOOL DI
- Page 29 and 30: LEA: 0303 - MOUNTAIN HOME SCHOOL DI
- Page 31 and 32: LEA: 0304 - NORFORK SCHOOL DISTRICT
- Page 33 and 34: LEA: 0304 - NORFORK SCHOOL DISTRICT
- Page 35 and 36: LEA: 0304 - NORFORK SCHOOL DISTRICT
- Page 37 and 38: LEA: 0401 - BENTONVILLE SCHOOL DIST
- Page 39 and 40: LEA: 0401 - BENTONVILLE SCHOOL DIST
- Page 41 and 42: LEA: 0402 - DECATUR SCHOOL DISTRICT
- Page 43 and 44: LEA: 0402 - DECATUR SCHOOL DISTRICT
- Page 45 and 46: LEA: 0402 - DECATUR SCHOOL DISTRICT
- Page 47 and 48: LEA: 0403 - GENTRY SCHOOL DISTRICT
- Page 49 and 50: LEA: 0403 - GENTRY SCHOOL DISTRICT
- Page 51 and 52: LEA: 0404 - GRAVETTE SCHOOL DISTRIC
- Page 53 and 54: LEA: 0404 - GRAVETTE SCHOOL DISTRIC
- Page 55 and 56: LEA: 0404 - GRAVETTE SCHOOL DISTRIC
- Page 57 and 58: LEA: 0405 - ROGERS SCHOOL DISTRICT
- Page 59 and 60: LEA: 0405 - ROGERS SCHOOL DISTRICT
- Page 61 and 62: ARKANSAS SPECIAL EDUCATION DISTRICT
- Page 63 and 64: LEA: 0406 - SILOAM SPRINGS SCHOOL D
- Page 65 and 66: LEA: 0406 - SILOAM SPRINGS SCHOOL D
- Page 67 and 68:
LEA: 0407 - PEA RIDGE SCHOOL DISTRI
- Page 69 and 70:
LEA: 0407 - PEA RIDGE SCHOOL DISTRI
- Page 71 and 72:
ARKANSAS SPECIAL EDUCATION DISTRICT
- Page 73 and 74:
LEA: 0440 - BENTON COUNTY SCHOOL OF
- Page 75 and 76:
LEA: 0440 - BENTON COUNTY SCHOOL OF
- Page 77 and 78:
LEA: 0501 - ALPENA SCHOOL DISTRICT
- Page 79 and 80:
LEA: 0501 - ALPENA SCHOOL DISTRICT
- Page 81 and 82:
LEA: 0502 - BERGMAN SCHOOL DISTRICT
- Page 83 and 84:
LEA: 0502 - BERGMAN SCHOOL DISTRICT
- Page 85 and 86:
LEA: 0502 - BERGMAN SCHOOL DISTRICT
- Page 87 and 88:
LEA: 0503 - HARRISON SCHOOL DISTRIC
- Page 89 and 90:
LEA: 0503 - HARRISON SCHOOL DISTRIC
- Page 91 and 92:
LEA: 0504 - OMAHA SCHOOL DISTRICT A
- Page 93 and 94:
LEA: 0504 - OMAHA SCHOOL DISTRICT I
- Page 95 and 96:
LEA: 0504 - OMAHA SCHOOL DISTRICT I
- Page 97 and 98:
LEA: 0505 - VALLEY SPRINGS SCHOOL D
- Page 99 and 100:
LEA: 0505 - VALLEY SPRINGS SCHOOL D
- Page 101 and 102:
LEA: 0506 - LEAD HILL SCHOOL DISTRI
- Page 103 and 104:
LEA: 0506 - LEAD HILL SCHOOL DISTRI
- Page 105 and 106:
LEA: 0506 - LEAD HILL SCHOOL DISTRI
- Page 107 and 108:
LEA: 0601 - HERMITAGE SCHOOL DISTRI
- Page 109 and 110:
LEA: 0601 - HERMITAGE SCHOOL DISTRI
- Page 111 and 112:
LEA: 0602 - WARREN SCHOOL DISTRICT
- Page 113 and 114:
LEA: 0602 - WARREN SCHOOL DISTRICT
- Page 115 and 116:
LEA: 0602 - WARREN SCHOOL DISTRICT
- Page 117 and 118:
LEA: 0701 - HAMPTON SCHOOL DISTRICT
- Page 119 and 120:
LEA: 0701 - HAMPTON SCHOOL DISTRICT
- Page 121 and 122:
LEA: 0801 - BERRYVILLE SCHOOL DISTR
- Page 123 and 124:
LEA: 0801 - BERRYVILLE SCHOOL DISTR
- Page 125 and 126:
LEA: 0801 - BERRYVILLE SCHOOL DISTR
- Page 127 and 128:
LEA: 0802 - EUREKA SPRINGS SCHOOL D
- Page 129 and 130:
LEA: 0802 - EUREKA SPRINGS SCHOOL D
- Page 131 and 132:
ARKANSAS SPECIAL EDUCATION DISTRICT
- Page 133 and 134:
LEA: 0803 - GREEN FOREST SCHOOL DIS
- Page 135 and 136:
LEA: 0803 - GREEN FOREST SCHOOL DIS
- Page 137 and 138:
LEA: 0901 - DERMOTT SCHOOL DISTRICT
- Page 139 and 140:
LEA: 0901 - DERMOTT SCHOOL DISTRICT
- Page 141 and 142:
LEA: 0903 - LAKESIDE SCHOOL DISTRIC
- Page 143 and 144:
LEA: 0903 - LAKESIDE SCHOOL DISTRIC
- Page 145 and 146:
LEA: 0903 - LAKESIDE SCHOOL DISTRIC
- Page 147 and 148:
LEA: 1002 - ARKADELPHIA SCHOOL DIST
- Page 149 and 150:
LEA: 1002 - ARKADELPHIA SCHOOL DIST
- Page 151 and 152:
LEA: 1003 - GURDON SCHOOL DISTRICT
- Page 153 and 154:
LEA: 1003 - GURDON SCHOOL DISTRICT
- Page 155 and 156:
LEA: 1003 - GURDON SCHOOL DISTRICT
- Page 157 and 158:
LEA: 1020 - DAWSON EDUCATION SERVIC
- Page 159 and 160:
LEA: 1020 - DAWSON EDUCATION SERVIC
- Page 161 and 162:
LEA: 1101 - CORNING SCHOOL DISTRICT
- Page 163 and 164:
LEA: 1101 - CORNING SCHOOL DISTRICT
- Page 165 and 166:
LEA: 1101 - CORNING SCHOOL DISTRICT
- Page 167 and 168:
LEA: 1104 - PIGGOTT SCHOOL DISTRICT
- Page 169 and 170:
LEA: 1104 - PIGGOTT SCHOOL DISTRICT
- Page 171 and 172:
LEA: 1106 - RECTOR SCHOOL DISTRICT
- Page 173 and 174:
LEA: 1106 - RECTOR SCHOOL DISTRICT
- Page 175 and 176:
LEA: 1106 - RECTOR SCHOOL DISTRICT
- Page 177 and 178:
LEA: 1201 - CONCORD SCHOOL DISTRICT
- Page 179 and 180:
LEA: 1201 - CONCORD SCHOOL DISTRICT
- Page 181 and 182:
ARKANSAS SPECIAL EDUCATION DISTRICT
- Page 183 and 184:
LEA: 1202 - HEBER SPRINGS SCHOOL DI
- Page 185 and 186:
LEA: 1202 - HEBER SPRINGS SCHOOL DI
- Page 187 and 188:
LEA: 1203 - QUITMAN SCHOOL DISTRICT
- Page 189 and 190:
LEA: 1203 - QUITMAN SCHOOL DISTRICT
- Page 191 and 192:
LEA: 1204 - WEST SIDE SCHOOL DISTRI
- Page 193 and 194:
LEA: 1204 - WEST SIDE SCHOOL DISTRI
- Page 195 and 196:
LEA: 1204 - WEST SIDE SCHOOL DISTRI
- Page 197 and 198:
LEA: 1304 - WOODLAWN SCHOOL DISTRIC
- Page 199 and 200:
LEA: 1304 - WOODLAWN SCHOOL DISTRIC
- Page 201 and 202:
ARKANSAS SPECIAL EDUCATION DISTRICT
- Page 203 and 204:
LEA: 1305 - CLEVELAND COUNTY SCHOOL
- Page 205 and 206:
LEA: 1305 - CLEVELAND COUNTY SCHOOL
- Page 207 and 208:
LEA: 1402 - MAGNOLIA SCHOOL DISTRIC
- Page 209 and 210:
LEA: 1402 - MAGNOLIA SCHOOL DISTRIC
- Page 211 and 212:
ARKANSAS SPECIAL EDUCATION DISTRICT
- Page 213 and 214:
LEA: 1408 - EMERSON-TAYLOR SCHOOL D
- Page 215 and 216:
LEA: 1408 - EMERSON-TAYLOR SCHOOL D
- Page 217 and 218:
LEA: 1503 - NEMO VISTA SCHOOL DISTR
- Page 219 and 220:
LEA: 1503 - NEMO VISTA SCHOOL DISTR
- Page 221 and 222:
ARKANSAS SPECIAL EDUCATION DISTRICT
- Page 223 and 224:
LEA: 1505 - WONDERVIEW SCHOOL DISTR
- Page 225 and 226:
LEA: 1505 - WONDERVIEW SCHOOL DISTR
- Page 227 and 228:
LEA: 1507 - SO. CONWAY CO. SCHOOL D
- Page 229 and 230:
LEA: 1507 - SO. CONWAY CO. SCHOOL D
- Page 231 and 232:
ARKANSAS SPECIAL EDUCATION DISTRICT
- Page 233 and 234:
LEA: 1520 - ARCH FORD EDUCATION SER
- Page 235 and 236:
LEA: 1520 - ARCH FORD EDUCATION SER
- Page 237 and 238:
LEA: 1601 - BAY SCHOOL DISTRICT Ind
- Page 239 and 240:
LEA: 1601 - BAY SCHOOL DISTRICT Ind
- Page 241 and 242:
ARKANSAS SPECIAL EDUCATION DISTRICT
- Page 243 and 244:
LEA: 1602 - WESTSIDE CONS. SCHOOL D
- Page 245 and 246:
LEA: 1602 - WESTSIDE CONS. SCHOOL D
- Page 247 and 248:
LEA: 1603 - BROOKLAND SCHOOL DISTRI
- Page 249 and 250:
LEA: 1603 - BROOKLAND SCHOOL DISTRI
- Page 251 and 252:
ARKANSAS SPECIAL EDUCATION DISTRICT
- Page 253 and 254:
LEA: 1605 - BUFFALO IS. CENTRAL SCH
- Page 255 and 256:
LEA: 1605 - BUFFALO IS. CENTRAL SCH
- Page 257 and 258:
LEA: 1608 - JONESBORO SCHOOL DISTRI
- Page 259 and 260:
LEA: 1608 - JONESBORO SCHOOL DISTRI
- Page 261 and 262:
LEA: 1611 - NETTLETON SCHOOL DISTRI
- Page 263 and 264:
LEA: 1611 - NETTLETON SCHOOL DISTRI
- Page 265 and 266:
LEA: 1611 - NETTLETON SCHOOL DISTRI
- Page 267 and 268:
LEA: 1612 - VALLEY VIEW SCHOOL DIST
- Page 269 and 270:
LEA: 1612 - VALLEY VIEW SCHOOL DIST
- Page 271 and 272:
LEA: 1613 - RIVERSIDE SCHOOL DISTRI
- Page 273 and 274:
LEA: 1613 - RIVERSIDE SCHOOL DISTRI
- Page 275 and 276:
LEA: 1613 - RIVERSIDE SCHOOL DISTRI
- Page 277 and 278:
LEA: 1701 - ALMA SCHOOL DISTRICT In
- Page 279 and 280:
LEA: 1701 - ALMA SCHOOL DISTRICT In
- Page 281 and 282:
ARKANSAS SPECIAL EDUCATION DISTRICT
- Page 283 and 284:
LEA: 1702 - CEDARVILLE SCHOOL DISTR
- Page 285 and 286:
LEA: 1702 - CEDARVILLE SCHOOL DISTR
- Page 287 and 288:
LEA: 1703 - MOUNTAINBURG SCHOOL DIS
- Page 289 and 290:
LEA: 1703 - MOUNTAINBURG SCHOOL DIS
- Page 291 and 292:
LEA: 1704 - MULBERRY SCHOOL DISTRIC
- Page 293 and 294:
LEA: 1704 - MULBERRY SCHOOL DISTRIC
- Page 295 and 296:
LEA: 1704 - MULBERRY SCHOOL DISTRIC
- Page 297 and 298:
LEA: 1705 - VAN BUREN SCHOOL DISTRI
- Page 299 and 300:
LEA: 1705 - VAN BUREN SCHOOL DISTRI
- Page 301 and 302:
LEA: 1802 - EARLE SCHOOL DISTRICT A
- Page 303 and 304:
LEA: 1802 - EARLE SCHOOL DISTRICT I
- Page 305 and 306:
LEA: 1802 - EARLE SCHOOL DISTRICT I
- Page 307 and 308:
LEA: 1803 - WEST MEMPHIS SCHOOL DIS
- Page 309 and 310:
LEA: 1803 - WEST MEMPHIS SCHOOL DIS
- Page 311 and 312:
LEA: 1804 - MARION SCHOOL DISTRICT
- Page 313 and 314:
LEA: 1804 - MARION SCHOOL DISTRICT
- Page 315 and 316:
LEA: 1804 - MARION SCHOOL DISTRICT
- Page 317 and 318:
LEA: 1901 - CROSS COUNTY SCHOOL DIS
- Page 319 and 320:
LEA: 1901 - CROSS COUNTY SCHOOL DIS
- Page 321 and 322:
LEA: 1905 - WYNNE SCHOOL DISTRICT A
- Page 323 and 324:
LEA: 1905 - WYNNE SCHOOL DISTRICT I
- Page 325 and 326:
LEA: 1905 - WYNNE SCHOOL DISTRICT I
- Page 327 and 328:
LEA: 2002 - FORDYCE SCHOOL DISTRICT
- Page 329 and 330:
LEA: 2002 - FORDYCE SCHOOL DISTRICT
- Page 331 and 332:
LEA: 2104 - DUMAS SCHOOL DISTRICT A
- Page 333 and 334:
LEA: 2104 - DUMAS SCHOOL DISTRICT I
- Page 335 and 336:
LEA: 2104 - DUMAS SCHOOL DISTRICT I
- Page 337 and 338:
LEA: 2105 - MCGEHEE SCHOOL DISTRICT
- Page 339 and 340:
LEA: 2105 - MCGEHEE SCHOOL DISTRICT
- Page 341 and 342:
ARKANSAS SPECIAL EDUCATION DISTRICT
- Page 343 and 344:
LEA: 2202 - DREW CENTRAL SCHOOL DIS
- Page 345 and 346:
LEA: 2202 - DREW CENTRAL SCHOOL DIS
- Page 347 and 348:
LEA: 2203 - MONTICELLO SCHOOL DISTR
- Page 349 and 350:
LEA: 2203 - MONTICELLO SCHOOL DISTR
- Page 351 and 352:
ARKANSAS SPECIAL EDUCATION DISTRICT
- Page 353 and 354:
LEA: 2220 - SOUTHEAST ARKANSAS EDUC
- Page 355 and 356:
LEA: 2220 - SOUTHEAST ARKANSAS EDUC
- Page 357 and 358:
LEA: 2301 - CONWAY SCHOOL DISTRICT
- Page 359 and 360:
LEA: 2301 - CONWAY SCHOOL DISTRICT
- Page 361 and 362:
ARKANSAS SPECIAL EDUCATION DISTRICT
- Page 363 and 364:
LEA: 2303 - GREENBRIER SCHOOL DISTR
- Page 365 and 366:
LEA: 2303 - GREENBRIER SCHOOL DISTR
- Page 367 and 368:
LEA: 2304 - GUY-PERKINS SCHOOL DIST
- Page 369 and 370:
LEA: 2304 - GUY-PERKINS SCHOOL DIST
- Page 371 and 372:
ARKANSAS SPECIAL EDUCATION DISTRICT
- Page 373 and 374:
LEA: 2305 - MAYFLOWER SCHOOL DISTRI
- Page 375 and 376:
LEA: 2305 - MAYFLOWER SCHOOL DISTRI
- Page 377 and 378:
LEA: 2306 - MT. VERNON/ENOLA SCHOOL
- Page 379 and 380:
LEA: 2306 - MT. VERNON/ENOLA SCHOOL
- Page 381 and 382:
LEA: 2307 - VILONIA SCHOOL DISTRICT
- Page 383 and 384:
LEA: 2307 - VILONIA SCHOOL DISTRICT
- Page 385 and 386:
LEA: 2307 - VILONIA SCHOOL DISTRICT
- Page 387 and 388:
LEA: 2402 - CHARLESTON SCHOOL DISTR
- Page 389 and 390:
LEA: 2402 - CHARLESTON SCHOOL DISTR
- Page 391 and 392:
ARKANSAS SPECIAL EDUCATION DISTRICT
- Page 393 and 394:
LEA: 2403 - COUNTY LINE SCHOOL DIST
- Page 395 and 396:
LEA: 2403 - COUNTY LINE SCHOOL DIST
- Page 397 and 398:
LEA: 2404 - OZARK SCHOOL DISTRICT I
- Page 399 and 400:
LEA: 2404 - OZARK SCHOOL DISTRICT I
- Page 401 and 402:
LEA: 2420 - WESTERN ARKANSAS CO-OP
- Page 403 and 404:
LEA: 2420 - WESTERN ARKANSAS CO-OP
- Page 405 and 406:
LEA: 2420 - WESTERN ARKANSAS CO-OP
- Page 407 and 408:
LEA: 2501 - MAMMOTH SPRING SCHOOL D
- Page 409 and 410:
LEA: 2501 - MAMMOTH SPRING SCHOOL D
- Page 411 and 412:
LEA: 2502 - SALEM SCHOOL DISTRICT A
- Page 413 and 414:
LEA: 2502 - SALEM SCHOOL DISTRICT I
- Page 415 and 416:
LEA: 2502 - SALEM SCHOOL DISTRICT I
- Page 417 and 418:
LEA: 2503 - VIOLA SCHOOL DISTRICT I
- Page 419 and 420:
LEA: 2503 - VIOLA SCHOOL DISTRICT I
- Page 421 and 422:
ARKANSAS SPECIAL EDUCATION DISTRICT
- Page 423 and 424:
LEA: 2601 - CUTTER-MORNING STAR SCH
- Page 425 and 426:
LEA: 2601 - CUTTER-MORNING STAR SCH
- Page 427 and 428:
LEA: 2602 - FOUNTAIN LAKE SCHOOL DI
- Page 429 and 430:
LEA: 2602 - FOUNTAIN LAKE SCHOOL DI
- Page 431 and 432:
ARKANSAS SPECIAL EDUCATION DISTRICT
- Page 433 and 434:
LEA: 2603 - HOT SPRINGS SCHOOL DIST
- Page 435 and 436:
LEA: 2603 - HOT SPRINGS SCHOOL DIST
- Page 437 and 438:
LEA: 2604 - JESSIEVILLE SCHOOL DIST
- Page 439 and 440:
LEA: 2604 - JESSIEVILLE SCHOOL DIST
- Page 441 and 442:
ARKANSAS SPECIAL EDUCATION DISTRICT
- Page 443 and 444:
LEA: 2605 - LAKE HAMILTON SCHOOL DI
- Page 445 and 446:
LEA: 2605 - LAKE HAMILTON SCHOOL DI
- Page 447 and 448:
LEA: 2606 - LAKESIDE SCHOOL DISTRIC
- Page 449 and 450:
LEA: 2606 - LAKESIDE SCHOOL DISTRIC
- Page 451 and 452:
ARKANSAS SPECIAL EDUCATION DISTRICT
- Page 453 and 454:
LEA: 2607 - MOUNTAIN PINE SCHOOL DI
- Page 455 and 456:
LEA: 2607 - MOUNTAIN PINE SCHOOL DI
- Page 457 and 458:
LEA: 2703 - POYEN SCHOOL DISTRICT I
- Page 459 and 460:
LEA: 2703 - POYEN SCHOOL DISTRICT I
- Page 461 and 462:
LEA: 2705 - SHERIDAN SCHOOL DISTRIC
- Page 463 and 464:
LEA: 2705 - SHERIDAN SCHOOL DISTRIC
- Page 465 and 466:
LEA: 2705 - SHERIDAN SCHOOL DISTRIC
- Page 467 and 468:
LEA: 2803 - MARMADUKE SCHOOL DISTRI
- Page 469 and 470:
LEA: 2803 - MARMADUKE SCHOOL DISTRI
- Page 471 and 472:
ARKANSAS SPECIAL EDUCATION DISTRICT
- Page 473 and 474:
LEA: 2807 - GREENE COUNTY TECH SCHO
- Page 475 and 476:
LEA: 2807 - GREENE COUNTY TECH SCHO
- Page 477 and 478:
LEA: 2808 - PARAGOULD SCHOOL DISTRI
- Page 479 and 480:
LEA: 2808 - PARAGOULD SCHOOL DISTRI
- Page 481 and 482:
LEA: 2901 - BLEVINS SCHOOL DISTRICT
- Page 483 and 484:
LEA: 2901 - BLEVINS SCHOOL DISTRICT
- Page 485 and 486:
LEA: 2901 - BLEVINS SCHOOL DISTRICT
- Page 487 and 488:
LEA: 2903 - HOPE SCHOOL DISTRICT In
- Page 489 and 490:
LEA: 2903 - HOPE SCHOOL DISTRICT In
- Page 491 and 492:
ARKANSAS SPECIAL EDUCATION DISTRICT
- Page 493 and 494:
LEA: 2906 - SPRING HILL SCHOOL DIST
- Page 495 and 496:
LEA: 2906 - SPRING HILL SCHOOL DIST
- Page 497 and 498:
LEA: 2920 - SOUTHWEST ARKANSAS EDUC
- Page 499 and 500:
LEA: 2920 - SOUTHWEST ARKANSAS EDUC
- Page 501 and 502:
LEA: 3001 - BISMARCK SCHOOL DISTRIC
- Page 503 and 504:
LEA: 3001 - BISMARCK SCHOOL DISTRIC
- Page 505 and 506:
LEA: 3001 - BISMARCK SCHOOL DISTRIC
- Page 507 and 508:
LEA: 3002 - GLEN ROSE SCHOOL DISTRI
- Page 509 and 510:
LEA: 3002 - GLEN ROSE SCHOOL DISTRI
- Page 511 and 512:
ARKANSAS SPECIAL EDUCATION DISTRICT
- Page 513 and 514:
LEA: 3003 - MAGNET COVE SCHOOL DIST
- Page 515 and 516:
LEA: 3003 - MAGNET COVE SCHOOL DIST
- Page 517 and 518:
LEA: 3004 - MALVERN SCHOOL DISTRICT
- Page 519 and 520:
LEA: 3004 - MALVERN SCHOOL DISTRICT
- Page 521 and 522:
LEA: 3005 - OUACHITA SCHOOL DISTRIC
- Page 523 and 524:
LEA: 3005 - OUACHITA SCHOOL DISTRIC
- Page 525 and 526:
LEA: 3005 - OUACHITA SCHOOL DISTRIC
- Page 527 and 528:
LEA: 3102 - DIERKS SCHOOL DISTRICT
- Page 529 and 530:
LEA: 3102 - DIERKS SCHOOL DISTRICT
- Page 531 and 532:
ARKANSAS SPECIAL EDUCATION DISTRICT
- Page 533 and 534:
LEA: 3104 - MINERAL SPRINGS SCHOOL
- Page 535 and 536:
LEA: 3104 - MINERAL SPRINGS SCHOOL
- Page 537 and 538:
LEA: 3105 - NASHVILLE SCHOOL DISTRI
- Page 539 and 540:
LEA: 3105 - NASHVILLE SCHOOL DISTRI
- Page 541 and 542:
LEA: 3201 - BATESVILLE SCHOOL DISTR
- Page 543 and 544:
LEA: 3201 - BATESVILLE SCHOOL DISTR
- Page 545 and 546:
LEA: 3201 - BATESVILLE SCHOOL DISTR
- Page 547 and 548:
LEA: 3209 - SOUTHSIDE SCHOOL DISTRI
- Page 549 and 550:
LEA: 3209 - SOUTHSIDE SCHOOL DISTRI
- Page 551 and 552:
LEA: 3211 - MIDLAND SCHOOL DISTRICT
- Page 553 and 554:
LEA: 3211 - MIDLAND SCHOOL DISTRICT
- Page 555 and 556:
LEA: 3211 - MIDLAND SCHOOL DISTRICT
- Page 557 and 558:
LEA: 3212 - CEDAR RIDGE SCHOOL DIST
- Page 559 and 560:
LEA: 3212 - CEDAR RIDGE SCHOOL DIST
- Page 561 and 562:
ARKANSAS SPECIAL EDUCATION DISTRICT
- Page 563 and 564:
LEA: 3301 - CALICO ROCK SCHOOL DIST
- Page 565 and 566:
LEA: 3301 - CALICO ROCK SCHOOL DIST
- Page 567 and 568:
LEA: 3302 - MELBOURNE SCHOOL DISTRI
- Page 569 and 570:
LEA: 3302 - MELBOURNE SCHOOL DISTRI
- Page 571 and 572:
ARKANSAS SPECIAL EDUCATION DISTRICT
- Page 573 and 574:
LEA: 3306 - IZARD CO. CONS. SCHOOL
- Page 575 and 576:
LEA: 3306 - IZARD CO. CONS. SCHOOL
- Page 577 and 578:
LEA: 3320 - NORTH CENTRAL ARKANSAS
- Page 579 and 580:
LEA: 3320 - NORTH CENTRAL ARKANSAS
- Page 581 and 582:
LEA: 3403 - NEWPORT SCHOOL DISTRICT
- Page 583 and 584:
LEA: 3403 - NEWPORT SCHOOL DISTRICT
- Page 585 and 586:
LEA: 3403 - NEWPORT SCHOOL DISTRICT
- Page 587 and 588:
LEA: 3405 - JACKSON CO. SCHOOL DIST
- Page 589 and 590:
LEA: 3405 - JACKSON CO. SCHOOL DIST
- Page 591 and 592:
ARKANSAS SPECIAL EDUCATION DISTRICT
- Page 593 and 594:
LEA: 3502 - DOLLARWAY SCHOOL DISTRI
- Page 595 and 596:
LEA: 3502 - DOLLARWAY SCHOOL DISTRI
- Page 597 and 598:
LEA: 3505 - PINE BLUFF SCHOOL DISTR
- Page 599 and 600:
LEA: 3505 - PINE BLUFF SCHOOL DISTR
- Page 601 and 602:
ARKANSAS SPECIAL EDUCATION DISTRICT
- Page 603 and 604:
LEA: 3509 - WATSON CHAPEL SCHOOL DI
- Page 605 and 606:
LEA: 3509 - WATSON CHAPEL SCHOOL DI
- Page 607 and 608:
LEA: 3510 - WHITE HALL SCHOOL DISTR
- Page 609 and 610:
LEA: 3510 - WHITE HALL SCHOOL DISTR
- Page 611 and 612:
ARKANSAS SPECIAL EDUCATION DISTRICT
- Page 613 and 614:
LEA: 3520 - ARKANSAS RIVER EDUCATIO
- Page 615 and 616:
LEA: 3520 - ARKANSAS RIVER EDUCATIO
- Page 617 and 618:
LEA: 3601 - CLARKSVILLE SCHOOL DIST
- Page 619 and 620:
LEA: 3601 - CLARKSVILLE SCHOOL DIST
- Page 621 and 622:
LEA: 3604 - LAMAR SCHOOL DISTRICT A
- Page 623 and 624:
LEA: 3604 - LAMAR SCHOOL DISTRICT I
- Page 625 and 626:
LEA: 3604 - LAMAR SCHOOL DISTRICT I
- Page 627 and 628:
LEA: 3606 - WESTSIDE SCHOOL DISTRIC
- Page 629 and 630:
LEA: 3606 - WESTSIDE SCHOOL DISTRIC
- Page 631 and 632:
LEA: 3701 - BRADLEY SCHOOL DISTRICT
- Page 633 and 634:
LEA: 3701 - BRADLEY SCHOOL DISTRICT
- Page 635 and 636:
LEA: 3701 - BRADLEY SCHOOL DISTRICT
- Page 637 and 638:
LEA: 3704 - LAFAYETTE COUNTY SCHOOL
- Page 639 and 640:
LEA: 3704 - LAFAYETTE COUNTY SCHOOL
- Page 641 and 642:
LEA: 3804 - HOXIE SCHOOL DISTRICT A
- Page 643 and 644:
LEA: 3804 - HOXIE SCHOOL DISTRICT I
- Page 645 and 646:
LEA: 3804 - HOXIE SCHOOL DISTRICT I
- Page 647 and 648:
LEA: 3806 - SLOAN-HENDRIX SCHOOL DI
- Page 649 and 650:
LEA: 3806 - SLOAN-HENDRIX SCHOOL DI
- Page 651 and 652:
LEA: 3809 - HILLCREST SCHOOL DISTRI
- Page 653 and 654:
LEA: 3809 - HILLCREST SCHOOL DISTRI
- Page 655 and 656:
LEA: 3809 - HILLCREST SCHOOL DISTRI
- Page 657 and 658:
LEA: 3810 - LAWRENCE COUNTY Indicat
- Page 659 and 660:
LEA: 3810 - LAWRENCE COUNTY Indicat
- Page 661 and 662:
ARKANSAS SPECIAL EDUCATION DISTRICT
- Page 663 and 664:
LEA: 3820 - NORTHEAST ARKANSAS EDUC
- Page 665 and 666:
LEA: 3820 - NORTHEAST ARKANSAS EDUC
- Page 667 and 668:
LEA: 3840 - IMBODEN CHARTER SCHOOL
- Page 669 and 670:
LEA: 3840 - IMBODEN CHARTER SCHOOL
- Page 671 and 672:
ARKANSAS SPECIAL EDUCATION DISTRICT
- Page 673 and 674:
LEA: 3904 - LEE COUNTY SCHOOL DISTR
- Page 675 and 676:
LEA: 3904 - LEE COUNTY SCHOOL DISTR
- Page 677 and 678:
LEA: 4003 - STAR CITY SCHOOL DISTRI
- Page 679 and 680:
LEA: 4003 - STAR CITY SCHOOL DISTRI
- Page 681 and 682:
LEA: 4101 - ASHDOWN SCHOOL DISTRICT
- Page 683 and 684:
LEA: 4101 - ASHDOWN SCHOOL DISTRICT
- Page 685 and 686:
LEA: 4101 - ASHDOWN SCHOOL DISTRICT
- Page 687 and 688:
LEA: 4102 - FOREMAN SCHOOL DISTRICT
- Page 689 and 690:
LEA: 4102 - FOREMAN SCHOOL DISTRICT
- Page 691 and 692:
ARKANSAS SPECIAL EDUCATION DISTRICT
- Page 693 and 694:
LEA: 4201 - BOONEVILLE SCHOOL DISTR
- Page 695 and 696:
LEA: 4201 - BOONEVILLE SCHOOL DISTR
- Page 697 and 698:
LEA: 4202 - MAGAZINE SCHOOL DISTRIC
- Page 699 and 700:
LEA: 4202 - MAGAZINE SCHOOL DISTRIC
- Page 701 and 702:
LEA: 4203 - PARIS SCHOOL DISTRICT A
- Page 703 and 704:
LEA: 4203 - PARIS SCHOOL DISTRICT I
- Page 705 and 706:
LEA: 4203 - PARIS SCHOOL DISTRICT I
- Page 707 and 708:
LEA: 4204 - SCRANTON SCHOOL DISTRIC
- Page 709 and 710:
LEA: 4204 - SCRANTON SCHOOL DISTRIC
- Page 711 and 712:
LEA: 4301 - LONOKE SCHOOL DISTRICT
- Page 713 and 714:
LEA: 4301 - LONOKE SCHOOL DISTRICT
- Page 715 and 716:
LEA: 4301 - LONOKE SCHOOL DISTRICT
- Page 717 and 718:
LEA: 4302 - ENGLAND SCHOOL DISTRICT
- Page 719 and 720:
LEA: 4302 - ENGLAND SCHOOL DISTRICT
- Page 721 and 722:
LEA: 4303 - CARLISLE SCHOOL DISTRIC
- Page 723 and 724:
LEA: 4303 - CARLISLE SCHOOL DISTRIC
- Page 725 and 726:
LEA: 4303 - CARLISLE SCHOOL DISTRIC
- Page 727 and 728:
LEA: 4304 - CABOT SCHOOL DISTRICT I
- Page 729 and 730:
LEA: 4304 - CABOT SCHOOL DISTRICT I
- Page 731 and 732:
ARKANSAS SPECIAL EDUCATION DISTRICT
- Page 733 and 734:
LEA: 4401 - HUNTSVILLE SCHOOL DISTR
- Page 735 and 736:
LEA: 4401 - HUNTSVILLE SCHOOL DISTR
- Page 737 and 738:
LEA: 4501 - FLIPPIN SCHOOL DISTRICT
- Page 739 and 740:
LEA: 4501 - FLIPPIN SCHOOL DISTRICT
- Page 741 and 742:
ARKANSAS SPECIAL EDUCATION DISTRICT
- Page 743 and 744:
LEA: 4502 - YELLVILLE-SUMMIT SCHOOL
- Page 745 and 746:
LEA: 4502 - YELLVILLE-SUMMIT SCHOOL
- Page 747 and 748:
LEA: 4602 - GENOA CENTRAL SCHOOL DI
- Page 749 and 750:
LEA: 4602 - GENOA CENTRAL SCHOOL DI
- Page 751 and 752:
LEA: 4603 - FOUKE SCHOOL DISTRICT A
- Page 753 and 754:
LEA: 4603 - FOUKE SCHOOL DISTRICT I
- Page 755 and 756:
LEA: 4603 - FOUKE SCHOOL DISTRICT I
- Page 757 and 758:
LEA: 4605 - TEXARKANA SCHOOL DISTRI
- Page 759 and 760:
LEA: 4605 - TEXARKANA SCHOOL DISTRI
- Page 761 and 762:
LEA: 4701 - ARMOREL SCHOOL DISTRICT
- Page 763 and 764:
LEA: 4701 - ARMOREL SCHOOL DISTRICT
- Page 765 and 766:
LEA: 4701 - ARMOREL SCHOOL DISTRICT
- Page 767 and 768:
LEA: 4702 - BLYTHEVILLE SCHOOL DIST
- Page 769 and 770:
LEA: 4702 - BLYTHEVILLE SCHOOL DIST
- Page 771 and 772:
ARKANSAS SPECIAL EDUCATION DISTRICT
- Page 773 and 774:
LEA: 4706 - SO. MISS. COUNTY SCHOOL
- Page 775 and 776:
LEA: 4706 - SO. MISS. COUNTY SCHOOL
- Page 777 and 778:
LEA: 4708 - GOSNELL SCHOOL DISTRICT
- Page 779 and 780:
LEA: 4708 - GOSNELL SCHOOL DISTRICT
- Page 781 and 782:
LEA: 4712 - MANILA SCHOOL DISTRICT
- Page 783 and 784:
LEA: 4712 - MANILA SCHOOL DISTRICT
- Page 785 and 786:
LEA: 4712 - MANILA SCHOOL DISTRICT
- Page 787 and 788:
LEA: 4713 - OSCEOLA SCHOOL DISTRICT
- Page 789 and 790:
LEA: 4713 - OSCEOLA SCHOOL DISTRICT
- Page 791 and 792:
ARKANSAS SPECIAL EDUCATION DISTRICT
- Page 793 and 794:
LEA: 4740 - OSCEOLA COMMUNICATION B
- Page 795 and 796:
LEA: 4740 - OSCEOLA COMMUNICATION B
- Page 797 and 798:
LEA: 4801 - BRINKLEY SCHOOL DISTRIC
- Page 799 and 800:
LEA: 4801 - BRINKLEY SCHOOL DISTRIC
- Page 801 and 802:
ARKANSAS SPECIAL EDUCATION DISTRICT
- Page 803 and 804:
LEA: 4802 - CLARENDON SCHOOL DISTRI
- Page 805 and 806:
LEA: 4802 - CLARENDON SCHOOL DISTRI
- Page 807 and 808:
LEA: 4901 - CADDO HILLS SCHOOL DIST
- Page 809 and 810:
LEA: 4901 - CADDO HILLS SCHOOL DIST
- Page 811 and 812:
LEA: 4902 - MOUNT IDA SCHOOL DISTRI
- Page 813 and 814:
LEA: 4902 - MOUNT IDA SCHOOL DISTRI
- Page 815 and 816:
LEA: 4902 - MOUNT IDA SCHOOL DISTRI
- Page 817 and 818:
LEA: 5006 - PRESCOTT SCHOOL DISTRIC
- Page 819 and 820:
LEA: 5006 - PRESCOTT SCHOOL DISTRIC
- Page 821 and 822:
LEA: 5008 - NEVADA SCHOOL DISTRICT
- Page 823 and 824:
LEA: 5008 - NEVADA SCHOOL DISTRICT
- Page 825 and 826:
LEA: 5008 - NEVADA SCHOOL DISTRICT
- Page 827 and 828:
LEA: 5102 - JASPER SCHOOL DISTRICT
- Page 829 and 830:
LEA: 5102 - JASPER SCHOOL DISTRICT
- Page 831 and 832:
ARKANSAS SPECIAL EDUCATION DISTRICT
- Page 833 and 834:
LEA: 5106 - DEER/MT. JUDEA SCHOOL D
- Page 835 and 836:
LEA: 5106 - DEER/MT. JUDEA SCHOOL D
- Page 837 and 838:
LEA: 5201 - BEARDEN SCHOOL DISTRICT
- Page 839 and 840:
LEA: 5201 - BEARDEN SCHOOL DISTRICT
- Page 841 and 842:
ARKANSAS SPECIAL EDUCATION DISTRICT
- Page 843 and 844:
LEA: 5204 - CAMDEN FAIRVIEW SCHOOL
- Page 845 and 846:
LEA: 5204 - CAMDEN FAIRVIEW SCHOOL
- Page 847 and 848:
LEA: 5205 - HARMONY GROVE SCHOOL DI
- Page 849 and 850:
LEA: 5205 - HARMONY GROVE SCHOOL DI
- Page 851 and 852:
LEA: 5206 - STEPHENS SCHOOL DISTRIC
- Page 853 and 854:
LEA: 5206 - STEPHENS SCHOOL DISTRIC
- Page 855 and 856:
LEA: 5206 - STEPHENS SCHOOL DISTRIC
- Page 857 and 858:
LEA: 5220 - SOUTH CENTRAL SERVICE C
- Page 859 and 860:
LEA: 5220 - SOUTH CENTRAL SERVICE C
- Page 861 and 862:
LEA: 5301 - EAST END SCHOOL DISTRIC
- Page 863 and 864:
LEA: 5301 - EAST END SCHOOL DISTRIC
- Page 865 and 866:
LEA: 5301 - EAST END SCHOOL DISTRIC
- Page 867 and 868:
LEA: 5303 - PERRYVILLE SCHOOL DISTR
- Page 869 and 870:
LEA: 5303 - PERRYVILLE SCHOOL DISTR
- Page 871 and 872:
ARKANSAS SPECIAL EDUCATION DISTRICT
- Page 873 and 874:
LEA: 5401 - BARTON-LEXA SCHOOL DIST
- Page 875 and 876:
LEA: 5401 - BARTON-LEXA SCHOOL DIST
- Page 877 and 878:
LEA: 5403 - HELENA/ W.HELENA SCHOOL
- Page 879 and 880:
LEA: 5403 - HELENA/ W.HELENA SCHOOL
- Page 881 and 882:
LEA: 5404 - MARVELL SCHOOL DISTRICT
- Page 883 and 884:
LEA: 5404 - MARVELL SCHOOL DISTRICT
- Page 885 and 886:
LEA: 5404 - MARVELL SCHOOL DISTRICT
- Page 887 and 888:
LEA: 5420 - GREAT RIVERS CO-OP Indi
- Page 889 and 890:
LEA: 5420 - GREAT RIVERS CO-OP Indi
- Page 891 and 892:
ARKANSAS SPECIAL EDUCATION DISTRICT
- Page 893 and 894:
LEA: 5440 - KIPP: DELTA COLLEGE PRE
- Page 895 and 896:
LEA: 5440 - KIPP: DELTA COLLEGE PRE
- Page 897 and 898:
LEA: 5502 - CENTERPOINT SCHOOL DIST
- Page 899 and 900:
LEA: 5502 - CENTERPOINT SCHOOL DIST
- Page 901 and 902:
LEA: 5503 - KIRBY SCHOOL DISTRICT A
- Page 903 and 904:
LEA: 5503 - KIRBY SCHOOL DISTRICT I
- Page 905 and 906:
LEA: 5503 - KIRBY SCHOOL DISTRICT I
- Page 907 and 908:
LEA: 5504 - SOUTH PIKE COUNTY SCHOO
- Page 909 and 910:
LEA: 5504 - SOUTH PIKE COUNTY SCHOO
- Page 911 and 912:
ARKANSAS SPECIAL EDUCATION DISTRICT
- Page 913 and 914:
LEA: 5602 - HARRISBURG SCHOOL DISTR
- Page 915 and 916:
LEA: 5602 - HARRISBURG SCHOOL DISTR
- Page 917 and 918:
LEA: 5604 - MARKED TREE SCHOOL DIST
- Page 919 and 920:
LEA: 5604 - MARKED TREE SCHOOL DIST
- Page 921 and 922:
LEA: 5605 - TRUMANN SCHOOL DISTRICT
- Page 923 and 924:
LEA: 5605 - TRUMANN SCHOOL DISTRICT
- Page 925 and 926:
LEA: 5605 - TRUMANN SCHOOL DISTRICT
- Page 927 and 928:
LEA: 5608 - EAST POINSETT CO. SCHOO
- Page 929 and 930:
LEA: 5608 - EAST POINSETT CO. SCHOO
- Page 931 and 932:
ARKANSAS SPECIAL EDUCATION DISTRICT
- Page 933 and 934:
LEA: 5620 - CROWLEY'S RIDGE EDUCATI
- Page 935 and 936:
LEA: 5620 - CROWLEY'S RIDGE EDUCATI
- Page 937 and 938:
LEA: 5703 - MENA SCHOOL DISTRICT In
- Page 939 and 940:
LEA: 5703 - MENA SCHOOL DISTRICT In
- Page 941 and 942:
ARKANSAS SPECIAL EDUCATION DISTRICT
- Page 943 and 944:
LEA: 5706 - OUACHITA RIVER SCHOOL D
- Page 945 and 946:
LEA: 5706 - OUACHITA RIVER SCHOOL D
- Page 947 and 948:
LEA: 5707 - COSSATOT RIVER SCHOOL D
- Page 949 and 950:
LEA: 5707 - COSSATOT RIVER SCHOOL D
- Page 951 and 952:
LEA: 5801 - ATKINS SCHOOL DISTRICT
- Page 953 and 954:
LEA: 5801 - ATKINS SCHOOL DISTRICT
- Page 955 and 956:
LEA: 5801 - ATKINS SCHOOL DISTRICT
- Page 957 and 958:
LEA: 5802 - DOVER SCHOOL DISTRICT I
- Page 959 and 960:
LEA: 5802 - DOVER SCHOOL DISTRICT I
- Page 961 and 962:
LEA: 5803 - HECTOR SCHOOL DISTRICT
- Page 963 and 964:
LEA: 5803 - HECTOR SCHOOL DISTRICT
- Page 965 and 966:
LEA: 5803 - HECTOR SCHOOL DISTRICT
- Page 967 and 968:
LEA: 5804 - POTTSVILLE SCHOOL DISTR
- Page 969 and 970:
LEA: 5804 - POTTSVILLE SCHOOL DISTR
- Page 971 and 972:
ARKANSAS SPECIAL EDUCATION DISTRICT
- Page 973 and 974:
LEA: 5805 - RUSSELLVILLE SCHOOL DIS
- Page 975 and 976:
LEA: 5805 - RUSSELLVILLE SCHOOL DIS
- Page 977 and 978:
LEA: 5901 - DES ARC SCHOOL DISTRICT
- Page 979 and 980:
LEA: 5901 - DES ARC SCHOOL DISTRICT
- Page 981 and 982:
LEA: 5903 - HAZEN SCHOOL DISTRICT A
- Page 983 and 984:
LEA: 5903 - HAZEN SCHOOL DISTRICT I
- Page 985 and 986:
LEA: 5903 - HAZEN SCHOOL DISTRICT I
- Page 987 and 988:
LEA: 6001 - LITTLE ROCK SCHOOL DIST
- Page 989 and 990:
LEA: 6001 - LITTLE ROCK SCHOOL DIST
- Page 991 and 992:
ARKANSAS SPECIAL EDUCATION DISTRICT
- Page 993 and 994:
LEA: 6002 - N. LITTLE ROCK SCHOOL D
- Page 995 and 996:
LEA: 6002 - N. LITTLE ROCK SCHOOL D
- Page 997 and 998:
LEA: 6003 - PULASKI CO. SPEC. SCHOO
- Page 999 and 1000:
LEA: 6003 - PULASKI CO. SPEC. SCHOO
- Page 1001 and 1002:
ARKANSAS SPECIAL EDUCATION DISTRICT
- Page 1003 and 1004:
LEA: 6040 - ACADEMICS PLUS CHARTER
- Page 1005 and 1006:
LEA: 6040 - ACADEMICS PLUS CHARTER
- Page 1007 and 1008:
LEA: 6041 - LISA ACADEMY CHARTER SC
- Page 1009 and 1010:
LEA: 6041 - LISA ACADEMY CHARTER SC
- Page 1011 and 1012:
ARKANSAS SPECIAL EDUCATION DISTRICT
- Page 1013 and 1014:
LEA: 6042 - DREAMLAND ACADEMY CHART
- Page 1015 and 1016:
LEA: 6042 - DREAMLAND ACADEMY CHART
- Page 1017 and 1018:
LEA: 6043 - ARKANSAS VIRTUAL CHARTE
- Page 1019 and 1020:
LEA: 6043 - ARKANSAS VIRTUAL CHARTE
- Page 1021 and 1022:
ARKANSAS SPECIAL EDUCATION DISTRICT
- Page 1023 and 1024:
LEA: 6044 - COVENANT KEEPERS CHARTE
- Page 1025 and 1026:
LEA: 6044 - COVENANT KEEPERS CHARTE
- Page 1027 and 1028:
LEA: 6045 - eSTEM ELEMENTARY CHARTE
- Page 1029 and 1030:
LEA: 6045 - eSTEM ELEMENTARY CHARTE
- Page 1031 and 1032:
ARKANSAS SPECIAL EDUCATION DISTRICT
- Page 1033 and 1034:
LEA: 6046 - eSTEM MIDDLE CHARTER SC
- Page 1035 and 1036:
LEA: 6046 - eSTEM MIDDLE CHARTER SC
- Page 1037 and 1038:
LEA: 6047 - eSTEM HIGH CHARTER SCHO
- Page 1039 and 1040:
LEA: 6047 - eSTEM HIGH CHARTER SCHO
- Page 1041 and 1042:
ARKANSAS SPECIAL EDUCATION DISTRICT
- Page 1043 and 1044:
LEA: 6048 - LISA ACADEMY CHARTER SC
- Page 1045 and 1046:
LEA: 6048 - LISA ACADEMY CHARTER SC
- Page 1047 and 1048:
LEA: 6049 - LITTLE ROCK PREPARATORY
- Page 1049 and 1050:
LEA: 6049 - LITTLE ROCK PREPARATORY
- Page 1051 and 1052:
ARKANSAS SPECIAL EDUCATION DISTRICT
- Page 1053 and 1054:
LEA: 6050 - JACKSONVILLE LIGHT HOUS
- Page 1055 and 1056:
LEA: 6050 - JACKSONVILLE LIGHT HOUS
- Page 1057 and 1058:
LEA: 6051 - URBAN COLLEGIATE PUBLIC
- Page 1059 and 1060:
LEA: 6051 - URBAN COLLEGIATE PUBLIC
- Page 1061 and 1062:
LEA: 6091 - AR SCHOOL FOR THE BLIND
- Page 1063 and 1064:
LEA: 6091 - AR SCHOOL FOR THE BLIND
- Page 1065 and 1066:
LEA: 6091 - AR SCHOOL FOR THE BLIND
- Page 1067 and 1068:
LEA: 6092 - AR SCHOOL FOR THE DEAF
- Page 1069 and 1070:
LEA: 6092 - AR SCHOOL FOR THE DEAF
- Page 1071 and 1072:
LEA: 6102 - MAYNARD SCHOOL DISTRICT
- Page 1073 and 1074:
LEA: 6102 - MAYNARD SCHOOL DISTRICT
- Page 1075 and 1076:
LEA: 6102 - MAYNARD SCHOOL DISTRICT
- Page 1077 and 1078:
LEA: 6103 - POCAHONTAS SCHOOL DISTR
- Page 1079 and 1080:
LEA: 6103 - POCAHONTAS SCHOOL DISTR
- Page 1081 and 1082:
ARKANSAS SPECIAL EDUCATION DISTRICT
- Page 1083 and 1084:
LEA: 6201 - FORREST CITY SCHOOL DIS
- Page 1085 and 1086:
LEA: 6201 - FORREST CITY SCHOOL DIS
- Page 1087 and 1088:
LEA: 6202 - HUGHES SCHOOL DISTRICT
- Page 1089 and 1090:
LEA: 6202 - HUGHES SCHOOL DISTRICT
- Page 1091 and 1092:
ARKANSAS SPECIAL EDUCATION DISTRICT
- Page 1093 and 1094:
LEA: 6205 - PALESTINE-WHEATLEY SCH.
- Page 1095 and 1096:
LEA: 6205 - PALESTINE-WHEATLEY SCH.
- Page 1097 and 1098:
LEA: 6301 - BAUXITE SCHOOL DISTRICT
- Page 1099 and 1100:
LEA: 6301 - BAUXITE SCHOOL DISTRICT
- Page 1101 and 1102:
LEA: 6302 - BENTON SCHOOL DISTRICT
- Page 1103 and 1104:
LEA: 6302 - BENTON SCHOOL DISTRICT
- Page 1105 and 1106:
LEA: 6302 - BENTON SCHOOL DISTRICT
- Page 1107 and 1108:
LEA: 6303 - BRYANT SCHOOL DISTRICT
- Page 1109 and 1110:
LEA: 6303 - BRYANT SCHOOL DISTRICT
- Page 1111 and 1112:
ARKANSAS SPECIAL EDUCATION DISTRICT
- Page 1113 and 1114:
LEA: 6304 - HARMONY GROVE SCHOOL DI
- Page 1115 and 1116:
LEA: 6304 - HARMONY GROVE SCHOOL DI
- Page 1117 and 1118:
LEA: 6401 - WALDRON SCHOOL DISTRICT
- Page 1119 and 1120:
LEA: 6401 - WALDRON SCHOOL DISTRICT
- Page 1121 and 1122:
ARKANSAS SPECIAL EDUCATION DISTRICT
- Page 1123 and 1124:
LEA: 6502 - SEARCY COUNTY SCHOOL DI
- Page 1125 and 1126:
LEA: 6502 - SEARCY COUNTY SCHOOL DI
- Page 1127 and 1128:
LEA: 6505 - OZARK MOUNTAIN SCHOOL D
- Page 1129 and 1130:
LEA: 6505 - OZARK MOUNTAIN SCHOOL D
- Page 1131 and 1132:
ARKANSAS SPECIAL EDUCATION DISTRICT
- Page 1133 and 1134:
LEA: 6601 - FORT SMITH SCHOOL DISTR
- Page 1135 and 1136:
LEA: 6601 - FORT SMITH SCHOOL DISTR
- Page 1137 and 1138:
LEA: 6602 - GREENWOOD SCHOOL DISTRI
- Page 1139 and 1140:
LEA: 6602 - GREENWOOD SCHOOL DISTRI
- Page 1141 and 1142:
LEA: 6603 - HACKETT SCHOOL DISTRICT
- Page 1143 and 1144:
LEA: 6603 - HACKETT SCHOOL DISTRICT
- Page 1145 and 1146:
LEA: 6603 - HACKETT SCHOOL DISTRICT
- Page 1147 and 1148:
LEA: 6604 - HARTFORD SCHOOL DISTRIC
- Page 1149 and 1150:
LEA: 6604 - HARTFORD SCHOOL DISTRIC
- Page 1151 and 1152:
LEA: 6605 - LAVACA SCHOOL DISTRICT
- Page 1153 and 1154:
LEA: 6605 - LAVACA SCHOOL DISTRICT
- Page 1155 and 1156:
LEA: 6605 - LAVACA SCHOOL DISTRICT
- Page 1157 and 1158:
LEA: 6606 - MANSFIELD SCHOOL DISTRI
- Page 1159 and 1160:
LEA: 6606 - MANSFIELD SCHOOL DISTRI
- Page 1161 and 1162:
LEA: 6701 - DEQUEEN SCHOOL DISTRICT
- Page 1163 and 1164:
LEA: 6701 - DEQUEEN SCHOOL DISTRICT
- Page 1165 and 1166:
LEA: 6701 - DEQUEEN SCHOOL DISTRICT
- Page 1167 and 1168:
LEA: 6703 - HORATIO SCHOOL DISTRICT
- Page 1169 and 1170:
LEA: 6703 - HORATIO SCHOOL DISTRICT
- Page 1171 and 1172:
ARKANSAS SPECIAL EDUCATION DISTRICT
- Page 1173 and 1174:
LEA: 6720 - DEQUEEN/MENA EDUCATIONA
- Page 1175 and 1176:
LEA: 6720 - DEQUEEN/MENA EDUCATIONA
- Page 1177 and 1178:
LEA: 6802 - CAVE CITY SCHOOL DISTRI
- Page 1179 and 1180:
LEA: 6802 - CAVE CITY SCHOOL DISTRI
- Page 1181 and 1182:
LEA: 6804 - HIGHLAND SCHOOL DISTRIC
- Page 1183 and 1184:
LEA: 6804 - HIGHLAND SCHOOL DISTRIC
- Page 1185 and 1186:
LEA: 6804 - HIGHLAND SCHOOL DISTRIC
- Page 1187 and 1188:
LEA: 6901 - MOUNTAIN VIEW SCHOOL DI
- Page 1189 and 1190:
LEA: 6901 - MOUNTAIN VIEW SCHOOL DI
- Page 1191 and 1192:
LEA: 7001 - EL DORADO SCHOOL DISTRI
- Page 1193 and 1194:
LEA: 7001 - EL DORADO SCHOOL DISTRI
- Page 1195 and 1196:
LEA: 7001 - EL DORADO SCHOOL DISTRI
- Page 1197 and 1198:
LEA: 7003 - JUNCTION CITY SCHOOL DI
- Page 1199 and 1200:
LEA: 7003 - JUNCTION CITY SCHOOL DI
- Page 1201 and 1202:
LEA: 7006 - NORPHLET SCHOOL DISTRIC
- Page 1203 and 1204:
LEA: 7006 - NORPHLET SCHOOL DISTRIC
- Page 1205 and 1206:
LEA: 7006 - NORPHLET SCHOOL DISTRIC
- Page 1207 and 1208:
LEA: 7007 - PARKERS CHAPEL SCHOOL D
- Page 1209 and 1210:
LEA: 7007 - PARKERS CHAPEL SCHOOL D
- Page 1211 and 1212:
ARKANSAS SPECIAL EDUCATION DISTRICT
- Page 1213 and 1214:
LEA: 7008 - SMACKOVER SCHOOL DISTRI
- Page 1215 and 1216:
LEA: 7008 - SMACKOVER SCHOOL DISTRI
- Page 1217 and 1218:
LEA: 7009 - STRONG-HUTTIG SCHOOL DI
- Page 1219 and 1220:
LEA: 7009 - STRONG-HUTTIG SCHOOL DI
- Page 1221 and 1222:
LEA: 7102 - CLINTON SCHOOL DISTRICT
- Page 1223 and 1224:
LEA: 7102 - CLINTON SCHOOL DISTRICT
- Page 1225 and 1226:
LEA: 7102 - CLINTON SCHOOL DISTRICT
- Page 1227 and 1228:
LEA: 7104 - SHIRLEY SCHOOL DISTRICT
- Page 1229 and 1230:
LEA: 7104 - SHIRLEY SCHOOL DISTRICT
- Page 1231 and 1232:
LEA: 7105 - SOUTH SIDE SCHOOL DISTR
- Page 1233 and 1234:
LEA: 7105 - SOUTH SIDE SCHOOL DISTR
- Page 1235 and 1236:
LEA: 7105 - SOUTH SIDE SCHOOL DISTR
- Page 1237 and 1238:
LEA: 7201 - ELKINS SCHOOL DISTRICT
- Page 1239 and 1240:
LEA: 7201 - ELKINS SCHOOL DISTRICT
- Page 1241 and 1242:
ARKANSAS SPECIAL EDUCATION DISTRICT
- Page 1243 and 1244:
LEA: 7202 - FARMINGTON SCHOOL DISTR
- Page 1245 and 1246:
LEA: 7202 - FARMINGTON SCHOOL DISTR
- Page 1247 and 1248:
LEA: 7203 - FAYETTEVILLE SCHOOL DIS
- Page 1249 and 1250:
LEA: 7203 - FAYETTEVILLE SCHOOL DIS
- Page 1251 and 1252:
ARKANSAS SPECIAL EDUCATION DISTRICT
- Page 1253 and 1254:
LEA: 7204 - GREENLAND SCHOOL DISTRI
- Page 1255 and 1256:
LEA: 7204 - GREENLAND SCHOOL DISTRI
- Page 1257 and 1258:
LEA: 7205 - LINCOLN SCHOOL DISTRICT
- Page 1259 and 1260:
LEA: 7205 - LINCOLN SCHOOL DISTRICT
- Page 1261 and 1262:
ARKANSAS SPECIAL EDUCATION DISTRICT
- Page 1263 and 1264:
LEA: 7206 - PRAIRIE GROVE SCHOOL DI
- Page 1265 and 1266:
LEA: 7206 - PRAIRIE GROVE SCHOOL DI
- Page 1267 and 1268:
LEA: 7207 - SPRINGDALE SCHOOL DISTR
- Page 1269 and 1270:
LEA: 7207 - SPRINGDALE SCHOOL DISTR
- Page 1271 and 1272:
LEA: 7208 - WEST FORK SCHOOL DISTRI
- Page 1273 and 1274:
LEA: 7208 - WEST FORK SCHOOL DISTRI
- Page 1275 and 1276:
LEA: 7208 - WEST FORK SCHOOL DISTRI
- Page 1277 and 1278:
LEA: 7221 - NORTHWEST ARKANSAS EDUC
- Page 1279 and 1280:
LEA: 7221 - NORTHWEST ARKANSAS EDUC
- Page 1281 and 1282:
LEA: 7301 - BALD KNOB SCHOOL DISTRI
- Page 1283 and 1284:
LEA: 7301 - BALD KNOB SCHOOL DISTRI
- Page 1285 and 1286:
LEA: 7301 - BALD KNOB SCHOOL DISTRI
- Page 1287 and 1288:
LEA: 7302 - BEEBE SCHOOL DISTRICT I
- Page 1289 and 1290:
LEA: 7302 - BEEBE SCHOOL DISTRICT I
- Page 1291 and 1292:
LEA: 7303 - BRADFORD SCHOOL DISTRIC
- Page 1293 and 1294:
LEA: 7303 - BRADFORD SCHOOL DISTRIC
- Page 1295 and 1296:
LEA: 7303 - BRADFORD SCHOOL DISTRIC
- Page 1297 and 1298:
LEA: 7304 - WHITE CO. CENTRAL SCHOO
- Page 1299 and 1300:
LEA: 7304 - WHITE CO. CENTRAL SCHOO
- Page 1301 and 1302:
LEA: 7307 - RIVERVIEW SCHOOL DISTRI
- Page 1303 and 1304:
LEA: 7307 - RIVERVIEW SCHOOL DISTRI
- Page 1305 and 1306:
LEA: 7307 - RIVERVIEW SCHOOL DISTRI
- Page 1307 and 1308:
LEA: 7309 - PANGBURN SCHOOL DISTRIC
- Page 1309 and 1310:
LEA: 7309 - PANGBURN SCHOOL DISTRIC
- Page 1311 and 1312:
LEA: 7310 - ROSE BUD SCHOOL DISTRIC
- Page 1313 and 1314:
LEA: 7310 - ROSE BUD SCHOOL DISTRIC
- Page 1315 and 1316:
LEA: 7310 - ROSE BUD SCHOOL DISTRIC
- Page 1317 and 1318:
LEA: 7311 - SEARCY SCHOOL DISTRICT
- Page 1319 and 1320:
LEA: 7311 - SEARCY SCHOOL DISTRICT
- Page 1321 and 1322:
ARKANSAS SPECIAL EDUCATION DISTRICT
- Page 1323 and 1324:
LEA: 7320 - WILBUR D. MILLS EDUCATI
- Page 1325 and 1326:
LEA: 7320 - WILBUR D. MILLS EDUCATI
- Page 1327 and 1328:
LEA: 7401 - AUGUSTA SCHOOL DISTRICT
- Page 1329 and 1330:
LEA: 7401 - AUGUSTA SCHOOL DISTRICT
- Page 1331 and 1332:
LEA: 7403 - MCCRORY SCHOOL DISTRICT
- Page 1333 and 1334:
LEA: 7403 - MCCRORY SCHOOL DISTRICT
- Page 1335 and 1336:
LEA: 7403 - MCCRORY SCHOOL DISTRICT
- Page 1337 and 1338:
LEA: 7503 - DANVILLE SCHOOL DISTRIC
- Page 1339 and 1340:
LEA: 7503 - DANVILLE SCHOOL DISTRIC
- Page 1341 and 1342:
ARKANSAS SPECIAL EDUCATION DISTRICT
- Page 1343 and 1344:
LEA: 7504 - DARDANELLE SCHOOL DISTR
- Page 1345 and 1346:
LEA: 7504 - DARDANELLE SCHOOL DISTR
- Page 1347 and 1348:
LEA: 7509 - WESTERN YELL CO. SCHOOL
- Page 1349 and 1350:
LEA: 7509 - WESTERN YELL CO. SCHOOL
- Page 1351 and 1352:
ARKANSAS SPECIAL EDUCATION DISTRICT
- Page 1353 and 1354:
LEA: 7510 - TWO RIVERS SCHOOL DISTR
- Page 1355 and 1356:
LEA: 7510 - TWO RIVERS SCHOOL DISTR
- Page 1357 and 1358:
LEA: 9150 - DHS: DIVISION of DEVELO
- Page 1359 and 1360:
LEA: 9150 - DHS: DIVISION of DEVELO


