


Create successful ePaper yourself
Turn your PDF publications into a flip-book with our unique Google optimized e-Paper software.
Accuracy of the KS method is often measured by the R 2 statistic. While, as den Haan<br />
(2010a) notes, this measure does not reflect the accuracy of the solution well, it is nevertheless<br />
an indicator that reflects how well the actual aggregate law of motion corresponds to the one<br />
perceived by the agents, and serves to evaluate whether the “limited-rationality” assumption<br />
of a linear aggregate law of motion is realistic. Since our method relies on approximation<br />
of the continuation values for each agent, rather than of the aggregate law of motion for<br />
capital, a similar statistic is the R 2 of the one-step-ahead k-nn predictor ˜ψ (11), which can<br />
be computed for any (k, e) as follows:<br />
R 2 = 1 −<br />
T∑ ( ˜ψ t − ˆψ t ) 2<br />
t=1<br />
( ˜ψ t − ψ) 2 (21)<br />
where ψ is the sample mean of ˜ψ t . Similarly to the R 2 statistic in the KS method, a high R 2<br />
implies that an agent finds her estimates of the continuation value to be sufficiently precise.<br />
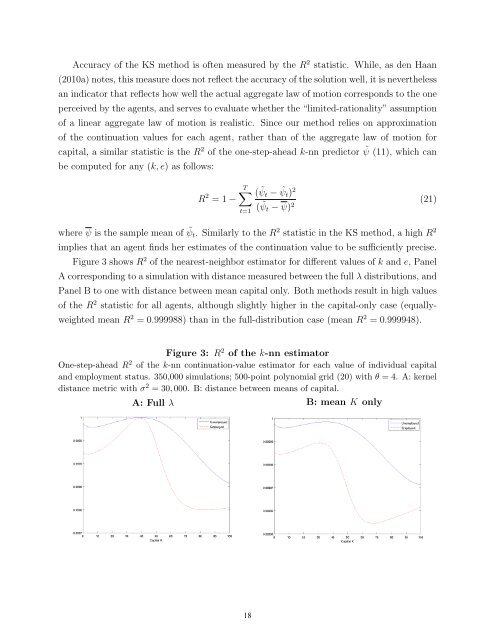
Figure 3 shows R 2 of the nearest-neighbor estimator for different values of k and e, Panel<br />
A corresponding to a simulation with distance measured between the full λ distributions, and<br />
Panel B to one with distance between mean capital only. Both methods result in high values<br />
of the R 2 statistic for all agents, although slightly higher in the capital-only case (equallyweighted<br />
mean R 2 = 0.999988) than in the full-distribution case (mean R 2 = 0.999948).<br />
Figure 3: R 2 of the k-nn estimator<br />
One-step-ahead R 2 of the k-nn continuation-value estimator for each value of individual capital<br />
and employment status. 350,000 simulations; 500-point polynomial grid (20) with θ = 4. A: kernel<br />
distance metric with σ 2 = 30, 000. B: distance between means of capital.<br />
A: Full λ B: mean K only<br />
16<br />
18


