


Create successful ePaper yourself
Turn your PDF publications into a flip-book with our unique Google optimized e-Paper software.
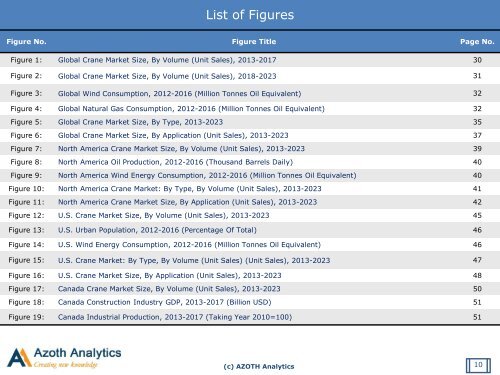
List of Figures<br />
Figure No. Figure Title Page No.<br />
Figure 1: <strong>Global</strong> <strong>Crane</strong> <strong>Market</strong> Size, By Volume (Unit Sales), 2013-2017 30<br />
Figure 2: <strong>Global</strong> <strong>Crane</strong> <strong>Market</strong> Size, By Volume (Unit Sales), 2018-2023 31<br />
Figure 3: <strong>Global</strong> Wind Consumption, 2012-2016 (Million Tonnes Oil Equivalent) 32<br />
Figure 4: <strong>Global</strong> Natural Gas Consumption, 2012-2016 (Million Tonnes Oil Equivalent) 32<br />
Figure 5: <strong>Global</strong> <strong>Crane</strong> <strong>Market</strong> Size, By Type, 2013-2023 35<br />
Figure 6: <strong>Global</strong> <strong>Crane</strong> <strong>Market</strong> Size, By Application (Unit Sales), 2013-2023 37<br />
Figure 7: North America <strong>Crane</strong> <strong>Market</strong> Size, By Volume (Unit Sales), 2013-2023 39<br />
Figure 8: North America Oil Production, 2012-2016 (Thousand Barrels Daily) 40<br />
Figure 9: North America Wind Energy Consumption, 2012-2016 (Million Tonnes Oil Equivalent) 40<br />
Figure 10: North America <strong>Crane</strong> <strong>Market</strong>: By Type, By Volume (Unit Sales), 2013-2023 41<br />
Figure 11: North America <strong>Crane</strong> <strong>Market</strong> Size, By Application (Unit Sales), 2013-2023 42<br />
Figure 12: U.S. <strong>Crane</strong> <strong>Market</strong> Size, By Volume (Unit Sales), 2013-2023 45<br />
Figure 13: U.S. Urban Population, 2012-2016 (Percentage Of Total) 46<br />
Figure 14: U.S. Wind Energy Consumption, 2012-2016 (Million Tonnes Oil Equivalent) 46<br />
Figure 15: U.S. <strong>Crane</strong> <strong>Market</strong>: By Type, By Volume (Unit Sales) (Unit Sales), 2013-2023 47<br />
Figure 16: U.S. <strong>Crane</strong> <strong>Market</strong> Size, By Application (Unit Sales), 2013-2023 48<br />
Figure 17: Canada <strong>Crane</strong> <strong>Market</strong> Size, By Volume (Unit Sales), 2013-2023 50<br />
Figure 18: Canada Construction Industry GDP, 2013-2017 (Billion USD) 51<br />
Figure 19: Canada Industrial Production, 2013-2017 (Taking Year 2010=100) 51<br />
(c) AZOTH Analytics<br />
10


