


You also want an ePaper? Increase the reach of your titles
YUMPU automatically turns print PDFs into web optimized ePapers that Google loves.
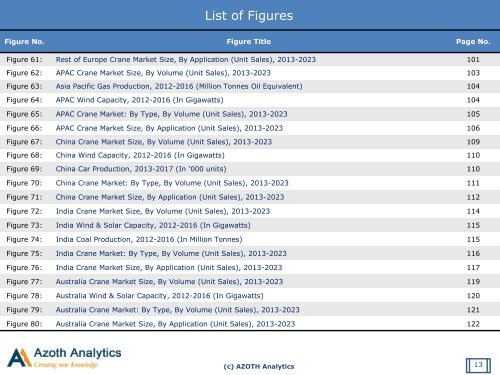
List of Figures<br />
Figure No. Figure Title Page No.<br />
Figure 61: Rest of Europe <strong>Crane</strong> <strong>Market</strong> Size, By Application (Unit Sales), 2013-2023 101<br />
Figure 62: APAC <strong>Crane</strong> <strong>Market</strong> Size, By Volume (Unit Sales), 2013-2023 103<br />
Figure 63: Asia Pacific Gas Production, 2012-2016 (Million Tonnes Oil Equivalent) 104<br />
Figure 64: APAC Wind Capacity, 2012-2016 (In Gigawatts) 104<br />
Figure 65: APAC <strong>Crane</strong> <strong>Market</strong>: By Type, By Volume (Unit Sales), 2013-2023 105<br />
Figure 66: APAC <strong>Crane</strong> <strong>Market</strong> Size, By Application (Unit Sales), 2013-2023 106<br />
Figure 67: China <strong>Crane</strong> <strong>Market</strong> Size, By Volume (Unit Sales), 2013-2023 109<br />
Figure 68: China Wind Capacity, 2012-2016 (In Gigawatts) 110<br />
Figure 69: China Car Production, 2013-2017 (In ‘000 units) 110<br />
Figure 70: China <strong>Crane</strong> <strong>Market</strong>: By Type, By Volume (Unit Sales), 2013-2023 111<br />
Figure 71: China <strong>Crane</strong> <strong>Market</strong> Size, By Application (Unit Sales), 2013-2023 112<br />
Figure 72: India <strong>Crane</strong> <strong>Market</strong> Size, By Volume (Unit Sales), 2013-2023 114<br />
Figure 73: India Wind & Solar Capacity, 2012-2016 (In Gigawatts) 115<br />
Figure 74: India Coal Production, 2012-2016 (In Million Tonnes) 115<br />
Figure 75: India <strong>Crane</strong> <strong>Market</strong>: By Type, By Volume (Unit Sales), 2013-2023 116<br />
Figure 76: India <strong>Crane</strong> <strong>Market</strong> Size, By Application (Unit Sales), 2013-2023 117<br />
Figure 77: Australia <strong>Crane</strong> <strong>Market</strong> Size, By Volume (Unit Sales), 2013-2023 119<br />
Figure 78: Australia Wind & Solar Capacity, 2012-2016 (In Gigawatts) 120<br />
Figure 79: Australia <strong>Crane</strong> <strong>Market</strong>: By Type, By Volume (Unit Sales), 2013-2023 121<br />
Figure 80: Australia <strong>Crane</strong> <strong>Market</strong> Size, By Application (Unit Sales), 2013-2023 122<br />
(c) AZOTH Analytics<br />
13


