Sample-Global Compounding Pharmacies Market
Create successful ePaper yourself
Turn your PDF publications into a flip-book with our unique Google optimized e-Paper software.
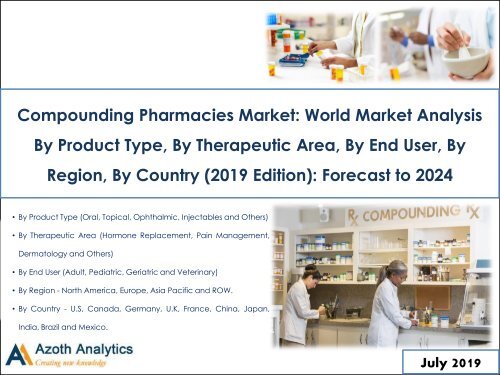
<strong>Compounding</strong> <strong>Pharmacies</strong> <strong>Market</strong>: World <strong>Market</strong> Analysis<br />
By Product Type, By Therapeutic Area, By End User, By<br />
Region, By Country (2019 Edition): Forecast to 2024<br />
• By Product Type (Oral, Topical, Ophthalmic, Injectables and Others)<br />
• By Therapeutic Area (Hormone Replacement, Pain Management,<br />
Dermatology and Others)<br />
• By End User (Adult, Pediatric, Geriatric and Veterinary)<br />
• By Region - North America, Europe, Asia Pacific and ROW.<br />
• By Country - U.S, Canada, Germany, U.K, France, China, Japan,<br />
India, Brazil and Mexico.<br />
July 2019
<strong>Compounding</strong> <strong>Pharmacies</strong> <strong>Market</strong><br />
2014 – 2024<br />
Base Year: 2018<br />
<strong>Global</strong> <strong>Compounding</strong> <strong>Pharmacies</strong> <strong>Market</strong> -<br />
Analysis By Product Type, Therapeutic Area, End User<br />
Oral<br />
By Product Type<br />
By Therapeutic Area<br />
End-User<br />
Topical<br />
Ophthalmic<br />
Injectables<br />
Others<br />
Hormone Replacement<br />
Pain Management<br />
Dermatology<br />
Others<br />
Adults<br />
Pediatric<br />
Geriatric<br />
o<br />
o<br />
o<br />
o<br />
o<br />
o<br />
o<br />
o<br />
o<br />
o<br />
o<br />
o<br />
o<br />
Regional Analysis<br />
North America<br />
Europe<br />
APAC<br />
ROW<br />
Country Analysis<br />
USA<br />
Canada<br />
United Kingdom<br />
Germany<br />
China<br />
India<br />
Japan<br />
Mexico<br />
Brazil<br />
<strong>Global</strong><br />
<strong>Market</strong><br />
Veterinary<br />
Historical Period<br />
2014 - 2018<br />
Forecast Period<br />
2019 - 2024<br />
2
<strong>Global</strong><br />
Scope of the Report – <strong>Compounding</strong> <strong>Pharmacies</strong> <strong>Market</strong><br />
Historical<br />
Forecast<br />
<strong>Market</strong><br />
(By Value)<br />
2014 2015 2016 2017 2018 2019 2020 2021 2022 2023 2024<br />
Oral <br />
Topical <br />
By Product Type,<br />
By Value<br />
Ophthalmic <br />
Injectables <br />
Others <br />
Hormone Replacement <br />
By Therapeutic<br />
Area,<br />
By Value<br />
Pain Management <br />
Dermatology <br />
Others <br />
Adult <br />
By End User,<br />
By Value<br />
Pediatric <br />
Geriatric <br />
Veterinary <br />
3
Regional<br />
Scope of the Report – <strong>Compounding</strong> <strong>Pharmacies</strong> <strong>Market</strong><br />
Historical<br />
Forecast<br />
<strong>Market</strong><br />
(By Value)<br />
2014 2015 2016 2017 2018 2019 2020 2021 2022 2023 2024<br />
Oral <br />
Topical <br />
By Product Type,<br />
By Value<br />
Ophthalmic <br />
Injectables <br />
Others <br />
Hormone Replacement <br />
By Therapeutic<br />
Area,<br />
By Value<br />
Pain Management <br />
Dermatology <br />
Others <br />
Adult <br />
By End User,<br />
By Value<br />
Pediatric <br />
Geriatric <br />
Veterinary <br />
4
Table of Content<br />
S.No Particulars Page No.<br />
1. Research Methodology 28<br />
2. Executive Summary 29<br />
3. Strategic Recommendation 30<br />
3.1 Focus on Pharmacogenetics based formulations 31<br />
3.2 APAC region to witness augmented growth in the forecast period 32<br />
4. <strong>Compounding</strong> <strong>Pharmacies</strong> <strong>Market</strong> Outlook 33<br />
5. <strong>Global</strong> <strong>Compounding</strong> <strong>Pharmacies</strong> <strong>Market</strong>: Growth and Forecast 37<br />
5.1 By Value (2014-2018) 38<br />
5.2 By Value (2019-2024) 39<br />
6. <strong>Global</strong> <strong>Compounding</strong> <strong>Pharmacies</strong> <strong>Market</strong>: Segmental Analysis 52<br />
6.1 <strong>Global</strong> <strong>Compounding</strong> <strong>Pharmacies</strong> <strong>Market</strong>, By Product Type: 53<br />
6.1.1 <strong>Global</strong> <strong>Compounding</strong> <strong>Pharmacies</strong> <strong>Market</strong> Size, By Product Type, By Value - 2018 (In %) 54<br />
6.1.2 <strong>Global</strong> <strong>Compounding</strong> <strong>Pharmacies</strong> <strong>Market</strong> Size, By Product Type, By Value - 2024 (In %) 54<br />
6.1.3 <strong>Global</strong> <strong>Compounding</strong> <strong>Pharmacies</strong> <strong>Market</strong>, By Oral Preparations, By Value (2014-2018) 55<br />
6.1.4 <strong>Global</strong> <strong>Compounding</strong> <strong>Pharmacies</strong> <strong>Market</strong>, By Oral Preparations, By Value (2019-2024) 55<br />
5
Table of Content<br />
S.No Particulars Page No.<br />
6.1.5 <strong>Global</strong> <strong>Compounding</strong> <strong>Pharmacies</strong> <strong>Market</strong>, By Topical Preparations, By Value (2014-2018) 56<br />
6.1.6 <strong>Global</strong> <strong>Compounding</strong> <strong>Pharmacies</strong> <strong>Market</strong>, By Topical Preparations, By Value (2019-2024) 56<br />
6.1.7 <strong>Global</strong> <strong>Compounding</strong> <strong>Pharmacies</strong> <strong>Market</strong>, By Ophthalmic Preparations, By Value (2014-2018) 57<br />
6.1.8 <strong>Global</strong> <strong>Compounding</strong> <strong>Pharmacies</strong> <strong>Market</strong>, By Ophthalmic Preparations, By Value (2019-2024) 57<br />
6.1.9 <strong>Global</strong> <strong>Compounding</strong> <strong>Pharmacies</strong> <strong>Market</strong>, By Injectable Preparations, By Value (2014-2018) 58<br />
6.1.10 <strong>Global</strong> <strong>Compounding</strong> <strong>Pharmacies</strong> <strong>Market</strong>, By Injectable Preparations, By Value (2019-2024) 58<br />
6.1.11 <strong>Global</strong> <strong>Compounding</strong> <strong>Pharmacies</strong> <strong>Market</strong>, By Other Preparations, By Value (2014-2018) 59<br />
6.1.12 <strong>Global</strong> <strong>Compounding</strong> <strong>Pharmacies</strong> <strong>Market</strong>, By Other Preparations, By Value (2019-2024) 59<br />
6.1.13 <strong>Market</strong> Opportunity of <strong>Global</strong> <strong>Compounding</strong> <strong>Pharmacies</strong> <strong>Market</strong> - By Product Type 60<br />
6.2 <strong>Global</strong> <strong>Compounding</strong> <strong>Pharmacies</strong> <strong>Market</strong>, By Therapeutic Area: 61<br />
6.2.1 <strong>Global</strong> <strong>Compounding</strong> <strong>Pharmacies</strong> <strong>Market</strong> Size, By Therapeutic Area, By Value - 2018 (In %) 62<br />
6.2.2 <strong>Global</strong> <strong>Compounding</strong> <strong>Pharmacies</strong> <strong>Market</strong> Size, By Therapeutic Area, By Value - 2024 (In %) 62<br />
6.2.3<br />
6.2.4<br />
6.2.5<br />
<strong>Global</strong> <strong>Compounding</strong> <strong>Pharmacies</strong> <strong>Market</strong>, By Hormone Replacement Application, By Value<br />
(2014-2018)<br />
<strong>Global</strong> <strong>Compounding</strong> <strong>Pharmacies</strong> <strong>Market</strong>, By Hormone Replacement Application, By Value<br />
(2019-2024)<br />
<strong>Global</strong> <strong>Compounding</strong> <strong>Pharmacies</strong> <strong>Market</strong>, By Pain Management Application, By Value<br />
(2014-2018)<br />
63<br />
63<br />
64<br />
6
Table of Content<br />
S.No Particulars Page No.<br />
6.2.6<br />
6.2.7<br />
6.2.8<br />
6.2.9<br />
6.2.10<br />
<strong>Global</strong> <strong>Compounding</strong> <strong>Pharmacies</strong> <strong>Market</strong>, By Pain Management Application, By Value<br />
(2019-2024)<br />
<strong>Global</strong> <strong>Compounding</strong> <strong>Pharmacies</strong> <strong>Market</strong>, By Dermatology Application, By Value<br />
(2014-2018)<br />
<strong>Global</strong> <strong>Compounding</strong> <strong>Pharmacies</strong> <strong>Market</strong>, By Dermatology Application, By Value<br />
(2019-2024)<br />
<strong>Global</strong> <strong>Compounding</strong> <strong>Pharmacies</strong> <strong>Market</strong>, By Other Therapeutic Areas, By Value<br />
(2014-2018)<br />
<strong>Global</strong> <strong>Compounding</strong> <strong>Pharmacies</strong> <strong>Market</strong>, By Other Therapeutic Areas, By Value<br />
(2019-2024)<br />
64<br />
65<br />
65<br />
66<br />
66<br />
6.2.10 <strong>Market</strong> Opportunity of <strong>Global</strong> <strong>Compounding</strong> <strong>Pharmacies</strong> <strong>Market</strong> - By Therapeutic Area 67<br />
6.3 <strong>Global</strong> <strong>Compounding</strong> <strong>Pharmacies</strong> <strong>Market</strong>, By End User: 68<br />
6.3.1 <strong>Global</strong> <strong>Compounding</strong> <strong>Pharmacies</strong> <strong>Market</strong> Size, By End User, By Value - 2018 (In %) 69<br />
6.3.2 <strong>Global</strong> <strong>Compounding</strong> <strong>Pharmacies</strong> <strong>Market</strong> Size, By End User, By Value - 2024 (In %) 69<br />
6.3.3 <strong>Global</strong> <strong>Compounding</strong> <strong>Pharmacies</strong> <strong>Market</strong>, By Adult End User, By Value (2014-2018) 70<br />
6.3.4 <strong>Global</strong> <strong>Compounding</strong> <strong>Pharmacies</strong> <strong>Market</strong>, By Adult End User, By Value (2019-2024) 70<br />
6.3.5 <strong>Global</strong> <strong>Compounding</strong> <strong>Pharmacies</strong> <strong>Market</strong>, By Pediatric End User, By Value (2014-2018) 71<br />
6.3.6 <strong>Global</strong> <strong>Compounding</strong> <strong>Pharmacies</strong> <strong>Market</strong>, By Pediatric End User, By Value (2019-2024) 71<br />
6.3.7 <strong>Global</strong> <strong>Compounding</strong> <strong>Pharmacies</strong> <strong>Market</strong>, By Geriatric End User, By Value (2014-2018) 72<br />
6.3.8 <strong>Global</strong> <strong>Compounding</strong> <strong>Pharmacies</strong> <strong>Market</strong>, By Geriatric End User, By Value (2019-2024) 72<br />
7
Table of Content<br />
S.No Particulars Page No.<br />
6.3.9 <strong>Global</strong> <strong>Compounding</strong> <strong>Pharmacies</strong> <strong>Market</strong>, By Veterinary End User, By Value (2014-2018) 73<br />
6.9.10 <strong>Global</strong> <strong>Compounding</strong> <strong>Pharmacies</strong> <strong>Market</strong>, By Veterinary End User, By Value (2019-2024) 73<br />
6.9.11 <strong>Market</strong> Opportunity of <strong>Global</strong> <strong>Compounding</strong> <strong>Pharmacies</strong> <strong>Market</strong> - By End User 74<br />
7. <strong>Global</strong> <strong>Compounding</strong> <strong>Pharmacies</strong> <strong>Market</strong>: Regional Analysis 75<br />
7.1 <strong>Global</strong> <strong>Compounding</strong> <strong>Pharmacies</strong> <strong>Market</strong> Size, By Region : Breakdown (%) 77<br />
7.1.1 <strong>Global</strong> <strong>Compounding</strong> <strong>Pharmacies</strong> <strong>Market</strong> Size, By Region, 2018 (%) 77<br />
7.1.2 <strong>Global</strong> <strong>Compounding</strong> <strong>Pharmacies</strong> <strong>Market</strong> Size, By Region, 2024F (%) 77<br />
7.2 North America <strong>Compounding</strong> <strong>Pharmacies</strong> <strong>Market</strong>: Growth and Forecast 79<br />
7.2.1 By Value (2014-2018) 80<br />
7.2.2 By Value (2019-2024) 81<br />
7.2.3 North America <strong>Compounding</strong> <strong>Pharmacies</strong> <strong>Market</strong>- Company Share Analysis 89<br />
7.2.4 By Product Type, By Value (2014-2018) 92<br />
7.2.5 By Product Type, By Value (2019-2024) 93<br />
7.2.6 By Therapeutic Area, By Value (2014-2018) 94<br />
7.2.7 By Therapeutic Area, By Value (2019-2024) 95<br />
8
Table of Content<br />
S.No Particulars Page No.<br />
7.2.8 By End User, By Value (2014-2018) 96<br />
7.2.9 By End User, By Value (2019-2024) 97<br />
7.3 North America <strong>Compounding</strong> <strong>Pharmacies</strong> <strong>Market</strong>: Country Analysis (U.S and Canada) 98<br />
7.3.1<br />
<strong>Market</strong> Attractiveness Chart of North America <strong>Compounding</strong> <strong>Pharmacies</strong> <strong>Market</strong> – By<br />
Country, By Value<br />
99<br />
7.3.2 North America <strong>Compounding</strong> <strong>Pharmacies</strong> <strong>Market</strong> Size, By Country, 2018 (%) 100<br />
7.3.3 North America <strong>Compounding</strong> <strong>Pharmacies</strong> <strong>Market</strong> Size, By Country, 2024F (%) 100<br />
7.3.4 U.S <strong>Compounding</strong> <strong>Pharmacies</strong> <strong>Market</strong>, By Value (2014-2018) 102<br />
7.3.5 U.S <strong>Compounding</strong> <strong>Pharmacies</strong> <strong>Market</strong>, By Value (2019-2024) 102<br />
7.3.6 Canada <strong>Compounding</strong> <strong>Pharmacies</strong> <strong>Market</strong>, By Value (2014-2018) 109<br />
7.3.7 Canada <strong>Compounding</strong> <strong>Pharmacies</strong> <strong>Market</strong>, By Value (2019-2024) 109<br />
7.4 Europe <strong>Compounding</strong> <strong>Pharmacies</strong> <strong>Market</strong>: Growth and Forecast 115<br />
7.4.1 By Value (2014-2018) 116<br />
7.4.2 By Value (2019-2024) 117<br />
7.4.3 Europe <strong>Compounding</strong> <strong>Pharmacies</strong> <strong>Market</strong>- Company Share Analysis 121<br />
7.4.4 By Product Type, By Value (2014-2018) 123<br />
9
Table of Content<br />
S.No Particulars Page No.<br />
7.4.5 By Product Type, By Value (2019-2024) 124<br />
7.4.6 By Therapeutic Area, By Value (2014-2018) 125<br />
7.4.7 By Therapeutic Area, By Value (2019-2024) 126<br />
7.4.8 By End User, By Value (2014-2018) 127<br />
7.4.9 By End User, By Value (2019-2024) 128<br />
7.5 Europe <strong>Compounding</strong> <strong>Pharmacies</strong> <strong>Market</strong>: Country Analysis (Germany and U.K) 129<br />
7.5.1<br />
<strong>Market</strong> Attractiveness Chart of Europe <strong>Compounding</strong> <strong>Pharmacies</strong> <strong>Market</strong> – By Country, By<br />
Value<br />
130<br />
7.5.2 Europe <strong>Compounding</strong> <strong>Pharmacies</strong> <strong>Market</strong> Size, By Country, 2018 (%) 131<br />
7.5.3 Europe <strong>Compounding</strong> <strong>Pharmacies</strong> <strong>Market</strong> Size, By Country, 2024F (%) 131<br />
7.5.4 Germany <strong>Compounding</strong> <strong>Pharmacies</strong> <strong>Market</strong>, By Value (2014-2018) 133<br />
7.5.5 Germany <strong>Compounding</strong> <strong>Pharmacies</strong> <strong>Market</strong>, By Value (2019-2024) 133<br />
7.5.6 U.K <strong>Compounding</strong> <strong>Pharmacies</strong> <strong>Market</strong>, By Value (2014-2018) 138<br />
7.5.7 U.K <strong>Compounding</strong> <strong>Pharmacies</strong> <strong>Market</strong>, By Value (2019-2024) 138<br />
7.6 APAC <strong>Compounding</strong> <strong>Pharmacies</strong> <strong>Market</strong>: Growth and Forecast 143<br />
7.6.1 By Value (2014-2018) 144<br />
10
Table of Content<br />
S.No Particulars Page No.<br />
7.6.2 By Value (2019-2024) 145<br />
7.6.3 APAC <strong>Compounding</strong> <strong>Pharmacies</strong> <strong>Market</strong>- Competitive Landscape 152<br />
7.6.4 By Product Type, By Value (2014-2018) 154<br />
7.6.5 By Product Type, By Value (2019-2024) 155<br />
7.6.6 By Therapeutic Area, By Value (2014-2018) 156<br />
7.6.7 By Therapeutic Area, By Value (2019-2024) 157<br />
7.6.8 By End User, By Value (2014-2018) 158<br />
7.6.9 By End User, By Value (2019-2024) 159<br />
7.5 APAC <strong>Compounding</strong> <strong>Pharmacies</strong> <strong>Market</strong>: Country Analysis (India, China and Japan) 160<br />
7.5.1<br />
<strong>Market</strong> Attractiveness Chart of APAC <strong>Compounding</strong> <strong>Pharmacies</strong> <strong>Market</strong> – By Country, By<br />
Value<br />
161<br />
7.5.2 APAC <strong>Compounding</strong> <strong>Pharmacies</strong> <strong>Market</strong> Size, By Country, 2018 (%) 162<br />
7.5.3 APAC <strong>Compounding</strong> <strong>Pharmacies</strong> <strong>Market</strong> Size, By Country, 2024F (%) 162<br />
7.5.4 India <strong>Compounding</strong> <strong>Pharmacies</strong> <strong>Market</strong>, By Value (2014-2018) 164<br />
7.5.5 India <strong>Compounding</strong> <strong>Pharmacies</strong> <strong>Market</strong>, By Value (2019-2024) 164<br />
7.5.6 China <strong>Compounding</strong> <strong>Pharmacies</strong> <strong>Market</strong>, By Value (2014-2018) 170<br />
11
Table of Content<br />
S.No Particulars Page No.<br />
7.6.5 China <strong>Compounding</strong> <strong>Pharmacies</strong> <strong>Market</strong>, By Value (2019-2024) 171<br />
7.6.6 Japan <strong>Compounding</strong> <strong>Pharmacies</strong> <strong>Market</strong>, By Value (2014-2018) 177<br />
7.6.7 Japan <strong>Compounding</strong> <strong>Pharmacies</strong> <strong>Market</strong>, By Value (2019-2024) 177<br />
7.7 ROW <strong>Compounding</strong> <strong>Pharmacies</strong> <strong>Market</strong>: Growth and Forecast 181<br />
7.7.1 By Value (2014-2018) 182<br />
7.7.2 By Value (2019-2024) 183<br />
7.7.3 ROW <strong>Compounding</strong> <strong>Pharmacies</strong> <strong>Market</strong>- Company Share Analysis 190<br />
7.7.4 By Product Type, By Value (2014-2018) 192<br />
7.7.5 By Product Type, By Value (2019-2024) 193<br />
7.7.6 By Therapeutic Area, By Value (2014-2018) 194<br />
7.7.7 By Therapeutic Area, By Value (2019-2024) 195<br />
7.7.8 By End User, By Value (2014-2018) 196<br />
7.7.9 By End User, By Value (2019-2024) 197<br />
7.8 ROW <strong>Compounding</strong> <strong>Pharmacies</strong> <strong>Market</strong>: Country Analysis (Brazil and Mexico) 198<br />
7.8.1<br />
<strong>Market</strong> Attractiveness Chart of APAC <strong>Compounding</strong> <strong>Pharmacies</strong> <strong>Market</strong> – By Country, By<br />
Value<br />
199<br />
12
Table of Content<br />
S.No Particulars Page No.<br />
7.8.2 ROW <strong>Compounding</strong> <strong>Pharmacies</strong> <strong>Market</strong> Size, By Country, 2018 (%) 200<br />
7.8.3 ROW <strong>Compounding</strong> <strong>Pharmacies</strong> <strong>Market</strong> Size, By Country, 2024F (%) 200<br />
7.8.4 Brazil <strong>Compounding</strong> <strong>Pharmacies</strong> <strong>Market</strong>, By Value (2014-2018) 202<br />
7.8.5 Brazil <strong>Compounding</strong> <strong>Pharmacies</strong> <strong>Market</strong>, By Value (2019-2024) 202<br />
7.8.6 Mexico <strong>Compounding</strong> <strong>Pharmacies</strong> <strong>Market</strong>, By Value (2014-2018) 207<br />
7.8.7 Mexico <strong>Compounding</strong> <strong>Pharmacies</strong> <strong>Market</strong>, By Value (2019-2024) 207<br />
8. <strong>Global</strong> <strong>Compounding</strong> <strong>Pharmacies</strong> <strong>Market</strong> Dynamics 209<br />
8.1 <strong>Global</strong> <strong>Compounding</strong> <strong>Pharmacies</strong> <strong>Market</strong> Drivers 210<br />
8.2 <strong>Global</strong> <strong>Compounding</strong> <strong>Pharmacies</strong> <strong>Market</strong> Restraints 216<br />
9. <strong>Global</strong> <strong>Compounding</strong> <strong>Pharmacies</strong> <strong>Market</strong> Trends 219<br />
10. <strong>Global</strong> <strong>Compounding</strong> <strong>Pharmacies</strong> <strong>Market</strong>: 222<br />
10.1 Competitive Landscape 223<br />
10.2 Company Share Analysis 225<br />
10.3 Merger and Acquisitions of Key Industry Players 226<br />
11. Porter Five Force Analysis 229<br />
13
Table of Content<br />
S.No Particulars Page No.<br />
12. SWOT Analysis 231<br />
13. Policy and Regulatory Landscape 233<br />
14. Company Profiling 241<br />
14.1 Fagron 242<br />
14.2 PharMEDium 245<br />
14.3 Doughtery’s Pharmacy 246<br />
14.4 ITC <strong>Compounding</strong> Pharmacy 248<br />
14.5 Fresenius Kabi 249<br />
14.6 Clinigen Group 251<br />
14.7 Absolute Pharmacy 254<br />
14.8 McGuff <strong>Compounding</strong> <strong>Pharmacies</strong> Services, Inc. 255<br />
14.9 Pentec Health 256<br />
14.10 Harrow Health, Inc. 257<br />
15. About Us 260<br />
14
Research Methodology<br />
For our study on compounding pharmacies market, we have conducted comprehensive secondary research<br />
followed by an extensive primary research. In the process of secondary research, we have scrutinized<br />
industry documents, accessed from open sources, premium paid databases (Bloomberg, Thomson Reuters,<br />
Factiva) and our internal knowledge base. In the process of primary research, we have interviewed various<br />
industry experts across the value chain of the healthcare industry.<br />
<strong>Market</strong> size of the actual period (2014-2018) has been evaluated on the basis of growth trends of the<br />
industry in the last five years, and confirming the findings through primary research. Annual reports of<br />
the companies were scanned to further validate the market size and to estimate the size of various<br />
other end-user sectors. <strong>Market</strong> sizing and growth in the forecast period (2019-2024) is estimated<br />
through product mapping, application in end-user industries, growth of allied sectors and historical<br />
growth pattern of the industry. All the relevant data points/ statistics in the forecast period are<br />
validated through relevant and reliable primary sources.<br />
Report Focus: <strong>Global</strong> <strong>Compounding</strong> <strong>Pharmacies</strong> <strong>Market</strong><br />
- By Product Type (Oral, Topical, Ophthalmic, Injectables and Others)<br />
- By Therapeutic Area (Hormone Replacement, Pain Management, Dermatology and Others)<br />
- By End User (Adult, Pediatric, Geriatric and Veterinary)<br />
- By Region (North America, Europe, Asia Pacific and Rest of the World)<br />
- By Country ( U.S., Canada, Germany, United Kingdom, Japan, China, India, Brazil and Mexico).<br />
Companies Contacted : Fagron, Avella Specialty Pharmacy<br />
15
Executive Summary<br />
<strong>Market</strong><br />
Drivers & Challenges<br />
Trend<br />
The global compounding<br />
pharmacies market was valued at<br />
USD 9689.56 million in the year<br />
2018 with North America leading the<br />
regional market share.<br />
.<br />
The global market grew at CAGR of<br />
approximately XX% during the<br />
period 2014-2018 and is expected to<br />
grow further by CAGR XX% in the<br />
forecast period 2019-2024.<br />
• Drivers<br />
‣ Rising healthcare expenditure<br />
‣ Ongoing demographic shift towards geriatric<br />
population<br />
‣ Increasing incidence of chronic ailments<br />
‣ Drug Shortages<br />
‣ Growing acceptance of personalized medicines<br />
• Challenges<br />
‣ Lack of skilled lab technicians and pharmacists<br />
‣ Changing regulatory landscape<br />
‣ Transition to biologics<br />
and genetically modified<br />
medications<br />
‣ Technological<br />
advancements<br />
Competitive Landscape<br />
Fagron, Dougherty’s Pharmacy, ITC <strong>Compounding</strong> Pharmacy, Fresenius, PharMEDium, Clinigen<br />
Group, Absolute Pharmacy, Pentec Health, McGuff <strong>Compounding</strong> Pharmacy Services, Inc., and<br />
Harrow Health, Inc.<br />
16
<strong>Global</strong> <strong>Compounding</strong> <strong>Pharmacies</strong> <strong>Market</strong><br />
Figure 19: Key Factors Driving <strong>Global</strong> Healthcare Industry<br />
xx% of global health care expenditure will be spent on<br />
cardiovascular ailments, cancer and respiratory diseases.<br />
Number of diabetic patients are expected to be xx by xx%-<br />
xx% by the year 2040.<br />
Prevalence of dementia is expected to be xx every xx years.<br />
By 2050, baby boomer populations is expected to be xx by<br />
xx%<br />
Source: World Bank, WHO, OECD.<br />
17
<strong>Global</strong> <strong>Compounding</strong> <strong>Pharmacies</strong> <strong>Market</strong>: By Product Type<br />
By product type, the oral segment dominates the global market throughout the analysis period.<br />
Figure 22: <strong>Global</strong> <strong>Compounding</strong> <strong>Pharmacies</strong> <strong>Market</strong><br />
Size, By Product Type, By Value - 2018 (%)<br />
Figure 23: <strong>Global</strong> <strong>Compounding</strong> <strong>Pharmacies</strong> <strong>Market</strong> Size,<br />
By Product Type, By Value - 2024F (%)<br />
Oral<br />
Oral<br />
Topical<br />
Topical<br />
Ophthalmic<br />
Ophthalmic<br />
Injectables<br />
Injectables<br />
Others<br />
Others<br />
Source: Azoth Analytics Estimates<br />
18
<strong>Global</strong> <strong>Compounding</strong> <strong>Pharmacies</strong> <strong>Market</strong>, By Oral Preparations<br />
<strong>Global</strong> <strong>Compounding</strong> <strong>Pharmacies</strong> <strong>Market</strong><br />
Replacement Devices <strong>Market</strong>, By Value<br />
Figure 24: <strong>Global</strong> <strong>Compounding</strong> <strong>Pharmacies</strong> <strong>Market</strong>, By<br />
Oral Preparations, By Value, 2014-2018 (USD Million)<br />
CAGR 2014-2018<br />
xx%<br />
Figure 25: <strong>Global</strong> <strong>Compounding</strong> <strong>Pharmacies</strong> <strong>Market</strong>, By Oral<br />
Preparations, By Value, Forecast, 2019-2024 (USD Million)<br />
CAGR 2019-2024<br />
xx%<br />
2014 2015 2016 2017 2018 2019 2020 2021 2022 2023 2024<br />
Source: Azoth Analytics Estimates<br />
Xx<br />
Xx<br />
Xx<br />
Xx<br />
Xx<br />
Xx<br />
Xx<br />
19
CAGR (2019-2024)<br />
<strong>Market</strong> Opportunity of <strong>Global</strong> <strong>Compounding</strong> <strong>Pharmacies</strong> <strong>Market</strong> - By Product Type<br />
Figure 34: <strong>Market</strong> Opportunity Chart of <strong>Global</strong> <strong>Compounding</strong> <strong>Pharmacies</strong> <strong>Market</strong> - By Product Type (Year-2024)<br />
6.00%<br />
5.00%<br />
Oral<br />
4.00%<br />
3.00%<br />
2.00%<br />
1.00%<br />
0.00%<br />
0 1000 2000 3000 4000 5000 6000 7000<br />
<strong>Market</strong> Size (USD Million) in Year 2024<br />
Topical<br />
Ophthalmic<br />
Injectables<br />
Others<br />
The segment of oral compounded formulations possessed the highest share of xx% in year 2018 due to its wide range of<br />
advantages such as ease of administration, ease of access, etc. Moreover, it is expected that this segment will also maintain its xx<br />
in the global market over the forecast period, reaching a share approximately xx% by the year 2024.<br />
(c) AZOTH Analytics<br />
20
<strong>Global</strong> <strong>Compounding</strong> <strong>Pharmacies</strong> <strong>Market</strong>, By Other Therapeutic Areas<br />
<strong>Global</strong> <strong>Compounding</strong> <strong>Pharmacies</strong> <strong>Market</strong><br />
Replacement Devices <strong>Market</strong>, By Value<br />
Figure 43: <strong>Global</strong> <strong>Compounding</strong> <strong>Pharmacies</strong> <strong>Market</strong>,<br />
By Other Therapeutic Areas, By Value, 2014-2018<br />
(USD Million)<br />
CAGR 2014-2018<br />
xx%<br />
Figure 44: <strong>Global</strong> <strong>Compounding</strong> <strong>Pharmacies</strong> <strong>Market</strong>,<br />
By Other Therapeutic Areas, By Value, Forecast,<br />
2019-2024 (USD Million)<br />
CAGR 2019-2024<br />
xx%<br />
2014 2015 2016 2017 2018 2019 2020 2021 2022 2023 2024<br />
Source: Azoth Analytics Estimates<br />
Xx<br />
Xx<br />
Xx<br />
Xx<br />
Xx<br />
Xx<br />
Xx<br />
21
<strong>Global</strong> <strong>Compounding</strong> <strong>Pharmacies</strong> <strong>Market</strong>, By Adult End User<br />
<strong>Global</strong> <strong>Compounding</strong> <strong>Pharmacies</strong> <strong>Market</strong><br />
Replacement Devices <strong>Market</strong>, By Value<br />
Figure 48: <strong>Global</strong> <strong>Compounding</strong> <strong>Pharmacies</strong> <strong>Market</strong>,<br />
By Adult End User, By Value, 2014-2018 (USD Million)<br />
Figure 49: <strong>Global</strong> <strong>Compounding</strong> <strong>Pharmacies</strong> <strong>Market</strong>, By Adult<br />
End User, By Value, Forecast, 2019-2024 (USD Million)<br />
CAGR 2014-2018<br />
xx%<br />
CAGR 2019-2024<br />
xx%<br />
2014 2015 2016 2017 2018 2019 2020 2021 2022 2023 2024<br />
Xx<br />
Source: Azoth Analytics Estimates<br />
Xx<br />
Xx<br />
Xx<br />
Xx<br />
Xx<br />
Xx<br />
22
North America <strong>Compounding</strong> <strong>Pharmacies</strong> <strong>Market</strong>, By End User<br />
Figure 78: North America <strong>Compounding</strong> <strong>Pharmacies</strong> <strong>Market</strong>: By End User, By Value, 2014-2018 (USD Million)<br />
CAGR 2014-2018<br />
Adult: xx%<br />
Pediatric: xx%<br />
Geriatric: xx%<br />
Veterinary: xx%<br />
2014 2015 2016 2017 2018<br />
Adult Pediatric Geriatric Veterinary<br />
2014 2015 2016 2017 2018<br />
Adult xx xx xx xx xx<br />
Pediatric xx xx xx xx xx<br />
Geriatric xx xx xx xx xx<br />
Veterinary xx xx xx xx xx<br />
Source: Azoth Analytics Estimates<br />
23
U.S. <strong>Compounding</strong> <strong>Pharmacies</strong> <strong>Market</strong>, By Value<br />
Figure 83: U.S. <strong>Compounding</strong> <strong>Pharmacies</strong> <strong>Market</strong><br />
Size, By Value, 2014-2018 (USD Million)<br />
Figure 84: U.S. <strong>Compounding</strong> <strong>Pharmacies</strong> <strong>Market</strong> Size,<br />
By Value, Forecast, 2019-2024 (USD Million)<br />
CAGR 2014-2018<br />
xx%<br />
CAGR 2019-2024<br />
xx%<br />
2014 2015 2016 2017 2018 2019 2020 2021 2022 2023 2024<br />
Source: Azoth Analytics Estimates<br />
Xx<br />
Xx<br />
Xx<br />
• .<br />
Xx<br />
Xx<br />
Xx<br />
Xx<br />
24
About Azoth Analytics Pvt Ltd.<br />
Azoth Analytics (ISO 9001:2015) is a business research and analytics company that creates in-depth research reports and provides customized research<br />
solutions and consulting services. An ISO 9001:2015 certified company, Azoth Analytics adheres to international quality management standard and has strong<br />
commitment to a culture of continuous improvement. The business research and market analysis of Azoth Analytics helps organizations across different<br />
industry verticals solve their business problems. Strategic market sizing and data dredging techniques include secondary research, and primary research<br />
(interviews with management personnel and industry experts). Azoth Analytics provide syndicated and customized market research reports on different<br />
verticals including pharmaceutical and healthcare, oil and gas and power, chemicals, automotive, technology, FMCG, food & beverages and media sectors.<br />
(c) AZOTH Analytics<br />
25


