You also want an ePaper? Increase the reach of your titles
YUMPU automatically turns print PDFs into web optimized ePapers that Google loves.
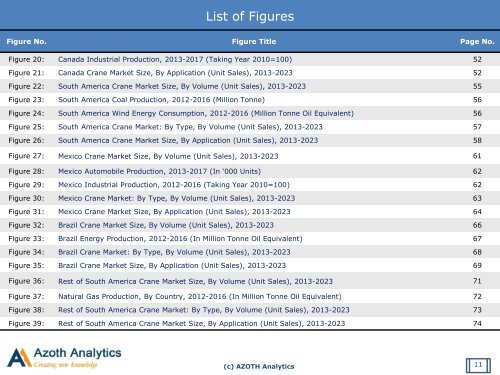
List of Figures<br />
Figure No. Figure Title Page No.<br />
Figure 20: Canada Industrial Production, 2013-2017 (Taking Year 2010=100) 52<br />
Figure 21: Canada <strong>Crane</strong> <strong>Market</strong> Size, By Application (Unit Sales), 2013-2023 52<br />
Figure 22: South America <strong>Crane</strong> <strong>Market</strong> Size, By Volume (Unit Sales), 2013-2023 55<br />
Figure 23: South America Coal Production, 2012-2016 (Million Tonne) 56<br />
Figure 24: South America Wind Energy Consumption, 2012-2016 (Million Tonne Oil Equivalent) 56<br />
Figure 25: South America <strong>Crane</strong> <strong>Market</strong>: By Type, By Volume (Unit Sales), 2013-2023 57<br />
Figure 26: South America <strong>Crane</strong> <strong>Market</strong> Size, By Application (Unit Sales), 2013-2023 58<br />
Figure 27: Mexico <strong>Crane</strong> <strong>Market</strong> Size, By Volume (Unit Sales), 2013-2023 61<br />
Figure 28: Mexico Automobile Production, 2013-2017 (In ‘000 Units) 62<br />
Figure 29: Mexico Industrial Production, 2012-2016 (Taking Year 2010=100) 62<br />
Figure 30: Mexico <strong>Crane</strong> <strong>Market</strong>: By Type, By Volume (Unit Sales), 2013-2023 63<br />
Figure 31: Mexico <strong>Crane</strong> <strong>Market</strong> Size, By Application (Unit Sales), 2013-2023 64<br />
Figure 32: Brazil <strong>Crane</strong> <strong>Market</strong> Size, By Volume (Unit Sales), 2013-2023 66<br />
Figure 33: Brazil Energy Production, 2012-2016 (In Million Tonne Oil Equivalent) 67<br />
Figure 34: Brazil <strong>Crane</strong> <strong>Market</strong>: By Type, By Volume (Unit Sales), 2013-2023 68<br />
Figure 35: Brazil <strong>Crane</strong> <strong>Market</strong> Size, By Application (Unit Sales), 2013-2023 69<br />
Figure 36: Rest of South America <strong>Crane</strong> <strong>Market</strong> Size, By Volume (Unit Sales), 2013-2023 71<br />
Figure 37: Natural Gas Production, By Country, 2012-2016 (In Million Tonne Oil Equivalent) 72<br />
Figure 38: Rest of South America <strong>Crane</strong> <strong>Market</strong>: By Type, By Volume (Unit Sales), 2013-2023 73<br />
Figure 39: Rest of South America <strong>Crane</strong> <strong>Market</strong> Size, By Application (Unit Sales), 2013-2023 74<br />
(c) AZOTH Analytics<br />
11


