Bilag 7 (PDF)
Bilag 7 (PDF)
Bilag 7 (PDF)

You also want an ePaper? Increase the reach of your titles
YUMPU automatically turns print PDFs into web optimized ePapers that Google loves.
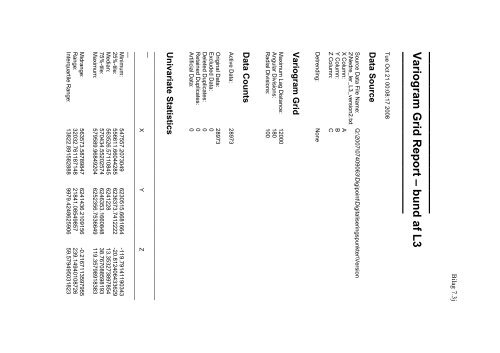
——————————————Variogram Grid Report – bund af L3——————————————Tue Oct 21 00:08:17 2008Data Source<strong>Bilag</strong> 7.3jSource Data File Name:2\Nedre_ler_L3_version2.txtX Column:Y Column:Z Column:Q:\2007\07409063\Digipoint\Digitaliseringspunkter\VersionABCDetrending:NoneVariogram GridMaximum Lag Distance: 12000Angular Divisions: 180Radial Divisions: 100Data CountsActive Data: 28973Original Data: 28973Excluded Data: 0Deleted Duplicates: 0Retained Duplicates: 0Artificial Data: 0Univariate Statistics————————————————————————————————————————————X Y Z————————————————————————————————————————————Minimum: 547557.2073049 6230515.6681664 -119.7914119034325%-tile: 556611.66044285 6236373.7412222 -20.812406433629Median: 563526.57110845 6241228 13.35327389785475%-tile: 570434.55202574 6246353.1660848 38.767088598193Maximum: 579589.96849204 6252356.7536649 119.35798918383Midrange: 563573.58789847 6241436.2109156 -0.2167113597955Range: 32032.761187148 21841.08549857 239.14940108726Interquartile Range: 13822.891582888 9979.4248625906 59.579495031823