Fakten und Zahlen 2012 - Press Room - General Motors
Fakten und Zahlen 2012 - Press Room - General Motors
Fakten und Zahlen 2012 - Press Room - General Motors

Sie wollen auch ein ePaper? Erhöhen Sie die Reichweite Ihrer Titel.
YUMPU macht aus Druck-PDFs automatisch weboptimierte ePaper, die Google liebt.
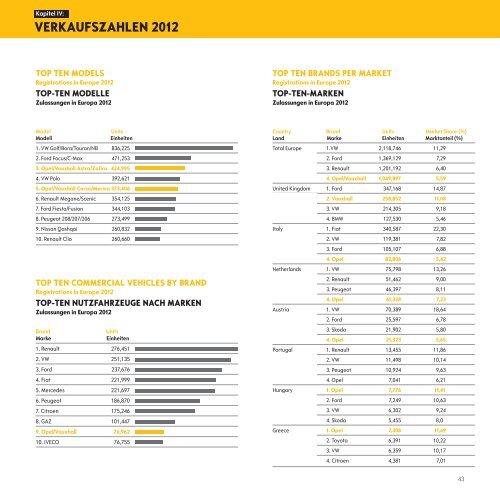
Kapitel IV:<br />
VerkauFszahlen <strong>2012</strong><br />
top ten MoDels<br />
registrations in europe <strong>2012</strong><br />
top-ten MoDelle<br />
zulassungen in europa <strong>2012</strong><br />
Model Units<br />
Modell Einheiten<br />
1. VW Golf/Bora/Touran/NB 836,225<br />
2. Ford Focus/C-Max 471,253<br />
3. opel/Vauxhall astra/zafira 424,995<br />
4. VW Polo 392,621<br />
5. opel/Vauxhall corsa/Meriva 373,406<br />
6. Renault Megane/Scenic 354,125<br />
7. Ford Fiesta/Fusion 344,103<br />
8. Peugeot 208/207/206 273,499<br />
9. Nissan Qashqai 260,832<br />
10. Renault Clio 260,660<br />
top ten coMMercial Vehicles by branD<br />
registrations in europe <strong>2012</strong><br />
top-ten nutzFahrzeuge nach Marken<br />
zulassungen in europa <strong>2012</strong><br />
Brand Units<br />
Marke Einheiten<br />
1. Renault 276,451<br />
2. VW 251,135<br />
3. Ford 237,676<br />
4. Fiat 221,999<br />
5. Mercedes 221,697<br />
6. Peugeot 186,870<br />
7. Citroen 175,246<br />
8. GAZ 101,447<br />
9. opel/Vauxhall 76,962<br />
10. IVECO 76,755<br />
top ten branDs per Market<br />
registrations in europe <strong>2012</strong><br />
top-ten-Marken<br />
zulassungen in europa <strong>2012</strong><br />
Country Brand Units Market Share (%)<br />
Land Marke Einheiten Marktanteil (%)<br />
Total Europe 1.VW 2,118,746 11,29<br />
2. Ford 1,369,129 7,29<br />
3. Renault 1,201,192 6,40<br />
4. opel/Vauxhall 1,049,897 5,59<br />
United Kingdom 1. Ford 347,168 14,87<br />
2. Vauxhall 258,852 11,08<br />
3. VW 214,305 9,18<br />
4. BMW 127,530 5,46<br />
Italy 1. Fiat 340,587 22,30<br />
2. VW 119,381 7,82<br />
3. Ford 105,107 6,88<br />
4. opel 82,806 5,42<br />
Netherlands 1. VW 75,798 13,26<br />
2. Renault 51,462 9,00<br />
3. Peugeot 46,397 8,11<br />
4. opel 41,338 7,23<br />
Austria 1. VW 70,389 18,64<br />
2. Ford 25,597 6,78<br />
3. Skoda 21,902 5,80<br />
4. opel 21,323 5,65<br />
Portugal 1. Renault 13,455 11,86<br />
2. VW 11,498 10,14<br />
3. Peugeot 10,924 9,63<br />
4. Opel 7,041 6,21<br />
Hungary 1. opel 7,776 11,41<br />
2. Ford 7,249 10,63<br />
3. VW 6,302 9,24<br />
4. Skoda 5,455 8,0<br />
Greece 1. opel 7,308 11,69<br />
2. Toyota 6,391 10,22<br />
3. VW 6,359 10,17<br />
4. Citroen 4,381 7,01<br />
43