Verena Gonzalez Lopez, 2011 - Institut für Tierzucht und Tierhaltung ...
Verena Gonzalez Lopez, 2011 - Institut für Tierzucht und Tierhaltung ...
Verena Gonzalez Lopez, 2011 - Institut für Tierzucht und Tierhaltung ...

Sie wollen auch ein ePaper? Erhöhen Sie die Reichweite Ihrer Titel.
YUMPU macht aus Druck-PDFs automatisch weboptimierte ePaper, die Google liebt.
Aus dem <strong>Institut</strong> <strong>für</strong> <strong>Tierzucht</strong> <strong>und</strong> <strong>Tierhaltung</strong><br />
der Agrar- <strong>und</strong> Ernährungswissenschaftlichen Fakultät<br />
der Christian-Albrechts-Universität zu Kiel<br />
Genetische Variabilität<br />
bei der Vaterrasse Piétrain in Schleswig-Holstein<br />
Dissertation<br />
zur Erlangung des Doktorgrades<br />
der Agrar- <strong>und</strong> Ernährungswissenschaftlichen Fakultät<br />
der Christian-Albrechts-Universität zu Kiel<br />
vorgelegt von<br />
M.Sc. <strong>Verena</strong> <strong>Gonzalez</strong> <strong>Lopez</strong><br />
aus Solingen<br />
Dekanin: Prof. Dr. K. Schwarz<br />
Erster Berichterstatter: Prof. Dr. G. Thaller<br />
Zweiter Berichterstatter: Prof. Dr. J. Bennewitz<br />
Tag der mündlichen Prüfung: 12.05.<strong>2011</strong><br />
Die Dissertation wurde mit dankenswerter finanzieller Unterstützung der Stiftung<br />
Schleswig-Holsteinische Landschaft angefertigt.
Inhaltsverzeichnis<br />
Einleitung.................................................................................................................... 1<br />
Kapitel 1..................................................................................................................... 3<br />
Akutelle <strong>und</strong> historische Entwicklungen beim<br />
Piétrainschwein in Schleswig-Holstein anhand einer Pedigreeanalyse<br />
Kapitel 2................................................................................................................... 19<br />
Connectedness between five German Piétrain herdbook populations<br />
Kapitel 3................................................................................................................... 37<br />
Application of optimum contribution selection<br />
combined with minimum coancestry mating in a Piétrain herdbook population<br />
Diskussion ................................................................................................................ 58<br />
Zusammenfassung ................................................................................................... 75<br />
Summary .................................................................................................................. 78
Einleitung<br />
In der heutigen Schweinefleischproduktion dominieren als Mastendprodukte<br />
Hybriden, die von spezialisierten Vater- <strong>und</strong> Mutterrassen abstammen <strong>und</strong><br />
Reinzuchttieren aufgr<strong>und</strong> von Kombinations- <strong>und</strong> Heterosiseffekten überlegen sind.<br />
Mit einem hohen Anteil wertvoller Teilstücke, einem günstigen Fleisch:Fett-Verhältnis<br />
sowie einer guten Futterverwertung ist das Piétrainschwein mit einem Anteil von über<br />
70% an allen durchgeführten Besamungen die am häufigsten eingesetzte Vaterrasse<br />
in Deutschland (ZDS, 2009). Seit Anfang der sechziger Jahre wird diese Rasse in<br />
Deutschland züchterisch bearbeitet (Wandhoff, 1982). Bis heute ist die Zucht<br />
überwiegend in der Hand regionaler Herdbuchzuchten verblieben, in denen meist nur<br />
eine geringe Anzahl spezialisierter Züchter organisiert sind.<br />
In den vergangenen 20 Jahren hat sich in der Piétrain Herdbuchzucht ein<br />
Strukturwandel vollzogen, der auf die starke Zunahme der künstlichen Besamung in<br />
der Ferkelerzeugung <strong>und</strong> dem daraus resultierenden Zusammenbruch des Marktes<br />
<strong>für</strong> Natursprungeber zurückzuführen ist. Mit einer abnehmenden Anzahl verkaufter<br />
Eber reduzierte sich die Anzahl der Herdbuchsauen in Deutschland von 1990 bis<br />
2008 von 10 431 auf 3 329 (ZDS, 2009). Diese Entwicklung spiegelt sich auch in der<br />
schleswig-holsteinischen Herdbuchpopulation wider. Waren 1980 in 45<br />
Herdbuchzuchtbetrieben noch 1 160 Herdbuchsauen vorhanden, so verblieben 2009<br />
nur noch sieben Betriebe mit insgesamt 446 Sauen (LWK SH, 2010).<br />
Die Reduzierung der Populationsgröße innerhalb der regionalen Herdbuchzuchten<br />
birgt die Gefahr eines erhöhten Inzuchtzuwachses, der neben Inzuchtdepressionen<br />
in Reproduktions- <strong>und</strong> Fitnessmerkmalen auch zu einer Fixierung unerwünschter<br />
Gene führen kann <strong>und</strong> langfristig die züchterisch nutzbare Variation <strong>und</strong> den maximal<br />
zu erzielenden Zuchtfortschritt reduziert (Robertson, 1960; James, 1972).<br />
Um langfristig den Selektionserfolg <strong>und</strong> eine Anpassungsfähigkeit an neue<br />
Zuchtziele zu gewährleisten <strong>und</strong> damit die produzierten Endprodukteber auch auf<br />
Dauer am Markt konkurrenzfähig bleiben, stehen die Zuchtverbände vor der<br />
Herausforderung, die genetische Variabilität in möglichst effizienter Zuchtarbeit zu<br />
nutzen <strong>und</strong> zu erhalten. Dies hat einige Zuchtverbände dazu veranlasst, die<br />
Zusammenarbeit über die Grenzen der B<strong>und</strong>esländer hinweg zu stärken <strong>und</strong> eine<br />
Kooperation zu gründen. Ziel ist eine effizientere Zuchtarbeit durch eine engere<br />
Zusammenarbeit in den Bereichen Vermarktung, Zuchtwertschätzung <strong>und</strong><br />
Interessenvertretung.<br />
1
Im Rahmen der vorliegenden Arbeit wurde eine Analyse der genetischen Variabilität<br />
der Piétrain Herdbuchpopulation in Schleswig-Holstein durchgeführt, die als<br />
Gr<strong>und</strong>lage zur Beurteilung der aktuellen Situation dienen <strong>und</strong> als Informationsbasis<br />
<strong>für</strong> zukünftige Konzepte zum Erhalt der genetischen Variabilität herangezogen<br />
werden kann.<br />
Im ersten Kapitel wird die Struktur <strong>und</strong> Entwicklung der Piétrain Herdbuchpopulation<br />
analysiert <strong>und</strong> mit einer Schätzung der effektiven Populationsgröße der<br />
Gefährdungsstatus der Population eingeordnet sowie Schwachstellen in der<br />
vergangenen Zuchtpolitik aufgezeigt.<br />
Das langfristige Ziel der Kooperation zwischen den Herdbuchzuchtverbänden ist eine<br />
überregionale Zuchtwertschätzung. Gr<strong>und</strong>lage hier<strong>für</strong> sind ausreichende genetische<br />
Verknüpfungen der Populationen, die im zweiten Kapitel anhand verschiedener<br />
pedigreebasierter Methoden dargestellt werden.<br />
Basierend auf den Ergebnissen des ersten <strong>und</strong> zweiten Kapitels wird in Kapitel drei<br />
ein Konzept, zugeschnitten auf die Belange der Piétrain Herdbuchzucht in<br />
Schleswig-Holstein, <strong>für</strong> den Erhalt <strong>und</strong> die Erweiterung der genetischen Variabilität<br />
unter Beachtung des Zuchtfortschritts ausgearbeitet.<br />
Literatur<br />
James, J. W. 1972. Optimum Selection Intensity in Breeding Programs. Anim. Prod.<br />
14: 1-9.<br />
LWK SH. 2010. <strong>Tierzucht</strong>zahlen Schleswig-Holstein 2009. Landwirtschaftskammer<br />
Schleswig-Holstein, Abt. <strong>Tierhaltung</strong> <strong>und</strong> <strong>Tierzucht</strong>, Blekendorf.<br />
Robertson, A. 1960. A Theory of Limits in Artificial Selection. Proc. of the Royal<br />
Society of London, Series B, Biological Sciences 153: 235-249.<br />
Wandhoff, H.-E. 1982. Das Piétrainschwein – Die Entwicklung der Rasse in<br />
Westeuropa <strong>und</strong> in der B<strong>und</strong>esrepublik unter besonderer Berücksichtigung<br />
des Aufbaus der Population in Schleswig-Holstein. Dissertation Christian-<br />
Albrechts-Universität zu Kiel.<br />
ZDS. 2009. Zahlen aus der Deutschen Schweineproduktion 2008. Zentralverband<br />
der Deutschen Schweineproduktion e.V., Deutschland.<br />
2
Kapitel 1<br />
Akutelle <strong>und</strong> historische Entwicklungen beim Piétrainschwein in<br />
Schleswig-Holstein anhand einer Pedigreeanalyse<br />
<strong>Verena</strong> <strong>Gonzalez</strong> <strong>Lopez</strong> 1<br />
Dirk Hinrichs 1<br />
Jan Christof Bielfeldt 2<br />
Norbert Borchers 3<br />
Georg Thaller 1<br />
1 <strong>Institut</strong> <strong>für</strong> <strong>Tierzucht</strong> <strong>und</strong> -haltung, Christian-Albrechts-Universität zu Kiel, 24098<br />
Kiel, Deutschland<br />
2 Schweineherdbuchzucht Schleswig-Holstein e.V., Rendsburger Str. 178, 24537<br />
Neumünster, Deutschland<br />
3 Landwirtschaftskammer Schleswig-Holstein, Futterkamp, 24327 Blekendorf,<br />
Deutschland<br />
Züchtungsk<strong>und</strong>e (<strong>2011</strong>) 38 (2): 118-128<br />
3
Zusammenfassung<br />
Ziel dieser Studie war es, die Populationsstruktur der Rasse Piétrain in Schleswig-<br />
Holstein mit einer Schätzung der effektiven Populationsgröße zu analysieren. Zur<br />
Verfügung standen die Pedigreedaten aller Herdbuchtiere der Rasse Piétrain in<br />
Schleswig-Holstein mit den Geburtsjahren 1978 bis 2009. Für die Schätzung der<br />
effektiven Populationsgröße wurde ausgehend von den aktiv gemeldeten Tieren im<br />
Dezember 2009, ein Pedigree (2 887 Tiere) aufgestellt. Die effektive<br />
Populationsgröße wurde anhand drei verschiedener Methoden geschätzt: drifteffektiv<br />
nach der Formel von Hill (1979) <strong>und</strong> inzuchteffektiv mittels der Numerator-<br />
Relationship-Matrix (NRM) sowie der Uncertain-Parentage-Matrix (UPM), die eine<br />
Korrektur bei unbekannter Abstammung durchführt. Die drifteffektive<br />
Populationsgröße sank tendenziell von 1990 bis 2006. Der harmonische Mittelwert<br />
über die Jahre ergab eine drifteffektive Populationsgröße von 105 Tieren. Die<br />
inzuchteffektive Populationsgröße berechnet mittels der NRM lag mit 190 Tieren über<br />
der geschätzten drifteffektiven Populationsgröße. Eine Korrektur bei unbekannter<br />
Abstammung (UPM Methode) resultierte in einer inzuchteffektiven Populationsgröße<br />
von 118 Tieren. Die deutlichen Unterschiede zwischen den beiden inzuchtbasierten<br />
Schätzmethoden deuten auf den Einfluss von Importebern hin. Des Weiteren<br />
variierte die Varianz in der Familiengröße im Vater-Tochter-Pfad in einigen Jahren<br />
extrem stark, da einige Eber überdurchschnittlich häufig eingesetzt wurden.<br />
Schlüsselwörter<br />
Schwein, Vaterrasse Piétrain, Inzuchtkoeffizienten, effektive Populationsgröße<br />
4
Current and historic developments of Piétrain pigs in Schleswig-Holstein using<br />
pedigree analysis<br />
The objective of this study was to analyze the population structure of the Piétrain pigs<br />
in Schleswig-Holstein and to estimate the effective population size. The data<br />
available consisted of Piétrain pigs of the herdbook population in Schleswig-Holstein<br />
born between 1978 and 2009. For the estimation of effective population size only<br />
ancestors of the active population in December 2009 were used (2,887 animals) .<br />
Three methods were applied to estimate effective population size: the formula given<br />
by HILL (1979) to estimate drift effective population size for each year, and,<br />
inbreeding coefficients to estimate inbreeding effective population size obtained from<br />
the numerator relationship matrix (NRM) or from uncertain parentage matrix (UPM).<br />
The latter applies a probabilistic correction for unknown ancestors. Drift effective<br />
population size has slightly decreased between 1990 and 2006. The harmonic mean<br />
across years resulted in an effective population size of 105 pigs. The effective<br />
population size estimated by NRM was higher at aro<strong>und</strong> 190 animals. Correction by<br />
unknown ancestors (UPM) led to an effective population size of 118 animals. The<br />
major differences between the methods NRM and UPM showed the influence of<br />
imported boars. Additional, the variance of the family size in the male-female path<br />
varied extremely due to the extensively use of some boars.<br />
Keywords<br />
pig, sire breed Piétrain, inbreeding coefficients, effective population size<br />
5
Einleitung<br />
Die Mastendprodukte in der heutigen Schweinefleischproduktion sind<br />
Kreuzungstiere, die von speziellen Vater- <strong>und</strong> Mutterrassen abstammen, <strong>und</strong><br />
Reinzuchttieren aufgr<strong>und</strong> von Kombinations- <strong>und</strong> Heterosiseffekten überlegen sind.<br />
Überwiegend wird die Einfachkreuzung Piétrain (Pi) * Deutsche Landrasse (DL)<br />
sowie die Drei-Rassen-Kreuzung Pi * (Deutsches Edelschwein (DE) * DL)<br />
angewendet. Mit einem Anteil von 72% an allen durchgeführten Besamungen ist das<br />
Piétrainschwein die am häufigsten eingesetzte Vaterrasse in Deutschland<br />
(ZDS, 2008).<br />
In Schleswig-Holstein wird die Rasse Piétrain seit Anfang der 60iger Jahre<br />
züchterisch bearbeitet. In die Population wurden in den letzten 30 Jahren regelmäßig<br />
Tiere, überwiegend Eber, aus anderen Zuchtgebieten importiert. Die Zahl der<br />
Herdbuchsauen hat sich seit 1980 in etwa halbiert, so dass heute nur noch etwa<br />
sieben Betriebe mit ca. 450 Sauen aktiv am Zuchtgeschehen beteiligt sind (LWK<br />
SH, 2010).<br />
Eine abnehmende Populationsgröße birgt die Gefahr einer genetischen Verarmung<br />
durch Drift aufgr<strong>und</strong> eines steigenden Inzuchtzuwachses. Ein erhöhter<br />
Inzuchtzuwachs kann sowohl zu Inzuchtdepressionen als auch zu vermehrtem<br />
Auftreten von Erbfehlern führen <strong>und</strong> steht in unmittelbarem Zusammenhang mit der<br />
Entwicklung der züchterisch nutzbaren Variation <strong>und</strong> dem maximal zu erzielenden<br />
Zuchtfortschritt (Robertson, 1960; James, 1972).<br />
Als Maß <strong>für</strong> die Inzucht in einer Population dient häufig der Inzuchtkoeffizient nach<br />
Wright (1922), definiert als die Wahrscheinlichkeit, dass zwei Allele an einem<br />
beliebigen Genort eines Individuums abstammungsidentisch sind. Wichtiger <strong>für</strong> die<br />
Beurteilung des Inzuchtgeschehens eines Zuchtprogramms ist allerdings der<br />
Inzuchtzuwachs, der den Anstieg des mittleren Inzuchtkoeffizienten pro definierter<br />
Zeiteinheit relativ zu dem verbliebenen Anteil der zur völligen Inzucht fehlt, misst. Der<br />
Inzuchtzuwachs steht in unmittelbarem Zusammenhang zur effektiven<br />
Populationsgröße (Falconer and Mackay, 1996), die aus diesem Gr<strong>und</strong> ein<br />
Standardmaß zur Beurteilung von Populationen <strong>und</strong> Zuchtprogrammen in Bezug auf<br />
den Erhalt genetischer Variation darstellt.<br />
Ziel dieser Studie ist die Analyse der aktuellen <strong>und</strong> historischen Entwicklungen beim<br />
Piétrainschwein in Schleswig-Holstein bezüglich der Inzucht <strong>und</strong> eine Schätzung der<br />
effektiven Populationsgröße (N e ). Mit diesen Ergebnissen sollen zukünftig Konzepte<br />
6
zur weiteren Optimierung des Zuchtprogramms in Hinblick auf ein verbessertes<br />
Management der genetischen Variation <strong>und</strong> des Zuchtfortschritts ausgearbeitet<br />
werden.<br />
Material <strong>und</strong> Methoden<br />
Daten<br />
Gr<strong>und</strong>lage <strong>für</strong> diese Untersuchung waren die von der Schweineherdbuchzucht<br />
Schleswig-Holstein e. V. <strong>und</strong> der Landwirtschaftskammer Schleswig-Holstein zur<br />
Verfügung gestellten Abstammungsinformationen registrierter Herdbuchtiere der<br />
Rasse Piétrain in Schleswig-Holstein mit den Geburtsjahren 1978 bis 2009<br />
(n=7 264). Als Referenzpopulation wurden alle aktiv gemeldeten Tiere der Population<br />
im Dezember 2009 (n=548) definiert. Ausgehend von der Referenzpopulation wurde<br />
ein Pedigree mit 2 887 Tieren, davon 950 männlich <strong>und</strong> 1 937 weiblich, aufgestellt.<br />
Tiere mit unbekannten Eltern wurden als unverwandte Basistiere betrachtet.<br />
Pedigreegüte <strong>und</strong> Generationsintervall<br />
Die Ermittlung möglichst genauer individueller Inzuchtkoeffizienten <strong>und</strong> folglich auch<br />
alle davon abgeleiteten Größen hängen von der Tiefe <strong>und</strong> der Qualität der<br />
zugr<strong>und</strong>eliegenden Pedigreeinformation ab (Cothran et al., 1984). Zur Beschreibung<br />
der Güte der Pedigreeinformation wurde der Vollständigkeitsindex nach MacCluer et<br />
al. (1983) berechnet. Des Weiteren wurden die Anzahl der komplett vollständigen<br />
Generationen, der äquivalent kompletten Generationen <strong>und</strong> der maximal<br />
rückverfolgbaren Generationen als Kennzahlen <strong>für</strong> die Qualität des Pedigrees<br />
herangezogen.<br />
Das Generationsintervall (L) wurde als durchschnittliches Alter der Elterntiere bei<br />
Geburt ihrer Nachkommen in den vier Pfaden männlich-männlich, männlich-weiblich,<br />
weiblich-männlich <strong>und</strong> weiblich-weiblich berechnet. Anschließend wurde das mittlere<br />
Generationsintervall über alle Pfade nach Hill (1979) wie folgt geschätzt:<br />
( L mm + L mf + L fm L ff )<br />
1<br />
L = +<br />
4<br />
Die Berechnung des Generationsintervalls sowie der Pedigreekennzahlen erfolgte<br />
mit dem Programmpaket ENDOG v4.6 (Gutiérrez <strong>und</strong> Goyache, 2005).<br />
7
Effektive Populationsgröße<br />
Die effektive Populationsgröße ist definiert als die Anzahl von Individuen einer<br />
idealen Population, in der dieselbe Varianz in den Änderungen der Genfrequenz<br />
bzw. derselbe Inzuchtzuwachs zu beobachten wäre, wie in der betrachteten<br />
Population (Falconer <strong>und</strong> Mackay, 1996). Sie stellt ein Maß <strong>für</strong> den Grad an<br />
genetischer Drift <strong>und</strong> Inzucht dar.<br />
Für die Schätzung der effektiven Populationsgröße wurden verschiedene Methoden<br />
herangezogen. Zunächst wurde die drifteffektive Populationsgröße nach der Formel<br />
von Hill (1979) geschätzt:<br />
1<br />
<br />
e<br />
2<br />
2<br />
1 ⎡<br />
⎤ ⎡<br />
⎤<br />
2 M ⎛ M ⎞ 2 1<br />
2 F ⎛ F ⎞ 2<br />
= ⎢2<br />
+ σ mm + 2 σ<br />
mm,<br />
mf<br />
+ ⎜ ⎟ σ mf ⎥ + ⎢2<br />
+ σ ff + 2 σ<br />
fm,<br />
ff<br />
+ ⎜ ⎟ σ fm ⎥<br />
16M L ⎢⎣<br />
F ⎝ F ⎠ ⎥⎦<br />
16F L ⎢⎣<br />
M ⎝ M ⎠ ⎥⎦<br />
Dabei sind M <strong>und</strong> F die Anzahl der männlichen bzw. weiblichen Herdbuchtiere, L<br />
das durchschnittliche Generationsintervall der vier Selektionspfade,<br />
2 2<br />
σ mm, mf<br />
2<br />
σ , σ fm<br />
<strong>und</strong><br />
2<br />
σ ff die Varianz der Familiengröße in den Pfaden Vater-Sohn, Vater-Tochter,<br />
Mutter-Sohn bzw. Mutter-Tochter sowie<br />
σ <strong>und</strong><br />
mm, mf<br />
fm, ff<br />
σ die Kovarianz in der<br />
Familiengröße zwischen den beiden Vater- bzw. Mutterpfaden. Die jährlich<br />
geschätzten effektiven Populationsgrößen wurden zu einem harmonischen Mittelwert<br />
zusammengefasst (Falconer <strong>und</strong> Mackay, 1996).<br />
Da diese Methode auf Annahmen beruht, die in realen Zuchtpopulationen nicht<br />
unbedingt gültig sind, wurde ebenfalls die inzuchteffektive Populationsgröße<br />
geschätzt. Da<strong>für</strong> wurden anhand des Pedigrees die Numerator-Relationship-Matrix<br />
(NRM) sowie die Uncertain-Parentage-Matrix (UPM), eine Methode zur Korrektur des<br />
Effektes unbekannter Abstammung (Pérez-Enciso <strong>und</strong> Fernando, 1992; Pérez-<br />
Enciso, 1995) aufgestellt.<br />
Bei der UPM wird unterstellt, dass alle Väter <strong>und</strong> Mütter innerhalb eines Zeitraumes,<br />
in diesem Fall von zwei bis vier Jahren, vor der Geburt eines Tieres mit unbekannter<br />
Abstammung als potentielle Väter <strong>und</strong> Mütter mit gleicher Wahrscheinlichkeit in<br />
Frage kommen.<br />
8
Für ein Tier i mit s potenziellen Vätern <strong>und</strong> d potenziellen Müttern, die mit einer<br />
Wahrscheinlichkeit p ij dem wahren Vater bzw. q ik der wahren Mutter entsprechen, gilt<br />
somit <strong>für</strong> das Element[n,i] der NRM:<br />
s<br />
an, i<br />
= 0,5[ ∑ pijanj<br />
+ ∑ q<br />
d<br />
j= 1 k = 1<br />
ik<br />
a<br />
nk<br />
]<br />
mit<br />
s<br />
∑<br />
d<br />
∑<br />
p ij<br />
= 1, q ik<br />
j= 1 k = 1<br />
= 1<br />
<strong>und</strong> <strong>für</strong> das Diagonalelement:<br />
a<br />
ij<br />
= 1+<br />
F<br />
i<br />
= 1+<br />
0,5<br />
s<br />
d<br />
∑∑<br />
j= 1 k = 1<br />
p<br />
ij<br />
q<br />
ik<br />
a<br />
jk<br />
.<br />
Aus der NRM bzw. UPM konnten auf Basis der individuellen Inzuchtkoeffizienten<br />
Durchschnittswerte pro Jahr abgeleitet werden.<br />
Die Schätzung der inzuchteffektiven Populationsgröße pro Jahr erfolgte dann auf<br />
Gr<strong>und</strong>lage des mittleren Inzuchtzuwachses über eine lineare Regression durch<br />
ˆ<br />
a<br />
=<br />
1<br />
2 (1 −<br />
β<br />
e<br />
)<br />
.<br />
Dabei kann die zu schätzende Steigung β aus den Inzuchtkoeffizienten im Jahr t in<br />
Form einer linearen Regression von ln( 1− F ) auf t berechnet werden <strong>und</strong> entspricht<br />
somit ln( 1 − 1/ ) . Eine Umformung der jahres- in die generationseffektive<br />
a<br />
t<br />
Populationsgröße wurde approximativ mit<br />
<br />
= L durchgeführt.<br />
e a<br />
/<br />
Ergebnisse<br />
Populationsentwicklung<br />
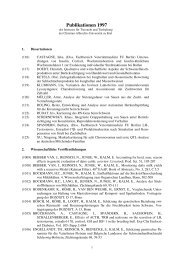
Abbildung 1 gibt einen Überblick über die Anzahl der Herdbuchtiere von 1978 bis<br />
2006. Da eine EDV-gestützte Herbuchführung erst 1990 begann, wurden die<br />
Eintragungen in den Jahrgängen davor von der Betrachtung ausgeschlossen. Von<br />
1990 bis 1997 ist ein deutlicher Rückgang der Sauen von 350 auf 170 zu<br />
beobachten, während die Anzahl der Eber bis 2003 auf einem relativ konstanten<br />
Niveau bleibt. Nach 1997 stagniert die Anzahl der Sauen, bei den Ebern hingegen ist<br />
ein Anstieg ab dem Jahr 2004 zu verzeichnen.<br />
9
Anzahl .<br />
400<br />
350<br />
300<br />
250<br />
200<br />
150<br />
100<br />
50<br />
0<br />
1978 1982 1986 1990 1994 1998 2002 2006<br />
Geburtsjahr<br />
Eber<br />
Sauen<br />
Abbildung 1: Herdbucheber <strong>und</strong> -sauen der Rasse Piétrain in Schleswig-Holstein nach<br />
Geburtsjahr.<br />
Generationsintervall<br />
Das Generationsintervall liegt im Durchschnitt bei 2,4 Jahren. In den Vaterpfaden ist<br />
das durchschnittliche Generationsintervall mit 2,56 <strong>und</strong> 2,49 Jahren geringfügig<br />
höher als in den Mutterpfaden mit 2,21 <strong>und</strong> 2,30 Jahren (Tabelle 1). Die Entwicklung<br />
des durchschnittlichen Generationsintervalls, abgetragen nach den<br />
Geburtsjahrgängen der Elterntiere, zeigt seit 1990 ein relativ konstantes Niveau <strong>und</strong><br />
lässt einen leichten Anstieg ab 2003 erkennen (Abbildung 2).<br />
Tabelle 1: Durchschnittliches Generationsintervall (in Jahren) in den vier Selektionspfaden<br />
mit den entsprechenden Standardabweichungen.<br />
Nachkommen<br />
männlich weiblich<br />
Eber 2,56 ± 0,04 2,49 ± 0,02<br />
Sauen 2,21 ± 0,03 2,30 ± 0,02<br />
Durchschnitt 2,4<br />
10
Generationsintervall in Jahren .<br />
3<br />
2,5<br />
2<br />
1,5<br />
1<br />
1990 1992 1994 1996 1998 2000 2002 2004 2006<br />
Geburtsjahr der Eltern<br />
Abbildung 2: Entwicklung des durchschnittlichen Generationsintervalls.<br />
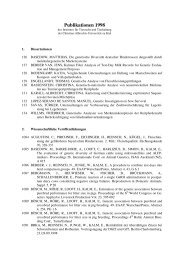
Pedigreegüte<br />
Der Pedigreevollständigkeit nimmt mit zunehmender Anzahl an Generationen ab <strong>und</strong><br />
beträgt in den ersten fünf Generationen über 80% (Abbildung 3). Die Anzahl<br />
rückverfolgbarer äquivalent kompletter Generationen <strong>und</strong> maximaler rückverfolgbarer<br />
Generationen unabhängig vom Vollständigkeitsgrad liegt bei der Referenzpopulation<br />
bei durchschnittlich 3,71 bzw. 7,96 Generationen. Unter Berücksichtigung der<br />
kompletten Vollständigkeit ergibt sich eine durchschnittliche Anzahl von 2,27<br />
Generationen.<br />
Anteil bekannter Ahnen .<br />
1<br />
0,9<br />
0,8<br />
0,7<br />
0,6<br />
0,5<br />
0,4<br />
0,3<br />
0,2<br />
0,1<br />
0<br />
1 2 3 4 5 6 7 8 9 10 11 12 13 14 15 16<br />
Generation<br />
Abbildung 3: Anteil bekannter Ahnen (%) der Referenzpopulation in den jeweiligen<br />
Generationen.<br />
11
Effektive Populationsgröße<br />
Tabelle 2 stellt die Schätzwerte <strong>für</strong> N e nach Hill (1979) von 1990 bis 2006 mit der<br />
Varianz der Familiengröße in den vier Selektionspfaden dar.<br />
Tabelle 2: Effektive Populationsgröße nach Hill (1979) von 1990 bis 2006 mit der Varianz<br />
der Familiengröße in den vier Selektionspfaden.<br />
Geburtsjahr σ 2 mm σ 2 mf σ 2 fm σ 2 ff N e<br />
1990 0,39 1,65 0,39 0,40 270<br />
1991 0,66 0,88 0,33 0,84 171<br />
1992 1,05 4,84 0,45 0,66 139<br />
1993 0,54 1,26 0,28 0,62 247<br />
1994 1,76 6,27 0,37 0,68 132<br />
1995 0,92 4,39 0,35 1,03 162<br />
1996 0,45 3,69 0,34 0,57 229<br />
1997 0,82 3,06 0,40 1,37 156<br />
1998 0,86 7,36 0,35 0,93 144<br />
1999 2,45 97,77 0,53 0,89 29<br />
2000 1,57 17,72 0,77 3,17 106<br />
2001 0,82 9,89 0,63 0,84 148<br />
2002 2,00 16,06 0,35 2,05 96<br />
2003 0,54 32,30 0,53 1,16 109<br />
2004 1,38 96,42 0,30 1,59 57<br />
2005 0,76 51,81 0,23 0,93 96<br />
2006 0,66 2,27 0,31 1,39 87<br />
Die Varianz in den Mutterpfaden sowie in dem Vater-Sohn-Pfad ist gering <strong>und</strong> liegt in<br />
einem Wertebereich von 0,23 bis 3,17. Im Vater-Tochter-Pfad hingegen variiert die<br />
Varianz von 0,88 bis 97,77 extrem stark mit besonders hohen Varianzen seit 1999.<br />
Bei Betrachtung der N e über die Jahre ist eine abnehmende Tendenz zu beobachten.<br />
Der harmonische Mittelwert von 1990 bis 2006 ergibt eine N e von 105 Tieren.<br />
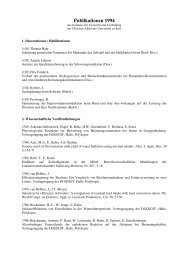
Abbildung 4 zeigt die geschätzten Inzuchtkoeffizienten berechnet über die NRM bzw.<br />
die UPM von 1990 bis 2006. Bei beiden Methoden ist ein Anstieg der<br />
durchschnittlichen Inzuchtkoeffizienten zu beobachten. Die Korrektur bei<br />
unbekannter Abstammung (UPM) bewirkt einen steileren Verlauf der Kurve im<br />
Vergleich zur NRM. Die höchsten Werte des durchschnittlichen Inzuchtkoeffizienten<br />
liegen bei der NRM als auch bei der UPM mit 0,019 bzw. 0,031 im Jahr 2006.<br />
12
Inzuchtkoeffizient<br />
0,04<br />
0,03<br />
0,02<br />
0,01<br />
NRM<br />
UPM<br />
0<br />
1990 1992 1994 1996 1998 2000 2002 2004 2006<br />
Jahr<br />
Abbildung 4: Durchschnittlicher Inzuchtkoeffizienten von 1990 bis 2006 geschätzt über die<br />
Numerator-Relationship-Matrix (NRM) bzw. Uncertain-Parentage-Matrix (UPM).<br />
Für beide Kurven wurden lineare Regressionen <strong>für</strong> den Zeitraum von 1990 bis 2006<br />
geschätzt <strong>und</strong> die inzuchteffektive N e abgeleitet. Tabelle 3 gibt eine<br />
zusammenfassende Übersicht der geschätzten drift- <strong>und</strong> inzuchteffektiven<br />
Populationsgrößen. Die effektive Populationsgröße aus den Inzuchtkoeffizienten der<br />
NRM beträgt 190 Tiere. Mit 105 Tieren liegt der Schätzwert aus der Formel nach Hill<br />
(1979) darunter <strong>und</strong> ist vergleichbar mit den 118 Tieren, die über die UPM geschätzt<br />
wurden.<br />
Tabelle 3: Effektive Populationsgröße von 1990 bis 2006 drifteffektiv nach Hill (1979) <strong>und</strong><br />
inzuchteffektiv mittels Numerator-Relationship-Matrix (NRM) bzw. Uncertain-Parentage-<br />
Matrix (UPM) geschätzt.<br />
N e 1990-2006<br />
drifteffektiv Hill 105<br />
inzuchteffektiv NRM 190<br />
UPM 118<br />
Diskussion<br />
Ziel dieser Arbeit war es, die Populationsstruktur <strong>und</strong> -entwicklung der<br />
Herdbuchpiétrains in Schleswig-Holstein zu analysieren <strong>und</strong> mit einer Schätzung der<br />
effektiven Populationsgröße den Gefährdungsstatus der Population einzuordnen.<br />
In Deutschland ist die Zucht des Piétrainschweins bis heute überwiegend in der<br />
Hand kleiner regionaler Herdbuchzuchten verblieben, wobei der Bestand an<br />
Herdbuchsauen rückläufig ist. Von 1990 bis 2007 reduzierte sich die Zahl der<br />
13
Herdbuchsauen in Deutschland von 10 431 auf 3 329 (ZDS, 2008). Diese<br />
Entwicklung spiegelt sich auch in der schleswig-holsteinischen Herdbuchpopulation<br />
wider. Waren 1980 in 45 Herdbuchzuchtbetrieben noch 1 160 Herdbuchsauen<br />
vorhanden, so verblieben 2009 nur noch sieben Betriebe mit insgesamt 446 Sauen<br />
(LKW SH, 2010). Die Geburtseintragungen ins Herdbuch zeigen, dass die<br />
Eberanzahl über die Jahre konstant geblieben ist <strong>und</strong> seit 2004 sogar ein Anstieg zu<br />
verzeichnen ist. Der Strukturwandel in der Piétrainzucht in den letzten 20 Jahren ist<br />
auf den Absatzrückgang von Natursprungebern <strong>und</strong> die abnehmende Anzahl<br />
verkaufter Eber bei gleichzeitig stark ansteigender Nachfrage nach Besamungsebern<br />
<strong>für</strong> die Ferkelerzeugung zurückzuführen.<br />
Das durchschnittliche Generationsintervall der Piétrainpopulation in Schleswig-<br />
Holstein liegt bei 2,4 Jahren <strong>und</strong> ist mit Werten aus der Literatur vergleichbar. Habier<br />
(2006) schätzte <strong>für</strong> die bayerische Piétrainpopulation ein Generationsintervall von 2,5<br />
Jahre, auf Basis aller Piétrain Herdbuchpopulationen in Deutschland wurden 2,3<br />
Jahre ermittelt (BLE, 2009).<br />
Die Aussagefähigkeit geschätzter Inzuchtkoeffizienten als auch effektiver<br />
Populationsgrößen ist abhängig von der Pedigreegüte <strong>und</strong> somit bei der<br />
Interpretation von Schätzwerten zu berücksichtigen. Ein hoher Anteil fehlender<br />
Abstammungsinformationen im Pedigree kann zu einer Unterschätzung des<br />
Inzuchtgrades in einer Population führen (Lutaaya et al., 1999).<br />
In dieser Untersuchung beträgt der Anteil bekannter Ahnen der Referenzpopulation<br />
in den ersten drei Generationen über 90% <strong>und</strong> damit zeigt sich eine geringere<br />
Pedigreetiefe als in Populationsanalysen anderer Spezies. Sowohl in Pferde-<br />
(Zechner et al., 2002; Valera et al., 2005) als auch in Rinderpopulationen (Hagger,<br />
2005) waren in den ersten fünf Generationen mindestens 90% der Ahnen bekannt.<br />
Mit einer Anzahl von 3,71 äquivalent kompletten Generationen in der<br />
Referenzpopulation ist auch diese Kennzahl im Vergleich mit anderen<br />
Literaturwerten im unteren Bereich einzuordnen. In Pferdepopulationen wurden<br />
wesentlich höhere Werte von 5,7 bis 15,2 ermittelt (Zechner et al., 2002; Valera et<br />
al., 2005; Cervantes et al., 2008; Hamann and Distl, 2008) <strong>und</strong> auch beim Rind mit<br />
4,2 bis 10,2 (Sölkner et al., 1998; Hagger, 2005; Sörensen et al., 2005; Honda et al.,<br />
2006). Ursache hier<strong>für</strong> ist der relativ kurze Zeitraum rückverfolgbarer Eintragungen<br />
ins EDV-gestützte Herdbuch (seit 1979) im Vergleich zu anderen Populationen, der<br />
14
egelmäßige Import von Tieren in den letzten 30 Jahren von denen keine<br />
Abstammungsinformationen vorliegen, sowie der Anteil fehlerhafter Eintragungen.<br />
Bei Schätzung der drifteffektiven Populationsgröße von 1990 bis 2006 ergibt sich ein<br />
Mittelwert von 105 Tieren. In der Familiengrößenvarianz im Vater-Tochter-Pfad fällt<br />
ein Anstieg seit 1999 auf, der durch eine extrem hohe weibliche Nachkommenanzahl<br />
einiger weniger Eber zu erklären ist <strong>und</strong> verdeutlicht, dass in der Vergangenheit<br />
einzelne Eber überdurchschnittlich häufig in der Zucht eingesetzt wurden.<br />
Bei der Methode nach Hill (1979) werden allerdings Annahmen getroffen, die bei<br />
gerichteter Selektion in realen Zuchtpopulationen unwahrscheinlich sind. Unterstellt<br />
wird das Hardy-Weinberg-Gleichgewicht sowie zufällige Anpaarung. In der<br />
Zuchtpraxis ist aber davon auszugehen, dass die Abstammung eines Tieres<br />
durchaus eine Bedeutung <strong>für</strong> Selektionsentscheidungen hat <strong>und</strong> deshalb mit einer<br />
hohen Wahrscheinlichkeit eine Korrelation in der Familiengröße über Generationen<br />
besteht.<br />
Aus diesem Gr<strong>und</strong> wurde zusätzlich die inzuchteffektive Populationsgröße über den<br />
Inzuchtzuwachs pro Jahr geschätzt. Die Schätzwerte der durchschnittlichen<br />
Inzuchtkoeffizienten von 1990 bis 2006 fallen <strong>für</strong> eine kleine Population unerwartet<br />
niedrig aus. Der maximale durchschnittliche Inzuchtkoeffizient im Jahr 2006 ist 0,019<br />
<strong>und</strong> liegt damit unterhalb des der bayerischen Piétrainpopulation von 0,025 im Jahr<br />
2002 (Habier et al., 2009). Eine mögliche Erklärung hier<strong>für</strong> kann die geringe<br />
Pedigreegüte der Daten sein. Die Korrektur bei unbekannter Abstammung (UPM)<br />
bestätigt dies, denn es resultiert eine steilere Inzuchtkurve <strong>und</strong> somit 2006 ein<br />
höherer durchschnittlicher Inzuchtkoeffizient von 0,031.<br />
Die Schätzung der N e über den Inzuchtzuwachs (NRM) ergibt 190 Tiere. Diese<br />
Methode unterstellt, dass Zuchttiere ohne Abstammungsinformation zur Population<br />
unverwandt sind. Bei einem regelmäßigen Import von Tieren aus anderen<br />
Zuchtgebieten, wie es in Schleswig-Holstein in den letzten 30 Jahren der Fall war, ist<br />
das nicht allgemeingültig anzunehmen, so dass dieses Ergebnis als obere Grenze<br />
der N e zu interpretieren ist. Die UPM-Methode korrigiert auf unbekannte<br />
Abstammung <strong>und</strong> resultiert in einer N e von 118 Tieren. Die deutlichen Unterschiede<br />
zwischen den Schätzwerten der NRM <strong>und</strong> der UPM deuten auf den Einfluss von<br />
Importtieren in den letzten 30 Jahren hin. Vergleichbare effektive Populationsgrößen<br />
von 160 mittels der NRM <strong>und</strong> 113 nach Korrektur bei unbekannter<br />
15
Abstammung (UPM) wurden von Habier et al. (2009) <strong>für</strong> die bayerische<br />
Piétrainpopulation von 1985 bis 2003 geschätzt.<br />
Legt man zur Einstufung des Gefährdungsstatus der Piétrainpopulation in Schleswig-<br />
Holstein die festgelegten Grenzwerte des nationalen Fachprogramms zur Erhaltung<br />
<strong>und</strong> nachhaltigen Nutzung tiergenetischer Ressourcen in Deutschland zu Gr<strong>und</strong>e,<br />
wird diese nach den berechneten N e als Erhaltungspopulation mit den Grenzwerten<br />
von Ne > 50 bis < 200 eingeordnet. Damit gilt die Population als existenzgefährdet<br />
<strong>und</strong> ein Erhaltungsprogramm zur Stabilisierung der effektiven Populationsgröße <strong>und</strong><br />
zur Minimierung weiterer Genverluste ist notwendig (TGRDEU, 2010).<br />
Daher sollten in Zukunft <strong>für</strong> die Zuchtpraxis Konzepte zum optimierten Management<br />
der genetischen Variation <strong>und</strong> des Zuchtfortschritts entwickelt werden <strong>und</strong> dabei die<br />
anhand der Populationsanalyse aufgezeigten Schwachstellen berücksichtigt werden.<br />
Anzustreben ist ein nachhaltiger Einsatz von Zuchtebern im Sinne der Erhaltung der<br />
genetischen Variabilität der Population. Des Weiteren sollte bei einem regelmäßigen<br />
Import von Ebern aus anderen Piétrainpopulationen die Verwandtschaft der<br />
Importtiere zur Population in SH berücksichtigt werden.<br />
Literatur<br />
BLE. 2009. Erhebung von Populationsdaten tiergenetischer Ressourcen in<br />
Deutschland: Schweine. B<strong>und</strong>esanstalt <strong>für</strong> Landwirtschaft <strong>und</strong> Ernährung.<br />
Cervantes, I., A. Molina, F. Goyache, J.P. Gutierrez, and M. Valera. 2008. Population<br />
history and genetic variability in the Spanish Arab Horse assessed via<br />
pedigree analysis. Livest. Sci. 113: 24-33.<br />
Cothran, E.G., J.W. MacCluer, L.R. Weitkamp, D.W. Pfennig, and A.J. Boyce. 1984.<br />
Inbreeding and Reproductive-Performance in Standardbred Horses. J. Hered.<br />
75: 220-224.<br />
Falconer, D.S., and T.F.C. Mackay. 1996. Introduction to quantitative genetics. 4 th<br />
edition, Longmann Group Ltd., Essex, UK.<br />
Gutiérrez, J.P., and F. Goyache. 2005. A note on ENDOG: a computer program for<br />
analysing pedigree information. J. Anim. Breed. Genet. 122: 172-176.<br />
16
Habier, D. 2006. Schätzung quantitativ-genetischer Parameter <strong>und</strong> Optimierung des<br />
Zuchtprogramms <strong>für</strong> das bayerische Piétrainschwein. Bayerische<br />
Landesanstalt <strong>für</strong> Landwirtschaft (LfL), Schriftenreihe 2, Freising-<br />
Weihenstephan.<br />
Habier, D., K.U. Götz, and L. Dempfle. 2009. Breeding programm for Piétrain pigs in<br />
Bavaria with an estimation of genetic trends and effective population size.<br />
Livest. Sci. 123: 187-192.<br />
Hagger, C. 2005. Estimates of genetic diversity in the brown cattle population of<br />
Switzerland obtained from pedigree information. J. Anim. Breed. Genet. 122:<br />
405-413.<br />
Hamann, H,. and O. Distl. 2008. Genetic variability in Hanoverian warmblood horses<br />
using pedigree analysis. J. Anim. Sci. 86: 1503-1513.<br />
Hill, W.G. 1979. Note on Effective Population-Size with Overlapping Generations.<br />
Genetics 92: 317-322.<br />
Honda, T., T. Fujii, T. Nomura, and F. Mukai. 2006. Evaluation of genetic diversity in<br />
Japanese Brown cattle population by pedigree analysis. J. Anim. Breed.<br />
Genet. 123: 172-179.<br />
James, J.W. 1972. Optimum Selection Intensity in Breeding Programs. Anim. Prod.<br />
14: 1-9.<br />
LWK SH. 2010. <strong>Tierzucht</strong>zahlen Schleswig-Holstein 2009. Landwirtschaftskammer<br />
Schleswig-Holstein, Abt. <strong>Tierhaltung</strong> <strong>und</strong> <strong>Tierzucht</strong>, Blekendorf.<br />
Lutaaya, E., I. Misztal, J.K. Bertrand, and J.W. Mabry. 1999. Inbreeding in<br />
populations with incomplete pedigrees. J. Anim. Breed. Genet. 116: 475-480.<br />
MacCluer, J.W., A.J. Boyce, B. Dyke, L.R. Weitkamp, D.W. Pfennig, and C.J.<br />
Parsons. 1983. Inbreeding and Pedigree Structure in Standardbred Horses. J.<br />
Hered. 74: 394-399.<br />
Pérez-Enciso, M. 1995. Use of the uncertain relationship matrix to compute effective<br />
population size. J. Anim. Breed. Genet. 112: 327-332.<br />
Pérez-Enciso, M., and R.L. Fernando. 1992. Genetic Evaluation with Uncertain<br />
Parentage - a Comparison of Methods. Theor. Appl. Genet. 84: 173-179.<br />
Robertson, A. 1960. A Theory of Limits in Artificial Selection. Proc. of the Royal<br />
Society of London, Series B, Biological Sciences 153: 235-249.<br />
17
Sölkner, J., L. Filipcic, and N. Hampshire. 1998. Genetic variability of populations and<br />
similarity of subpopulations in Austrian cattle breeds determined by analysis of<br />
pedigrees. Anim. Sci. 67: 249-256.<br />
Sörensen, A.C., M.K. Sörensen, and P. Berg. 2005. Inbreeding in Danish dairy cattle<br />
breeds. J. Dairy Sci. 88: 1865-1872.<br />
TGRDEU. 2010. . Zentrale Dokumentation Tiergenetischer<br />
Ressourcen in Deutschland.<br />
Valera, M., A. Molina, J.P. Gutiérrez, J. Gomez, and F. Goyache. 2005. Pedigree<br />
analysis in the Andalusian horse: population structure, genetic variability and<br />
influence of the Carthusian strain. Livest. Prod. Sci. 95: 57-66.<br />
Wright, S. 1922. Coefficients of inbreeding and relationship. Am. Natur. 56: 330-338.<br />
ZDS. 2008. Zahlen aus der Deutschen Schweineproduktion 2007. Zentralverband<br />
der Deutschen Schweineproduktion e.V., 2008.<br />
Zechner, P., J. Solkner, I. Bodo, T. Druml, R. Baumung, R. Achmann, E. Marti, F.<br />
Habe, and G. Brem. 2002. Analysis of diversity and population structure in the<br />
Lipizzan horse breed based on pedigree information. Livest. Prod. Sci. 77:<br />
137-146.<br />
.<br />
18
Kapitel 2<br />
Connectedness between five German Piétrain herdbook populations<br />
<strong>Verena</strong> <strong>Gonzalez</strong> <strong>Lopez</strong> 1<br />
Dirk Hinrichs 1<br />
Jan Christof Bielfeldt 2<br />
Norbert Borchers 3<br />
Kay-Uwe Götz 4<br />
Georg Thaller 1<br />
1 <strong>Institut</strong>e of Animal Breeding and Husbandry, Christian-Albrechts-University Kiel, D-<br />
24098 Kiel, Germany<br />
2 Pig herdbook organization Schleswig-Holstein e.V., Rendsburger Str. 178, D-24537<br />
Neumünster, Germany<br />
3 Chamber of Agriculture Schleswig-Holstein, Futterkamp, D-24327 Blekendorf,<br />
Germany<br />
4 Bavarian Insitute of Agriculture, <strong>Institut</strong>e of Animal Breeding, Prof.-Dürrwaechter-<br />
Platz 1, D-85586 Poing-Grub, Germany<br />
Submitted for publication<br />
19
Abstract<br />
The aim of this study was to evaluate the genetic connectedness between the five<br />
most important Piétrain herdbook populations in Germany. The herdbook populations<br />
were located in Bavaria (n=8,211), Baden-Württemberg (n=6,694), Schleswig-<br />
Holstein (n=3,389), North Rhine-Westphalia (n=2,909), and Lower-Saxony (n=2,657).<br />
Animals born between 2006 and 2008 were selected as the reference population. To<br />
calculate the connectedness between the five herdbook populations all pedigrees<br />
were combined (n=23,201), which led to an improvement of pedigree quality in<br />
comparison with each herdbook population alone. To estimate genetic<br />
connectedness, different methods were used. Common boars between herdbook<br />
populations varied from 67 to 248. The genetic similarities among the five breeding<br />
populations ranged from 5.71% to 20.36% with a mean value of 11.17%. In all<br />
populations, at least one of the five ancestors with the largest marginal contributions<br />
to the reference population originated from another herdbook population. One of the<br />
most important ancestors was common for three populations. Additionally, the<br />
average genetic relationship coefficients between the five breeding organizations<br />
confirmed that the populations are genetically linked and ranged between 2.57% and<br />
4.52%. Over the past 30 years, the contribution of foreign fo<strong>und</strong>ers to the populations<br />
has increased as a consequence of exchange of genetic material. The various<br />
measures of connectedness indicated that there are sufficient genetic links between<br />
the five herdbook populations to enable an overall breeding value estimation system.<br />
Keywords<br />
sire breed Piétrain, connectedness, genetic relationship, gene origin<br />
20
Introduction<br />
In Germany, the Piétrain pig is bred by independent herdbook breeding organizations<br />
in which small numbers of specialized breeders are organized. With a proportion of<br />
72% of all inseminations, the Piétrain pig is the dominating sire breed in Germany.<br />
Since 1990 the number of Piétrain herdbook sows decreased substantially from<br />
10,431 to 3,329 in 2009 (ZDS, 2010). The structural change has led to cooperation<br />
between some herdbook organizations. In December 2008 eight breeding<br />
associations fo<strong>und</strong>ed the „Deutsche Herdbuchzucht Schwein“ (DHS). The declared<br />
aim is a closer collaboration in marketing, genetic evaluation and representation of<br />
interests. Three breeding organizations already implemented an overall breeding<br />
value system in September 2009. In future, this should be extended to all member<br />
organizations.<br />
An indispensable prerequisite of genetic evaluations across populations is an<br />
adequate genetic connectedness. A weak genetic connectedness will cause<br />
fluctuations in the estimation of the average genetic merit of populations and the<br />
genetic correlations between the same traits evaluated in different populations<br />
(Hanocq et al., 1996; Jorjani et al., 2005). The accuracy of estimated breeding values<br />
of individuals as well as genetic merit of populations increases with the degree of<br />
connectedness. Therefore, genetic evaluation with weakly linked populations is<br />
feasible, but not recommended (Mark et al., 2005). For this reason, it is essential to<br />
have detailed and quantitative information on the genetic connectedness between<br />
populations.<br />
In this context, the objective of this study was to analyze the genetic connectedness<br />
between the five most important Piétrain herdbook populations in Germany. Different<br />
methods are applied to quantify to which extent populations are genetically linked as<br />
a result of imported boars and the use of artificial insemination (AI) boars.<br />
Material and methods<br />
Data<br />
Piétrain pig populations from five regional, independent herdbook breeding<br />
organizations were studied. The breeding organizations were located in five regions<br />
in Germany: Schleswig-Holstein (SH), Lower Saxony (LS), North Rhine-Westphalia<br />
(NRW), Baden-Württemberg (BW), and Bavaria (B). Pedigree records were obtained<br />
from the Chamber of Agriculture Schleswig-Holstein for the herdbook populations in<br />
21
Schleswig-Holstein, Lower-Saxony, North Rhine-Westphalia, and Baden-<br />
Württemberg; Bavarian records were provided by the local herdbook Pig breeding<br />
organization in Bavaria (EGZH). These records included animal, sire and dam<br />
identification number, sex, herdbook organization and year of birth.<br />
First, analyses were carried out separately for the populations using the respective<br />
pedigree records. For each population, a reference population was defined to allow<br />
proper comparisons. The reference population was made up of animals born<br />
between 2006 and 2008 with both parents known. The length of the reference period<br />
was defined such that it represented approximately a generation interval. Based on<br />
the reference population a complete pedigree was built proceeding until all ancestors<br />
were unknown. Table 1 gives an overview of the number of animals in the pedigrees.<br />
The sex ratio of dams to sires is approximately 2 to 1.<br />
To calculate the connectedness between the five herdbook populations all pedigrees<br />
were pooled together into a single file, eliminating duplicate animals. This resulted in<br />
an overall pedigree containing 23,201 animals.<br />
Table 1: Number of animals included in analyses of pedigrees.<br />
B BW LS NRW SH<br />
Animals in pedigree 8,211 6,694 2,657 2,909 3,389<br />
Sires (%) 37.45 31.69 45.20 31.70 36.44<br />
Dams (%) 62.55 68.31 54.80 68.30 63.56<br />
Bavaria (B), Baden-Württemberg (BW), Lower Saxony (LS), North Rhine-Westphalia (NRW),<br />
Schleswig-Holstein (SH).<br />
Pedigree Completeness<br />
Different parameters were used to describe the pedigree completeness. First, the<br />
relative number of known ancestors per generation was calculated to compare the<br />
degree of pedigree completeness of each population. The pedigree completeness<br />
index (PCI) was proposed by MacCluer et al. (1983):<br />
PCI<br />
animal<br />
sire dam<br />
= 2 ,<br />
C<br />
C<br />
sire<br />
C<br />
+ C<br />
dam<br />
where C sire and C dam are contributions from paternal and maternal lines:<br />
C =<br />
1<br />
d<br />
d<br />
∑ a i<br />
i=<br />
1<br />
,<br />
22
where a i is the proportion of known ancestors in generation i and d the number of<br />
generations that is taken into account.<br />
In addition, known ancestors were used to compute the complete generation<br />
equivalent for each individual j as<br />
n<br />
j<br />
∑<br />
1 ,<br />
gij<br />
i=<br />
1 2<br />
where n j is the number of ancestors of individual j, and g ij is the number of<br />
generations between individual j and its ancestor i (Boichard et al., 1997). Finally, the<br />
maximum number of generations traced was obtained as the number of generations<br />
between an individual and its most distant known ancestor. The calculations were<br />
carried out for the whole pedigree file as well as for each population.<br />
Inbreeding and average degree of relationship<br />
The individual inbreeding coefficient (F) is defined as the probability that an individual<br />
has two identical alleles by descent (Wright, 1931). The additive genetic relationships<br />
among all pairs of animals and the individual coefficients of inbreeding were<br />
computed based on the numerator relationship matrix (NRM). Furthermore, the<br />
average relationship coefficient (AR) for each individual was calculated as the<br />
average of the coefficients in the row corresponds to the individual in the NRM. The<br />
AR is defined as the probability that an allele randomly chosen from the whole<br />
population is present to a given animal (Gutiérrez et al., 2003).<br />
Measure of connectedness<br />
In this study different methods were applied to describe the degree of connectedness<br />
between the herdbook populations.<br />
1) Number of common boars<br />
The number of boars in common in two or more herdbook organizations is also used<br />
by Weigel et al. (2000) and Thorén Hellsten et al. (2008) as a measure of genetic<br />
connectedness in cattle and horses.<br />
2) Genetic similarity (GS)<br />
The genetic similarity is a relative measure and was computed as the proportion of<br />
progeny of boars with progeny in two herdbook populations, relative to the total<br />
23
number of progeny in both herdbook populations, according to the formula suggested<br />
by Rekaya et al. (1999):<br />
GS<br />
ij<br />
=<br />
<br />
ij<br />
∑<br />
k = 1<br />
<br />
i<br />
∑<br />
( n<br />
n<br />
ik<br />
+<br />
+ n<br />
<br />
j<br />
∑<br />
ik<br />
k = 1 k = 1<br />
jk<br />
n<br />
)<br />
jk<br />
,<br />
with N ij number of boars with descendants in populations i and j, N i and N j the<br />
number of boars in population i and j and n ik and n jk the number of progenies of boar<br />
k in population i and j, respectively.<br />
In addition, the contribution of each herdbook population to the genetic similarity was<br />
calculated as the number of progeny in one herdbook population sired by a common<br />
boar in relation to the total number of progeny sired by common boars into the two<br />
herdbook populations:<br />
nik<br />
k = 1<br />
Contribution population i to GS in % =<br />
* 100 ,<br />
to detect differences in the distribution of progeny.<br />
3) Origin of the five most important ancestors<br />
The marginal genetic contribution of the five ancestors within each population to the<br />
reference population of animals born between 2006 and 2008 was calculated. The<br />
marginal contribution of an individual quantifies its contribution to the reference<br />
population, which has not previously been explained by other individuals (Boichard et<br />
al., 1997).<br />
4) Average genetic relationship within and between herdbook populations<br />
To estimate the average genetic relationship within and between herdbook<br />
populations the NRM was built for the whole pedigree. Following, the off-diagonal<br />
elements of the NRM within each population and between two populations were<br />
averaged. For graphic representation, the software package “heatmap” was used in<br />
GNU R (R Development Core Team, 2004).<br />
<br />
ij<br />
∑<br />
k = 1<br />
<br />
ij<br />
∑<br />
( n<br />
ik<br />
+ n<br />
jk<br />
)<br />
24
5) Foreign fo<strong>und</strong>er gene contributions<br />
For the calculation of genetic contributions of foreign fo<strong>und</strong>ers to the reference<br />
populations the matrix multiplication X´ZTQ was applied, where X and Z are<br />
incidence matrices for populations and animals. T contains the gene flow from one<br />
generation to the next and is a lower triangular matrix. Accordingly, all diagonal<br />
elements are one and all elements to the right of the diagonal are zero. The matrix Q<br />
assigns the fo<strong>und</strong>ers to origin herdbook (Kennedy and Trus, 1993).<br />
Software<br />
The software package Pedig from Boichard (2002) was used to calculate measures<br />
of pedigree completeness and marginal contributions of ancestors. All other<br />
parameters have been computed using SAS package or programs in C++ developed<br />
by the author.<br />
Results<br />
Pedigree Completeness<br />
All measures for pedigree completeness were computed considering either the entire<br />
pedigree or pedigrees for each herdbook separately. The percentage of known<br />
ancestors by generation is illustrated in Figure 1.<br />
known ancestors (%)<br />
1<br />
0.9<br />
0.8<br />
0.7<br />
0.6<br />
0.5<br />
0.4<br />
0.3<br />
0.2<br />
0.1<br />
0<br />
1 2 3 4 5 6 7 8 9 10 11 12 13 14 15 16 17 18 19 20<br />
All<br />
SH<br />
BW<br />
B<br />
NRW<br />
LS<br />
generations<br />
Figure 1: Average proportion of known ancestors by generation for each reference<br />
population (animals born between 2006 and 2008): Bavaria (B), Baden-Württemberg (BW),<br />
Lower Saxony (LS), North Rhine-Westphalia and Schleswig-Holstein (SH)) and the entire<br />
pedigree (All).<br />
25
The herdbook population with the highest level of pedigree completeness was B<br />
followed by SH and BW. A substantially lower pedigree quality was observed in the<br />
two smallest herdbook populations, LS and NRW.<br />
The large differences in pedigree quality between the populations were also reflected<br />
in the average complete generation equivalent, which ranged from 1.73 for NRW to<br />
5.80 for B. The same pattern was observed for the average number of maximum<br />
generation traced (Table 2). Animals with unknown parentage were above 25% in LS<br />
and NRW but much lower in the other herdbook populations with less than 15%. In<br />
comparison with the single herdbook populations, the entire pedigree showed the<br />
best values for all measures of pedigree quality. The completeness for the whole<br />
pedigree was aro<strong>und</strong> 80% back to the fifth generation, resulting in the highest mean<br />
value for the number of known generation equivalents (6.23).<br />
Table 2: Pedigree completeness criterions, average values of inbreeding (F), average<br />
relationship (AR), percentage of inbred animals and maximal inbreeding coefficient for each<br />
population and the entire pedigree.<br />
B BW LS NRW SH All<br />
Maximum generation traced 13.67 9.85 4.77 3.88 10.05 19.35<br />
Complete generation equivalent 5.8 3.54 1.90 1.73 3.88 6.23<br />
Both parents unknown (%) 11.76 14.97 31.28 25.06 14.90 9.59<br />
F (%) 1.71 0.56 0.19 0.16 0.95 1.31<br />
AR (%) 2.37 0.93 0.44 0.76 1.84 1.19<br />
Percentage of inbred animals 62.98 41.19 13.13 8.59 50.10 65.56<br />
Max. inbreeding coefficient 28.46 26.88 25.00 15.63 27.32 28.65<br />
Bavaria (B), Baden-Württemberg (BW), Lower Saxony (LS), North Rhine-Westphalia (NRW),<br />
Schleswig-Holstein (SH) and entire pedigree (All).<br />
Inbreeding<br />
The results for average inbreeding coefficients, average relationship, percentage of<br />
inbred animals and maximum inbreeding coefficients for the whole pedigree and in<br />
the herdbook populations respectively are given in Table 2. The average coefficient<br />
of inbreeding varied between the different herdbook populations. The population with<br />
the highest average inbreeding coefficient was B with 1.17%, followed by SH and BW<br />
with 0.95% and 0.56%, respectively. Significantly lower average inbreeding<br />
coefficients were calculated for LS and NRW, probably because the pedigrees in<br />
these populations were less complete. Inbreeding coefficients were fo<strong>und</strong> in the<br />
range from 0% to 28.46%. The values of maximum inbreeding coefficients were<br />
26
similar between 25% and 28% for all populations except NRW with 14%. More than<br />
62% of the pigs in B but less than 15% in LS and NRW were inbred. Proportions of<br />
inbred pigs in SH and BW were 50.10% and 41.19%, respectively. The highest<br />
values for percentage of inbred pigs with 65.56% as well as for the maximum<br />
individual inbreeding coefficient with 28.65% were fo<strong>und</strong> when analyzing the whole<br />
pedigree.<br />
Measures of connectedness<br />
As shown in Table 3, all five herdbook populations had boars in common. The<br />
number ranged from 67 (NRW - SH) to 248 (B-BW). North Rhine-Westphalia shared<br />
the lowest number of boars with SH, B and LS. In contrast, B and BW had the<br />
highest average number of common ancestors with any other populations.<br />
Table 3: Common boars represented in each pair of herdbook populations.<br />
B BW LS NRW SH<br />
Bavaria (B)<br />
Baden-Württemberg (BW) 248<br />
Lower Saxony (LS) 141 112<br />
North Rhine-Westphalia (NRW) 85 121 95<br />
Schleswig-Holstein (SH) 117 101 96 67<br />
Estimates of GS between the five populations for the whole time period are shown in<br />
Table 4. The GS ranged from 5.71% (NRW-BW) to 20.36% (BW-B). The contribution<br />
to GS by population varied from 18.87% / 81.13% (NRW-SH) to 52.31% / 47.69%<br />
(LS-NRW). For six pairs of populations the contribution to the GS was relatively<br />
balanced with values between 40% and 60%.<br />
Table 4: Genetic similarities between herdbook populations (in % above diagonal) and the<br />
contribution by herdbook population in column (in % below diagonal).<br />
B BW LS NRW SH<br />
Bavaria (B) 20.36 14.29 6.94 11.49<br />
Baden-Württemberg (BW) 47.04 8.67 5.71 8.73<br />
Lower Saxony (LS) 66.24 57.49 9.99 14.78<br />
North Rhine-Westphalia (NRW) 72.06 60.67 52.31 10.70<br />
Schleswig-Holstein (SH) 56.60 52.63 29.36 18.87<br />
27
In Table 5, the five ancestors with the largest marginal contributions to the reference<br />
population are shown. All these ancestors were born after 1995. Within each<br />
population, the five most important ancestors contributed between 22.02% and<br />
28.54% to the reference population. In all populations, at least one of the five<br />
ancestors originated from any other herdbook population. It is interesting to note that<br />
the Bavarian boar “Musk 65080” was among the five important ancestors in BW, LS<br />
and NRW.<br />
Table 5: Marginal genetic contribution (%) and origin of the five most important ancestors of<br />
reference populations*.<br />
Herdbook population Id Year Sex<br />
Marginal genetic<br />
contribution<br />
Origin<br />
Bavaria (B)<br />
65110<br />
15168<br />
26035<br />
68653<br />
25004<br />
1998<br />
2003<br />
1999<br />
2004<br />
1997<br />
m<br />
m<br />
f<br />
m<br />
m<br />
8.87<br />
5.76<br />
4.57<br />
3.88<br />
3.87<br />
B<br />
B<br />
B<br />
Austria<br />
B<br />
Baden-Württemberg (BW)<br />
65080<br />
92002<br />
91112<br />
61903<br />
91774<br />
1997<br />
2004<br />
1996<br />
1999<br />
2001<br />
m<br />
m<br />
m<br />
m<br />
m<br />
6.48<br />
4.27<br />
3.97<br />
3.84<br />
3.46<br />
B<br />
BW<br />
BW<br />
BW<br />
BW<br />
Lower-Saxony (NS)<br />
8259<br />
33967<br />
52414<br />
65080<br />
51057<br />
2003<br />
1999<br />
1999<br />
1997<br />
1996<br />
m<br />
m<br />
m<br />
m<br />
m<br />
9.34<br />
5.42<br />
5.38<br />
3.32<br />
3.26<br />
B<br />
B<br />
LS<br />
B<br />
B<br />
North Rhine-Westphalia<br />
(NRW)<br />
15041<br />
65080<br />
68123<br />
13843<br />
14164<br />
2000<br />
1997<br />
2000<br />
2001<br />
2001<br />
m<br />
m<br />
m<br />
m<br />
m<br />
11.19<br />
4.19<br />
3.74<br />
3.42<br />
2.72<br />
SH<br />
B<br />
B<br />
NRW<br />
BW<br />
Schleswig-Holstein (SH)<br />
17482<br />
17687<br />
17486<br />
17645<br />
846822<br />
1999<br />
2002<br />
1999<br />
2001<br />
2002<br />
m<br />
m<br />
m<br />
m<br />
m<br />
7.26<br />
6.07<br />
5.39<br />
5.35<br />
4.47<br />
SH<br />
SH<br />
B<br />
SH<br />
B<br />
* animals born between 2006 and 2008<br />
Figure 2 illustrates the mean additive genetic relationship coefficients between and<br />
within reference populations. The populations in SH and B showed the largest<br />
estimates within population. In LS, NRW, and BW, the relationship within population<br />
was smaller than between the populations. The highest genetic relationships<br />
between populations could be observed between LS and SH as well as between BW<br />
28
and NRW. The dendrogram in Figure 3 indicates that populations in the southern<br />
(NRW, BW, B) and in the northern (SH, LS) part of Germany were more closely<br />
linked.<br />
BW<br />
NRW<br />
B<br />
SH<br />
Piétrain herdbook populations<br />
LS<br />
LS<br />
SH<br />
B<br />
NRW<br />
Piétrain herdbook populations<br />
Color Key<br />
BW<br />
0.03 0.04 0.05 0.06<br />
Value<br />
* animals born between 2006 and 2008<br />
Figure 2: Mean genetic relationship within and between the Piétrain herdbook reference<br />
populations* Lower-Saxony (LS), Schleswig-Holstein (SH), Bavaria (B), North Rhine-<br />
Westphalia (NRW), and Baden-Württemberg (BW).<br />
Genetic contributions of fo<strong>und</strong>ers to the Piétrain herdbook populations are presented<br />
in Figure 3. In all five herdbook populations, the largest proportion of genes of<br />
animals born between 1980 and 1994 originated from fo<strong>und</strong>ers of their own<br />
population, whereas the gene contribution of foreign fo<strong>und</strong>ers was comparatively low.<br />
This changed when considering animals born between 1996 and 2008. Then, the<br />
contributions of foreign fo<strong>und</strong>ers markedly increased. All in all, fo<strong>und</strong>ers from SH and<br />
Bavaria had the highest gene contributions to other populations.<br />
29
a)<br />
SH<br />
LS<br />
NRW<br />
BW<br />
Piétrain herdbook populations<br />
B<br />
SH<br />
LS<br />
NRW<br />
BW<br />
B<br />
Hesse<br />
fo<strong>und</strong>er contributions (%)<br />
Color Key<br />
Austria<br />
Other<br />
0 20 40 60 80<br />
Value<br />
b)<br />
SH<br />
LS<br />
NRW<br />
BW<br />
Piétrain herdbook populations<br />
B<br />
SH<br />
LS<br />
NRW<br />
BW<br />
B<br />
Hesse<br />
fo<strong>und</strong>er contributions (%)<br />
Color Key<br />
Austria<br />
Other<br />
10 20 30 40<br />
Value<br />
Figure 3: Genetic contributions of fo<strong>und</strong>ers (%) to the Piétrain herdbook populations Lower-<br />
Saxony (LS), Schleswig-Holstein (SH), North-Rhine-Westphalia (NRW), Baden-Württemberg<br />
(BW) and Bavaria (B) including animals born between a) 1980 and 1994 and b) 1995 and<br />
2008.<br />
30
Discussion<br />
The aim of this study was to evaluate the genetic connectedness between five<br />
different German herdbook populations of Piétrain pigs using pedigree information.<br />
An important prerequisite for detecting genetic ties between populations is the unique<br />
identification of all animals across the five herdbook organizations. Unfortunately, this<br />
was not fulfilled in this study. Identification codes vary among herdbooks and<br />
imported boars receive new identification code. Consequently, it was not possible to<br />
assign original identification to imported boars so that genetic ties could be quantified<br />
only about the parental information. This may lead to <strong>und</strong>erestimation of the genetic<br />
links between the populations, because maybe the imported boars were already<br />
used in original herdbook population with original identification number. Therefore, it<br />
is recommended to establish a uniform identification system with unique life numbers<br />
for all animals in future.<br />
Analyses of pedigree completeness and inbreeding using each herdbook pedigree<br />
file separately as well as the entire pedigree provided a first insight into the genetic<br />
ties between the populations. The herdbook populations in LS and NRW showed a<br />
lower pedigree quality compared to the other populations. The low pedigree quality of<br />
NRW can be explained by the fact that the pedigree file did not include all farms,<br />
because some farmers have switched to another breeding organization.<br />
Furthermore, in 2006 one of the largest farms in NRW was culled because of swine<br />
fever and newly established with foreign animals afterwards. In general, the quality of<br />
pedigrees was lower than those reported for dairy cattle breeds (Sölkner et al., 1998;<br />
Hagger, 2005; Sörensen et al., 2005; Honda et al., 2006) and horse populations<br />
(Zechner et al., 2002; Valera et al., 2005; Cervantes et al., 2008; Hamann and Distl,<br />
2008). One reason might be the relatively short period of traceable electronic<br />
recordings in the herdbooks (since 1979), regular importation of boars without<br />
complete pedigree information as well as a high proportion of missing pedigree<br />
information. The highest pedigree completeness was observed for the whole<br />
pedigree file which suggests genetic links between populations. The comparison of<br />
the whole and each pedigree file showed that imports and foreign AI-boars markedly<br />
decreased pedigree completeness of herdbook populations. Thus, a general<br />
pedigree would provide additional genealogical information for each breeding<br />
organization.<br />
31
The average inbreeding coefficients ranged from 0.9% for SH, 0.5% for BW and<br />
about 1.7% for B. Hubbard et al. (1990) estimated similar levels of average<br />
inbreeding of 0.75, 0.66, 0.53, and 0.70% for Duroc, Hampshire, Landrace, and<br />
Yorkshire populations in Canada, respectively. As expected, average inbreeding<br />
coefficients estimated for NRW and LS were the lowest due to the poor quality of<br />
pedigrees. The average inbreeding coefficient of the whole pedigree was larger than<br />
the expected value if the populations were unrelated. Hence, it can be concluded that<br />
separately estimated inbreeding coefficients were <strong>und</strong>erestimated.<br />
Several methods were used to measure genetic connectedness among the five<br />
Piétrain herdbook populations. The simplest measurement is the number of sires in<br />
common which specifies the total number of boars that have been used in any two<br />
populations.<br />
In this study, all five herdbook populations had between 67 and 248 boars in<br />
common. In addition, the genetic similarity was also calculated as a relative measure<br />
for the impact of common boars because it also reflects the extent to which common<br />
boars have been used within populations. The genetic similarity varied among the<br />
five breeding populations from 5.71% to 20.36% with a mean value of 11.17%. The<br />
mean value was higher as reported for dairy cattle breeds. Weigel et al. (2000)<br />
examined Holstein populations in 15 countries and estimated a genetic similarity of<br />
0% to 35% with an average of 7.94%. Similar results were fo<strong>und</strong> by Jorjani (2000) for<br />
Ayrshire populations in seven countries with a genetic similarity of 0% to 37% and an<br />
average of 8.01%. A higher average genetic similarity (14.40%) was described by<br />
Thorén Hellsten et al. (2008) for European sport horse populations.<br />
The advantage of the two measurements, number of common sires and genetic<br />
similarity, is that they are easy to calculate. However, it should be noted that genetic<br />
similarity could be high even though the progenies of the common sires over<br />
populations were unequally distributed. For this reason it is particular important to<br />
consider the percentage of progenies contributed by each population when using the<br />
genetic similarity. An approximately equal distribution of progenies of the common<br />
boars existed between B, BW, and SH. In contrast, there were differences in the<br />
contribution of progenies between LS or NRW and the other populations. Thorén<br />
Hellsten et al. (2008) also detected differences in the percentage of progenies<br />
provided by each country and excluded these countries from the calculation of the<br />
average genetic similarity. However, in this study the average genetic similarity did<br />
32
not change if only populations were taken into account with an equal distribution of<br />
progenies from common sires.<br />
The determination of the origin of the five ancestors with the largest marginal<br />
contributions to the reference populations confirmed that there exist genetic links<br />
between all five populations. At least one of the five major ancestors within<br />
populations originated from a foreign population and many of those came from<br />
Bavaria. In three populations (BW, LS, NRW) the most marginal contributing<br />
ancestor originated from another population. Particular attention should be given to<br />
the Bavarian boar “Musk 65080”, who was a dominating sire in three populations<br />
(BW, LS and NRW). These results showed that both progenies of imported boars<br />
and of foreign AI boars were used extensively in the populations. The fact that<br />
populations share the same major ancestors was also reported by Young and<br />
Seykora (1996), Sörensen et al. (2005) and Hammami et al. (2007) for Holstein<br />
populations in Luxembourg, Tunisia, Denmark, and America.<br />
Common and imported boars as well as the extensively use of their progenies lead to<br />
an average genetic relationship between the herdbook reference populations of<br />
2.57% to 4.52% and can be seen as a summary of the results shown previously.<br />
Mrode et al. (2009) estimated similar results for Holstein cow populations in three<br />
European dairy countries. From 2003 to 2006, the average genetic relationship of the<br />
top and bottom 4,000 index cows among Great Britain, Italy and Ireland ranged from<br />
1.94% to 6.57%.<br />
The contribution of the fo<strong>und</strong>er animals to the populations was determined in order to<br />
show the influence of imported boars and the use of foreign AI boars over the last 30<br />
years. It can be concluded that the genetic connectedness has developed mainly<br />
over the past 15 years (Figure 3). Until 1995, the largest proportion of genes of<br />
animals still originated from fo<strong>und</strong>ers of their own population. Between 1996 and<br />
2008 the contribution of foreign fo<strong>und</strong>ers increased significantly in all populations. In<br />
all herdbook populations, a substantial part of fo<strong>und</strong>er genes stemmed from B and<br />
SH. Thereby, breeding organizations in B and SH seemed to be the major exporters<br />
of genetic material to the other populations, whereas BW was the main importing<br />
organization.<br />
The results concerning the genetic connectedness differed slightly between the<br />
applied methods. This makes clear, that there is no unique measurement of<br />
33
connectedness. Nevertheless, genetic links were fo<strong>und</strong> between all participating<br />
herdbook populations. The different methods allowed to quantify to which extent<br />
populations are genetically related. The present study has shown that there are<br />
sufficient genetic links among populations allow genetic evaluation across<br />
populations. Besides, connectedness is expected to increase in the future due to the<br />
possibility to select boars based on breeding values estimated across populations.<br />
References<br />
Boichard, D. 2002. Pedig: a Fortran package for pedigree analysis suited to largem<br />
populations. 7 th World Congress on Genetics Applied to Livestock Production.<br />
Montpellier, France.<br />
Boichard, D., L. Maignel, and É. Verrier. 1997. The value of using probabilities of<br />
gene origin to measure genetic variability in a population. Genet. Sel. Evol.<br />
29: 5-23.<br />
Cervantes, I., A. Molina, F. Goyache, J.P. Gutiérrez, and M. Valera. 2008.<br />
Populations history and genetic variability in the Spanish Arab horse assessed<br />
via pedigree analysis. Livest. Sci. 113: 24-33.<br />
Gutiérrez, J.P., J. Altarriba, C. Díaz, R. Quintanilla, J. Cañón, and J. Piedrafita. 2003.<br />
Pedigree analysis of eight Spanish beef cattle breeds. Genet. Sel. Evol. 35:<br />
43-63.<br />
Hagger, C. 2005. Estimates of genetic diversity in the brown cattle population of<br />
Switzerland obtained from pedigree information. J. Anim. Breed. Genet. 122:<br />
405-413.<br />
Hamann, H., and O. Distl. 2008. Genetic variability in Hanoverian warmblood horses<br />
using pedigree analysis. J. Anim. Sci. 86: 1503-1513.<br />
Hammami, H., C. Croquet, J. Stoll, B. Rekik, and N. Gengler. 2007. Genetic diversity<br />
and joint-pedigree analysis of two importing Holstein populations. J. Dairy Sci.<br />
90: 3530-3541.<br />
Hanocq, E. D. Boichard, and J.L. Foulley. 1996. A simulation study of the effect of<br />
connectedness on genetic trend. Genet. Sel. Evol. 28: 67-82.<br />
Honda, T., T. Fujii, T. Nomura, and F. Mukai. 2006. Evaulation of genetic diversity in<br />
Japanese Brown cattle population by pedigree analysis. J. Anim. Breed.<br />
Genet. 123: 172-179.<br />
34
Hubbard, D.J., O.I. Southwood, and B. W. Kennedy. 1990. Rates of inbreeding in<br />
Yorkshire, Landrace, Duroc and Hampshire performance tested pigs in<br />
Ontario. Can. J. Anim. Sci. 70 : 401-407.<br />
Jorjani, H. 2000. Well-connected, informative sub-set of data. Proc. Of the 2000<br />
Interbull Meeting. Bled, Slovenia.Interbull Bulletin 25: 51-55.<br />
Jorjani, H., U. Emanuelson, and W. F. Fikse. 2005. Data subsetting strategies for<br />
estimation of across-country genetic correlations. J. Dairy Sci. 88: 1214-1224.<br />
Kennedy, B.W., and D. Trus. 1993. Considerations on genetic connectedness<br />
between management units <strong>und</strong>er an animal model. J. Anim. Sci. 71: 2341-<br />
2352.<br />
MacCluer, J.W., A.J. Boyce, B. Dyke, L.R. Weitkamp, D.W. Pfennig, and C.J.<br />
Parsons. 1983. Inbreeding and pedigree structure in Standardbred horses. J.<br />
Hered. 74: 394-399.<br />
Mark, T., P. Madsen, J. Jensen, and W.F. Fikse. 2005. Short communication:<br />
Difficulties in estimating across-country genetic correlations for weakly linked<br />
bull populations. J. Dairy Sci. 88: 3303-3305.<br />
Mrode, R., F. Kearney, S. Biffani, M. Coffey, and F. Canavesi. 2009. Short<br />
communication: Genetic relationships in the Holstein cow populations of three<br />
major dairy countries. J. Dairy Sci. 92: 5760-5764.<br />
R Development Core Team. 2004. R A language and environment for statistical<br />
computing. R-Fo<strong>und</strong>ation for statistical computing. Vienna, Austria.<br />
http://www.r-project.org/.<br />
Rekaya, R., K.A. Weigel, and D. Gianola. 1999. Bayesian estimation of a structural<br />
model for genetic covariances for milk yield in five regions of the USA. 50 th<br />
Meeting of the EAAP. Zurich, Switzerland.<br />
Sölkner, J., L. Filipcic, and N. Hampshire. 1998. Genetic variability of populations and<br />
similarity of subpopulations in Austrian cattle breeds determined by analysis of<br />
pedigrees. Anim. Sci. 67: 249-256.<br />
Sörensen, A.C., M.K. Sörensen, and P. Berg. 2005. Inbreeding in Danish Dairy<br />
Cattle Breeds. J. Dairy Sci. 88: 1865-1872.<br />
Thorén Hellsten, E., H. Jorjani, and J. Philipsson. 2008. Connectedness among five<br />
European sport horse populations. Livest. Sci. 118: 147-156.<br />
35
Valera, M., A. Molina, J.P. Gutiérrez, J. Gómez, and F. Goyache. 2005. Pedigree<br />
analysis in the Andalusian horse: population structure, genetic variability and<br />
influence of the Carthusian strain. Livest. Prod. Sci. 95: 57-66.<br />
Weigel, K., R. Rekaya, F. Fikse, N. Zwald, and D. Gianola. 2000. Data structure and<br />
connectedness issues in international dairy sire evaluations. Proc. Of the 2000<br />
Interbull Meeting. Bled, Slovenia. Interbull Bulletin 25: 26-30.<br />
Wright, S. 1931. Evolution in Mendelian populations. Genetics 16: 97-159.<br />
Young, C.W., and A.J. Seykora. 1996. Estimates of inbreeding and relationship<br />
among registerred Holstein females in the United States. J. Dairy Sci. 79: 502-<br />
505.<br />
ZDS. 2010. Zahlen aus der Deutschen Schweineproduktion 2009. Zentralverband<br />
der Deutschen Schweineproduktion e.V., Deutschland.<br />
Zechner, P., J. Sölkner, I. Brodo, T. Druml, R. Baumung, R. Achmann, E. Marti, F.<br />
Habe and G. Brem. 2002. Analysis of diversity and population structure in the<br />
Lipizzan horse breed based on pedigree information. Livest. Prod. Sci. 77:<br />
137-146.<br />
.<br />
36
Kapitel 3<br />
Application of optimum contribution selection combined with minimum<br />
coancestry mating in a Piétrain herdbook population<br />
<strong>Verena</strong> <strong>Gonzalez</strong> <strong>Lopez</strong> 1<br />
Dirk Hinrichs 1<br />
Jan Christof Bielfeldt 2<br />
Norbert Borchers 3<br />
Georg Thaller 1<br />
1 <strong>Institut</strong> <strong>für</strong> <strong>Tierzucht</strong> <strong>und</strong> -haltung, Christian-Albrechts-Universität zu Kiel, 24098<br />
Kiel, Deutschland<br />
2 Schweineherdbuchzucht Schleswig-Holstein e.V., Rendsburger Str. 178, 24537<br />
Neumünster, Deutschland<br />
3 Landwirtschaftskammer Schleswig-Holstein, Futterkamp, 24327 Blekendorf,<br />
Deutschland<br />
37
Abstract<br />
The aim of this study was to investigate the properties and consequences of the<br />
optimal contribution selection of Meuwissen (1997) combined with minimum<br />
coancestry mating in the Piétrain herdbook population in Schleswig-Holstein (SH)<br />
<strong>und</strong>er practical conditions. Especially the additional benefit by considering boars from<br />
Piétrain herdbook population in Baden-Württemberg (BW) in selection decisions was<br />
of particular interest. At first, animals were selected with the optimum contribution<br />
selection method to identify elite sows and boars. The optimum contribution selection<br />
theory using official estimated breeding values was applied for different constraints<br />
on relationship. The number of sows was fixed at a constant value of 50. In general,<br />
the optimal number of boars decreased rapidly as the relationship constraint was<br />
relaxed. The lowest achievable level of relationship in the next generation were 2.7%<br />
for SH boars and only 1.9% if BW boars were included. Furthermore, a higher<br />
average breeding value of selected animals could be achieved by including BW<br />
boars. Consequently, it is recommended to consider BW boars in selection of elite<br />
boars. Contributions from selected boars and sows were used to develop specific<br />
mating plans by applying minimum coancestry mating with a linear programming<br />
technique. Minimum coancestry mating reduced average coancestry by at least 64%.<br />
The two-step selection and mating strategy requires less computer time, compared to<br />
a one step mating scheme, where all selection candidates are included in the mating<br />
step. Application of optimum contribution selection combined with minimum<br />
coancestry mating seems to be a promising tool to select elite animals and to control<br />
inbreeding while maintaining genetic progress <strong>und</strong>er practical conditions.<br />
Keywords<br />
sire breed Piétrain, inbreeding, relationship, optimum genetic contributions, minimum<br />
coancestry mating<br />
38
Introduction<br />
In Germany, the Piétrain pig is bred by independent herdbook breeding organizations<br />
in which small numbers of specialized breeders are organized. Since 1980, the<br />
number of Piétrain herdbook sows in Schleswig-Holstein (SH) decreased from 1,160<br />
to 446 in 2009 (LWK SH, 2010). Such a small population is at risk because an<br />
increase of inbreeding is expected with detrimental effects, such as inbreeding<br />
depression, occurrence of genetic defects and loss of usable genetic variability for<br />
genetic improvement (Falconer and Mackay, 1996). <strong>Gonzalez</strong> <strong>Lopez</strong> et al. (<strong>2011</strong>)<br />
reported a continuously decreasing effective population size that resulted from<br />
increasing inbreeding rates. In view of these developments a common breeding<br />
evaluation system was implemented for the Piétrain populations in SH and Baden-<br />
Württemberg (BW) in 2009 and boars from BW with comparable estimated breeding<br />
values (EBV) are now also available to the herdbook breeders in SH. The Piétrain<br />
herdbook organization in Schleswig-Holstein (SHZ) has expressed interest in an<br />
application of dynamic optimization tool to allow the management of inbreeding with<br />
additional potential for increasing genetic gain. In practice, selective breeding<br />
programs may be considered as a two stage process. In the first instance, animals<br />
are selected according to specific criteria and used as parents, a process that also<br />
determines the genetic contribution of each parent to the next generation. In this<br />
context, several authors have suggested different dynamic tools to maximize genetic<br />
progress of selected animals while constraining the inbreeding rate at a predefined<br />
value (Meuwissen, 1997; Gr<strong>und</strong>y et al., 1998; Meuwissen <strong>und</strong> Sonesson, 1998;<br />
Gr<strong>und</strong>y, 2000). These methods optimize the number of selected animals and their<br />
contributions to the next generation. Simulation studies showed that such<br />
approaches could generate genetic gains more than 20% higher compared to<br />
traditional selection based on BLUP EBV at the same rate of inbreeding (Meuwissen,<br />
1997). After selecting parents for the next generation, the following step is to<br />
establish a proper mating policy. Several mating systems, such as minimum<br />
coancestry, compensatory and minimum variance mating, generate less inbreeding<br />
while producing at least as much genetic gain as random mating in breeding<br />
schemes where the parents are truncation selected (Caballero et al., 1996). The<br />
mating system that is generally recommended is minimum coancestry mating<br />
(Caballero et al., 1996; Sonesson and Meuwissen 2000; Meuwissen 2007).<br />
39
The aim of this study was to investigate the properties and consequences of the<br />
optimal contribution selection of Meuwissen (1997) combined with minimum<br />
coancestry mating to select and mate elite sows and boars in the Piétrain herdbook<br />
population <strong>und</strong>er practical conditions. Especially the additional benefit by considering<br />
boars from Piétrain herdbook population in BW in selection decisions was of<br />
particular interest.<br />
Material and methods<br />
Data<br />
Three different data sets consisting of potential selection candidates with<br />
performance records and EBV were available. Data set one and two comprised<br />
herdbook sows (n=504) and boars (n=168) in Schleswig-Holstein representing birth<br />
years 2006 to 2008 and 2004 to 2008, respectively. All artificial insemination boars<br />
(n=329) from the herdbook population in BW, born between 2004 and 2008, were<br />
included in data set three.<br />
The EBV of an animal was composed as follows. Natural breeding values were<br />
standardized to relative breeding values having a mean of 100 and a standard<br />
deviation of 20 points. The different relative breeding values were unequally weighted<br />
and they were combined to the EBV with the following weights:<br />
• lean meat content (%) 30%<br />
• daily gain (g/d) 25%<br />
• feed conversion ratio (kg/kg) 20%<br />
• loin eye area (cm²) 14%<br />
• pH 24 min post mortem 7%<br />
• dripp loss 4%.<br />
To illustrate the relationships among the potential selection candidates, the<br />
relationship of each potential animal to all other potential candidates in SH was<br />
calculated (R-Value). Therefore, the additive genetic relationships among all pairs of<br />
animals in the pedigree were computed based on the numerator relationship matrix.<br />
The pedigree database of all selection candidates were extracted from the joint<br />
genetic evaluation of herdbook populations in Schleswig-Holstein and Baden-<br />
Württemberg and were obtained from the Chamber of Agriculture of Schleswig-<br />
40
Holstein. The data record included a total of 23,201 animals born from 1980 to 2009<br />
with sire and dam identification number, sex, herdbook organization and year of birth.<br />
Selection of elite animals<br />
Two selection steps were used to select elite parents for the next generation. The<br />
first, included performance and additive breeding values requirements set by the<br />
breeding organization. The second was the optimum contribution selection method,<br />
implemented in the program GENCONT (Meuwissen, 2002), to select males and<br />
females with their optimal mating frequencies to breed the next generation.<br />
1) Performance and breeding values requirements<br />
At first, potential elite animals were selected following stringent assessment of<br />
performance. Minimum requirements were determined by the representatives of<br />
SHZ. The progeny of potential elite animals, tested in the performance test station of<br />
SH, were required to have an average daily gain of >750 g, feed conversion ratio<br />
59 cm², fat to lean ratio 6. Moreover, additive breeding values of growth<br />
performance have to be positive. For a potential elite animal, the performance and<br />
breeding values had to be within the predetermined thresholds for all traits. Table 1<br />
and 2 give an overview of the performance of potential elite candidates.<br />
2) Optimum contribution selection<br />
In the second step, the optimum contribution selection method of Meuwissen (1997)<br />
was used to obtain the number of individuals to be selected and the number of<br />
offspring each of them should contribute to the next generation. The method implies<br />
a maximization of the genetic level of the next generation<br />
41<br />
G<br />
t+ 1<br />
= c'<br />
t<br />
EBVt<br />
, where<br />
t<br />
c is a<br />
vector of genetic contributions of the selection candidates to generation t + 1 and<br />
EBV<br />
t<br />
is a vector of estimated breeding values in generation t . The objective function<br />
is maximised for c<br />
t<br />
<strong>und</strong>er two restrictions. First, the rates of inbreeding are restrained<br />
to a preset level by constraining the average coancestry between selected animals to<br />
C t+ 1 = c'<br />
t<br />
At<br />
c / 2, where A t<br />
t<br />
is the relationship matrix between selection candidates,<br />
t<br />
C t+ 1 = 1−<br />
(1 − ∆F d<br />
) and ∆ Fd<br />
is the desired rate of inbreeding. The second restriction is<br />
on the sum of the contributions of male and female to 1 / 2, respectively, with<br />
Q ' c t<br />
= (1/ 2) , where Q is an n × 2 incidence matrix of the sex of the selection
candidates. In order to find the optimal c<br />
t<br />
that maximizes G<br />
t+ 1<br />
<strong>und</strong>er restrictions, two<br />
LaGrangian multipliers are necessary. For a detailed description of the optimization<br />
procedure and the derivation of equations for the LaGrangian multipliers see<br />
Meuwissen (1997). The output from the selection algorithm is the vector<br />
genetic contribution of each selection candidate to the next generation.<br />
c<br />
t<br />
with<br />
Due to the breeding scheme of the herdbook organization SHZ the number of<br />
selected sows was fixed to a constant value of 50 in GENCONT. Moreover, each<br />
sow was allocated a maximum of one mating.<br />
Mating of selected elite candidates<br />
The mating step was applied for the selected animals only and random and minimum<br />
coancestry mating were used. For all schemes, the number of progeny for each<br />
selected boar was given by optimum contribution algorithm.<br />
1) Random mating<br />
The random mating method selects a boar and a sow at random with a probability<br />
that is proportional to the genetic contribution obtained by the optimum contribution<br />
algorithm.<br />
2) Minimum coancestry mating<br />
The average relationship of selected elite boars and sows and consequently the<br />
inbreeding of their offspring was minimized using minimum coancestry mating. The<br />
basis is the coancestry matrix F of size<br />
selected sires and dams and element<br />
<br />
s<br />
× <br />
d<br />
, where<br />
s<br />
and<br />
<br />
d<br />
is the number of<br />
F<br />
ij<br />
is the coefficient of coancestry of the<br />
selected animals i and<br />
j . For minimization of average pairwise coancestry<br />
coefficients between males and females in the selected group linear programming<br />
techniques was implemented. Linear programming optimizes a linear objective<br />
function subject to linear equality and inequality constraints and has been proposed<br />
as a tool for minimum coancestry mating (Toro et al., 1988).<br />
42
The general problem of selecting mating pairs in linear programming can described<br />
as follows:<br />
minimize<br />
∑∑<br />
i j<br />
F<br />
ij x ij<br />
subject to the restrictions<br />
x = 0 or 1<br />
ij<br />
∑ xij<br />
= 1<br />
i<br />
∑ x ij<br />
= contribution allocated by optimum algorithm,<br />
j<br />
where<br />
F<br />
ij<br />
is the estimated coancestry between the i th male and j th female and x<br />
ij<br />
is the number of progeny from the ij th mating pair, restricted to 0 or 1.<br />
Results<br />
Selection of candidates according to performance requirement<br />
Average EBV, R-value, inbreeding coefficients, number of tested progeny and their<br />
performance are summarized for potential and selected candidates in Table 1 and 2.<br />
The average EBV of selected candidates was considerably higher compared to those<br />
of potential candidates. As expected, in all traits the performance of tested progeny<br />
of selected candidates was superior to the potential candidates. Moreover, the<br />
selection of candidates according to performance requirements reduced the average<br />
inbreeding slightly due to a substantially lower maximum value. Whereas the<br />
relationship value of selected candidates increased a little. Both, potential BW boars<br />
and selected BW boars have on average a lower relationship value; although the<br />
maximum value is comparable with the value of SH boars.<br />
43
Table 1: Estimated breeding value, R-value (relationship to all SH potential candidates),<br />
inbreeding coefficient and performance of tested progeny of potential and selected herdbook<br />
sows according to requirements of the pig herdbook breeding organization in Schleswig-<br />
Holstein.<br />
Potential candidates<br />
Selected candidates*<br />
Number of sows 504 93<br />
Mean Min Max Mean Min Max<br />
R-value 6.38 1.03 10.08 6.42 1.37 9.74<br />
Inbreeding coefficient (%) 1.89 0 16.67 1.44 0 4.63<br />
Breeding Value 112 51 176 128 90 173<br />
No. of tested progeny 2 1 5 2 1 4<br />
- daily gain (g/d) 816 653 987 845 754 944<br />
- feed conversion ratio (kg/kg) 2.37 2.05 2.85 2.31 2.11 2.49<br />
- carcass length (cm) 96 91 101 97 95 101<br />
- loin eye area (cm²) 61.92 52.4 73.3 62.70 59.2 70.3<br />
- fat to lean ratio 0.17 0.11 0.32 0.16 0.11 0.19<br />
- pH value 45 min post mortem 6.24 5.4 6.75 6.34 6.03 6.65<br />
- lean meat content 65.62 62.4 67.5 65.72 64.4 67.4<br />
- drip loss 4.36 0.5 13.3 3.73 1.2 11.9<br />
* requirements: daily gain >750 g, feed conversion ratio =95 cm, loin eye<br />
area >59 cm², fat to lean ratio 6, additive breeding values of<br />
growth performance positive<br />
In Figure 1 the association between EBV and relationship value is illustrated for<br />
potential and selected sows and boars. No associations between EBV and<br />
relationship value for neither the potential candidates nor the selected candidates<br />
were observed. Estimated correlations were low with values 0.08 and 0.24 and no<br />
differences could be seen between potential and selected candidates. The<br />
relationship values of most BW boars are below 3%. Consequently, the mean<br />
relationship value and also the standard deviation (1.56) is lower compared to SH<br />
boars (2.32). Therefore, breeders could use more boars with a low relationship value<br />
and a high EBV if boars from BW were considered in selection decisions. However, it<br />
should be noted that some BW boars were also closely related to the SH population<br />
with a relationship value up to 9.79%.<br />
44
Table 2: Estimated breeding value, R-value (relationship to all SH potential candidates),<br />
inbreeding coefficient and performance of tested progeny of potential and selected herdbook<br />
boars in Schleswig-Holstein (a) and Baden-Württemberg (b) according to requirements of the<br />
pig herdbook breeding organization in Schleswig-Holstein.<br />
a) Schleswig-Holstein Potential candidates Selected candidates*<br />
Number of boars 168 44<br />
Mean Min Max Mean Min Max<br />
R-value 5.28 0.15 11.29 5.87 1.23 11.23<br />
Inbreeding coefficient (%) 1.84 0 16.42 1.75 0 7.15<br />
Breeding Value 113 48 185 119 73 185<br />
No. of tested progeny 12 1 59 14 2 59<br />
- daily gain (g/d) 808 648 1001 830 766 1001<br />
- feed conversion ratio (kg/kg) 2.40 2.16 2.78 2.35 2.16 2.45<br />
- carcass length (cm) 96 92 100 96 95 98<br />
- loin eye area (cm²) 61.96 54.40 72.90 61.93 59.10 67.10<br />
- fat to lean ratio 0.17 0.12 0.25 0.16 0.14 0.19<br />
- pH value 45 min post mortem 6.24 5.85 6.68 6.26 6.01 6.66<br />
- lean meat content 65.44 63.40 66.80 65.46 64.50 66.50<br />
- drip loss 4.19 1.20 14.30 4.19 1.40 8.30<br />
b) Baden-Württemberg Potential candidates Selected candidates*<br />
Number of boars 329 38<br />
Mean Min Max Mean Min Max<br />
R-value 1.45 0 9.79 2.144 0 9.79<br />
Inbreeding coefficient (%) 1.56 0 13.58 1.20 0 7.34<br />
Breeding Value 118 49 174 131 87 163<br />
No. of tested progeny 8 1 42 11 2 36<br />
- daily gain (g/d) 781 625 971 816 764 971<br />
- feed conversion ratio (kg/kg) 2.34 2.11 2.64 2.31 2.23 2.48<br />
- carcass length (cm) 94 88 99 96 95 98<br />
- loin eye area (cm²) 63.61 53.28 76.13 63.02 59.11 68.15<br />
- fat to lean ratio 0.15 0.08 0.25 0.14 0.12 0.18<br />
- pH value 45 min post mortem 6.01 5.41 6.71 6.21 6.02 6.65<br />
- lean meat content 66.39 63.95 68.73 66.41 64.80 67.12<br />
- drip loss 3.79 0.66 7.64 3.21 1.93 5.14<br />
* requirements: daily gain >750 g, feed conversion ratio =95 cm, loin eye<br />
area >59 cm², fat to lean ratio 6, additive breeding values of<br />
growth performance positive<br />
45
R-Value<br />
2 4 6 8 10<br />
sows<br />
60 80 100 120 140 160 180<br />
EBV<br />
R-Value<br />
0 2 4 6 8 10<br />
boars<br />
60 80 100 120 140 160 180<br />
EBV<br />
Figure 1: Association between EBV and R-value (relationship to all SH potential candidates)<br />
of potential candidates (circle) and selected candidates (filled dot): Schleswig-Holstein in<br />
black, Baden-Württemberg in red.<br />
Optimum contribution selection<br />
Realistic scenarios for typical production systems, with restricted female contributions<br />
were investigated and each dam was allocated a maximum of one mating. The<br />
number of sows was fixed at a constant value of 50, but for various constraints on<br />
relationship values different sets of sows were selected. This definition implies equal<br />
contributions of 2% of the 50 selected sows to the following generation. The optimal<br />
46
number of selected boars at different levels of relationship constraints and the<br />
corresponding expected average breeding value of selected animals are shown in<br />
Figure 2.<br />
number of selected boars<br />
22<br />
20<br />
18<br />
16<br />
14<br />
12<br />
10<br />
8<br />
6<br />
4<br />
2<br />
0<br />
selected boars Schleswig-Holstein<br />
selected boars Schleswig-Holstein and Baden-Württemberg<br />
average breeding value Schleswig-Holstein<br />
average breeding value Schleswig-Holstein and Baden-Württemberg<br />
1.9 2.1 2.3 2.5 2.7 2.9 3.1 3.3 3.5 3.7 3.9<br />
constraint on relationship (%)<br />
170<br />
160<br />
150<br />
140<br />
130<br />
120<br />
average breeding value<br />
Figure 2: Average expected breeding value of selected animals and number of selected<br />
sires at different constraints on relationship without restrictions on maximal contributions.<br />
In general, the optimal number of boars decreased rapidly as the relationship<br />
constraint is relaxed. The lowest achievable level of relationship in the next<br />
generation were 2.7% for SH boars and only 1.9% if BW boars were included. The<br />
optimal number of boars at the most stringent constraint was 16 for SH boars and 17<br />
for SH and BW boars, respectively. At the most relaxed relationship constraint<br />
(3.9%), the optimal number of boars decreased to two and one for SH and SH with<br />
BW boars, respectively. Without a constraint on boars reproductive capacity,<br />
expected average breeding value of selected animals was maximized at relationship<br />
constraint at 3.9% for both datasets. However, a higher average breeding value of<br />
selected animals could be achieved by including BW boars.<br />
In a second scenario, the maximum genetic contribution of individual boars was<br />
restricted to 10% which means that the maximum number of progeny from the same<br />
boar is limited to a value of five animals (Figure 3). This constraint led to a loss in<br />
genetic gain. With a maximal contribution of 10% of each selected boar, the maximal<br />
achievable average breeding value of selected animals reduced from 160 to 140<br />
including SH boars. Also a reduction was calculated for SH and BW boars from 163<br />
to 148.<br />
47
25<br />
selected boars Schleswig-Holstein<br />
selected boars Schleswig-Holstein and Baden-Württemberg<br />
average breeding value Schleswig-Holstein<br />
average breeding value Schleswig-Holstein and Baden-Württemberg<br />
150<br />
number of selected boars<br />
20<br />
15<br />
10<br />
5<br />
145<br />
140<br />
135<br />
130<br />
125<br />
average breeding value<br />
0<br />
1.9 2.1 2.3 2.5 2.7 2.9 3.1 3.3 3.5<br />
constraint on relationship (%)<br />
120<br />
Figure 3: Average expected breeding value of selected animals and number of selected<br />
sires at different constraints on relationship with restriction on maximal contributions of<br />
selected boars (cmax=10%).<br />
Relation between optimized contributions and EBV<br />
In Figure 4 the relation between optimum contributions and estimated breeding<br />
values was demonstrated by four different constraints on relationship. The more<br />
stringent the relationship constraint, the higher the number of selected candidates<br />
and the more evenly distributed were their optimum contributions. Consequently, the<br />
standard deviation of optimum contributions among selected candidates increased<br />
from 3.83 (relationship=2.0%) to 15.70 (relationship=2.6%), whereas the standard<br />
deviation of the EBV among selected candidates decreased from 20.56<br />
(relationship=2.0%) to 13.23 (relationship=2.6%). If the relationship is limited to 2.2%,<br />
2.4% or 2.6%, the highest contribution was assigned to the boar with best EBV<br />
(EBV=185) and ranged from 20.84% (relationship=2.2%) to 47.16%<br />
(relationship=2.6%). However, if applying the most stringent constraint of 2.0%, the<br />
best boar was selected as well, but was not assigned the highest contribution to the<br />
offspring population.<br />
48
contribution (%)<br />
0 10 30 50<br />
a) b)<br />
contribution (%)<br />
0 10 30 50<br />
50 100 150 200<br />
EBV<br />
50 100 150 200<br />
EBV<br />
contribution (%)<br />
0 10 30 50<br />
c) d)<br />
contribution (%)<br />
0 10 30 50<br />
50 100 150 200<br />
50 100 150 200<br />
EBV<br />
Figure 4: Relation between estimated breeding values (EBV) of selected boars and optimum<br />
contributions for different constraints on relationship in GENCONT a) 2.0%, b) 2.2%, c) 2.4%,<br />
d) 2.6% without restriction on maximal contributions of selected boars (Schleswig-Holstein<br />
boars in black, Baden-Württemberg boars in red).<br />
EBV<br />
Figure 5 shows the impact of a restriction on maximal contribution (cmax=10.0%) of<br />
selected boars. For the two lowest level of the average relationship at 2.0% and<br />
2.2%, the highest contributions in Figure 1 are reduced to 10%. Applying a more<br />
relaxed constraint at 2.4% or 2.6%, all selected boars had a contribution of 10% or<br />
no contribution at all. Without considering BW boars, the same pattern could be<br />
observed with regard to the relation between optimized contributions and EBV.<br />
Figure 4 and 5 illustrated, that the optimum selection algorithm selected a higher<br />
proportion of Baden-Württemberg boars in each of the four relationship constraints.<br />
Thereby, the highest number of selected SH boars could be observed at the most<br />
severe relationship constraint at 2.0%.<br />
49
contribution (%)<br />
0 10 20 30 40 50 60<br />
contribution (%)<br />
0 10 20 30 40 50 60<br />
a) b)<br />
50 100 150 200<br />
EBV<br />
50 100 150 200<br />
EBV<br />
contribution (%)<br />
0 10 20 30 40 50 60<br />
contribution (%)<br />
0 10 20 30 40 50 60<br />
c) d)<br />
50 100 150 200<br />
50 100 150 200<br />
EBV<br />
Figure 5: Relation between estimated breeding values (EBV) of selected boars and<br />
optimized contributions for different constraints on relationship in GENCONT a) 2.0%, b)<br />
2.2%, c) 2.4%, d) 2.6% with restriction on maximal contributions (cmax = 0.1) of selected<br />
boars (Schleswig-Holstein boars in black, Baden-Württemberg boars in red).<br />
EBV<br />
Optimal contribution selection combined with minimum coancestry mating<br />
In Figure 6 the impact of minimum coancestry mating after applying optimum<br />
contribution theory to select boars and sows is illustrated. Minimum coancestry<br />
mating provided a mating plan with an average coancestry coefficient for matings<br />
that are substantially lower than when they were mated at random.<br />
As expected, on average the same expected breeding value of selected animals was<br />
achieved with both mating schemes. By comparison, boars and sows mated at<br />
random resulted in a much higher average coefficient. The reduction of average<br />
minimum coancestry through minimum coancestry mating was in the range from 74%<br />
up to 76% for SH boars. Including BW boars, average minimum coancestry could be<br />
reduced by 64% to 69%. The decrease in average coancestry applying minimum<br />
50
coancestry mating was mainly due to the elimination of mating pairs with extremely<br />
high coancestry values. Consequently, the standard deviation was considerably<br />
reduced by minimum coancestry mating.<br />
averge breeding value<br />
150<br />
145<br />
140<br />
135<br />
130<br />
125<br />
120<br />
average breeding value random mating<br />
average breeding value minimum<br />
coancestry mating<br />
a)<br />
1.9 2.1 2.3 2.5<br />
constraint on relationship (%)<br />
average coancestry<br />
standard deviation coancestry<br />
0.08<br />
0.07<br />
0.06<br />
0.05<br />
0.04<br />
0.03<br />
0.02<br />
0.01<br />
0<br />
average coancestry<br />
average breeding value<br />
150<br />
145<br />
140<br />
135<br />
130<br />
125<br />
120<br />
b)<br />
2.7 2.9 3.1 3.3<br />
constraint on relationship (%)<br />
0.08<br />
0.07<br />
0.06<br />
0.05<br />
0.04<br />
0.03<br />
0.02<br />
0.01<br />
0<br />
average coancestry<br />
Figure 5: Average expected breeding value of selected animals and average coancestry<br />
applying random or minimum coancestry mating of different constraints on relationship in<br />
GENCONT beginning with lowest achievable relationship. a) Schleswig-Holstein and Baden-<br />
Württemberg, b) Schleswig-Holstein alone.<br />
51
Discussion<br />
In the last 15 years, selection schemes in Piétrain herdbook population in SH are<br />
characterized by the widespread use of genetically superior proven boars. Especially<br />
the boar to sow selection path is dominated by only a few boars (<strong>Gonzalez</strong> <strong>Lopez</strong> et<br />
al., <strong>2011</strong>). Furthermore, BLUP based selection, which has been applied since 1990<br />
in the local population, has led to an increased probability of coselecting related<br />
animals. Both circumstances increased the inbreeding level in the population in past<br />
decades and resulted in an effective population size of aro<strong>und</strong> 100 animals<br />
(<strong>Gonzalez</strong> <strong>Lopez</strong> et al., <strong>2011</strong>). Such developments are typical in systematically bred<br />
livestock populations and were also extensively investigated in cattle populations. For<br />
example Sorenson et al. (2004) identified eight ancestors that together accounted for<br />
about 50% of the genes of reference population and estimated an effective<br />
population size of 70 animals in Danish Holsteins.<br />
Increased rates of inbreeding might result in detrimental effect in the long term<br />
through a reduction in genetic variability, higher chance of appearance of <strong>und</strong>esired<br />
recessive disorders and increased inbreeding depression (Falconer and Mackay,<br />
1996). Therefore, breeding organizations focus much more on joint control of genetic<br />
progress and inbreeding in recent years.<br />
Several selection methods have been described to maximize genetic progress while<br />
constraining inbreeding (Woolliams and Meuwissen, 1993; Wray and Goddard, 1994;<br />
Brisbane and Gibson, 1995; Meuwissen and Goddard, 1997; Meuwissen, 1997). The<br />
optimum contribution method (Meuwissen 1997), implemented in the program<br />
GENCONT, has been analyzed in detail using both simulation studies (Sonesson<br />
<strong>und</strong> Meuwissen, 2002) and data from practical breeding programs, for example in<br />
five US dairy breeds (Weigel and Lin, 2002), in beef cattle and a sheep population<br />
(Avendaño et al., 2003) as well as in the UK Holstein population (Kearney et al.,<br />
2004). So far, however, only a limited number of optimum contribution selection<br />
applications in pig breeding programs were published. One example is the study of<br />
Hanenberg and Merks (2001), in which results from optimum contribution selection<br />
application with an equal contribution approach in a closed pig breeding program<br />
were compared. They fo<strong>und</strong> that the use of optimum contribution selection can<br />
improve genetic gain up to 22% at the same rate of inbreeding. Similar results were<br />
reported by Meuwissen (1997) and Gr<strong>und</strong>y et al. (1998) who used simulation studies<br />
to evaluate optimum contribution theory compared with BLUP truncation selection.<br />
52
In the present study, optimum contribution theory was applied in a small pig<br />
herdbook population. In order to ensure that the different scenarios investigated are<br />
close to practical breeding schemes, specific conditions determined from the local<br />
breeding organization were considered. First, a predefined number of 50 elite sows<br />
should be selected. Moreover, a preselection of candidates has been carried out<br />
based on minimum performance requirements. This was necessary to ensure that<br />
progeny of elite matings can also be sold to potential customers such as artificial<br />
insemination organizations in Germany. Indeed, a considerable number of animals<br />
with high EBV and low relationship value were discarded during the first selection<br />
step. The main criterion causing the loss of potential candidates was the restriction<br />
on carcass length.<br />
Applying the optimum contribution selection, the number of animals selected<br />
increased and the average expected breeding value of selected animals decreased<br />
the more the relationship was constrained. These results were consistent with those<br />
of Weigel and Lin (2002) and König and Simianer (2006). The relation between EBV<br />
and optimized contributions with different constraints on relationship observed in this<br />
study was in accordance with other studies as well (Gr<strong>und</strong>y et al., 1998; Avendaño et<br />
al., 2003). In addition, it was demonstrated that a higher average breeding value of<br />
selected animals could be achieved at a severe relationship constraint by considering<br />
boars from BW. This can be explained by the fact that BW boars had a lower<br />
average R-value to potential candidates compared with SH boars. For this reason,<br />
the largest proportion of selected boars composed of BW boars (Figure 4 and 5).<br />
Individual BW boars were also highly related to the potential SH candidates as a<br />
result of exchange of genetic material between herdbook populations in past<br />
decades (<strong>Gonzalez</strong> <strong>Lopez</strong> et al., unpublished data). Therefore, a targeted application<br />
of BW boars is recommended.<br />
After the selection of elite sows and boars by applying the optimum contribution<br />
selection, minimum coancestry mating with linear programming technique was<br />
applied to define the specific mating between sows and boars. This two-step<br />
selection and mating strategy requires less computer time, compared to a one-step<br />
selection and mating scheme, for example the linear programming algorithm of Toro<br />
and Pérez-Enciso (1990) which have to include all selection candidates. The same<br />
approach has also been applied by Berg et al. (2006), Sonesson and<br />
53
Meuwissen (2000), and Sorenson et al. (2006). In the present work, minimum<br />
coancestry mating reduced the average coancestry of mating pairs at least 60%.<br />
Similar results were reported by König and Simianer (2006) for Holstein dairy cattle<br />
population. In this study, the expected inbreeding coefficient could be reduced by<br />
66.7% in the next generation when a simulated annealing algorithm was applied to<br />
minimize average inbreeding coefficients.<br />
In consequence, an additional minimum coancestry mating plan was suggested,<br />
because minimum coancestry mating enabled decreased inbreeding levels of the<br />
progeny (Caballero et al., 1996), i.e. also of the parents of the next generation. This<br />
leads to a larger Mendelian sampling variance and consequently a higher genetic<br />
variance and genetic gain can be achieved. Furthermore, minimum coancestry<br />
mating improves family structure by connecting unrelated families. Also extreme<br />
relationships are prevented resulting in more homogenous relationships across<br />
families (Sonesson and Meuwissen, 2000).<br />
Application of optimum contribution selection combined with minimum coancestry<br />
mating seems to be a promising tool to select elite animals and control inbreeding<br />
while maintaining genetic progress <strong>und</strong>er practical conditions. The pig breeding<br />
organization SHZ is recommended to consider BW boars in selection of elite boars,<br />
because it enables an additionally genetic gain with less relationship. It could be<br />
shown, that the optimum contribution algorithm can deal with constraints as required<br />
by the pig breeding organization. This included the setting of a maximum contribution<br />
per male and a fixed number of females.<br />
The practical realization requires the cooperation of herdbook breeders, breeding<br />
organization and artificial insemination organizations to ensure that the correct<br />
animals and their contributions are identified. Because the pig reproduction cycle is<br />
very fast, decisions should be taken quite often and maybe this will lead to the<br />
greatest difficulties in practical implementation. Based on discussions with all<br />
involved parties, it appears that such cooperate may be possible.<br />
Herdbook breeders have also expressed interest in mating plans, but it remains to be<br />
seen if this can be implemented in practice. Since the ultimate practical objective is<br />
not to force the breeders to conduct a specific mating, one idea is to generate a<br />
triplet of boars for each sow. In future work it should be tested, how the average<br />
54
coancestry and genetic gain would be change if a triplet concept would be<br />
implemented.<br />
Optimal genetic contribution theory in combination with minimum coancestry mating<br />
with and without gene import from a related population has been proven to be an<br />
adequate concept to manage genetic variability in a herdbook pig population <strong>und</strong>er<br />
practical conditions.<br />
References<br />
Avendaño, S., B. Villanueva, and J.A. Woolliams. 2003. Expected increases in<br />
genetic merit from using optimized contributions in two livestock populations of<br />
beef cattle and sheep. J. Anim Sci. 81: 2964-2975.<br />
Brisbane, J.R., and J.P. Gibson. 1995. Balancing selection response and rate of<br />
inbreeding by including genetic-relationships in selection decisions. Theor<br />
Appl Genet 91: 421-431.<br />
Caballero, A., E. Santiago, and M.A. Toro. 1996. Systems of mating to reduce<br />
inbreeding in selected populations. J. Anim. Sci. 62: 431-443.<br />
Falconer, D.S. and T.F.C. Mackay. 1996. Introduction to quantitative genetics. 4 th<br />
edition, Longmann Group Ltd., Essex, UK.<br />
<strong>Gonzalez</strong> <strong>Lopez</strong>, V., D. Hinrichs, J.C. Bielfeldt, N. Borchers, and G. Thaller. <strong>2011</strong>.<br />
Aktuelle <strong>und</strong> historische Entwicklungen beim Piétrainschwein in Schleswig-<br />
Holstein anhand einer Pedigreenalyse. Züchtungsk<strong>und</strong>e 38(2): 118-128.<br />
Gr<strong>und</strong>y, B., B. Villanueva, and J.A. Woolliams. 1998. Dynamic selection procedures<br />
for constrained inbreeding and their consequences for pedigree development.<br />
Genet. Res. 72: 159-168.<br />
Gr<strong>und</strong>y, B., B. Villanueva, and J.A. Woolliams. 2000. Dynamic selection for<br />
maximizing response with constrained inbreeding in schemes with overlapping<br />
generations. Anim. Sci. 70: 373-382.<br />
Hanenberg, E.H.A.T., and J.W.M. Merks. 2001. Optimisation of pig breeding<br />
programmes by implementing the optimal Genetic Contribution Theory IPG,<br />
<strong>Institut</strong>e for pig Genetics BV. Annual Meeting of the European Association for<br />
Animal Production. Abstracts No. 7.<br />
55
Kearney, J.F., E. Wall, B. Villanueva, and M.P. Coffey. 2004. Inbreeding trends and<br />
application of optimized selection in the UK Holstein population. J. Dairy Sci.<br />
87: 3503-3509.<br />
Koenig, S., and H. Simianer. 2006. Approaches to the management of inbreeding<br />
and relationship in the german holstein dairy cattle population. Livest. Sci. 103:<br />
40-53.<br />
LWK SH. 2010. <strong>Tierzucht</strong>zahlen Schleswig-Holstein 2009. Landwirtschaftskammer<br />
Schleswig-Holstein, Abt. <strong>Tierhaltung</strong> <strong>und</strong> <strong>Tierzucht</strong>, Blekendorf<br />
Meuwissen, T.H.E. 1997. Maximizing the response of selection with a predefined<br />
rate of inbreeding. J. Anim Sci. 75: 934-940.<br />
Meuwissen, T.H.E. 2002. GENCONT: An operational tool for controlling inbreeding<br />
in selection and conservation schemes. Proc. 7 th World Congress on Genetics<br />
Applied to Livestock Production.<br />
Meuwissen, T.H.E. 2009. Genetic management of small populations: A review. Act.<br />
Agric. Scand. 59: 71-79.<br />
Meuwissen, T.H.E., and A.K. Sonesson. 1998. Maximizing the response of<br />
selection with a predefined rate of inbreeding: Overlapping generations. J.<br />
Anim Sci. 76: 2575-2583.<br />
Meuwissen, T.H.E., and M.E. Goddard. 1997. Optimization of progeny tests with<br />
prior information on young bulls. Livest. Prod. Sci. 52: 57-68.<br />
Sonesson, A.K., and T.H.E. Meuwissen. 2002. Non-random mating for selection<br />
with restricted rates of inbreeding and overlapping generations. Genet. Sel.<br />
Evol. 34: 23-39.<br />
Sonesson, A.K., and T.H.E. Meuwissen. 2000. Mating schemes for optimum<br />
contribution selection with constrained rates of inbreeding. Genet. Sel. Evol.<br />
32: 231-248.<br />
Sorensen, A.C., M.K. Sorensen, and P. Berg. 2005. Inbreeding in Danish Dairy<br />
Cattle Breeds. J. Dairy Sci. 88:1865-1872.<br />
Sorenson, M.K., A:C. Sorenson, S. Borchersen, and P. Berg. 2006. Consequences<br />
of using EVA software as a tool for optimal genetic contribution selection in<br />
Danish Holstein. Proc. 8 th World Congress on Genetics Applied to Livestock<br />
Production.<br />
Toro, M.A., and M. Pérez-Enciso. 1990. Optimization of selection response <strong>und</strong>er<br />
restricted inbreeding. Genet. Sel. Evol. 22: 93-107.<br />
56
Toro, M.A., B. Nieto, and C. Salgado. 1988. A note on minimization of inbreeding in<br />
small-scale selection programmes. Livest. Prod. Sci. 20: 317-323.<br />
Weigel, K.A., and S.W. Lin. 2002. Controlling inbreeding by constraining the<br />
average relationship between parents of young bulls entering ai progeny test<br />
programs. J. Dairy Sci. 85: 2376-2383.<br />
Wolliams, J.A., and Meuwissen, T.H.E. 1993. Decision rules and variance of<br />
response in breeding schemes. Anim. Prod. 56: 179.<br />
Wray, N.R., and M.E. Goddard. 1994. Increasing long-term response to selection.<br />
Genet. Sel. Evol. 26: 431-451.<br />
57
Diskussion<br />
Der Erhalt genetischer Variabilität in Nutztierpopulationen ist entscheidend <strong>für</strong> die<br />
langfristige Aufrechterhaltung von Vitalität <strong>und</strong> Leistungsfähigkeit. Die Diskussion um<br />
den Erhalt genetischer Variabilität war viele Jahre auf kleine <strong>und</strong> seltene<br />
Haustierrassen beschränkt, in den letzten Jahren ist jedoch auch die Beobachtung in<br />
kommerziellen Nutztierpopulationen stärker in den Fokus gerückt (Meuwissen,<br />
2009).<br />
Der Einsatz neuer Reproduktionsmethoden, wie etwa künstliche Besamung <strong>und</strong><br />
Embryotransfer haben in den vergangenen Jahren dazu geführt, dass ein Individuum<br />
eine sehr hohe Anzahl Nachkommen erzeugen kann. Des Weiteren ist die Gefahr<br />
einer vermehrten Koselektion verwandter Tiere bei einer Anwendung effizienterer<br />
Zuchtwertschätzverfahren, wie BLUP, aufgr<strong>und</strong> einer Nutzung aller vorhandenen<br />
Verwandteninformationen gestiegen. Diese Methoden ermöglichen zwar kurzfristig<br />
einen sehr hohen Selektionserfolg, erhöhen aber die Wahrscheinlichkeit von<br />
Paarungen zwischen Tieren, die enger miteinander verwandt sind als der<br />
Durchschnitt der Population. Je höher die Verwandtschaft zwischen Paarungspartner<br />
ist, umso größer ist die Wahrscheinlichkeit der Vererbung herkunftsgleicher Allele an<br />
die Nachkommen. Ein steigender Homozygotiegrad ist mit einer Abnahme der<br />
genetischen Variabilität innerhalb einer Population verb<strong>und</strong>en, die in einem linearen<br />
Verhältnis zur Inzucht steht (Falconer, 1989):<br />
V<br />
g<br />
( t)<br />
= (1 − Ft<br />
) Vg<br />
(0)<br />
,<br />
dabei ist V g (t) die genetische Varianz in Generation t <strong>und</strong> F t der durchschnittliche<br />
Inzuchtkoeffizient in Generation t. So sind bei völliger Inzucht alle Individuen<br />
genetisch identisch.<br />
Inzucht führt bei landwirtschaftlichen Nutztierpopulationen zu einer reduzierten<br />
genetisch nutzbaren Merkmalsvariation. Gleichzeitig nimmt die Gefahr des Verlustes<br />
von unerwünschten Allelen zu, wodurch das Potenzial <strong>für</strong> langfristige<br />
Selektionserfolge <strong>und</strong> Anpassungsfähigkeit an sich ändernde Umweltbedingungen<br />
<strong>und</strong> Zuchtziele reduziert wird. Ein zusätzliches Risiko stellen Inzuchtdepressionen<br />
insbesondere mit negativen Auswirkungen auf die Merkmalskomplexe Reproduktion<br />
<strong>und</strong> Vitalität dar. In der Literatur wird das Schwein als relativ inzuchtanfälliges<br />
58
Nutztier beschrieben <strong>und</strong> Inzuchtdepressionen <strong>für</strong> prä- <strong>und</strong> postnatale<br />
Sterblichkeiten von Ferkeln sowie bei Geburtsgewichten <strong>und</strong> Wurfgrößen<br />
festegestellt. In einer Untersuchung zur Reproduktionsleistung wurde von<br />
Rodrigánez et al. (1998) pro 10% Inzuchtsteigerung innerhalb eines Wurfes eine<br />
Reduktion der Anzahl geborener Ferkel um 0,27 Ferkel je Wurf, bzw. die Zahl der<br />
lebend geborenen Ferkel je Wurf um 0,39 Ferkel ermittelt. Unter der Annahme, dass<br />
Wurfgröße <strong>und</strong> -qualität nicht ausschließlich vom Genotyp der Mutter beeinflusst<br />
werden, stellte Johnson (1990) fest, dass je 10%iger Steigerung der Inzucht des<br />
Wurfes etwa 0,6 Embryonen bis zum 65. Trächtigkeitstag absterben. Bezogen auf<br />
die Sau reduzierte sich die Wurfgröße um etwa 0,4 Ferkel je Wurf. Außerdem wies<br />
Johnson (1990) einen Zusammenhang zwischen der Überlebensrate von Ferkeln<br />
<strong>und</strong> deren Inzuchtgrad sowie zum Inzuchtgrad der Mutter nach. Je 10%<br />
Inzuchtsteigerung auf Ebene des Wurfes zeigten sich Ferkelverluste von 0,3 bis 0,5<br />
Ferkel <strong>und</strong> auf Ebene der Mutter Verluste von 0,2 bis 0,4 Ferkel innerhalb eines<br />
Wurfes. Im Vergleich mit den Leistungseinbußen in den Reproduktionsmerkmalen<br />
sind die Auswirkungen im Bereich der Produktionsmerkmale weniger ausgeprägt.<br />
Christensen et al. (1994) ermittelte je 10% Inzuchtsteigerung eine Abnahme der<br />
Tageszunahmen um 1,6g/Tag, eine Reduzierung der Leistung in Bezug auf die<br />
Schlachtkörper- <strong>und</strong> Fleischqualität konnte in der Studie nicht nachgewiesen werden.<br />
Eine Reduzierung der Populationsgröße in Populationen, die nach Prinzipien der<br />
Reinzucht gezüchtet werden, bedingt zwangsläufig die Gefahr eines erhöhten<br />
Inzuchtzuwachses. Da sich die Anzahl der Piétrain Herdbuchsauen in Schleswig-<br />
Holstein seit 1980 um mehr als die Hälfte reduziert hat, war das Ziel dieser Arbeit die<br />
genetische Variabilität dieser Population im Kontext der historischen Entwicklung <strong>und</strong><br />
der aktuellen Situation zu analysieren. Darauf aufbauend sollte ein Konzept <strong>für</strong> ein<br />
Management <strong>und</strong> eine Erweiterung der genetischen Variabilität unter Beachtung des<br />
Zuchtfortschrittes entwickelt werden.<br />
Das Piétrainschwein – Entwicklung <strong>und</strong> Bedeutung in Schleswig-Holstein<br />
Eine Populationsanalyse, mit dem Ziel die genetische Variabilität zu beschreiben,<br />
sollte immer im Kontext mit der historischen Entwcklung der Population unter<br />
verschiedenen Aspekten wie Ursprung der Rasse, Bildung von Subpopulationen,<br />
Zuchtverfahren <strong>und</strong> Bestandsentwicklungen betrachtet werden (Zechner et al., 2002;<br />
59
Valera et al., 2005). Nachfolgend wird kurz die Entwicklung des Piétrainschweins<br />
erläutert <strong>und</strong> die Bedeutung der schleswig-holsteinischen Population<br />
herausgearbeitet.<br />
Das Piétrainschwein hat seinen Ursprung in der belgischen Provinz Brabant um das<br />
Jahr 1920 mit einer zunächst nur rein lokalen Bedeutung.<br />
In der Leistung zeichnet sich das Piétrainschwein besonders durch einen hohen<br />
Anteil wertvoller Teilstücke, einem günstigen Fleisch:Fett-Verhältnis sowie einer<br />
guten Futterverwertung aus. Diese Eigenschaften führten in den 50er Jahren in<br />
Verbindung mit der Veränderung des Nachfrageverhaltens der Konsumenten hin zu<br />
magerem Schweinefleisch zu einer steigenden Bedeutung <strong>und</strong> Nachfrage der Rasse.<br />
Nach Anerkennung der Rasse 1956 <strong>für</strong> ganz Belgien wurden erstmals<br />
Piétrainschweine nach Frankreich, Dänemark <strong>und</strong> in die Niederlande exportiert<br />
(Bader, 1965). In Deutschland erfolgten erste Importe Ende der 50er Jahre von<br />
Züchtern in Schleswig-Holstein mit dem Ziel in einem<br />
Kombinationszüchtungsversuch den Fleischanteil der Angler-Sattelschweine zu<br />
erhöhen <strong>und</strong> damit den veränderten Marktanforderungen gerecht zu werden. Bereits<br />
die ersten F1-Produkte überzeugten durch ihre überdurchschnittlichen Mast- <strong>und</strong><br />
Schlachtleistungen, womit der Weg zur heute praktizierenden Kreuzungszucht<br />
geebnet war (Bielfeldt, 2007). Der Verband der Züchter der Angler Sattelschweine in<br />
Schleswig-Holstein (Neumünster) nahm dann eine Vorreiterrolle ein <strong>und</strong> gründete in<br />
der B<strong>und</strong>esrepublik 1961 die erste Herbuchabteilung <strong>für</strong> Piétrainschweine. Die<br />
züchterische Bearbeitung kann von 1960 bis 1982 in folgende vier Phasen<br />
(Wandhoff, 1982) unterteilt werden:<br />
1. Erprobung der Rasse (1960-1962)<br />
2. Aufbau der Population (1963-1967)<br />
3. Kombinationszucht mit der Belgischen Rasse (1968-1974)<br />
4. Konsolidierung der Rasse (ab 1975)<br />
Mit Abschluss der Aufbauphase der Zuchtpopulation wurde durch eine gezielte<br />
Anpaarung mit der Belgischen Landrasse Verbesserungen in Rahmen, Wuchs <strong>und</strong><br />
Fruchtbarkeit erzielt. Bis heute zeichnet sich das Piétrainschwein in Schleswig-<br />
Holstein durch einen wachstumsbetonten Typ aus. Seit der Konsolidierungsphase,<br />
ab etwa 1972, steht eine Reinzucht mit einer auf einer Leistungsprüfung basierenden<br />
Selektion im Vordergr<strong>und</strong>.<br />
60
Bis 1975 dominierte der Zuchtverband in Schleswig-Holstein mit einem Anteil von<br />
60 bis 70% den Bestand an Piétrain Herdbuchtieren in Deutschland. Durch den<br />
Zukauf von Zuchttieren waren die mit einigem zeitlichen Abstand entstanden<br />
Herbuchzuchten in den anderen B<strong>und</strong>esländern bis Ende der 1970er Jahre stark von<br />
genetischem Material aus Schleswig-Holstein geprägt, insbesondere die<br />
Populationen in Süddeutschland <strong>und</strong> Österreich (Wandhoff, 1982). Der Zuchtverband<br />
in Schleswig-Holstein hat somit zum einen als Vorreiter durch intensive Zuchtarbeit in<br />
den frühen Jahren wesentlich zu der Entwicklung als auch zum Erfolg der Rasse in<br />
Deutschland beigetragen.<br />
Das Piétrainschwein wird demnach in Deutschland seit Ende der 70er Jahre in<br />
unabhängigen Herdbuchpopulationen nach Prinzipien der Reinzucht züchterische<br />
bearbeitet. Dabei hat in den vergangenen Jahren immer wieder ein genetischer<br />
Austausch zwischen den Populationen stattgef<strong>und</strong>en.<br />
Die Piétrain Herdbuchpopulation in Schleswig-Holstein war in den letzten Jahren<br />
einem starken Strukturwandel unterzogen. Wie in Tabelle 1 dargestellt ist, ging die<br />
Anzahl der Herdbuchzuchtbetriebe von 1980 stark zurück <strong>und</strong> auch die Anzahl an<br />
Herdbuchsauen reduzierte sich bis heute um mehr als die Hälfte.<br />
Tabelle 1. Anzahl Herdbuchsauen <strong>und</strong> Herdbuchzuchtbetriebe in Schleswig-Holstein (LWK<br />
SH, 2010)<br />
1980 1990 2000 2005 2009<br />
Herdbuchsauen 1160 890 671 582 446<br />
Herdbuchzuchtbetriebe 45 55 13 10 8<br />
Dies ist mit der steigenden Besamungsdichte <strong>und</strong> dem Absatzrückgang bei<br />
Natursprungebern zu erklären. Infolge dieser Entwicklungen hat sich der<br />
Zuchtverband mit einer kleinen Anzahl von Züchtern zu einem Spezialisten <strong>für</strong> die<br />
Zucht von Endproduktebern entwickelt. Dies sollte dennoch nicht über die Bedeutung<br />
hinwegtäuschen. Aktuell werden in Schleswig-Holstein in acht<br />
Herdbuchzuchtbetrieben mit 446 Herdbuchsauen Piétraineber zum Einsatz in der<br />
Hybridzucht <strong>für</strong> den nationalen <strong>und</strong> internationalen Markt gezüchtet. Im<br />
Geschäftsjahr 2009 konnten auf Auktionen <strong>und</strong> ab Hof 1059 Piétraineber mit einem<br />
Durchschnittspreis von 903 Euro verkauft <strong>und</strong> ein Gesamthandelsvolumen von<br />
957000 Euro erzielt werden (LWK, 2010). Darüber hinaus stellt die Schleswig-<br />
Holsteinische Herdbuchzucht den Großteil der Genetik zum Einsatz in der<br />
61
Besamungsstation Schipphorsterfeld. Infolge einer konsequenten Selektion hat der<br />
Zuchtverband in Schleswig-Holstein eine Spitzenposition im Leistungsniveau der<br />
europäischen Piétrainzucht erreicht, <strong>und</strong> dementsprechend eine hohe Anerkennung<br />
in den schweinestarken Exportmärkten Spanien, Frankreich <strong>und</strong> den Niederlanden.<br />
Dabei sind im internationalen Handel in Spanien ansässige Zuchtunternehmen die<br />
Hauptabnehmer <strong>für</strong> Eber aus der schleswig-holsteinischen Piétrainzucht.<br />
Pedigreeanalyse zur Beschreibung der genetischen Variabilität<br />
Eine gr<strong>und</strong>legende Voraussetzung <strong>für</strong> die Kontrolle über das Wirken von Drift <strong>und</strong><br />
Inzucht, also den Größen die die genetische Variabilität verringern, ist die genaue<br />
Kenntnis über den aktuellen Stand <strong>und</strong> gegebenenfalls existierende Schwachstellen<br />
im Zuchtprogramm. Zur Beschreibung der genetischen Variabilität existieren<br />
verschiedene Ansätze. Eine Reihe von Kennzahlen mit deren Hilfe die genetische<br />
Variabilität beschrieben werden kann, basieren auf Pedigreeinformationen. Die<br />
Entwicklungen in der Molekulargenetik erlauben jedoch darüber hinaus auch<br />
Kennzahlen zu berechnen, die auf genetischen Markerinformationen beruhen.<br />
Bei der Durchführung eines Monitorings der genetischen Variabilität auf Basis von<br />
Pedigreedaten, wie es in dieser Studie erfolgte, ist sowohl die Qualität als auch die<br />
Quantität der Pedigreeinformationen der entscheidende Faktor <strong>für</strong> die Aussagekraft<br />
von Kennzahlen (Rochambeau et al. 1997). In realen Datensätzen variiert die<br />
Pedigreegüte sehr stark. Neben fehlenden Abstammungsinformationen kann es<br />
durch fehlerhafte Datenerfassung zu Fehlabstammungen kommen. In der Literatur,<br />
sind in Rinderpopulationen Fehlabstammungen von bis zu 23% beschrieben (Ron et<br />
al. 1996, Weller et al., 2004). Außerdem liegen Abstammungsinformationen meist<br />
erst ab einem bestimmten Jahr in einem elektronischen Format vor. In der<br />
vorliegenden Studie waren von den Zuchtverbänden elektronische Aufzeichnungen<br />
der Abstammungsinformationen ab 1979 vorhanden. Tiere dieses Geburtsjahres<br />
gingen dementsprechend als unverwandte Basistiere in die Analysen ein, was nicht<br />
allgemeingültig anzunehmen ist. Wie in dem vorherigen Abschnitt beschrieben, sind<br />
viele Herdbuchzuchten in Deutschland bis Ende der 70er Jahre von genetischem<br />
Material aus Schleswig-Holstein geprägt worden. Dies konnte im zweiten Kapitel<br />
anhand des Ursprungs der Fo<strong>und</strong>ertiere von 1980 bis 1995 aufgr<strong>und</strong> der nicht weiter<br />
zurückgehenden Aufzeichnungen der Abstammungsinformationen nicht<br />
nachvollzogen werden. In Kapitel eins wurde des Weiteren die Problematik der<br />
62
offenen Population mit dem Zukauf von Zuchttieren insbesondere Ebern, von denen<br />
keine Abstammungsinformation oder nur eine Ahnengeneration vorlag, diskutiert.<br />
Diese Tiere gingen als unverwandt zur Population in die Analysen ein, wovon bei<br />
einem regelmäßigen Zukauf aus denselben Populationen, wie es zwischen den<br />
Piétrain Herdbuchpopulationen in den vergangenen Jahren stattgef<strong>und</strong>en hat, nicht<br />
auszugehen ist. Dementsprechend konnte in Kapitel zwei gezeigt werden, dass bei<br />
einer Zusammenführung der Pedigrees eine höhere Pedigreevollständigkeit erzielt<br />
werden kann.<br />
In der durchgeführten Arbeit ergaben sich zusätzlich Schwierigkeiten bei der<br />
Aufbereitung der Herdbuchdaten zur Erstellung der Pedigrees <strong>und</strong> der<br />
Zusammenführung dieser. Folgende Inkonsistenzen, die zum Ausschluss der<br />
betroffenen Herdbucheintragungen von weiteren Analysen führten, konnten<br />
identifiziert werden:<br />
• red<strong>und</strong>ante Tiere<br />
• red<strong>und</strong>ante Tiere mit unterschiedlichen Elternangaben<br />
• Geburtsdatum von Eltern <strong>und</strong> Nachkommen unplausible<br />
• Inkonsistenz in den Abstammungsinformationen („Loops“)<br />
Des Weiteren konnte ein hoher Anteil an Tieren mit fehlendem Geburtsdatum<br />
identifiziert werden. Um eine Berücksichtigung dieser Tiere in den Analysen<br />
gewährleisten zu können, wurde das Geburtsdatum von dem ältesten Nachkommen<br />
abgeleitet. Darüber hinaus stellte die in den vergangenen Jahren übliche<br />
Umcodierung von importierten Tieren eine besondere Herausforderung dar. Die<br />
Konsistenz der Abstammungsdaten wurde bestmöglich hergestellt, in Einzelfällen ist<br />
allerdings nicht auszuschließen, dass ein Tiere doppelt, mit zwei unterschiedlichen<br />
Herdbuchnummern, in den Verbänden geführt wurde. Die Konsequenzen dieser<br />
möglichen Fehleinschätzung auf die dargestellten genetischen Verknüpfungen<br />
zwischen den Populationen in Kapitel zwei sind nicht genau abzuschätzen. Um eine<br />
einheitliche Identifikation aller Herdbuchtiere über die Verbände hinweg<br />
gewährleisten zu können, wird in Zukunft, insbesondere in Hinblick auf die<br />
gemeinsame Zuchtwertschätzung empfohlen, auf eine Umcodierung zu verzichten.<br />
Für die Aufbereitung der einzelnen Herdbuchdaten sowie der Zusammenführung der<br />
Pedigrees wurde ein umfangreiches Programm in C++ entwickelt.<br />
63
Als Referenzgröße zur Einschätzung einer Zuchtpopulation <strong>und</strong> eines<br />
Zuchtprogramms im Hinblick auf das Wirken von Inzucht hat sich die effektive<br />
Populationsgröße als ein geeigneter <strong>und</strong> wissenschaftlich f<strong>und</strong>ierter Parameter<br />
durchgesetzt (Caballero 1994; Caballero <strong>und</strong> Toro, 2000). Diese ist definiert als die<br />
Anzahl von Individuen, welche die berechnete Stichprobenvarianz oder<br />
Inzuchtsteigerung verursachen würde, wenn mit ihr nach Art der idealisierten<br />
Population gezüchtet würde (Falconer, 1989). Eine Bestimmung der wahren<br />
Größenordnung ist jedoch gr<strong>und</strong>sätzlich schwierig <strong>und</strong> kann, insbesondere in<br />
offenen Populationen, wie es in der schleswig-holsteinischen Piétrain<br />
Herdbuchpopulation der Fall ist, nur approximativ durchgeführt werden. Die zunächst<br />
gewählte inzuchteffektive Methode zur Schätzung der effektiven Populationsgröße,<br />
über die Verwandtschaftsmatrix, wird im Rahmen der zur Verfügung stehenden<br />
statistisch-genetischen Möglichkeiten als die verlässlichste Methode angesehen<br />
(Toro et al., 1998). Aufgr<strong>und</strong> der regelmäßigen Importe ist die geschätzte effektive<br />
Populationsgröße von 190 Tieren in der vorliegenden Analyse allerdings überschätzt<br />
<strong>und</strong> als absolute Obergrenze zu betrachten. Der Effekt der Importtiere in der<br />
Schätzung wurde deshalb in Form von einer Korrektur bei unbekannter Abstammung<br />
(Pérez-Enciso <strong>und</strong> Fernando, 1992) berücksichtigt (siehe Kapitel eins). Dies führte<br />
zu einer deutlich geringeren effektiven Populationsgröße von 118 Tieren.<br />
Eine vergleichbare effektive Populationsgröße von 105 Tieren wurde drifteffektiv<br />
nach Hill (1979) geschätzt. In diese Methode fließen die Anzahl Zuchttiere, das<br />
Generationsintervall sowie die tatsächlich realisierten Familienvarianzen in den vier<br />
Selektionspfaden ein. Nach Falconer <strong>und</strong> Mackay (1996) stellt die nichtzufällige<br />
Verteilung der Familiengröße die wichtigste Abweichung eines Zuchtssystems der<br />
Idealpopulation dar. Dabei ist die Familiengröße definiert als die Anzahl Nahkommen<br />
eines Tieres, die wieder in der Zucht eingesetzt werden. Die Familiengröße ist<br />
demnach ein Parameter zum Einschätzen des Übertrages von Allelen eines Tieres<br />
auf die nächste Generation. In heutigen Zuchtpopulationen haben Tiere aufgr<strong>und</strong> der<br />
Abstammung <strong>und</strong> der geschätzten Zuchtwerte nicht die gleiche Chance<br />
Nachkommen zur nächsten Generation beizutragen, wodurch die Varianz in der<br />
Familiengröße erhöht wird. Demzufolge stammt die nachfolgende Generation von<br />
einer geringeren Anzahl Tiere ab, wodurch die effektive Größe reduziert wird. Diese<br />
Methode ist somit auch als Analyseinstrument <strong>für</strong> das Zuchtmanagement zu<br />
verstehen <strong>und</strong> hat aufgezeigt, dass in der Piétrain Herdbuchpopulation in Schleswig-<br />
64
Holstein seit 1999 einige Spitzeneber überdurchschnittlich viele weibliche<br />
Nachkommen hatten, die wieder in der Zucht eingesetzt wurden. Der Eber „Mink“<br />
(Herdbuchnummer 17482), geboren 1999, ist mit 59 weiblichen Nachkommen von<br />
2002 bis 2007 besonders hervorzuheben <strong>und</strong> wurde in Kapitel zwei als der Ahne mit<br />
dem höchsten genetischen Beitrag zur Population identifiziert.<br />
„Mink“ geht wiederum in zweiter Generation auf den Eber „Markus“<br />
(Herdbuchnummer 17141) zurück, der aus Bayern importiert wurde <strong>und</strong> ebenfalls<br />
schon eine hohe Anzahl an Nachkommen in der Population aufwies. Dieses Beispiel<br />
verdeutlicht sehr anschaulich, wie sich die genetischen Verknüpfungen zwischen den<br />
Populationen entwickelt haben (siehe Kapitel zwei).<br />
In Kapitel eins wird die Inzuchtentwicklung in der Population als kritisch eingestuft<br />
<strong>und</strong> vor allem die in der Vergangenheit extrem hohe Nachkommenanzahl einiger<br />
Spitzeneber als Schwachstelle gesehen. Auch wenn sicherlich im Interesse eines<br />
hohen Zuchtfortschritts gehandelt wurde, ist in Zukunft im Sinne einer nachhaltigen<br />
Zuchtpolitik das Einschreiten der Verantwortlichen im Zuchtverband durch eine<br />
Bestimmung einer maximalen Einsatzhäufigkeit von Ebern gefordert.<br />
Ein komplementärer Ansatz zur Beschreibung der genetischen Variabilität in einer<br />
Population ist die effektive Anzahl von Fo<strong>und</strong>ertieren (Lacy, 1989), die effektive<br />
Anzahl von Ahnen (Boichard et al. 1997) <strong>und</strong> die effektive Anzahl von<br />
Gründergenomen (Chevalet <strong>und</strong> Rochambeau 1986, MacCluer et al. 1986; Lacy<br />
1989). Für die in Kapitel eins definierte Referenzpopulation wurden diese<br />
Kennzahlen zusätzlich zur Bewertung der genetischen Variabilität der Piétrain<br />
Herdbuchpopulation in Schleswig-Holstein herangezogen. Eine effektive Anzahl von<br />
118 Fo<strong>und</strong>ertieren <strong>und</strong> eine effektive Anzahl von 35 Ahnen wurden geschätzt.<br />
Insgesamt 181 Ahnen erklärten 100% der genetischen Variabilität der<br />
Referenzpopulation, wobei 50% der Gene nur von 13 Ahnen bestimmt wurden. Die<br />
deutliche Diskrepanz zwischen der effektiven Anzahl von Fo<strong>und</strong>ertieren <strong>und</strong> Ahnen<br />
ebenso wie zwischen der tatsächlichen Anzahl von Ahnen (181) <strong>und</strong> der effektiven<br />
Anzahl (35) lassen auf einen unbalancierten Einsatz von Zuchttieren schließen <strong>und</strong><br />
bestätigten die in Kapitel eins dargestellten Ergebnisse.<br />
Rückblickend wäre die Beschreibung der genetischen Variabilität innerhalb <strong>und</strong><br />
zwischen den Herdbuchpopulationen durch eine ergänzende Analyse unter<br />
65
Verwendung molekulargenetischer Informationen sinnvoll gewesen. Insbesondere<br />
unter dem Aspekt der nicht in allen Belangen ausreichenden Pedigreequalität. Im<br />
Rahmen der vorliegenden Studie konnte dies nicht realisiert werden, da<br />
entsprechende Markerinformationen nicht zur Verfügung standen. Unter Verwendung<br />
von genetischen Markerinformationen hätten im Idealfall genauere<br />
Verwandtschaftskoeffizienten zwischen den Tieren geschätzt werden können (Toro<br />
et al. 2002), <strong>und</strong> somit eine verbesserte Einschätzung der wahren effektiven<br />
Populationsgröße erfolgen können. Darüber hinaus hätten genetische Distanzen<br />
zwischen den Populationen basierend auf der Ähnlichkeit der Allelfrequenzen zur<br />
Abschätzung der genetischen Differenziertheit geschätzt (Nei, 1972) sowie eine<br />
markergestützte Schätzung von Verwandtschaftskoeffizienten zwischen den<br />
Herdbuchpopulationen durchgeführt werden können (Eding <strong>und</strong> Meuwissen, 2001).<br />
Strategien zur Erhaltung genetischer Variabilität unter Praxisbedingungen<br />
In der Schweinezucht gehören gr<strong>und</strong>sätzlich die Populationsgröße <strong>und</strong> –struktur<br />
sowie die Selektionsentscheidung <strong>und</strong> die Anpaarungsstrategie von Seiten der<br />
Zuchtplanung zu den Parametern, die sowohl den Selektionserfolg als auch die<br />
Entwicklung des Inzuchtzuwachses maßgeblich bestimmen. Gr<strong>und</strong>legend basieren<br />
die wichtigsten Strategien zur Inzuchtkontrolle auf der Selektionsentscheidung, d. h.<br />
die Auswahl der Elterntiere <strong>für</strong> die nächste Generation sowie in welchem Umfang<br />
diese eingesetzt werden, als auch der gegebenenfalls gezielten Verpaarung. Diese<br />
zwei Punkte können isoliert oder aber kombiniert bearbeitet werden.<br />
Auf diesen beiden Ebenen wurden in den vergangen Jahren von der Wissenschaft<br />
verschiedene Strategien zur Kontrolle von Inzucht in Populationen mit oder ohne<br />
Selektion sowie unter Einbeziehung molekulargenetischer Informationen entwickelt<br />
<strong>und</strong> insbesondere anhand von Simulationsstudien evaluiert (unter anderem<br />
Caballero et al., 1996, Meuwissen, 1997, Toro et al., 1999, Wang, 1997, Wang <strong>und</strong><br />
Hill, 2000, Fernandéz et al., 2003). Dabei ist die Selektionsentscheidung von<br />
größerer Bedeutung, da die genetische Basis der nächsten Generation durch die<br />
selektierten Elterntiere determiniert wird (Meuwissen, 2009). Unter dem Aspekt, dass<br />
in kommerziellen Nutztierpopulationen ein Hauptaugenmerk auf einem hohen<br />
Zuchtfortschritt liegt, stellt die von Meuwissen (1997) entwickelte „optimum genetic<br />
contribution“ Methode das Mittel der Wahl dar. Diese Selektionsmethode maximiert<br />
66
den genetischen Fortschritt pro Generation bei einer vorgegebenen Inzuchtrate<br />
durch eine Optimierung der Beiträge der Tiere zur nächsten Generation.<br />
Die Anwendung der Methode an realen Zuchtpopulationsdaten wurde in der Literatur<br />
bereits beschrieben (Weigel <strong>und</strong> Lin, 2002, Avendaño et al, 2003, Kearney et al.<br />
2004). In der Schweiz wird die Methode bereits in der Praxis in Zuchtprogrammen<br />
beim Schwein zur Eliteanpaarung angewendet (Luther <strong>und</strong> Hofer, 2005). Das<br />
Softwareprogramm GENCONT, welches auf der „optimum genetic contribution<br />
theory“ beruht, ermöglicht eine einfache Erprobung der Methode an realen Daten<br />
sowie eine routinemäßige Anwendung unter praktischen Bedingungen. Nichts desto<br />
trotz stellt die Einführung einer solchen Selektionsmethode in die routinemäßige<br />
Zuchtarbeit eine nicht zu unterschätzende Herausforderung dar. Gr<strong>und</strong>legende<br />
Voraussetzung ist die Einsicht <strong>und</strong> aktive Mitarbeit der Züchter. Aufgr<strong>und</strong> dessen<br />
wurde im Rahmen des hier vorgestellten Projektes umfassende Aufklärungsarbeit<br />
geleistet <strong>und</strong> der Züchterschaft anhand der Ergebnisse in Kapitel eins die<br />
Notwendigkeit eines Konzeptes zur Inzuchtkontrolle vermittelt. Für die erfolgreiche<br />
Durchführung ist ein hohes Maß an Zusammenarbeit von Züchtern, Zuchtverband<br />
<strong>und</strong> den beteiligten künstlichen Besamungsstationen gefordert. Ein regelmäßiger<br />
Informationsaustausch bezüglich der verfügbaren Eber als auch der zu belegenden<br />
Sauen sowie eine Rückinformation welcher Eber eingesetzt wurde, ist die<br />
Voraussetzung. Die genaue Einhaltung der optimalen Beiträge der selektierten Tiere<br />
nach der „optimum genetic contribution theory“ ist allerdings unter<br />
Praxisbedingungen aufgr<strong>und</strong> von verschiedenen Faktoren, wie Umrauschen einer<br />
Sau oder Verfügbarkeit von Sperma, nie zu 100% realisierbar. Gr<strong>und</strong>sätzlich ist die<br />
Tatsache, dass nur noch eine sehr kleine Züchterschaft in Schleswig-Holstein<br />
beteiligt ist <strong>für</strong> die Durchführung positiv zu bewerten.<br />
Zunächst wurde den Züchtern <strong>und</strong> dem Zuchtverband als Strategie zur<br />
Inzuchtkontrolle nur die Selektionsentscheidung auf Basis der „optimum contribution<br />
theory“ vorgestellt, die noch keine gezielte Verpaarung impliziert. Bei gezielten<br />
Anpaarungsvorgaben besteht immer die Gefahr, dass sich Züchter zu sehr in der<br />
eigenen Zuchtarbeit eingeschränkt fühlen. In Diskussion mit der Züchterschaft in<br />
Schleswig-Holstein wurde jedoch der Wunsch eines Anpaarungsvorschlages der<br />
selektierten Tiere deutlich. Somit wurde basierend auf den Ergebnissen der<br />
„optimum contribution selection“ ein optimaler Anpaarungsplan mit einer Minimierung<br />
des Sippenkoeffizienten zwischen den Paarungspartner der selektierten Tiere<br />
67
vorgeschlagen (siehe Kapitel drei). Ein gezielter Anpaarungsvorschlag <strong>für</strong> eine Sau<br />
mit einem Eber ist jedoch nicht immer praktikabel. Zum einen kann das Sperma des<br />
Ebers nicht verfügbar sein, zum anderen vermeiden die Züchter die Verpaarung von<br />
bestimmten Genealogien aufgr<strong>und</strong> eines jahrelangen Erfahrungshorizontes. Von<br />
daher wäre es unter praktischen Bedingungen durchaus sinnvoll dem Züchter<br />
bestmögliche Alternativvorschläge <strong>für</strong> eine Sau anzubieten. In der vorliegenden<br />
Arbeit wurde da<strong>für</strong> ein Eber-Triplet gebildet. Der Eber an erster Position entsprach<br />
dem optimalen Anpaarungsvorschlag nach der Minimierung des Sippenkoeffizienten.<br />
An zweiter <strong>und</strong> dritter Position wurden die Eber gesetzt, die der optimalen Anpaarung<br />
in Bezug auf den Sippenkoeffizient am ähnlichsten waren.<br />
Tabelle 2: Verschiedene Anpaarungsstrategien nachdem Eber <strong>und</strong> Sauen mit GENCONT selektiert<br />
wurden (Vorgaben 50 Sauen <strong>und</strong> maximal zulässige Verwandtschaft von 2,1%).<br />
Ø<br />
Sippenkoeffizient<br />
Ø erwartete<br />
Zuchtwert<br />
Änderung der Beiträge in<br />
Anzahl Nachkommen<br />
Zufällige Anpaarung 0,00838 144<br />
Anpaarung mit Minimierung des<br />
Sippenkoeffizienten<br />
0,00299 144<br />
Eber-Triplet mit<br />
Anpaarungswahrscheinlichkeit Ø Min Max<br />
[80,15,5] 0,00300 144 1,38 1 3<br />
[60,25,15] 0,00301 142 1,84 1 4<br />
[40,35,25] 0,00303 141 2,30 1 5<br />
[33.3,33.3,33.3] 0,00308 141 2,46 1 5<br />
Tabelle 2 zeigt exemplarisch, wie sich der durchschnittliche Sippenkoeffizient <strong>und</strong><br />
der durchschnittlich erwartete Zuchtwert verändern, wenn den Züchtern in Form<br />
eines Eber-Triplets eine Alternative geboten wird. Die Tiere wurden vorher, wie in<br />
Kapitel drei, nach der „optimum contribution theory“ selektiert. Erwartungsgemäß<br />
steigt die durchschnittliche Verwandtschaft mit sinkender Wahrscheinlichkeit der<br />
optimalen Anpaarung. Jedoch ist immer noch eine niedrigere durchschnittliche<br />
Verwandtschaft als bei einer zufälligen Anpaarung der selektierten Tiere zu<br />
beobachten. Allerdings mit einem geringeren erwarteten durchschnittlichen<br />
Zuchtwert. Bei der Anwendung eines Eber-Triplets ändern sich zwangsläufig die<br />
Beiträge der Eber, die nach der „optimum contirbution selection“ zur Optimierung<br />
relalisiert werden sollten, ebenfalls dargestellt in Tabelle 2 anhand der Anzahl der<br />
Nachkommen. Wie sich der Einsatz eines Eber-Triplets langfristig auf die<br />
68
Inzuchtentwicklung <strong>und</strong> den Zuchtfortschritt auswirkt, muss vor der praktischen<br />
Implementierung noch anhand einer realitätsnahen Simulationsstudie validiert<br />
werden. Dabei könnte anhand der unterschiedlichen<br />
Anpaarungswahrscheinlichkeiten Empfehlungen <strong>für</strong> den Zuchtverband abgeleitet<br />
werden, zu welchem prozentualen Anteil die optimalen Eliteanpaarung durchgeführt<br />
werden sollten.<br />
Aktuelle Entwicklungen der Piétrain Herdbuchzucht in Deutschland<br />
Nicht nur in der Piétrain Herdbuchzucht in Schleswig-Holstein, sondern auch in den<br />
anderen Herdbuchzuchten in Deutschland, hat sich in den vergangen Jahren ein<br />
Strukturwandel vollzogen. Seit 1990 hat sich die Anzahl an Piétrain Herdbuchsauen<br />
in Deutschland von über 10000 auf etwa 5000 reduziert (ZDS, 2010) <strong>und</strong> auch die<br />
Anzahl and Züchtern reduzierte sich. Um in diesen relativ kleinen Strukturen eine<br />
effektive Zuchtarbeit leisten zu können, so dass der produzierte<br />
Piétrainendprodukteber attraktiv <strong>und</strong> konkurrenzfähig insbesondere zu großen<br />
nationalen <strong>und</strong> internationalen Zuchtunternehmen bleibt, wird seit 2007 eine engere<br />
Zusammenarbeit über die B<strong>und</strong>esländergrenzen hinweg aufgebaut. Im Dezember<br />
2008 gründeten die Zuchtverbände aus Baden-Württemberg (SZV), Bayern (EGZH),<br />
Hessen (VSH), Mecklenburg-Vorpommern (HSZV), Mitteldeutschland (MSZV), dem<br />
Rheinland (LRS), Rheinland-Pfalz (VSR) <strong>und</strong> Schleswig-Holstein (SHZ) die<br />
„Deutsche Herdbuchzucht Schwein“ (DHS). Ziel dieser Kooperation ist die Bildung<br />
einer Plattform <strong>für</strong> eine engere Zusammenarbeit in den Bereichen Vermarktung,<br />
Zuchtwertschätzung <strong>und</strong> Interessenvertretung. Bereits 2009 <strong>und</strong> 2010 wurde<br />
erfolgreich eine B<strong>und</strong>eseliteauktion der Züchtervereinigung durchgeführt.<br />
Seit September 2009 sind die SHZ mit dem SZV <strong>und</strong> der LRS die ersten<br />
Zuchtverbände, die eine überregionale Zuchtwertschätzung durchführen. Durch die<br />
Zusammenführung entstand die weltweit größte Piétrainpopulation mit 2.300<br />
Herdbuchsauen aus 40 Herbuchbetrieben, die nach einem einheitlichen Zuchtziel<br />
züchterisch bearbeitet wird. Das Ziel ist die Produktion eines Endproduktebers, der<br />
sich durch eine Erzeugung von homogenen Mastendprodukten mit guten Zunahmen<br />
<strong>und</strong> hervorragende Schlachtkörperqualität bei guter Fleischbeschaffenheit<br />
auszeichnet <strong>und</strong> auf Basis umfangreicher Prüfverfahren gezüchtet wurde. Auf Basis<br />
der überregionalen Zuchtwertschätzung wurde zur Vermarktung der Eber die Marke<br />
„German Piétrain“ etabliert. German Piétrain stellt den größten Anteil der<br />
69
Besamungseber in Deutschland <strong>und</strong> zeigt die enorme Bedeutung <strong>für</strong> die gesamte<br />
Schweineproduktion.<br />
Die überregionale Zuchtwertschätzung ermöglicht:<br />
• vergleichbare Zuchtwerte<br />
• genauer geschätzte Zuchtwerte<br />
• überregionale Prüfung von Testebern<br />
• überregionaler Einsatz von Spitzenebern<br />
• objektive über die Ländergrenzen hinweg vergleichbaren Leistungsprüfung.<br />
Somit wurde mit der gemeinsamen Zuchtwertschätzung die Voraussetzungen <strong>für</strong><br />
eine breite Selektionsbasis <strong>und</strong> eine hohe Selektionsintensität geschaffen. Dies<br />
ermöglicht eine effektivere Zuchtarbeit <strong>für</strong> eine weitere Forcierung des<br />
Zuchtfortschritts, damit die produzierten Endprodukteber am Markt konkurrenzfähig<br />
bleiben.<br />
Die in Kapitel zwei gezeigten genetischen Verknüpfungen zwischen den<br />
Populationen stellen dabei die Gr<strong>und</strong>lage <strong>für</strong> die gemeinsame Zuchtwertschätzung<br />
dar. Ohne genetische Verknüpfungen ist eine gemeinsame Zuchtwertschätzung zwar<br />
durchführbar, aber nicht zu empfehlen (Hanocq et al., 1996, Mark et al., 2005).<br />
In Zukunft ist noch ein Anstieg des Verwandtschaftsgrades zwischen den<br />
Populationen zu erwarten. Die Möglichkeit, Eber aus den anderen Zuchtgebieten mit<br />
einheitlich geschätzten Zuchtwerten zu nutzen, hat in Schleswig-Holstein bereits zu<br />
einem vermehrten Einsatz dieser geführt (Bielfeldt, persönliche Mitteilung). Zukünftig<br />
ist anzunehmen, dass sich ein überregionaler Einsatz von Spitzenebern, der durch<br />
die gemeinsame Zuchtwertschätzung gegeben ist, entwickeln wird. Dies birgt die<br />
Gefahr eines erhöhten Inzuchtzuwachses <strong>und</strong> kann langfristig zu einer Problematik<br />
wie in der Rinderzucht führen. In der Literatur wurde umfassend von verschiedenen<br />
Autoren analysiert, dass international die Holsteinzucht auf nur eine ganz geringe<br />
Anzahl Bullen zurückgeht (König <strong>und</strong> Simianer, 2006). Umso wichtiger ist<br />
zukunftsweisend, im Zuge der Umstrukturierung der Píetrainzucht in Deutschland,<br />
ein Konzept zum Inzuchtmanagement wie in Kapitel drei dargestellt, aufzubauen.<br />
Sowohl innerhalb der einzelnen Populationen als auch langfristig überregional.<br />
Wie in Kapitel drei gezeigt, kann der Zuchtverband in Schleswig-Holstein derzeit bei<br />
einem Inzuchtmanagement unter Einbeziehung baden-württembergischer Eber<br />
70
Vorteile erzielen, indem ein höherer durchschnittlich erwarteter Zuchtwert der<br />
selektierten Eltern bei einer geringeren Verwandtschaft möglich ist. Jedoch wurde<br />
auch die Notwendigkeit eines gezielten Austausches zwischen den Populationen<br />
verdeutlicht. Einige Eber aus Baden-Württemberg sind aufgr<strong>und</strong> des in der<br />
Vergangenheit stattgef<strong>und</strong>enen genetischen Austausches eng mit der aktuellen<br />
Population verwandt (siehe Kapitel zwei).<br />
Zukunftsweisend haben die Züchtervereinigung (SHZ, SZV, LRS), die Landesanstalt<br />
<strong>für</strong> Schweinezucht Boxberg (LSZ), die Universität Hohenheim <strong>und</strong> die<br />
Besamungsstation GFS Ascheberg ein Projekt aufgebaut, mit dem Ziel, im<br />
Routinebetrieb genomisch geschätzte Zuchtwerte <strong>für</strong> potentielle Remonteeber zu<br />
liefern <strong>und</strong> mit klassischen Leistungsprüfprogrammen zu kombinieren. Sowohl die<br />
Zuchtfortschritte in den einzelnen Merkmalen sollen dadurch forciert als auch die<br />
Genauigkeit der Zuchtwerte gesteigert werden. Darüber hinaus könnten die<br />
vorhandenen Markerinformation <strong>für</strong> ein zukünftiges Inzuchtmanagement genutzt<br />
werden (Sonesson, 2010).<br />
Literatur<br />
Aveñdano, S., B. Villanueva, and J. A. Woolliams. 2003. Expected increases in<br />
genetic merit from using optimized contributions in two livestock populations of<br />
beef cattle and sheep. J. Anim Sci. 81: 2964-2975.<br />
Bader, J. 1965. Das Piétrainschwein, seine Leistungen <strong>und</strong> seine Bedeutung <strong>für</strong> die<br />
Kreuzungszucht (Gebrauchskreuzung). Dissertation Technische Universität<br />
Berlin.<br />
Bielfeldt, J. C. 2007. Schweinezucht im Wander der Zeit. Landpost 55.<br />
Boichard, D., L. Maignel, É. Verrier. 1997. The value of using probabilities of gene<br />
origin to measure genetic variability in a population. Genet. Sel. Evol. 29: 5-23.<br />
Caballero, A. 1994. Developments in the prediction of effective population size.<br />
Heredity 73: 657-679.<br />
Caballero, A., E. Santiago, and M.A. Toro. 1996. Systems of mating to reduce<br />
inbreeding in selected populations. J. Anim. Sci. 62: 431-443.<br />
71
Caballero, A., and M. A. Toro. 2000. Interrelations between effective population size<br />
and other pedigree tools for the management of conserved populations.<br />
Genet. Res. 75: 331-343.<br />
Christensen, K., P. Jensen, and J. N. Jorgensen. 1994. A note on effect of inbreeding<br />
on production traits in pigs. Anim. Prod. 58: 298-300.<br />
Eding, H., and T. H. E. Meuwissen. 2001. Marker-based estimates of between and<br />
within population kinships for the conservation of genetic diversity. J. Anim.<br />
Breed. Genet. 118: 141-159.<br />
Falconer, D.S., and T.F.C. Mackay. 1996. Introduction to quantitative genetics. 4 th<br />
edition, Longmann Group Ltd., Essex, UK.<br />
Fernández, J. M. A. Toro, and A. Caballero. 2003. Fixed Contributions Design vs.<br />
Minimization of Global Coancestry to Control Inbreeding in Small Populations.<br />
Genetics 165: 885-894.<br />
Johnson, R.K. 1990. Inbreeding effects on reproduction , growth and carcass traits.<br />
Genetics of Swine UDSDA, Lincoln, 107-109.<br />
Hanocq, E. D. Boichard, and J.L. Foulley. 1996. A simulation study of the effect of<br />
connectedness on genetic trend. Genet. Sel. Evol. 28:67-82.<br />
Hill, W.G. 1979. Note on Effective Population-Size with Overlapping Generations.<br />
Genetics 92: 317-322.<br />
Kearney, J.F., E. Wall, B. Villanueva, and M.P. Coffey. 2004. Inbreeding trends and<br />
application of optimized selection in the uk holstein population. J. Dairy Sci.<br />
87: 3503-3509.<br />
Koenig, S., and H. Simianer. 2006. Approaches to the management of inbreeding<br />
and relationship in the german holstein dairy cattle population. Livest. Sci. 103:<br />
40-53.<br />
Lacy, R.C. 1989. Analysis of fo<strong>und</strong>er representation in pedigrees: fo<strong>und</strong>er<br />
equivalents and fo<strong>und</strong>er genome equivalents. Zoo. Biol. 8: 111-24.<br />
Luther, H., and A. Hofer. 2005. Implementation of a selection and mating strategy to<br />
optimize genetic gain and rate of inbreeding in the Swiss pig breeding<br />
program. 56 th Annual Meeting of the European Association for Animal<br />
Production. Uppsala, Book of abstracts, 224.<br />
LWK SH. 2010. <strong>Tierzucht</strong>zahlen Schleswig-Holstein 2009. Landwirtschaftskammer<br />
Schleswig-Holstein, Abt. <strong>Tierhaltung</strong> <strong>und</strong> <strong>Tierzucht</strong>, Blekendorf.<br />
72
MacCluer, J.W., A.J. Boyce, B. Dyke, L.R. Weitkamp, D.W. Pfennig, and C.J.<br />
Parsons. 1983. Inbreeding and Pedigree Structure in Standardbred Horses. J.<br />
Hered. 74: 394-399.<br />
MacCluer, J.W., J.L. van de Berg, B. Read, and O.A. Ryder. 1986. Pedigree<br />
analysis by computer simulation. Zoo. Biol., 5: 147-160.<br />
Mark, T., P. Madsen, J. Jensen and W.F. Fikse. 2005. Short communication:<br />
Difficulties in estimating across-country genetic correlations for weakly linked<br />
bull populations. J. Dairy Sci. 88:3303-3305.<br />
Meuwissen, T.H.E. 1997. Maximizing the response of selection with a predefined<br />
rate of inbreeding. J. Anim Sci. 75: 934-940.<br />
Meuwissen, T.H.E. 2002. GENCONT: An operational tool for controlling inbreeding<br />
in selection and conservation schemes. Proc. 7th World Congress on Genetics<br />
Applied to Livestock Production.<br />
Meuwissen, T.H.E. 2009. Genetic management of small populations: A review. Act.<br />
Agric. Scand. 59: 71-79.<br />
Nei, M. 1972. Genetic distance between populations. Amer. Natur. 106: 283-292.<br />
Pérez-Enciso, M., and R.L. Fernando. 1992. Genetic Evaluation with Uncertain<br />
Parentage - a Comparison of Methods. Theor. Appl. Genet. 84: 173-179.<br />
Rochambeau, H.D., F. Fournet-Hanocq, and J. Vu Tien Khang. 1997. Measuring and<br />
managing genetic variability in small populations. 48th EAAP, August 25-28,<br />
1997, Vienna. Austria.<br />
Rodrigánez, M.C., M. A. Toro, Rodriguez, M.C., and L. Silió. 1998. Effekt of fo<strong>und</strong>er<br />
allele survival and inbreeding depression on litter size in a closed line of Large<br />
white pigs. Anim. Sci. 67: 537-582.<br />
Ron, M., Y. Blanc, M. Band, E. Erza, and J.I. Weller. 1996. Misidentification rate in<br />
the Israeli dairy cattle population and its implications for genetic improvement.<br />
J. Dairy Sci. 79: 676-681.<br />
Sonesson, A. K., J. A. Wolliams, and T. H. E. Meuwissen. 2010. Maximising genetic<br />
gain whilst controlling rates of genomic inbreeding using genomic optimum<br />
contribution selection. In: Proceedings of the 9th World Congress on Genetics<br />
Applied to Livestock Production, Leipzig, Germany<br />
Toro, M.A., L. Silió, J. Rodrigánez, C. Rodriguez, and J. Fernández. 1999. Optimal<br />
use of genetic markers in conservation programmes. Genet. Sel. Evol. 31:255-<br />
261.<br />
73
Valera, M., A. Molina, J. P. Gutiérrez, J. Gómez, and F. Goyache. 2005. Pedigree<br />
analysis in the Andalusian horse: population structure, genetic variability and<br />
influence of the Carthusian strain. Livest. Prod. Sci. 95:57-66.<br />
Wandhoff, H.-E. 1982. Das Piétrainschwein – Die Entwicklung der Rasse in<br />
Westeuropa <strong>und</strong> in der B<strong>und</strong>esrepublik unter besonderer Berücksichtigung<br />
des Aufbaus der Population in Schleswig-Holstein. Dissertation Christian-<br />
Albrechts-Universität zu Kiel.<br />
Wang, J. 1997. More efficient breeding systems for controlling inbreeding and<br />
effective size in animal populations. Heredity 79: 591-599.<br />
Wand, J., and W. G. Hill. 2000. Marker-Assisted Selection to Increase Effective<br />
Population Size by Reducing Mendelian Segregation Variance. Genetics 154:<br />
475-489.<br />
Weigel, K.A., and S.W. Lin. 2002. Controlling inbreeding by constraining the<br />
average relationship between parents of young bulls entering ai progeny test<br />
programs. J. Dairy Sci. 85: 2376-2383.<br />
Weller, J.I., E. Feldmesser, M. Golik, I. Tager-Cohen, R. Domochovsky, O. Alus, E.<br />
Ezra, and M. Ron. 2004. Factors affecting incorrect paternity assignment in<br />
the Israeli Holstein population. J Dairy Sci. 87: 2627-2640.<br />
Zechner, P., J. Sölkner, I. Brodo, T. Druml, R. Baumung, R. Achmann, E. Marti, F.<br />
Habe, and G. Brem. 2002. Analysis of diversity and population structure in the<br />
Lipizzan horse breed based on pedigree information. Livest. Prod. Sci. 77:137-<br />
146.<br />
74
Zusammenfassung<br />
Die Erhaltung der genetischen Variabilität ist die Basis des nachhaltigen Umgangs<br />
mit tiergenetischen Ressourcen <strong>und</strong> entscheidend <strong>für</strong> die Aufrechterhaltung von<br />
Vitalität <strong>und</strong> Leistungsfähigkeit. Insbesondere in kleinen, nach Prinzipien der<br />
Reinzucht gezüchteten Populationen, besteht die Gefahr eines erhöhten<br />
Inzuchtzuwachses mit einer Reduktion der additiv genetischen Varianz. Im Rahmen<br />
der vorliegenden Arbeit wurde eine Analyse der genetischen Variabilität der Piétrain<br />
Herdbuchpopulation in Schleswig-Holstein durchgeführt, die als Gr<strong>und</strong>lage zur<br />
Beurteilung der aktuellen Situation dienen <strong>und</strong> als Informationsbasis <strong>für</strong> zukünftige<br />
Konzepte zum Erhalt der genetischen Variabilität herangezogen werden kann.<br />
Im ersten Kapitel wurde die Struktur <strong>und</strong> Entwicklung der Piétrain<br />
Herdbuchpopulation analysiert <strong>und</strong> mit einer Schätzung der effektiven<br />
Populationsgröße der Gefährdungsstatus der Population eingeordnet. Da<strong>für</strong> wurde<br />
das durchschnittliche Generationsintervall, die Entwicklung der Familienvarianz, die<br />
Inzuchtentwicklung <strong>und</strong> die effektive Populationsgröße anhand einer definierten<br />
aktuellen Zuchtpopulation mit entsprechenden Pedigreeinformationen ermittelt.<br />
Das Generationsintervall in der Population betrug im Durchschnitt 2,4 Jahre <strong>und</strong> ließ<br />
einen leichten Anstieg seit 2003 erkennen. Die effektive Populationsgröße wurde<br />
anhand dreier verschiedener Methoden geschätzt: drifteffektiv nach der Formel von<br />
Hill (1979) <strong>und</strong> inzuchteffektiv mittels der Numerator-Relationship-Matrix (NRM)<br />
sowie der Uncertain-Parentage-Matrix (UPM). Die drifteffektive Populationsgröße<br />
sank tendenziell von 1990 bis 2006 <strong>und</strong> wurde im Mittel auf 105 Tiere geschätzt. Mit<br />
190 Tieren lag die inzuchteffektive Populationsgröße -berechnet mittels der NRM –<br />
über der geschätzten drifteffektiven Populationsgröße. Eine Korrektur bei<br />
unbekannter Abstammung (UPM Methode) resultierte in einer inzuchteffektiven<br />
Populationsgröße von 118 Tieren. Die deutlichen Unterschiede zwischen den beiden<br />
inzuchtbasierten Schätzmethoden zeigten den Einfluss fehlender<br />
Pedigreeinformationen bei der NRM-Methode. Keine Abstammungsinformation<br />
wiesen hauptsächlich importierte Eber auf. Bei der Analyse der Varianz der<br />
Familiengröße, war eine extrem starke Varianz im Vater-Tochter-Pfad zu<br />
beobachten, die durch eine extrem hohe weibliche Nachkommenanzahl einer<br />
weniger Eber zu erklären ist <strong>und</strong> verdeutlicht, dass in der Vergangenheit einzelne<br />
Eber überdurchschnittlich häufig in der Zucht eingesetzt wurden.<br />
75
Ziel des zweiten Kapitels war es, die genetischen Verknüpfungen der fünf größten<br />
Piétrain Herdbuchpopulationen in Deutschland anhand verschiedener Methoden zu<br />
analysieren. In die Analyse mit einbezogen wurden die Pedigreedaten der<br />
Herdbuchpopulationen aus Bayern, Baden-Württemberg, Schleswig-Holstein,<br />
Nordrhein-Westfalen <strong>und</strong> Niedersachsen. Zwischen diesen Herdbuchpopulationen<br />
hat in den vergangenen Jahrzehnten ein Austausch von genetischem Material<br />
stattgef<strong>und</strong>en, insbesondere durch den Im- <strong>und</strong> Export von Ebern, aber auch durch<br />
den Einsatz von Ebern aus anderen Zuchtgebieten über die künstliche Besamung.<br />
Dementsprechend konnten <strong>für</strong> alle Herdbuchpopulationen gemeinsam eingesetzte<br />
Eber, die auch Nachkommen in den jeweiligen Herdbuchpopulationen hatten,<br />
nachgewiesen werden. Dies resultierte in einer mittleren genetischen Ähnlichkeit der<br />
Populationen von 11,17%. Gemeinsam eingesetzte als auch importierte Eber in den<br />
Populationen führten zu durchschnittlichen Verwandtschaftskoeffizienten zwischen<br />
den Populationen von 2.57% bis 4.52%. Des Weiteren wurden <strong>für</strong> jede<br />
Herdbuchpopulation die fünf Ahnen mit den höchsten genetischen Beiträgen, <strong>und</strong><br />
deren Herkunft, ermittelt. In jeder Herdbuchpopulation stammte mindestens einer<br />
dieser Ahnen aus einem anderen Zuchtgebiet. Ein dominierender Eber aus Bayern<br />
konnte in drei der Herdbuchpopulationen identifiziert werden. Anhand der<br />
genetischen Fo<strong>und</strong>erbeiträge in den Herdbuchpopulationen konnte gezeigt werden,<br />
dass sich die genetischen Verknüpfungen hauptsächlich von 1996 an entwickelt<br />
haben. Dabei trugen die Herdbuchpopulationen in Bayern <strong>und</strong> Schleswig-Holstein<br />
die höchsten Fo<strong>und</strong>erbeiträgen zu den anderen Herdbuchpopulationen bei. Die<br />
Ergebnisse des zweiten Kapitels deuten auf eine ausreichende genetische<br />
Verknüpfung zwischen den Herdbuchpopulationen hin, so dass gr<strong>und</strong>sätzlich<br />
Potenzial <strong>für</strong> die Umsetzung einer überregionalen Zuchtwertschätzung gegeben ist.<br />
Zielsetzung des dritten Kapitels war die Ausarbeitung eines auf die Belange der<br />
Piétrain Herdbuchzucht in Schleswig-Holstein zugeschnittene Konzept zum<br />
Management <strong>und</strong> Erweiterung der genetischen Variabilität unter Beachtung des<br />
Zuchtfortschritts. Inwieweit der Einsatz von Ebern aus Baden-Württemberg von<br />
Vorteil wäre, war von besonderem Interesse. Zur Selektion <strong>und</strong> Verpaarung von<br />
Elitetieren wurde eine Zwei-Stufen Prozess gewählt. Dabei wird im Vergleich mit<br />
Anpaarungsstrategien, die alle potentiellen Tiere beinhalten, ein geringerer<br />
Rechenaufwand benötigt. Zunächst erfolgte die Selektion der Kandidaten anhand der<br />
„optimum contribution selection“ unter Einbeziehung der geschätzten Zuchtwerte der<br />
76
Tiere. Die Anzahl selektierter Eber, bei einer festgesetzten Anzahl von 50 Sauen,<br />
sowie der erwartete Zuchtwert der selektierten Eltern wurden am Beispiel<br />
verschiedener Begrenzungen der Verwandtschaft dargestellt. Gr<strong>und</strong>sätzlich<br />
reduzierte sich mit steigender maximal zugelassener Verwandtschaft die Anzahl der<br />
selektierten Eber stark. Die Einbeziehung von Ebern aus Baden-Württemberg<br />
ermöglichte eine geringere Verwandtschaft in der nächsten Generation bei einem<br />
insgesamt höheren maximal zu erwartenden Zuchtwert der selektierten Tiere.<br />
Dementsprechend wird der Einsatz von Ebern aus Baden-Würrtemberg empfohlen.<br />
Zur weiteren konkreten Anpaarungsplanung der von Gencont selektierten Tiere mit<br />
ihren Beiträgen zur nächsten Generation wurde eine Minimierung der<br />
Verwandtschaft zwischen den Paarungspartner anhand des Sippenkoeffizienten mit<br />
Hilfe einer linearen Programmierung durchgeführt. Aufgr<strong>und</strong> der gezielten Anpaarung<br />
konnte der durchschnittliche Sippenkoeffizient zwischen den Paarungspartner um<br />
mindestens 64% reduziert werden. Die Anwendung des vorgestellten Konzeptes zur<br />
Erhaltung der genetischen Variabilität in der Piétrain Herdbuchpopulation in<br />
Schleswig-Holstein scheint unter praktischen Bedingungen geeignet zu sein.<br />
77
Summary<br />
The conservation of genetic variability is the basis for a sustainable use of animal<br />
resources and a decisive factor for the maintenance of vitality and performance. In<br />
particular, small populations are at risk because an increase of inbreeding is to be<br />
expected with loss of usable genetic variability. The aim of this thesis was to analyze<br />
the genetic variability of the Piétrain herdbook population in Schleswig-Holstein. The<br />
analysis of the actual situation is the basis for future concepts with regard to the<br />
conservation of genetic variability.<br />
The objective of the first chapter was to analyze population structure and effective<br />
population size to evaluate the endangerment status of the Piétrain herdbook<br />
population in Schleswig-Holstein. The following parameters were determined: the<br />
average generation interval, variance of the family size, the increase of the rate of<br />
inbreeding and the effective population size. For the estimation of effective<br />
population size only ancestors of the active population were used . The average<br />
generation interval was calculated to be 2.4 years with a slight increase since 2003.<br />
Three methods were applied to estimate effective population size: the formula given<br />
by Hill (1979) to estimate drift effective population size for each year and inbreeding<br />
coefficients to estimate inbreeding effective population size obtained from the<br />
numerator relationship matrix (NRM) or from uncertain parentage matrix (UPM). The<br />
latter applies a probabilistic correction for unknown ancestors. Drift effective<br />
population size has slightly decreased between 1990 and 2006. The harmonic mean<br />
across years resulted in an effective population size of 105 pigs. The effective<br />
population size estimated by NRM was higher at aro<strong>und</strong> 190 animals. Correction by<br />
unknown ancestors (UPM) led to an effective population size of 118 animals. The<br />
major differences between the methods NRM and UPM showed the influence of<br />
missing pedigree information mainly caused by imported boars. The variance of the<br />
family size in the male-female path varied extremely in the past due to the extensive<br />
use of some boars.<br />
In the second chapter the genetic connectedness between the five most important<br />
Piétrain herdbook populations in Germany was evaluated. The herdbook populations<br />
were located in Bavaria, Baden-Württemberg, Schleswig-Holstein, North Rhine-<br />
Westphalia and Lower-Saxony. The herdbook populations were genetically linked as<br />
a result of imported boars and the use of artificial insemination boars in the past<br />
78
decades. Accordingly, all populations had common boars with progeny. This resulted<br />
in an average genetic similarity of 11.17%. The average genetic relationship<br />
coefficients between the five breeding organizations confirmed that the populations<br />
are genetically linked and ranged between 2.57 % and 4.52 %. Additionally, in all<br />
populations, at least one of the five ancestors with the largest marginal contributions<br />
to the reference population originated from another herdbook population. One of the<br />
most important ancestors was common for three populations. Over the past 30 years,<br />
the contribution of foreign fo<strong>und</strong>ers to the populations has increased as a<br />
consequence of exchange of genetic material. The various measures of<br />
connectedness indicated that there are sufficient genetic links between the five<br />
herdbook populations to enable an overall breeding value estimation system.<br />
In chapter three, the properties and consequences through the application of a<br />
concept to maintain genetic variability while maximizing genetic gain in the Piétrain<br />
herdbook population in Schleswig-Holstein were investigated. Especially the<br />
additional benefit by considering boars from Piétrain herdbook population in Baden-<br />
Württemberg in selection decisions was of particular interest. A two-step selection<br />
and mating strategy was applied. At first, animals were selected with the optimum<br />
contribution selection method to identify elite sows and boars. The optimum<br />
contribution selection theory using official estimated breeding values was applied for<br />
different constraints on relationship. The number of sows was fixed at a constant<br />
value of 50. In general, the optimal number of boars decreased rapidly as the<br />
relationship constraint was relaxed. The lowest achievable level of relationship in the<br />
next generation wase 2.7% for SH boars and only 1.9% when BW boars were<br />
included. Furthermore, a higher average breeding value of selected animals could be<br />
achieved by including BW boars. Consequently, it is recommended to consider BW<br />
boars in selection of elite boars. Contributions from selected boars and sows were<br />
used to develop specific mating plans by applying minimum coancestry mating with a<br />
linear programming technique. Minimum coancestry mating reduced average<br />
coancestry by at least 64%. This two-step selection and mating strategy requires less<br />
computer time, compared to a one step mating scheme, where all selection<br />
candidates are included in the mating step. Application of optimum contribution<br />
selection combined with minimum coancestry mating seems to be a promising tool to<br />
select elite animals and to control inbreeding while maintaining genetic progress<br />
<strong>und</strong>er practical conditions.<br />
79
Danksagung<br />
An dieser Stelle möchte ich den Menschen danken, die zur Umsetzung <strong>und</strong> zum<br />
Gelingen dieser Arbeit beigetragen haben.<br />
Mein besonderer Dank gilt Herrn Prof. Dr. Georg Thaller <strong>für</strong> die Überlassung des<br />
Themas, die wissenschaftliche Betreuung <strong>und</strong> die gewährleisteten Freiräume bei der<br />
Erstellung dieser Arbeit sowie <strong>für</strong> die Möglichkeit, meine Ergebnisse auf Tagungen<br />
im In- <strong>und</strong> Ausland vorzustellen.<br />
Bei Herrn Prof. Dr. Jörn Bennewitz bedanke ich mich <strong>für</strong> die Übernahme des<br />
Koreferats.<br />
Für die finanzielle Unterstützung danke ich der Stiftung Schleswig-Holsteinische<br />
Landschaft sowie der H. Wilhelm Schaumann Stiftung.<br />
Bei Herrn Dr. Dirk Hinrichs bedanke ich mich <strong>für</strong> die fachlichen Diskussionen <strong>und</strong> die<br />
fortwährende Hilfsbereitschaft <strong>und</strong> Unterstützung bei der Erstellung der Arbeit. Ein<br />
Dankeschön geht auch an Herrn Dr. Bielfeldt (Schweineherdbuchzucht Schleswig-<br />
Holstein) <strong>und</strong> Herrn Dr. Borchers (Landwirtschaftskammer Schleswig-Holstein) <strong>für</strong><br />
die gute Zusammenarbeit, den vielen Anregungen, die Datenbereitstellung sowie die<br />
Hilfsbereitschaft bei der Durchsicht der Manuskripte.<br />
Darüber hinaus danke ich allen Kollegen <strong>für</strong> die schöne Zeit am <strong>Institut</strong> mit einem<br />
tollen kollegialen <strong>und</strong> fre<strong>und</strong>schaftlichen Arbeitsklima <strong>und</strong> vielen gemeinsamen<br />
St<strong>und</strong>en bei Abgabebieren, Disputationen <strong>und</strong> Doktorandenfahrten.<br />
Ein ganz besonderer Dank geht an die ‚H<strong>und</strong>econtainer-Mädels’ Imke Gerjets, Lisa<br />
Kruse, Marrin Arfsten-Häußler <strong>und</strong> Anna Albrecht – es war eine w<strong>und</strong>erbare<br />
gemeinsame Zeit. Danke <strong>für</strong> Eure moralische Unterstützung, Hilfsbereitschaft <strong>und</strong><br />
Eure Fre<strong>und</strong>schaft. Des Weiteren möchte ich Stefanie Hotes, Andreas Stukenborg,<br />
Julia Brosig, Andreas Baer <strong>und</strong> Ewald Kramer <strong>für</strong> die vielen gemeinsamen Aktivitäten<br />
außerhalb der Arbeitszeit, wie Brunchen oder Kegeln, die immer eine willkommene<br />
Abwechslung waren, danken.<br />
Mein größter Dank gilt meiner besten Fre<strong>und</strong>in Moni, meinen Eltern <strong>und</strong> Jan, die<br />
mich in jeder Phase der Arbeit uneingeschränkt unterstützt haben. Ihr habt immer an<br />
mich geglaubt <strong>und</strong> mir damit viel Rückhalt gegeben. Vielen Dank da<strong>für</strong>!<br />
80
Lebenslauf<br />
Name<br />
<strong>Verena</strong> <strong>Gonzalez</strong> <strong>Lopez</strong><br />
Geburtsdatum 02.02.1982<br />
Geburtsort<br />
Solingen<br />
Familienstand<br />
ledig<br />
Staatsangehörigkeit deutsch<br />
Schulausbildung<br />
08/1988 – 06/1992 Gr<strong>und</strong>schule Stübchen, Solingen<br />
08/1992 – 07/2001 Allgemeine Hochschulreife,<br />
Gymnasium Vogelsang, Solingen<br />
Studium<br />
04/2002 – 12/2005 Studium der Agrarwissenschaften,<br />
Fachrichtung Nutztierwissenschaften,<br />
Christian-Albrechts-Universität zu Kiel<br />
Abschluss: Bachelor of Science<br />
01/2006 – 12/2007 Studium der Agrarwissenschaften,<br />
Fachrichtung Nutztierwissenschaften,<br />
Christian-Albrechts-Universität zu Kiel<br />
Abschluss: Master of Science<br />
Berufliche Tätigkeit<br />
07/2007 – 08/<strong>2011</strong> Wissenschaftliche Mitarbeiterin am <strong>Institut</strong> <strong>für</strong> <strong>Tierzucht</strong><br />
<strong>und</strong> –haltung der Christian-Albrechts-Universität zu Kiel<br />
bei Herrn Prof. Dr. G. Thaller<br />
Praktika<br />
08 – 09/2005 Farm Neu Heusis,<br />
Ochsenmast <strong>und</strong> Pferdezucht,<br />
Windhoek, Namibia<br />
06 – 08/2005 Landwirtschaftsbetrieb Peter Brandt,<br />
Milchviehbetrieb,<br />
Dammfleth, Deutschland<br />
03 – 06/2005 Versuchsgut Hohenschulen,<br />
Schweinezucht <strong>und</strong> –mastanlage,<br />
Achterwehr, Deutschland<br />
81