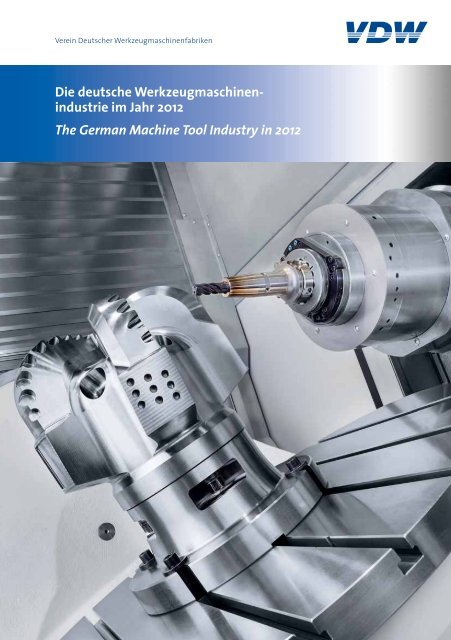
Die deutsche Werkzeugmaschinen- industrie im Jahr 2012 ... - VDW
Die deutsche Werkzeugmaschinen- industrie im Jahr 2012 ... - VDW
Die deutsche Werkzeugmaschinen- industrie im Jahr 2012 ... - VDW

Erfolgreiche ePaper selbst erstellen
Machen Sie aus Ihren PDF Publikationen ein blätterbares Flipbook mit unserer einzigartigen Google optimierten e-Paper Software.
Verein Deutscher <strong>Werkzeugmaschinen</strong>fabriken<br />
<strong>Die</strong> <strong>deutsche</strong> <strong>Werkzeugmaschinen</strong><strong>industrie</strong><br />
<strong>im</strong> <strong>Jahr</strong> <strong>2012</strong><br />
The German Machine Tool Industry in <strong>2012</strong>
3 Leitmarkt China<br />
7 Aktuelle Situation und Perspektiven<br />
17 <strong>Werkzeugmaschinen</strong>-Produktion<br />
31 <strong>Werkzeugmaschinen</strong>-Außenhandel<br />
45 Stellung auf dem Weltmarkt<br />
59 Strukturdaten der <strong>Werkzeugmaschinen</strong><strong>industrie</strong><br />
65 Statistischer Anhang, methodische Hinweise, <strong>VDW</strong>-Mitgliedsfirmen<br />
3 Leading market China<br />
7 Current situation and perspectives<br />
17 Machine tool production<br />
31 Foreign trade in machine tools<br />
45 Position on the world market<br />
59 Structural data of the machine tool industry<br />
65 Statistical appendix, methodical comments, <strong>VDW</strong> member companies<br />
Titelseite: Mit diesen Universal-Bearbeitungszentren wurde ein Maschinentyp entwickelt, der die Produktion mit horizontaler Spindellage und 5-Achs-S<strong>im</strong>ultan-Bearbeitung bei<br />
voller Ausnutzung der Werkzeuglänge in allen Winkellagen, für die perfekte Werkstückqualität, z. B. einer Bohrkrone, ermöglicht. Ob Medizintechnik, Werkzeug- und Formenbau,<br />
Luft- und Raumfahrt, Automotive oder Maschinenbau – die 5-Achs-Universal-Bearbeitungszentren zeichnen sich durch ihre kompakte, zugängliche und energieeffiziente<br />
Bauweise für vielfältigste Einsatzmöglichkeiten aus und sind für jeden Werkstoff bestens geeignet.<br />
Front cover: The development of these universal machining centres introduced a type of machine which enables production with horizontal spindle position and 5-axis s<strong>im</strong>ultan -<br />
eous machining under full utilisation of tool length at all angles for perfect workpiece quality, e.g. of a drill bit. Regardless of whether it involves medical technology, tool and dye<br />
making, aerospace, automotive or machinery construction – thanks to their compact, accessible and energy-efficient construction, these 5-axis universal machining centres<br />
feature an extremely wide range of potential applications and are ideally suited for every material.
Vorwort<br />
Preface<br />
1<br />
<strong>2012</strong> deutlich stärker als erwartet, selbstbewusster Start<br />
ins Geschäftsjahr 2013, Konsolidierung nach zwei strammen<br />
Wachstumsjahren angesagt<br />
<strong>2012</strong> significantly stronger than expected, confident start<br />
in financial year 2013, consolidation anticipated following<br />
two sturdy years of growth<br />
Der Auftragseingang <strong>deutsche</strong>r Hersteller von <strong>Werkzeugmaschinen</strong><br />
legte 2011 weitere 45 % auf ein Rekordvolumen<br />
von 16,9 Mrd. EUR zu. Speziell die Auslandsnachfrage drang<br />
in zuvor nicht denkbare Höhen vor. Mit einem Volumen von<br />
über 15 Mrd. EUR <strong>im</strong> aktuellen Berichtsjahr <strong>2012</strong> wird die<br />
Bestelltätigkeit des starken Basisjahres wertmäßig um 10 %<br />
und damit gegenüber den Anzeichen <strong>im</strong> frühen <strong>Jahr</strong>esverlauf<br />
eher moderat unterschritten. <strong>Die</strong>s entspricht den Erwartungen<br />
des <strong>VDW</strong> und seines Prognosepartners Oxford<br />
Economics nahezu punktgenau. Der Blick auf die wirtschaftsgeografische<br />
Herkunft belegt überraschend eine<br />
stabilere Nachfrageentwicklung aus Europa gegenüber der<br />
aus Asien, wenn auch die Ablösung Europas als wichtigster<br />
Absatzregion, angesichts von aktuell mehr als 40 % Anteil<br />
der asiatischen Märkte am Gesamtvolumen der Auslandsorders,<br />
längst vollzogen ist. Aber: Es bleibt Fakt, dass Europa<br />
mehr als die Eurozone darstellt, weil z. B. Mittel-/Osteuropa<br />
mit Russland an der Spitze ganz erhebliche Masse für<br />
Kompensation einbringt. Das Nachfragevolumen aus Amerika<br />
zeigt unerwartet einen erfreulichen Aufwärtstrend<br />
durch ganz erhebliche Anstrengungen der US-Automobil<strong>industrie</strong><br />
in Bezug auf Fertigungsmodernisierung.<br />
Somit ist Produktionsausweitung in <strong>2012</strong> nur anteilig auf die<br />
Umsetzung von stattlichem, speziell durch den Sonderanlagenbereich<br />
und Projektgeschäft geprägtem Auftragsbestand<br />
aus den Vorperioden angewiesen. Im Quartalsmuster<br />
ist auf sukzessive stärkere Ausbringung <strong>im</strong> Vor jahresverlauf<br />
zu referenzieren. Entsprechend ergeben sich abnehmende<br />
Steigerungsraten <strong>im</strong> Produktionsgeschehen <strong>2012</strong>, die sich<br />
indessen für das gesamte <strong>Jahr</strong> auf 9 % Plus und in der Beschränkung<br />
auf allein den Anlagenwert (ohne Teile und<br />
Zubehör sowie <strong>Die</strong>nstleistungen) sogar auf 10 % Zuwachs<br />
kumulieren. Erzielt wird ein Volumen von 14,1 Mrd. EUR und<br />
damit ein Ergebnis, das sich dichter als zuvor prognostiziert<br />
an den durch Sondereinflüsse realisierbaren Rekordwert<br />
aus 2008 heranschiebt.<br />
Annähernde Querbewegung 2013 vorgezeichnet<br />
Der <strong>VDW</strong> erwartet für das laufende Geschäftsjahr bei Produktion<br />
und Export (<strong>2012</strong>: +20 %!) sehr moderates Wachstumspotenzial<br />
von jeweils rund 1 %. Damit wäre der Anschluss<br />
an die 2008 vorgelegte bisherige Bestmarke <strong>im</strong><br />
Produktions wert sicher hergestellt. Für das Inlandsmarktvolumen<br />
gilt Stagnation als plausibel. <strong>Die</strong> erwartete Querbewegung<br />
<strong>im</strong> Auftragseingang insgesamt wird, bei durch-<br />
In 2011, incoming orders received by German manufacturers<br />
of machine tools increased by another 45% to a record volume<br />
of EUR 16.9 billion. Demand from abroad, in particular, rose<br />
to previously un<strong>im</strong>aginable levels. With a volume of more<br />
than EUR 15 billion in the current reporting year <strong>2012</strong>,<br />
order activity was only down 10% by value on the strong<br />
reference year before it, which was quite moderate in view<br />
of the signs during the early part of the year. This corresponded<br />
almost exactly to the expectations of the <strong>VDW</strong> and<br />
its forecasting partner Oxford Economics. A glance at the<br />
geo-economic origins of those foreign orders surprisingly<br />
confirms a more stable development in demand from Europe<br />
as opposed to that of Asia, even though the Asian market<br />
has already long since eclipsed Europe as the biggest sales<br />
region and currently represents more than 40% of the total<br />
volume of orders from abroad. The fact remains, however,<br />
that Europe comprises more than the eurozone, because<br />
the very considerable weight of Central and Eastern Europe,<br />
for example – led by Russia – compensated for weakness<br />
elsewhere. The volume of demand from America displayed<br />
an unexpectedly encouraging upward trend as a result of<br />
tremendous efforts by the US automotive industry to modernise<br />
their production facilities.<br />
This means that the expansion of production in <strong>2012</strong> was<br />
only partly attributable to finishing the ample order backlog<br />
of the previous period – a backlog in which the special<br />
machinery segment and project business played a particularly<br />
<strong>im</strong>portant role. Each quarter demonstrated successively<br />
stronger export activity over the comparable period of the<br />
previous year. Production activity’s growth rates declined<br />
accordingly in <strong>2012</strong>, nevertheless achieving a cumulative<br />
9% increase for the full year – and even 10% growth when<br />
the machinery value alone is considered (excluding parts,<br />
accessories or services). A volume of EUR 14.1 billion was<br />
achieved, representing a result which came closer than<br />
predicted to the record value of 2008 – a record made possible<br />
only through special circumstances.<br />
Nearly flat growth envisioned in 2013<br />
For the current financial year, the <strong>VDW</strong> expects very moderate<br />
growth potential in production and export (<strong>2012</strong>: +20%!)<br />
of about 1% each. This would certainly suffice to reach the<br />
aforementioned all-t<strong>im</strong>e record production level of 2008.<br />
For the domestic market volume, stagnation is considered<br />
to be a plausible scenario. With consistently weaker de-
2<br />
gängig klar schwächeren Entwicklungen während der<br />
1. <strong>Jahr</strong>eshälfte, durch stabiler bleibende Auslandsorders gestützt.<br />
<strong>Die</strong>se Auslandsnachfrage weist gemäß aktuellsten<br />
Prognosen von <strong>VDW</strong> und Oxford Economics (Stand: April<br />
2013) eine für die derzeitige weltwirtschaftliche Situation<br />
charakteristische Struktur auf: Einbußen in Europa (–8%)<br />
und Amerika (–2%) steht Zuwachs <strong>im</strong> Asiengeschäft gegenüber<br />
(+7%).<br />
velopments clearly evident during the first half of the year,<br />
the expected flat growth in incoming orders overall will be<br />
buttressed by continuing more stable orders from abroad.<br />
According to the latest forecasts from the <strong>VDW</strong> and Oxford<br />
Economics (as at April 2013), the structure of that foreign<br />
demand will be characteristic of the current global economic<br />
situation: Declines in Europe (-8%) and America ( 2%) will<br />
contrast with growth in Asian business (+7%).<br />
Programmstruktur und regionale Verteilung der<br />
Nachfrage sind Assets der <strong>deutsche</strong>n <strong>Werkzeugmaschinen</strong><strong>industrie</strong><br />
Programme structure and the regional distribution<br />
of demand are assets of the German machine tool<br />
industry<br />
<strong>Die</strong> in den Schwellenländern, hier insbesondere in China,<br />
zu erwartende Hinwendung zu höherwertigen, potenziell<br />
exportfähigen Erzeugnissen wird den Anspruch an Fertigungstechnologie<br />
nach oben verschieben und damit <strong>deutsche</strong>n<br />
Herstellern gute Chancen bieten, am veränderten<br />
Beschaffungsverhalten überproportional zu profitieren.<br />
It is likely that emerging countries, and especially China, will<br />
become increasingly oriented towards higher quality products<br />
which are potentially suitable for export. This will, in turn,<br />
raise the demands on manufacturing technology, thereby<br />
offering German manufacturers good opportunities to benefit<br />
disproportionately from the new procurement practices.<br />
Während nämlich knapp die Hälfte des Produktionsvolumens<br />
der <strong>deutsche</strong>n <strong>Werkzeugmaschinen</strong><strong>industrie</strong> auf nachgefragte<br />
Sonderlösungen und Projekte entfällt, bedient die<br />
internationale Konkurrenz lediglich mit einem Wertanteil<br />
von etwa 30 % Auftragsvolumina derartigen Zuschnitts.<br />
Günstig sollte sich auch die Zusammensetzung der Auslands<br />
orders <strong>deutsche</strong>r Hersteller nach Herkunftsregionen<br />
auswir ken. <strong>Die</strong>s infolge des weiter wachsenden Gewichts<br />
asiatisch er Märkte, wo in aller Regel auch während schwächerer<br />
Phasen deutlich geringer erforderliche Abstriche am<br />
<strong>Werkzeugmaschinen</strong>verbrauch zu erwarten sind. Ganz<br />
abgesehen von der mittlerweile auf fast 20 % Teilhabe am<br />
gesamten Nachfragevolumen der Branche in Deutschland<br />
angestiegenen Nachfrage aus Amerika.<br />
<strong>Die</strong> vorliegende Publikation will sachlich unterrichten und<br />
aktuell diskutierte Branchenentwicklungen aufgreifen.<br />
Rea listisch in den geschilderten Erwartungen und unabhängig<br />
davon, ob der Berichtszeitraum attraktive Wachstumsraten<br />
bietet oder nicht. Als Zielgruppe sieht der<br />
<strong>VDW</strong> vor nehm lich Entscheider aus der Politik, <strong>im</strong> Bankenbereich,<br />
auf Gewerkschaftsebene, in der Presselandschaft<br />
oder in Forschung und Lehre. <strong>Die</strong> vom <strong>VDW</strong> regelmäßig<br />
überarbeitete und in verschiedener Hinsicht begründet von<br />
anderen Quellen abweichende Weltmarktbetrachtung bildet<br />
traditionell einen Schwerpunkt dieser 1998 begonnenen<br />
Schriftenreihe.<br />
Frankfurt am Main, April 2013<br />
Verein Deutscher <strong>Werkzeugmaschinen</strong>fabriken e. V. (<strong>VDW</strong>)<br />
Bereich Wirtschaft und Statistik<br />
While made-to-order special solutions and projects represent<br />
nearly half of the production volume of the German machine<br />
tool industry, its international competitors dedicate only<br />
about 30% of their order volume to customisation of this type.<br />
Beneficial effects are also likely to emerge from the composition<br />
of German manufacturers’ portfolio of foreign orders<br />
according to their region of origin. This as a consequence of<br />
the continued increase in the <strong>im</strong>portance of Asian markets,<br />
where, as a general rule, industry can be expected to require<br />
far less drastic cuts in machine tool consumption even during<br />
weaker phases. To say nothing of America’s share of the<br />
demand – a share which has meanwhile risen to nearly<br />
20% of Germany’s total demand volume in the industry.<br />
This publication a<strong>im</strong>s to provide matter-of-fact analyses and<br />
consider industry trends of topical interest realistically within<br />
the expectations described and regardless of whether or<br />
not the reporting period offers attractive growth rates. The<br />
<strong>VDW</strong> considers its target audience to comprise mainly<br />
decision-makers from politics, the banking sector, at trade<br />
union level, in the media landscape and in research and<br />
teaching. The <strong>VDW</strong>’s regularly revised view of the world<br />
market, which differs from ones based on other sources in<br />
various respects, represents a traditional focal point of this<br />
series of publications started in 1998.<br />
Frankfurt am Main, April 2013<br />
German Machine Tool Builders’ Association<br />
Economy and Statistics Division
Leitmarkt XXXChina<br />
XXX<br />
Leading market China<br />
3<br />
Bearbeitung einer Schneidwalze für die Verpackungs<strong>industrie</strong>, gefertigt auf einem vertikalen 5-Achsen-Bearbeitungszentrum mit<br />
automatischem Gegenhalter. <strong>Die</strong> Schneidwalze, die bereits auf 60 HRC gehärtet ist, wird mehrachsig in höchster Präzision bearbeitet,<br />
sodass eine Schneidgeometrie auf der Walze entsteht, welche später rotativ Verpackungen aus einem Papierbogen schneidet.<br />
Machining of a cutting drum for the packaging industry, fabricated on a vertical 5-axis machining centre with an automatic arbour holder.<br />
The cutting drum, which has already been hardened to 60 HRC, is being machined along multiple axes with extremely high precision, in<br />
order to create a cutting geometry on the drum which will later be used to cut packaging from a sheet of paper.
4<br />
Leitmarkt China bestätigt höchsten Stellenwert, <strong>VDW</strong><br />
unterstützt Branche mit klar fokussierten <strong>Die</strong>nstleistungen<br />
Leading market China confirms its pre-eminence,<br />
<strong>VDW</strong> supports the industry with clearly focussed services<br />
Gemessen an Zahlen und Fakten für die Einfuhr sowie den<br />
Verbrauch von <strong>Werkzeugmaschinen</strong> distanziert China den<br />
„Rest“ der Welt, obwohl der <strong>VDW</strong> amtliche chinesische Produktions-<br />
und Außenhandelsdaten bereinigt, und zwar von<br />
artfremden Erzeugnissen und Maschinen sehr einfacher<br />
Machart, die keinen <strong>industrie</strong>llen Standard verkörpern.<br />
Einbezogen ist das komplette Spektrum der NC-Anlagen<br />
sowie etwa ein Drittel der höherpreisigen konventionellen<br />
Maschinen. <strong>Die</strong>se sachlich begründeten, <strong>im</strong> Zeitablauf<br />
nachvollziehbaren und regelmäßig überprüften Abschläge<br />
sind, gemeinsam mit notwendigen Modifikationen für<br />
weitere Herstellerländer, ein Alleinstellungsmerkmal der<br />
<strong>VDW</strong>-Statistik und ermöglichen erst einen sinnvollen<br />
Nationenvergleich <strong>im</strong> Weltmaßstab.<br />
Gemäß dieser Vorgehensweise ergibt sich für China <strong>im</strong> <strong>Jahr</strong><br />
<strong>2012</strong> ein enormer <strong>Werkzeugmaschinen</strong>verbrauch in Höhe<br />
von rund 23,9 Mrd. EUR. <strong>Die</strong> Aufnahmefähigkeit des Marktes<br />
steigt in dieser Betrachtungsweise somit um 7 % bzw.<br />
sinkt um 1 % auf Basis nationaler Währung. Der Anteil am<br />
weltweiten Verbrauch steigt auf glatt 36 %, moderat über<br />
der Partizipation <strong>im</strong> Vorjahr 2011. <strong>Die</strong> Eigenproduktion<br />
Chinas wächst um 6 % auf 14,6 Mrd. EUR an, auf Renminbi-Basis<br />
ergibt sich ein Minus von 3 %. Zum aktuell frühen<br />
Zeitpunkt verstehen sich die vorstehenden Volumina und<br />
Veränderungs raten noch als vorläufige Resultate.<br />
As measured by facts and figures for both the <strong>im</strong>portation<br />
and the consumption of machine tools, China extended its<br />
lead over the “rest” of the world, even though the <strong>VDW</strong> adjusts<br />
official Chinese production and export data by excluding<br />
unrelated products and very s<strong>im</strong>ple machines which<br />
do not represent any industrial standard. It does take the<br />
full spectrum of NC machinery into consideration along<br />
with about one third of the higher priced conventional<br />
machines. In combination with the necessary modifications<br />
for other manufacturing countries, those factually justified<br />
exclusions – which make sense when viewed from a chronological<br />
perspective and which are regularly reviewed –<br />
are a unique selling point of the <strong>VDW</strong> statistics, and any<br />
meaningful comparison among countries on a global scale<br />
would also be <strong>im</strong>possible without them.<br />
Applying this methodology results in a huge machine tool<br />
consumption for China in <strong>2012</strong> of about EUR 23.9 billion.<br />
So when viewed in this way, the absorption capacity of the<br />
market increased by 7% and fell by 1% based on local currency.<br />
The share of worldwide consumption increased to an even<br />
36%, slightly above the level of the previous year. China’s<br />
own production grew by 6% to EUR 14.6 billion, which represented<br />
a 3% decline on a renminbi basis. At this present,<br />
early stage, the volumes and differentials listed above are<br />
prel<strong>im</strong>inary results which are still subject to change.<br />
<strong>Die</strong> Partizipation <strong>deutsche</strong>r <strong>Werkzeugmaschinen</strong>hersteller<br />
am Marktgeschehen <strong>2012</strong> in China ist mit einem Exportvolumen<br />
von 2,6 Mrd. EUR, 13 % Steigerungssatz gegenüber<br />
Vorjahr (+34%!) und einem Anteil an der gesamten<br />
<strong>deutsche</strong>n <strong>Werkzeugmaschinen</strong>ausfuhr von über 27 %<br />
beeindruckend. Der Auftragseingang <strong>2012</strong> mit Herkunft<br />
aus China signalisiert <strong>im</strong> Rahmen der entsprechenden<br />
<strong>VDW</strong>-Eigenerhebung eine Abschwächung der chinesischen<br />
Konjunktur sowie der Investitionsneigung, insbesondere<br />
<strong>im</strong> chinesischen Mittelstand. <strong>Die</strong>s ausgehend von verschärften<br />
Kreditkonditionen. Hinzu tritt vorsichtige Zurückhaltung<br />
mit Blick auf die noch unklaren politischen Machtverhältnisse.<br />
Naturgemäß ist der Auftragseingang durch<br />
deutlich zyklischeren Verlauf gegenüber der realisierten<br />
Ausfuhr geprägt, weil die Realisierung von Bestellungen <strong>im</strong><br />
Umsatz, gerade hinsichtlich kundenspezifischer Sonderanlagen<br />
und <strong>im</strong> Projektgeschäft, phasenversetzt erfolgt.<br />
With an export volume of EUR 2.6 billion, a 13% rate of increase<br />
over the previous year (+34%!) and a more than 27%<br />
share of the entire German machine tool exports, the participation<br />
of German machine tool manufacturers in China’s<br />
market activity in <strong>2012</strong> was <strong>im</strong>pressive. Incoming orders<br />
originating from China in <strong>2012</strong> signalled, within the framework<br />
of the corresponding <strong>VDW</strong> survey, a weakening both<br />
of the Chinese economy and of the willingness to invest,<br />
especially amongst China’s small and medium-sized companies.<br />
This was the result of tightened credit conditions.<br />
Prudent reserve regarding the still uncertain balance of<br />
power in the political arena also played a role. Incoming<br />
orders are clearly more cyclical than exports actually posted,<br />
of course, because there is a phase shift in the transformation<br />
of orders into turnover – particularly with regard to customer-specific<br />
special machines and in the project business.
Leitmarkt China<br />
Leading market China<br />
5<br />
Verband reagiert mit umfassendem Maßnahmenbündel<br />
Association reacts with a comprehensive package<br />
of measures<br />
Hierbei sind vier Kategorien <strong>im</strong> <strong>Die</strong>nstleistungsspektrum<br />
zu unterscheiden, nämlich:<br />
A distinction must be drawn here among four categories in<br />
the service spectrum:<br />
Klassische Hilfestellung durch Beantragung geförderter<br />
Firmengemeinschaftsbeteiligungen auf wichtigen chinesischen<br />
Messen, wie der mit weitem Abstand marktführenden<br />
China International Machine Tool Exhibition CIMT in<br />
Peking oder der Metalworking and CNC Machine Tool Show<br />
MWCS in Shanghai, die sich speziell <strong>im</strong> Bereich der Blechbearbeitung<br />
profiliert hat. In beiden Fällen stellt Deutschland<br />
die größten ausländischen Beteiligungen.<br />
Regional differenzierte Unterstützung durch verstärkte<br />
Ausleuchtung von <strong>industrie</strong>llen Ballungsräumen anhand<br />
von Technologiesymposien für Kunden und potenzielle<br />
Anwender. Exemplarisch hat der Fokus in <strong>2012</strong> auf den<br />
Regionen Wuhan, Guangzhou und Chongqing gelegen.<br />
Nachhaltige Unterstützung durch ein <strong>VDW</strong>-Verbindungsbüro<br />
in Shanghai, <strong>im</strong> Sinne einer Beteiligung mit eigener<br />
personeller Kapazität an der dortigen, gut eingeführten<br />
VDMA-Repräsentanz. Erklärtes Ziel ist hier beschleunigte<br />
Verfügbarkeit von Information über forschungs-, innovations-<br />
und handelspolitische Maßnahmen der Zentralregie -<br />
r ung und deren Umsetzung durch Provinzverwaltungen.<br />
Ebenso wie die Erschließung neuer und möglichst aktueller<br />
Daten durch qualifizierte Übersetzung originalsprachiger<br />
Quellen. Ferner die Förderung von Netzwerk-Bildung durch<br />
regelmäßige Treffen mit Führungskräften aus den chinesischen<br />
Niederlassungen der Mitgliedsunternehmen, inzwischen<br />
eingeführt als „China Machine Tool Management<br />
Meetings“. Zugang hinsichtlich dieses Gremiums besteht<br />
ausschließlich für die lokale Führungsetage <strong>im</strong> Verbund der<br />
innerhalb des <strong>VDW</strong> organisierten Unternehmensgruppen.<br />
Themen sind die Diskussion über Plausibilität monatlich<br />
verfügbarer amtlicher chinesischer Produktionsdaten und<br />
die tatsächliche Umsatzentwicklung bei lokalem Wettbewerb<br />
und deren Kundschaft. Ferner die Inanspruchnahme<br />
lokaler Finanzierer mit Schwerpunkt Leasinggeschäft, Personalqualifizierung<br />
und Personalbindung sowie erhöhte<br />
Transparenz der lokalen Beschaffungsmärkte oder die<br />
zunehmend fraktionierte chinesische Messelandschaft.<br />
Schließlich entstehen <strong>im</strong> Verbindungsbüro vierteljährliche<br />
Newsletter und Reports zu ausgewählten Anwenderbranchen,<br />
wie der Automobil<strong>industrie</strong>, dem Windkraft-Sektor<br />
oder dem Schienenfahrzeugbau, sowie zu Marktchancen<br />
in noch weniger intensiv bearbeiteten Provinzen, wie<br />
Classic assistance through the submission of applications<br />
on behalf of government-subsidised joint company participa -<br />
tions to exhibit at major Chinese trade fairs, such as the China<br />
International Machine Tool Exhibition CIMT in Beijing (which<br />
was once again the leading trade fair by far) or the Metalworking<br />
and CNC Machine Tool Show MWCS in Shanghai<br />
(which has specialised in the area of sheet-metal machining).<br />
In both cases, Germany represents the largest share of<br />
foreign participation.<br />
Regionally differentiated support through intensified highlighting<br />
of industrial conurbations by means of technology<br />
symposia for customers and potential users. In <strong>2012</strong>, for<br />
example, the focus was on the regions Wuhan, Guangzhou<br />
and Chongqing.<br />
Sustained support through a <strong>VDW</strong> liaison office in Shanghai,<br />
in the form of participation with its own personnel resources<br />
in the local, well-established VDMA branch office there.<br />
The declared objective here is the accelerated availability<br />
of information on research, innovation and trade policy<br />
measures of the central government and their <strong>im</strong>plementation<br />
by provincial administrations. It also includes the<br />
collection of the new information which is as up-to-date<br />
as possible through qualified translation of sources in the<br />
original language. Furthermore, the promotion of network<br />
formation through regular meetings with managers from<br />
the Chinese subsidiaries of member companies, meanwhile<br />
established as “China Machine Tool Management Meetings”.<br />
Access relative to this body is open exclusively to local upper<br />
management ranks in conjunction with the corporate<br />
groups organised within the <strong>VDW</strong>. Topics include the discussion<br />
of the plausibility of official Chinese production<br />
data which are provided on a monthly basis and the actual<br />
change in turnover amongst local competitors and their<br />
clientele. Moreover, the use of local financers with a focus<br />
on leasing business, personnel qualification and personnel<br />
retention along with heightened transparency of local<br />
procurement markets or the increasingly fractionated Chinese<br />
trade fair landscape. And finally, the liaison office<br />
publishes a quarterly newsletter and reports on selected<br />
user branches such as the automotive industry, the wind<br />
power sector and rail vehicle construction, along with market<br />
opportunities in provinces which remain less intensively
6<br />
Zhejiang, Shandong und Yunnan. In Planung befinden sich<br />
Ausarbeitungen für die Medizintechnik sowie die Regionen<br />
Sechuan und Chongqing.<br />
developed such as Zhejiang, Shandong and Yunnan. Planning<br />
is currently underway for reports examining medical<br />
technology and the regions Sichuan and Chongqing.<br />
Zukunftsorientierte Unterstützung durch Initiierung einer<br />
breit angelegten Untersuchung zur technologischen Wettbewerbsfähigkeit<br />
des chinesischen <strong>Werkzeugmaschinen</strong>baus.<br />
Im Mittelpunkt der Studie stehen neben dem „Scre ening“<br />
führender chinesischer Hersteller eine Vielzahl von Interviews<br />
mit ausgewählten chinesischen Werkzeugmaschi -<br />
nenanwendern sowie bedeutenden chinesischen und für<br />
die Entwicklung der <strong>Werkzeugmaschinen</strong>produktion relevanten<br />
Zulieferern von Systemkomponenten. Anhand konkreter<br />
Technologiemerkmale, fungierend als Differenzierungs<br />
kri terien zwischen lokaler Fertigung und eingeführter<br />
Hoch technologie, soll der aktuelle Status chinesischer Eigenproduktion<br />
definiert und der Versuch unternommen<br />
werden, das Tempo der Fortentwicklung realistisch abzuschätzen.<br />
Schließlich sieht sich der <strong>VDW</strong> beständig als Mahner, was<br />
die zunehmende Verlagerung der weltweiten <strong>Werkzeugmaschinen</strong>nachfrage<br />
in den asiatisch-pazifischen Raum<br />
angeht. Im Mittelpunkt steht die vom Verband geforderte<br />
Auseinandersetzung mit der Frage, wie sich ein entspre -<br />
chend hoher Anteil <strong>deutsche</strong>r Technologie an der zweifelsfrei<br />
expandierenden Entwicklung weltweiter Aufnahmefähigkeit<br />
für <strong>Werkzeugmaschinen</strong> bewerkstelligen lässt. Insbesondere<br />
aus der Sicht mittelständischer Unternehmen geht es<br />
dabei um lokale Wertschöpfung in den neuen Wachstumszentren,<br />
um die Qualifizierung dortiger Belegschaften sowie<br />
die Erschließung notwendiger Quellen für Beschaffung vor<br />
Ort.<br />
Future-oriented support through the initiation of a broadbased<br />
examination of the technological competitiveness of<br />
the Chinese machine tool industry. Along with screening<br />
the leading Chinese manufacturers, the study focuses on a<br />
large number of interviews with selected Chinese machine<br />
tool users and major Chinese suppliers of system components<br />
which are also of relevance to the development of<br />
machine tool production. Using specific technology features<br />
to serve as differentiation criteria between local manufacturing<br />
and <strong>im</strong>ported high technology, the current status of<br />
China’s own production will be defined and an attempt will<br />
be made to generate a realistic est<strong>im</strong>ate of the rate of<br />
conti nued development.<br />
Ult<strong>im</strong>ately the <strong>VDW</strong> senses a perennial duty to sound a note<br />
of warning with regard to the increasing shift of worldwide<br />
machine tool demand to the Asia-Pacific region. The association<br />
has promoted examination of the question at the core<br />
of this issue, namely: how to achieve a correspondingly high<br />
share of German technology with the undeniably expanding<br />
development of worldwide adsorption capacity for machine<br />
tools? Especially from the perspective of small and mediumsized<br />
companies, this involves local value creation in the new<br />
growth centres, qualification of staff located there, and development<br />
of the necessary sources for local procurement.
Aktuelle Situation und Perspektiven<br />
XXX<br />
XXX<br />
Current situation and perspectives<br />
7<br />
Komplettbearbeitung (Drehen, Fräsen, Bohren, Reiben) von Getriebedeckeln auf einer zweispindligen Pick-up-Vertikaldrehmaschine.<br />
<strong>Die</strong>se Drehmaschine benötigt keine separate Be-/Entladeeinrichtung, da die verfahrbare Arbeitsspindel die Werkstücke <strong>im</strong> sogenannten<br />
„Pick-up“-Verfahren von einem Transportband holt und zur Bearbeitung in den Arbeitsraum bringt. <strong>Die</strong> unterschiedlichen<br />
Getriebe deckel mit einem max<strong>im</strong>alen Durchmesser von 630 mm werden in landwirtschaftlichen Nutzfahrzeugen eingesetzt.<br />
Complete machining (turning, milling, drilling, grinding) of gearbox covers on a two-spindle pick-up vertical turning machine. This turn ing<br />
machine needs no separate loading / unloading unit, because the moveable spindle retrieves the workpieces from a conveyor belt and<br />
brings them into the workspace for machining by means of the so-called “pick-up” process. The different gearbox covers with diameters of<br />
up to 630 mm are used in agricultural vehicles.
8<br />
Bestellungen <strong>im</strong> Referenzjahr 2011 stoßen in historisch<br />
einmalige D<strong>im</strong>ensionen vor<br />
Orders in reference year 2011 take on uniquely historic<br />
d<strong>im</strong>ensions<br />
Der Auftragseingang <strong>deutsche</strong>r <strong>Werkzeugmaschinen</strong>hersteller<br />
legte <strong>im</strong> <strong>Jahr</strong>esverlauf, nach regelrechter Aufholjagd<br />
2010 (+87%), weitere 45 % auf ein Volumen von spektakulären<br />
16,9 Mrd. EUR zu! Das bislang als einsamer Nachfrage-<br />
Gipfel betrachtete und nur dank verschiedener Sondereinflüsse<br />
realisierbare Ergebnis 2007 wurde souverän übertroffen.<br />
After the relentless catch-up race of 2010 (+87%), German<br />
machine tool manufacturers’ incoming orders increased by<br />
another 45%, attaining the spectacular volume of EUR 16.9<br />
billion! Previously considered as a unique peak in demand<br />
and only achievable due to a variety of special circumstances,<br />
the 2007 result was exceeded by a comfortable margin.<br />
<strong>Die</strong> Differenzierung der Bestelltätigkeit nach Inlands- und<br />
Auslandsorders unterstreicht trotz ähnlicher prozentualer<br />
Wachstumsbeiträge zuvor nicht denkbare Höhen in der<br />
Auslandsnachfrage (11,3 Mrd. EUR), selbst gegenüber extremer<br />
Ausweitung in 2007. Man distanzierte diese Referenz<br />
mit mehr als 2 Mrd. EUR Abstand. <strong>Die</strong> Inlandskomponente<br />
der Nachfrage 2011 steuerte <strong>im</strong> Volumen knapp 5,6 Mrd.<br />
EUR bei und hielt mit reichlich 1 Mrd. EUR Unterdeckung<br />
doch deutlichen Abstand zum bereits erwähnten Vergleichsmaßstab<br />
2007.<br />
Mit Blick auf drei expansiv wirkende Aspekte, nämlich die<br />
schon 2010 wieder erreichte Fertigungseffizienz auf hohem<br />
Vor-Krisen-Stand, die Verfügbarkeit eines stattlichen Auftragspolsters<br />
als Folge der bereits 2010 rapide angeschwollenen<br />
Nachfrage sowie der fortgesetzt florierende laufende<br />
Auftragseingang, verwundert es kaum, dass auch die Produktionsleistung<br />
2011 rasch an Tempo zulegte. <strong>Die</strong>s mit<br />
Zuwächsen von 36 % <strong>im</strong> 1. Halbjahr (+41% für <strong>Werkzeugmaschinen</strong><br />
„netto“, ohne Teile und Zubehör sowie <strong>Die</strong>nstleistungen)<br />
und 31 % über den gesamten <strong>Jahr</strong>esverlauf<br />
(<strong>Werkzeugmaschinen</strong> alleine +34 %) auf leicht über 12,9<br />
Mrd. EUR.<br />
Der <strong>Werkzeugmaschinen</strong>export, traditionelle Paradedisziplin<br />
der Branche in Deutschland, übertraf 2011 den Vorjahreswert<br />
um 31 % und stieg auf über 7,9 Mrd. EUR an. In der Verteilung<br />
entscheidender Absatzräume näherten sich die dominie -<br />
renden Wirtschaftsblöcke in großen Schritten an. Hinsichtlich<br />
der Anteile am gesamten Ausfuhrvolumen standen<br />
sich Europa und Asien mit knapp 43 % bzw. über 41 % auf<br />
Augenhöhe gegenüber.<br />
Im Gegensatz zur noch geschwächten Verfassung 2010<br />
sprang der Inlandsverbrauch 2011 mit 37 % Plus auf mehr<br />
als 6,7 Mrd. EUR massiv an. Parallel hierzu legte auch der<br />
<strong>deutsche</strong> <strong>Werkzeugmaschinen</strong><strong>im</strong>port mit 2,8 Mrd. EUR<br />
Volumen sogar überproportional zu, wobei aber Lieferverflechtungen<br />
<strong>deutsche</strong>r Führungsgesellschaften mit Auslandstöchtern<br />
oder die Drehscheibenfunktion des<br />
Despite very s<strong>im</strong>ilar percentage growth rates, the differentiation<br />
of order activity according to domestic and foreign<br />
orders underscores the previously unthinkable scale of<br />
foreign demand (EUR 11.3 billion), even by comparison<br />
with the huge expansion experienced in 2007. That bench -<br />
mark was out-distanced by more than EUR 2 billion. The<br />
domestic component of demand contributed a volume of<br />
nearly EUR 5.6 billion in 2011, finishing a full EUR 1 billion<br />
ahead of the aforementioned 2007 benchmark.<br />
In view of three expansion factors – namely, the re-esta b-<br />
lishment of the high pre-crisis level of manufacturing efficiency<br />
even by 2010, the availability of a full order buffer as<br />
a consequence of the rapidly burgeoning demand already<br />
in 2010, and the flow of incoming orders which continued<br />
to flourish – it was hardly any wonder that the rate of production<br />
output increased dramatically in 2011. It did so<br />
with increases of 36% in the first half of the year (+41% for<br />
machine tools “net” without parts and accessories or services)<br />
and 31% over the entire course of the year (machine<br />
tools alone: +34%) to slightly more than EUR 12.9 billion.<br />
Machine tool exports, the traditional flagship of the sector<br />
in Germany, exceeded the previous year’s value by 31% in<br />
2011, rising to more than EUR 7.9 billion. Among the key<br />
sales regions, the dominant economic blocks rapidly converged<br />
towards parity: Regarding their shares of the total<br />
export volume, Europe and Asia stood neck and neck with<br />
nearly 43% and 41%, respectively.<br />
Unlike its still subdued performance in 2010, domestic consumption<br />
vaulted ahead in 2011, with a 37% increase to<br />
more than EUR 6.7 billion. At the same t<strong>im</strong>e, the volume<br />
of German machine tool <strong>im</strong>ports also grew at a disproportionately<br />
high rate with EUR 2.8 billion, whereby supply<br />
link-ups between leading German companies and their<br />
local subsidiaries abroad or the hub function of specialist<br />
trade (re-export) played a major role. In keeping with the<br />
traditional structure, European competitors covered a large<br />
part of the <strong>im</strong>port volume (more than 68%), whereby it is
Situation/Perspektiven<br />
Situation/Perspectives<br />
9<br />
Auftragseingang der <strong>deutsche</strong>n <strong>Werkzeugmaschinen</strong><strong>industrie</strong><br />
Order intake of the German machine tool industry<br />
3-Monats-Durchschnitte: %-Veränderung zum Vorjahr (nominal)<br />
3 monthly averages: %-change to previous year (nominal)<br />
140<br />
%<br />
120<br />
100<br />
80<br />
60<br />
40<br />
20<br />
0<br />
-20<br />
-40<br />
-60<br />
-80<br />
03 04 05 06 07 08 09 10 11 12<br />
Quelle: VDMA<br />
Source: VDMA<br />
Fachhandels (Re-Export) eine wesentliche Rolle spielen. Der<br />
traditionellen Struktur folgend, deckten europäische Wettbewerber<br />
mit über 68 % einen Großteil des Einfuhrvolumens<br />
ab, wobei erneut der Hinweis auf die zuvor adressierten<br />
Verflechtungen innerhalb <strong>deutsche</strong>r Unternehmensgruppen<br />
angebracht ist.<br />
Im Dezember 2011 lag die Anzahl der Beschäftigten <strong>im</strong><br />
<strong>Werkzeugmaschinen</strong>bau am Standort Deutschland mit<br />
rund 67.800 Personen um gut 6 % über <strong>Jahr</strong>esendstand<br />
2010. Hatte der Auslastungsgrad der Kapazitäten <strong>im</strong> Oktober<br />
2010 noch bei 86 % gelegen, standen <strong>im</strong> gleichen Monat<br />
des aktuellen Referenzjahres 2011 fast 89 % zu Buche. Erwartungsgemäß<br />
notierte auch der Auftragsbestand mit<br />
ähnlicher Tendenz: Dem Niveau von fast 8 Monaten Reichweite<br />
<strong>im</strong> Oktober 2010 standen zum gleichen Zeitpunkt<br />
2011 hervorragende 9,5 Monate gegenüber.<br />
appropriate to call attention once again to the previously<br />
addressed supply link-ups within German corporate groups.<br />
In December 2011, the number of employees in machine<br />
tool construction in Germany (about 67,800 people) was a<br />
full 6% above the 2010 year-end level. Whilst the utilisation<br />
of capacities was still 86% in October of 2010, the industry<br />
posted nearly 89% utilisation in the same month of the<br />
current reference year of 2011. As expected, the order backlog<br />
also demonstrated a s<strong>im</strong>ilar tendency: By comparison,<br />
with a range of nearly 8 months in October 2010, the level<br />
had reached an outstanding 9.5 months by the same t<strong>im</strong>e<br />
in 2011.<br />
Demand growth in <strong>2012</strong> stabler than expected despite<br />
renewed tensions in the eurozone and a spreading sense<br />
of global economic gloom<br />
Nachfrageentwicklung <strong>2012</strong> trotz erneuter Spannungen in<br />
der Eurozone und weltwirtschaftlicher Eintrübung stabiler<br />
als erwartet<br />
<strong>Die</strong> Produktionsausweitung <strong>2012</strong> ist nur anteilig auf Umsetz<br />
ung von Auftragsbestand aus dem Vorjahr angewiesen. Mit<br />
einem Auftragseingangsvolumen <strong>2012</strong> von über 15,1 Mrd.<br />
EUR wird das Ergebnis der „Springflut“ in der Bestelltätigkeit<br />
2011 wertmäßig um 10 % und damit gegenüber den<br />
The expansion of production output in <strong>2012</strong> is only partly<br />
attributable to realisation of the order backlog from the<br />
previous year. With an incoming order volume of more than<br />
EUR 15.1 billion in <strong>2012</strong>, the result of the “flood tide” in order<br />
activity in 2011 amounted to 10%, actually falling mode -<br />
rat ely short of indications at the early part of the year. The<br />
annual balance sheet shows that domestic and foreign<br />
orders changed almost in lock step. The overall evolution<br />
matched the expectations of the <strong>VDW</strong> and its prognosis
10<br />
Kapazitätsauslastung und Auftragsbestand der <strong>deutsche</strong>n <strong>Werkzeugmaschinen</strong><strong>industrie</strong><br />
Capacity utilization and order backlog of the German machine tool industry<br />
Kapazitätsauslastung (%)*<br />
Capacity utilization (%)*<br />
100<br />
Auftragsbestand (Monate)<br />
Order backlog (months)<br />
10<br />
95<br />
9<br />
90<br />
85<br />
8<br />
80<br />
7<br />
75<br />
6<br />
70<br />
65<br />
5<br />
60<br />
03 04 05 06 07 08 09<br />
10 11 12<br />
4<br />
03 04 05 06 07 08 09<br />
10 11 12<br />
* Okt. 12 = 93,3 %,<br />
Jan. 13 = 92,4 %<br />
Quellen: Ifo-Institut, VDMA<br />
* Oct. 12 = 93.3%,<br />
Jan. 13 = 92.4%<br />
Sources: Ifo institute, VDMA<br />
Anzeichen <strong>im</strong> frühen <strong>Jahr</strong>esverlauf eher moderat unterschritten.<br />
Inlands- und Auslandsorders verändern sich in<br />
der <strong>Jahr</strong>esbilanz annähernd <strong>im</strong> Gleichschritt. <strong>Die</strong> Gesamtentwicklung<br />
entspricht fast punktgenau den Erwartungen<br />
des <strong>VDW</strong> und seines Prognosepartners Oxford Economics,<br />
London. Das Quartalsmuster der Nachfrage zeigt – mit<br />
wechselndem Besorgnisgrad über die konjunkturelle Großwetterlage<br />
in Europa und darüber hinaus – für die 1. <strong>Jahr</strong>es -<br />
hälfte <strong>2012</strong> noch 13 % Minus, zurückgehend auf Abstriche<br />
von 7 % <strong>im</strong> 1. Vierteljahr und 20 % <strong>im</strong> 2. Quartal, einem<br />
offenkundigen Tiefpunkt der ökonomischen St<strong>im</strong>mungslage.<br />
Demgegenüber kommt es <strong>im</strong> 3. Vierteljahr sowie <strong>im</strong> Schluss -<br />
quartal mit 4 % und schließlich 9 % Minus zu einer neuerlichen<br />
Konsolidierung.<br />
<strong>Die</strong> wertmäßige Unterscheidung des Auftragseingangs <strong>2012</strong><br />
nach Inlands- und Auslandsbestellungen ergibt rund 10,1<br />
Mrd. EUR an Auslandsnachfrage, erneut und damit zum<br />
zweiten Mal nach 2011 deutlich (um 850 Mio. EUR) über Niveau<br />
2007. Aufträge aus dem Inland erreichen ein speziell<br />
während des 2. Halbjahres nachgebendes Volumen von 5,0<br />
Mrd. EUR und bleiben somit signifikant (um 1,7 Mrd. EUR)<br />
hinter dem Resultat der Bewertungsbasis 2007 zurück.<br />
<strong>Die</strong> Differenzierung nach wirtschaftsgeografischen Regionen<br />
unterstreicht <strong>2012</strong> eine stabilere Entwicklung der<br />
Nachfrage aus Europa (–10%) gegenüber der aus Asien<br />
partner Oxford Economics, London, almost exactly. The<br />
quarterly pattern of demand shows – with a changing<br />
degree of concern for the overall economic situation in<br />
Europe and beyond – still 13% less in the first half of <strong>2012</strong><br />
as a result of a 7% downturn in the first quarter and a<br />
20% downturn in the second quarter, which represented<br />
a clear low-point in the economic mood. Those figures<br />
contrast with a renewed consolidation in the third quarter<br />
and ult<strong>im</strong>ately in the final quarter with 4% and 9% decreases,<br />
respectively.<br />
Differentiating the value of incoming orders in <strong>2012</strong> according<br />
to domestic and foreign orders shows about EUR 10.1 billion<br />
in foreign demand – which was once again (and for the se c -<br />
ond t<strong>im</strong>e since 2011) well above the 2007 level, ex ceeding<br />
the latter by EUR 850 million. Orders from abroad weakened,<br />
especially in the second half of the year, attaining a volume<br />
of EUR 5.0 billion, thereby lagging significantly behind (by<br />
EUR 1.7 billion) the result of the 2007 benchmark.<br />
When broken down according to geo-economic regions, <strong>2012</strong><br />
underscores stabler development of demand from Europe<br />
(-10%) than from Asia (-24%). Europe had been eclipsed as<br />
the biggest sales region (a full 39% share based on total<br />
foreign orders) already in 2011, however, which remained<br />
the case given the Asian markets’ current participation of<br />
more than 40%. With a 10% increase, the demand volume
Situation/Perspektiven<br />
Situation/Perspectives<br />
11<br />
Wichtige Zahlen der <strong>deutsche</strong>n <strong>Werkzeugmaschinen</strong><strong>industrie</strong><br />
Key figures of the German machine tool industry<br />
Mrd. EUR Bill. EUR %-Veränderung %-Change<br />
2008 2009 2010 2011 <strong>2012</strong> 2010/09 2011/10 <strong>2012</strong>/11<br />
Produktion Production 14,2 10,2 9,9 12,9 14,1 –3 +31 +9<br />
Spanende Maschinen Cutting machines 8,2 5,6 5,1 7,0 7,8 –10 +38 +12<br />
Umformende Maschinen Forming machines 2,5 2,1 2,1 2,6 2,8 –2 +25 +6<br />
Teile, Zubehör Parts, accessories 2,5 1,6 1,9 2,3 2,4 +14 +22 +5<br />
Installationen, Reparaturen etc. Installation, repairs etc. 0,9 0,8 0,9 1,1 1,1 +10 +22 +4<br />
Auftragseingang Order intake 13,7 6,2 11,7 16,9 15,1 +87 +45 –10<br />
Inland Domestic 5,6 2,2 3,8 5,6 5,0 +75 +46 –10<br />
Ausland Foreign 8,1 4,1 7,9 11,3 10,1 +94 +44 –11<br />
(ohne Installation, Reparaturen excl. installation, repairs)<br />
Produktion<br />
Production<br />
13,3 9,4 9,0 11,9 13,0 –4 +31 +9<br />
– Export – Exports<br />
8,2 6,0<br />
6,1<br />
7,9 9,6<br />
+1<br />
+31<br />
+20<br />
+ Import + Imports<br />
3,7<br />
2,1 2,0 2,8 3,2<br />
–7<br />
+42<br />
+14<br />
= Inlandsverbrauch = Domestic consumption<br />
8,8 5,5 4,9 6,7 6,6<br />
–10<br />
+37<br />
–1<br />
Exportquote (%) Export quota (%)<br />
61,9 64,3 67,4 67,0 73,7<br />
Importquote (%) Import quota (%)<br />
42,4 38,7 40,3 41,8 48,6<br />
Beschäftigte Employment 70 839 69 614 64 108 65 837 69 314 –7,9 +2,7 +5,3<br />
Kapazitätsauslastung (%) Capacity utilization (%) 94,7 72,6 75,4 93,8 95,2<br />
Auftragsbestand (Monate) Order backlog (months) 8,7 6,2 7,4 9,1 8,5<br />
■ Daten <strong>2012</strong> teilweise geschätzt<br />
Hinweise:<br />
– Daten beziehen sich auf <strong>Werkzeugmaschinen</strong> inklusive Teile/Zubehör<br />
– Auftragseingang: Hochrechnung auf Basis Verbandsstatistik<br />
– Beschäftigte, Kapazitätsauslastung, Auftragsbestand: <strong>Jahr</strong>esdurchschnitte<br />
Quellen: Statistisches Bundesamt, Ifo-Institut, VDMA, <strong>VDW</strong><br />
■ Data <strong>2012</strong> partly est<strong>im</strong>ated<br />
Note:<br />
– Figures include parts/accessories<br />
– Order intake: projection based on associations, statistics<br />
– Employment, capacity utilization, order backlog: average of year<br />
Sources: German Statistical Office, Ifo-Institute, VDMA, <strong>VDW</strong><br />
(–24%). <strong>Die</strong> Ablösung Europas als wichtigste Absatzregion<br />
(gut 39 % Anteil, bezogen auf die Auslandsorders insgesamt)<br />
hat sich aber schon in 2011 vollzogen und ist angesichts<br />
von aktuell mehr als 40 % Partizipation der asiatischen<br />
Märkte fortzuschreiben! Das Nachfragevolumen<br />
aus Amerika zeigt mit 10 % Plus einen unerwartet erfreulichen<br />
Aufwärtstrend. Schwer beeinträchtigt in der Finanzkrise<br />
und von vielen Analysten bereits abgeschrieben,<br />
hat die US-Industrie eine regelrechte Renaissance erlebt.<br />
Insbesondere die amerikanische Automobil<strong>industrie</strong> holt<br />
Modernisierung ihrer Produktionsanlagen nach und setzt<br />
dabei in erheblichem Maß auf <strong>deutsche</strong> Technologie.<br />
<strong>Die</strong> Betrachtung der nachfragestärksten Auslandskunden<br />
<strong>2012</strong> zeigt folgendes Bild: Zwar wird das für die USA, der<br />
Nummer 2 <strong>im</strong> Ranking, dynamisch vorgelegte Bestellvolumen<br />
(+22%) wertmäßig durch den „Champion“ China mit<br />
mehr als Faktor 2 überboten (2011 noch mit fast Faktor 4),<br />
doch kann China kein ungebremster Steigflug mehr attestiert<br />
werden. Der Auftragseingang aus dem riesigen Flächenstaat<br />
sinkt um knapp 32 % gegenüber dem zugegebenermaßen<br />
exorbitanten Volumen 2011 (damals +34 %).<br />
Natürlich ließ das äußerst hohe Niveau des Referenzjahres<br />
einen Dämpfer erwarten. Verunsicherung durch noch unfrom<br />
America showed an unexpectedly encouraging positive<br />
trend. Heavily <strong>im</strong>paired in the financial crisis and already<br />
written off by many analysts, US industry experienced a<br />
bona fide renaissance. The American automotive industry,<br />
in particular, resumed the modernisation of its production<br />
facilities, relying to a large degree on German technology.<br />
Analysis of the foreign customers with the highest demand<br />
in <strong>2012</strong> showed the following picture: Although the dynam -<br />
ically posted order volume of second-ranked USA (+22%)<br />
was exceeded by a factor of more than two by the “champion”<br />
China (in 2011 that factor was still nearly 4), China<br />
could no longer lay cla<strong>im</strong> to a full-throttle ascent. Incoming<br />
orders from that country, which covers a vast territory, fell<br />
by nearly 32% versus the admittedly exorbitant volume of<br />
2011 (+34% at that t<strong>im</strong>e). Of course, a dampening effect<br />
was not unexpected in the wake of the extremely high<br />
level of the reference year. Contributing factors include the<br />
still uncertain balance of political power and significantly<br />
more restrictive credit conditions, especially for the Chinese<br />
private industry. In the Asian sphere, the markets of South<br />
Korea and Japan posted robust increases (by 22% and 37%,<br />
respectively), thereby serving as demand growth engines.<br />
The <strong>im</strong>portance of Taiwan and India as motive forces d<strong>im</strong>in-
12<br />
<strong>Werkzeugmaschinen</strong>-Produktion Deutschland<br />
Machine tool production Germany<br />
■<br />
■<br />
■<br />
Maschinen Machines<br />
Teile, Zubehör Parts, accessories<br />
Installation, Reparatur/Instandhaltung Installation, repair/maintenance<br />
15<br />
Mrd. eur Bill. eur<br />
12<br />
9<br />
6<br />
3<br />
0<br />
93 94 95 96 97 98 99 00 01 02 03 04 05 06 07 08<br />
09 10 11 12<br />
<strong>2012</strong> = <strong>VDW</strong>-Schätzung<br />
Hinweis: Ab 1995 Werte<br />
verfügbar für Installation,<br />
ab 2002 zusätzlich für<br />
Reparatur/Instandhaltung<br />
Quellen: Statistisches<br />
Bundesamt, <strong>VDW</strong>, VDMA<br />
<strong>2012</strong> = <strong>VDW</strong> est<strong>im</strong>ate<br />
Note: since 1995 figures<br />
available for installation,<br />
since 2002 additionally<br />
for repair/maintenance<br />
Sources: German Statistical<br />
Office, <strong>VDW</strong>, VDMA<br />
klare politische Machtverhältnisse sowie deutlich restriktivere<br />
Kreditkonditionen insbesondere für chinesische Privat<strong>industrie</strong><br />
treten begründend hinzu. Im asiatischen Raum<br />
fungieren mit kraftvollen Steigerungen um 22 % bzw. 37 %<br />
die Märkte Südkorea und Japan als Treiber der Nachfrageentwicklung.<br />
Taiwan und Indien verlieren <strong>im</strong> aktuellen<br />
Berichtsjahr an Bedeutung als Impulsgeber. Während<br />
automobilgetriebene „Klassiker“ wie Frankreich, Italien<br />
und Großbritannien für markante zweistellige Einbußen<br />
stehen, wird Europa durch mittleren einstelligen Zuwachs<br />
in Russland, sehr moderate Nachfrageausweitung aus<br />
Österreich, nur leichte Abstriche in Tschechien, stabiles<br />
Geschäft mit der Schweiz und satte Zuwächse von mehr<br />
als 50 % in Polen gestützt. Anders als 2011 bleiben die<br />
„Automotive-geprägten“ Länder Ungarn und insbesondere<br />
die Slowakei als Schubgeber zurück. Ein prüfender Blick auf<br />
Amerika offenbart das Gefälle zwischen den USA bzw. dem<br />
NAFTA-Standort Mexiko, an welchem sich ebenfalls strukturell<br />
bedingter Bedarf für die Realisierung energieeffizienter<br />
Motoren- und Getriebekonzepte positiv für <strong>deutsche</strong><br />
Lieferanten auswirkt, und dem noch 2011 so vitalen südamerikanischen<br />
Leitmarkt Brasilien (Auftragseingang <strong>2012</strong>:<br />
–30%!). Auch Argentinien als zweiter interessanter Nachfrager<br />
in der Region erweist sich als beeinträchtigt.<br />
ished in the current reporting year. Whilst automobiledriven<br />
“classics” such as France, Italy and Great Britain<br />
posted striking two-digit declines, Europe was supported<br />
by mid-single-digit growth in Russia, very moderate demand<br />
expansion from Austria, only a slight downturn in<br />
the Czech Republic, stable business with Switzerland and<br />
hefty increases of more than 50% in Poland. Unlike the case<br />
of 2011, the heavily automotive countries of Hungary and<br />
(especially) Slovakia failed to provide thrust. A closer look at<br />
the Americas reveals the gap between the USA – and also<br />
the NAFTA location Mexico, where a s<strong>im</strong>ilar structurally<br />
conditioned need to create more energy-efficient engines<br />
and drive concepts had a positive effect for German suppliers<br />
– and the South American lead market of Brazil,<br />
which was still so vital in 2011 (incoming orders in <strong>2012</strong>:<br />
-30%!). The region’s second major source of demand,<br />
Argentina, also showed signs of <strong>im</strong>pairment.<br />
Only the narrowest possible gap remained between<br />
the <strong>2012</strong> production volume and the all-t<strong>im</strong>e highwater<br />
mark of 2008<br />
With relatively large quarter-to-quarter variations in the<br />
growth ranging from 22% in the first quarter, a 13% increase<br />
during the first half-year, and 9% growth over the entire year
Situation/Perspektiven<br />
Situation/Perspectives<br />
13<br />
Produktionsvolumen <strong>2012</strong> nur noch mit hauchdünnem<br />
Abstand vom Rekordhoch 2008<br />
Bei vierteljährlich relativ ausgeprägter Spreizung der Wachs -<br />
tumsbeiträge zwischen 22 % <strong>im</strong> Startquartal, 13 % Plus<br />
während des 1. Halbjahres und 9 % Zuwachs über das gesamte<br />
<strong>Jahr</strong> <strong>2012</strong> stehen schließlich 14,1 Mrd. EUR Produktionsvolumen<br />
zu Buche (einschließlich Teile und Zubehör<br />
sowie <strong>Die</strong>nstleistungen). In der „Netto-Betrachtung“ alleine<br />
für Maschinenfertigung kommt man auf 10 % Steigerung.<br />
Von der Rekordausbringung des <strong>Jahr</strong>es 2008 trennt<br />
die Branche lediglich noch eine Differenz in Höhe von weniger<br />
als 120 Mio. EUR, wobei der umformende Maschinenbereich<br />
nicht allein den unmittelbaren Anschluss findet,<br />
sondern die starke Referenz sogar übertreffen kann.<br />
In der Gegenüberstellung der Ergebnisse <strong>2012</strong> für spanende<br />
und umformende Technologien kommen unterschiedliche<br />
Beschaffungsmodalitäten zum Ausdruck. In dem Sinne<br />
nämlich, dass sich die überproportionale Dynamik <strong>im</strong><br />
spanenden Bereich stärker in konjunkturellem Zusammenhang<br />
mit deutlich breiterer Aufstellung nach Branchen<br />
versteht, während die durch (Groß-)Pressenbau geprägten<br />
umformenden Verfahren eng dem Beschaffungsverhalten<br />
der Automobil<strong>industrie</strong> folgen. <strong>Die</strong>s wiederum bedeutet<br />
Projekte mit sehr langen Durchlaufzeiten und oft „paukenschlagartiger“,<br />
das jeweilige Berichtsjahr überschreitender<br />
Realisierung von Auftragsvolumen in Produktion und Umsatz.<br />
Auch der mit Umformtechnik verbundene positive<br />
Basiseffekt – man arbeitete bereits 2010 fast wieder auf<br />
Vorjahresniveau – bremst darauf folgende Zuwachsraten<br />
in 2011 und <strong>2012</strong> naturgemäß ein. <strong>Die</strong> Blechbearbeitung<br />
mit und ohne Laser hat <strong>im</strong> Gegensatz zum projektorientierten<br />
Pressenbau 2011/<strong>2012</strong> für deutlich schnelleren Durchsatz<br />
und entsprechend beschleunigten Zugewinn an Produktions<br />
wert gesorgt.<br />
Der <strong>Werkzeugmaschinen</strong>export <strong>2012</strong> bleibt dominierende<br />
Wachstumsgrundlage der <strong>deutsche</strong>n Werkzeugmaschin en<strong>industrie</strong>.<br />
Trotz zügiger Abstriche in Sachen Dynamik von<br />
Quartal zu Quartal, konkret von 36 % Plus <strong>im</strong> 1. Vierteljahr<br />
über Zuwächse von 26 % bzw. 13 % in den beiden Folgequartalen<br />
bis hin zu einem Steigerungssatz von nur mehr<br />
10 %, gültig für die letzten drei Monate des <strong>Jahr</strong>es, notierte<br />
das Gesamtvolumen mit fast 9,6 Mrd. EUR und damit satten<br />
20 % über Vorjahresniveau. Der Rekordwert des Vor-Krisen-<br />
Spitzenjahres 2008 wird gleich um über 1,3 Mrd. EUR überboten.<br />
Triebfedern für dieses Ausfuhrwachstum <strong>2012</strong> sind<br />
mit 33 % Steigerung das Amerika-Geschäft (Vorjahr bereits<br />
+57 %!) sowie – ganz <strong>im</strong> Gegensatz zur Entwicklung 2011 –<br />
<strong>2012</strong>, the industry ult<strong>im</strong>ately posted a production volume<br />
(including parts and accessories as well as services) of EUR<br />
14.1 billion. In the “net analysis” for machinery production<br />
alone, there was a 10% increase. Less than EUR 120 million<br />
was all that still separated the industry from the record<br />
output posted in 2008, whereby the metal-forming machine<br />
sector did not merely come within striking distance, but<br />
rather actually exceeded the strong benchmark.<br />
A comparison of the results for metal-cutting and metalforming<br />
technologies in <strong>2012</strong> reflects their different procurement<br />
modalities, in the sense that the disproportionately<br />
dynamic activity in the metal-cutting sector, with its much<br />
broader market segment orientation, pr<strong>im</strong>arily follows the<br />
general economic cl<strong>im</strong>ate. Metal-forming processes, on the<br />
other hand, which are dominated by (heavy duty) press<br />
construction, are closely tied to the procurement activity of<br />
the automotive industry. This, in turn, means projects with<br />
very long turnaround t<strong>im</strong>es and contract volumes realised<br />
with great “fanfare” with production and turnover often<br />
extending beyond the year currently under review. And the<br />
basic positive effect underlying metal-forming technology<br />
– already in 2010 work was proceeding almost at the level<br />
of the previous year again – also naturally inhibited subsequent<br />
growth rates in 2011 and <strong>2012</strong>. In 2011 / <strong>2012</strong>,<br />
unlike project-oriented press construction, sheet-metal<br />
machining with and without lasers provided much higher<br />
through put and the commensurate acceleration in production<br />
value growth.<br />
Machine tool exports remained the dominant growth principle<br />
of the German machine tool industry in <strong>2012</strong>. Despite<br />
sharp declines in momentum from quarter to quarter –<br />
specifically ranging from +36% in the first quarter to<br />
growth rates of 26% and 13% in the following two quarters,<br />
down to a rate of increase of just 10% for the last three<br />
months of the year, the industry posted a total volume of<br />
nearly EUR 9.6 billion, which represented a full 20% increase<br />
over the level of the previous year. The record value of the<br />
pre-crisis peak year of 2008 was abruptly exceeded by more<br />
than EUR 1.3 billion. The driving forces behind this export<br />
growth in <strong>2012</strong> were, with a 33% increase, the trade with<br />
America (+57% already in the previous year!) and – in sharp<br />
contrast with the 2011 trend – the clientele within Europe<br />
(+27%). During the same period, dampened procurement<br />
activity in India, Korea and Taiwan <strong>im</strong>paired the momentum<br />
in Asia (+10%). Europe’s share of the total export value rose<br />
from nearly 43% (2011) to 45% in the current reporting<br />
year. The countries of Asia fell from a share of 42% to less<br />
than 38%. America added 1.6 percentage points, currently
14<br />
die Kundschaft innerhalb Europas (+27%), während die Dynamik<br />
in Asien (+10%) durch Beschaffungszurückhaltung<br />
in Indien, Korea und Taiwan beeinträchtigt ist. Der Anteil<br />
Europas am Gesamt-Ausfuhrwert steigt von knapp 43 %<br />
(2011) auf 45 % <strong>im</strong> aktuellen Berichtsjahr. <strong>Die</strong> Länder<br />
Asiens laufen von 42 % auf weniger als 38 % Anteil zurück.<br />
Amerika legt 1,6 Prozentpunkte auf aktuell reichlich 60 %<br />
Teilhabe zu. Für China alleine sind in 2011 Lieferungen <strong>im</strong><br />
Wert von mehr als 2,6 Mrd. EUR zu konstatieren(+34 %),<br />
und damit eine niemals zuvor erreicht Größenordnung.<br />
Der aktuelle Steigerungssatz beläuft sich auf 13 %, der Anteil<br />
am gesamten Ausfuhrvolumen <strong>deutsche</strong>r Hersteller<br />
geht leicht von 29 % auf reichlich 27 % zurück. <strong>Die</strong> USA können<br />
ihre Stellung als zweitgrößter Markt mit 42 % Plus (Vorjahr:<br />
+66 %!) und 11 % Anteil am Gesamtaufkommen (hoch<br />
von 9 %) weiter ausbauen. Im Wertverhältnis gegenüber<br />
China notiert der asiatische „Champion“ allerdings mit Faktor<br />
2,5 über dem Liefervolumen an US-Kunden. Position 3<br />
<strong>im</strong> Ranking verteidigt Russland mit 27 % Zuwachs und einen<br />
moderat auf 5 % gesteigerten Anteil am Gesamt-<br />
Exportvolumen <strong>deutsche</strong>r Hersteller souverän, noch vor<br />
den klassischen europäischen Best<strong>im</strong>mungsländern Frankreich,<br />
Großbritannien oder Österreich. Den Abstand bis zur<br />
Rekordmarke 2008 machen nur noch weniger als 50 Mio.<br />
EUR aus.<br />
Wegen der in 2011 eingeforderten kurzen Lieferzeiten für<br />
Universalmaschinen, vorherrschender Lost-Order-Grund<br />
für die voll ausgelastete Branche in Deutschland, partizipierte<br />
der damalige <strong>Werkzeugmaschinen</strong><strong>im</strong>port mit rund<br />
42 % Plus auf 2,8 Mrd. EUR (erneut ohne Teile und Zubehör<br />
sowie <strong>Die</strong>nstleistungen) voll an der aufstrebenden Entwicklung<br />
des Inlandsverbrauchs und erreichte 42 % Anteil<br />
an diesem rund 6,7 Mrd. EUR umfassenden Aggregat. <strong>2012</strong><br />
realisiert der ausländische Wettbewerb 14 % Einfuhrsteigerung<br />
auf 3,2 Mrd. EUR, der Anteil an der Aufnahmefähigkeit<br />
des <strong>deutsche</strong>n Marktes insgesamt (6,6 Mrd. EUR) steigt auf<br />
fast 49 %. Der auf europäische Konkurrenz entfallende Anteil<br />
läuft von 68 % auf 71 % hoch, die Teilhabe Asiens geht<br />
indessen von 26 % auf 24 % zurück. Im Falle der Schweiz<br />
(aktuell alleine 28 % Anteil), Italiens (Partizipation von<br />
reichlich 9 %), Tschechiens und Polens (gemeinsamer Anteil<br />
von 10 %) ist erneut auf Lieferverflechtungen innerhalb<br />
<strong>deutsche</strong>r Unternehmensgruppen zu verweisen. Der Import<br />
schnell lieferbarer Universalmaschinen aus Japan erhöht<br />
sich nach Steigerung um mehr als die Hälfte <strong>im</strong><br />
Referenzjahr 2011 um weitere 7 % in <strong>2012</strong>. Gleichzeitig geht<br />
der Anteil an der <strong>deutsche</strong>n Gesamt-Einfuhr von 13 % auf<br />
knapp 12 % zurück. Standardmaschinen des Basissegments<br />
anderer asiatischer Herkunft, vielfach über den Handel<br />
reaching a full 60% participation. For China alone, deliveries<br />
amounting to more than EUR 2.6 billion (+34%) were<br />
logged in 2011, achieving a magnitude never seen before.<br />
The rate of growth during the current reporting period was<br />
13%, and the share of the total export volume of German<br />
manufacturers fell slightly from 29% to 27%. As the second<br />
largest market, the USA was able to extend its position with<br />
a 42% increase (previous year: +66%!) and an 11% share of<br />
the total output (up from 9%). In terms of value versus<br />
China, however, the Asian “champion” finished ahead of<br />
the supply volume to US customers by a factor of 2.5. Russia<br />
easily defended its third-rank position with 27% growth,<br />
moderately increasing its share of German manufacturers’<br />
total export volume to 5%, still well ahead of the classic<br />
European destination countries such as France, Great<br />
Britain and Austria. The result was less than EUR 50 million<br />
short of the 2008 record level.<br />
Due to the short delivery t<strong>im</strong>es demanded by the universal<br />
machine sector in 2011 – the pr<strong>im</strong>ary reason for lost orders<br />
in Germany, where the sector was operating at full capacity<br />
– the 42% increase in machine tool <strong>im</strong>ports at the t<strong>im</strong>e to<br />
about EUR 2.8 billion (once again without parts and accessories<br />
or services) contributed to the ambitious evolution<br />
of domestic consumption in full measure and achieved a<br />
42% share of that pool which totalled about EUR 6.7 billion.<br />
Whilst foreign competitors posted a 14% increase in <strong>im</strong>ports<br />
to EUR 3.2 billion in <strong>2012</strong>, the share of the absorption<br />
capacity of the German market overall (EUR 6.6 billion) rose<br />
to nearly 49%. The share corresponding to the European<br />
competitors rose from nearly 68% in the previous year to<br />
71%, while Asia’s share fell from 26% to 24%. In the case of<br />
Switzerland (with a 28% share all to itself at present), Italy<br />
(a full 9% share), the Czech Republic and Poland (combined<br />
share of 10%), it is appropriate to mention the supply linkups<br />
within German corporate groups once again. After<br />
having increased by more than half in the reference year<br />
2011, <strong>im</strong>ports of universal machines (which can be supplied<br />
rapidly) from Japan rose by another 7% in <strong>2012</strong>. At<br />
the same t<strong>im</strong>e, the share of total <strong>im</strong>ports to Germany fell<br />
slightly from 13% to just below 12%. The volume of standard<br />
machines of the basic segment originating from elsewhere<br />
in Asia – many of which were re-exported through<br />
distribution channels – fell by about 11% in South Korea<br />
and increased by 18% in China and 20% in Taiwan versus<br />
2011, achieving a share of 11% all together.
Situation/Perspektiven<br />
Situation/Perspectives<br />
15<br />
re-exportiert, verlieren gegenüber 2011 rund 11 % (Südkorea)<br />
oder aber legen 18 % (China) bzw. 20 % (Taiwan) an Volumen<br />
zu und erzielen gemeinsam einen Anteil von 11 %.<br />
The industry sets forth with self-confidence in the financial<br />
year 2013, signs point to consolidation after two tremendously<br />
strong growth years<br />
Branche geht selbstbewusst ins Geschäftsjahr 2013,<br />
Zeichen stehen auf Konsolidierung nach zwei enorm starken<br />
Wachstumsjahren<br />
Unter den bedeutenden internationalen <strong>Werkzeugmaschinen</strong><strong>industrie</strong>n<br />
präsentiert sich die Branche in Deutschland<br />
mit ihren Ergebnissen <strong>2012</strong> in herausgehobener Weise.<br />
Wechselkurs-bereinigt, berechnet ohne Teile und Zubehör<br />
sowie <strong>Die</strong>nstleistungen und auf der Grundlage noch vorläufiger<br />
internationaler Basisdaten zeigt die chinesische<br />
<strong>Werkzeugmaschinen</strong>produktion ein Minus, der Output von<br />
Japan stagniert und selbst US-Hersteller bleiben mit 7 %<br />
Zuwachs hinter der Dynamik <strong>deutsche</strong>r Produzenten zurück.<br />
Europa wächst in Summe mit etwa 5 % lediglich halb so<br />
stark wie die Branche in Deutschland.<br />
Hinsichtlich des Exportgeschehens <strong>2012</strong> belegt Deutschland<br />
nach Japan Platz 2 der Weltrangliste. Während die Ausfuhren<br />
he<strong>im</strong>ischer Hersteller mit 20 % Plus jedoch stark expandieren,<br />
hält die japanische Konkurrenz ihr Exportresultat wegen<br />
des starken Yen lediglich auf Vorjahresniveau. Auf diese<br />
Weise hat sich der Abstand innerhalb des Führungsduos<br />
deutlich von etwa 1,5 Mrd. EUR als Referenz auf 900 Mio.<br />
EUR <strong>im</strong> aktuellen Berichtsjahr verringert.<br />
Für 2013 gibt sich die <strong>deutsche</strong> <strong>Werkzeugmaschinen</strong><strong>industrie</strong><br />
opt<strong>im</strong>istisch. Nach dem kraftvollen Wachstum der beiden<br />
Vorjahre stehen die Zeichen auf Konsolidierung. Erwartet<br />
wird eine annähernde Querbewegung der Produktionsund<br />
Exportentwicklung, mit bestenfalls einem bescheidenen<br />
Zuwachs von jeweils 1 %, sowie des zu Grunde liegenden<br />
Auftragseingangs insgesamt. Trotzdem wäre die<br />
Ausbringung 2008 als bisherige Branchenbestmarke<br />
(14,2 Mrd. EUR) somit wieder erreicht.<br />
Plausibel herleiten lassen sich diese moderaten Aufbesserungen<br />
von günstigeren Perspektiven <strong>im</strong> laufenden <strong>Jahr</strong>,<br />
was die weltweite Industrieproduktion und die globalen<br />
Investitionen der wichtigsten Kundenbranchen angeht. Auf<br />
Basis der gemeinsamen Frühjahrsprognosen von <strong>VDW</strong> und<br />
Oxford Economics sollen in 2013 die Industrieproduktion<br />
um 3,3 % sowie die Investitionen um 6,5 % wachsen. Europa<br />
kommt mit Blick auf diese Indikatoren auf 0,3 % Minus bzw.<br />
1,4 % Plus, Amerika steht für 2,0 % bzw. 8,4 % Plus und schließ -<br />
lich sollte Asien für 5,9 % bzw. 7,4 % Zuwachs gut sein. <strong>Die</strong>sem<br />
Zuschnitt folgen auch die Erwartungen hinsichtlich der<br />
Among the major international machine tool <strong>industrie</strong>s,<br />
the segment in Germany stands out from the crowd with<br />
its excellent <strong>2012</strong> results. Adjusted for exchange rates,<br />
calculated without parts and accessories or services, and<br />
based on prel<strong>im</strong>inary international basic data, Chinese<br />
machine tool production posted a decline, Japan’s output<br />
stagnated, and even US manufacturers remained, with<br />
7% growth, behind the momentum of the German producers.<br />
All together, Europe grew at a rate of about 5% –<br />
only half as strong as the industry in Germany.<br />
With regard to <strong>2012</strong> export activity, Germany ranked second<br />
after Japan in the world standings. Whilst exports by manufacturers<br />
there expanded dramatically by 20%, the export<br />
result of the Japanese competitors merely remained at the<br />
same level as the previous year due to the strong yen. So<br />
the gap between the two leaders narrowed significantly<br />
from about EUR 1.5 billion as a benchmark to EUR 900<br />
million in the current reporting year.<br />
The German machine tool industry is opt<strong>im</strong>istic about 2013.<br />
After the strong growth of the two previous years, signs<br />
point to consolidation. Experts anticipate an essentially flat<br />
evolution of production and export activity, the best-case<br />
scenario calls for modest 1% growth each, and of the underlying<br />
incoming orders overall. This would nevertheless<br />
suffice to reach the previous record output posted by the<br />
industry in 2008 (EUR 14.2 billion).<br />
These moderate <strong>im</strong>provements can be plausibly extrapolated<br />
from more favourable prospects in the current year with<br />
regard to worldwide industrial production and global<br />
investment of the most <strong>im</strong>portant customer branches.<br />
Based on the joint spring prognoses of the <strong>VDW</strong> and Oxford<br />
Economics industrial production and investment<br />
were projected to increase by 3.3% and 6.5%, respectively,<br />
in 2013. According to those same indicators, Europe will<br />
likely decline by 0.3% and grow by 1.4%, America is expected<br />
to increase by 2.0% and 8.4%, respectively, and Asia will<br />
grow by a 5.9% and 7.4%, respectively. That breakdown also<br />
corresponds to the expectations regarding the structure<br />
of German manufacturers’ orders from abroad in 2013:<br />
After stabilisation in the second half of the year, orders<br />
from Europe will probably end up decreasing by about 8%.<br />
Due to the high volume in the previous year incoming orders<br />
from America should decrease slightly by 2%. Fully in
16<br />
Struktur der Auslandsorders 2013 <strong>deutsche</strong>r Hersteller: <strong>Die</strong><br />
Bestellungen aus Europa dürften nach Stabilisierung<br />
in der 2. <strong>Jahr</strong>eshälfte mit etwa 8% Minus notieren und der<br />
Auftragseingang aus Amerika sollte aufgrund der hohen<br />
Vorjahresbasis leicht um 2% zurückgehen. <strong>Die</strong> Nachfrage<br />
aus Asien würde, ganz <strong>im</strong> Sinne ihrer Treiberfunktion und<br />
bei stark überproportional höherer Dynamik während der<br />
letzten 6 Monate 2013, insgesamt mit 7% Plus markant<br />
ansteigen.<br />
<strong>Die</strong>se somit skizzierte Zusammensetzung der Auslandsorders<br />
sollte sich wegen des hohen und tendenziell weiter<br />
wachsenden Gewichts Asiens stützend für die Branche in<br />
Deutschland auswirken. Insbesondere aus chinesischer<br />
Sicht – letztlich aber auch aus indischem Blickwinkel –<br />
erscheint die Hinwendung zu hochwertigen, tendenziell<br />
exportfähigen Erzeugnissen als obligatorisch, was auch<br />
den Anspruch an die eingesetzte Fertigungstechnik weiter<br />
nach oben verschieben wird. Deutsche Hersteller haben<br />
somit gute Chancen, überproportional an diesem Trend<br />
zu partizipieren.<br />
keeping with its function as a driving force, and with<br />
very disproportionately higher momentum during the last<br />
six months of 2013, demand from Asia is expected to rise<br />
dramatically with an 7% increase overall.<br />
Due to the heavy <strong>im</strong>pact of Asia – an <strong>im</strong>pact which also<br />
generally continues to grow – the composition of foreign<br />
orders outlined in this way should have a beneficial effect<br />
on the industry in Germany. Particularly from a Chinese<br />
perspective – but recently also from the Indian point of<br />
view – manufacturers are apparently obliged to shift to<br />
high-quality, increasingly exportable products, and this will<br />
continue to raise the demands on the manufacturing technology<br />
used. German manufacturers are well positioned to<br />
benefit disproportionately from that trend.
<strong>Werkzeugmaschinen</strong>-Produktion<br />
XXX 17<br />
XXX<br />
Machine tool production<br />
Mit dieser Wälzschleifmaschine steht ein Maschinensystem für die Hartfeinbearbeitung von Verzahnungen zur Verfügung, das sich<br />
durch seine besondere Leistungsfähigkeit und Universalität auszeichnet. So kann man auf derselben Maschine wälz- und profilschleifen,<br />
sowohl einzeln als auch in Kombination. Zudem können abrichtbare Werkzeuge aus Korund und CBN und nicht abrichtbare aus galvanisch<br />
gebundenem CBN eingesetzt werden. Durch schnelles Umrüsten und kurze Taktzeiten mit Automation ist diese Wälzschleifmaschine<br />
äußerst wirtschaftlich.<br />
This generating and profile grinding machine offers a machine system for the finishing of hardened gears which stands out for its special<br />
performance and versatility. In this way it is possible to perform generating and profile grinding on a single machine, both individually<br />
and in combination. Moreover, dressable tools made of corundum and CBN and non-dressable tools made of electroplated CBN can be<br />
used. Rapid retooling and short cycle t<strong>im</strong>es with automation make this generating and profiling machine extremely cost-efficient.
18<br />
Höchste jemals erzielte Produktionssteigerung 2011 steht<br />
als starke Referenz, Anlagenabsatz expansiver als Ersatzteilund<br />
Servicegeschäft<br />
2011 saw the highest production increase ever and<br />
stands as a powerful benchmark, more expansion in<br />
machine sales than in spare parts and service business<br />
In dieses Vergleichsjahr 2011 startete die <strong>deutsche</strong> Werkzeug -<br />
maschinen<strong>industrie</strong> mit fast 1,8 Mrd. EUR Auftragsüberhang.<br />
Schon früh war klar geworden, dass ein Großteil des<br />
in 2010 um 87 % auf rund 11,7 Mrd. EUR angeschwollenen<br />
Auftragseingangsvolumens wegen der langen Durchlaufzeiten<br />
<strong>im</strong> Sonderanlagen- und Projektbereich nicht mehr<br />
<strong>im</strong> gleichen <strong>Jahr</strong> zu realisieren sein würde.<br />
In the year referenced, 2011, the German machine tool industry<br />
started out with an order backlog of nearly EUR 1.8<br />
billion. It soon became apparent that most of the incoming<br />
order volume, which had swollen by 87% to about EUR 11.7<br />
billion in 2010, could no longer be achieved within that same<br />
year due to the long turnaround t<strong>im</strong>es in the special machinery<br />
and project sector.<br />
<strong>Die</strong> Produktionsprognosen für 2011 waren entsprechend<br />
hoch gespannt und von vornherein auf Zuwächse in der<br />
Größenordnung nahe 30 % ausgerichtet. Zumal der laufende<br />
Auftragseingang 2011 fortgesetzte Expansion signalisierte.<br />
Während der 1. <strong>Jahr</strong>eshälfte kam es zu prozentual annähernder<br />
Nachfrageverdopplung gegenüber dem Vorjahreszeitraum,<br />
und zwar erfreulich gleichläufig in der Inlands- und<br />
Auslandsbetrachtung. Erwartungsgemäß sorgten stärkere<br />
Basiswerte der Referenzperiode <strong>im</strong> 2. Halbjahr für eine<br />
Beruhigung auf 9 % Zuwachs, was sich in der <strong>Jahr</strong>esbilanz<br />
2011 auf rund 16,9 Mrd. EUR und somit satte 45 % Zuwachs<br />
kumulierte. <strong>Die</strong>s erneut mit ähnlich dynamischen Entwicklungen<br />
in der Inlands- und Auslandskomponente, allerdings<br />
<strong>im</strong> Wertverhältnis von einem Drittel zu zwei Dritteln<br />
Anteil zugunsten der Bestellungen aus dem Ausland. Als<br />
bemerkenswert erscheint hierbei die „paritätische“ Vertei -<br />
l ung der Dynamiken <strong>im</strong> Bereich der Auslandsorders, wo<br />
Europa um 43 % zulegte, Amerika 44 % Plus beisteuerte<br />
(davon Nordamerika +51 %) und Asien auf insgesamt<br />
30 % Zuwachs kam. Im letzteren Falle angeführt durch<br />
die volumenstarken „Motoren“ China, Südkorea und<br />
Indien mit Steigerungssätzen von 34 %, 42 % bzw. 38 %.<br />
The production prognoses for 2011 were ratcheted up accordingly<br />
and oriented towards growth rates to the order<br />
of 30% right from the start, especially given that the ongoing<br />
receipt of orders for 2011 signalled continued expansion.<br />
During the first half of the year, demand nearly doubled on<br />
a percentage basis with respect to the same period of the<br />
previous year, with a satisfyingly equal contribution from<br />
home and abroad. As expected, stronger underlying rates<br />
for the reference period in the second half of the year slowed<br />
growth to 9%, which accumulated over the course of the<br />
year in 2011 to about EUR 16.9 billion, a full 45% growth.<br />
This once again featured s<strong>im</strong>ilarly dynamic rates of development<br />
in the domestic and foreign components, albeit<br />
with a ratio of one third to two thirds share in favour of<br />
orders from abroad. In this regard, the “parity” distribution<br />
of momentum in the area of foreign orders appears noteworthy,<br />
where Europe increased by 43%, the Americas<br />
posted 44% growth (including North America’s +51%), and<br />
Asia finished with a 30% increase overall. In the case of the<br />
latter, growth was led by the high-volume “engines” of<br />
China, South Korea and India with 34%, 42% and 38%<br />
growth, respectively.<br />
Auch Umsatzentwicklung dreht früh und dynamisch<br />
ins Plus<br />
Turnover also pivoted early and dynamically towards<br />
positive growth<br />
Da die Fertigungseffizienz <strong>im</strong> Anschluss an die „Aufholjagd“<br />
2010 den außerordentlich hohen Vor-Krisen-Stand wieder<br />
erreichte, verwunderte es wenig, dass auch der realisierte<br />
Umsatz, und zwar als Folge der Abarbeitung des dicken<br />
Auftragspolsters und florierender laufender Bestelltätigkeit,<br />
rasch an Tempo zulegte. <strong>Die</strong>s indessen, bei Zuwächsen<br />
von 41 % <strong>im</strong> 1. Halbjahr und 34 % über das Gesamtjahr<br />
2011 hinweg (<strong>Werkzeugmaschinen</strong> ohne Teile und Zubehör<br />
sowie <strong>Die</strong>nstleistungen), mit dem üblichen durchlauftechnisch<br />
bedingten Phasenversatz. Der Bereich spanender<br />
<strong>Werkzeugmaschinen</strong> trug während der ersten 6 Monate<br />
mit 45 % Plus gegenüber 31 % Zuwachs bei Anlagen für um-<br />
Inasmuch as manufacturing efficiency had once again<br />
reached the extraordinarily high pre-crisis level following the<br />
“catch-up race” of 2010, it was hardly surprising that the<br />
actual turnover also accelerated dramatically as a result of<br />
working off the generous order buffer in combination with<br />
the flourishing current order activity. This occurred, however,<br />
with growth rates of 41% in the first half of the year and<br />
34% throughout 2011 (machine tools without parts and<br />
accessories or services), with the usual turnaround t<strong>im</strong>erelated<br />
phase shift. The metal-cutting machine tool sector,<br />
with a 45% increase during the first six months, as opposed<br />
to 31% growth in systems for forming processes, clearly
Produktion<br />
Production<br />
19<br />
formende Verfahren deutlich überproportional zum starken<br />
Wachstum der branchenweiten Produktion bei.<br />
Mit 38 % Plus <strong>im</strong> Vergleich mit 25 % Ausweitung änderte<br />
sich <strong>im</strong> gesamten <strong>Jahr</strong>esverlauf 2011 eher wenig an diesen<br />
unterschiedlichen „Verfahrgeschwindigkeiten“. Positiv hob<br />
sich <strong>im</strong> Kreis der umformenden Technologien die durchsatzschnellere<br />
Blechbearbeitung von der verhaltener umsetzenden,<br />
weil stark projektorientierten Pressentechnik<br />
ab. Volumenbezogen standen zum <strong>Jahr</strong>esende gegenüber:<br />
7 Mrd. EUR Produktionswert <strong>im</strong> spanenden Bereich und<br />
2,6 Mrd. EUR Output der Umformtechnik (Anteil von 27 %<br />
am totalen Produktionswert).<br />
made a disproportionately high contribution to the strong<br />
growth of production throughout the industry. With a 38%<br />
increase as compared to 25% expansion, these different<br />
“travel speeds” changed relatively little over the course of<br />
2011. Within the range of forming technologies, sheetmetal<br />
machining with its more rapid throughput stood out<br />
in the positive sense from press technology where turnover<br />
tends to be slower due to its strongly project-driven orientation.<br />
The year-end figures in terms of volume: EUR 7 billion<br />
production value in the metal-cutting area and EUR 2.6 billion<br />
of output in forming technology (a 27% share of the total<br />
production value).<br />
Punktlandungen in den Prognosen für Auftragseingang<br />
und Umsatz <strong>2012</strong>, tatsächliche Produktionsleistung sogar<br />
noch leicht über der Vorausschau<br />
Bull’s eye on prognoses for <strong>2012</strong> incoming orders and<br />
turnover, actual production performance even slightly<br />
higher than forecast<br />
Bereits <strong>im</strong> Herbst 2011 hatten der <strong>VDW</strong> und sein britischer<br />
Prognosepartner Oxford Economics ein Auftragsminus von<br />
9 % für das aktuelle Berichtsjahr dieser Publikation prognostiziert.<br />
Im Frühjahr <strong>2012</strong> scheint der Ansatz einer Einbuße<br />
von 13 % gerechtfertigt zu sein, die indessen bereits<br />
<strong>im</strong> frühen Herbst <strong>2012</strong> auf 10 % Minus zurückjustiert werden<br />
darf, was dem heute vorliegenden Endstand entspricht.<br />
In autumn 2011, the <strong>VDW</strong> and its British partner for establishing<br />
prognoses, Oxford Economics, had already predicted<br />
a 9% decline in orders for the current reporting year of this<br />
publication. In the spring of <strong>2012</strong>, the est<strong>im</strong>ation of a 13%<br />
downturn seemed to be justified, although with the possibility<br />
of a revision to -10% early in the fourth quarter of<br />
<strong>2012</strong>. This indeed corresponds to the present final figure.<br />
Gleichzeitig verbleibt die Kapazitätsauslastung auf hohem<br />
Niveau. Der sich noch <strong>im</strong> Oktober <strong>2012</strong> auf branchendurchschnittlich<br />
über 8 Monate belaufende Auftragsbestand<br />
lässt gemeinsam mit der vor allem <strong>im</strong> letzten Quartal <strong>2012</strong><br />
stabiler als ursprünglich verlaufenden Nachfrage aus dem<br />
Inland eine sukzessive Anhebung der Produktionserwartung<br />
von 6 % auf 8 % Plus zu. <strong>Die</strong> effektiv realisierte Produktionssteigerung<br />
<strong>2012</strong> beläuft sich auf 9 % und einen Wert von<br />
14,06 Mrd. EUR. <strong>Die</strong>ses Volumen kommt bis auf eine moderate<br />
Lücke von lediglich etwa 100 Mio. EUR dicht an den<br />
Produktionsrekord des Vor-Krisen-Boomjahres 2008 heran.<br />
Ohne Teile und Zubehör sowie <strong>Die</strong>nstleistungen notiert<br />
die Produktion mit 10 % Plus, wobei die spanenden Verfahren<br />
12 % und die projektgetriebene Umformtechnik rund<br />
6 % Zuwachs beitragen. Speziell <strong>im</strong> letzteren Falle ergeben<br />
sich auch sehr gute Umsetzungsperspektiven für 2013.<br />
At the same t<strong>im</strong>e, capacity utilisation remained at a high<br />
level. The current order backlog still extended over eight<br />
months on average in the industry in October <strong>2012</strong> and,<br />
in combination with domestic demand which was more<br />
stable than originally observed (especially in the last quarter<br />
of <strong>2012</strong>), made it possible to raise expected production<br />
levels gradually from +6% to +8%. The effective production<br />
increase achieved in <strong>2012</strong> was 9% and represented a value<br />
of EUR 14.06 billion. That volume came very close to the<br />
record production level of the pre-crisis boom year 2008,<br />
falling short by only about EUR 100 million. Without parts<br />
and accessories or services, production posted a 10% increase,<br />
whereby metal-cutting processes contributed 12%<br />
growth while the project-driven forming technology contributed<br />
about 6%. Particularly in the case of the latter,<br />
the turnover prospects for 2013 are also very good.<br />
Export ist ausschlaggebender Treiber der<br />
Entwicklung<br />
Export is the decisive driver behind the<br />
development of the sector<br />
Das besagte Wachstum von 9 % ist durch 20 % Plus <strong>im</strong><br />
Export gestützt, das heißt, hier sind sehr hohe Volumina<br />
an Auslandsbestellungen, vielfach gerichtet auf mit langem<br />
Vorlauf georderte Sonderanlagen und Projekte, „vom<br />
Hof“ gebracht worden.<br />
The aforementioned 9% growth was buttressed by a 20%<br />
increase in exports – which means that very high foreign<br />
order volumes were shipped out from here, many of which<br />
involved special machines and projects with long lead<br />
t<strong>im</strong>es.
20<br />
Produktion spanender und umformender <strong>Werkzeugmaschinen</strong> in Deutschland<br />
Production of metal cutting and forming machine tools in Germany<br />
9<br />
Mrd. eur Bill. eur<br />
8<br />
7<br />
Spanende <strong>Werkzeugmaschinen</strong>*<br />
Metal cutting machine tools*<br />
6<br />
5<br />
4<br />
3<br />
2<br />
1<br />
0<br />
Umformende <strong>Werkzeugmaschinen</strong>*<br />
Metal forming machine tools*<br />
93 94 95 96 97 98 99 00 01 02 03 04 05 06 07 08<br />
09 10 11 12<br />
<strong>2012</strong> = <strong>VDW</strong>-Schätzung<br />
* ohne Teile, Zubehör<br />
Quellen: Statistisches<br />
Bundesamt, <strong>VDW</strong>, VDMA<br />
<strong>2012</strong> = <strong>VDW</strong> est<strong>im</strong>ate<br />
* excluding parts,<br />
accessories<br />
Sources: German Statistical<br />
Office, <strong>VDW</strong>, VDMA<br />
Gleichzeitig ist es gelungen, den in 2011 verbuchten<br />
Inlands absatz (+37%, ohne Teile und Zubehör sowie<br />
<strong>Die</strong>nstleistungen) mit 1 % Plus in <strong>2012</strong> zu halten. Hierbei<br />
besteht die berechtigte Vermutung, dass sich jüngere<br />
finanzpolitische Turbulenzen <strong>im</strong> Inland, mit dort deutlich<br />
höherem Anteil mittelständischer und konjunkturreagibler<br />
Kundschaft, in Form von mehr Zurückhaltung als <strong>im</strong> Beschaffungswesen<br />
der strategisch operierenden Groß<strong>industrie</strong><br />
ausgewirkt haben. Viele mittelständische Anwender in<br />
Deutschland dürften auch die schwierige Situation in Südeuropa<br />
empfindlicher spüren und über geringere Kompensationsmöglichkeiten<br />
durch Osteuropa-, USA- oder Asiengeschäft<br />
verfügen.<br />
At the same t<strong>im</strong>e, it was possible to maintain the domestic<br />
turnover posted in 2011 (+37% without parts and accessories<br />
or services) with a 1% increase in <strong>2012</strong>. In this regard, it is<br />
reasonable to assume that recent turbulence buffeting<br />
financial policy in Germany (where small and mediumsized<br />
companies and businesses which are more sensitive<br />
to the economic conditions comprise a significantly higher<br />
share of the clientele) caused greater reticence than in the<br />
procurement activity of strategically oriented major industrial<br />
operations. Many small and medium-sized users in Germany<br />
were also more susceptible to the effects of the difficult<br />
situation in southern Europe and less able to compensate<br />
through business in the East, the USA or Asia.<br />
<strong>VDW</strong> und Oxford Economics verhalten opt<strong>im</strong>istisch für 2013<br />
<strong>VDW</strong> and Oxford Economics cautiously opt<strong>im</strong>istic for 2013<br />
Nach zwei enorm starken Wachstumsjahren stehen die<br />
Zeichen auf Konsolidierung. Für 2013 als ein <strong>Jahr</strong> des<br />
„Übergangs“ zu prinzipiell zyklisch angelegten Produktions -<br />
steigerungen in der Folgezeit wird eine Querbewegung <strong>im</strong><br />
Produktionsgeschehen mit bestenfalls einem Zuwachs von<br />
wertmäßig 1 % erwartet. Damit würde der Anschluss an die<br />
Branchen-Bestmarke aus dem <strong>Jahr</strong> 2008 hergestellt. Immer<br />
vorausgesetzt, dass es nicht zu neuerlichen Verwerfungen<br />
durch exogene Störungen aus dem Finanzwesen kommt.<br />
After two tremendously strong years of growth, signs now<br />
point to a period of consolidation. As a “transition year” towards<br />
pr<strong>im</strong>arily cyclically oriented production increases in<br />
the near term, production activity is expected to trace a flat<br />
development in 2013 with growth of no more than 1% on<br />
a value basis. This would suffice to attain the record level<br />
set by the industry in 2008, always subject to the provision<br />
that no new discontinuities occur as a result of exogenous<br />
disturbances from the financial system.
Produktion<br />
Production<br />
21<br />
Deutsche <strong>Werkzeugmaschinen</strong>-Produktion nach Technologien (Mio. EUR)<br />
German machine tool production by technologies (mill. EUR)<br />
%-Anteil<br />
%-Share<br />
%-Veränd.<br />
%-Change<br />
Jan.–Sept.<br />
%-Anteil<br />
%-Share<br />
%-Veränd.<br />
%-Change<br />
Laser-, Ionen- und Ultraschallmaschinen<br />
Laser-, ion beam-, ultrasonic machines<br />
Erodiermaschinen<br />
Electrical discharge machines<br />
Bearbeitungszentren, Flexible Systeme<br />
Machining centres, flexible systems<br />
Mehrwege, -Transfermaschinen<br />
Unit construction machines, transfer machines<br />
Drehmaschinen, Drehzentren<br />
Turning machines, turning centres<br />
Bohr-, Ausbohrmaschinen, komb. Ausbohr- und Fräsmaschinen<br />
Drilling machines, boring machines, boring-milling machines<br />
Fräsmaschinen<br />
Milling machines<br />
Schleif-, Hon-, Läpp- und Poliermaschinen<br />
Grinding, honing, lapping and polishing machines<br />
Verzahnmaschinen, Zahnfertigbearbeitungsmaschinen<br />
Gear cutting and finishing machines<br />
Säge- und Trennmaschinen<br />
Sawing and cutting-off machines<br />
Sonstige spanende <strong>Werkzeugmaschinen</strong><br />
Other metal cutting machine tools<br />
Spanende <strong>Werkzeugmaschinen</strong><br />
Metal cutting machine tools<br />
Schmiedemaschinen und Hämmer (einschl. Pressen)<br />
Forging machines and hammers (incl. presses)<br />
Biege-, Abkant- und Richtmaschinen (einschl. Pressen)<br />
Bending, folding and straightening machines (incl. presses)<br />
Scheren, Lochstanzen, Ausklinkmaschinen (einschl. Pressen)<br />
Shearing, punching, notching machines (incl. presses)<br />
Andere Pressen<br />
Other presses<br />
Drahtbe- und - verarbeitungsmaschinen<br />
Wire working machines<br />
Sonstige umformende <strong>Werkzeugmaschinen</strong><br />
Other metal forming machine tools<br />
Umformende <strong>Werkzeugmaschinen</strong><br />
Metal forming machine tools<br />
<strong>Werkzeugmaschinen</strong> insgesamt<br />
Total machine tools<br />
2008 2009 2010 2011 2011 2011/10 2011 <strong>2012</strong> <strong>2012</strong> <strong>2012</strong>/11<br />
469 232 263 335 2,6 +27 227 306 3,1 +35<br />
74 46 56 73 0,6 +31 54 58 0,6 +7<br />
1 913 1 269 1 081 1 699 13,2 +57 1 135 1 382 13,8 +22<br />
564 516 466 570 4,4 +22 398 451 4,5 +13<br />
1 565 1 062 960 1 491 11,5 +55 1 005 1 108 11,1 +10<br />
215 146 162 187 1,4 +15 126 140 1,4 +11<br />
1 086 703 667 776 6,0 +16 535 644 6,4 +20<br />
1 226 853 710 1 034 8,0 +46 681 845 8,5 +24<br />
748 619 528 575 4,4 +9 383 404 4,0 +5<br />
268 145 149 202 1,6 +36 143 141 1,4 –2<br />
86 50 51 62 0,5 +23 34 58 0,6 +70<br />
8 214 5 642 5 092 7 003 54,2 +38 4 721 5 536 55,4 +17<br />
160 232 299 241 1,9 –19 188 132 1,3 –30<br />
543 409 384 470 3,6 +22 324 368 3,7 +13<br />
432 328 341 435 3,4 +28 322 311 3,1 –3<br />
605 562 578 757 5,9 +31 515 532 5,3 +3<br />
299 211 184 250 1,9 +36 176 193 1,9 +10<br />
462 382 300 457 3,5 +52 319 394 3,9 +24<br />
2 501 2 125 2 086 2 610 20,2 +25 1 844 1 929 19,3 +5<br />
10 715 7 767 7 178 9 613 74,4 +34 6 565 7 465 74,7 +14<br />
Teile und Zubehör<br />
Parts and accessories<br />
Installation, Reparatur, Instandhaltung von <strong>Werkzeugmaschinen</strong><br />
Installation, repair, maintenance of machine tools<br />
<strong>Werkzeugmaschinen</strong> inkl. Teile und Zubehör,<br />
Installation, Reparatur/Instandhaltung<br />
Machine tools incl. parts and accessories,<br />
installation, repair/maintenance<br />
Quellen: Statistisches Bundesamt, <strong>VDW</strong>, VDMA<br />
2 537 1 623 1 851 2 253 17,4 +22 1 634 1 750 17,5 +7<br />
925 788 865 1 052 8,1 +22 735 773 7,7 +5<br />
14 178 10 177 9 894 12 919 100,0 +31 8 934 9 988 100,0 +12<br />
Sources: German Statistical Office, <strong>VDW</strong>, VDMA
22<br />
Basis für die Einschätzung ist die absehbar günstigere Entwicklung<br />
der Weltwirtschaft. Nach Annahmen des <strong>VDW</strong>-<br />
Prognosepartners Oxford Economics wird die Industrieproduktion<br />
2013 weltweit um 3,5 % (davon Asien: 6 %)<br />
ansteigen. Auch die globalen Anlageinvestitionen dürften<br />
mit ebenfalls 3,5 % (Asien: 5 %) wieder stärker zulegen.<br />
Alles in allem bietet das weltwirtschaftliche Umfeld 2013<br />
Rückenwind. Frühindikatoren wie der weltweit gültige<br />
Einkaufsmanagerindex oder das IFO-Geschäftskl<strong>im</strong>a für<br />
die <strong>deutsche</strong>n Herstellerfirmen von <strong>Werkzeugmaschinen</strong><br />
zeigen seit einigen Monaten nach oben. Auch der <strong>deutsche</strong><br />
Industrie- und Handelskammertag DIHK hat jüngst eine<br />
St<strong>im</strong>mungsaufhellung in der <strong>deutsche</strong>n Wirtschaft betont.<br />
Doch fühlen sich inländische Investoren verunsichert durch<br />
die aktuelle Diskussion um Steuererhöhungen, die schlingernde<br />
Energiewende mit hohen Energiepreisen als Folge,<br />
die weiterhin schwelende Unsicherheit <strong>im</strong> Eurofinanzwesen<br />
als Ursache für Unwägbarkeiten in etlichen Märkten sowie<br />
nicht zuletzt die Ankündigung hoher Lohnforderungen.<br />
Der erforderliche Antrieb für den erwähnten leichten Produktionszuwachs<br />
der <strong>deutsche</strong>n <strong>Werkzeugmaschinen</strong><strong>industrie</strong><br />
in 2013 sollte von der 2. <strong>Jahr</strong>eshälfte und hier insbesondere<br />
von Asien ausgehen. Wegen des hohen Anstiegs<br />
<strong>im</strong> Exportvolumen <strong>2012</strong> ist die Ausfuhr 2013 in der Vorausschau<br />
von 2 % Plus auf lediglich einen Prozentpunkt Zuwachs<br />
zurückgeführt worden.<br />
The est<strong>im</strong>ate is based on more favourable near-term development<br />
of the global economy. According to assumptions<br />
by the <strong>VDW</strong>’s prognosis partner Oxford Economics,<br />
industrial production will increase by 3.5% worldwide (including<br />
6% in Asia) in 2013. Global investment in plant<br />
and equipment is also expected to show stronger growth<br />
again, likewise with an increase of 3.5% (Asia: 5%). All in all,<br />
global economic conditions in 2013 will provide a tailwind.<br />
Early indicators such as the Purchasing Managers Index,<br />
applicable worldwide, or the Ifo Business Cl<strong>im</strong>ate Index for<br />
German machine tool manufacturers have been trending<br />
upward for the past few months. Also the Association of<br />
German Chambers of Commerce and Industry (DIHK) has<br />
recently emphasised the <strong>im</strong>proving mood of German econ<br />
omy. But domestic investors are concerned about the current<br />
discussion concerning tax increases, the lurching sea change<br />
in the energy sector which will result in high energy prices,<br />
the growing uncertainty in the euro finance system as a<br />
cause of risk-aversion in countless markets, and not least<br />
the announcement of high salary and wage demands.<br />
The required boost for the aforementioned slight growth<br />
in production by the German machine tool industry in 2013<br />
will come in the second half of the year and in particular<br />
from Asia. Due to the high rise in export volumes in <strong>2012</strong>,<br />
projected exports in 2013 have been dialled back from<br />
+2% to just 1 percentage point of growth.<br />
Internationale Präsenz der Branche<br />
International presence of the sector<br />
Bei der Betrachtung der <strong>deutsche</strong>n <strong>Werkzeugmaschinen</strong><strong>industrie</strong><br />
ist es inzwischen nicht mehr sinnvoll, alleine auf<br />
Datenmaterial für den Standort Deutschland abzustellen.<br />
Schließlich steht die Auslandsproduktion <strong>deutsche</strong>r Hersteller<br />
mit Blick auf die Gesamtleistungsfähigkeit der Branche<br />
mittlerweile für weit mehr als einen „Added Value“. <strong>Die</strong><br />
Abschätzung der Auslandsproduktion wirft verschiedene<br />
Probleme auf. So muss alles außen vor bleiben, was als<br />
Umsatz <strong>im</strong> <strong>deutsche</strong>n Stammhaus fakturiert und somit<br />
bereits an nationale statistische Behörden gemeldet<br />
worden ist. Ferner muss die Bedeutung aus dem Ausland<br />
beigestellter Komponenten und Baugruppen bzw. aus<br />
Deutschland gelieferter Rumpfmaschinen, die <strong>im</strong> Ausland<br />
veredelt werden und dort separat als Umsatz anfallen, hinreichend<br />
geklärt sein.<br />
<strong>Die</strong> geografische Orientierung am global tätigen Großanwender<br />
Automobil<strong>industrie</strong> hat zu Aufbau von Produktionsstätten<br />
vor allem in Westeuropa (Frankreich, Großbritannien,<br />
Italien, Österreich, Schweiz), Osteuropa<br />
In examining the German machine tool industry, it is no<br />
longer useful to gear analyses to data concerning Germany<br />
alone. After all, in view of the overall capacity of the sector,<br />
German manufacturers’ production abroad stands for far<br />
more than just “added value”. The analysis of production<br />
abroad raises a series of issues. For instance, all sales invoiced<br />
by the German head office – and thereby previously<br />
reported to national statistical authorities – must be excluded<br />
from consideration. Furthermore, the significance of components<br />
and modules provided from abroad and of basic<br />
machines supplied from Germany that are then customised<br />
abroad and recorded there separately as sales must be<br />
sufficiently clarified.<br />
Geographical alignment to the automotive industry, a major<br />
consumer segment with global operations, has led to the<br />
establishment and expansion of production facilities mainly<br />
in Western Europe (France, Great Britain, Italy, Austria and<br />
Switzerland), Eastern Europe (Czech Republic and Poland),<br />
the USA and Brazil. Also in Asian countries, where the People’s
Produktion<br />
Production<br />
23<br />
(Tschechien, Polen), den USA und Brasilien geführt. Auch in<br />
Ländern Asiens, wo die Volksrepublik China die Entwicklung<br />
dominiert, gibt es bereits Standorte mit noch bescheidener,<br />
aber kräftig wachsender Ausbringung. Hier steht das Engagement<br />
noch eher am Anfang, wird aber künftig insbesondere<br />
in China, wegen verschärfter Local-Content- Anforderung<br />
und dem gezielten Zurückdrängen von Einfuhren zugunsten<br />
der Eigenproduktionen, zu intensivieren sein. Nahezu<br />
alle großen <strong>Werkzeugmaschinen</strong>hersteller unterhalten einen<br />
oder mehrere Produktions- bzw. Montagestandorte <strong>im</strong><br />
Ausland. Vor dem Hintergrund des mittelständischen Charakters<br />
der Branche (mehr als die Hälfte der Betriebe beschäftigt<br />
höchstens 250 Mitarbeiter) stößt Produktionsverlagerung<br />
an finanzielle und personelle Grenzen.<br />
Einmal abgesehen von mehreren hundert Vertriebs- und<br />
Serviceniederlassungen bzw. Repräsentanzen <strong>deutsche</strong>r<br />
<strong>Werkzeugmaschinen</strong>hersteller in aller Welt, dürften derzeit<br />
weniger als 20 <strong>deutsche</strong> Unternehmensgruppen komplette<br />
Anlagen <strong>im</strong> Ausland produzieren. Zuletzt sind 49 Produktions -<br />
stätten in 13 Ländern ermittelt worden. Im Vergleich zum<br />
<strong>Jahr</strong> 2010 konnte die Auslandsproduktion um 56,9 % zulegen<br />
und liegt nun bei 1,7 Mrd. EUR.<br />
Der Anteil der Auslandsproduktion, gemessen an der gesamten<br />
weltweiten <strong>Werkzeugmaschinen</strong>produktion <strong>im</strong><br />
Teilnehmerkreis, beträgt knapp 29 % und ist somit ein Prozentpunkt<br />
höher als 2010.<br />
Ein Blick auf die regionale Verteilung zeigt, dass das Produk -<br />
tionsvolumen in allen Ländern gegenüber dem Vorjahreszeitraum<br />
stark gestiegen ist. <strong>Die</strong> europäischen und amerikanischen<br />
Standorte tun sich aber noch schwer, an die<br />
Produktionswerte von 2008 heranzureichen, während<br />
China und Brasilien den Einbruch <strong>im</strong> Krisenjahr schon wieder<br />
wettgemacht haben. Mit einem Anteil von 63 % und<br />
einem Produktionsvolumen von 1,07 Mrd. EUR steht Europa<br />
trotzdem weiterhin an der Spitze in Bezug auf die Struktur<br />
der Produktionsstandorte. Dahinter folgen Nordamerika<br />
mit 19 %, Südamerika mit 10 % sowie Asien mit 8 %. Mit<br />
Blick auf die Technologien legt die Zerspanung mit einem<br />
Plus von 34,3 % auf nun 774 Mio. EUR deutlich weniger<br />
stark zu als die Umformtechnik mit einem Volumen von<br />
928 Mio. EUR sowie einem Zuwachs von 82,1 %. Der Anteil<br />
an der gesamten Auslandsproduktion hat sich damit etwas<br />
in Richtung Umformtechnik verschoben. 55 % der <strong>im</strong> Ausland<br />
hergestellten Maschinen sind aus dem Bereich der Umformtechnik,<br />
während 45 % der Zerspanung zugeordnet<br />
werden.<br />
Republic of China is dominating development, there are<br />
already locations where output is still modest but growing<br />
rapidly. Although commitment here tends to be in its early<br />
stages, it will intensify in the future, particularly in China,<br />
due to heightened local-content requirements and specifically<br />
targeted <strong>im</strong>port barriers favouring domestic production.<br />
Nearly every major machine tool manufacturer operates<br />
one or more production facilities or assembly plants abroad.<br />
Inasmuch as the sector is predominated by mediumsized<br />
companies (more than half of the businesses employ<br />
250 people or less), financial and staffing constraints l<strong>im</strong>it<br />
production outsourcing.<br />
Apart from several hundred sales and service subsidiaries<br />
or branch offices of German machine tool manufacturers<br />
throughout the world, there are probably less than 20 German<br />
corporations producing complete units abroad at this<br />
t<strong>im</strong>e. Recently, 49 production sites in 13 countries were<br />
identified. Production abroad increased by 56.9% over<br />
2010, attaining EUR 1.7 billion.<br />
The share of production abroad as a share of total machine<br />
tool production worldwide within the group of participants<br />
was nearly 29%, which was 1 percentage point higher than<br />
in 2010.<br />
With regard to regional distribution, the production volume<br />
in all countries increased significantly over the previous<br />
year. But the European and American manufacturing locations<br />
still had a hard t<strong>im</strong>e reaching the production values<br />
of 2008, whilst China and Brazil had already recovered all<br />
of the ground they had lost in the collapse of the crisis year.<br />
With a 63% share and a production volume of EUR 1.07<br />
billion, Europe nevertheless remained at the top in terms<br />
of the hierarchy of production locations. It was followed<br />
by North America with 19%, South America with 10% and<br />
Asia with 8%. Regarding the technologies, metal-cutting<br />
grew much less dramatically (with a 34.3% increase to<br />
EUR 774 million) than forming technology (with a volume<br />
of EUR 928 million and 82.1% growth). This shifted the<br />
share of the total production abroad somewhat towards<br />
forming technology. Of the machines manufactured abroad,<br />
55% were from the forming technology area and 45% were<br />
classified under metal-cutting.
24<br />
Spanende und umformende Technologie: Andere Kundenstruktur<br />
prägt unterschiedliche Nachfrageverläufe<br />
Metal-cutting and metal-forming technologies: Different<br />
customer profiles affect different demand patterns<br />
Als <strong>im</strong> Zeitablauf üblicherweise recht konstant dürfen die<br />
Beiträge beider Aggregate zur <strong>deutsche</strong>n <strong>Werkzeugmaschinen</strong>produktion<br />
gelten. Im Zeitraum Januar bis September<br />
<strong>2012</strong> belaufen sich diese Anteile auf „klassische“ 74 %<br />
(5,5 Mrd. EUR) und 26 % (1,9 Mrd. EUR).<br />
As usual over t<strong>im</strong>e, the two elements of German machine<br />
tool production made essentially constant contributions to<br />
earnings. During the period from January to September<br />
<strong>2012</strong> they assumed the “classic” proportions of 74% (EUR<br />
5.5 billion) and 26% (EUR 1.9 billion).<br />
Der oft auftretende Phasenversatz zwischen dem Beschaffungsverhalten<br />
der Automobil<strong>industrie</strong>, mit lange vorgeplanten<br />
Projekten und strategischer Ausrichtung, und der<br />
viel stärker konjunkturabhängigen Nachfrage <strong>im</strong> Mittelstand<br />
kann zu recht unterschiedlichen Verläufen in der<br />
Produktionsentwicklung bei umformenden (Großpressen!)<br />
und spanenden <strong>Werkzeugmaschinen</strong> führen. Mit technologischem<br />
Strukturwandel oder Gefälle in der Innovationsfähigkeit<br />
hat der eingeschränkte oder auch einmal gänzlich<br />
ausbleibende Gleichschritt der beiden großen <strong>Werkzeugmaschinen</strong>aggregate<br />
nichts zu tun!<br />
<strong>Die</strong> für das Gesamtjahr <strong>2012</strong> bereits ausgewiesene Umsatzentwicklung<br />
gemäß VDMA-Indexstatistik (das letzte<br />
Vierteljahr der amtlichen Produktionsstatistik liegt noch<br />
nicht vor) belegt deutlich die sehr unterschiedlichen Auftragseingangs-<br />
und Umsatzverläufe der spanenden und<br />
umformenden Technologie. Während das Auftragseingangs -<br />
volumen in der Umformtechnik nur um 2 % zurückgeht und<br />
hier insbesondere die inländischen Bestellungen, bis auf<br />
den Beginn des <strong>Jahr</strong>es, zweistellige Zuwachsraten zu verzeichnen<br />
haben, muss die Zerspanung mit einem Rückgang<br />
von 13 % <strong>im</strong> Auftragseingang zufrieden sein. Im Umsatz<br />
hingegen zeigt sich das gegenteilige Bild. Während die Umformtechnik<br />
durch zwei gute Schlussmonate zumindest<br />
noch bei einem knappen Plus von 1 % landet, bewegt sich<br />
der Umsatzzuwachs bei den spanenden Unternehmen<br />
fast das ganze <strong>Jahr</strong> über bei zweistelligen Raten und pendelt<br />
sich am Ende bei einem soliden Plus von 11 % ein.<br />
The procurement behaviour of the automotive industry –<br />
with its projects planned well in advance and its strategic<br />
orientation – often differs sharply from the demand of<br />
small and medium-sized companies, which is far more<br />
dependent on economic conditions. The resulting phase<br />
shift can create rather different production development<br />
patterns with metal-forming (large-scale presses!) and<br />
metal-cutting machine tools. The partial or even total<br />
diss<strong>im</strong>ilarity in performance between the two major machine<br />
tool segments has nothing to do with structural<br />
transformation of technology or d<strong>im</strong>inished innovative<br />
capacity.<br />
For the full year <strong>2012</strong>, however, the turnover trend listed<br />
according to VDMA index statistics (the last quarter of official<br />
production statistics has not been released yet) clearly<br />
confirms that the evolution of incoming orders and turn -<br />
ov er differed significantly between metal-cutting and forming<br />
technology. Whilst the incoming order volume in forming<br />
technology fell by only 2% – whereby domestic orders in<br />
particular posted two-digit rates of growth here except at<br />
the start of the year – metal-cutting was forced to accept<br />
a 13% decline in incoming orders. In terms of turnover, on<br />
the other hand, the picture was exactly inverted. Whilst<br />
forming technology was at least able to finish with barely<br />
1% growth thanks to two good final months, the growth<br />
rate of turnover for metal-cutting equipment companies<br />
registered in double digits almost all year long, ult<strong>im</strong>ately<br />
settling out with a solid 11% increase.<br />
Bearbeitungszentren, das Drehen, Schleifen,<br />
Fräsen und die Blechbearbeitung dominieren die<br />
Strukturen nach Fertigungsverfahren<br />
Machining centres, turning, grinding, milling and<br />
sheet-metal machining dominate the structures<br />
according to manufacturing process<br />
Volumenstärkste Sektoren unter den spanenden bzw. abtragenden<br />
<strong>Werkzeugmaschinen</strong> sind in der Kumulation der<br />
ersten 3 Quartale <strong>2012</strong> die Bearbeitungszentren/flexiblen<br />
Systeme (Produktionswert von 1,38 Mrd. EUR, gegenüber<br />
1,14 Mrd. EUR in der Referenzperiode des Vorjahres) sowie<br />
das Technologiefeld der Drehmaschinen/Drehzentren<br />
(1,1 Mrd. EUR bzw. 1,0 Mrd. EUR <strong>im</strong> Vergleichszeitraum 2011),<br />
The two metal-cutting / EDM machine tool sectors which<br />
posted the highest cumulative volume over the first three<br />
quarters of <strong>2012</strong> were the machining centres / flexible systems<br />
segment (production value of EUR 1.38 billion as opposed<br />
to EUR 1.14 billion during the reference period of the<br />
previous year) and the technical field of lathes / turning<br />
centres (EUR 1.1 billion and EUR 1.0 billion in the compara-
Produktion<br />
Production<br />
25<br />
Aktuelle technologische Trends<br />
Current technological trends<br />
Hochleistungsprozesse<br />
Hochleistungsbearbeitung:<br />
Reduzierung der Bearbeitungszeit durch Steigerung der Schnitt- und Vorschub -<br />
geschwindigkeiten. Grundlage hierfür sind neue Maschinenkonzepte sowie<br />
leistungsstarke Komponenten und Schneidstoffe.<br />
Trockenbearbeitung/Min<strong>im</strong>almengenschmierung:<br />
Reduzierung von bzw. Verzicht auf Kühlschmierstoffe bei der Zerspanung zur<br />
Verringerung der Umweltbelastung und der Produktionskosten.<br />
Hartbearbeitung:<br />
Zerspanung, insbesondere Feinbearbeitung, gehärteter Werkstoffe mit definierter<br />
Schneide (Drehen, Fräsen, Bohren).<br />
Hybride Prozesse<br />
Unterstützung von Bearbeitungsprozessen durch Zusatzenergie, z. B. ultraschall- oder<br />
laserunterstützende Verfahren.<br />
Mikrobearbeitung<br />
Spanende und nichtspanende Bearbeitungsverfahren zum Erzeugen miniaturisierter<br />
Werkstücke, zum Teil mit Geometrieabmessungen <strong>im</strong> Mikrometer- und Oberflächen<br />
<strong>im</strong> Nanometerbereich.<br />
Laser-Materialbearbeitung<br />
Laser-Strahlquellen:<br />
Höhere Leistungsklassen, Miniaturisierung, Flexibilitätssteigerung durch neuartige<br />
Strahlführungen, Diodenlaser, Scheibenlaser, Faserlaser.<br />
Laser-Anlagen:<br />
Schneidsysteme mit höchster Prozessdynamik, kompakte und gut integrierbare<br />
Markier- und Beschriftungssysteme, innovative Lösungen für das Schweißen, Mikround<br />
Kurzpulsbearbeitung.<br />
Komplettbearbeitung/Prozesskettenverkürzung<br />
Integration verschiedener Bearbeitungsverfahren wie Drehen, Fräsen, Verzahnen,<br />
Schleifen in einer Maschine zur Fertigbearbeitung des Werkstückes.<br />
Rekonfigurierbare Fertigungssysteme<br />
Stückzahl- und Technologieflexibilität bezüglich neuer Teilespektren zur lebensdaueropt<strong>im</strong>ierten<br />
Nutzung investitionsintensiver Anlagen.<br />
Direktantriebe<br />
Linear- und Torquemotoren mit hoher Dynamik und einfachem Aufbau zur unmittel -<br />
baren Erzeugung linearer und rotatorischer Bewegungen.<br />
Rapid Prototyping<br />
Schnelle Realisierung von Prototypen und Vorserien neuer Produkte zur Geometrieund<br />
Funktionsprüfung.<br />
Faserverbundwerkstoffe<br />
Bearbeitungsverfahren für Faserverbundwerkstoffe zur Realisierung von<br />
Leichtbaupotenzialen.<br />
Steuerungen<br />
Innovative Steuerungen halten mit den wachsenden Anforderungen Schritt.<br />
Dezentralisierung, Vernetzung, Ferndiagnose über Internet, Fehlererkennung bis zur Ebene<br />
der Feldgeräte (z. B. Sensoren, Aktoren) kennzeichnen die zukünftigen Herausforderungen.<br />
Durchgängige CAX-Verfahrensketten<br />
Leistungsstarke CAD-CAM-Kopplungen sowie die entsprechende Anbindung an die<br />
CNC sind die Voraussetzungen für durchgängige Verfahrensketten von digitalen<br />
Produktmodelldaten bis zum fertigen Bauteil.<br />
S<strong>im</strong>ulation/Virtual Reality/Augmented Reality<br />
Leistungsfähige Werkzeuge und Rechnerunterstützung helfen Konstrukteuren und<br />
Entwicklern bei der Schaffung genauer und wirtschaftlicher Fertigungssysteme sowie<br />
der Planung leistungsfähiger Produktionsprozesse für die Zukunft.<br />
Energie- und Ressourceneffizienz<br />
Energie- und ressourceneffiziente <strong>Werkzeugmaschinen</strong> dienen als Grundlage für<br />
ökologisch verbesserte Produkte.<br />
High-performance processes<br />
High-performance machining:<br />
Reduction of machining t<strong>im</strong>e by increase of cutting speed, based on<br />
new machine concepts as well as powerful components and cutting<br />
materials.<br />
Dry machining / min<strong>im</strong>um quantity lubrication:<br />
Reduction or el<strong>im</strong>ination of coolants in machining in order to reduce environmental<br />
<strong>im</strong>pact and production cost.<br />
Hard machining:<br />
Cutting and specifically finishing of hardened materials by means of a defined<br />
cutting edge (turning, milling, drilling, boring).<br />
Hybrid processes<br />
Support of machining processes through additional energy, e. g. ultrasonic or laserbased<br />
processes.<br />
Micro processing<br />
Metal-cutting and non-metal-cutting processes for generation of miniaturised<br />
components, partially having geometric d<strong>im</strong>ensions in the micron and surfaces<br />
in the nano range.<br />
Lasers in material processing<br />
Laser beam sources:<br />
Higher output, miniaturisation, increased flexibility by means of new beam control,<br />
diode lasers, disc lasers, fibre lasers.<br />
Laser systems:<br />
Cutting systems with extremely high process dynamics, compact and easy-to-integrate<br />
marking and inscribing systems, innovative solutions for welding, micro processing,<br />
ultra short pulse processing.<br />
Complete machining / shortening of process chains<br />
Integration of various machining processes such as turning, milling, gear cutting,<br />
grinding in a single machine to finish the workpiece in one set-up.<br />
Reconfigurable manufacturing systems<br />
Flexible piece numbers and technology facilitate new ranges of parts for<br />
lifet<strong>im</strong>e-opt<strong>im</strong>ised utilisation of investment-intensive plants.<br />
Direct drives<br />
Highly dynamic linear and torque motors of s<strong>im</strong>ple construction for direct generation<br />
of linear and rotary movements.<br />
Rapid prototyping<br />
Rapid realisation of prototypes and pre-series products for<br />
geometrical and functional testing.<br />
Composite technology<br />
Manufacturing processes for the realisation of lightweight construction potential<br />
with fibre-compound materials.<br />
Control systems<br />
Innovative control systems are keeping up with growing requirements.<br />
of field equipment (such as sensors, actuators) are characterising future challenges.<br />
Decentralisation, networks, remote diagnostics via internet, error detection up to the level<br />
Continuous CAX process chains<br />
Continuous process chains from the digital product model data to the finished<br />
component require powerful CAD-CAM interfaces and the corresponding integration<br />
in the CNC system.<br />
S<strong>im</strong>ulation / virtual reality / augmented reality<br />
Efficient tools and computer-aided systems are helping designers and developers<br />
in creating precise and economic manufacturing systems as well as planning<br />
powerful production processes for the future.<br />
Energy and resource efficiency<br />
Machine tools that make efficient use of energy and resources serve as a basis for<br />
ecologically enhanced products.
26<br />
gefolgt von der Schleiftechnik (845 Mio. EUR), von Fräsmaschinen<br />
(644 Mio. EUR) und Mehrwegemaschinen<br />
(451 Mio. EUR).<br />
ble period of 2011, respectively), followed by grinding technology<br />
(EUR 845 million), milling machines (EUR 644 million)<br />
and multi-station transfer machines (EUR 451 million).<br />
<strong>Die</strong> Ausweitung etablierter Einsatzfelder bzw. Diversifizierung<br />
in neue Anwendungsgebiete spiegelt sich in verstärkter<br />
Auflösung klassischer Unterscheidungen in Dreh-, Fräs-,<br />
Schleif- und Laserbearbeitung wider. Kombinierte Verfahren<br />
liegen <strong>im</strong> Trend. Es gilt, Prozessketten zu verkürzen, hochdynamische<br />
Lösungen anzustreben und somit Produktivität<br />
zu steigern. Andererseits ist die Teilsubstitution von Transferlinien/Mehrwegemaschinen<br />
durch verkettete Bearbeitungszentren<br />
als Plädoyer für mehr Flexibilität und Rekonfigurierbarkeit<br />
anstelle hoher Ausbringungsmengen, die<br />
aber in den Schwellenländern durchaus ebenfalls gefordert<br />
bleiben können, zu interpretieren.<br />
Expansion of established application areas and diversification<br />
into new ones reflected the accelerated pace with which<br />
the classic differentiations among turning, milling, grinding<br />
and laser machining are melting away. The trend favoured<br />
combined methods that shorten process chains and work<br />
to achieve highly dynamic solutions, thereby increasing<br />
productivity. On the other hand, the partial use of interlinked<br />
machining centres as a substitute for transfer lines or<br />
multi-station transfer machines could be seen as a plea for<br />
greater flexibility and re-configurability rather than high<br />
output, although this might well remain in demand in the<br />
emerging countries.<br />
Musterbeispiele für erfolgreiche Diversifikation –<br />
Erschließung neuer Einsatzbereiche<br />
Perfect examples of successful diversification –<br />
development of a new application area<br />
Bei Laseranlagen für die Materialbearbeitung ließ sich der<br />
Produktionswert zwischen dem weltweiten Krisenjahr<br />
2009 und 2011 um mehr als 90 % steigern und fast wieder<br />
an das Niveau <strong>im</strong> Boomjahr 2008 heranführen. Wegen<br />
unspezifischer Definition der betreffenden Meldepositionen<br />
in der amtlichen Statistik wird dies nur sehr eingeschränkt<br />
bewusst. Wirklich aussagefähig sind hier allein die Eigenerhebungen<br />
des Verbandes. Mit zunehmender <strong>industrie</strong>ller<br />
Verbreitung gerade des volumenstarken Laserschneidens<br />
hatte sich auch die Lasermaterialbearbeitung der internatio -<br />
nalen Nachfragekrise 2009 nicht entziehen können. Man<br />
musste gegenüber der allgemeinen <strong>Werkzeugmaschinen</strong><strong>industrie</strong><br />
(–28%) sogar deutlich überproportionale Einbußen<br />
<strong>im</strong> Produktionswert von mehr als 50 % hinnehmen,<br />
weil wegen schnellerer Durchlaufzeiten in den Herstellerfirmen<br />
solcher Lasersysteme eine Pufferwirkung durch<br />
hohen Auftragsbestand weitgehend entfällt. Allerdings<br />
bedeutet dies in Aufschwungphasen wie 2010 auch<br />
schnellere Realisierbarkeit der Orders <strong>im</strong> Umsatz bzw. Produktionswert.<br />
So ist das Wachstum in 2010 tatsächlich in<br />
der Lage, den schweren Umsatzeinbruch des Vorjahres<br />
sprungartig mehr als auszugleichen! Das <strong>Jahr</strong> 2011 steht<br />
dann für weitere Erhöhung des Volumens in der Größenordnung<br />
von fast einem Viertel. <strong>2012</strong> steht für annähernde<br />
Querbewegung, von sehr hohem Niveau ausgehend. Realisiert<br />
wird am Standort Deutschland ein Zuwachs von weniger<br />
als 2 %. Weltweite Konsolidierung ergibt, als Ergebnis<br />
konsequent globalisierter Produktion, ein deutlich stattlicheres<br />
Plus.<br />
Between the global crisis year of 2009 and 2011, the production<br />
value of laser installations for the machining of<br />
materials rose by more than 90% and has nearly reached<br />
the level of the boom year 2008 again. Owing to the classification’s<br />
vague definition in official statistics, this has generally<br />
gone unnoticed. Only the association’s own surveys<br />
are truly meaningful for this purpose. With strong volumes<br />
buoyed in particular by the increasing industrial penetration<br />
of laser-cutting, the laser-machining of materials had also<br />
been unable to escape the international crisis in demand in<br />
2009. Relative to the decline in the general machine tool<br />
industry (-28%), the more than 50% downturn in production<br />
value here was disproportionately heavy, because the more<br />
rapid turnaround t<strong>im</strong>es in companies that manufacture<br />
such laser systems largely el<strong>im</strong>inated the buffer effect that<br />
a high order backlog would have provided. Nevertheless,<br />
this also translates into an ability to convert orders into<br />
turnover and production value faster during recovery phases<br />
such as 2010. In this way, the sudden growth in 2010 was<br />
actually more than able to compensate for the previous<br />
year’s steep decline in turnover. Then 2011 brought further<br />
recovery with something on the order of nearly one third<br />
more volume. <strong>2012</strong> evolved along an essentially flat trajectory,<br />
starting from a very high level. Germany as a manufacturing<br />
location grew at a rate of less than 2%. As a consequence<br />
of consistently globalised production, worldwide<br />
consolidation yielded a far more <strong>im</strong>pressive increase.
Produktion<br />
Production<br />
27<br />
Laserschneidanlagen für die Flexible Blechbearbeitung stehen<br />
nach wie vor für den größten Umsatzanteil. <strong>Die</strong> Nachfrage<br />
hinsichtlich Laserschneiden dreid<strong>im</strong>ensionaler Bauteile aus<br />
Blech, insbesondere von Rohren und Profilen, steigt 2010<br />
ebenfalls zweistellig an. In 2011 ergibt sich erneut ein mit t-<br />
leres einstelliges Plus, <strong>2012</strong> steht für einen mittleren einstelligen<br />
Abschlag als Folge neuerlicher weltwirtschaftlicher<br />
St<strong>im</strong>mungseintrübung.<br />
Herausragendes Applikationsbeispiel ist ferner das Laserschweißen<br />
nichtlinearer Nähte und maßgeschneiderter<br />
Baugruppen (Tailored Blanks) <strong>im</strong> Leichtbau der Automobil<strong>industrie</strong>.<br />
Das Remote-Schweißen, also Laser-Schweißprozesse<br />
über deutlich größere Abstände zum Werkstück <strong>im</strong><br />
freien Raum, ermöglicht spektakuläre Investitionskostensenkung<br />
und Taktzeitverkürzung. <strong>Die</strong> Fertigung von Airbagoder<br />
Abgaskomponenten sowie die Bearbeitung von Getriebe-<br />
und Kupplungselementen sorgen ebenso für<br />
Wachstum.<br />
Hinzu tritt in jüngerer Zeit massiv die Mikromaterialbearbeitung<br />
bzw. Feinstbearbeitung mit Laser, ein Feld in dem<br />
sich laufend – Werkstoff- und Anwenderbranchen-übergreifend<br />
– vielversprechende Neuapplikationen ergeben.<br />
Aktuell qualifizieren sich Laseranlagen als effizienzsteigernde<br />
erste Wahl für das Schneiden, Markieren, Kantenisolieren/<br />
- Randentschichten oder Strukturieren von Solarmodulen in<br />
der Photovoltaik<strong>industrie</strong>.<br />
<strong>Die</strong> Erzeugung von ultrakurz gepulstem, hochenergetischem<br />
Laserlicht (UKP-Laser), z. B. zur schonenden „Kalten Bearbeitung“<br />
ohne thermische Belastung der Werkstücke, öffnet<br />
ein weites Spielfeld. Anwendungsgebiete von UKP- Strahlquellen<br />
sind neben der schon erwähnten Photovoltaik: das<br />
Trennen dünner, gehärteter Display-Gläser, das Schneider<br />
sprödharter Keramik und von polyikristallinem Diamant,<br />
das Bohren von Kontaktlöchern bzw. Abtragen von dielek -<br />
t rischen und metallischen Schichten <strong>im</strong> Halbleitermarkt, das<br />
Schneidern von Implantaten aus Titan in der Medizintechnik<br />
sowie das „kalte“ Laserbohren von Einspritzdüsen <strong>im</strong> Automotive-Bereich.<br />
Der Direkteinsatz von Hochleistungsdiodenlasern sorgt für<br />
eine Vielzahl komplementärer Anwendungen modernsten<br />
Zuschnitts, wobei das insbesondere <strong>im</strong> Bereich der Karosseriefertigung<br />
erfolgreiche Aluminiumschweißen exemplarisch<br />
zu nennen ist. <strong>Die</strong>se Strahlquellen stoßen nämlich bei Aluminiumwerkstoffen<br />
auf besonders gute Absorption.<br />
Laser-cutting machines used in the flexible machining of<br />
sheet metal continued to account for the biggest share<br />
of sales. Demand relative to the laser-cutting of threed<strong>im</strong>ensional<br />
sheet-metal components – especially pipes<br />
and profile sections – also posted a two-digit increase in<br />
2010. There was a renewed mid-single-digit increase in<br />
2011, but <strong>2012</strong> registered a mid-single-digit decline as a<br />
result of a resurgence in pess<strong>im</strong>istic attitudes concerning<br />
the global economy.<br />
Another application area that illustrates this point extremely<br />
well is the laser-welding of non-linear seams and made-tomeasure<br />
components (tailored blanks) used in lightweight<br />
construction for the automotive industry. Remote welding,<br />
i.e. laser-welding processes performed in an open workspace<br />
and at markedly greater distances from the workpiece,<br />
made it possible to achieve spectacular reductions in invest -<br />
ment costs and cycle t<strong>im</strong>es. The fabrication of components<br />
for airbag assemblies or exhaust systems and the machining<br />
of gear and clutch elements also provided growth.<br />
Moreover, the industry has recently seen a massive amount<br />
of micro-material machining by means of lasers – a field<br />
where promising new developments are constantly emerging<br />
across the full spectrum of materials and applications.<br />
Laser machines currently represent the photovoltaic industry’s<br />
system of choice for <strong>im</strong>proving efficiency in cutting,<br />
marking, edge insulation / deletion and structuring operations<br />
used in the production of solar modules.<br />
The generation of ultra-short pulse, high-energy laser light<br />
(USP lasers) – for example for gentle “cold machining” wit h -<br />
out subjecting the workpiece to thermal stress – is opening<br />
up a broad range of opportunity. In addition to the aforementioned<br />
area of photovoltaics, application areas for USP<br />
radiation sources include: the separation of thin, hardened<br />
display glasses, the cutting of brittle-hard ceramics and<br />
polycrystalline diamond, the drilling of contact holes and<br />
the ablation of dielectric and metallic layers in the semiconductor<br />
market, the cutting of <strong>im</strong>plants made of titanium<br />
in medical technology and the “cold” laser drilling of injector<br />
nozzles.<br />
The direct use of high-power diode lasers provides opportunities<br />
for numerous complementary applications involving<br />
state-of-the-art tr<strong>im</strong>ming, whereby aluminium welding –<br />
which has been particularly successful in the field of automotive<br />
body fabrication – is a noteworthy example. That<br />
is because these beam sources encounter especially good<br />
absorption with aluminium materials.
28<br />
Das Potenzial von Faserlasern n<strong>im</strong>mt <strong>im</strong> Rahmen geeigneter<br />
Einsatzfälle weiter rasch zu.<br />
The potential of fibre lasers continues to increase rapidly in<br />
the context of suitable application cases.<br />
In der Umformtechnik spielen Pressen und Blechbearbeitungsmaschinen<br />
wertmäßig die bedeutendste Rolle. <strong>Die</strong><br />
innerhalb der Europäischen Union erfolgte Vereinheitlichung<br />
der für die Produktionsstatistik gültigen Nomenklaturen<br />
hat dazu geführt, dass beide Begriffe statistisch<br />
nicht mehr klar gegriffen werden können.<br />
In metal-forming technology, presses and sheet-metal machining<br />
centres generated the largest share of value. Owing<br />
to the standardisation of the official nomenclature used to<br />
track production statistics within the European Union, the<br />
statistical weight of these two classifications is no longer<br />
entirely clear.<br />
Pressen stehen 2011 für ein Produktionsvolumen von rund<br />
757 Mio. EUR bzw. für 532 Mio. EUR in den ersten drei<br />
Quartalen <strong>2012</strong>, wobei Pressentechnik zum Teil noch über<br />
andere Verfahren wie das Stanzen und Abkanten mit erfasst<br />
ist. Über 905 Mio. EUR beträgt der Produktionswert<br />
2011 bei Anlagen für die Blechbearbeitung (Januar bis September<br />
<strong>2012</strong>: 678 Mio. EUR). Schwerpunktmäßig stehen<br />
die Gruppen Scheren, Lochstanzen, Ausklinkmaschinen<br />
bzw. Biege-, Abkant- und Richtmaschinen für diesen Bereich.<br />
Interessante Verfahrenskombinationen stellen das<br />
Laserschneiden und Umformen in einem Blechbearbeitungszentrum<br />
sowie die kombinierte Laser-/Ultraschallbearbeitung<br />
dar, wo sich <strong>im</strong> Falle hochharter, spröder Werkstoffe<br />
bei gleichzeitig extremen Präzisionsanforderungen<br />
neue Möglichkeiten eröffnen. Auch lasergestützte Wärmebehandlung<br />
zur Verbesserung der Spanbarkeit von Sonderwerkstoffen<br />
gehört prinzipiell in diese Reihe.<br />
Innovationsfähigkeit ist best<strong>im</strong>mender Wettbewerbsfaktor<br />
Der Begriff „Innovationsfähigkeit“ lässt sich zweifach interpretieren.<br />
Zum einen wird darauf abgestellt, dass die <strong>Werkzeugmaschinen</strong><strong>industrie</strong><br />
selbst in der Lage ist, Tauglichkeit<br />
und Potenziale neuer Materialien und Technologien in den<br />
Markt zu tragen. Zum anderen ist das Vermögen gemeint,<br />
oft zitierte „Product Innovation by End-Users“ aufzugreifen<br />
und selbst in neue, für den harten <strong>industrie</strong>llen Alltag<br />
taugliche Maschinenkonzepte umzusetzen.<br />
Dass <strong>deutsche</strong> <strong>Werkzeugmaschinen</strong>hersteller in beiden Fällen<br />
Erstklassiges leisten und erfolgreich sind, belegen die durch<br />
umfangreiches Zahlenmaterial gestützten Beiträge in vorliegender<br />
Broschüre. Verschiedene Technologien, die früher<br />
nur in sogenannten High-End-Unternehmen der Großindus -<br />
trie als realisierbar bzw. beherrschbar erschienen, sind heute<br />
in zahlreichen kleineren und mittelständischen Betrie -<br />
b en des Maschinenbaus <strong>im</strong>plementiert.<br />
Presses represented a production volume of some EUR 757<br />
million in 2011 and EUR 532 million in the first three quarters<br />
of <strong>2012</strong>. Some press technology was still classified under<br />
other processes here, however, such as punching and edg<br />
ing. The production value for sheet-metal machining was<br />
more than EUR 905 million in 2011 (January to September<br />
<strong>2012</strong>: EUR 678 million). Shearing, punching and notching<br />
machines are the flagships of this sector along with bending,<br />
folding and straightening machines. Certain particularly<br />
attractive processing combinations permit laser-cutting<br />
and forming on a sheet-metal machining centre or combine<br />
laser and ultrasound machining, where the need to meet<br />
extreme precision requirements in the case of ultra-hard,<br />
brittle materials is opening up new opportunities. Laserbased<br />
heat treatment to <strong>im</strong>prove the machinability of<br />
special materials pr<strong>im</strong>arily falls under this category as well.<br />
Innovative capacity is a defining competitive factor<br />
The term “innovative capacity” can be interpreted in two<br />
ways. First it expresses the machine tool industry’s own<br />
ability to market the potential of suitable new materials<br />
and technologies. At the same t<strong>im</strong>e it also means examining<br />
ideas which emerge through the oft-mentioned process of<br />
“product innovation by end users” and turning them into<br />
practical machine concepts suited to the hard realities of<br />
everyday industrial routine.<br />
Supported by extensive statistical evidence, the articles in<br />
this brochure suggest that German machine tool manufacturers<br />
are doing a first-class job and achieving success in both<br />
respects. Various technologies which previously appeared<br />
achievable or manageable only in major “high-end” industrial<br />
companies have now been <strong>im</strong>plemented in a large<br />
number of small and medium-sized engineering firms.
Produktion<br />
Production<br />
29<br />
<strong>VDW</strong>-Messen EMO Hannover und METAV offerieren<br />
umfassende Technologieschaufenster<br />
<strong>VDW</strong> trade fairs EMO Hannover and METAV offer<br />
comprehensive technology showcases<br />
In den geraden Messejahren ist die METAV Düsseldorf eine<br />
Top-Veranstaltung für die Fertigungstechnik und Automatisierung<br />
in Deutschland und Europa. <strong>Die</strong> METAV <strong>2012</strong>,<br />
erste internationale Messe <strong>im</strong> laufenden <strong>Jahr</strong>, öffnete am<br />
28. Februar in Düsseldorf ihre Tore. Während der fünftägigen<br />
Laufzeit bis zum 3. März zeigten rund 690 Aussteller<br />
aus 26 Ländern ihr technologisch hochstehendes Angebot<br />
und signalisierten einmal mehr, dass die Branche gut aufgestellt<br />
ist. Insbesondere ausländische Aussteller, deren Anzahl<br />
<strong>im</strong> Vergleich zu 2010 um mehr als ein Zehntel anstieg,<br />
zeigten Flagge. Mit mehr als 36.000 m 2 Netto-Ausstellungsfläche<br />
belegte die METAV 5 Hallen auf dem Düsseldorfer<br />
Gelände. Damit ist sie <strong>im</strong> Vergleich zur Vorveranstaltung<br />
um über 12 % gewachsen. Deutsche Hersteller, mit<br />
rund 490 Firmen größte Ausstellergruppe, boten der europäischen<br />
Kundschaft, deren Nachfrage 2011 insgesamt um<br />
46 % angestiegen war, schlagende Argumente für Neuinvestitionen.<br />
Auch auf der nächsten METAV 2014 bleiben<br />
Energie- und Ressourceneffizienz in der Produktion, neue<br />
Antriebskonzepte in der Automobil<strong>industrie</strong> oder die<br />
Anwendung neuer Materialien in zahllosen Anwenderbereichen<br />
echte Mega-Themen. Gleiches gilt für <strong>im</strong> Zuge des<br />
Rahmenprogramms adressierte Aspekte, wie innovative<br />
Zerspanungsprozesse, Fertigungskonzepte für die Medizintechnik,<br />
Produktionslösungen mit Blick auf Elektromobilität<br />
oder die Bearbeitung von Faserverbundwerkstoffen.<br />
EMO Hannover 2013 – Weltleitmesse der Metallbearbeitung<br />
In the even trade fair years, METAV Düsseldorf is one of the<br />
top events for manufacturing technology and automation<br />
in Germany and Europe. METAV <strong>2012</strong>, the first international<br />
trade fair of the current year, opened its doors on 28 February<br />
in Düsseldorf. During the five-day period ending on<br />
3 March, some 690 exhibitors from 26 countries presented<br />
their premium technological offerings and signalled once<br />
again that the industry is well positioned. Foreign companies<br />
made an especially strong showing, with 10% more<br />
exhibitors than in 2010. METAV filled five halls totalling<br />
more than 36,000 m2 of net exhibition space at the trade<br />
fair grounds in Düsseldorf. That means it was 12% bigger<br />
than its predecessor. With a contingent of about 490 manufacturing<br />
companies, the German exhibitors provided<br />
persuasive arguments for new investment to European<br />
clientele, whose overall demand grew by 46% in 2011.<br />
Several genuine mega-topics will remain at the forefront<br />
of the next METAV in 2014: energy and resource efficiency<br />
in production, new drive concepts in the automotive industry,<br />
and the use of new materials in countless application<br />
areas, for example. The same applies for aspects addressed<br />
by the supporting programme, such as innovative metalcutting<br />
processes, manufacturing concepts for medical<br />
technology, production solutions relative to electromobility,<br />
or the machining of fibre-reinforced composites.<br />
EMO Hannover 2013 – the world’s leading trade fair for<br />
the metalworking industry<br />
Traditioneller Höhepunkt der ungeraden Messejahre und<br />
international bedeutendste Ausstellung für Technologie<br />
der Metallbearbeitung ist die EMO mit Austragungsort<br />
Hannover oder Mailand. Nach 2011 findet diese unbestrittene<br />
Weltleitmesse vom 16. bis 21. September 2013 wieder<br />
in Hannover statt. Im <strong>Jahr</strong> 2015 ist dann Mailand mit der<br />
Ausrichtung am Zug.<br />
The traditional highpoint of uneven trade fair years and the<br />
world’s leading exhibition for metalworking technology is<br />
the EMO, which is held either in Hannover or in Milan. For<br />
the first t<strong>im</strong>e since 2011, this undisputed world leader<br />
among trade fairs will be held in Hannover again – from 16<br />
until 21 September 2013. And then in 2015 it will be Milan’s<br />
turn to organise everything.<br />
Um die Bedeutung der EMO Hannover 2013 zu unterstreichen,<br />
bietet sich der Blick auf die vorangegangene Veranstaltung<br />
2011 an. Von 2.037 Ausstellern aus 41 Ländern<br />
auf 176.435 m 2 belegter Standfläche fühlten sich rund<br />
140.000 Besucher aus über 100 Ländern angesprochen. <strong>Die</strong><br />
positive St<strong>im</strong>mung in der Branche zeigte sich in den Messehallen.<br />
Mehr als die Hälfte der Besucher hatte Entscheidungskompetenz<br />
bei Beschaffung und Einkauf. Entsprech end<br />
kamen 55 % der Fachbesucher mit konkreten Inves titionsabsichten<br />
auf die EMO. Bei den ausländischen Gästen wa-<br />
In order to underscore the significance of EMO Hannover<br />
2013, it is useful to consider the previous event in 2011.<br />
Some 140,000 visitors who arrived from more than 100<br />
countries were solicited by 2,037 exhibitors from 41 countries<br />
who occupied 176,435 m2 of stand area. The positive<br />
mood in the industry was palpable in the halls of the exhibition<br />
centre. More than half of the visitors had decisionmaking<br />
authority for purchasing and procurement. Accordingly,<br />
55% of the professional visitors came to the EMO<br />
fair with concrete investment intentions. Among foreign
30<br />
ren es sogar 75 %. Rund die Hälfte der Besucher wollte in<br />
die Erweiterung ihrer Kapazitäten, 20 % erstmals in <strong>Werkzeugmaschinen</strong><br />
investieren. Insgesamt wurden allein während<br />
der sechstägigen Laufzeit der EMO Aufträge mit einem<br />
Volumen von mindestens 4,5 Mrd. EUR erteilt. <strong>Die</strong><br />
Aussteller lobten vor allem die hohe Internationalität der<br />
Besucher. Knapp 40 % der EMO- Gäste kamen aus dem Ausland.<br />
<strong>Die</strong> EMO ist mit ihrem hohen Anteil internationaler<br />
Besucher damit einmalig in der Branche und spiegelt die<br />
voranschreitende Globalisierung wider. Bei den ausländischen<br />
Fachbesuchern verschoben sich die Anteile von den<br />
europäischen hin zu den asiatischen und südamerikanischen<br />
Besuchern um gut 6,5 %punkte.<br />
guests, the corresponding figure was actually 75%. About<br />
half of the visitors wanted to invest in the expansion of<br />
their capacities and 20% intended to invest in machine<br />
tools for the first t<strong>im</strong>e. A total order volume of at least EUR<br />
4.5 billion was placed during the six-day period of the EMO<br />
event alone. Exhibitors particularly appreciated the highly<br />
international character of the visiting public. Nearly 40% of<br />
EMO guests came from outside of Germany. Its high share<br />
of international visitors makes the EMO trade fair unique in<br />
the industry and reflects the advanced degree of globalisation.<br />
Among the professional visitors from outside of Germany,<br />
the European share shifted by a full 6.5 percentage<br />
points in favour of Asian and South American visitors.<br />
Auch 2013 kann die EMO Hannover wieder mit hochkarätigen<br />
Veranstaltungen aufwarten. Wie schon 2011 bringt der<br />
EMO-Kongress zum Thema „Neue Fertigungstechnologien<br />
in der Luft- und Raumfahrt“ Experten aus Industrie und<br />
Forschung zusammen, um die aktuellsten Entwicklungen<br />
und zukünftige Herausforderungen der Branche zu diskutieren.<br />
Begleitet wird der Kongress von der Sonderschau<br />
„Innovationen gestern – heute – morgen: wirtschaftliche<br />
Prozesslösungen für Qualitätsbauteile“, die während der<br />
gesamten Messelaufzeit stattfindet. Erstmals findet 2013<br />
zudem der Kongress „Intelligenter Produzieren“ <strong>im</strong> Rahmen<br />
der EMO statt. Unter dem Motto „Inspired by technology“<br />
dreht sich auf dem Kongress alles um die Möglichkeiten<br />
des intelligenten Produzierens. Außerdem veranstaltet der<br />
<strong>VDW</strong> das „EMO Fokus Indien“-Seminar. Indien war 2011<br />
nach Deutschland das wichtigste Besucherland mit einem<br />
Anteil von über 10 % und mehr als 5.000 Besuchern. Darin<br />
spiegelt sich die wachsende Bedeutung des indisch en<br />
Marktes für die <strong>Werkzeugmaschinen</strong><strong>industrie</strong> wider.<br />
Experten beleuchten neben der aktuellen wirtschaft lichen<br />
Situation insbesondere Aspekte aus den Bereichen Recht,<br />
Steuern und Finanzierung. Abgerundet wird das Seminar<br />
mit Best-Practice-Beispielen erfahrener Unternehmen der<br />
Branche.<br />
High-calibre events can be expected once again at EMO<br />
Hannover in 2013. As in 2011, the EMO conference on “New<br />
manufacturing technologies in the aerospace industry” will<br />
bring together experts from industry and research in order<br />
to discuss the industry’s latest developments and future<br />
challenges. The conference will be accompanied by the<br />
special show “Past, present and future innovations: econom -<br />
ic process solutions for quality components”, which will be<br />
on show throughout the trade fair. Within the framework<br />
of the EMO, the congress “Producing more intelligently” will<br />
also be held for the first t<strong>im</strong>e in 2013. Under the banner<br />
“Inspired by technology”, the congress addresses every aspect<br />
of intelligent production and its potential opportunities.<br />
In addition, the <strong>VDW</strong> will be hosting the “EMO<br />
focus on India” seminar. In 2011, India was the country with<br />
the second largest number of visitors (after Germany) with<br />
more than 5,000 guests and a 10% share of the total. That<br />
reflected the growing significance of the Indian market for<br />
the machine tool industry. Along with the current economic<br />
situation, experts will focus on aspects specifically related to<br />
the areas of law, taxes and finance. Examples of best<br />
practices from experienced companies in the sector will<br />
round out the seminar.
<strong>Werkzeugmaschinen</strong>-Außenhandel<br />
XXX 31<br />
XXX<br />
Foreign trade in machine tools<br />
Formbau für die Automobilbranche: Auf dieser Maschine werden Formbauteile in Komplettbearbeitung mit Fräsen und Drehen gefertigt.<br />
Mould making for the automotive industry: Mould components are milled and turned on this machine in a complete machining operation.
32<br />
XXX<br />
XXX<br />
Export erreicht in <strong>2012</strong> neues Rekordniveau<br />
Export reaches new record level in <strong>2012</strong><br />
Nach der tiefen Wirtschafts- und Finanzkrise 2009 erholte<br />
sich die <strong>Werkzeugmaschinen</strong>nachfrage schneller und kräftiger<br />
als erwartet. Gemäß Daten des <strong>VDW</strong>-Prognosepartners<br />
Oxford Economics stieg die weltweite Industrieproduktion<br />
2010 um 9,7 % und 2011 um nochmals 4,3 %. <strong>Die</strong> Investitionen<br />
wichtiger Kundensegmente zeigten zweistellige<br />
Steigerungsraten von 10,1 % und 15,9 %. Vor dem Hintergrund<br />
einer insbesondere von Asien und Amerika angetriebenen<br />
Weltkonjunktur zogen die Auslandsaufträge in 2010<br />
und 2011 wieder sehr stark an. <strong>Die</strong> <strong>Werkzeugmaschinen</strong>exporte<br />
reagierten wie üblich mit einem Zeitversatz auf die<br />
zunehmende Ordertätigkeit. Der hohe Anteil von High-<br />
End-Maschinen, kundenspezifischen Lösungen und Projektgeschäft<br />
in der <strong>deutsche</strong>n <strong>Werkzeugmaschinen</strong>branche<br />
erfordert eine entsprechende Durchlaufzeit von der Hereinnahme<br />
des Auftrags bis zur Realisierung <strong>im</strong> Umsatz, die <strong>im</strong><br />
Durchschnitt bei ca. drei Quartalen liegt. Der erhebliche<br />
Nachholbedarf als Folge der Krise, die teilweise regelrechte<br />
Investitionsstopps hervorrief, führte somit in 2011 zu ein<br />
em Schub für die <strong>deutsche</strong>n <strong>Werkzeugmaschinen</strong>exporte<br />
von +31 % auf ein Niveau von gut 7,9 Mrd. EUR. Das<br />
Rekordniveau aus 2008 von 8,2 Mrd. EUR war schon fast in<br />
Reichweite. Während die Exporte 2010 noch rein vom<br />
Asiengeschäft gestützt wurden, trug in 2011 die Triade<br />
insgesamt zum Wachstum bei.<br />
Amerika übern<strong>im</strong>mt mit hohen Investitionen der<br />
Automobil<strong>industrie</strong> die Rolle des Wachstumstreibers<br />
<strong>Die</strong> Weltkonjunktur zeigt in <strong>2012</strong> Bremsspuren, in Europa<br />
rutschen <strong>im</strong> Zuge der anhaltenden Schuldenkrise Industrieproduktion<br />
und Investitionen sogar spürbar ins Minus.<br />
Weltweit schwächen sich die Zuwachsraten der Industrieproduktion<br />
auf 2,5 % und der Investitionen wichtiger<br />
Kundenbranchen auf 5,1 % ab. Dennoch setzt sich der<br />
Höhenflug der <strong>Werkzeugmaschinen</strong>exporte fort. Zwar<br />
überschreiten die Bestellungen der ausländischen Kunden<br />
den oberen Wendepunkt, bleiben mit einem moderaten<br />
Minus für das Gesamtjahr von 10 % aber <strong>im</strong>mer noch auf<br />
hohem Niveau. Außerdem stützen die sehr hohen Auftragsbestände<br />
in der Branche mit Reichweiten von 8 bis 9<br />
Monaten das Ausfuhrgeschäft. <strong>Die</strong> Exporte erreichen mit<br />
einem Plus von 20 % einen neuen historischen Rekordwert<br />
in Höhe von 9,6 Mrd. EUR. <strong>Die</strong> Exportquote, also der Anteil<br />
der Ausfuhren an der Produktion, steigt auf eine ungewöhnlich<br />
hohe Marke von fast 74 %. <strong>Die</strong>s belegt die starke<br />
Position der <strong>deutsche</strong>n Hersteller, die hinter Japan den Vize-<br />
Exportweltmeister stellen, auf den weltweiten Märkten.<br />
After the serious economic and financial crisis of 2009, the<br />
demand for machine tools recovered faster and stronger<br />
than expected. According to data from <strong>VDW</strong>’s prognosis<br />
partner Oxford Economics, global industrial production rose<br />
in 2010 by 9.7% and once again in 2011 by 4.3%. Inves t-<br />
ments in major customer segments showed two-digit rates<br />
of growth (10.1% and 15.9%, respectively). Against the<br />
background of a world economy driven particularly by Asia<br />
and America, demand from abroad experienced a very<br />
strong recovery in 2010 and 2011. As usual, machine tool<br />
exports reacted with a t<strong>im</strong>e delay relative to the increasing<br />
order activity. The high share of high-end machines, customer-<br />
specific solutions and project business in the German machine<br />
tool sector requires a corresponding turnaround t<strong>im</strong>e<br />
between taking the order and realising the turnover – a<br />
process which takes about three quarters to complete on<br />
average. The considerable need to make up for ground lost<br />
as a result of the crisis, which had halted investment altogether<br />
in some cases, thus led to a surge in German machine<br />
tool exports of +31% to a full EUR 7.9 billion. The<br />
record level of EUR 8.2 billion which had been set in 2008<br />
was once again within grasp. Exports were still bolstered<br />
by the Asian business alone in 2010, but in 2011, the entire<br />
triad began to contribute to growth.<br />
With its automotive industry’s high investment<br />
levels, America becomes the growth engine<br />
In <strong>2012</strong>, the world economy’s abrupt braking left skid marks.<br />
In Europe, the ongoing debt crisis even caused industrial<br />
production and investments to decline perceptibly. On a<br />
worldwide basis, growth rates for industrial production<br />
and for investment by major customer sectors weakened<br />
to 2.5% and 5.1%, respectively. Notwithstanding this, the<br />
soaring performance of machine tool exports continued.<br />
With orders from foreign customers having exceeded the<br />
previous peak level, they remained high despite a moderate<br />
10% decline over the course of the entire year. Moreover,<br />
the export business was supported by the sector’s very<br />
high order backlogs extending 8 to 9 months out. With a<br />
20% increase, exports attained a new historic record level<br />
of EUR 9.6 billion. The export rate, i.e. the share of production<br />
shipped abroad, rose to an unusually high level of nearly<br />
74%. This testifies to the strong global market position of<br />
German manufacturers (vice-world champion exporters,<br />
second only to the Japanese).
Außenhandel<br />
Foreign trade<br />
33<br />
Deutscher <strong>Werkzeugmaschinen</strong>-Export und -Import<br />
German machine tool exports and <strong>im</strong>ports<br />
9<br />
Mrd. eur Bill. eur<br />
8<br />
7<br />
6<br />
Export<br />
Exports<br />
5<br />
4<br />
3<br />
2<br />
1<br />
0<br />
Import<br />
Imports<br />
93 94 95 96 97 98 99 00 01 02 03 04 05 06 07 08<br />
09 10 11 12<br />
Hinweis: Einschließlich<br />
Teile, Zubehör<br />
Quellen: Statistisches<br />
Bundesamt, <strong>VDW</strong>, VDMA<br />
Note: including parts,<br />
accessories<br />
Sources: German Statistical<br />
Office, <strong>VDW</strong>, VDMA<br />
Treiber bleibt wie schon <strong>im</strong> Vorjahr mit +33 % eindeutig<br />
das Amerikageschäft. <strong>Die</strong> US-Automobil<strong>industrie</strong> baut ihre<br />
Technologieinvestitionen in sparsamere Motoren und Antriebstechnologie<br />
weiter aus. Auch der europäische Markt<br />
wächst um 27 % und kann wieder etwas Boden gutmachen.<br />
Dennoch ist die Verschiebung in der Bedeutung der Absatzregionen<br />
unverkennbar. Der Anteil Europas am Gesamtexport<br />
liegt mit aktuell 45 % fast 15 Punkte unter dem Wert<br />
von 2008. Hinzu kommt eine Zweiteilung in der Entwicklung.<br />
Osteuropa stellt mit dem Leitmarkt Russland und<br />
einem Plus von 43 % den deutlich dynamischeren Part <strong>im</strong><br />
Vergleich zu Westeuropa, das mit 18 % eindeutig schwächer<br />
wächst. Nach ihrem beeindruckenden Siegeszug in den<br />
letzten <strong>Jahr</strong>en legt die Absatzregion Asien mit einem Zuwachs<br />
von „nur noch“ 10 % eine Atempause ein. In China<br />
bremsen eine schwächere Konjunktur, Unsicherheiten<br />
aufgrund des Wechsels in der politischen Führungsspitze<br />
sowie der erschwerte Kreditzugang für kleinere und mittlere<br />
Betriebe aus der Privatwirtschaft. Das Geschäft mit dem<br />
<strong>im</strong>mer wieder als Hoffnungsträger gehandelten Markt<br />
Indien, der aber unter anderem die zahlreichen bürokra -<br />
t ischen Hemmnisse nicht abschütteln kann, ist sogar rückläufig.<br />
Dennoch, der längerfristige Vergleich zeigt die enorm<br />
gestiegene Bedeutung der Region. Der Anteil Asiens an den<br />
Gesamtausfuhren erhöhte sich seit 2008 von 25 % auf aktuell<br />
38 %.<br />
With a 33% increase, business with the Americas clearly<br />
remained the driving force, as had already been the case in<br />
the previous year. The US automotive industry continued<br />
to expand its technology investments in more fuel-efficient<br />
engines and drive systems. The European market also grew<br />
by 27% and managed to make up some lost ground. The<br />
shift in the significance among sales regions was nevertheless<br />
unmistakable. At its current level of 45%, Europe’s share<br />
of total exports was nearly 15 points below that of 2008.<br />
Moreover, that growth was divided. Export activity to East<br />
ern Europe, with Russia’s leading market and a 43% increase,<br />
was significantly more dynamic than that of Western<br />
Europe, which posted a much weaker 18% growth. On the<br />
heels of its <strong>im</strong>pressive tour de force in recent years, the<br />
Asian sales region paused to catch its breath with “merely”<br />
10% growth. Exports to China were dampened by weaker<br />
economic activity, uncertainties due to changes at the top<br />
political echelons, and tighter credit conditions for small<br />
and medium-sized private businesses. Business with the<br />
Indian market, on which hopes have been pinned t<strong>im</strong>e and<br />
again, was even in decline, due, inter alia, to its inability<br />
to shake free of its many bureaucratic obstacles. Notwithstanding<br />
this, the longer term comparison reveals the enormously<br />
expanded significance of the region. Since 2008,<br />
the Asian share of total exports has increased from 25%<br />
to its current level of 38%.
34<br />
Deutscher <strong>Werkzeugmaschinen</strong>-Export: wichtigste Absatzmärkte<br />
German machine tool exports: major customer markets<br />
Top-10-Absatzmärkte ■ <strong>2012</strong> Entwicklung der Top-4-Märkte (Mio. EUR)<br />
Top 10 customer markets ■ 2011 Development of the top 4 markets (mill. EUR)<br />
China<br />
China<br />
USA<br />
USA<br />
Russland<br />
Russia<br />
Frankreich<br />
France<br />
Verein. Königreich<br />
Great Britain<br />
Österreich<br />
Austria<br />
Tschechien<br />
Czech Republic<br />
Schweiz<br />
Switzerland<br />
Italien<br />
Italy<br />
363<br />
331<br />
342<br />
153<br />
341<br />
263<br />
340<br />
201<br />
328<br />
360<br />
277<br />
290<br />
479<br />
376<br />
723<br />
1 026<br />
2 613<br />
2 303<br />
2 700<br />
2 400<br />
2 100<br />
1 800<br />
1 500<br />
1 200<br />
Polen 253<br />
Poland 211<br />
0<br />
Mio. eur Mill. eur 2008<br />
900<br />
600<br />
300<br />
USA<br />
USA<br />
China<br />
China<br />
Russland<br />
Russia<br />
Schweiz<br />
Switzerland<br />
2009 2010 2011 <strong>2012</strong><br />
Hinweis: Einschließlich<br />
Teile, Zubehör<br />
Quellen: Statistisches<br />
Bundesamt, VDMA, <strong>VDW</strong><br />
Note: including parts,<br />
accessories<br />
Sources: German Statistical<br />
Office, VDMA, <strong>VDW</strong><br />
Im Rating der wichtigsten Absatzländer der <strong>deutsche</strong>n<br />
<strong>Werkzeugmaschinen</strong>hersteller bleibt China mit weitem<br />
Abstand der größte Exportmarkt, der für einen Zuwachs<br />
von 13 % und einen Anteil von 27,3 % steht. Ihre Stellung als<br />
zweitgrößter Markt können die USA mit +42 % und ei -<br />
nem Anteil von 10,7 % eindrucksvoll ausbauen. Russland<br />
festigt seine Stellung als Nummer 3 mit einem Zuwachs<br />
von 27 % und einem Anteil von 5,0 %. Auf den Plätzen 4 bis<br />
6 folgen mit Anteilen von 3,8 % bzw. je 3,6 % Frankreich,<br />
Großbritannien und Österreich. Rang 7 mit ebenfalls 3,6 %<br />
belegt der nach Russland zweitgrößte osteuropäische<br />
Markt Tschechien.<br />
<strong>Die</strong> Staatsschuldenkrise in der Eurozone stellt weiterhin ein<br />
Risiko für die <strong>Werkzeugmaschinen</strong>konjunktur dar. Insbesondere<br />
in den südeuropäischen Ländern bleiben Industrieproduktion<br />
und Investitionstätigkeit schwach. Asien hingegen<br />
sollte sich <strong>im</strong> <strong>Jahr</strong>esverlauf 2013 weiter stabilisieren<br />
und auch das Amerikageschäft dürfte sein hohes Niveau<br />
halten. Insgesamt gehen der <strong>VDW</strong> und sein Prognosepartner<br />
Oxford Economics in 2013 von einem stabilen Exportgeschäft<br />
mit einem leichten Plus von 1 % aus. Dabei bestehen<br />
gute Chancen, dass sich die Erholung der Weltwirtschaft<br />
weiter verstärkt und den Grundstein für ein wieder stärkeres<br />
Exportwachstum <strong>im</strong> Folgejahr legt.<br />
In the ranking of the German machine tool manufacturers’<br />
most <strong>im</strong>portant customer markets, the biggest export<br />
market by a large margin was still China, which posted 13%<br />
growth and accounted for a 27.3% share. The USA managed<br />
to consolidate its position as the second largest market with<br />
a 42% increase and an <strong>im</strong>pressive 10.7% share. Russia consolidated<br />
its number 3 position with 27% growth and a<br />
5.0% share. France, Great Britain and Austria followed in<br />
fourth through sixth place with shares of 3.8%, 3.6% and<br />
3.6%, respectively. The Czech Republic, the second largest<br />
Eastern European market after Russia, ranked seventh and<br />
likewise accounted for 3.6% of Germany’s total machine<br />
tool exports.<br />
The public debt crisis in the eurozone continued to present<br />
a risk to the economic health of the machine tool industry.<br />
Industrial production and investment activity remained<br />
weak, especially in the countries of southern Europe. Asia,<br />
on the other hand, is expected to stabilise further over the<br />
course of 2013 and business with America is expected to<br />
remain at a high level. Overall, the <strong>VDW</strong> and its prognosis<br />
partner Oxford Economics envision a stable export business<br />
with a slight increase of 1%. So there is a good chance that<br />
the global economic recovery will continue to gain strength,<br />
laying the foundation for even stronger export growth in<br />
the following year.
Außenhandel<br />
Foreign trade<br />
35<br />
<strong>Die</strong> nachfolgende tiefer gehende Betrachtung der Absatzmärkte,<br />
gegliedert nach großen geografischen Regionen,<br />
sowie der Einfuhren nach Deutschland basiert auf den vorliegenden<br />
Daten für das Gesamtjahr <strong>2012</strong>. Ausführliches<br />
Zahlenmaterial enthält der statistische Anhang. In diesen<br />
Tabellen sind die Gesamtwerte in „<strong>Werkzeugmaschinen</strong>“<br />
sowie „Teile/Zubehör für <strong>Werkzeugmaschinen</strong>“ unterschieden.<br />
<strong>Die</strong>s erlaubt eine differenziertere Betrachtungsweise<br />
der Daten. Auf der Ausfuhrseite sind die Zahlen für „Teile/<br />
Zubehör“ beispielsweise ein Indiz für Ersatzteillieferungen<br />
oder für die Lieferung von Baugruppen/Komponenten, die<br />
in Produktions- und Montagestätten vor Ort eingehen (z. B.<br />
Markt und zugleich Standort USA). Auf der Einfuhrseite<br />
sind sie unter anderem ein Hinweis auf Outsourcingaktivitäten<br />
wie den Bezug von Maschinengehäusen oder Gussteilen<br />
(z. B. aus Tschechien oder Polen). Der Anteil von Teile/<br />
Zubehör am Gesamtwert beträgt für die Ausfuhr ca. 15 %,<br />
für die Einfuhr ca. 25 %. Insgesamt besteht <strong>im</strong> Zeitalter der<br />
Globalisierung und weltweiten Verflechtungen eine Tendenz<br />
zu steigenden Handelsströmen (export- und <strong>im</strong>portseitig).<br />
Sei es, dass von Deutschland aus Basismaschinen<br />
oder Komponenten an Auslandsstandorte geliefert werden<br />
oder ausländische Wettbewerber europäische Vertriebszentralen<br />
in Deutschland unterhalten, die Maschinen <strong>im</strong>portieren,<br />
diese zum Teil aber wieder in umliegende Absatzmärkte<br />
weiterexportieren.<br />
The following is a thorough examination of the markets<br />
based on the data now available for the whole of <strong>2012</strong>. It<br />
is arranged according to major geographical regions along<br />
with <strong>im</strong>ports to Germany. The “Statistical appendix” provides<br />
complete numerical data. The total values listed in these<br />
tables differentiate between “Machine tools” and “Parts /<br />
accessories for machine tools”. This permits a more sophisticated<br />
analysis of the data. On the export side the figures<br />
for “Parts / accessories”, for example, are evidence of deliveries<br />
of spare parts or for the delivery of modules / components<br />
that are received on site at production and assembly<br />
facilities (e.g. market and location USA at the same t<strong>im</strong>e).<br />
On the <strong>im</strong>port side they are, inter alia, an indication of<br />
outsourcing activities, such as the procurement of machine<br />
housings or castings (e.g. from the Czech Republic or Poland).<br />
Parts / accessories as a share of the total value amounts to<br />
some 15% for exports and about 25% for <strong>im</strong>ports. In the<br />
era of globalisation and worldwide interconnections, the<br />
flow of trade is generally increasing (on both the export<br />
and <strong>im</strong>port sides), whether this involves basic machines<br />
or components supplied from Germany to foreign locations<br />
or foreign competitors who maintain European sales offices<br />
in Germany, who <strong>im</strong>port machines and then re-export some<br />
of them to nearby markets.<br />
Higher growth rates in Eastern Europe<br />
Osteuropäische Länder mit höheren Wachstumsraten<br />
Noch in 2010 hinkte Europa als Absatzregion mit einem<br />
Minus von 12 % hinterher. In den letzten beiden <strong>Jahr</strong>en<br />
investierten aber auch die europäischen Kunden wieder<br />
kräftiger. <strong>Die</strong> <strong>deutsche</strong>n <strong>Werkzeugmaschinen</strong>ausfuhren<br />
steigen <strong>2012</strong> um mehr als ein Viertel an. Europa, hier als<br />
Ex portmarkt, also ohne Deutschland definiert, stellt mit<br />
einem Anteil von 45,0 % zwar den wichtigsten Absatzraum.<br />
Seit 2008 ist der europäische Anteil aber um 15 Prozentpunkte<br />
gesunken. <strong>Die</strong> größere Dynamik weisen die osteuropäischen<br />
Märkte auf, die mit +43 % gegenüber westeuropäischen<br />
Ländern deutlich kräftiger zulegen.<br />
Frankreich, Großbritannien, Österreich, die Schweiz und<br />
Italien sind die größten westeuropäischen Märkte und liegen<br />
<strong>im</strong> Gesamtrating der Absatzländer, lediglich durchbrochen<br />
von Tschechien, in den Rängen 4 bis 9. <strong>Die</strong> Exporte<br />
nach Italien, das <strong>im</strong> Zusammenhang mit der Staatsschuldenkrise<br />
und aufgrund unklarer politischer Verhältnisse<br />
besonders <strong>im</strong> Fokus steht, verringern sich in <strong>2012</strong> um 5 %.<br />
In 2010, Europe was still l<strong>im</strong>ping along behind the rest of<br />
the world as a consumer region with -12% growth. In the<br />
past two years, however, European customers have also invested<br />
heavily again: In <strong>2012</strong>, German machine tool exports<br />
grew by more than 25%. With a 45.0% share, Europe indeed<br />
represented the biggest sales region (defined as an export<br />
market here, i.e. excluding Germany), but that European<br />
share has fallen by 15 percentage points since 2008. The<br />
greater momentum was demonstrated by the Eastern<br />
European markets, where – with a 43% increase – growth<br />
was significantly stronger than that of Western Europe.<br />
France, Great Britain, Austria, Switzerland and Italy were the<br />
biggest Western European markets, filling the range from<br />
rank 4 through 9 in the overall rating of customer nations,<br />
where the only outsider was the Czech Republic. Exports to<br />
Italy, which were subject to particularly heavy scrutiny in<br />
connection with the public debt crisis and due to uncertain<br />
political conditions, fell by 5% in <strong>2012</strong>. Relative to the peak<br />
year of 2008, the German manufacturers have bitterly<br />
watched their exports to Italy decline by a dramatic 46%.
36<br />
Deutscher <strong>Werkzeugmaschinen</strong>-Außenhandel nach Regionen<br />
German machine tool trade by regions<br />
Export <strong>2012</strong> = 9 555 Mio. eur<br />
Exports <strong>2012</strong> = 9 555 mill. eur<br />
Import <strong>2012</strong> = 3 225 Mio. eur<br />
Imports <strong>2012</strong> = 3 225 mill. eur<br />
Australien, Afrika, Sonstige<br />
Australia, Africa, Others<br />
1,0 %<br />
Asien<br />
Asia<br />
23,9 %<br />
Australien, Afrika, Sonstige<br />
Australia, Africa, Others<br />
0,5 %<br />
Asien<br />
Asia<br />
37,6 %<br />
EU-27<br />
EU 27<br />
32,5 %<br />
Amerika<br />
America<br />
4,9 %<br />
EU-27<br />
EU 27<br />
39,9 %<br />
Amerika<br />
America<br />
16,4 %<br />
Sonstiges Europa<br />
Other Europe<br />
12,5 %<br />
Sonstiges Europa<br />
Other Europe<br />
30,8 %<br />
Hinweis: Einschließlich<br />
Teile, Zubehör<br />
Quellen: Statistisches<br />
Bundesamt, VDMA, <strong>VDW</strong><br />
Note: including parts,<br />
accessories<br />
Sources: German Statistical<br />
Office, VDMA, <strong>VDW</strong><br />
Im Vergleich zum Spitzenjahr 2008 müssen die <strong>deutsche</strong>n<br />
Her steller einen herben Einbruch ihrer Exporte um dramatische<br />
46 % konstatieren. Zum Vergleich: <strong>Die</strong> Ausfuhren in<br />
den gesamten EU-Raum gingen nur um 12 % zurück. Spanien<br />
legt entgegen allen Erwartungen um ein Fünftel zu. Das Volumen<br />
bleibt aber <strong>im</strong>mer noch deutlich, um über 40 %, unter<br />
dem Niveau aus 2008. Auch die aktuellen Auftragseingänge<br />
liegen in beiden Fällen <strong>im</strong>mer noch kräftig <strong>im</strong> Minus.<br />
Vermutlich basierend auf Projekten <strong>im</strong> Automobil- und Aerospacesektor<br />
wachsen die Exporte <strong>2012</strong> nach Großbritannien<br />
besonders stark. <strong>Die</strong> Türkei gehört seit einigen <strong>Jahr</strong>en<br />
zu den wachstumsstarken europäischen Märkten. Das Exportvolumen<br />
<strong>2012</strong> übersteigt den Wert aus 2008 um gut<br />
ein Fünftel. Das Land ist mittlerweile <strong>im</strong>merhin zwölftgrößter<br />
Absatzmarkt.<br />
Russland ist eine bedeutende Größe als Abnehmer <strong>deutsche</strong>r<br />
<strong>Werkzeugmaschinen</strong> und hat sich schon seit einigen<br />
<strong>Jahr</strong>en fest auf dem dritten Rang hinter den Hauptmärkten<br />
China und USA, aber vor den großen westeuropäischen<br />
Ländern etabliert. <strong>Die</strong> <strong>deutsche</strong>n Hersteller unterhalten<br />
traditionell gute Geschäftsbeziehungen und präsentieren<br />
sich mit einem Anteil von 25 % an den russischen Einfuhr en<br />
als wichtigster Lieferant von <strong>Werkzeugmaschinen</strong>. <strong>Die</strong> Ausfuhren<br />
steigen <strong>2012</strong> um 27 % und reichen schon fast an das<br />
Ergebnis des <strong>Jahr</strong>es 2008 heran. Außer Frage steht das weitere<br />
mittelfristige Wachstumspotenzial dieses Marktes.<br />
By contrast, exports to the entire EU region fell by only 12%<br />
during that same period. Against all expectations, exports<br />
to Spain grew by 20%. But the volume remained far below<br />
the level of 2008 (by more than 40%). The current level of<br />
incoming orders also continued to decline sharply in both<br />
cases. Presumably as a result of projects in the automotive<br />
and aerospace sectors, the increase in exports to Great Britain<br />
was particularly strong. For the past several years now,<br />
Turkey has been one of the fastest growing European markets.<br />
In <strong>2012</strong>, the export volume to that country exceeded<br />
the 2008 mark by more than one fifth, so the fact that it<br />
has become the twelfth largest market should come as no<br />
surprise.<br />
As a consumer of German machine tools, Russia was a major<br />
player, having already occupied a secure third rank for several<br />
years now – behind the main markets of China and the<br />
USA but ahead of the major countries of Western Europe.<br />
The German manufacturers traditionally maintain good<br />
business relations with Russia, and with a 25% share of<br />
Russian <strong>im</strong>ports they were the biggest supplier of machine<br />
tools. The exports rose by 27% in <strong>2012</strong> and were already<br />
approaching the 2008 result. There is no doubt about the<br />
further medium-term growth potential of this market. The<br />
basic need for manufacturing technology in order to promote<br />
industrial and infrastructural development in the<br />
country remains as high as ever. The international automo-
Außenhandel<br />
Foreign trade<br />
37<br />
Der grundsätzliche Bedarf an Fertigungstechnologie zur<br />
Weiterentwicklung der Industrie und Infrastruk tur <strong>im</strong> Land<br />
bleibt unverändert hoch. <strong>Die</strong> internationale Automobil<strong>industrie</strong><br />
weitet ihr Engagement vor Ort aus. Im Schienenverkehr<br />
und auch <strong>im</strong> Luft- und Raumfahrtsektor werden hohe<br />
Investitionen getätigt. Weißrussland und die Ukraine sind<br />
zwei weitere erwähnenswerte Märkte in dieser Region, die<br />
basierend auf ihren Rohstoffvorkommen die Wirtschaft<br />
aufbauen und dazu Fertigungstechnik benötigen.<br />
In der Regel stark geprägt von Investitionen der internationalen<br />
Automobil- und Zuliefer<strong>industrie</strong> sind die etablierten<br />
osteuropäischen Absatzmärkte Tschechien, Polen, Ungarn<br />
und Rumänien. <strong>Die</strong>se Länder weisen in <strong>2012</strong> sehr hohe, teils<br />
über 100 % liegende Zuwachsraten aus.<br />
tive industry is expanding its commitment there. Major investments<br />
are being made in rail transportation and also<br />
in the aerospace sector. Belarus and the Ukraine are two<br />
other noteworthy markets in this region, which are expanding<br />
their economies based on their natural resources<br />
and require manufacturing technology to do so.<br />
As a general rule, the international automotive and supplier<br />
industry has a strong <strong>im</strong>pact on the established Eastern<br />
European markets of the Czech Republic, Poland, Hungary<br />
and Romania. Those countries posted very high growth<br />
rates in <strong>2012</strong> – in some cases over 100%.<br />
Strong demand for machine tools throughout the<br />
NAFTA region<br />
Starke <strong>Werkzeugmaschinen</strong>nachfrage <strong>im</strong> gesamten<br />
NAFTA-Raum<br />
<strong>Die</strong> Absatzregion Nord- und Mittelamerika mit den Ländern<br />
USA, Kanada und Mexiko überrascht in dieser D<strong>im</strong>ension<br />
als der Wachstumstreiber der <strong>Jahr</strong>e 2011 und <strong>2012</strong>. <strong>Die</strong><br />
<strong>deutsche</strong>n <strong>Werkzeugmaschinen</strong>hersteller verbuchen ein<br />
kräftiges Exportwachstum von 57 % in 2011 und nochmals<br />
42 % in <strong>2012</strong>.<br />
Mit einem auf 10,7 % deutlich gestiegenen Anteil sind die<br />
USA der zweitwichtigste Auslandsmarkt <strong>deutsche</strong>r Hersteller.<br />
Wie eingangs des Kapitels schon ausgeführt, besteht in der<br />
US-Industrie grundsätzlich die Notwendigkeit, in moderne<br />
Fertigungstechnologie zu investieren, um Produktivität und<br />
Qualität zu steigern. <strong>Die</strong>s gilt insbesondere auch für die<br />
he<strong>im</strong>ische Automobil<strong>industrie</strong>, die die Fertigung energiesparsamer<br />
Motoren- und Antriebstechnologie ausbaut.<br />
Stark <strong>im</strong> Aufwind ist der Markt Mexiko. <strong>Die</strong> <strong>deutsche</strong>n Hersteller<br />
verbuchen <strong>2012</strong> ein Exportplus von 48 %. Mit einem<br />
Ausstoß von 2,8 Mio. Einheiten ist das Land achtgrößter<br />
Pkw-Hersteller weltweit. <strong>Die</strong> Automobilhersteller und ihre<br />
Zulieferer haben neue Expansionspläne am Standort Mexiko<br />
angekündigt. <strong>Die</strong> US-Industrie verlagert weiter Wertschöpfung<br />
in den Nachbarstaat. Ebenfalls interessante<br />
Abnehmerbranchen sind der Agrar- und Baumaschinenbereich<br />
sowie die Luft- und Raumfahrt.<br />
Brasilien, einer der oft zitierten BRIC-Staaten, ist auf Platz 16<br />
hinter Mexiko zurückgefallen. <strong>Die</strong> <strong>deutsche</strong>n <strong>Werkzeugmaschinen</strong>lieferungen<br />
steigen <strong>2012</strong>, nach starkem Wachstum<br />
in den Vorjahren, nur noch um 6 %. Hintergrund ist eine<br />
wirtschaftliche Abschwächung in Brasilien mit rück läufiger<br />
Industrieproduktion und stagnierenden Investitionen.<br />
Observers were surprised to see the markets in North and<br />
Central America – with the USA, Canada and Mexico – as<br />
the growth engine in 2011 and <strong>2012</strong> in this regard. German<br />
machine tool manufacturers posted a strong 57% increase<br />
in exports to that region in 2011, followed by another 42%<br />
increase in <strong>2012</strong>.<br />
With its 10.7% share of the total volume (which represents<br />
a significant increase over the previous year), the USA was<br />
the second most <strong>im</strong>portant foreign market for German<br />
manufacturers. As already mentioned at the outset of this<br />
chapter, US industry had a basic need to invest in modern<br />
manufacturing technology, in order to raise productivity<br />
and quality. This was also especially true for the domestic<br />
automotive industry, which expanded its production of<br />
more energy-efficient engines and drive technology. The<br />
Mexican market is surging. German manufacturers posted<br />
a 48% increase in exports there in <strong>2012</strong>. With an output of<br />
2.8 million units, the country is the world’s eighth largest<br />
producer of passenger cars. The automakers and their suppliers<br />
have announced new expansion plans for Mexico as<br />
a manufacturing location. The US industry continues to<br />
outsource value creation to its neighbouring state to the<br />
south. Other attractive consumer segments include agricultural<br />
and construction machinery and the aerospace<br />
industry.<br />
Brazil, one of the frequently mentioned BRIC states, fell to<br />
16th place behind Mexico. After strong growth in previous<br />
years, German machine tool deliveries there rose by only<br />
6% in <strong>2012</strong>. The underlying cause was an economic slowdown<br />
in Brazil with lagging industrial production and stagnating<br />
investment activity. But major events such as the<br />
Football World Cup and the Olympic Games along with
38<br />
Groß ereignisse wie die Fußballweltmeisterschaft und die<br />
Olympischen Spiele sowie Großprojekte in den Bereichen<br />
Offshore-Erdölvorkommen, Schnellzugverbindung und<br />
Wasserkraftwerke versprechen aber für die Zukunft wieder<br />
spürbar höheres Investitionswachstum.<br />
Generell ist neben der Analyse von Exportdaten aber auch<br />
zu berücksichtigen, dass eine Reihe der großen <strong>deutsche</strong>n<br />
<strong>Werkzeugmaschinen</strong>hersteller Produktionsstandorte in<br />
den USA und ebenfalls in Brasilien unterhält. <strong>Die</strong>se Märkte<br />
werden also auch direkt über die Produktion vor Ort bedient<br />
und man verschafft sich größere Sicherheit gegenüber<br />
Wechselkursschwankungen zwischen Euro und lokaler<br />
Währung.<br />
Asiens Wachstum schwächt sich ab<br />
Eine Verschiebung der Gewichte in der <strong>Werkzeugmaschinen</strong> -<br />
nachfrage von Europa nach Asien ist unverkennbar. <strong>Die</strong><br />
Wachstumsregion Asien hat ihren Anteil an den <strong>deutsche</strong>n<br />
Gesamtausfuhren seit 2008 von 24,7 % auf heute 37,6 %<br />
ausgebaut. Während alle anderen Regionen in der Krise<br />
2009 starke Einbußen brachten, blieb der Absatzmarkt<br />
Asien stabil, um dann in 2010 und 2011 mit Zuwächsen<br />
von 22 % und 29 % wieder Fahrt aufzunehmen. In <strong>2012</strong> legt<br />
die Region aber mit einem unterproportionalen Wachs tum<br />
von 10 % eine merkliche Atempause ein. Dahinter stehen<br />
ein abgeschwächtes Exportwachstum in Richtung China<br />
sowie rückläufige Lieferungen in die zweit- und drittgrößten<br />
Märkte Asiens, Indien und Südkorea.<br />
<strong>Die</strong> hohe Bedeutung Chinas lässt sich an der Entwicklung<br />
<strong>im</strong> Zeitablauf festmachen. In 2000 stand das Land noch für<br />
weniger als 4 % der <strong>deutsche</strong>n <strong>Werkzeugmaschinen</strong>ausfuhren,<br />
mittlerweile sind es mit 27 % Anteil fast das Siebenfache.<br />
Das Absatzvolumen liegt mit 2,6 Mrd. EUR zweieinhalb<br />
Mal so hoch wie das des zweitgrößten Marktes USA<br />
(1,0 Mrd. EUR). Eine schwächere Konjunktur, Unsicherheiten<br />
aufgrund des Wechsels in der politischen Führungsspitze<br />
sowie der erschwerte Kreditzugang für kleinere und<br />
mittlere Betriebe in der Privatwirtschaft bremsen die <strong>Werkzeugmaschinen</strong>nachfrage<br />
in China in <strong>2012</strong> deutlich ab.<br />
<strong>Die</strong>s zeigt sich auch sehr deutlich in rückläufigen Aufträgen<br />
für die <strong>deutsche</strong>n Hersteller, die das Exportgeschäft 2013<br />
dämpfen dürften. Andererseits war eine gewisse zyklische<br />
Reaktion nach dem überschäumenden Boom der letzten<br />
<strong>Jahr</strong>e auch zu erwarten. Aktuelle Indikatoren zeigen aber,<br />
dass die chinesische Wirtschaft dabei ist, ihre Schwächephase<br />
zu überwinden. Grundsätzlich bleibt das hohe Nachfragepotenzial<br />
des chinesischen Marktes bestehen. Zwar<br />
major projects related to offshore oil production, highspeed<br />
trains and hydroelectric power plants promise<br />
perceptibly high investment growth again in the future.<br />
Whenever analysing export data, however, it is also <strong>im</strong>portant<br />
to bear in mind that several major German machine tool<br />
manufacturers operate production facilities in both the<br />
USA and Brazil. So those markets are also served directly<br />
via local production, and manufacturers reduce their risk<br />
due to exchange rate fluctuations between the euro and<br />
the local currency.<br />
Asia is growing at a slower rate<br />
The centre of gravity of machine tool demand has shifted<br />
unmistakably away from Europe and towards Asia. Since<br />
2008, growth in Asia has expanded its share of German<br />
exports from 24.7% to 37.6%. While all other regions suffered<br />
heavy setbacks during the crisis of 2009, the Asian market<br />
remained stable, resuming momentum again thereafter<br />
with growth rates of 22% and 29% in 2010 and 2011, respectively.<br />
In <strong>2012</strong>, however, the region paused perceptibly<br />
to recover its breath, posting a disproportionately low<br />
growth rate of 10%. This was the result of d<strong>im</strong>inished<br />
growth in exports to China and declining deliveries to the<br />
second and third largest Asian markets, India and South<br />
Korea.<br />
The high <strong>im</strong>portance of China can best be appreciated by<br />
examining its evolution over t<strong>im</strong>e. In 2000, the country still<br />
accounted for only less than 4% of German machine tool<br />
exports; by the end of 2010, that share had grown to 27% –<br />
nearly a seven-fold increase. At EUR 2.6 billion, the sales<br />
volume exceeded that of the second largest market, the<br />
USA (EUR 1.0 billion), by a factor of two and a half. Chinese<br />
demand for machine tools was significantly dampened in<br />
<strong>2012</strong> by weaker economic activity, uncertainties due to<br />
changes at the top political echelons, and tighter credit<br />
conditions for small and medium-sized private businesses.<br />
This was also very clearly evidenced by the declining volume<br />
of orders for German manufacturers, which will likely slow<br />
the export business in 2013. On the other hand, a certain<br />
cyclical reaction was also to be expected after the overwhelming<br />
boom of the past few years. Current indicators<br />
suggest, however, that the Chinese economy is starting to<br />
recover from its weak phase. The high demand potential of<br />
the Chinese market remains essentially unchanged. Although<br />
Oxford Economics no longer projects two-digit GDP<br />
growth rates for China in the coming years, rates in the<br />
range of 8% will remain strong by comparison with other
Außenhandel<br />
Foreign trade<br />
39<br />
Deutscher <strong>Werkzeugmaschinen</strong>-Export und -Import: 15 wichtigste Abnehmer-/Lieferländer<br />
German machine tool exports and <strong>im</strong>ports: 15 most <strong>im</strong>portant countries of destination/origin<br />
Export<br />
Exports<br />
Maschinen Teile<br />
Machines Parts<br />
Gesamt<br />
Total<br />
Import<br />
Imports<br />
Maschinen Teile<br />
Machines Parts<br />
Gesamt<br />
Total<br />
Mio. EUR<br />
Mill. EUR<br />
Mio. EUR<br />
Mill. EUR<br />
%-Ant.<br />
%-Sha.<br />
%-VR<br />
%-Ch.<br />
Mio. EUR<br />
Mill. EUR<br />
Mio. EUR<br />
Mill. EUR<br />
<strong>2012</strong><br />
1. China China 2 449 164 2 613 27,3 +13 1. Schweiz Switzerland 708 195 903 28,0 +0<br />
2. USA USA 838 188 1 026 10,7 +42 2. Japan Japan 336 43 380 11,8 +7<br />
3. Russland Russia 428 51 479 5,0 +27 3. Italien Italy 218 86 303 9,4 +40<br />
4. Frankreich France 298 64 363 3,8 +10 4. Tschech. Rep. Czech Rep. 158 81 238 7,4 +67<br />
5. Verein. Königreich United Kingd. 276 67 342 3,6 +123 5. Österreich Austria 89 51 141 4,4 +17<br />
6. Österreich Austria 264 76 341 3,6 +30 6. USA USA 93 41 134 4,1 +3<br />
7. Tschech. Rep. Czech Rep. 272 68 340 3,6 +69 7. China China 104 28 132 4,1 +18<br />
8. Schweiz Switzerland 185 143 328 3,4 –9 8. Taiwan Taiwan 113 10 123 3,8 +20<br />
9. Italien Italy 219 58 277 2,9 –5 9. Südkorea South Korea 92 8 99 3,1 –11<br />
10. Polen Poland 214 38 253 2,6 +20 10. Niederlande Netherlands 71 22 93 2,9 +21<br />
11. Indien India 218 29 247 2,6 –6 11. Verein. Königreich United Kingd. 81 10 91 2,8 +120<br />
12. Türkei Turkey 182 22 204 2,1 +7 12. Spanien Spain 74 14 88 2,7 +38<br />
13. Ungarn Hungary 178 23 201 2,1 +109 13. Frankreich France 54 25 78 2,4 +10<br />
14. Mexiko Mexico 174 26 201 2,1 +48 14. Polen Poland 27 49 76 2,4 +23<br />
15. Brasilien Brazil 150 44 193 2,0 +6 15. Türkei Turkey 53 6 58 1,8 +5<br />
Sonstige Others 1 800 347 2 148 22,5 +22 Sonstige Others 148 140 288 8,9 +12<br />
Gesamt Total 8 146 1 409 9 555 100,0 +20 Gesamt Total 2 418 807 3 225 100,0 +14<br />
2011<br />
1. China China 2 142 161 2 303 29,0 +34 1. Schweiz Switzerland 714 185 899 31,9 +48<br />
2. USA USA 602 121 723 9,1 +66 2. Japan Japan 317 39 356 12,6 +55<br />
3. Russland Russia 327 49 376 4,7 +11 3. Italien Italy 146 71 217 7,7 +28<br />
4. Schweiz Switzerland 216 144 360 4,5 +35 4. Tschech. Rep. Czech Rep. 94 49 142 5,1 +11<br />
5. Frankreich France 271 60 331 4,2 +59 5. USA USA 95 35 130 4,6 +26<br />
6. Italien Italy 241 50 290 3,7 +10 6. Österreich Austria 87 33 120 4,3 +9<br />
7. Österreich Austria 201 62 263 3,3 +29 7. China China 87 25 112 4,0 +52<br />
8. Indien India 233 30 263 3,3 +21 8. Südkorea South Korea 104 8 112 4,0 +86<br />
9. Polen Poland 179 32 211 2,7 +21 9. Taiwan Taiwan 91 11 102 3,6 +88<br />
10. Südkorea South Korea 185 20 205 2,6 +12 10. Niederlande Netherlands 61 16 76 2,7 +73<br />
11. Tschech. Rep. Czech Rep. 153 49 201 2,5 +43 11. Frankreich France 51 21 72 2,5 +26<br />
12. Türkei Turkey 168 22 190 2,4 +27 12. Spanien Spain 55 8 64 2,3 +50<br />
13. Brasilien Brazil 143 40 182 2,3 +26 13. Polen Poland 18 44 62 2,2 +39<br />
14. Verein. Königreich United Kingd. 126 28 153 1,9 –5 14. Türkei Turkey 50 6 56 2,0 +85<br />
15. Mexiko Mexico 114 22 136 1,7 +45 15. Verein. Königreich United Kingd. 34 7 41 1,5 –11<br />
Sonstige Others 1 494 267 1 761 22,2 +28 Sonstige Others 137 121 258 9,1 +42<br />
Gesamt Total 6 793 1 155 7 949 100,0 +31 Gesamt Total 2 141 679 2 819 100,0 +42<br />
2010<br />
1. China China 1 566 150 1 716 28,2 +32 1. Schweiz Switzerland 452 156 609 30,7 +8<br />
2. USA USA 319 118 437 7,2 +4 2. Japan Japan 203 26 229 11,6 +12<br />
3. Russland Russia 298 42 340 5,6 –7 3. Italien Italy 111 58 169 8,5 –31<br />
4. Schweiz Switzerland 156 111 267 4,4 –4 4. Tschech. Rep. Czech Rep. 92 37 129 6,5 –15<br />
5. Italien Italy 215 49 263 4,3 –10 5. Österreich Austria 85 26 110 5,6 +11<br />
6. Indien India 194 23 217 3,6 –1 6. USA USA 65 38 103 5,2 +12<br />
7. Frankreich France 156 52 208 3,4 –13 7. China China 56 17 74 3,7 +21<br />
8. Österreich Austria 149 55 204 3,3 –35 8. Südkorea South Korea 53 7 60 3,0 +15<br />
9. Südkorea South Korea 166 17 183 3,0 +10 9. Frankreich France 41 15 57 2,9 –7<br />
10. Polen Poland 146 28 174 2,9 +1 10. Taiwan Taiwan 47 7 54 2,7 –24<br />
11. Verein. Königreich United Kingd. 126 36 162 2,7 +12 11. Verein. Königreich United Kingd. 39 8 47 2,4 –15<br />
12. Türkei Turkey 129 21 150 2,5 +40 12. Polen Poland 11 33 45 2,2 –33<br />
13. Brasilien Brazil 118 26 144 2,4 +21 13. Niederlande Netherlands 34 10 44 2,2 –23<br />
14. Tschech. Rep. Czech Rep. 108 33 141 2,3 +24 14. Spanien Spain 36 6 42 2,1 –58<br />
15. Niederlande Netherlands 80 23 103 1,7 +5 15. Türkei Turkey 26 4 30 1,5 –7<br />
Sonstige Others 1 149 229 1 378 22,6 –18 Sonstige Others 92 89 181 9,1 –12<br />
Gesamt Total 5 075 1 012 6 087 100,0 +1 Gesamt Total 1 442 540 1 983 100,0 –7<br />
%-Ant.<br />
%-Sha.<br />
%-VR<br />
%-Ch.<br />
Hinweise: %-Ant. = Prozentanteil, %-VR = prozentuale Veränderung zum Vorjahr<br />
Quellen: Statistisches Bundesamt, <strong>VDW</strong>, VDMA<br />
Note: %-Sha. = per cent share, %-Ch. = percental change to previous year<br />
Sources: German Statistical Office, <strong>VDW</strong>, VDMA
40<br />
fallen die Wachstumsraten des Bruttoinlandsproduktes<br />
nach Prognosen von Oxford Economics in den nächsten<br />
<strong>Jahr</strong>en nicht mehr zweistellig, aber mit Raten um die 8 %<br />
<strong>im</strong> internationalen Vergleich <strong>im</strong>mer noch kräftig aus. Dabei<br />
entwickeln sich Industrieproduktion und Investitionen<br />
weiter hin überproportional. <strong>Die</strong> anhaltende Fortentwicklung<br />
der eigenen <strong>industrie</strong>llen Basis ist erklärtes politisches Ziel<br />
und wird auch für die Zukunft die herausragende Bedeutung<br />
dieses Marktes festigen. Zur Beurteilung des chinesischen<br />
Marktes gehören aber auch die durch die Politik enorm<br />
geförderten und <strong>im</strong> neuesten Fünf-<strong>Jahr</strong>es-Plan auch festgeschriebenen<br />
Anstrengungen, die technologische Wettbewerbsfähigkeit<br />
der eigenen <strong>Werkzeugmaschinen</strong><strong>industrie</strong><br />
zügig zu erhöhen. Der zunehmende Wegfall von Steuerund<br />
Zollerleichterungen für Importe dient ebenfalls zur<br />
Stützung der Eigenentwicklung.<br />
Weitere größere Absatzmärkte Asiens sind Indien (2,6 % Anteil<br />
und Rang 11 <strong>im</strong> Exportrating), Südkorea (2,0 %, Rang 16)<br />
und Japan (1,5 %, Rang 20).<br />
Indien hält die Position als zweitwichtigster asiatischer Markt<br />
hinter China. Mittelfristig gehört das Land zwar zu den vielversprechenden<br />
Wachstumsmärkten, beispielsweise weil<br />
der Motorisierungsgrad der Bevölkerung gering und der<br />
Nachholbedarf somit hoch ist. Dennoch gestaltet sich der<br />
Marktzugang oft schwierig. Als wichtiger Grund werden<br />
oftmals unzureichende politische Rahmenbedingungen<br />
mit einer ausufernden Bürokratie genannt. <strong>Die</strong> <strong>deutsche</strong>n<br />
<strong>Werkzeugmaschinen</strong>exporte sind mit –6% sogar leicht<br />
rückläufig und bleiben um noch fast ein Fünftel hinter<br />
2008 zurück.<br />
Auch die Ausfuhren nach Südkorea, für <strong>deutsche</strong> Werkzeug -<br />
maschinenhersteller die Nummer 3 in Asien, bleiben <strong>2012</strong><br />
mit 6 % <strong>im</strong> Minus, übertreffen aber schon deutlich das Volumen<br />
von 2008. Wichtige Abnehmersektoren neben der<br />
Automobil<strong>industrie</strong> sind der Schiffbau und die Stahl<strong>industrie</strong>.<br />
Trotz schwieriger Rahmenbedingungen Exporterfolge<br />
in Japan, stark prosperierende ASEAN-Region<br />
<strong>Die</strong> Folgen der Tsunami- und Kernreaktorkatastrophe <strong>im</strong><br />
März 2011 hatte die japanische Industrie zwar wieder<br />
schnell überwunden. Sie hinterließen aber dennoch deutliche<br />
Spuren in den Wirtschaftsdaten für das Gesamtjahr.<br />
Beispielsweise blieb die Industrieproduktion 2011, aber<br />
auch noch <strong>2012</strong> mit –2,3% bzw. – 1,0 % weiter <strong>im</strong> Rückwärtsgang.<br />
Trotz dieser schwierigen Rahmenbedingungen<br />
kann die <strong>deutsche</strong> <strong>Werkzeugmaschinen</strong>branche ihre Liefe-<br />
countries. Within that context, industrial production and<br />
investment activity will continue to grow at disproportionately<br />
high rates. Continuous progress towards the development<br />
of its own industrial base is a declared political<br />
objective and will consolidate the extraordinary significance<br />
of this market also for the future. But any assessment of<br />
the Chinese market must also consider the government’s<br />
highly subsidised efforts to quickly boost the technological<br />
competitiveness of its own machine tool industry – efforts<br />
which are also formally documented in the latest five-year<br />
plan. The increasing trend towards gradually el<strong>im</strong>inating<br />
tax breaks and raising customs barriers on <strong>im</strong>ports also<br />
serves to support local development.<br />
Other major Asian markets included India (ranked number<br />
11 in exports with a 2.6% share), South Korea (number 16<br />
with 2.0%) and Japan (number 20 with 1.5%).<br />
India was the second largest Asian market after China. The<br />
country represents one of the promising growth markets in<br />
the medium term. One factor underlying that potential, for<br />
example, is the low rate of motor vehicle ownership among<br />
the general population, which creates high pent-up demand.<br />
Access to this market is often difficult, however. Inadequate<br />
political conditions and bloated bureaucracy are among<br />
the reasons typically cited for this. German machine tool<br />
exports even declined slightly, falling by 6%, and remained<br />
nearly one fifth below the 2008 level.<br />
Although the volume of exports to South Korea, the number<br />
3 destination in Asia for German machine tool manufacturers,<br />
was also 6% lower in <strong>2012</strong>, it still exceeded the 2008<br />
volume by a significant margin. Along with the automotive<br />
industry, key customer segments here included shipbuilding<br />
and the steel industry.<br />
Manufacturers export successfully to Japan despite<br />
difficult conditions, ASEAN region experiences high<br />
prosperity<br />
Japanese industry rapidly overcame the consequences of<br />
the dramatic tsunami and nuclear reactor catastrophe of<br />
March 2011, but their effects were clearly apparent in the<br />
economic data for the full year. Industrial production shrank<br />
in 2011, for example, but also continued to do so in <strong>2012</strong><br />
(-2.3% and -1.0%, respectively). Despite these difficult<br />
conditions, the German machine tool industry managed<br />
to increase its supply to Japan by a full 20% in both years.<br />
Japan is traditionally considered to be a rather isolated<br />
market with a low <strong>im</strong>port rate of about 10%. With their high -
Außenhandel<br />
Foreign trade<br />
41<br />
Deutscher <strong>Werkzeugmaschinen</strong>-Import: wichtigste Lieferländer<br />
German machine tool <strong>im</strong>ports: major supplier countries<br />
Top-10-Absatzmärkte ■ <strong>2012</strong> Entwicklung der Top-4-Märkte (Mio. EUR)<br />
Top 10 customer markets ■ 2011 Development of the top 4 markets (mill. EUR)<br />
Schweiz<br />
Switzerland<br />
903<br />
899<br />
1 200<br />
Japan<br />
Japan<br />
Italien<br />
Italy<br />
303<br />
217<br />
380<br />
356<br />
1 000<br />
Schweiz<br />
Switzerland<br />
Tschech. Rep.<br />
Czech Rep.<br />
238<br />
142<br />
800<br />
Österreich<br />
Austria<br />
141<br />
120<br />
600<br />
USA<br />
USA<br />
China<br />
China<br />
Taiwan<br />
Taiwan<br />
134<br />
130<br />
132<br />
112<br />
123<br />
102<br />
400<br />
200<br />
Italien<br />
Italy<br />
Japan<br />
Japan<br />
Südkorea<br />
South Korea<br />
Niederlande<br />
Netherlands<br />
99<br />
112<br />
93<br />
76<br />
Mio. EUR Mill. EUR<br />
0<br />
Tschech. Rep.<br />
Czech Rep.<br />
2008 2009 2010 2011 <strong>2012</strong><br />
Hinweis: Einschließlich<br />
Teile, Zubehör<br />
Quellen: Statistisches<br />
Bundesamt, VDMA, <strong>VDW</strong><br />
Note: including parts,<br />
accessories<br />
Sources: German Statistical<br />
Office, VDMA, <strong>VDW</strong><br />
rungen nach Japan in beiden <strong>Jahr</strong>en um je gute 20 % erhöhen.<br />
Traditionell gilt Japan als ein eher abgeschotteter<br />
Markt mit einer niedrigen Importquote von ca. 10 %. Deutsche<br />
Hersteller sind mit ihrem hochtechnologischen und<br />
-spezialisierten Angebot seit vielen <strong>Jahr</strong>en aber wichtiger<br />
ausländischer Lieferant. Denn nicht <strong>im</strong> von japanischen<br />
Herstellern stark besetzten Standardmaschinenbereich,<br />
sondern nur mit Technologie, die vor Ort nicht zur Verfügung<br />
steht, können die Firmen in diesem Markt punkten.<br />
Hohe Zuwächse verbucht die <strong>deutsche</strong> Branche <strong>im</strong> ASEAN-<br />
Raum. Nach einem Plus von über 50 % in 2011 steigen die<br />
Exporte <strong>2012</strong> nochmals um 21 % an. <strong>Die</strong> einzelnen Länder<br />
der Region nehmen an Entwicklungstempo auf und emanzipieren<br />
sich <strong>im</strong>mer mehr von der Drehscheibe Singapur.<br />
Ausländische Industrieunternehmen engagieren sich stärker<br />
mit Direktinvestitionen vor Ort. <strong>Die</strong>ser Trend wird sich<br />
fortsetzen und erhält durch die Schaffung einer Freihandelszone<br />
in dieser Region ab 2015 weiteren Schub. <strong>Die</strong><br />
positive Nachfrageentwicklung gilt durchgängig für die<br />
größeren Märkte Thailand und Malaysia, aber auch für<br />
Vietnam und Indonesien.<br />
Das sogenannte „Recycling der Petrodollars“, also die Nut -<br />
zung der Deviseneinnahmen aus dem Erdölgeschäft für Investitionen<br />
in Infrastruktur- und Industrieprojekte, hat die<br />
technology and highly specialised offerings, however, German<br />
manufacturers have long been major foreign suppliers.<br />
Since German companies cannot compete in this market<br />
with the standard machines which are so prevalent among<br />
Japanese manufacturers, they must offer technology that<br />
cannot be obtained locally.<br />
The German industry posted high rates of growth in the<br />
ASEAN region. After an increase of more than 50% in 2011,<br />
exports there rose by another 21% in <strong>2012</strong>. Development<br />
has accelerated in the individual countries of the region,<br />
which are becoming increasingly emancipated from the<br />
Singapore hub. Foreign industrial companies have committed<br />
more resources there through direct investment<br />
in local markets. This trend will continue and the creation<br />
of a free trade zone in the region will provide it with further<br />
<strong>im</strong>petus starting from 2015. The demand trend was consistently<br />
positive for the larger markets of Thailand and Malaysia,<br />
and also for Vietnam and Indonesia.<br />
The so-called “recycling of petrodollars” – i.e. the use of<br />
foreign currency revenues from the oil business for inves t-<br />
ments in infrastructural and industrial projects – has fundamentally<br />
raised the stature of countries such as Saudi
42<br />
Bedeutung von Ländern wie Saudi-Arabien oder den Vereinigten<br />
Arabischen Emiraten zwar grundsätzlich steigen lassen.<br />
Ein fortgesetzter Aufwärtstrend konnte sich <strong>im</strong> Export<br />
der <strong>deutsche</strong>n <strong>Werkzeugmaschinen</strong>hersteller in den letzten<br />
<strong>Jahr</strong>en aber noch nicht etablieren.<br />
Deutschlands Einfuhren steigen in den letzten beiden<br />
<strong>Jahr</strong>en um über 50 %<br />
Deutschland ist weltweit hinter China und den USA drittgrößter<br />
Importeur von <strong>Werkzeugmaschinen</strong>. Schon in 2011<br />
erholten sich die Einfuhren mit einem Plus von 42 % kräftig.<br />
<strong>Die</strong>ser Erholungsprozess setzt sich auch <strong>2012</strong> mit einem<br />
Zuwachs von nochmals 14 % fort und spiegelt die <strong>im</strong> europäischen<br />
Vergleich sehr gute Verfassung der <strong>deutsche</strong>n<br />
Wirtschaft wider. Deutschland profitiert als exportstarke<br />
Nation vom starken Wachstum der Schwellenmärkte, vor<br />
allem Chinas, und kam schneller und kräftiger aus der Krise<br />
als seine europäischen Nachbarn. Allerdings kann sich der<br />
<strong>deutsche</strong> Markt den Problemen vor allen Dingen <strong>im</strong> EU-<br />
Raum selbst natürlich nicht entziehen. <strong>Die</strong> Inlandsaufträge<br />
der <strong>deutsche</strong>n <strong>Werkzeugmaschinen</strong>hersteller können daher<br />
auch das hohe Niveau aus dem Vorjahr nicht halten und<br />
sinken <strong>2012</strong> um ein Zehntel. Insbesondere kleine und mittelständische<br />
Unternehmen zeigen sich durch die EU-<br />
Schuldenkrise verunsichert und halten sich mit Investitionen<br />
zurück. Dennoch kann das Auftragsvolumen <strong>2012</strong> insgesamt<br />
als gut bezeichnet werden. Für die <strong>Werkzeugmaschinen</strong>einfuhren<br />
nach Deutschland ist 2013 eine Konsolidierung<br />
auf Vorjahresniveau zu erwarten.<br />
<strong>Die</strong> Schweiz ist traditionell mit Abstand größter ausländischer<br />
Anbieter auf dem <strong>deutsche</strong>n Markt. Von den gesamten<br />
Einfuhren stammen 28 % aus dem Nachbarland.<br />
<strong>Die</strong>s hängt sicherlich auch damit zusammen, dass Schweizer<br />
<strong>Werkzeugmaschinen</strong> wie <strong>deutsche</strong> für modernste Technologie<br />
und hohe Präzision stehen. Allerdings ist die Schweiz<br />
auch durch eine sehr spezialisierte Produktionsstruktur geprägt.<br />
Der Absatz in Deutschland wird dominiert von Laser-,<br />
Erodier- und Schleiftechnik. Wie oben erwähnt stehen hinter<br />
diesen Einfuhren aber auch konzerninterne Lieferverflechtungen<br />
mit <strong>deutsche</strong>n Firmen.<br />
Japan hält mit einem Anteil am Gesamt<strong>im</strong>port von 11,8 %<br />
seine Stellung als zweitwichtigster Lieferant. Ferner ist zu<br />
berücksichtigen, dass japanische Maschinen auch über europäische<br />
Transplants bzw. Vertriebszentralen (z. B. Großbritannien,<br />
Niederlande, Belgien) auf den <strong>deutsche</strong>n Markt<br />
kommen. Der besondere Schwerpunkt der japanischen Anbieter<br />
liegt grundsätzlich <strong>im</strong> Serienmaschinengeschäft wie<br />
Arabia and the United Arab Emirates. Exports to those<br />
countries by German machine tool manufacturers in recent<br />
years, however, have yet to establish a sustained upward<br />
trend.<br />
Germany’s <strong>im</strong>ports increase by more than 50% in the past<br />
two years<br />
Germany was the world’s third biggest <strong>im</strong>porter of machine<br />
tools after China and the USA. Already in 2011, <strong>im</strong>ports<br />
made a strong recovery with a 42% increase. That recovery<br />
process also continued in <strong>2012</strong> with another 14% increase<br />
in <strong>im</strong>ports, reflecting the excellent health of the German<br />
economy relative to the rest of Europe. As a heavily exportoriented<br />
country, Germany benefited from the strong<br />
growth of the emerging markets – especially China – and<br />
recovered from the crisis faster and stronger than its European<br />
neighbours did. However, the German market could<br />
not escape the problems looming over all within the EU<br />
zone itself, of course. Therefore, domestic orders for German<br />
machine tools also failed to maintain the high level<br />
of the previous year, falling by one tenth in <strong>2012</strong>. Small and<br />
medium-sized companies appeared to be particularly unsettled<br />
by the EU debt crisis and were reluctant to invest.<br />
The <strong>2012</strong> order volume overall can nevertheless be de -<br />
scrib ed as good. In 2013, machine tool <strong>im</strong>ports to Germany<br />
are expected to consolidate to the level of the previous year.<br />
In keeping with tradition, Switzerland was the biggest foreign<br />
supplier to the German market by far. Some 28% of all<br />
<strong>im</strong>ports originated from this neighbouring country. This<br />
was surely also related to the fact that Swiss machine<br />
tools, much like their German counterparts, stand for ultramodern<br />
technology and high precision. Switzerland is also<br />
characterised by a highly specialised production structure,<br />
however. Its sales to Germany were dominated by laser,<br />
EDM and grinding technology. As mentioned above, however,<br />
group-related supply involvements with German companies<br />
also partly serve to explain these <strong>im</strong>ports.<br />
With an 11.8% share of the total <strong>im</strong>ports, Japan maintained<br />
its position as the second most <strong>im</strong>portant supplier.<br />
It should also be borne in mind that Japanese machines<br />
also arrive onto the German market via European transplants<br />
and distribution centres (e.g. Great Britain, the<br />
Netherlands and Belgium). The particular emphasis of<br />
Japanese providers essentially lies in their production line<br />
machine business, such as CNC machining centres and<br />
CNC lathes. This amplifies their sensitivity to economic<br />
fluctuations, during both downturns and upswings.
Außenhandel<br />
Foreign trade<br />
43<br />
CNC-Bearbeitungszentren und CNC-Drehmaschinen. Damit<br />
ist die Abhängigkeit von konjunkturellen Schwankungen<br />
stärker ausgeprägt, sowohl <strong>im</strong> Auf- als auch <strong>im</strong> Abschwung.<br />
Italiens <strong>Werkzeugmaschinen</strong>hersteller können <strong>2012</strong> mit einem<br />
unerwartet kräftigen Zuwachs von 40 % ihren Anteil<br />
am <strong>deutsche</strong>n Import auf 9,4 % ausbauen. Auf den Plätzen<br />
4 und 5 der Importrangliste folgen Tschechien (7,4%) und<br />
Österreich (4,4%).<br />
Noch ein grundsätzlicher Hinweis zur Interpretation der<br />
Einfuhrdaten. Hier ist gewisse Vorsicht angebracht und es<br />
gelten ähnliche Einschränkungen wie sie zu Beginn dieses<br />
Kapitels für den Export angeführt sind. Im Zeitalter der<br />
Globalisierung und internationaler Konzernverflechtungen<br />
hat die Interpretierbarkeit der grenzüberschreitenden Warenströme<br />
ihre Grenzen. Deutsche <strong>Werkzeugmaschinen</strong>konzerne<br />
besitzen in einer Reihe von Ländern Produktionsund<br />
Montagestätten. Einfuhren beispielsweise aus der<br />
Schweiz, Tschechien, Polen, Großbritannien und Italien<br />
erklären sich zum Teil auch vor diesem Hintergrund. Verbandsschätzungen<br />
gehen davon aus, dass ca. ein Fünftel<br />
der Importe darauf zurückzuführen ist. Insbesondere die<br />
Zuwächse der Einfuhren <strong>im</strong> Berichtsjahr <strong>2012</strong> erklären sich<br />
vor diesem Hintergrund. Während die Importe aus Asien<br />
und Amerika nur niedrig einstellig zulegen, steigen sie aus<br />
den Ländern Europas sehr kräftig an.<br />
Auch folgende Überlegung spricht für eine vorsichtige Interpretation<br />
der Handelsströme. Ausländische Wettbewerber<br />
unterhalten europäische Vertriebszentralen in Deutschland<br />
und <strong>im</strong>portieren Maschinen, die zum Teil aber wieder<br />
in umliegende Absatzmärkte weiterexportiert werden.<br />
With an unexpectedly strong 40% increase, Italy’s machine<br />
tool manufacturers managed to expand their share of <strong>im</strong>ports<br />
to Germany to 9.4% in <strong>2012</strong>. The <strong>im</strong>port rankings<br />
followed with the Czech Republic (7.4%) and Austria (4.4%)<br />
in fourth and fifth place, respectively.<br />
Another general remark on the interpretation of the <strong>im</strong>port<br />
data: A certain level of caution is advisable and caveats s<strong>im</strong>ilar<br />
to those listed for exports at the beginning of this chapter<br />
apply. In this age of globalisation and international financial<br />
link-ups between groups of companies, the inter pretability<br />
of the cross-border flows of goods has its l<strong>im</strong>its. German<br />
machine tool corporations own production and assembly<br />
facilities in a number of countries. This also partly explains<br />
<strong>im</strong>ports from Switzerland, the Czech Republic, Poland, Great<br />
Britain and Italy, for example. The <strong>VDW</strong> est<strong>im</strong>ates that<br />
about one fifth of the total <strong>im</strong>port volume is traceable to<br />
this. The increased <strong>im</strong>port levels in the reporting year <strong>2012</strong><br />
are best understood in that context. Whilst <strong>im</strong>ports from<br />
Asia and America increased only by low one-digit percentage<br />
rates, <strong>im</strong>ports from European countries experienced very<br />
healthy growth.<br />
The following logic also speaks in favour of a cautious interpretation<br />
of trade flows: Foreign competitors maintain<br />
European distribution centres in Germany and <strong>im</strong>port machines,<br />
but some of those machines are then re-exported<br />
to nearby markets.
Stellung auf dem Weltmarkt<br />
XXX<br />
XXX<br />
Position on the world market<br />
45<br />
<strong>Die</strong> Abbildung zeigt eine Laserschweißmaschine für das Schweißen von Getrieberädern. An bis zu drei Stationen wird das Zahnrad<br />
erwärmt, gefügt und lasergeschweißt. Durch den Einsatz eines Faserlasers konnten die Betriebskosten halbiert werden. <strong>Die</strong> Maschine<br />
wird in der Automobil<strong>industrie</strong> für die Produktion von Getriebe- und Powertrain-Komponenten eingesetzt.<br />
The picture shows a laser welding machine used to weld transmission gearwheels. The gear is heated, joined and laser-welded on up to<br />
three different stations. Operating costs were cut by half through the use of a fibre laser. The machine is used in the automotive industry<br />
to produce transmission and powertrain components.
46<br />
Datenbasis der Weltstatistik<br />
Database of worldwide statistics<br />
Zur Erstellung der Weltstatistik nutzt der <strong>VDW</strong> unterschied -<br />
lichste Informations- und Datenquellen. Ziele dabei sind eine<br />
möglichst konsistente Einbindung der Weltdaten in das<br />
gesamte statistische Berichtswesen des Verbandes und der<br />
Aufbau plausibler Zeitreihen. Datenquellen sind amtliche<br />
Statistiken, nationale <strong>Werkzeugmaschinen</strong>verbände, das<br />
europäische Statistikamt Eurostat, Datenbanken der Organisation<br />
der Vereinten Nationen (UNO) und wo notwendig<br />
auch <strong>VDW</strong>-Abschätzungen. Endgültige Daten liegen bis 2011,<br />
teilweise auch schon für <strong>2012</strong> vor. Basis der vorläufigen<br />
Daten für das <strong>Jahr</strong> <strong>2012</strong> ist unter anderem auch die jährliche<br />
Umfrage des US-Fachmagazins „Metalworking Insiders’<br />
Report (Gardner Publications)“. Hier melden die internationalen<br />
Verbände vorläufige Daten für das gerade abgelaufene<br />
<strong>Jahr</strong> und revidierte Daten für das Vorjahr. In vielen Fällen<br />
weicht der <strong>VDW</strong> aber auch von den Ergebnissen der Umfrage<br />
ab, soweit aus anderen Quellen plausiblere Daten bzw. Abschätzungen<br />
vorliegen.<br />
The <strong>VDW</strong> uses an extremely wide range of information and<br />
data sources to generate its worldwide statistics. The a<strong>im</strong><br />
here is to integrate such global data into the association’s<br />
overall statistical reporting system as consistently as possible<br />
while establishing plausible sequences of t<strong>im</strong>e periods. Data<br />
sources include officially published statistics, national machine<br />
tool associations, Eurostat (the European statistics<br />
office), UNO databases and, where necessary, also <strong>VDW</strong><br />
est<strong>im</strong>ates. Definitive data can be found up to 2011 – and<br />
in some cases for <strong>2012</strong> already as well. Among other things,<br />
one basis for the provisional data for <strong>2012</strong> is the annual<br />
survey of the US specialist publication “Metalworking<br />
Insiders’ Report” (Gardner Publications). It reports the international<br />
associations’ provisional data for the year just<br />
completed along with adjusted data for the previous year.<br />
In many cases, however, the <strong>VDW</strong> also diverges from the<br />
results of the survey where more plausible data or est<strong>im</strong>ates<br />
are available from other sources.<br />
Wesentliche Datenbasis ist das ausführliche internationale<br />
Berichtswesen des <strong>VDW</strong>, das detaillierte Daten bis auf Maschinenebene<br />
enthält. Grundlage hierfür sind die Exportund<br />
Importstatistiken von über 40 Ländern, die mit hohem<br />
Detaillierungsgrad in der Datenbank des VDMA (Verband<br />
Deutscher Maschinen- und Anlagenbau) eingepflegt sind.<br />
Ursprungsquelle sind die offiziellen amtlichen Außenhandelsdaten<br />
der einzelnen Länder. <strong>Die</strong> Vorzüge der Nutzung<br />
dieser Datenbasis liegen auf der Hand: eine einheitliche<br />
durchgängige Quelle, frühere Verfügbarkeit, weniger fehlerbehaftet,<br />
deutlich mehr Länder <strong>im</strong> Zugriff und eine vertiefte<br />
Selektierbarkeit für die Mitgliedsunternehmen des<br />
Verbandes, die pr<strong>im</strong>är an Marktforschung für das eigene<br />
Maschinenprogramm interessiert sind.<br />
The key database is the <strong>VDW</strong>’s comprehensive international<br />
reporting system which contains detailed figures right<br />
down to the machine level. These data are essentially based<br />
on the export and <strong>im</strong>port data maintained in the statistical<br />
database of the VDMA (Verband Deutscher Maschinenund<br />
Anlagenbau, or German Engineering Federation) and<br />
are available exclusively to members of the federation. The<br />
original sources of those data are the officially published<br />
export data for the individual countries. The advantages of<br />
relying on those data are obvious: a uniformly consistent<br />
source, earlier availability, higher reliability, access to far<br />
more countries, and enhanced selectivity for <strong>VDW</strong> member<br />
companies pr<strong>im</strong>arily interested in market research pertaining<br />
to their own machine range.<br />
Abweichungen vom amtlichen Zahlenmaterial, nämlich<br />
durch Rückgriff auf Verbandsdaten, sind alleine <strong>im</strong> Fall der<br />
volumenmäßig bedeutsamen Außenhandelsnationen Japan<br />
und USA zugelassen worden. <strong>Die</strong> USA verfügen (in weltweiter<br />
Alleinstellung) über statistische Möglichkeiten, ihre<br />
Export- und Importergebnisse von Gebraucht- und „Billigmaschinen“<br />
zu bereinigen. Der japanische Verband führt<br />
für die Außenhandelsdaten ebenfalls eine Bereinigung<br />
durch, um aus seiner Sicht zu sinnvolleren Verbrauchsdaten<br />
zu kommen.<br />
Um ein hohes Maß an Vergleichbarkeit der <strong>im</strong> Nationen-<br />
Ranking verwendeten Daten sicherzustellen, verstehen<br />
sich alle Angaben „ohne Teile und Zubehör“. Neben der<br />
Deviations from the official figures, specifically those caused<br />
by resorting to the use of association data, have been permitted<br />
only in the case of export trading nations Japan and<br />
the USA, which are significant in terms of volume. The USA<br />
is the only country in the world with the statistical means<br />
to filter out second-hand and “cheap and s<strong>im</strong>ple” machines<br />
from its <strong>im</strong>port and export results. The Japanese association<br />
also adjusts its foreign trade figures, in order to generate<br />
consumer data which it considers more useful.<br />
In order to ensure high comparability among the data used<br />
in the national rankings, all data provided are “without parts<br />
and accessories”. With regard to the German figures, along<br />
with the l<strong>im</strong>itation on complete machines, the services
Weltmarkt<br />
World market<br />
47<br />
Welt-Produktion <strong>Werkzeugmaschinen</strong><br />
World machine tool production<br />
■ Mrd. EUR Bill. EUR<br />
■ Mrd. US-$ Bill. US-$<br />
70<br />
105<br />
60<br />
90<br />
50<br />
75<br />
40<br />
60<br />
30<br />
45<br />
20<br />
30<br />
10<br />
0<br />
23,6 22,9 27,0 29,3 33,6 33,5 33,7 41,1 39,7 33,0 32,0 35,5 41,5 46,0 51,4 54,2 37,5 47,8 61,8 66,3<br />
93 94 95 96 97 98 99 00 01 02 03 04 05 06 07 08 09 10 11 12<br />
15<br />
0<br />
Hinweis: Ohne Teile,<br />
Zubehör; <strong>2012</strong> =<br />
Schätzung<br />
Quelle: <strong>VDW</strong><br />
Note: excluding parts,<br />
accessories; <strong>2012</strong> =<br />
est<strong>im</strong>ate<br />
Source: <strong>VDW</strong><br />
Beschränkung auf Komplettmaschinen ist hinsichtlich der<br />
<strong>deutsche</strong>n Zahlen auch das <strong>Die</strong>nstleistungsgeschäft herausgerechnet<br />
worden. Entsprechend liegen die resultierenden<br />
Angaben unter den Wertansätzen bei rein nationaler<br />
Betrachtung. Bezogen auf das <strong>Jahr</strong> <strong>2012</strong> beträgt die Wertdifferenz<br />
gegenüber dem Aggregat inklusive genannter<br />
Umsatzkomponenten rund 25 %. Der <strong>VDW</strong> hat die Länder<br />
Polen, Slowakei, Ungarn, Bulgarien und Slowenien vor einiger<br />
Zeit in den Kernberichtskreis aufgenommen. <strong>Die</strong> Produktionszahlen<br />
verstehen sich als grobe <strong>VDW</strong>-Schätzungen.<br />
Basis sind Daten vom europäischen Statistikamt Eurostat,<br />
die aber teilweise älter und auch nicht vollständig sind.<br />
Sinnvoller Ländervergleich <strong>im</strong> Weltmaßstab droht<br />
ohne Bereinigung der chinesischen Daten verloren<br />
zu gehen<br />
<strong>Die</strong> Aussagekraft chinesischer Produktionsdaten ist <strong>im</strong>mer<br />
wieder lebhaft diskutiert und das Volumen als unrealistisch<br />
hoch kritisiert worden. Detaillierte <strong>VDW</strong>-Recherchen zeigen,<br />
dass die chinesischen Daten einen hohen Anteil einfachster<br />
Maschinen enthalten, die einen sinnvollen Ländervergleich<br />
<strong>im</strong> Weltmaßstab verzerren. Daher hat sich der Verband entschlossen,<br />
in seinen Publikationen sachlich begründete, <strong>im</strong><br />
Zeitablauf nachvollziehbare und regelmäßig zu überprüfende<br />
Abschläge auf chinesische Produktions- und Export-<br />
business has also been deducted. Accordingly, the resulting<br />
data are below the raw amounts otherwise reported from<br />
a strictly national perspective. With regard to <strong>2012</strong>, the difference<br />
in value compared to the aggregate, including the<br />
turnover components mentioned, is around 25%. The <strong>VDW</strong><br />
added the countries Poland, Slovakia, Hungary, Bulgaria and<br />
Slovenia to its core reporting circle some t<strong>im</strong>e ago. The production<br />
figures are to be construed as rough <strong>VDW</strong> est<strong>im</strong>ates,<br />
and are based on data from the European statistics office,<br />
Eurostat. Some of those data are old, however, and they are<br />
also incomplete.<br />
Unfiltered Chinese data risk falsifying any useful<br />
comparison among countries on a global scale<br />
The validity of Chinese production data is a perennially<br />
controversial topic and the volume has been severely criticised<br />
as unrealistic. Detailed <strong>VDW</strong> research indicates that<br />
the Chinese data include a high proportion of very s<strong>im</strong>ple<br />
machines, which distort any useful comparison among<br />
countries on a global scale. For this reason the association<br />
has decided to subject the Chinese production and export<br />
data which the <strong>VDW</strong> uses in its publications to factually<br />
justified, chronologically documented and regularly reviewed<br />
reductions. According to information provided by the<br />
Chinese machine tool association CMTBA, machine tools
48<br />
daten vorzunehmen. Nach Angaben des chinesischen<br />
<strong>Werkzeugmaschinen</strong>verbandes CMTBA lag der Anteil numerisch<br />
gesteuerter Maschinen (NC-Maschinen) am Produktionswert<br />
2011 bei 54,3 % (2010: 51,9 %), wobei diese<br />
aber oftmals auch einfachere Technologie darstellen. Der<br />
konventionelle Bereich besteht zum überwiegenden Teil<br />
aus Maschinen einfachster Machart, sehr wohl auch für<br />
den nicht<strong>industrie</strong>llen Einsatz. Auch erscheint es als fraglich,<br />
ob hinter den ausgewiesenen Daten durchgängig<br />
<strong>Werkzeugmaschinen</strong> in einem engeren Sinne stehen. Für<br />
das Bohren ist beispielsweise Aufblähung des Volumens<br />
durch handgeführte Maschinen nicht auszuschließen. Im<br />
Falle von zwei Dritteln der konventionellen Technik handelt<br />
es sich um Maschinen mit einem Wert unter 10 Tsd. EUR.<br />
Der <strong>VDW</strong> hat sich daher entschlossen, die Produktionsdaten<br />
auf Basis der Recherchen zu bereinigen. Einbezogen wird<br />
die komplette NC-Technologie sowie ein Drittel des konventionellen<br />
Bereichs, der ansonsten stark von Billigstmaschinen<br />
beeinflusst ist. Der Weiterentwicklung der technologischen<br />
Wettbewerbsfähigkeit wird durch Einbezug der steigenden<br />
NC-Durchdringung Rechnung getragen. So ist der NC-Anteil<br />
2007 bis 2011 von 45,0 % auf 51,9 % angestiegen. <strong>Die</strong> <strong>VDW</strong> -<br />
Methode führt in <strong>2012</strong> zu einer Bereinigung des von chinesischer<br />
Seite veröffentlichten Produktionswertes um 32 %<br />
von 21,4 auf 14,7 Mrd. EUR. Mit gleichem Prozentsatz wird<br />
auch der Exportwert gekürzt, die Importdaten bleiben<br />
hingegen unverändert. Rechnerisch ergibt sich damit eine<br />
Reduzierung des chinesischen Marktvolumens um 20 % von<br />
29,9 auf 23,9 Mrd. EUR. Der <strong>VDW</strong> wird seine Recherchen<br />
auch in der Zukunft fortführen, um den Grad der notwendigen<br />
Bereinigung laufend zu überprüfen.<br />
Aus Gründen der Gleichbehandlung hat der <strong>VDW</strong> auch die<br />
Produktionsdaten anderer wichtiger Herstellerländer anhand<br />
des skizzierten Verfahrens überprüft. Mit streng betrachtet<br />
notwendiger Bereinigung zwischen 0 % und 5 % ergibt sich<br />
sogar für Indien eine in der Praxis vernachlässigbare Größenordnung.<br />
Chinesische Produktionsdaten bilden somit in<br />
nennenswertem Umfang international nicht vergleichbare<br />
Technologie ab. Nähere Einzelheiten, auch hinsichtlich weiterer<br />
Zweifelsfälle wie Taiwan oder Russland, wo mangels<br />
hinreichend detaillierter Produktionsdaten keine Bereinigung<br />
unter gesicherten Voraussetzungen möglich ist, aber<br />
auch die Größenordnungen nicht annähernd der Tragweite<br />
chinesischer Einflüsse entsprechen, finden sich in den „Methodischen<br />
Hinweisen zur Weltstatistik“ <strong>im</strong> Rahmen des<br />
durch ausführliche Tabellen gestützten statistischen Anhangs<br />
dieser Publikation.<br />
using numerical control (NC machines) represented 54.3%<br />
of the total production value in 2011 (2010: 51.9%), whereby<br />
much of that equipment also includes s<strong>im</strong>pler technology.<br />
The conventional segment largely comprises the s<strong>im</strong>plest<br />
of machinery, and very likely also includes equipment intended<br />
for non-industrial applications. It also appears<br />
questionable whether all of the data provided represent<br />
consistent machine tools in the stricter sense of the term.<br />
In drilling equipment, for example, nothing can guarantee<br />
with any certainty that the volume has not been inflated<br />
by manually operated machines. Two thirds of conventional<br />
technology cases involve machines valued at less than EUR<br />
10,000. For this reason, the <strong>VDW</strong> decided to adjust the<br />
production data based on the research. It considers all NC<br />
technology plus one third of the conventional area, which<br />
is otherwise heavily influenced by the least expensive “cheap<br />
and s<strong>im</strong>ple” machines. The further development of technological<br />
competitiveness is taken into account by considering<br />
the increasing penetration of NC. In the period from 2007<br />
to 2011, for example, the NC share grew from 45.0% to<br />
51.9%. In <strong>2012</strong>, the <strong>VDW</strong> methodology has adjusted China’s<br />
officially released production value downward by 32% from<br />
EUR 21.4 billion to EUR 14.7 billion. The export value was<br />
also reduced by the same percentage, while <strong>im</strong>port data<br />
remained unchanged. This results in a 20% reduction in the<br />
Chinese market volume – from EUR 29.9 billion to EUR 23.9<br />
billion. The <strong>VDW</strong> will also carry on its research in the future,<br />
in order to continuously monitor the required degree of adjustment.<br />
In the interest of equal treatment, the <strong>VDW</strong> also used the<br />
methodology described here to study the production data<br />
of other major manufacturing countries. With required adjustments<br />
of between 0% and 5% at most, figures deviated<br />
by a practically negligible order of magnitude, even those<br />
for India. To a considerable degree, therefore, Chinese production<br />
data represent technology that cannot be compared<br />
on an international basis. For further details, also relative to<br />
other dubious cases such as Taiwan or Russia, where adjustments<br />
cannot be carried out under reliable conditions<br />
due to the lack of sufficiently detailed production data, but<br />
where the order of magnitude also does not even begin to<br />
approach that of China, please refer to the “Methodical<br />
comments on worldwide statistics” within the framework<br />
of the comprehensive tabular supporting data in the “Statis-<br />
tical appendix” to this publication.
Weltmarkt<br />
World market<br />
49<br />
Entwicklung des Euro Welt-Produktion <strong>Werkzeugmaschinen</strong> (2010 = 100)<br />
Development of the Euro World machine tool production (2010 = 100)<br />
Veränderung des Euro <strong>2012</strong> zu 2011 gegenüber ...<br />
Change of Euro <strong>2012</strong> to 2011 against ...<br />
■ konstante Wechselkurse constant exchange rates<br />
■ € laufende Wechselkurse € current exchange rates<br />
■ US-$ laufende Wechselkurse US-$ current exchange rates<br />
Brasilien Brasilien (R$) (R$)<br />
Brazil Brazil<br />
+7,8 +7,8<br />
160 160<br />
Indien Indien (iR) (iR)<br />
India India<br />
Tschechische Rep. (Kc˘ Rep. ) (Kc˘ )<br />
Czech Czech Republic Republic<br />
Russland Russland (Rbl) (Rbl)<br />
Russia Russia<br />
Schweiz Schweiz (sfr) (sfr)<br />
Switzerland Switzerland<br />
Südkorea Südkorea (Won) (Won)<br />
South South Korea Korea<br />
Verein. Verein. Königreich Königreich (£) (£)<br />
United United Kingdom Kingdom<br />
Taiwan Taiwan (NT$) (NT$)<br />
Taiwan Taiwan<br />
Japan Japan (¥) (¥)<br />
Japan Japan<br />
USA (US-$) USA (US-$)<br />
USA USA<br />
China China (RMB.¥) (RMB.¥)<br />
China China<br />
+5,7 +5,7<br />
+2,3 +2,3<br />
-2,3 -2,3<br />
-2,4 -2,4<br />
-6,1 -6,1<br />
-6,6 -6,6<br />
-7,3 -7,3<br />
-7,6 -7,6<br />
-7,7 -7,7<br />
-9,9 -9,9<br />
140 140<br />
120 120<br />
100 100<br />
80<br />
60<br />
40<br />
80<br />
60<br />
40<br />
03 03 04 04 05 05 06 06 07 07 08 08 09 09 10 1011 112<br />
12<br />
+2 % +2 % +7 % +7 % +1 % +1 %<br />
Erläuterung:<br />
Orange Kurve: Entwicklung der Weltproduktion unter Annahme konstanter<br />
Wechselkurse (Basis 2010). <strong>Die</strong> Entwicklung wird also ohne wechselkursverzerrende<br />
Einflüsse dargestellt (Weltproduktion <strong>2012</strong>/11: +2 %).<br />
Dunkelgrüne Kurve: Umrechnung mit laufenden Wechselkursen in Euro<br />
(Weltproduktion <strong>2012</strong>/11: +7 %).<br />
Hellgrüne Kurve: Umrechnung mit laufenden Wechselkursen in US-Dollar<br />
(Weltproduktion <strong>2012</strong>/11: –1 %).<br />
Explanation:<br />
Orange line: development of world production assuming constant exchange<br />
rates (base 2010). The development is thus shown without distorting influences<br />
due to exchange rates (world production <strong>2012</strong>/11: +2%).<br />
Dark-green line: converting to euro at current exchange<br />
rates (world production <strong>2012</strong>/11: +7%).<br />
Light-green line: converting to US-Dollar at current exchange rates<br />
(world production <strong>2012</strong>/11: -1%).<br />
Weltproduktion klettert <strong>2012</strong> in Euro gemessen auf einen<br />
neuen Rekordwert<br />
World production in <strong>2012</strong> cl<strong>im</strong>bs to a new record as<br />
measured in euros<br />
<strong>Die</strong> Weltproduktion steigt <strong>2012</strong> in Euro gerechnet nochmals<br />
um 7 % an und erreicht ein neues Rekordniveau von 66,3<br />
Mrd. EUR. Auf Dollarbasis ist das Volumen hingegen mit<br />
–1 % leicht rückläufig. Der Euro wertet <strong>im</strong> <strong>Jahr</strong>esdurchschnitt<br />
<strong>2012</strong> gegenüber wichtigen Währungen ab, z. B. um knapp<br />
8 % gegenüber US-Dollar und Yen bzw. um 10 % gegenüber<br />
dem chinesischen Renminbi. Bei vergleichenden internationalen<br />
Betrachtungen in einer Währung, hier dem Euro,<br />
spielen Wechselkurseffekte natürlich eine Rolle. <strong>Die</strong> tatsächliche<br />
Performance eines Landes spiegelt sich realistisch<br />
allein auf Basis der nationalen Währung wider. Um<br />
solche Währungseffekte auszuschalten, ist eine Berechnung<br />
der Weltentwicklung unter Annahme konstanter<br />
Wechselkurse sinnvoll. Das heißt, die Entwicklung einzelner<br />
Länder wird auf Basis der nationalen Währung gemessen.<br />
Danach ergibt sich für die Weltproduktion <strong>2012</strong> ein Plus<br />
von knapp 2 %.<br />
On a euro basis, world production increased by another 7%<br />
in <strong>2012</strong> and reached a new record level of EUR 66.3 billion.<br />
When measured in dollars, on the other hand, the volume<br />
fell slightly by 1%. Over the course of <strong>2012</strong>, the euro declined<br />
on average in comparison to major currencies, e.g. by nearly<br />
8% against the US dollar and the yen and by 10% against<br />
the Chinese renminbi. In comparative international analyses<br />
in one currency – in this case, the euro – exchange rate<br />
effects play a role, of course. The actual performance of any<br />
country is realistically reflected only on the basis of its local<br />
currency. In order to exclude such currency effects, it is useful<br />
to calculate worldwide economic evolution assuming constant<br />
exchange rates. That means the growth of individual<br />
countries is measured on the basis of the local currency.<br />
This approach yields an increase of nearly 2% for world<br />
production in <strong>2012</strong>.
50<br />
<strong>Werkzeugmaschinen</strong>-Produktion: Top-10-Länder weltweit<br />
Machine tool production: top 10 countries worldwide<br />
Produktion in Mio. eur<br />
Production in mill. eur<br />
%-Veränderung <strong>2012</strong>/11<br />
%-Change <strong>2012</strong>/11<br />
<strong>2012</strong> 2011<br />
Euro Euro<br />
nationale Währung national currency<br />
China*<br />
14 683<br />
China* 13 912<br />
–5 (RMB.¥)<br />
+6<br />
Japan<br />
Japan<br />
Deutschland<br />
Germany<br />
Südkorea<br />
South Korea<br />
Italien<br />
Italy<br />
Taiwan<br />
4 226<br />
Taiwan 3 694<br />
USA<br />
USA<br />
Schweiz<br />
Switzerland<br />
Spanien<br />
Spain<br />
Österreich<br />
Austria<br />
825<br />
772<br />
803<br />
698<br />
2 493<br />
1 810<br />
4 440<br />
4 134<br />
3 493<br />
3 360<br />
4 410<br />
4 250<br />
10 600<br />
9 613<br />
14 210<br />
13 164<br />
-4<br />
–6 (sfr)<br />
-0 (¥)<br />
+8<br />
+7<br />
+1 (Won)<br />
+4<br />
+4 (€)<br />
+6 (NT$)<br />
+7 (US-$)<br />
+7<br />
+7 (€)<br />
+10<br />
+10 (€)<br />
+14<br />
+15<br />
+15<br />
+15 (€)<br />
* <strong>VDW</strong>-Bereinigung um<br />
einfachste Maschinen<br />
(vgl. Anhang, methodische<br />
Hinweise, z. B. <strong>2012</strong> um<br />
32,0 %);<br />
Hinweis: Ohne Teile, Zubehör;<br />
<strong>2012</strong> = Schätzungen<br />
Quellen: <strong>VDW</strong>, VDMA,<br />
nationale Verbände,<br />
Gardner Publications<br />
* <strong>VDW</strong> correction for<br />
„cheap and s<strong>im</strong>ple“<br />
machines (see appendix,<br />
methodical comments,<br />
e.g. <strong>2012</strong> by 32.0%),<br />
Note: excluding parts,<br />
accessories; <strong>2012</strong> =<br />
est<strong>im</strong>ates<br />
Sources: <strong>VDW</strong>, VDMA,<br />
national associations,<br />
Gardner Publications<br />
<strong>Die</strong> Entwicklung der Triade, ebenfalls gemessen in nationalen<br />
Währungen, ergibt folgendes Bild. Europa kann als Produzent<br />
mit +6 % gegenüber der Konkurrenz wieder etwas an<br />
Boden gutmachen. Amerika wächst um 4 %, Asien hingegen<br />
rutscht nach zwei wachstumsstarken <strong>Jahr</strong>en <strong>2012</strong> mit<br />
1 % ins Minus. In Euro gemessen nehmen sich die Zuwächse<br />
Amerikas und Asiens aufgrund der Währungsaufwertungen<br />
mit +11 % bzw. +7 % dagegen deutlich stärker aus (Europa:<br />
+7 %). <strong>Die</strong> auf Eurobasis berechneten Weltanteile zeigen<br />
gegenüber 2011 keine signifikanten Veränderungen. Asien<br />
steht für 57,7 % der Weltproduktion, Europa hält einen Anteil<br />
von 34,7 %. Amerika spielt mit 7,6 % Anteil als Produzent<br />
<strong>im</strong> weltweiten Geschehen eine deutlich untergewichtete<br />
Rolle.<br />
The development of the triad, likewise measured in local<br />
currencies, presents the following picture: As a producer<br />
Europe managed to make up some lost ground again with<br />
respect to the competition with a 6% increase. America<br />
grew by 4%, whereas Asia, after two strong growth years,<br />
slipped back with a 1% decline in <strong>2012</strong>. When measured in<br />
euros, on the other hand, the growth rates of America and<br />
Asia appear much stronger as a result of the upward currency<br />
revaluations, at +11% and +7%, respectively (Europe<br />
+7%). The euro-based value shares show no significant<br />
changes as opposed to 2011. Asia represented 57.7% of<br />
world production and Europe held a 34.7% share. With a<br />
7.6% share, America played a significantly underachieving<br />
role as a producer on the global stage.<br />
Deutsche <strong>Werkzeugmaschinen</strong>hersteller wachsen<br />
<strong>2012</strong> überproportional stark<br />
German machine tool manufacturers grow at a<br />
disproportionately high rate in <strong>2012</strong><br />
Im Weltrating der Produzentenländer behauptet China auch<br />
nach Bereinigung um einfachste Technologie den Spitzenplatz.<br />
Das Reich der Mitte steht für ein Produktionsvolumen<br />
von 14,7 Mrd. EUR und einen Weltanteil von 22,1 %.<br />
Unbereinigt läge der Produktionswert bei 21,4 Mrd. EUR.<br />
Allerdings müssen die chinesischen Hersteller der nach<br />
vielen Wachstumsjahren in <strong>2012</strong> doch schwächeren <strong>Werkzeugmaschinen</strong>nachfrage<br />
<strong>im</strong> eigenen Land mit einem Pro-<br />
In the world ranking of the producing countries, China came<br />
out on top, even after filtering out the s<strong>im</strong>plest technology.<br />
The Middle Kingdom posted a production volume of EUR<br />
14.7 billion and a world share of 22.1%. Before adjustments,<br />
the production value was EUR 21.4 billion. Notwithstanding<br />
this, after many years of growth the Chinese manufacturers<br />
did have to pay a tribute to weaker machine tool demand<br />
at home in <strong>2012</strong> with a 5% decrease in production on a
Weltmarkt<br />
World market<br />
51<br />
Welt-Produktion und -Verbrauch von <strong>Werkzeugmaschinen</strong><br />
World machine tool production and consumption<br />
Top-5-Produzenten (Mrd. EUR)<br />
Top 5 producers (bill. EUR)<br />
Sonstige 18,0 Mrd. EUR<br />
Others 18.0 bill. EUR<br />
27,1 %<br />
Italien 4,4 Mrd. EUR<br />
Italy 4.4 bill. EUR<br />
6,7 %<br />
China* 14,7 Mrd. EUR<br />
China* 14.7 bill. EUR<br />
22,1 %<br />
Südkorea 4,4 Mrd. EUR<br />
South Korea 4.4 bill. EUR<br />
6,7 % Deutschland 10,6 Mrd. EUR<br />
Germany 10.6 bill. EUR<br />
16,0 %<br />
Welt-Produktion = Welt-Verbrauch <strong>2012</strong>: 66,3 Mrd. EUR<br />
World production = world consumption <strong>2012</strong>: 66.3 bill. EUR<br />
Japan 14,2 Mrd. EUR<br />
Japan 14.2 bill. EUR<br />
21,4 %<br />
Top-5-Verbraucher (Mrd. EUR)<br />
Top 5 consumers (bill. EUR)<br />
Sonstige 21,4 Mrd. EUR<br />
Others 21.4 bill. EUR<br />
32,2 %<br />
Südkorea<br />
3,6 Mrd. EUR<br />
South Korea<br />
3.6 bill. EUR<br />
5,5 %<br />
Deutschland 4,9 Mrd. EUR<br />
Germany 4.9 bill. EUR<br />
7,3 %<br />
Japan 5,8 Mrd. EUR<br />
Japan 5.8 bill. EUR<br />
8,8 %<br />
China* 23,9 Mrd. EUR<br />
China* 23.9 bill. EUR<br />
36,0 %<br />
USA 6,8 Mrd. EUR<br />
USA 6.8 bill. EUR<br />
10,2 %<br />
* <strong>VDW</strong>-Bereinigung um<br />
einfachste Maschinen<br />
(vgl. Anhang, methodische<br />
Hinweise, z. B. <strong>2012</strong><br />
Produktion und Export<br />
um 32 % => Verbrauch<br />
um 20 %); Hinweis: Ohne<br />
Teile, Zubehör; <strong>2012</strong> =<br />
Schätzungen; <strong>VDW</strong>-<br />
Annahme: Weltproduktion<br />
= Weltverbrauch<br />
Quellen: <strong>VDW</strong>, VDMA,<br />
nationale Verbände,<br />
Gardner Publications<br />
* <strong>VDW</strong> correction for<br />
„cheap and s<strong>im</strong>ple“<br />
machines (see appendix,<br />
methodical comments,<br />
e.g. <strong>2012</strong> production<br />
and exports by 32% =><br />
consumption by 20%);<br />
Note: excluding parts,<br />
accessories; <strong>2012</strong> = est<strong>im</strong>ates;<br />
<strong>VDW</strong> assumption:<br />
world production = world<br />
consumption<br />
Sources: <strong>VDW</strong>, VDMA,<br />
national associations,<br />
Gardner Publications<br />
duktionsminus von 5 % auf Renminbi-Basis Tribut zollen (in<br />
EUR: +6 %). Rang 2 halten Japans <strong>Werkzeugmaschinen</strong>hersteller,<br />
die auf Yen-Basis nur Stagnation vermelden können<br />
(in EUR: +8 %). Mit 21,4 % Weltanteil und 14,2 Mrd. EUR<br />
Output ist der Rückstand zu China aber nur gering. Mit einem<br />
<strong>im</strong> Vergleich zu den Hauptwettbewerbern deutlich<br />
überproportionalen Zuwachs von 10 % auf 10,6 Mrd. EUR<br />
und einem Anteil von 16,0 % liegt die <strong>deutsche</strong> <strong>Werkzeugmaschinen</strong>branche<br />
auf Platz 3. <strong>Die</strong> drei größten Herstellernationen<br />
vereinen somit knapp 60 % der Weltproduktion<br />
auf sich.<br />
Der zweitgrößte europäische Produzent Italien ist trotz eines<br />
doch eher unerwarteten Zuwachses von 4 % um Haaresbreite<br />
hinter Südkorea auf Rang 5 zurückgefallen. Beide<br />
Länder stehen gerundet für jeweils 6,7 % der Weltproduktion.<br />
Taiwan hält mit 6,4 % Anteil wie schon <strong>im</strong> Vorjahr Rang 6.<br />
Im Weltmaßstab haben die US-Produzenten mit einem Anteil<br />
von 5,8 % an Bedeutung gewonnen. Aufgrund des stärkeren<br />
he<strong>im</strong>ischen Marktes können sie ihre Leistung auf<br />
Dollar-Basis um 7 % erhöhen (in Euro sogar +15 %). Drittgrößter<br />
europäischer Produzent ist die Schweiz mit 3,8 %<br />
Anteil. <strong>Die</strong> Eidgenossen verbuchen allerdings in <strong>2012</strong> ein<br />
einstelliges Minus. Nach Rang 8 klafft eine weitere Lücke<br />
zu den folgenden Produzentenländern. <strong>Die</strong> Top 10 komplettieren<br />
Spanien und Österreich mit jeweils 1,2 %.<br />
renminbi basis (in EUR: +6%). Second-ranked Japan’s machine<br />
tool manufacturers could report nothing better than<br />
stagnation on a yen basis (in EUR: +8%). With a 21.4% world<br />
share and EUR 14.2 billion in output, however, they did not<br />
lag far behind China. With what was clearly disproportionately<br />
high growth relative to their main competitors, the<br />
third-place German machine tool sector increased output<br />
by 10% to EUR 10.6 billion and held a 16.0% share. Taken<br />
together, the three largest manufacturer nations therefore<br />
represent nearly 60% of the total world production.<br />
Despite a rather unexpected 4% growth, Italy – Europe’s<br />
second largest producer – fell behind South Korea by a hair<br />
to fifth place. Each of these two countries’ shares of world<br />
production rounded off to 6.7%. With a 6.4% share, Taiwan<br />
maintained its sixth rank from the previous year. The US<br />
producers raised their profile on the world scale with a<br />
5.8% share. Their strengthened domestic market enabled<br />
them to raise their output by 7% on a dollar basis (and<br />
even +15% in euros). The third largest European producer<br />
was Switzerland with a 3.8% share, but the Helvetians<br />
posted a single-digit decline in <strong>2012</strong>. A wide gap separated<br />
eighth-ranked Switzerland from the remaining countries<br />
on the list. Spain and Austria completed the Top 10 with<br />
1.2% each.
52<br />
Japan Nummer 1 in der Zerspanung, China führt in der<br />
Umformtechnik<br />
Japan number 1 in the cutting sector, China leads in<br />
metal-forming technology<br />
Weltweit steht die Zerspanung in <strong>2012</strong> für 48,4 Mrd. EUR<br />
und die Umformtechnik für 16,8 Mrd. EUR Produktionsvolumen.<br />
<strong>Die</strong> Anteile belaufen sich auf 73 % versus 27 %, eine<br />
Relation, die sich <strong>im</strong> Zeitablauf mit leichten Schwankungen<br />
als relativ stabil erweist. Im aktuellen Berichtsjahr<br />
<strong>2012</strong> ist der Zuwachs bei spanenden Maschinen (+6%) jedoch<br />
etwas schwächer ausgeprägt als <strong>im</strong> umformenden<br />
Bereich (+10%). Im Vorjahr hingegen zeigte die Zerspanung<br />
die stärkere Performance.<br />
Worldwide, the cutting sector represented a production<br />
volume of EUR 48.4 billion in <strong>2012</strong> while metal-cutting<br />
accounted for EUR 16.8 billion. That 73%-to-27% ratio<br />
fluctuated slightly but proved relatively stable over t<strong>im</strong>e.<br />
In the current reporting year <strong>2012</strong>, however, growth in<br />
metal-cutting machines (+6%) was somewhat weaker<br />
than in the metal-forming sector (+10%). During the<br />
previous year, on the other hand, metal-cutting demon -<br />
s trated the stronger performance.<br />
Der Anteil der Zerspanung am gesamten Produktionsergebnis<br />
liegt für Japan mit 87 %, gültig für <strong>2012</strong>, <strong>im</strong> Vergleich zu<br />
den wichtigsten Wettbewerbern am höchsten. Es folgen<br />
die Schweiz mit einem Zerspanungsanteil von 85 % und<br />
Taiwan mit 84 %. Deutschland liegt bei 74 %, ähnlich ist die<br />
Quote auch in den USA (74%) und Südkorea (73%). China<br />
weist einen Anteil von 67 % aus. Lediglich Italien zeigt eine<br />
„ausgeglichene“ Produktionsstruktur mit jeweils 50 % für<br />
beide Segmente.<br />
Im Rating der Produktionsergebnisse für spanende <strong>Werkzeugmaschinen</strong><br />
wird China (bereinigt 9,8 Mrd. EUR, 20,3 %<br />
Anteil) von der Branche in Japan (12,4 Mrd. EUR, 25,7 %)<br />
auf Rang 2 verwiesen. <strong>Die</strong> <strong>deutsche</strong>n Hersteller können mit<br />
einem Produktionsplus von 12 % ihren Weltanteil auf 16,2 %<br />
erhöhen und belegen Platz 3 in der Rangliste der Zerspan er.<br />
Taiwan ist weltweit viertgrößter Produzent (7,4%) und baut<br />
seinen Vorsprung vor den nächstplatzierten Südkorean ern<br />
(6,7%) weiter aus.<br />
Deutsche Umformtechnik weltweit auf<br />
Rang 2<br />
China vermeldete schon in 2011 für die Umformtechnik ein<br />
erstaunlich hohes und durchaus Fragen aufwerfendes<br />
Wachstum von 46 %. Auch <strong>2012</strong> entwickelte sich die chinesische<br />
Umformtechnik deutlich besser als der spanende<br />
Bereich. Mit einem Produktionsvolumen von 4,9 Mrd. EUR<br />
und einem Weltanteil von 27,2 % wird die Konkurrenz<br />
schon fast deklassiert und dies trotz <strong>VDW</strong>-Bereinigung der<br />
Daten (unbereinigtes Volumen: 7,1 Mrd. EUR). Deutschland<br />
stellt mit 2,8 Mrd. EUR und 15,5 % Anteil den Vize-Weltmeister.<br />
Italien ist weltweit drittgrößter Produzent umformender<br />
Maschinen mit einem starken Fokus auf dem Sektor<br />
der Biegetechnik. Das Produktionsvolumen beläuft sich auf<br />
2,2 Mrd. EUR, der Anteil auf 12,3 %. Japan wird mit 10,0 %<br />
Anteil auf den vierten Rang verwiesen. Auf Platz 5 folgt<br />
Südkorea, das für 6,7 % der Produktion steht.<br />
Among the major competitors, Japan had the highest metal -<br />
cutting machine output as a share of its total production<br />
result in <strong>2012</strong> at 87%. It was followed by Switzerland with<br />
an 85% metal-cutting share and Taiwan with 84%. In Germany<br />
the share was 74%, s<strong>im</strong>ilar to the figures for the USA<br />
(74%) and South Korea (73%). China posted a 67% share.<br />
The only country exhibiting a “balanced” production structure<br />
was Italy, with a 50% share for both segments.<br />
In the ranking of the production results for metal-cutting<br />
machine tools, China (EUR 9.8 billion and a 20.3% share<br />
after adjustment) was relegated to second place by that<br />
segment in Japan (EUR 12.4 billion, 25.7%). With a 12% increase<br />
in production, German manufacturers managed to<br />
raise their share by value to 16.2% and were ranked number<br />
3 among producers of metal-cutting machinery. Taiwan was<br />
the world’s fourth largest producer (7.4%) and extended their<br />
lead ahead of South Korea (6.7%).<br />
German metal-forming technology ranks second<br />
overall<br />
The 46% growth in metal-forming technology previously<br />
reported by China in 2011 was amazingly high and raised<br />
perfectly justifiable scepticism. Once again in <strong>2012</strong>, China’s<br />
metal-forming segment posted significantly stronger<br />
growth than its metal-cutting area did. With a production<br />
volume of EUR 4.9 billion and a 27.2% world share, the<br />
competition was almost completely outclassed, even after<br />
the data have been adjusted downward by the <strong>VDW</strong> (unfiltered<br />
volume: EUR 7.1 billion). With EUR 2.8 billion and a<br />
15.5% share, Germany was placed second. Italy was the<br />
world’s third largest producer of metal-forming machines,<br />
with a strong focus on the bending technology sector. Its<br />
production volume was EUR 2.2 billion which represented<br />
a 12.3% share of the world total. With a 10.0% share, Japan<br />
was down to fourth place. South Korea followed in fifth<br />
place with 6.7% of the total production.
Weltmarkt<br />
World market<br />
53<br />
<strong>Werkzeugmaschinen</strong>-Produktion spanend/umformend: Top-10-Länder weltweit<br />
Machine tool production cutting/forming: top 10 countries worldwide<br />
Produktion spanende Maschinen in Mio. eur<br />
Production cutting machines in mill. eur<br />
Produktion umformende Maschinen in Mio. eur<br />
Production forming machines in mill. eur<br />
■ <strong>2012</strong> ■ 2011 ■ <strong>2012</strong> ■ 2011<br />
Japan<br />
Japan<br />
12 417<br />
11 697<br />
China*<br />
China*<br />
4 878<br />
4 193<br />
China*<br />
China*<br />
9 805<br />
9 719<br />
Deutschland<br />
Germany<br />
2 770<br />
2 610<br />
Deutschland<br />
Germany<br />
Taiwan<br />
Taiwan<br />
Südkorea<br />
South Korea<br />
USA<br />
USA<br />
Italien<br />
Italy<br />
Schweiz<br />
Switzerland<br />
Spanien<br />
Spain<br />
Indien<br />
India<br />
536<br />
496<br />
493<br />
552<br />
3 565<br />
3 057<br />
3 247<br />
2 983<br />
2 881<br />
2 499<br />
2 205<br />
1 733<br />
2 127<br />
2 189<br />
7 830<br />
7 003<br />
Italien<br />
Italy<br />
Japan<br />
Japan<br />
Südkorea<br />
South Korea<br />
USA<br />
USA<br />
Taiwan<br />
Taiwan<br />
Türkei<br />
Turkey<br />
Österreich<br />
Austria<br />
Schweiz<br />
Switzerland<br />
2 205<br />
2 095<br />
1 793<br />
1 467<br />
1 193<br />
1 150<br />
998<br />
860<br />
662<br />
638<br />
385<br />
352<br />
378<br />
329<br />
366<br />
406<br />
* <strong>VDW</strong>-Bereinigung um<br />
einfachste Maschinen<br />
(vgl. Anhang, methodische<br />
Hinweise, z. B. <strong>2012</strong> um<br />
32 %);<br />
Hinweis: Ohne Teile, Zubehör;<br />
<strong>2012</strong> = Schätzungen<br />
Quellen: <strong>VDW</strong>, VDMA,<br />
nationale Verbände,<br />
Gardner Publications<br />
* <strong>VDW</strong> correction for<br />
„cheap and s<strong>im</strong>ple“<br />
machines (see appendix,<br />
methodical comments,<br />
e.g. <strong>2012</strong> by 32%),<br />
Note: excluding parts,<br />
accessories; <strong>2012</strong> =<br />
est<strong>im</strong>ates<br />
Sources: <strong>VDW</strong>, VDMA,<br />
national associations,<br />
Gardner Publications<br />
Japan stellt den Exportchampion <strong>2012</strong><br />
Japan is the export champion in <strong>2012</strong><br />
Bezogen auf den Kreis von 34 Berichtsländern, der in der<br />
<strong>VDW</strong>-Weltstatistik durchgängig Produktions-, Export-, Import-<br />
und damit auch Verbrauchsdaten ausweist, ergibt<br />
sich ein „Weltexportvolumen“ in <strong>2012</strong> von 37,2 Mrd. EUR.<br />
Gegenüber 2011 entspricht dies einem Anstieg um 13 %<br />
auf Eurobasis.<br />
Mit 9,0 Mrd. EUR Ausfuhrvolumen hält Japan seine Stellung<br />
als Exportweltmeister. Der Anteil am globalen <strong>Werkzeugmaschinen</strong>export<br />
liegt bei knapp 24,2 %. <strong>Die</strong> <strong>deutsche</strong>n<br />
Hersteller können mit einem kräftigen Zuwachs von einem<br />
Fünftel auf gut 8,1 Mrd. EUR ihren Rückstand gegenüber<br />
Japan deutlich verkürzen und steuern 21,9 % zum Weltexport<br />
bei. Beide Länder zusammengenommen dominieren<br />
eindrucksvoll das weltweite Exportgeschehen.<br />
Mit Abstand vervollständigen Italien (3,4 Mrd. EUR, 9,2 %<br />
Anteil), Taiwan (3,3 Mrd. EUR, 8,8 %) und die Schweiz (2,2<br />
Mrd. EUR, 6,0 %) die Top-5-Exportländer. Nach Südkorea<br />
und den USA belegt China Rang 8 auf Basis des bereinigten<br />
Exportvolumens von 1,5 Mrd. EUR. <strong>Die</strong> chinesischen Hersteller<br />
verfügen noch nicht über hinreichend verzweigte<br />
Vertriebslinien für hochwertige und somit exportfähige<br />
Anlagen und stehen aktuell für bescheidene 3,9 % Anteil<br />
an der globalen Ausfuhr. Der sehr große und dynamische<br />
Based on the 34 countries covered in this report, for which<br />
the <strong>VDW</strong> world statistics have consistent production, export,<br />
and <strong>im</strong>port data and therefore also consumption data, the<br />
“world export volume” in <strong>2012</strong> was EUR 37.2 billion. This<br />
represents a 13% increase over 2011 on a euro basis.<br />
With an export volume of EUR 9.0 billion, Japan maintained<br />
its position as the world champion exporter. Its share of<br />
global machine tool exports was nearly 24.2%. With strong<br />
20% growth to a full EUR 8.1 billion, German manufacturers<br />
managed to narrow the gap behind Japan significantly,<br />
contributing a 21.9% share of the world’s export volume.<br />
Taken together, the two countries dominated the worldwide<br />
export activity to an <strong>im</strong>pressive extent.<br />
Lagging well behind them, Italy (EUR 3.4 billion, 9.2% share),<br />
Taiwan (EUR 3.3 billion, 8.8%) and Switzerland (EUR 2.2 billion,<br />
6.0%) rounded out the list of the Top 5 export countries.<br />
After South Korea and the USA, China ranked number 8<br />
based on the adjusted export volume of EUR 1.5 billion. For<br />
high quality (and therefore exportable) machinery, Chinese<br />
manufacturers still lacked adequately branched distribution<br />
channels. They represented a modest 3.9% share of global<br />
exports during the reporting period. Their very large and<br />
dynamic domestic market consumed 90% of the total pro-
54<br />
He<strong>im</strong>atmarkt n<strong>im</strong>mt 90 % der kompletten Produktion auf.<br />
<strong>Die</strong>s entspricht einem niedrigen Exportanteil von 10 % für<br />
Chinas Produzenten. Eine traditionell sehr hohe Exportquote<br />
von 89 % kennzeichnet die <strong>Werkzeugmaschinen</strong><strong>industrie</strong> in<br />
der Schweiz. Auch Taiwan (Exportquote 78 %), Italien (78%)<br />
und Deutschland (77%) weisen eine starke Exportorientierung<br />
auf. Südkorea und die USA bedienen hingegen stärker<br />
den eigenen Markt, die Ausfuhrquote ist <strong>im</strong> internationalen<br />
Vergleich mit 45 % und 42 % deutlich niedriger.<br />
duction. This results in a small 10% share of exports for<br />
China’s producers. The Swiss machine tool industry exported<br />
89% of its production. The export ratio for that country<br />
has traditionally been very high. Taiwan (78% export ratio),<br />
Italy (78%) and Germany (77%) were also heavily exportoriented.<br />
By contrast, South Korea and the USA demonstrat -<br />
ed a stronger tendency to serve their own domestic markets:<br />
Their export ratios (45% and 42%, respectively) were much<br />
lower than those of the other countries.<br />
China absorbiert 36 % des Weltverbrauchs<br />
China absorbs 36 % of the world’s production<br />
<strong>Die</strong> Größen Produktion und Export beleuchten die Herstellerseite,<br />
wo also die wesentlichen Zentren der Erzeugung<br />
von <strong>Werkzeugmaschinen</strong> liegen. Import und Verbrauch<br />
beschreiben dagegen die Marktseite, wo also <strong>Werkzeugmaschinen</strong><br />
vor allem gekauft und eingesetzt werden. Der<br />
Verbrauch wird dabei rechnerisch ermittelt aus Produktion<br />
minus Export plus Import und kann auch als Marktvolumen<br />
bezeichnet werden. Der <strong>VDW</strong> setzt definitorisch auf Weltebene<br />
Produktion und Verbrauch gleich, das heißt, das weltweite<br />
Volumen an produzierten und „verbrauchten“ <strong>Werkzeugmaschinen</strong><br />
beträgt in <strong>2012</strong> 66,3 Mrd. EUR. <strong>Die</strong>s<br />
bedeutet sinnvollerweise auch eine Gleichsetzung von<br />
Weltexport und Welt<strong>im</strong>port (<strong>2012</strong>: 37,2 Mrd. EUR).<br />
The quantities for “production” and “exports” highlight the<br />
manufacturers’ perspective – i.e. they indicate the major<br />
centres where machine tools are produced. “Imports” and<br />
“consumption” on the other hand, describe the market side<br />
– where machine tools are pr<strong>im</strong>arily purchased and used.<br />
Consumption here is determined mathematically as production<br />
minus exports plus <strong>im</strong>ports, and can also be referred<br />
to as market volume. The <strong>VDW</strong> sets production equal<br />
to consumption on the world level by definition, which<br />
means that the worldwide volume of machine tools produced<br />
and “consumed” in <strong>2012</strong> was EUR 66.3 billion. This also<br />
logically infers the equivalence of world exports and world<br />
<strong>im</strong>ports (<strong>2012</strong>: EUR 37.2 billion).<br />
Gemessen in nationalen Währungen zeigt allein Amerika<br />
mit einem Verbrauchswachstum von 14 % eine klare Aufwärtsentwicklung.<br />
Europa (+1%) und Asien (–1%) stehen lediglich<br />
für Querbewegung. Am Weltmarktvolumen von<br />
66,3 Mrd. EUR hält Asien einen beeindruckenden Anteil von<br />
60 %. Europa steht für einen <strong>im</strong> Vergleich zu 2011 reduzierten<br />
Anteil von 23,3 %. Klarer Gewinner ist der amerikanische<br />
Markt, der seine Partizipation am Weltgeschehen auf 16,6 %<br />
ausbauen kann.<br />
China behauptet seine Ausnahmestellung als wichtigster<br />
<strong>Werkzeugmaschinen</strong>markt und steht für 23,9 Mrd. EUR<br />
Volumen und 36,0 % des weltweiten Verbrauchs. Allerdings<br />
markiert <strong>2012</strong> mit einem in lokaler Währung gerechneten<br />
Minus von 3 % eine Pause <strong>im</strong> langjährigen Wachstumsprozess.<br />
Unbereinigt läge der <strong>Werkzeugmaschinen</strong>verbrauch<br />
Chinas bei 29,9 Mrd. EUR. <strong>Die</strong> USA, zweitgrößter Markt mit<br />
einem Anteil von 10,2 % und 6,8 Mrd. EUR, legen auf Dollarbasis<br />
kräftig um 19 % zu. Der <strong>deutsche</strong> Markt belegt hinter<br />
Japan (8,8%, 5,8 Mrd. EUR) mit 7,3 % Anteil und 4,9 Mrd. EUR<br />
Rang 4, kann aber mit einem Rückgang um 2 % das Vorjahresniveau<br />
nicht ganz halten. Auch Südkorea, fünftgrößter<br />
Markt weltweit mit 5,5 % Anteil, verliert in <strong>2012</strong> auf<br />
Won-Basis um ein Zehntel. Indien wächst nur schwach, ver-<br />
Measured in local currencies, only America demonstrated<br />
a clear upward trend, posting 14% growth in consumption.<br />
Growth in Europe (+1%) and Asia (-1%) was merely flat. Of<br />
the world’s total market volume of EUR 66.3 billion, Asia<br />
held an <strong>im</strong>pressive 60% share. Europe’s 23.3% share was<br />
lower than in 2011. The American market was the clear<br />
winner: It managed to expand its share of world output<br />
to 16.6%.<br />
China confirmed its exceptional position as the most<br />
<strong>im</strong>por tant machine tool market, representing EUR 23.9<br />
billion in volume and 36.0% of worldwide consumption.<br />
Notwithstanding this, <strong>2012</strong> marked a pause in the longstanding<br />
growth process with a 3% decline measured in<br />
local currency. Before adjustments, China’s machine tool<br />
consumption was EUR 29.9 billion. With a 10.2% share and<br />
EUR 6.8 billion, the USA – the second largest market – posted<br />
a dramatic 19% increase on a dollar basis. With a 7.3% share<br />
and EUR 4.9 billion, the German market ranked fourth<br />
behind Japan (8.8%, EUR 5.8 billion), but could not quite<br />
maintain the level of the previous year (-2%). Consumption<br />
in South Korea, the world’s fifth largest market with a 5.5%<br />
share, also fell by one tenth on a won basis in <strong>2012</strong>. India<br />
demonstrated only weak growth, but defended its sixth
Weltmarkt<br />
World market<br />
55<br />
<strong>Werkzeugmaschinen</strong>-Export und -Import: Top-10-Länder weltweit<br />
Machine tool exports and <strong>im</strong>ports: top 10 countries worldwide<br />
Export in Mio. EUR<br />
Exports in mill. EUR<br />
Import in Mio. EUR<br />
Imports in mill. EUR<br />
<strong>2012</strong> 2011 <strong>2012</strong> 2011<br />
Japan<br />
Japan<br />
9 004<br />
8 305<br />
China*<br />
China*<br />
10 630<br />
9 501<br />
Deutschland<br />
Germany<br />
Italien<br />
Italy<br />
Taiwan<br />
Taiwan<br />
Schweiz<br />
Switzerland<br />
Südkorea<br />
South Korea<br />
USA<br />
USA<br />
China*<br />
China*<br />
Spanien<br />
Spain<br />
Belgien<br />
Belgium<br />
695<br />
3 438<br />
3 070<br />
3 284<br />
2 845<br />
2 218<br />
2 215<br />
1 983<br />
1 650<br />
1 625<br />
1 352<br />
1 460<br />
1 190<br />
765<br />
712<br />
625<br />
6 793<br />
8 146<br />
USA<br />
USA<br />
Deutschland<br />
Germany<br />
Indien<br />
India<br />
Russland<br />
Russia<br />
Mexiko<br />
Mexico<br />
Südkorea<br />
South Korea<br />
Türkei<br />
Turkey<br />
Brasilien<br />
Brazil<br />
Kanada<br />
Canada<br />
4 535<br />
3 251<br />
2 418<br />
2 141<br />
1 572<br />
1 556<br />
1 446<br />
1 105<br />
1 384<br />
967<br />
1 160<br />
1 287<br />
932<br />
791<br />
870<br />
1 006<br />
790<br />
687<br />
* <strong>VDW</strong>-Bereinigung des<br />
Exportvolumens um<br />
einfachste Maschinen<br />
(vgl. Anhang, methodische<br />
Hinweise, z. B. <strong>2012</strong> um<br />
32 %)<br />
Hinweis: Ohne Teile, Zubehör;<br />
<strong>2012</strong> = Schätzungen<br />
Quellen: <strong>VDW</strong>, VDMA,<br />
nationale Verbände,<br />
Gardner Publications<br />
* <strong>VDW</strong> correction of the<br />
export volume for „cheap<br />
and s<strong>im</strong>ple“ machines<br />
(see appendix, methodical<br />
comments, e.g. <strong>2012</strong> by<br />
32%)<br />
Note: excluding parts,<br />
accessories; <strong>2012</strong> =<br />
est<strong>im</strong>ates<br />
Sources: <strong>VDW</strong>, VDMA,<br />
national associations,<br />
Gardner Publications<br />
teidigt aber mit 3,1 % seinen sechsten Rang. Der italienische<br />
Markt zeigt sich mit einem Rückgang von 15 % in<br />
schwacher Verfassung. Vor drei <strong>Jahr</strong>en war Italien noch die<br />
Nummer 5, mittlerweile ist das Land aber mit einem Anteil<br />
von 2,5 % auf Rang 7 abgerutscht. <strong>Die</strong> wirklichen Wachstumsträger<br />
des <strong>Jahr</strong>es <strong>2012</strong> unter den Top Ten sind neben<br />
den USA die Märkte Russland und Mexiko. Russland rückt<br />
mit 2,4 % Verbrauchsanteil in seiner Bedeutung schon sehr<br />
nahe an Italien heran. Mexiko, angetrieben von den Investitionen<br />
der internationalen Automobil<strong>industrie</strong> und weiteren<br />
Verlagerungstendenzen seitens der US-Firmen, ist jetzt „Mitglied“<br />
der Top 10 und steht für 2,1 % Weltanteil. Dazwischen<br />
schiebt sich Taiwan auf Position 9 (2,2%).<br />
rank with a 3.1% share. With a 15% decline, the Italian market<br />
exhibited a weak state. Three years ago Italy was still<br />
number 5 but has since slid to seventh with a 2.5% share.<br />
Along with the USA, the real growth engines among the<br />
Top 10 in <strong>2012</strong> were Russia and Mexico. With a 2.4% share<br />
of consumption, Russia came very close to matching the<br />
<strong>im</strong>portance of Italy. Fuelled by the international automotive<br />
industry’s investments and continued outsourcing tendencies<br />
by US firms, Mexico joined the Top 10 and accounted for<br />
2.1% of worldwide consumption. Taiwan jockeyed for position<br />
between them in ninth place (2.2%).<br />
Thailand’s high <strong>im</strong>port volume raises questions<br />
Hohes Importvolumen Thailands wirft Fragen auf<br />
Auch als Importeur dominiert China das weltweite Geschehen,<br />
<strong>im</strong> Vergleich zum Verbrauch allerdings in etwas geringerem<br />
Ausmaß. Mit 10,6 Mrd. EUR Einfuhrwert absorbiert<br />
die Volksrepublik 28,6 % des weltweiten Importaufkommens.<br />
<strong>Die</strong> Importquote liegt aktuell bei 45 %, hat sich aber seit<br />
2007 sehr spürbar um über 10 Prozentpunkte reduziert.<br />
Dafür können zwei Gründe angeführt werden. Einerseits<br />
ist dies ein klarer Beleg für die aus <strong>industrie</strong>politischen<br />
Gründen angestrebte zunehmende Versorgung des Marktes<br />
durch Eigenproduktion. Zu den Maßnahmen zählen<br />
China also dominated worldwide activity as an <strong>im</strong>porter,<br />
albeit to a somewhat lesser degree than as a consumer.<br />
With EUR 10.6 billion in <strong>im</strong>ports, the People’s Republic absorbed<br />
28.6% of the world’s <strong>im</strong>port volume. The <strong>im</strong>port<br />
ratio during the period under review was 45%, but it has<br />
fallen very considerably by more than ten percentage points<br />
since 2007. Two explanations for this can be postulated. For<br />
one thing, this was a clear indication of China’s intentions<br />
(for reasons of industrial politics) to supply more of the<br />
domestic market through its own production capacities.<br />
The measures taken have included not only strengthening<br />
larger business units and further enhancing the country’s
56<br />
<strong>Werkzeugmaschinen</strong>-Verbrauch: Top-10-Länder weltweit<br />
Machine tool consumption: top 10 countries worldwide<br />
Produktion in Mio. eur<br />
Production in mill. eur<br />
<strong>2012</strong> 2011<br />
%-Veränderung <strong>2012</strong>/11<br />
%-Change <strong>2012</strong>/11<br />
Euro Euro nationale Währung national currency<br />
China*<br />
23 853<br />
China* 22 224<br />
USA<br />
USA<br />
Japan<br />
Japan<br />
Deutschland<br />
Germany<br />
Südkorea<br />
South Korea<br />
Indien 2 057<br />
India 2 100<br />
Italien<br />
Italy<br />
Russland<br />
Russia<br />
Taiwan<br />
Taiwan<br />
Mexiko<br />
Mexico<br />
1 689<br />
1 986<br />
1 610<br />
1 252<br />
1 440<br />
1 432<br />
1 399<br />
1 031<br />
6 789<br />
5 260<br />
5 810<br />
5 328<br />
4 873<br />
4 960<br />
3 617<br />
3 771<br />
-10 (Won)<br />
-15<br />
-15 (€)<br />
–3 (RMB.¥)<br />
-2<br />
-2 (€)<br />
-4<br />
-2<br />
+1 (¥)<br />
+1<br />
+7<br />
+4 (iR)<br />
+9<br />
+8 (NT$)<br />
+29<br />
+19 (US-$)<br />
+29<br />
+19 (US-$)<br />
+36<br />
+33 (mex$)<br />
* <strong>VDW</strong>-Bereinigung um<br />
einfachste Maschinen<br />
(vgl. Anhang, methodische<br />
Hinweise, z. B. <strong>2012</strong><br />
Produktion und Export<br />
um 32 % => Verbrauch<br />
um 20 %); Hinweis: Ohne<br />
Teile, Zubehör; <strong>2012</strong> =<br />
Schätzungen<br />
Quellen: <strong>VDW</strong>, VDMA,<br />
nationale Verbände,<br />
Gardner Publications<br />
* <strong>VDW</strong> correction for<br />
„cheap and s<strong>im</strong>ple“<br />
machines (see appendix,<br />
methodical comments,<br />
e.g. <strong>2012</strong> production<br />
and exports by 32% =><br />
consumption by 20%);<br />
Note: excluding parts,<br />
accessories; <strong>2012</strong> =<br />
est<strong>im</strong>ates<br />
Sources: <strong>VDW</strong>, VDMA,<br />
national associations,<br />
Gardner Publications<br />
die Stärkung größerer Unternehmenseinheiten, eine weitere<br />
Erhöhung der eigenen technologischen Wettbewerbsfähigkeit,<br />
aber auch die Rückführung von Zoll- und Umsatzsteuer -<br />
präferenzen bei der Einfuhr technologisch hochstehender<br />
Investitionsgüter. Andererseits spiegelt sich hier auch das<br />
zunehmende Engagement ausländischer <strong>Werkzeugmaschinen</strong>hersteller<br />
mit dem Aus- und Aufbau von Produktionsstätten<br />
vor Ort wider.<br />
Nummer 2 in der Importrangliste sind die wachstumsstarken<br />
USA, die 4,5 Mrd. EUR Einfuhrvolumen und 9,5 % Weltanteil<br />
aufzuweisen haben. <strong>Die</strong> recht hohe Importquote liegt aktuell<br />
bei 67 %. Deutschland selbst belegt mit Einfuhren in<br />
Höhe von 2,4 Mrd. EUR und 6,5 % Anteil den dritten Rang<br />
(gestiegene Importquote von knapp 50 %). Auf Position 4<br />
folgt Indien, das für 1,6 Mrd. EUR <strong>Werkzeugmaschinen</strong> einführt<br />
und für 4,2 % Anteil steht. Auf Rang 5 und 6 finden sich<br />
die erwähnten wachstumsstarken Länder Russland (3,9%)<br />
und Mexiko (3,7%). Hinter Südkorea (Rang 7, 3,1 %) platziert<br />
sich die Türkei (2,5%), einer der dynamischen Märkte<br />
in Europa.<br />
Eine besondere Anmerkung gilt dem Markt Thailand. Das<br />
Land findet sich nicht in den Standard-Rankings der Weltstatistik<br />
wieder, da keine Produktionsdaten verfügbar sind.<br />
Somit ist der Verbrauch gemäß der klassischen Formel<br />
own technological competitiveness, but also rolling back<br />
customs and sales tax relief for <strong>im</strong>porters of technologically<br />
advanced capital goods. At the same t<strong>im</strong>e, though, this also<br />
reflected the fact that foreign machine tool manufacturers<br />
are increasingly involved in the establishment and expansion<br />
of production facilities in China itself.<br />
Experiencing strong growth, the USA was number 2 on the<br />
list of <strong>im</strong>porting countries, with EUR 4.5 billion and a 9.5%<br />
world share. The <strong>im</strong>port ratio during the period under review<br />
was rather high (67%). With EUR 2.4 billion in <strong>im</strong>ports<br />
and a 6.5% world share, Germany itself occupied third place<br />
(its <strong>im</strong>port ratio of nearly 50% was higher than in 2011).<br />
Fourth-ranked India <strong>im</strong>ported EUR 1.6 billion in machine<br />
tools and accounted for a 4.2% share. Fifth and sixth positions<br />
were held by the aforementioned high-growth countries<br />
Russia (3.9%) and Mexico (3.7%), respectively. Turkey<br />
(2.5%), one of Europe’s dynamic markets, ranked behind<br />
seventh-place South Korea (3.1%).<br />
A special note applies to the Thai market. The country is<br />
not reflected in the standard rankings of the world statistics<br />
because no production data are available. That makes it<br />
<strong>im</strong>possible to calculate consumption using the classic formula<br />
“production minus exports plus <strong>im</strong>ports”. The strong<br />
increase in Thailand’s <strong>im</strong>ports based on the official foreign
Weltmarkt<br />
World market<br />
57<br />
„Produktion minus Export plus Import“ nicht berechenbar.<br />
Äußerst bemerkenswert ist der starke Anstieg der thailändischen<br />
Importe auf Basis offizieller Außenhandelsstatistiken.<br />
<strong>Die</strong> Einfuhren sind von gut 500 Mio. EUR in 2009 auf 2.400<br />
Mio. EUR in <strong>2012</strong> emporgeschnellt. Das Land läge damit<br />
auf Platz 4 <strong>im</strong> weltweiten Import-Rranking, nur knapp hinter<br />
Deutschland. Zwar ist Thailand als wichtiger Automobilstandort<br />
bekannt und eine recht hohe <strong>Werkzeugmaschinen</strong> -<br />
nachfrage auch nachvollziehbar. <strong>Die</strong>se D<strong>im</strong>ension aber, die<br />
vergleichbar mit einem hochindustrialisierten Land wie<br />
Deutschland wäre, weckt verständlicherweise Zweifel. Bevor<br />
Thailand daher in die Länder-Rankings eingehen kann,<br />
sind ausführliche Recherchen zur Plausibilität des Datenmaterials<br />
und zur Höhe des Produktionsvolumens notwendig.<br />
<strong>Die</strong> Produktion dürfte übrigens fast ausschließlich<br />
durch einige Transplants japanischer <strong>Werkzeugmaschinen</strong>hersteller<br />
best<strong>im</strong>mt werden.<br />
Maßstab für die tatsächliche Performance<br />
Wie schon eingangs erläutert spiegelt sich die Entwicklung<br />
der nationalen <strong>Werkzeugmaschinen</strong><strong>industrie</strong>n allein in<br />
Darstellungen wider, die in jeweils eigener Währung erzielte<br />
<strong>Jahr</strong>esergebnisse <strong>im</strong> mittelfristigen Volumenvergleich<br />
zeigen und somit die Einordnung <strong>im</strong> Zeitablauf ermöglichen.<br />
Wechselkursverzerrende Effekte sind damit ausgeschlossen.<br />
Unsere in dieser Weise strukturierten Charts<br />
zeigen dies exemplarisch für die sechs größten Märkte<br />
bzw. Produzentenländer.<br />
Deutschland kann <strong>2012</strong> bezogen auf die Produktion schon<br />
fast wieder den Stand von 2008, also vor der weltweiten<br />
Finanz- und Wirtschaftskrise erreichen. Der Verbrauch liegt<br />
hingegen noch um mehr als ein Viertel darunter. China verspürt<br />
für beide Aggregate nach zwei <strong>Jahr</strong>en rasanten<br />
Wachstums in <strong>2012</strong> einen deutlichen Dämpfer. Japan verharrt<br />
in der Stagnation, die Krisenverluste sind noch nicht<br />
wieder wettgemacht. Das Marktvolumen liegt noch weit<br />
um 38 % vom Höchststand 2007 entfernt. Noch dramatischer<br />
ist die Entwicklung in Italien. Im Vergleich zu 2007<br />
verliert der italienische Markt mehr als die Hälfte. Das positivere<br />
Auslandsgeschäft stützt die Produktion, die knapp<br />
20 % unter 2007 liegt. <strong>Die</strong> südkoreanische Produktion zeigt<br />
einen beständigen Wachstumskurs, nur von der Krise in<br />
2009 unterbrochen, und feiert <strong>2012</strong> einen neuen Rekordwert.<br />
Der Markt hingegen durchläuft in <strong>2012</strong> eine Schwächephase.<br />
<strong>Die</strong> USA durchschreiten in der Krise ein tiefes<br />
zweijähriges Tal, um dann aber in den <strong>Jahr</strong>en 2011 und<br />
<strong>2012</strong> wieder wie Phönix aus der Asche aufzusteigen. Der<br />
Verbrauch <strong>2012</strong> übertrifft sogar die Marke aus 2008.<br />
trade statistics is quite remarkable. Imports have skyrocketed<br />
from EUR 500 million in 2009 to EUR 2,400 million in <strong>2012</strong>.<br />
That would put the country in fourth place in the worldwide<br />
<strong>im</strong>port ranking just slightly behind Germany. Granted,<br />
Thailand is known as an <strong>im</strong>portant automotive manufacturing<br />
location and a rather high machine tool demand is<br />
also perfectly plausible. This magnitude, however, which<br />
would be comparable with a highly industrialised country<br />
such as Germany, understandably arouses suspicion. So before<br />
Thailand can enter the country rankings, the plausibility<br />
of the data and the level of the production volume must<br />
be thoroughly researched. Incidentally, the production appears<br />
to originate almost exclusively from a few transplants<br />
of Japanese machine tool manufacturers.<br />
Yardstick for actual performance<br />
As already mentioned at the outset, the growth of local<br />
machine tool <strong>industrie</strong>s can only be visualised in diagrams<br />
that show annual results achieved in the relevant local<br />
currency, comparing volume over the medium-term and<br />
thereby making it possible to present a chronological framework.<br />
Exchange rate distortion effects are thereby excluded.<br />
Structured in this way, our charts illustrate this for the six<br />
largest markets and producing countries.<br />
In terms of production, Germany had already managed by<br />
<strong>2012</strong> to almost regain the level of 2008, i.e. before the global<br />
financial and economic crisis. Consumption, on the<br />
other hand, remained more than 25% below the pre-crisis<br />
figure. After two years of extremely rapid growth, China<br />
experienced significantly dampened activity in both domains.<br />
Japan was mired in stagnation and it had yet to<br />
make up the ground it lost during the crisis. The market<br />
volume remains far below the record level of 2007 (38%<br />
down). The evolution in Italy was even more dramatic.<br />
The Italian market fell to less than half the level of 2007.<br />
The more positive business abroad supported production,<br />
which was nearly 20% below 2007. Production in South<br />
Korea has exhibited respectable growth – interrupted only<br />
by the crisis in 2009 – and celebrated a new record value in<br />
<strong>2012</strong>. The market there experienced a weak phase in <strong>2012</strong>,<br />
however. Having endured a deep, two-year decline during<br />
the crisis, the USA rose again in 2011 and <strong>2012</strong> like a phoenix<br />
from the ashes. In <strong>2012</strong>, consumption even exceeded<br />
the level of 2008.
58<br />
<strong>Werkzeugmaschinen</strong>-Produktion und -Verbrauch ausgewählter Länder (in nationaler Währung)<br />
Machine tool production and consumption of selected countries (in national currency)<br />
Produktion Production<br />
Verbrauch Consumption<br />
Japan (Mrd. Yen) Japan (bill. Yen)<br />
1 800<br />
1 440<br />
1 080<br />
720<br />
360<br />
0<br />
Deutschland (Mrd. EUR) Germany (bill. EUR)<br />
12,5<br />
10,0<br />
7,5<br />
5,0<br />
2,5<br />
0,0<br />
03 04 05 06 07 08 09 10 11 12 03 04 05 06 07 08 09 10 11 12<br />
China (Mrd. RMB.¥)* China (bill. RMB.¥)*<br />
250<br />
200<br />
150<br />
100<br />
50<br />
0<br />
Italien (Mrd. EUR) Italy (bill. EUR)<br />
6,5<br />
5,2<br />
3,9<br />
2,6<br />
1,3<br />
0<br />
03 04 05 06 07 08 09 10 11 12 03 04 05 06 07 08 09 10 11 12<br />
Südkorea (Mrd. Won) South Korea (bill. Won)<br />
USA (Mrd. US-$) USA (bill. US-$)<br />
7 000<br />
5 600<br />
10<br />
8<br />
4 200<br />
6<br />
2 800<br />
4<br />
1 400<br />
2<br />
0<br />
0<br />
03 04 05 06 07 08 09 10 11 12 03 04 05 06 07 08 09 10 11 12<br />
* <strong>VDW</strong>-Bereinigung um<br />
einfachste Maschinen<br />
(vgl. Anhang, methodische<br />
Hinweise, z. B. <strong>2012</strong> Produktion<br />
und Export um<br />
32 % => Verbrauch um<br />
20 %);<br />
Hinweis: Ohne Teile, Zubehör;<br />
<strong>2012</strong> = Schätzungen<br />
Quellen: <strong>VDW</strong>, VDMA,<br />
nationale Verbände<br />
* <strong>VDW</strong> correction for<br />
„cheap and s<strong>im</strong>ple“<br />
machines (see appendix,<br />
methodical comments,<br />
e.g. <strong>2012</strong> production<br />
and exports by 32% =><br />
consumption by 20%)<br />
Note: excluding parts,<br />
accessories; <strong>2012</strong> =<br />
est<strong>im</strong>ates<br />
Sources: <strong>VDW</strong>, VDMA,<br />
national associations
Strukturdaten der <strong>Werkzeugmaschinen</strong><strong>industrie</strong><br />
XXX 59<br />
XXX<br />
Structural data of the machine tool industry<br />
Das Bild zeigt die Drehbearbeitung von Seilwinden auf einer Fahrständermaschine. <strong>Die</strong> Maschine eignet sich besonders für die Drehund<br />
Fräsbearbeitung von sperrigen Großteilen und ist dabei flexibel und präzise auf langen Fahrwegen. Sie findet vor allem Anwendung<br />
<strong>im</strong> Werkzeugbau sowie in der Einzel- und Kleinserienfertigung des Maschinenbaus. Durch die hohe Flexibilität ist sie besonders <strong>im</strong> Bereich<br />
der Lohnfertigung sehr beliebt. Weiterhin findet sie Verwendung in der Bau-/Landmaschinenbranche, der Energietechnik sowie<br />
<strong>im</strong> <strong>Werkzeugmaschinen</strong>bau.<br />
The picture shows the cable winches being turned on a travelling column machine. The machine is particularly well-suited for the turning<br />
and milling of large, bulky components while ensuring versatility and precision over long displacements at the same t<strong>im</strong>e. It is typically<br />
used in tool and die making applications and in custom and l<strong>im</strong>ited-series machinery production. Its high versatility makes it particularly<br />
popular in the contract manufacturing area. It is also used in the construction / agricultural machinery sector, energy technology and<br />
machine tool construction.
60<br />
XXX<br />
XXX<br />
Deutsche <strong>Werkzeugmaschinen</strong><strong>industrie</strong> nach Betriebsgrößenklassen (%-Anteile)*<br />
German machine tool industry by company size (%-Shares)*<br />
Zahl der Beschäftigten<br />
Betriebe Companies Beschäftigte Employment Produktion Production<br />
Number of employees<br />
2010 2011 <strong>2012</strong> 2010 2011 <strong>2012</strong> 2010 2011 <strong>2012</strong><br />
1 – 50 15,9 14,2 12,6 1,2 1,0 0,8 1, 4 1, 5 1,2<br />
51 – 100 18,6 14,2 14,6 4,6 3, 3 3,1 3, 4 2 , 5 2,6<br />
101 – 250 23,9 26, 4 28,2 13,8 13,6 13,5 13,7 12,5 11,6<br />
251 – 500 23,9 25,5 24, 3 26,6 25,9 25,2 26,2 26,7 25,8<br />
501 – 1 000 13,3 14,2 14,6 30,4 29,3 29,5 36,2 29,7 28,6<br />
> 1 000 4, 4 5,7 5,8 23,4 26,9 27,8 19,1 27,1 30,2<br />
Gesamt Total 100,0 100,0 100,0 100,0 100,0 100,0 100,0 100,0 100,0<br />
■ vorläufig/prel<strong>im</strong>inary<br />
* auf Basis der Meldungen von Mitgliedsfirmen des <strong>VDW</strong> und des Fachverbandes <strong>Werkzeugmaschinen</strong> <strong>im</strong> VDMA<br />
* based on reports from member companies of <strong>VDW</strong> and VDMA section Machine Tools<br />
Erfolgreiches Modell „Mittelstand“<br />
Medium-sized companies – a successful model<br />
<strong>Die</strong> <strong>Werkzeugmaschinen</strong><strong>industrie</strong> bleibt mittelständisch<br />
geprägt. Auch wenn Konzentrationsprozesse, vor allem<br />
während der in Deutschland kritischen <strong>Jahr</strong>e 1992 bis 1994<br />
und natürlich als Folge der weltweiten Finanz- und Wirtschaftskrise<br />
von Herbst 2008 bis in den späten <strong>Jahr</strong>esverlauf<br />
2009 hinein, dazu geführt haben, dass auf den Kreis<br />
der größten und international präsenten Unternehmensgruppen<br />
ein „Löwenanteil“ am branchenweiten Umsatz<br />
entfällt. <strong>Die</strong>s ist letztlich auch notwendig, weil gerade Volumenanbieter<br />
die komplette Breite in den Märkten brauchen<br />
und entsprechend verzweigte Vertriebskanäle bzw.<br />
genügend Manpower für die Umsetzung von Direktvertriebskonzepten<br />
finanzieren müssen. Andererseits ist Unternehmensgröße<br />
noch kein Erfolgsrezept, denn zahlreiche<br />
Spezialisten haben ihre Personalausstattung sowie den<br />
Kreis bedienbarer Zielmärkte opt<strong>im</strong>al auf „Nischen“ zugeschnitten<br />
und erwirtschaften gute Erträge. Der globale Finanzkollaps<br />
und seine gravierenden realwirtschaftlichen<br />
Konsequenzen, sprich der über alle Anwendersparten flächendeckende<br />
und sich mit bislang ungekannter negativer<br />
Dynamik vollziehende Nachfrageeinbruch, haben aber auch<br />
diese durch besonderes Know-how, nicht aber Skaleneffekte<br />
geprägten Firmen vor ernste betriebswirtschaftliche Herausforderungen<br />
gestellt. In Summe ist festzuhalten, dass<br />
solche Adressaten für strategische Investments rechnerisch<br />
oft besser als die breite Mehrzahl der Unternehmen durch<br />
die Krise gekommen sind. Der verblüffend steile Wiederaufschwung<br />
hat Firmenzusammenbrüche auf breiter Front<br />
verhindert.<br />
The machine tool industry still predominantly comprises<br />
medium-sized companies. This remains true today, even if<br />
concentration processes – above all during the critical period<br />
in Germany from 1992 to 1994, and also, of course, as a<br />
consequence of the worldwide financial and economic<br />
crisis which began in the autumn of 2008 and continued<br />
through most of 2009 – have channelled a huge share of<br />
turnover across the industry to the cadre of the biggest<br />
and international corporations. In the final analysis, this<br />
consolidation is indeed also necessary, as the volume<br />
providers are the ones who especially need the markets’<br />
full breadth and who have to finance the appropriately diversified<br />
distribution channels and personnel resources<br />
that the <strong>im</strong>plementation of direct sales concepts requires.<br />
On the other hand, the large-sized company model is still<br />
not a proven recipe for success, as numerous specialists have<br />
tailored their personnel complement and their circle of<br />
serviceable target markets specifically to “niche” types and<br />
are profiting handsomely. But the global financial collapse<br />
and its serious consequences for the real economy, i.e. the<br />
precipitous drop in demand across all user segments which<br />
persists with heretofore unprecedented negative momentum,<br />
have also presented serious business management challenges<br />
for those companies marked by exceptional expertise<br />
but lacking in economy-of-scale effects. All in all, it should<br />
be noted that many such strategic investment candidates<br />
have fared better during the crisis than most of the other<br />
companies. The amazingly steep recovery prevented corporate<br />
bankruptcies across a wide range.<br />
Im Vergleich zum Vorjahr ist die Zahl der Betriebe weitgehend<br />
gleich geblieben. Bundesweit 330 <strong>Werkzeugmaschinen</strong>herstellern<br />
<strong>im</strong> engeren Sinne (Verbandsschätzung)<br />
The number of businesses remained largely unchanged<br />
versus the previous year. Throughout Germany, there were<br />
330 machine tool manufacturers in the narrower sense of
Strukturdaten<br />
Structural data<br />
61<br />
Regionale Verteilung der <strong>deutsche</strong>n <strong>Werkzeugmaschinen</strong><strong>industrie</strong> (%-Anteile)*<br />
Geographical distribution of the German machine tool industry (%-Shares)*<br />
Bundesland German laender Betriebe Companies Beschäftigte Employment Produktion Production<br />
2010 2011 <strong>2012</strong> 2010 2011 <strong>2012</strong> 2010 2011 <strong>2012</strong><br />
Baden-Württemberg Baden-Württemberg 42 , 5 42 , 5 42 ,7 48,8 48,1 47,8 50,8 5 4,1 53,5<br />
Nordrhein-Westfalen North Rhine-Westphalia 17,7 17,9 17,5 16,9 16,4 17,1 20, 3 18,2 17,0<br />
Bayern Bavaria 13,3 14,2 14,6 19,8 21,2 21,5 16,7 16,6 18,2<br />
Thüringen Thuringia 7,1 7, 5 7,8 5, 3 5, 4 5, 5 4,8 4, 4 5,0<br />
Sachsen Saxony 5, 3 5,7 5,8 3,8 3,8 4,0 2,8 2,9 3,1<br />
Hessen Hesse 5, 3 5,7 4,9 1,9 1,9 1, 4 1, 4 1, 3 0,9<br />
Sonstige Others 8,8 6,6 6,8 3, 4 3,1 2,6 3,1 2 , 5 2 , 3<br />
Gesamt Total 100,0 100,0 100,0 100,0 100,0 100,0 100,0 100,0 100,0<br />
■ vorläufig/prel<strong>im</strong>inary<br />
* auf Basis der Meldungen von Mitgliedsfirmen des <strong>VDW</strong> und des Fachverbandes <strong>Werkzeugmaschinen</strong> <strong>im</strong> VDMA<br />
* based on reports from member companies of <strong>VDW</strong> and VDMA section Machine Tools<br />
stehen 468 Betriebe nach Zählmuster des Statistischen<br />
Bun desamtes gegenüber. <strong>Die</strong>ses bezieht allerdings deutlich<br />
mehr kleinere Anbieter von Teilen und Zubehör für <strong>Werkzeugmaschinen</strong><br />
ein.<br />
Detaillierte Aussagen zur Branchenstruktur lassen sich anhand<br />
von Ergebnissen aus der Verbandsstatistik treffen. <strong>Die</strong><br />
für <strong>2012</strong> ermittelten Kennzahlen sind näherungsweise auf<br />
die Branche insgesamt übertragbar. Danach beschäftigten<br />
<strong>2012</strong> etwa 55 % der Unternehmen höchstens 250 Mitarbeiter,<br />
erwirtschafteten 17 % (Vorjahr: 18 %) des gegenüber<br />
2011 um 9 % gestiegenen Produktionswerts und stehen für<br />
insgesamt 15 % (2011: knapp 17 %) des Beschäftigtenpotenzials.<br />
24 % der Anbieter (2011: 26 %) rangieren <strong>im</strong> Betriebsgrößenbereich<br />
zwischen mehr als 250 bis max<strong>im</strong>al<br />
500 Mitarbeiter, erzielen 25 % (2011: 26 %) des Gesamtproduktionswerts<br />
und beschäftigen knapp 27 % der Mitarbeiter<br />
<strong>im</strong> Industriezweig (2011: knapp 26 %). Gut 20 % der Firmen<br />
beschäftigen nominell mehr als 500 Personen und<br />
konzentrieren auf sich 57 % des Produktionswerts und 59 %<br />
der „Workforce“. <strong>Die</strong> nähere Betrachtung zeigt, dass sich die<br />
Anzahl dieser „Main Players“ letztlich auf 15 Firmenkonglomerate<br />
reduziert. Der ausgewiesene Prozentsatz (besagte<br />
20 %) geht nämlich auf die Erfassung einzelner, <strong>im</strong> Rahmen<br />
von Unternehmensgruppen selbstständig operierender<br />
Tochterfirmen zurück.<br />
Gegenüber der vorherigen Erhebung zeigt diese Struktur,<br />
dass die beiden „unteren“ Betriebsgrößenklassen ihre naturgemäß<br />
eher bescheidenen Anteile am Produktionswert<br />
und der Beschäftigtenzahl der Branche knapp gehalten<br />
haben. Einzig bei der Zahl der Betriebe mussten die Unternehmen<br />
bis 50 Beschäftigten einen Rückgang von fast<br />
2 % hinnehmen. Innerhalb der beiden „mittleren“ Grö-<br />
the term (as est<strong>im</strong>ated by the association), whereby the<br />
German Federal Office for Statistics counts 468 such businesses<br />
according to its own methodology. The latter figure,<br />
however, includes significantly more smaller manufacturers<br />
of parts and accessories for machine tools.<br />
More detailed conclusions on sector structure can be drawn<br />
from the results listed in the association’s statistics. The key<br />
indicators determined for <strong>2012</strong> can be approx<strong>im</strong>ately extra -<br />
polated to the industry as a whole. They report that about<br />
55% of the companies employed a max<strong>im</strong>um of 250 staff.<br />
Those companies generated 17% (previous year: 18%) of<br />
total production value, which increased by 9% over 2011.<br />
All together they represented 15% of the employment potential<br />
(2011: nearly 17%). Some 24% of manufacturers<br />
(2011: 26%) ranged in size from more than 250 up to a<br />
max<strong>im</strong>um of 500 employees. They achieved 25% (2011:<br />
26%) of the total production value and employed nearly<br />
27% of the personnel in this industrial sector (2011: nearly<br />
26%). A full 20% of the companies employed more than 500<br />
people, concentrating 57% of the gross value of production<br />
and 59% of the workforce. Closer observation reveals that<br />
these key players ult<strong>im</strong>ately boiled down to 15 conglome -<br />
rates. The percentage listed (i.e. the 20% mentioned above)<br />
actually derives from the registration of individual, independently<br />
operating subsidiaries within the framework of<br />
corporate groups.<br />
Compared to the previous survey, this structure reveals that<br />
both of the “lower” company size classifications barely<br />
maintained their earlier shares of the sector’s production<br />
value and workforce, which are naturally rather modest.<br />
The only category in decline was that of companies with 50<br />
employees or less, where the number of businesses fell by
62<br />
Customer structures – market research confirms the special<br />
significance of the automotive industry and mechanical<br />
engineering<br />
The association’s approach here examines the distribution<br />
of annual production within Germany and abroad according<br />
to user groups. The quality of a near-term study of this kind<br />
(two-year cycle, survey for 2011 completed) is particularly<br />
dependent on random samples. The product range and<br />
customer structure of the individual companies surveyed<br />
can exaggerate the effect of customers’ various procurement<br />
practices. Smaller and medium-sized customers in<br />
the electrical and electronics industry and the mechanical<br />
engineering sector tend to stretch or postpone investment<br />
projects in line with economic indicators and individually<br />
<strong>im</strong>plemented principles of commercial prudence. As a<br />
result, the less economy-sensitive projects of the larger<br />
corporations can have a very strong <strong>im</strong>pact.<br />
The lack of clear boundaries between segments poses a<br />
problem: Where does the “automotive electronics” sector –<br />
where manufacturers are considered as automotive supßenklassen<br />
gab es leichte Verschiebungen. Während sich<br />
die Anzahl der Betriebe <strong>im</strong> Segment bis 250 Mitarbeiter um<br />
knapp 2 Prozentpunkte erhöht, gingen die Werte bei den Beschäftigten<br />
und der Produktion gegenüber 2011 zurück. Innerhalb<br />
der beiden „oberen“ Größenklassen hat die Gruppe<br />
der Betriebe mit über 1.000 Beschäftigten ihren Anteil am<br />
Produktionswert deutlich auf gut 30 % erhöht. Auch die<br />
Zahl der Betriebe sowie die Beschäftigten stiegen <strong>im</strong> letzten<br />
<strong>Jahr</strong> in diesem Segment an. <strong>Die</strong> Gruppe der Unternehmen<br />
mit über 1.000 Mitarbeitern ist damit die einzige Betriebsgrößenklasse,<br />
die in allen drei Betrachtungen ihren<br />
Anteil erhöhen konnte.<br />
Regionale Verteilung entspricht traditionellem Grundmuster<br />
Wie unsere Übersicht zeigt, dominieren die Bundesländer<br />
Baden-Württemberg, Nordrhein-Westfalen und Bayern als<br />
Standorte.<br />
nearly 2%. Slight shifts occurred within the two “mid-size”<br />
categories. Whilst the number of businesses in the segment<br />
with 250 employees or less increased slightly by 2 percentage<br />
points, the average number of employees and the<br />
production levels in this segment fell versus 2011. Within<br />
the two “upper size categories”, the group of businesses<br />
with more than 1,000 employees raised its share of production<br />
value significantly to a full 30%. The number of businesses<br />
and the number of employees also increased in that<br />
segment last year. That makes the group of companies<br />
with more than 1,000 employees the only business size<br />
category which managed to increase its share in all three<br />
respects.<br />
Regional distribution corresponds to traditional basic pattern<br />
As our overview shows, Baden-Württemberg, North Rhine-<br />
Westphalia and Bavaria are dominant as locations.<br />
Hinsichtlich Firmen- und Beschäftigtenpotenzial bzw. realisiertem<br />
Produktionsvolumen vereinigt Baden-Württemberg<br />
2011 eindrucksvolle Sätze von 43 %, 48 % und 54 % auf<br />
sich. Bei der Anzahl der Betriebe gab es kaum nennenswerte<br />
Verschiebungen zwischen den Bundesländern. In der Produktion<br />
allerdings muss sich Nordrhein-Westfalen von Bayern<br />
überholen lassen und kommt nur noch auf einen Anteil<br />
von 17,0 % (2011: 18,2 %).<br />
With regard to company and employee potential and to<br />
production volume achieved, Baden-Württemberg posted<br />
<strong>im</strong>pressive rates of 43%, 48% and 54% respectively for 2011.<br />
In terms of the number of businesses, there were hardly<br />
any significant shifts among the German Federal States.<br />
Production in North Rhine-Westphalia was overtaken by<br />
that of Bavaria, however, ult<strong>im</strong>ately posting a share of only<br />
17% (2011: 18.2%).<br />
Kundenstrukturen: Marktforschung belegt die besondere<br />
Bedeutung der Automobil<strong>industrie</strong> und des Maschinenbaus<br />
Der Ansatz des Verbandes zielt hier auf die Verteilung der<br />
<strong>Jahr</strong>esproduktion nach Anwendergruppen <strong>im</strong> In- und Ausland<br />
ab. Eine kurzfristig angelegte Untersuchung solcher<br />
Art (zweijähriger Turnus, Erhebung für das <strong>Jahr</strong> 2011 erfolgte)<br />
ist in qualitativer Hinsicht besonders stichprobenabhängig.<br />
Je nach Programm- und Kundenstruktur der<br />
Firmen <strong>im</strong> Melderkreis schlägt unterschiedliches Beschaffungsverhalten<br />
der Abnehmer voll durch. Während kleinere<br />
und mittelständische Kunden aus dem Maschinenbau und<br />
der Elektro<strong>industrie</strong>, je nach konjunkturellem Barometerstand<br />
und individuell gehandhabten Regeln kaufmännischer<br />
Vorsicht, Investitionsvorhaben strecken oder vertagen,<br />
kann der Anteil relativ konjunkturautonomer Projekte der<br />
Groß<strong>industrie</strong> sehr hoch ausfallen.<br />
Ein Problem besteht in unscharfen Branchenabgrenzungen:<br />
Wo endet Autoelektronik, deren Hersteller als Automobilzulieferer<br />
deklariert sind, und was gehört unter das Label<br />
„Elektro<strong>industrie</strong>“. Gleiches gilt für den Bereich der Herstel-
Strukturdaten<br />
Structural data<br />
63<br />
Abnehmerbranchen der <strong>deutsche</strong>n <strong>Werkzeugmaschinen</strong><strong>industrie</strong><br />
Customer branches of the German machine tool industry<br />
Prozentuale Verteilung des Produktionswertes <strong>2012</strong> Percental distribution of the production value <strong>2012</strong><br />
Luft- und Raumfahrt<br />
Aerospace<br />
2,5 %<br />
Elektro<strong>industrie</strong><br />
Electrical industry<br />
3,2 %<br />
Lohnarbeit<br />
Job shops<br />
3,7 %<br />
Sonstiger Fahrzeugbau, Schiffbau<br />
Other vehicles, shipbuilding<br />
1,9 %<br />
Sonstige<br />
Others<br />
4,7 %<br />
Automobil- und Zuliefer<strong>industrie</strong>*<br />
Automotive industry and components supplier*<br />
41,9 %<br />
Feinmechanik und Optik<br />
Precision machanics and optics<br />
4,6 %<br />
Metallerzeugung und -bearbeitung,<br />
Metallerzeugnisse<br />
Metals, metal products<br />
8,5 %<br />
Maschinenbau<br />
Mechanical engineering<br />
29,0 %<br />
* Automobil<strong>industrie</strong>:<br />
23,5 %, Zulieferer: 18,4 %<br />
Quelle: <strong>VDW</strong>-Verbandsstatistik<br />
* Automotive industry:<br />
23,5%, Components<br />
supplier: 18,4%<br />
Source: <strong>VDW</strong> association’s<br />
statistics<br />
pliers – end, and what actually belongs under the “electrical<br />
and electronics industry” heading? The same applies for<br />
the metal products manufacturing sector (cf. locks and<br />
fittings suppliers). The association favours the terminology<br />
typically used by machine tool suppliers. From a market<br />
research perspective, the declared objective is to indicate<br />
the significance of particularly high-volume user <strong>industrie</strong>s<br />
like the automotive industry or mechanical construction<br />
in its entirety.<br />
The automotive industry, together with its component and<br />
system suppliers, increased its value share by 5 percentage<br />
points over 2009 to 42% in 2011, thereby underscoring its<br />
position as the largest client sector. This was pr<strong>im</strong>arily due<br />
to China and the USA, which sustained dynamic investment<br />
levels, particularly in the automotive branch. As the<br />
second largest customer sector together with its many different<br />
sub-segments, the share of machinery construction<br />
fell by 3 percentage points versus 2009 to 29%. Within machinery<br />
construction, mould and die making represented<br />
the single biggest sub-segment. Other major segments<br />
included machine tool construction itself, drive system<br />
technology, process engineering / energy management,<br />
mould and die making, and power machinery / turbines.<br />
Taken together, these two main customer segments – the<br />
automotive industry and machinery construction – reprelung<br />
von Metallerzeugnissen (siehe Zulieferer von Schlössern<br />
und Beschlägen). Der Verband priorisiert die bei den<br />
<strong>Werkzeugmaschinen</strong>herstellern gebräuchliche Sprachregelung.<br />
Unter Marktforschungsaspekten erklärtes Ziel ist es,<br />
die Bedeutung besonders volumenstarker Anwender<strong>industrie</strong>n,<br />
wie z.B. des Automobil- oder Maschinenbaus, in ihrer<br />
Gesamtheit darzustellen.<br />
<strong>Die</strong> Automobil<strong>industrie</strong> inklusive ihrer Systemlieferanten<br />
und Zulieferer baut 2011 ihren wertmäßigen Anteil gegen -<br />
über 2009 um 5 Prozentpunkte auf 42 % aus und unterstreicht<br />
damit ihre Stellung als wichtigste Abnehmerbranche.<br />
Wesentliche Ursache hierfür sind die Absatzmärkte<br />
China und USA, die von anhaltender Investitions dynamik<br />
gerade <strong>im</strong> Automobilsektor geprägt sind. Der Maschinenbau<br />
als zweitgrößter Kunde mit seinen vielfältigen Teilbranchen<br />
hält einen gegenüber 2009 um 3 Prozentpunkte<br />
reduzierten Anteil von 29 %. Innerhalb des Maschin enbaus<br />
stellt der Stanz-/Formenbau die größte Teilbranche. Weitere<br />
wichtige Segmente sind der <strong>Werkzeugmaschinen</strong>bau<br />
selbst, Antriebstechnik, Verfahrenstechnik/Energiewirtschaft,<br />
Stanzwerkzeuge/Formenbau sowie Kraftmaschinen/Turbinen.<br />
Nach den Hauptkunden Automobil<strong>industrie</strong> und Maschinenbau,<br />
die zusammen für zwei Drittel des Absatzes<br />
stehen, spielen die Metallerzeugung und -bearbeitung
64<br />
(Anteil: 8,5 %; vor allem Stahlproduktion, Walzwerke) sowie<br />
die Herstellung von Metallerzeugnissen (5,3%; z. B. Stahl-/<br />
Leichtmetallbau, Press-/Stanz-/Drehteile, Kesselbau, Drahtwaren<br />
sowie unterschiedlichste Metallwaren) eine wichtige<br />
Rolle. Zu den weiteren bedeutenden Kundengruppen zählen<br />
Feinmechanik/Optik (4,6%; inkl. Medizintechnik), Lohnarbeit<br />
(3,7%), Elektrotechnik (3,2%), Luft- und Raumfahrt (2,5%)<br />
sowie sonstiger Fahrzeugbau (1,9%, inkl. Schienenfahrzeuge,<br />
Schiffbau).<br />
Eine tendenziell andere Gewichtung ergibt sich bei der Betrachtung<br />
des stückzahlmäßigen Absatzes. Hier führt der<br />
Maschinenbau mit einem Anteil von 31,2 %, die Automobil<strong>industrie</strong><br />
und ihre Zuliefersparten folgen mit 30,8 %. <strong>Die</strong>s<br />
erklärt sich mit dem höheren Anteil des Projektgeschäfts<br />
be<strong>im</strong> Kunden Automobil<strong>industrie</strong>, charakterisiert durch<br />
den Einsatz von werkstückspezifischen Sondermaschinen<br />
und komplexen Fertigungslinien.<br />
sented two thirds of all sales. They were followed by metal<br />
production and metalworking (8.5% share, above all steel<br />
production and rolling mills) and the manufacture of metal<br />
products (5.3% share, e.g. steel / lightweight metal con struc -<br />
tion, pressed / punched / turned parts, boiler construction,<br />
wire products and an extremely wide range of metal goods),<br />
which also played an <strong>im</strong>portant role. The other <strong>im</strong>portant<br />
customer categories included precision mechanics / optics<br />
(4.6%, including medical technology), commissioned work<br />
(3.7%), electrical technology (3.2%), aerospace (2.5%) and<br />
other vehicle construction (1.9%, including rail vehicles and<br />
shipbuilding).<br />
Viewing performance-based unit sales tends to weight the<br />
results differently. On that basis, machinery construction<br />
led with a share of 31.2%, while the automotive industry<br />
and its supplier segments followed with 30.8%. This can be<br />
explained by the higher share of project business with the<br />
automotive industry customer segment, which is character -<br />
ised by the use of workpiece-specific special machines and<br />
complex assembly lines.
Statistischer Anhang, methodische Hinweise, <strong>VDW</strong>-Mitgliedsfirmen<br />
XXX 65<br />
XXX<br />
Statistical appendix, methodical comments, <strong>VDW</strong> member companies<br />
Innenrundschleifmaschinen bieten für viele Anwendungen die passende Lösung, z. B. für die Herstellung von Prototypen und Kleinserien<br />
in der Werkzeug<strong>industrie</strong>: Spritzformen für Kunststoffteile, Werkzeughalter, Speziallager, Muttern für Kugelumlaufspindeln und<br />
vieles mehr. Mit der entsprechenden Ausstattung können Innenschleifmaschinen sogar in effiziente Produktionsmaschinen um ge wandelt<br />
werden, z. B. für die Bearbeitung von Komponenten für Schlagbohrer, speziell beschichtete Flansche für die Luftfahrt<strong>industrie</strong> etc.<br />
Internal cylindrical grinding machines offer the right solution for many applications, e.g. in the production of prototypes and l<strong>im</strong>ited series in<br />
the tooling industry: injection moulds for plastic parts, tool holders, special bearings, nuts for ball screws, and much more. With the appropriate<br />
equipment configuration, internal grinding machines can even be converted into efficient production machines, e.g. for the machining of<br />
components for percussion drills, specially coated flanges for the aerospace industry, etc.
67 Historische Zeitreihen der <strong>deutsche</strong>n <strong>Werkzeugmaschinen</strong><strong>industrie</strong><br />
68 <strong>Werkzeugmaschinen</strong>-Produktion und -Außenhandel Deutschlands nach Maschinengruppen<br />
69 Deutscher <strong>Werkzeugmaschinen</strong>-Import nach Ländern und Regionen<br />
70 Deutscher <strong>Werkzeugmaschinen</strong>-Export nach Ländern und Regionen<br />
72 Welt-<strong>Werkzeugmaschinen</strong>-Statistik<br />
74 <strong>Jahr</strong>esdurchschnittskurse des Euro<br />
74 Methodische Hinweise zur Weltstatistik<br />
67 Historical t<strong>im</strong>e series of the German machine tool industry<br />
68 German machine tool production and trade by machinery groups<br />
69 German machine tool <strong>im</strong>ports by countries and regions<br />
70 German machine tool exports by countries and regions<br />
72 World machine tool statistics<br />
74 Annual average rates of the Euro<br />
74 Remarks on the methodology for world statistics
Anhang<br />
Appendix<br />
67<br />
Historische Zeitreihen der <strong>deutsche</strong>n <strong>Werkzeugmaschinen</strong><strong>industrie</strong> (Mio. EUR)<br />
Historical t<strong>im</strong>e series of the German machine tool industry (mill. EUR)<br />
Produktion Produktion<br />
Auftragseingang<br />
Export Import Verbrauch<br />
Gesamt* (ohne Repar.*)<br />
Gesamt Inland Ausland<br />
Production Production<br />
Domestic<br />
Order intake<br />
Exports Imports<br />
total* (excl. Repair*)<br />
onsumpt. Total Domestic Foreign<br />
Beschäftigte<br />
Kapazitätsauslastung<br />
(%) (Monate)<br />
Auftragsbestand<br />
Employment<br />
Capacity Order backlog<br />
utilization (%) (months)<br />
1962 1 679 790 238 1 127 1 277 707 570 113 000<br />
1963 1 552 832 141 861 1 179 630 5 49 106 000<br />
1964 1 550 798 156 908 1 658 97 1 687 110 000<br />
1965 1 740 819 199 1 120 1 849 1 084 765 115 000<br />
1966 1 815 996 179 998 1 785 832 95 4 112 500<br />
1967 1 791 1 127 130 794 1 724 713 1 011 108 000<br />
1968 1 815 1 239 156 733 2 466 1 124 1 343 110 000<br />
1969 2 202 1 301 269 1 170 3 471 1 933 1 538 120 000<br />
1970 2 744 1 498 397 1 643 3 173 1 872 1 300 125 000<br />
1971 3 082 1 563 419 1 93 8 2 327 1 264 1 063 120 000<br />
1972 2 921 1 664 356 1 612 2 534 1 151 1 383 113 000<br />
1973 2 969 1 861 300 1 408 3 675 1 638 2 037 112 000 85,9<br />
1974 3 459 2 444 316 1 332 3 737 1 423 2 313 111 500 88,7<br />
1975 3 462 2 595 341 1 208 3 629 1 606 2 023 102 000 80,2<br />
1976 3 562 2 564 382 1 3 80 3 542 1 377 2 165 97 000 77,9<br />
1977 3 623 2 528 472 1 567 3 894 1 921 1 973 99 000 80,2<br />
1978 3 926 2 552 585 1 959 4 681 2 303 2 378 98 500 88,2<br />
1979 4 396 2 722 709 2 3 84 5 313 2 664 2 649 100 000 90,3<br />
1980 5 055 3 162 924 2 817 5 515 2 514 3 001 99 000 92 , 5<br />
1981 5 252 3 447 895 2 701 4 829 2 158 2 671 99 000 89,7<br />
1982 5 005 3 211 773 2 567 4 679 2 307 2 371 94 500 79, 3<br />
1983 4 807 2 980 766 2 592 4 207 1 846 2 361 84 000 75,9<br />
1984 4 822 3 092 871 2 602 5 645 2 699 2 946 83 000 84,1 6, 6<br />
1985 5 588 3 485 1 182 3 284 7 400 3 493 3 907 88 000 94,6 8 , 8<br />
1986 6 654 4 034 1 485 4 104 7 535 3 542 3 994 93 000 95,7 10,1<br />
1987 6 786 3 907 1 444 4 323 5 847 2 894 2 953 93 500 92,8 9, 2<br />
1988 6 811 4 214 1 443 4 040 6 988 3 186 3 801 94 000 92 , 5 7, 9<br />
1989 7 622 4 692 1 777 4 707 9 196 4 647 4 549 99 500 96,4 9,1<br />
1990 8 398 4 830 2 248 5 816 8 939 4 759 4 180 103 000 95,0 9, 8<br />
1991 8 812 5 025 2 488 6 275 7 838 4 287 3 551 98 000 89,7 8 ,7<br />
1992 7 239 4 350 1 960 4 850 5 942 3 004 2 938 89 500 81,5 6, 6<br />
1993 5 474 3 552 1 292 3 214 4 734 2 120 2 614 82 500 69,0 4, 9<br />
1994 5 316 3 608 1 348 3 056 6 014 2 682 3 333 72 000 79,2 5, 5<br />
1995 6 448 6 325 3 611 1 667 4 3 81 7 519 3 401 4 117 65 400 88,4 7, 5<br />
1996 6 954 6 855 4 168 1 884 4 572 6 742 3 167 3 575 66 500 87,1 7, 5<br />
1997 7 325 7 182 4 145 2 141 5 178 7 893 3 532 4 361 64 100 88,1 6, 9<br />
1998 8 223 8 094 4 438 2 729 6 3 86 9 269 4 714 4 555 64 100 92,6 8 ,0<br />
1999 8 602 8 476 4 278 2 860 7 058 7 931 4 180 3 752 65 300 90,8 7, 5<br />
2000 9 207 9 070 5 099 2 399 6 370 10 822 4 957 5 865 66 000 94,8 7, 8<br />
2001 10 294 10 147 5 676 2 623 7 094 9 375 4 734 4 641 69 500 92 , 3 8 ,0<br />
2002 9 606 8 989 5 157 2 091 5 922 9 430 4 490 4 940 67 700 83, 5 7,0<br />
2003 9 078 8 448 4 965 1 856 5 339 8 720 3 670 5 050 66 885 82,3 6, 4<br />
2004 9 586 8 912 5 546 1 950 5 316 10 300 4 050 6 250 65 036 86,3 6, 2<br />
2005 10 374 9 700 6 136 2 165 5 730 10 460 4 050 6 410 64 951 88,2 6,1<br />
2006 10 806 10 072 7 055 2 599 5 617 12 380 5 050 7 330 65 044 90,6 6, 4<br />
2007 12 624 11 769 7 759 3 341 7 351 16 000 6 730 9 270 66 369 93,6 7, 5<br />
2008 14 178 13 253 8 206 3 712 8 758 13 730 5 610 8 120 70 839 94,7 8 ,7<br />
2009 10 177 9 390 6 033 2 121 5 477 6 230 2 170 4 060 69 614 72,6 6, 2<br />
2010 9 881 9 029 6 087 1 983 4 925 11 650 3 790 7 860 64 108 75,4 7, 4<br />
2011 12 919 11 866 7 949 2 819 6 737 16 860 5 550 11 310 65 837 93,8 9,1<br />
<strong>2012</strong> 14 060 12 970 9 555 3 225 6 640 15 140 5 020 10 120 69 314 95,2 8 , 5<br />
■ Daten teilweise geschätzt<br />
* Produktion Gesamt beinhaltet ab 1996 „Installation“ und ab 2002 „Reparatur/<br />
Instandhaltung“. Für einen sinnvollen Vergleich mit Export- und Importdaten<br />
sind diese Werte aber nicht enthalten.<br />
Hinweise:<br />
– Verbrauch = Produktion – Export + Import<br />
– Teilweise wurden Daten revidiert<br />
– Auftragseingang enthält ab 2002 „Installation, Reparatur und Instandhaltung“<br />
– Beschäftigte, Kapazitätsauslastung und Auftragsbestand sind <strong>Jahr</strong>esdurchschnitte<br />
– Daten ab 1996 inkl. neue Bundesländer (Beschäftigte ab 1996)<br />
Quellen: Statistisches Bundesamt, Ifo-Institut München, VDMA, <strong>VDW</strong><br />
■ Data partly est<strong>im</strong>ated<br />
* Production total includes „installation“ (since 1995) and „repair/maintenance“<br />
(since 2002). For a reasonable comparison with export and <strong>im</strong>port data these<br />
figures are excluded.<br />
Note:<br />
– Consumption = production - exports + <strong>im</strong>ports<br />
– Data are partly revised<br />
– Order intake includes „installation, repair and maintenance“ since 2002<br />
– Employment, capacity utilization and order backlog = average of year<br />
– Data include New German Countries since 1991 (employment since 1993)<br />
Sources: German Statistical Office, Ifo Institute Munich, VDMA, <strong>VDW</strong>
68<br />
<strong>Werkzeugmaschinen</strong>-Produktion und -Außenhandel Deutschlands nach Maschinengruppen (Mio. EUR)<br />
German machine tool production and trade by machinery groups (mill. EUR)<br />
2005 2006 2007 2008 2009 2010 2011 <strong>2012</strong><br />
Laser-, Erodier- und andere abtragende <strong>Werkzeugmaschinen</strong><br />
Laser machines, electrical discharge machines,<br />
other metal removing machines<br />
Bearbeitungszentren, Flexible Systeme<br />
Machining centres, flexible systems<br />
Mehrwege-, Transfermaschinen<br />
Unit construction machines, transfer machines<br />
Drehmaschinen, Drehzentren<br />
Turning machines, turning centres<br />
Bohr-, Ausbohrmaschinen, kombinierte Ausbohr- und Fräsmaschinen<br />
Drilling machines, boring machines, boring-milling machines<br />
Fräsmaschinen<br />
Milling machines<br />
Schleif-, Hon-, Läpp- und Poliermaschinen<br />
Grinding, honing, lapping and polishing machines<br />
Verzahnmaschinen, Zahnfertigbearbeitungsmaschinen<br />
Gear cutting and finishing machines<br />
Säge- und Trennmaschinen<br />
Sawing and cutting-off machines<br />
Sonstige spanende <strong>Werkzeugmaschinen</strong><br />
Other metal cutting machine tools<br />
Spanende <strong>Werkzeugmaschinen</strong><br />
Metal cutting machine tools<br />
Schmiedemaschinen und Hämmer (einschl. Pressen)<br />
Forging machines and hammers (incl. presses)<br />
Biege-, Abkant- und Richtmaschinen (einschl. Pressen)<br />
Bending, folding and straightening mach. (incl. presses)<br />
Scheren, Stanzen, Ausklinkmaschinen (einschl. Pressen)<br />
Shearing, punching, notching machines (incl. presses)<br />
Andere Pressen<br />
Other presses<br />
Drahtbe- und verarbeitungsmaschinen*<br />
Wire working machines*<br />
Sonstige umformende <strong>Werkzeugmaschinen</strong><br />
Other metal forming machines tools<br />
Umformende <strong>Werkzeugmaschinen</strong><br />
Metal forming machine tools<br />
Teile und Zubehör<br />
Parts and accessories<br />
<strong>Werkzeugmaschinen</strong> inkl. Teile und Zubehör<br />
Machine tools incl. parts and accessories<br />
Produktion<br />
Export<br />
Import<br />
Produktion<br />
Export<br />
Import<br />
Produktion<br />
Export<br />
Import<br />
Produktion<br />
Export<br />
Import<br />
Produktion<br />
Export<br />
Import<br />
Produktion<br />
Export<br />
Import<br />
Produktion<br />
Export<br />
Import<br />
Produktion<br />
Export<br />
Import<br />
Produktion<br />
Export<br />
Import<br />
Produktion<br />
Export<br />
Import<br />
Produktion<br />
Export<br />
Import<br />
Produktion<br />
Export<br />
Import<br />
Produktion<br />
Export<br />
Import<br />
Produktion<br />
Export<br />
Import<br />
Produktion<br />
Export<br />
Import<br />
Produktion<br />
Export<br />
Import<br />
Produktion<br />
Export<br />
Import<br />
Produktion<br />
Export<br />
Import<br />
Produktion<br />
Export<br />
Import<br />
Produktion<br />
Export<br />
Import<br />
* ab 2009 wegen Gehe<strong>im</strong>haltung nicht mehr ausgewiesen<br />
Hinweise: Produktionsvolumen nach Maschinengruppen für <strong>2012</strong> noch nicht verfügbar.<br />
Daten teilweise revidiert; Produktions- und Außenhandelsdaten nur eingeschränkt<br />
vergleichbar (z. B. Produktion i. d .R. neue Maschinen, <strong>im</strong> Außenhandel auch gebrauchte<br />
Maschinen enthalten) Quellen: Statistisches Bundesamt, <strong>VDW</strong>, VDMA<br />
420<br />
460<br />
294<br />
1 412<br />
916<br />
259<br />
429<br />
264<br />
39<br />
1 057<br />
615<br />
340<br />
129<br />
153<br />
67<br />
745<br />
324<br />
61<br />
1 061<br />
703<br />
246<br />
354<br />
281<br />
25<br />
162<br />
89<br />
23<br />
95<br />
41<br />
12<br />
5 862<br />
3 846<br />
1 366<br />
89<br />
46<br />
21<br />
440<br />
255<br />
96<br />
307<br />
241<br />
70<br />
692<br />
403<br />
57<br />
218<br />
107<br />
19<br />
268<br />
227<br />
30<br />
2 014<br />
1 279<br />
293<br />
1 824<br />
1 011<br />
506<br />
9 700<br />
6 136<br />
2 165<br />
461<br />
588<br />
424<br />
1 310<br />
1 189<br />
287<br />
376<br />
212<br />
44<br />
1 112<br />
649<br />
443<br />
148<br />
176<br />
60<br />
862<br />
375<br />
77<br />
973<br />
727<br />
243<br />
457<br />
404<br />
42<br />
205<br />
122<br />
34<br />
93<br />
67<br />
10<br />
5 997<br />
4 510<br />
1 664<br />
74<br />
91<br />
26<br />
444<br />
309<br />
113<br />
335<br />
294<br />
101<br />
611<br />
326<br />
61<br />
236<br />
131<br />
20<br />
380<br />
335<br />
39<br />
2 081<br />
1 487<br />
360<br />
1 995<br />
1 057<br />
575<br />
10 072<br />
7 055<br />
2 599<br />
555<br />
684<br />
581<br />
1 542<br />
1 288<br />
397<br />
465<br />
143<br />
53<br />
1 370<br />
771<br />
604<br />
188<br />
189<br />
97<br />
996<br />
389<br />
93<br />
1 120<br />
788<br />
288<br />
543<br />
403<br />
64<br />
238<br />
161<br />
40<br />
71<br />
46<br />
11<br />
7 089<br />
4 863<br />
2 228<br />
88<br />
137<br />
45<br />
505<br />
413<br />
160<br />
446<br />
382<br />
115<br />
623<br />
370<br />
74<br />
286<br />
145<br />
22<br />
403<br />
379<br />
48<br />
2 352<br />
1 825<br />
464<br />
2 328<br />
1 072<br />
649<br />
11 769<br />
7 759<br />
3 341<br />
543<br />
695<br />
549<br />
1 913<br />
1 301<br />
444<br />
564<br />
120<br />
72<br />
1 565<br />
845<br />
659<br />
215<br />
203<br />
122<br />
1 086<br />
396<br />
114<br />
1 226<br />
824<br />
369<br />
748<br />
548<br />
104<br />
268<br />
168<br />
48<br />
86<br />
96<br />
16<br />
8 214<br />
5 197<br />
2 496<br />
160<br />
136<br />
40<br />
543<br />
396<br />
180<br />
432<br />
360<br />
111<br />
605<br />
417<br />
66<br />
299<br />
171<br />
23<br />
462<br />
337<br />
49<br />
2 501<br />
1 816<br />
468<br />
2 537<br />
1 193<br />
748<br />
13 253<br />
8 206<br />
3 712<br />
277<br />
379<br />
229<br />
1 269<br />
944<br />
217<br />
516<br />
149<br />
34<br />
1 062<br />
596<br />
343<br />
146<br />
180<br />
125<br />
703<br />
285<br />
96<br />
853<br />
587<br />
210<br />
619<br />
528<br />
48<br />
145<br />
89<br />
31<br />
50<br />
72<br />
15<br />
5 642<br />
3 808<br />
1 347<br />
232<br />
168<br />
26<br />
409<br />
302<br />
110<br />
328<br />
271<br />
55<br />
562<br />
337<br />
37<br />
211<br />
*<br />
17<br />
382<br />
325<br />
22<br />
2 125<br />
1 403<br />
268<br />
1 623<br />
821<br />
506<br />
9 390<br />
6 033<br />
2 121<br />
319<br />
503<br />
276<br />
1 081<br />
811<br />
183<br />
466<br />
78<br />
29<br />
960<br />
585<br />
305<br />
162<br />
213<br />
54<br />
668<br />
328<br />
54<br />
710<br />
638<br />
181<br />
528<br />
476<br />
38<br />
149<br />
87<br />
28<br />
51<br />
65<br />
7<br />
5 092<br />
3 784<br />
1 155<br />
299<br />
237<br />
31<br />
384<br />
272<br />
99<br />
341<br />
262<br />
85<br />
578<br />
231<br />
31<br />
184<br />
*<br />
16<br />
300<br />
288<br />
25<br />
2 086<br />
1 291<br />
288<br />
1 851<br />
1 012<br />
540<br />
9 029<br />
6 087<br />
1 983<br />
408<br />
698<br />
423<br />
1 699<br />
1 217<br />
314<br />
570<br />
203<br />
41<br />
1 491<br />
796<br />
494<br />
187<br />
225<br />
71<br />
776<br />
401<br />
71<br />
1 034<br />
859<br />
279<br />
575<br />
515<br />
56<br />
202<br />
110<br />
34<br />
62<br />
62<br />
10<br />
7 003<br />
5 085<br />
1 794<br />
241<br />
161<br />
27<br />
470<br />
414<br />
122<br />
435<br />
338<br />
89<br />
757<br />
432<br />
61<br />
250<br />
*<br />
19<br />
457<br />
364<br />
29<br />
2 610<br />
1 708<br />
347<br />
2 254<br />
1 155<br />
679<br />
11 866<br />
7 949<br />
2 819<br />
–<br />
815<br />
416<br />
–<br />
1 678<br />
404<br />
–<br />
215<br />
55<br />
–<br />
917<br />
478<br />
–<br />
273<br />
93<br />
–<br />
505<br />
97<br />
–<br />
986<br />
345<br />
–<br />
535<br />
77<br />
–<br />
135<br />
42<br />
–<br />
71<br />
19<br />
7 830<br />
6 130<br />
2 026<br />
–<br />
193<br />
50<br />
–<br />
571<br />
141<br />
–<br />
315<br />
85<br />
–<br />
439<br />
68<br />
–<br />
*<br />
18<br />
–<br />
499<br />
30<br />
–<br />
2 016<br />
392<br />
2 770<br />
1 409<br />
807<br />
12 970<br />
9 555<br />
3 225<br />
* since 2009 not published due to nondisclosure<br />
Note: production data by machinery groups not yet available for <strong>2012</strong>; data partly<br />
revised; comparison of production with trade figures is partly restricted (e.g. production<br />
figures include only new machines, trade figures also used machines)<br />
Sources: German Statistical Office, <strong>VDW</strong>, VDMA
Anhang<br />
Appendix<br />
69<br />
Deutscher <strong>Werkzeugmaschinen</strong>-Import nach Ländern und Regionen<br />
German machine tool <strong>im</strong>ports by countries and regions<br />
Maschinen (Mio. EUR) Teile, Zubehör (Mio. EUR) Gesamt (Mio. EUR) Gesamt (%-Ant.) Gesamt (%-VR)<br />
Machines (mill. EUR) Parts, accessories (mill. EUR) Total (mill. EUR) Total (%-share) Total (%-change)<br />
2010 2011 <strong>2012</strong> 2010 2011 <strong>2012</strong> 2010 2011 <strong>2012</strong> 2011 <strong>2012</strong> 2011 <strong>2012</strong><br />
Gesamt<strong>im</strong>port Total <strong>im</strong>ports 1 442,4 2 140,7 2 418,4 540,4 678,6 806,7 1 982,8 2 819,3 3 225,2 100,0 100,0 +42 +14<br />
Frankreich France 41,1 50,6 53,9 15,5 20,9 24,6 56,6 71,5 78,5 2,5 2,4 +26 +10<br />
Belgien Belgium 11,7 12,4 13,2 3,5 4,6 4,7 54,8 17,0 17,9 1,0 0,8 +44 –7<br />
Luxemburg Luxembourg 0,0 0,0 0,5 0,9 1,9 2,8 11,3 1,9 3,3 0,2 0,2 +8 +45<br />
Niederlande Netherlands 34,0 60,5 70,6 10,1 15,9 22,0 44,2 76,5 92,5 2,7 2,9 +73 +21<br />
Italien Italy 110,8 146,3 217,9 58,4 71,0 85,5 169,2 217,3 303,5 7,7 9,4 +28 +40<br />
Verein. Königreich United Kingdom 38,8 33,9 81,0 7,8 7,4 10,1 46,7 41,3 91,1 1,5 2,8 –11 +120<br />
Irland Ireland 1,1 0,8 0,2 0,3 0,4 0,2 1,3 1,1 0,5 0,0 0,0 –15 –60<br />
Dänemark Denmark 7,7 8,3 7,6 4,2 6,2 5,0 12,0 14,5 12,5 0,5 0,4 +21 –13<br />
Spanien Spain 35,9 55,3 73,6 6,4 8,3 13,9 42,3 63,6 87,5 2,3 2,7 +50 +38<br />
Schweden Sweden 8,0 6,5 10,9 8,9 9,3 13,9 16,8 15,8 24,8 0,6 0,8 –6 +57<br />
Finnland Finland 5,3 5,2 7,1 2,1 1,6 3,2 7,4 6,8 10,3 0,2 0,3 –8 +51<br />
Österreich Austria 84,7 86,8 89,5 25,7 33,1 51,1 110,4 120,0 140,6 4,3 4,4 +9 +17<br />
Polen Poland 11,3 18,1 27,4 33,3 43,8 48,8 44,6 61,9 76,2 2,2 2,4 +39 +23<br />
Tschech. Rep. Czech Rep. 91,8 93,5 157,5 36,9 48,9 80,9 128,7 142,4 238,4 5,1 7,4 +11 +67<br />
Slowakei Slovakia 13,8 19,2 14,8 8,9 16,0 17,9 22,8 35,3 32,6 1,3 1,0 +55 –7<br />
Ungarn Hungary 0,9 1,3 1,5 9,3 16,2 22,1 10,2 17,5 23,6 0,6 0,7 +72 +34<br />
Rumänien Romania 2,5 1,6 5,1 3,3 5,6 8,8 5,8 7,2 14,0 0,3 0,4 +23 +94<br />
Bulgarien Bulgaria 3,3 5,2 6,2 2,2 2,3 2,9 5,5 7,4 9,2 0,3 0,3 +35 +24<br />
Slowenien Slovenia 5,2 8,6 11,8 7,6 12,1 13,6 12,8 20,6 25,4 0,7 0,8 +61 +23<br />
Sonstige Others 0,4 1,9 2,1 2,0 1,9 3,0 2,4 3,8 5,1 0,1 0,2 +61 +33<br />
EU-27 EU 27 508,4 616,0 852,4 247,3 327,6 434,9 755,7 943,6 1 287,4 33,5 39,9 +25 +36<br />
Schweiz Switzerland 452,4 714,2 707,7 156,3 184,6 195,1 608,7 898,9 902,8 31,9 28,0 +48 +0<br />
Türkei Turkey 26,0 49,8 52,5 4,2 6,1 5,9 30,2 55,9 58,5 2,0 1,8 +85 +5<br />
Russland Russia 2,5 1,9 1,9 0,4 0,6 0,8 2,8 2,5 2,6 0,1 0,1 –12 +6<br />
Kroatien Croatia 6,5 6,8 6,5 2,9 5,6 6,8 9,4 12,4 13,3 0,4 0,4 +32 +7<br />
Sonstige Others 3,8 3,8 2,7 6,6 12,7 13,8 10,4 16,6 16,5 0,6 0,5 +59 –0<br />
Sonst. Europa Other Europe 491,2 776,6 771,4 170,3 209,6 222,4 661,5 986,2 993,7 35,0 30,8 +49 +1<br />
Europa Europe 999,6 1 392,6 1 623,8 417,6 537,2 657,3 1 417,2 1 929,8 2 281,1 68,4 70,7 +36 +18<br />
Afrika Africa 1,0 1,8 0,9 1,2 0,9 0,8 2,2 2,7 1,8 0,1 0,1 +23 –34<br />
USA USA 65,1 95,5 93,0 38,1 34,7 40,8 103,2 130,1 133,8 4,6 4,1 +26 +3<br />
Kanada Canada 2,9 1,7 3,2 0,9 0,5 1,0 3,7 2,2 4,2 0,1 0,1 –41 +89<br />
Nord-Amerika North America 68,0 97,2 96,2 38,9 35,1 41,8 106,9 132,3 138,0 4,7 4,3 +24 +4<br />
Mittel-Amerika Middle America 0,3 0,3 0,4 0,3 0,4 0,6 0,5 0,7 1,0 0,0 0,0 +38 +31<br />
Brasilien Brazil 1,9 13,0 16,3 13,9 7,0 2,1 15,7 20,0 18,4 0,7 0,6 +27 –8<br />
Sonstige Others 0,0 0,0 0,0 0,0 0,0 0,3 0,1 0,1 0,3 0,0 0,0 +46 +240<br />
Süd-Amerika South America 1,9 13,0 16,3 13,9 7,0 2,4 15,8 20,1 18,7 0,7 0,6 +27 –7<br />
Amerika America 70,1 110,5 112,8 53,1 42,6 44,7 123,2 153,1 157,6 5,4 4,9 +24 +3<br />
Naher/Mittlerer Osten Near/Middle East 0,7 0,3 0,5 2,2 2,6 3,8 2,8 2,9 4,3 0,1 0,1 +2 +50<br />
Indien India 1,6 4,6 3,4 3,5 6,5 8,2 5,1 11,2 11,5 0,4 0,4 +119 +3<br />
Sonstige Others 0,0 0,0 0,0 0,0 0,2 0,1 0,0 0,2 0,1 0,0 0,0 +492 –44<br />
Zentral-/Süd-Asien Central/South Asia 1,7 4,6 3,4 3,5 6,7 8,2 5,1 11,3 11,6 0,4 0,4 +121 +2<br />
Thailand Thailand 4,6 11,3 8,5 0,5 0,5 0,4 5,0 11,8 8,9 0,4 0,3 +135 –25<br />
Singapur Singapore 3,6 11,8 8,9 0,9 0,8 0,6 4,6 12,6 9,4 0,4 0,3 +177 –25<br />
China China 56,2 87,0 104,3 17,4 25,1 27,9 73,6 112,1 132,2 4,0 4,1 +52 +18<br />
Südkorea South Korea 52,9 104,0 91,5 7,4 8,0 7,7 60,3 112,1 99,2 4,0 3,1 +86 –11<br />
Japan Japan 203,0 317,3 336,5 26,3 39,0 43,2 229,4 356,3 379,7 12,6 11,8 +55 +7<br />
Taiwan Taiwan 46,8 91,1 113,0 7,3 10,7 9,5 54,2 101,7 122,5 3,6 3,8 +88 +20<br />
Sonstige Others 0,2 1,7 1,0 1,4 1,8 1,6 1,7 3,5 2,6 0,1 0,1 +107 –25<br />
Ost-/SO-Asien East/Southeast Asia 367,3 624,2 663,8 61,3 85,9 90,8 428,6 710,1 754,6 25,2 23,4 +66 +6<br />
Asien Asia 369,7 629,2 667,7 66,9 95,2 102,8 436,6 724,3 770,5 25,7 23,9 +66 +6<br />
Australien/Ozeanien Australia/Oceania 2,1 6,0 13,2 1,6 1,4 1,0 3,6 7,4 14,2 0,3 0,4 +104 +91<br />
Sonstige Länder Other countries 0,0 0,5 0,0 0,0 1,4 0,0 0,0 1,9 0,0 0,1 0,0<br />
EU-27 EU 27 508,4 616,0 852,4 247,3 327,6 434,9 755,7 943,6 1 287,4 33,5 39,9 +25 +36<br />
Nicht-EU-Länder Non EU countries 934,0 1 524,7 1 566,0 293,1 351,0 371,8 1 227,2 1 875,7 1 937,8 66,5 60,1 –100 +3<br />
Hinweise: Warennummern des Außenhandels: Maschinen = 8456 – 8463<br />
(ohne 845691, 845699 30/50), 847940,Teile/Zubehör = 846693, 846694;<br />
%-Ant. = Prozentanteil, %-VR = prozentuale Veränderung zum Vorjahr<br />
Quellen: Statistisches Bundesamt, <strong>VDW</strong>, VDMA<br />
Note: foreign trade tariff codes: machines = 8456 – 8463<br />
(excl. 845691, 846699 30/50), 847940, parts/accessories = 846693, 846694;<br />
%-Change = percental change to previous year<br />
Sources: German Statistical Office, <strong>VDW</strong>, VDMA
70<br />
Deutscher <strong>Werkzeugmaschinen</strong>-Export nach Ländern und Regionen<br />
German machine tool exports by countries and regions<br />
Maschinen (Mio. EUR) Teile, Zubehör (Mio. EUR) Gesamt (Mio. EUR) Gesamt (%-Ant.) Gesamt (%-VR)<br />
Machines (mill. EUR) Parts, accessories (mill. EUR) Total (mill. EUR) Total (%-share) Total (%-change)<br />
2010 2011 <strong>2012</strong> 2010 2011 <strong>2012</strong> 2010 2011 <strong>2012</strong> 2011 <strong>2012</strong> 2011 <strong>2012</strong><br />
Gesamtexport Total exports 5 075,1 6 793,5 8 145,8 1 012,0 1 155,1 1 409,4 6 087,1 7 948,6 9 555,2 100,0 100,0 +31 +20<br />
Frankreich France 156,1 270,8 298,3 51,6 59,9 64,3 207,7 330,7 362,6 4,2 3,8 +59 +10<br />
Belgien Belgium 39,6 67,3 59,5 15,2 11,9 14,5 54,8 79,2 74,0 1,0 0,8 +44 –7<br />
Luxemburg Luxemburg 9,1 10,1 14,8 2,2 2,0 2,8 11,3 12,2 17,6 0,2 0,2 +8 +45<br />
Niederlande Netherlands 79,8 88,7 97,8 22,7 29,3 53,1 102,5 118,0 150,9 1,5 1,6 +15 +28<br />
Italien Italy 214,9 240,9 218,7 48,5 49,6 58,1 263,5 290,4 276,7 3,7 2,9 +10 –5<br />
Verein. Königreich United Kingdom 125,6 125,7 275,8 36,5 27,6 66,7 162,1 153,3 342,5 1,9 3,6 –5 +123<br />
Irland Ireland 7,0 11,2 6,0 1,6 1,5 1,6 8,6 12,7 7,6 0,2 0,1 +48 –40<br />
Dänemark Denmark 22,0 37,0 44,1 6,8 9,8 8,4 28,8 46,8 52,5 0,6 0,5 +63 +12<br />
Griechenland Greece 9,1 2,8 3,0 1,4 1,2 1,2 10,5 4,0 4,2 0,1 0,0 –62 +4<br />
Portugal Portugal 16,9 13,5 26,8 2,9 4,0 7,1 19,7 17,6 33,9 0,2 0,4 –11 +93<br />
Spanien Spain 62,2 68,6 86,4 15,8 19,0 19,1 78,0 87,6 105,6 1,1 1,1 +12 +21<br />
Schweden Sweden 58,5 103,8 141,8 14,3 19,6 33,2 72,8 123,4 175,0 1,6 1,8 +70 +42<br />
Finnland Finland 24,1 36,9 32,9 4,3 5,4 6,1 28,4 42,3 39,1 0,5 0,4 +49 –8<br />
Österreich Austria 148,7 200,7 264,2 54,8 62,1 76,4 203,5 262,8 340,6 3,3 3,6 +29 +30<br />
Malta Malta 0,4 0,8 1,3 0,1 0,1 0,1 0,4 0,9 1,4 0,0 0,0 +122 +54<br />
Estland Estonia 1,6 6,0 8,1 0,6 0,8 0,7 2,2 6,7 8,8 0,1 0,1 +207 +31<br />
Lettland Latvia 3,2 6,8 6,8 0,3 0,7 0,8 3,6 7,4 7,6 0,1 0,1 +106 +2<br />
Litauen Lithuania 3,1 6,0 5,0 0,5 0,6 0,7 3,6 6,6 5,7 0,1 0,1 +83 –14<br />
Polen Poland 145,9 178,6 214,4 28,2 32,2 38,3 174,1 210,8 252,7 2,7 2,6 +21 +20<br />
Tschechische Republik Czech Republic 108,1 152,7 272,4 32,9 48,7 67,9 141,0 201,4 340,3 2,5 3,6 +43 +69<br />
Slowakei Slovakia 50,5 75,9 76,3 16,7 24,5 24,4 67,3 100,4 100,7 1,3 1,1 +49 +0<br />
Ungarn Hungary 60,6 74,9 177,8 18,5 21,2 23,1 79,1 96,1 200,8 1,2 2,1 +22 +109<br />
Rumänien Romania 37,7 65,4 134,8 10,6 10,5 13,9 48,3 75,9 148,8 1,0 1,6 +57 +96<br />
Bulgarien Bulgaria 8,0 6,7 10,6 1,2 1,5 1,7 9,2 8,2 12,3 0,1 0,1 –11 +50<br />
Slowenien Slovenia 23,9 21,6 29,7 5,5 4,9 5,1 29,4 26,5 34,8 0,3 0,4 –10 +31<br />
Zypern Cyprus 3,5 4,6 4,4 0,1 0,2 0,2 3,6 4,8 4,6 0,1 0,0 +34 –5<br />
EU-27 EU 27 1 420,0 1 877,8 2 511,8 393,7 448,9 589,4 1 813,7 2 326,7 3 101,2 29,3 32,5 +28 +33<br />
Norwegen Norway 11,8 18,4 18,1 3,1 5,0 5,8 14,9 23,3 23,8 0,3 0,2 +57 +2<br />
Liechtenstein Liechtenstein 5,0 5,2 6,4 1,1 1,8 1,4 6,1 7,0 7,8 0,1 0,1 +15 +12<br />
Schweiz Switzerland 156,2 216,2 185,0 110,8 143,7 143,0 267,0 359,9 328,0 4,5 3,4 +35 –9<br />
Türkei Turkey 129,3 168,2 181,6 20,9 22,0 22,4 150,2 190,2 204,0 2,4 2,1 +27 +7<br />
Albanien Albania 0,1 0,4 0,1 0,0 0,0 0,0 0,1 0,4 0,1 0,0 0,0 +408 -83<br />
Ukraine Ukraine 32,1 33,4 62,0 3,0 4,5 4,1 35,1 37,8 66,2 0,5 0,7 +8 +75<br />
Weißrussland White Russia 59,6 34,3 44,4 4,1 1,7 2,0 63,6 36,0 46,4 0,5 0,5 –43 +29<br />
Moldau Moldavia 0,3 0,2 0,7 0,0 0,0 0,1 0,3 0,2 0,8 0,0 0,0 –20 +225<br />
Russland Russia 298,2 327,2 428,3 41,9 48,7 50,8 340,1 375,9 479,1 4,7 5,0 +11 +27<br />
Kroatien Croatia 10,4 11,4 15,1 1,5 1,9 1,8 11,8 13,2 16,9 0,2 0,2 +12 +28<br />
Bosnien-Herzegowina Bosnia-Herzegovina 4,6 8,8 7,3 0,5 1,1 0,5 5,0 10,0 7,7 0,1 0,1 +98 –22<br />
Serbien-Montenegro Serbia Montenegro 3,4 7,7 10,7 1,5 0,5 1,1 5,0 8,2 11,9 0,1 0,1 +65 +45<br />
Mazedonien Macedonia 1,1 0,7 0,9 0,1 0,1 0,2 1,2 0,9 1,0 0,0 0,0 –26 +23<br />
Sonstige Others 1,1 0,6 2,2 0,1 0,1 0,2 1,2 0,8 2,4 0,0 0,0 –38 +216<br />
Sonstiges Europa Other Europe 713,0 832,7 962,5 188,5 231,1 233,4 901,5 1 063,8 1 196,0 13,4 12,5 +18 +12<br />
Europa Europe 2 133,0 2 710,5 3 474,4 582,2 680,0 822,9 2 715,3 3 390,5 4 297,2 42,7 45,0 +25 +27<br />
Marokko Morocco 1,1 5,2 5,7 0,8 1,0 1,3 1,9 6,2 7,0 0,1 0,1 +228 +13<br />
Algerien Algeria 9,1 5,7 1,1 0,5 0,4 0,4 9,5 6,1 1,6 0,1 0,0 –36 –74<br />
Tunesien Tunisia 3,7 5,3 1,5 0,4 0,9 1,0 4,1 6,2 2,5 0,1 0,0 +51 –59<br />
Ägypten Egypt 15,0 11,7 8,5 1,2 1,1 1,9 16,2 12,8 10,4 0,2 0,1 –21 –19<br />
Nigeria Nigeria 1,0 1,1 1,8 0,2 0,4 0,2 1,2 1,5 2,0 0,0 0,0 +25 +35<br />
Rep. Südafrika Rep. of South Africa 22,4 41,2 25,2 4,7 7,8 6,5 27,2 49,0 31,6 0,6 0,3 +80 –35<br />
Sonstige Others 7,9 4,0 7,1 1,1 1,2 1,5 9,0 5,2 8,6 0,1 0,1 –42 +65<br />
Afrika Africa 60,2 74,3 51,0 8,9 12,8 12,8 69,1 87,1 63,8 1,1 0,7 +26 –27
Anhang<br />
Appendix<br />
71<br />
Maschinen (Mio. EUR) Teile, Zubehör (Mio. EUR) Gesamt (Mio. EUR) Gesamt (%-Ant.) Gesamt (%-VR)<br />
Machines (mill. EUR) Parts, accessories (mill. EUR) Total (mill. EUR) Total (%-share) Total (%-change)<br />
2010 2011 <strong>2012</strong> 2010 2011 <strong>2012</strong> 2010 2011 <strong>2012</strong> 2011 <strong>2012</strong> 2011 <strong>2012</strong><br />
USA USA 318,5 602,3 837,9 118,4 121,0 188,3 436,9 723,4 1 026,2 9,1 10,7 +66 +42<br />
Kanada Canada 29,3 60,6 76,8 6,5 7,6 11,8 35,8 68,2 88,7 0,9 0,9 +90 +30<br />
Nord-Amerika North America 347,8 662,9 914,8 124,9 128,6 200,1 472,7 791,6 1 114,9 10,0 11,7 +67 +41<br />
Mexiko Mexico 75,0 114,4 174,3 18,9 21,5 26,2 93,8 135,9 200,5 1,7 2,1 +45 +48<br />
Sonstige Others 3,0 3,1 4,2 0,4 0,4 0,5 3,4 3,5 4,8 0,0 0,0 +2 +37<br />
Mittel-Amerika Middle America 78,0 117,5 178,5 19,3 21,9 26,7 97,3 139,4 205,3 1,8 2,1 +43 +47<br />
Kolumbien Columbia 4,6 4,5 7,0 0,2 0,4 0,8 4,8 4,9 7,8 0,1 0,1 +2 +58<br />
Venezuela Venezuela 6,4 3,2 4,2 2,3 0,3 0,8 8,7 3,5 5,0 0,0 0,1 –60 +43<br />
Peru Peru 2,9 2,8 7,2 0,7 1,4 0,9 3,6 4,2 8,1 0,1 0,1 +16 +94<br />
Brasilien Brazil 118,4 142,6 149,6 25,9 39,8 43,8 144,3 182,4 193,4 2,3 2,0 +26 +6<br />
Chile Chile 2,1 6,2 8,4 0,8 1,1 0,8 2,9 7,3 9,2 0,1 0,1 +153 +26<br />
Argentinien Argentina 8,3 41,1 20,3 1,6 1,3 1,6 10,0 42,4 21,9 0,5 0,2 +326 –48<br />
Sonstige Others 5,3 2,3 5,4 0,6 0,5 0,3 5,8 2,8 5,7 0,0 0,1 –52 +104<br />
Süd-Amerika South America 148,1 202,7 201,9 32,0 44,7 49,1 180,1 247,4 251,0 3,1 2,6 +37 +1<br />
Amerika America 573,9 983,1 1 295,2 176,1 195,2 276,0 750,0 1 178,3 1 571,2 14,8 16,4 +57 +33<br />
Iran Iran 31,9 20,8 18,7 4,8 3,8 1,4 36,7 24,6 20,2 0,3 0,2 –33 –18<br />
Israel Israel 16,0 21,9 23,1 3,8 2,3 2,8 19,8 24,2 25,9 0,3 0,3 +22 +7<br />
Saudi-Arabien Saudi Arabia 28,4 43,4 46,1 4,0 3,4 4,4 32,4 46,8 50,4 0,6 0,5 +44 +8<br />
VA Emirate United Arab Emirates 17,0 26,4 24,2 1,7 1,8 3,4 18,7 28,2 27,7 0,4 0,3 +51 –2<br />
Sonstige Others 20,3 38,0 19,1 1,6 1,7 3,0 21,8 39,7 22,1 0,5 0,2 +82 –44<br />
Naher/Mittlerer Osten Near/Middle East 113,6 150,5 131,2 15,8 13,0 15,1 129,4 163,5 146,3 2,1 1,5 +26 –11<br />
Kasachstan Kazakhstan 3,3 7,0 6,5 0,5 0,5 0,6 3,7 7,4 7,0 0,1 0,1 +100 –5<br />
Usbekistan Usbekistan 13,2 5,0 1,7 0,0 0,2 0,4 13,2 5,2 2,1 0,1 0,0 –61 –59<br />
Indien India 193,7 232,8 218,0 23,3 29,8 29,0 216,9 262,6 247,0 3,3 2,6 +21 –6<br />
Sonstige Others 6,5 4,5 3,7 0,4 0,5 0,4 6,9 5,1 4,1 0,1 0,0 –27 –20<br />
Zentral-/Süd-Asien Central/South Asia 216,6 249,3 229,9 24,2 31,0 30,4 240,8 280,3 260,2 3,5 2,7 +16 –7<br />
Thailand Thailand 17,6 30,9 34,2 2,0 2,6 5,0 19,6 33,5 39,2 0,4 0,4 +71 +17<br />
Vietnam Vietnam 15,5 16,6 21,4 0,4 2,5 3,4 15,9 19,1 24,8 0,2 0,3 +20 +30<br />
Indonesien Indonesia 7,5 10,2 21,3 0,7 1,3 1,1 8,2 11,5 22,4 0,1 0,2 +41 +95<br />
Malaysia Malaysia 13,4 30,1 34,8 1,7 2,4 8,3 15,1 32,5 43,1 0,4 0,5 +115 +32<br />
Singapur Singapore 23,4 33,6 28,5 2,8 3,5 4,5 26,2 37,1 33,1 0,5 0,3 +42 –11<br />
Philippinen Philippines 3,2 2,6 5,2 0,7 0,6 0,6 3,9 3,3 5,9 0,0 0,1 –17 +80<br />
China China 1 566,2 2 141,8 2 449,4 149,9 161,0 163,7 1 716,1 2 302,8 2 613,1 29,0 27,3 +34 +13<br />
Südkorea South Korea 166,2 185,0 170,7 16,8 20,1 22,2 183,0 205,1 192,9 2,6 2,0 +12 –6<br />
Japan Japan 78,2 97,4 115,4 16,2 17,5 27,2 94,4 114,8 142,6 1,4 1,5 +22 +24<br />
Taiwan Taiwan 54,7 51,0 40,9 7,6 5,9 8,8 62,3 56,9 49,6 0,7 0,5 –9 –13<br />
Hongkong Hong Kong 10,4 6,8 10,8 2,0 2,0 2,5 12,4 8,8 13,3 0,1 0,1 –29 +52<br />
Sonstige Others 1,5 2,8 1,5 0,1 0,1 0,1 1,6 3,0 1,6 0,0 0,0 +89 –45<br />
Ost-/Südost-Asien East/Southeast Asia 1 957,7 2 608,7 2 934,1 201,0 219,7 247,4 2 158,7 2 828,4 3 181,6 35,6 33,3 +31 +12<br />
Asien Asia 2 288,0 3 008,5 3 295,2 240,9 263,6 292,9 2 528,9 3 272,2 3 588,1 41,2 37,6 +29 +10<br />
Australischer Bund Australia 17,8 15,4 27,2 3,5 3,3 4,5 21,3 18,7 31,7 0,2 0,3 –12 +70<br />
Neuseeland New Zealand 2,1 1,7 2,8 0,4 0,2 0,4 2,5 1,8 3,1 0,0 0,0 –27 +72<br />
Sonstige Others 0,0 0,0 0,0 0,0 0,0 0,0 0,0 0,0 0,1 0,0 0,0 –65 +800<br />
Australien/Ozeanien Australia/Oceania 19,9 17,0 30,0 3,9 3,5 4,9 23,8 20,5 34,9 0,3 0,4 –14 +70<br />
Sonstige Länder Other countries 0,0 0,0 0,0 0,0 0,0 0,0 0,0 0,0 0,0 0,0 0,0<br />
EU-27 EU 27 1 420,0 1 877,8 2 511,8 393,7 448,9 589,4 1 813,7 2 326,7 3 101,2 29,3 32,5 +28 +33<br />
Nicht-EU-Länder Non EU countries 3 655,1 4 915,7 5 634,0 618,3 706,2 820,0 4 273,4 5 621,9 6 453,9 70,7 67,5 +32 +15<br />
NAFTA NAFTA 422,8 777,3 1 089,1 143,7 150,1 226,3 566,6 927,4 1 315,4 11,7 13,8 +64 +42<br />
MERCOSUR MERCOSUR 135,4 187,3 174,5 30,2 41,4 46,4 165,7 228,7 220,9 2,9 2,3 +38 –3<br />
ASEAN ASEAN 80,9 126,2 145,6 8,4 13,0 22,9 89,3 139,2 168,5 1,8 1,8 +56 +21<br />
Hinweise: Warennummern des Außenhandels: Maschinen = 8456 – 8463<br />
(ohne 845691, 845699 30/50), 847940,Teile/Zubehör = 846693, 846694;<br />
%-Ant. = Prozentanteil, %-VR = prozentuale Veränderung zum Vorjahr<br />
Quellen: Statistisches Bundesamt, <strong>VDW</strong>, VDMA<br />
Note: foreign trade tariff codes: machines = 8456 – 8463<br />
(excl. 845691, 845699 30/50), 847940, parts / accessories = 846693, 846694;<br />
%-Change = percental change to previous year<br />
Sources: German Statistical Office, <strong>VDW</strong>, VDMA
72<br />
Welt–<strong>Werkzeugmaschinen</strong>–Statistik (Mio. EUR, ohne Teile/Zubehör)<br />
World machine tool statistics (mill. EUR, excluding parts/accessories)<br />
Produktion<br />
%-Veränderung<br />
Production<br />
%-Change<br />
Export<br />
Exports<br />
%-Veränderung<br />
%-Change<br />
2008 2009 2010 2011 <strong>2012</strong> <strong>2012</strong>/11* 2008 2009 2010 2011 <strong>2012</strong> <strong>2012</strong>/11*<br />
Deutschland Germany 10 715 7 767 7 178 9 613 10 600 +10 +10 € 7 013 5 212 5 075 6 793 8 146 +20 +20€<br />
Frankreich France 872 403 503 615 627 +2 +2 € 574 386 390 490 532 +9 +9 €<br />
Belgien Belgium 341 265 225 257 231 –10 –10 € 923 488 484 625 712 +14 +14 €<br />
Niederlande Netherlands 350 266 279 293 313 +7 +7 € 372 250 300 392 384 –2 –2 €<br />
Italien Italy 5 352 3 770 3 789 4 250 4 410 +4 +4 € 3 206 2 399 2 462 3 070 3 438 +12 +12 €<br />
Verein. Königreich United Kingdom 478 314 393 525 506 –4 –10 £ 641 405 472 538 615 +14 +7 £<br />
Irland Ireland – – – – – – – 20 15 12 11 11 +5 +5 €<br />
Dänemark Denmark 163 52 54 67 73 +10 +10 € 102 64 67 81 90 +12 +12 €<br />
Griechenland Greece – – – – – – – 14 13 11 16 22 +32 +32 €<br />
Portugal Portugal 56 45 34 36 38 +5 +5 € 33 34 33 37 46 +26 +26 €<br />
Spanien Spain 1 057 745 632 772 825 +7 +7 € 722 538 484 695 765 +10 +10 €<br />
Schweden Sweden 196 174 157 188 198 +5 +1 skr 163 139 122 154 165 +7 +3 skr<br />
Finnland Finland 205 110 102 141 144 +2 +2 € 151 96 83 119 116 –2 –2 €<br />
Österreich Austria 839 645 637 698 803 +15 +15 € 700 491 582 617 690 +12 +12 €<br />
Schweiz Switzerland 2 738 1 556 1 790 2 595 2 493 –4 –6 sfr 2 272 1 317 1 555 2 215 2 218 +0 –2 sfr<br />
Norwegen Norway – – – – – – – 14 15 12 11 18 +57 +51 nkr<br />
Slowenien² Slowenia² 69 35 32 40 42 +5 +5 € 38 35 34 49 68 +38 +38 €<br />
Kroatien Croatia 53 45 30 35 37 +5 +6 K 25 22 3 15 15 +5 +6 K<br />
Serbien Serbia – – – – – – – 18 14 7 13 16 +27 –<br />
Türkei Turkey 442 317 419 474 505 +7 +5 TL 342 210 240 278 330 +18 +17 TL<br />
Polen² Poland² 201 143 125 163 179 +10 +12 Zl 145 144 103 138 155 +12 +14 Zl<br />
Tschech. Rep. Czech Rep. 619 403 371 463 566 +22 +25 Kc ˇ 599 428 415 525 552 +5 +7 Kcˇ<br />
Slowakei² Slovakia² 85 45 25 40 42 +5 +5 € 98 53 61 92 115 +26 +26 €<br />
Ungarn² Hungary² 61 26 44 50 50 +0 +4 Ft 17 12 15 16 12 –23 –20 Ft<br />
Rumänien Romania 30 26 22 33 35 +5 +10 l 73 50 46 67 57 –15 –11 l<br />
Bulgarien² Bulgaria² 51 27 30 37 41 +10 +10 Lw 48 22 25 33 38 +16 +16 Lw<br />
Ukraine Ukraine – – – – – – – 54 49 32 27 – – –<br />
Russland Russia 287 145 165 189 246 +30 +20 US–$ 76 46 44 42 81 +95 +80 US–$<br />
USA USA 3 522 2 462 2 518 3 360 3 879 +15 +7 US–$ 1 287 886 1 176 1 352 1 625 +20 +11 US–$<br />
Kanada Canada 439 311 412 459 539 +17 +10 kan$ 190 127 139 141 155 +10 +3 kan$<br />
Mexiko Mexico 112 95 125 88 106 +20 +17 mex$ 28 26 31 25 91 +268 +260 mex$<br />
Brasilien Brazil 876 512 632 640 501 –22 –16 R$ 108 88 50 83 132 +59 +71 R$<br />
Argentinien Argentina 25 19 22 23 28 +22 +12 US–$ 10 15 8 7 10 +32 +22 US–$<br />
Iran¹ Iran¹ – – – – – – – – – – – – – –<br />
Israel Israel – – – – – – – 37 25 31 39 – – –<br />
Saudi-Arabien¹ Saudi Arabia¹ – – – – – – – – – – – – – –<br />
VA Emirate¹ U.A.Emirates¹ – – – – – – – – – – – – – –<br />
Indien India 463 305 580 634 562 –11 –6 iR 110 104 98 90 76 –15 –10 iR<br />
China³ China³ 6 256 7 467 11 014 13 912 14 683 +6 –5 RMB.¥ 927 688 934 1 190 1 460 +23 +11 RMB.¥<br />
Südkorea South Korea 2 973 1 977 3 393 4 134 4 440 +7 +1 Won 1 298 869 1 266 1 650 1 983 +20 +13 Won<br />
Japan Japan 10 876 5 331 9 044 13 164 14 210 +8 –0 ¥ 5 780 3 028 5 679 8 305 9 004 +8 +0 ¥<br />
Taiwan Taiwan 3 269 1 628 2 932 3 694 4 226 +14 +6 NT$ 2 479 1 221 2 218 2 845 3 284 +15 +7 NT$<br />
Thailand Thailand – – – – – – – 153 67 181 263 269 +2 –4 B<br />
Vietnam¹ Viet Nam¹ – – – – – – – – – – – – – –<br />
Philippinen¹ Philippines¹ – – – – – – – – – – – – – –<br />
Malaysia Malaysia – – – – – – – 97 38 98 132 178 +35 +26 RM<br />
Indonesien Indonesia – – – – – – – 13 12 72 26 – – –<br />
Singapur Singapore – – – – – – – 185 206 320 413 – – –<br />
Hongkong Hong Kong – – – – – – – 24 12 19 32 – – –<br />
Australien Australia 111 111 86 108 125 +16 +7 $A 70 56 57 64 68 +7 –2 $A<br />
Südafrika South Africa – – – – – – – 17 14 16 29 24 –18 –14 R<br />
Welt–Produktion (Mrd. EUR)<br />
World production (bill. EUR)<br />
54,2 37,5 47,8 61,8 66,3 +7<br />
Europa Europe 25,3 17,3 17,0 21,6 23,0 +7<br />
Amerika America 5,0 3,4 3,7 4,6 5,1 +11<br />
Asien Asia 23,9 16,8 27,0 35,6 38,2 +7<br />
Welt–Produktion (Mrd. US–$)<br />
World production (bill. US–$)<br />
79,7 52,4 63,4 86,0 85,2 –1<br />
Quellen: Nationale statistische Ämter, Nationale <strong>Werkzeugmaschinen</strong>hersteller–<br />
Verbände, Metalworking Insiders’ Report (Gardner Publications), CECIMO (Dach–<br />
verband der europäischen <strong>Werkzeugmaschinen</strong>hersteller–Verbände), VDMA, <strong>VDW</strong><br />
Sources: National Statistical Offices, National Machine Tool Builders’ Associations,<br />
Metalworking Insiders’ Report (Gardner Publications), CECIMO (European<br />
Committee of the National Machine Tool Builders’ Associations), VDMA, <strong>VDW</strong>
Anhang<br />
Appendix<br />
73<br />
Import<br />
Imports<br />
%-Veränderung<br />
%-Change<br />
Verbrauch<br />
Consumption<br />
%-Veränderung<br />
%-Change<br />
2008 2009 2010 2011 <strong>2012</strong> <strong>2012</strong>/11* 2008 2009 2010 2011 <strong>2012</strong> <strong>2012</strong>/11*<br />
Deutschland Germany 2 964 1 615 1 442 2 141 2 418 +13 +13 € 6 666 4 170 3 546 4 960 4 873 –2 –2 €<br />
Frankreich France 998 591 526 817 736 –10 –10 € 1 296 608 639 941 832 –12 –12 €<br />
Belgien Belgium 878 455 446 581 633 +9 +9 € 296 232 187 213 152 –29 –29 €<br />
Niederlande Netherlands 383 208 257 388 357 –8 –8 € 361 224 236 289 285 –1 –1 €<br />
Italien Italy 1 470 642 691 806 717 –11 –11 € 3 616 2 013 2 018 1 986 1 689 –15 –15 €<br />
Verein. Königreich United Kingdom 660 374 421 544 740 +36 +36 £ 496 283 342 532 631 +19 +11 £<br />
Irland Ireland 49 18 28 33 29 –14 –14 € – – – – – – –<br />
Dänemark Denmark 157 76 54 69 114 +65 +65 € 218 64 41 55 97 +76 +76 €<br />
Griechenland Greece 110 63 40 17 16 –6 –6 € – – – – – – –<br />
Portugal Portugal 95 70 70 84 122 +45 +45 € 118 80 71 84 114 +36 +36 €<br />
Spanien Spain 444 207 210 234 248 +6 +6 € 778 414 358 311 308 –1 –1 €<br />
Schweden Sweden 356 271 165 232 285 +22 +22 skr 389 306 200 267 317 +19 +15 skr<br />
Finnland Finland 210 104 65 88 90 +2 +2 € 263 118 84 111 118 +6 +6 €<br />
Österreich Austria 526 332 305 389 399 +3 +3 € 665 487 360 470 512 +9 +9 €<br />
Schweiz Switzerland 605 415 389 538 478 –11 –11 sfr 1 072 654 623 917 752 –18 –20 sfr<br />
Norwegen Norway 175 92 60 85 102 +21 +21 nkr – – – – – – –<br />
Slowenien² Slowenia² 138 70 74 95 89 –6 –6 € 170 70 71 86 64 –26 –26 €<br />
Kroatien Croatia 58 48 36 36 43 +20 +20 K 85 70 63 56 64 +15 +16 K<br />
Serbien Serbia 54 18 21 35 27 –23 – – – – – – – –<br />
Türkei Turkey 704 356 520 791 932 +18 +18 TL 804 464 700 987 1 108 +12 +11 TL<br />
Polen² Poland² 555 343 292 366 421 +15 +15 Zl 611 342 314 391 445 +14 +16 Zl<br />
Tschech. Rep. Czech Rep. 490 211 210 359 345 –4 –4 Kc ˇ<br />
510 186 165 297 359 +21 +24 Kcˇ<br />
Slowakei² Slovakia² 201 114 106 193 155 –20 –20 € 189 106 70 141 82 –42 –42 €<br />
Ungarn² Hungary² 182 100 100 120 163 +35 +35 Ft 226 114 129 155 200 +30 +34 Ft<br />
Rumänien Romania 265 179 131 267 308 +15 +15 l 222 155 108 234 286 +22 +28 l<br />
Bulgarien² Bulgaria² 85 46 36 46 59 +28 +28 Lw 88 50 41 50 62 +22 +22 Lw<br />
Ukraine Ukraine 223 81 83 177 – – – – – – – – – –<br />
Russland Russia 1 178 769 844 1 105 1 446 +31 +31 US–$ 1 390 868 965 1 252 1 610 +29 +19 US–$<br />
USA USA 3 314 1 622 1 911 3 251 4 535 +39 +39 US–$ 5 549 3 198 3 253 5 260 6 789 +29 +19 US–$<br />
Kanada Canada 605 388 459 687 790 +15 +15 kan$ 854 572 732 1 005 1 174 +17 +9 kan$<br />
Mexiko Mexico 969 657 706 967 1 384 +43 +43 mex$ 1 053 726 800 1 031 1 399 +36 +33 mex$<br />
Brasilien Brazil 844 643 714 1 006 870 –14 –14 R$ 1 612 1 067 1 296 1 563 1 239 –21 –15 R$<br />
Argentinien Argentina 170 101 97 136 186 +37 +37 US–$ 185 105 110 152 205 +35 +24 US–$<br />
Iran¹ Iran¹ 106 117 213 124 – – – – – – – – – –<br />
Israel Israel 154 67 81 122 – – – – – – – – – –<br />
Saudi-Arabien¹ Saudi Arabia¹ 163 130 125 171 – – – – – – – – – –<br />
VA Emirate¹ U.A.Emirates¹ 192 149 132 143 – – – – – – – – – –<br />
Indien India 1 305 859 1 157 1 556 1 572 +1 +1 iR 1 658 1 060 1 639 2 100 2 057 –2 +4 iR<br />
China³ China³ 5 127 4 215 7 127 9 501 10 630 +12 +12 RMB.¥ 10 456 10 994 17 207 22 224 23 853 +7 –3 RMB.¥<br />
Südkorea South Korea 907 812 1 089 1 287 1 160 –10 –10 Won 2 581 1 920 3 216 3 771 3 617 –4 –10 Won<br />
Japan Japan 504 322 329 469 603 +29 +29 ¥ 5 600 2 625 3 694 5 328 5 810 +9 +1 ¥<br />
Taiwan Taiwan 515 231 524 584 497 –15 –15 NT$ 1 305 639 1 237 1 432 1 440 +1 –7 NT$<br />
Thailand Thailand 783 518 947 1 253 2 383 +90 +90 B – – – – – – –<br />
Vietnam¹ Viet Nam¹ 260 202 279 329 – – – – – – – – – –<br />
Philippinen¹ Philippines¹ 96 77 130 107 – – – – – – – – – –<br />
Malaysia Malaysia 454 297 565 510 687 +35 +35 RM – – – – – – –<br />
Indonesien Indonesia 364 238 356 556 – – – – – – – – – –<br />
Singapur Singapore 304 203 277 287 – – – – – – – – – –<br />
Hongkong Hong Kong 336 178 379 400 – – – – – – – – – –<br />
Australien Australia 264 226 227 277 318 +15 +15 $A 305 281 256 321 375 +17 +7 $A<br />
Südafrika South Africa 200 168 181 192 213 +11 +11 R – – – – – – –<br />
Hinweis: <strong>2012</strong> = geschätzt; Verbrauch = Produktion – Export + Import<br />
* Erste Zahl = Veränderungsrate auf Basis Euro / Zweite Zahl = Veränderungsrate<br />
auf Basis nationaler bzw. gemeldeter Währung<br />
1 Importe: <strong>VDW</strong>–Berechnungen anhand der Exporte wichtiger Länder<br />
2 Produktion: grobe <strong>VDW</strong>–Schätzung<br />
3 Produktion und Export: <strong>VDW</strong>–Bereinigung (vgl. methodische Erläuterungen,<br />
z. B. <strong>2012</strong> um 32 % => Verbrauch <strong>2012</strong> um 20 %), Unbereinigte Chinadaten <strong>2012</strong><br />
(Mio. EUR): Produktion = 21 435 (+6 %), Export = 2 132 (+23 %), Verbrauch = 29 933<br />
(+7 %), Wechselkurse und methodische Hinweise siehe nächste Seite<br />
Note: <strong>2012</strong> = est<strong>im</strong>ated; consumption = production – exports + <strong>im</strong>ports<br />
* First number = change rate based on euro / second number = change<br />
rate based on national resp. reported currency<br />
1 Imports: <strong>VDW</strong> calculations based on the exports of major countries<br />
2 Production: rough <strong>VDW</strong> est<strong>im</strong>ate<br />
3 Production and exports: <strong>VDW</strong> correction (see methodical comments;<br />
e.g. <strong>2012</strong> by 32% => consumption <strong>2012</strong> by 20%), Uncorrected Chinese data <strong>2012</strong> (mill. EUR):<br />
production = 21 435 (+6%), exports = 2 132 (+23%), consumption = 29 933 (+7%)<br />
Exchange rates and methodical comments see next page
74<br />
<strong>Jahr</strong>esdurchschnittskurse des Euro<br />
Annual average rates of the Euro<br />
%-Veränderung<br />
%-Change<br />
1 € = ... 2008 2009 2010 2011 <strong>2012</strong> 2011/10 <strong>2012</strong>/11<br />
Verein. Königreich United Kingdom £ 0,796 0,891 0,858 0,868 0,811 +1,2 –6,6<br />
Dänemark Denmark dkr 7,46 7,45 7,45 7,45 7,44 +0,0 –0,1<br />
Schweden Sweden skr 9,62 10,62 9,54 9,03 8,70 –5,3 –3,6<br />
Schweiz Switzerland sfr 1,59 1,51 1,38 1,23 1,20 –10,7 –2,4<br />
Tschechische Republik Czech Republic Kc ˇ<br />
24,9 26,4 25,3 24,6 25,1 –2,7 +2,3<br />
Polen Poland Zl 3,51 4,33 3,99 4,12 4,18 +3,2 +1,6<br />
Ungarn Hungary Ft 252 280 275 279 289 +1,4 +3,5<br />
Türkei Turkey YTL 1,91 2,16 2,00 2,34 2,31 +17,1 –1,0<br />
Russland Russia Rbl 36,4 44,1 40,3 40,9 39,9 +1,5 –2,3<br />
USA USA US-$ 1,47 1,39 1,33 1,39 1,28 +5,0 –7,7<br />
Kanada Canada kan$ 1,56 1,59 1,37 1,38 1,28 +0,8 -6,7<br />
Mexiko Mexico mex$ 16,3 18,8 16,7 17,3 16,9 +3,3 –2,2<br />
Brasilien Brazil R$ 2,67 2,77 2,33 2,33 2,51 –0,2 +7,8<br />
Indien India iR 64,1 67,4 60,6 64,9 68,6 +7,1 +5,7<br />
China China RMB.¥ 10,22 9,53 8,97 9,00 8,11 +0,3 –9,9<br />
Südkorea South Korea Won 1 606 1 773 1 532 1 541 1 448 +0,6 –6,1<br />
Japan Japan ¥ 152 130 116 111 102 –4,5 –7,6<br />
Taiwan Taiwan NT$ 46,4 46,0 41,7 41,0 38,0 –1,7 –7,3<br />
Australien Australia $A 1,74 1,77 1,44 1,35 1,24 –6,5 –8,0<br />
Quelle: Deutsche Bundesbank<br />
Source: Deutsche Bundesbank<br />
Methodische Hinweise zur Weltstatistik<br />
Remarks on the methodology for world statistics<br />
– Zur Erstellung der Weltstatistik nutzt der <strong>VDW</strong> unterschiedlichste<br />
Informations- und Datenquellen. <strong>Die</strong> Ziele<br />
dabei sind eine möglichst konsistente Einbindung<br />
der Weltdaten in das gesamte statistische Berichtswesen<br />
des Verbandes und der Aufbau plausibler Zeitreihen.<br />
Datenquellen sind amtliche Statistiken, nationale<br />
<strong>Werkzeugmaschinen</strong>verbände, das europäische Statistik -<br />
amt Eurostat, Datenbanken der UNO und wo notwendig<br />
auch <strong>VDW</strong>-Abschätzungen. Endgültige Daten liegen bis<br />
2011, teilweise auch schon für <strong>2012</strong> vor. Basis der vorläufigen<br />
Daten für das <strong>Jahr</strong> <strong>2012</strong> ist unter anderem auch<br />
die jährliche Umfrage des US-Fachmagazins „Metalworking<br />
Insiders’ Report“ (Gardner Publications). Hier melden<br />
die internationalen Verbände vorläufige Daten für<br />
das gerade abgelaufene <strong>Jahr</strong> und revidierte Daten für<br />
das Vorjahr. In vielen Fällen weicht der <strong>VDW</strong> aber auch<br />
von den Ergebnissen der Umfrage ab, soweit aus anderen<br />
Quellen plausiblere Daten bzw. Abschätzungen vorliegen.<br />
– Zentrale Datenbasis ist das ausführliche internationale<br />
Berichtswesen des <strong>VDW</strong>, das detailliertes Zahlenmaterial<br />
bis auf Maschinenebene enthält. Wesentliche Grundlage<br />
hierfür sind die Export- und Importdaten von über 40<br />
Ländern, die mit hohem Detaillierungsgrad in der Statis-<br />
– The <strong>VDW</strong> uses an extremely wide range of information<br />
and data sources to generate its worldwide statistics.<br />
The a<strong>im</strong> here is to integrate such global data into the<br />
association’s overall statistical reporting system as consistently<br />
as possible while establishing plausible sequences<br />
of t<strong>im</strong>e periods. Data sources include officially<br />
published statistics, national machine tool associations,<br />
Eurostat (the European statistics office), UNO databases<br />
and, where necessary, also <strong>VDW</strong> est<strong>im</strong>ates. Definitive<br />
data can be found up to 2011 – and in some cases for<br />
<strong>2012</strong> already as well. Among other things, one basis for<br />
the provisional data for <strong>2012</strong> is the annual survey of the<br />
US specialist publication “Metalworking Insiders’ Report”<br />
(Gardner Publications). It reports the international<br />
associations’ provisional data for the year just completed<br />
along with adjusted data for the previous year. In many<br />
cases, however, the <strong>VDW</strong> also diverges from the results<br />
of the survey where more plausible data or est<strong>im</strong>ates<br />
are available from other sources.<br />
– The central database is the <strong>VDW</strong>’s comprehensive international<br />
reporting system which contains detailed figures<br />
right down to the machine level. These data are essentially<br />
based on the export and <strong>im</strong>port data maintained in the
Anhang<br />
Appendix<br />
75<br />
tik-Datenbank des VDMA (Verband Deutscher Maschinen-<br />
und Anlagenbau) eingepflegt sind und exklusiv für<br />
Mitgliedsfirmen zur Verfügung stehen. Ursprungsquelle<br />
sind die offiziellen amtlichen Außenhandelsdaten der<br />
einzelnen Länder. Der <strong>VDW</strong> nutzt pr<strong>im</strong>är diese eigene<br />
Datenbasis. <strong>Die</strong> Vorteile liegen u. a. in der Nutzung einer<br />
durchgängigen Quelle, einer einheitlichen Abgrenzung<br />
des <strong>Werkzeugmaschinen</strong>sektors sowie der Bildung einer<br />
konsistenten Zeitreihe. In zwei Fällen, USA und Japan,<br />
haben wir uns allerdings entschieden, den Angaben der<br />
Verbände zu folgen, die eine erhebliche Bereinigung ihrer<br />
Außenhandelsdaten vornehmen, um aus ihrer Sicht<br />
zu sinnvolleren Verbrauchsdaten zu kommen (vgl. Anmerkungen<br />
zu diesen Ländern).<br />
– Obwohl die nationalen Verbände i. d. R. auch auf amtliches<br />
Zahlenmaterial bei der Meldung der Export-/Importdaten<br />
zurückgreifen, gibt es bezogen auf die Gesamtsumme<br />
<strong>Werkzeugmaschinen</strong> teilweise Abweichungen zu den<br />
<strong>VDW</strong>-Daten. Dafür kann es unterschiedliche Gründe geben,<br />
z. B. eine etwas andere Abgrenzung des <strong>Werkzeugmaschinen</strong>sektors<br />
(Einbezug von Teile/Zubehör oder<br />
Maschinen für die Halbleiterbearbeitung) oder ein unterschiedlicher<br />
Datenstand (z. B. Berücksichtigung von<br />
Revisionen).<br />
statistical database of the VDMA (Verband Deutscher<br />
Maschinen- und Anlagenbau, or German Engineering<br />
Federation). Access to those highly detailed data, which<br />
cover more than 40 countries, is available exclusively to<br />
member companies. The original sources of the data are<br />
the officially published export data for the individual<br />
countries. The <strong>VDW</strong> relies pr<strong>im</strong>arily on this in-house<br />
database. The advantages lie inter alia in the usage of a<br />
consistent source, the standardised demarcation of the<br />
machine tool sector, and the mapping of consistent sets<br />
of t<strong>im</strong>e periods. In two cases, however – USA and Japan –<br />
we have decided to use the data provided by the associations<br />
which adjust their foreign trade figures considerably<br />
in order to generate what they consider to be more<br />
mean ingful consumption data (cf. remarks concerning<br />
these countries).<br />
– Although national associations also generally rely on official<br />
figures when reporting <strong>im</strong>port / export data, some<br />
of their data relating to machine tool totals may differ<br />
from the <strong>VDW</strong> data. There can be various reasons for this:<br />
somewhat different demarcations of the machine tool<br />
sector (inclusion of parts / accessories or semiconductor<br />
processing equipment), for example, or different revision<br />
levels (e.g. taking adjustments / corrections into account).<br />
– <strong>Die</strong> Produktionsdaten stammen weiterhin in den meisten<br />
Fällen direkt von dem jeweiligen nationalen Verband. Im<br />
Gegensatz zu den international einheitlich systematisierten<br />
Außenhandelsdaten stehen hier nur wenige alternative<br />
Quellen mit entsprechender Aussagekraft zur<br />
Verfügung. <strong>Die</strong> Verbände nutzen ihrerseits überwiegend<br />
die amtlichen Daten ihres Landes. Es ist aber auch denkbar,<br />
dass in manchen Ländern Verbände eigene Erhebungen<br />
oder Abschätzungen einbeziehen, wenn kein<br />
entsprechendes offizielles Zahlenmaterial vorliegt.<br />
– In most cases, production data continue to originate<br />
directly from the relevant national associations. Unlike<br />
foreign trade data, production data do not follow an<br />
internationally standardised system and the number of<br />
available sources of suitably meaningful information is<br />
l<strong>im</strong>ited. For their part, the national associations largely<br />
use the official data for their respective countries, whereby<br />
some may include their own surveys or est<strong>im</strong>ates in<br />
cases where no corresponding official figures are<br />
availab le.<br />
– Soweit möglich sind alle Angaben exklusive Teile/Zubehör,<br />
beziehen sich also auf komplette <strong>Werkzeugmaschinen</strong>!<br />
In manchen Fällen sind allerdings Zweifel angebracht,<br />
ob die Produktionsdaten nicht auch Teile, Komponenten<br />
oder gar Werkzeuge etc. enthalten. Dazu gehören<br />
beispielsweise die Niederlande und Brasilien.<br />
– Wherever possible, all figures exclude parts / accessories,<br />
i.e. they refer to complete machine tools. In some cases,<br />
however, there is reason to suspect that production figures<br />
might also include parts, components, or even<br />
tools, etc. Examples of this include the Netherlands and<br />
Brazil.<br />
– <strong>Die</strong> Abgrenzung des Bereichs <strong>Werkzeugmaschinen</strong> orientiert<br />
sich international am sogenannten HS, dem<br />
„Harmonisierten System für Außenhandelsstatistiken“.<br />
Dem Bereich <strong>Werkzeugmaschinen</strong> (für die Metallbearbeitung)<br />
entsprechen die Warencodes 8456 bis 8463<br />
(ohne Teile/Zubehör).<br />
– The demarcation of the machine tool sector is geared<br />
internationally to the so-called HS, the “Harmonised<br />
System for International Trade Statistics”. Product codes<br />
8456 through to 8463 (excluding parts / accessories)<br />
correspond to the machine tool sector (for metalworking).
76<br />
– <strong>Die</strong> Auswahl der aufgeführten Länder orientiert sich daran,<br />
möglichst die weltweite <strong>Werkzeugmaschinen</strong>produktion<br />
abzudecken. <strong>Die</strong>s ist auch in hohem Ausmaß erreicht.<br />
Der <strong>VDW</strong> weist auch Produktionszahlen für die<br />
Länder Polen, Slowakei, Ungarn, Bulgarien und Slowenien<br />
aus. <strong>Die</strong> Volumina verstehen sich als sehr grobe <strong>VDW</strong>-<br />
Abschätzungen. Basis dafür sind Daten vom europäischen<br />
Statistikamt Eurostat, die aber teilweise älter<br />
und auch nicht vollständig sind.<br />
– Während sich die Herstellung von <strong>Werkzeugmaschinen</strong><br />
auf eine überschaubare Länderzahl konzentriert, ist der<br />
Einsatz, also der Verbrauch, natürlich weltweit auf viele<br />
Länder verteilt. Dennoch steht der aufgeführte Länderkreis<br />
auch für den überwiegenden Teil des weltweiten<br />
<strong>Werkzeugmaschinen</strong>verbrauchs. <strong>Die</strong> Größe „Verbrauch“<br />
wird rein rechnerisch ermittelt mit der Formel „Produktion<br />
– Export + Import“. Teilweise ist dies problematisch,<br />
da Produktionsdaten auf der einen und Export-/Importdaten<br />
auf der anderen Seite aus verschiedenen Statistiksystemen<br />
stammen. In den Außenhandelsdaten sind<br />
auch Gebrauchtmaschinen oder teilweise Re-Exporte/<br />
-Importe enthalten bzw. manche Länder sind in ihrer<br />
Funktion als Handelsdrehscheibe bis zu einem gewissen<br />
Grad nur Durchgangsländer für <strong>Werkzeugmaschinen</strong><br />
(z. B. Belgien, Niederlande, Singapur, Hongkong).<br />
– The list of countries a<strong>im</strong>s to cover the worldwide production<br />
of machine tools as far as possible. To a large<br />
extent, this goal has also been achieved. The <strong>VDW</strong> also<br />
lists production figures for Poland, Slovakia, Hungary,<br />
Bulgaria and Slovenia. These volumes are to be con -<br />
strued as rough <strong>VDW</strong> est<strong>im</strong>ates, and are based on data<br />
from the European statistics office, Eurostat. Some of<br />
those data are old, however, and they are also incomplete.<br />
– Whereas machine tool manufacture is concentrated in a<br />
l<strong>im</strong>ited number of countries, the use – in other words,<br />
the consumption – of those machine tools is of course<br />
distributed among many countries around the world.<br />
Nevertheless, the group of countries listed also represents<br />
the largest share of world machine tool consumption.<br />
The “consumption” quantity is calculated on a purely<br />
mathematical basis using the formula “production minus<br />
exports plus <strong>im</strong>ports”. In some cases this gives rise to<br />
problems, as production data and export / <strong>im</strong>port data<br />
are derived from different statistical systems. The international<br />
trade figures also include used machines and<br />
some re-exports and re-<strong>im</strong>ports, whereby certain countries<br />
essentially function as a trade hub and in some<br />
respects serve as little more than a transit country for<br />
machine tools (e.g. Belgium, the Netherlands, Singapore,<br />
Hong Kong).<br />
– Im Falle einiger Länder, für die keine Produktionszahlen<br />
verfügbar sind, wurden wenigstens die entsprechenden<br />
Export- und Importdaten ausgewiesen. Nicht in allen<br />
Fällen liegen aber die Original-Außenhandelsdaten vor<br />
(in der Welttabelle mit der Zahl „1“ gekennzeichnet).<br />
Hier wurden die Importe (als Indiz für die Aufnahmefähigkeit<br />
des Marktes) vom <strong>VDW</strong> anhand der Exporte von<br />
mehr als 40 Berichtsländern in das betreffende Land<br />
berechnet.<br />
– In the case of certain countries for which production<br />
figures are unavailable, at least the relevant export and<br />
<strong>im</strong>port data have been reported. The original foreign<br />
trade figures are not always available in every case, however<br />
(indicated with “number 1” in the world table).<br />
In this case, the <strong>VDW</strong> used the export figures provided<br />
by more than 40 reporting countries to calculate the<br />
<strong>im</strong>ports by the country in question (as an indication of<br />
the market’s consumption capacity).<br />
– <strong>Die</strong> Berechnung der Weltsumme erfolgte nur für die Produktion,<br />
da auf Weltebene die Produktion gleich dem<br />
Verbrauch sein sollte. Als Referenzgröße für das Weltvolumen<br />
ist die Produktion statistisch besser geeignet<br />
als der „künstlich“ errechnete „Verbrauch“.<br />
– The world total is calculated for production only because,<br />
at a global level, production should equal consumption.<br />
Production figures are better suited as reference values<br />
for world volume than the “artificially” calculated<br />
“consumption”.<br />
– Umrechnungen erfolgten mit den jeweiligen <strong>Jahr</strong>esdurchschnittskursen<br />
zum Euro (vgl. Wechselkurstabelle).<br />
– Figures have been converted to euros using the relevant<br />
exchange rates averaged over the year (cf. table of exchange<br />
rates).
Anhang<br />
Appendix<br />
77<br />
Anmerkungen zu einzelnen Ländern<br />
Remarks on specific countries<br />
Niederlande: In den niederländischen Produktionszahlen<br />
sind vermutlich Teile/Zubehör enthalten.<br />
The Netherlands: The production figures for the Netherlands<br />
probably include parts / accessories.<br />
USA: In den USA wurde vom Statistikamt der sogenannte<br />
„Current Industrial Report“ zur Erfassung der Produktion<br />
eingestellt. Der US-Verband AMT musste daher ab dem Berichtsjahr<br />
2011 auf eine neue amtliche Quelle, den „Annual<br />
Survey of Manufacturers“ umsteigen. Dadurch haben sich<br />
die Produktionsdaten auch rückwirkend teils erheblich geändert.<br />
USA: In the USA, the census bureau has terminated the<br />
so-called “Current Industrial Report” programme which<br />
was designed to record production data. As a result, the US<br />
association AMT had to switch to a new official source, the<br />
“Annual Survey of Manufacturers”, starting from the report -<br />
ing year 2011. This caused considerable changes in some of<br />
the production data, also retroactively.<br />
Kanada: <strong>Die</strong> Produktionsdaten Kanadas sind ebenfalls oft<br />
Diskussionsgegenstand, da es keine detaillierte nachprüfbare<br />
Quelle gibt. Auf Anregung des <strong>VDW</strong> hatte der US-Verband<br />
AMT vor einiger Zeit intensivere Recherchen für Kanada<br />
durchgeführt. <strong>Die</strong> abgeschätzten Daten basieren auf der<br />
Identifizierung kanadischer <strong>Werkzeugmaschinen</strong>firmen<br />
und ihrer Umsätze, die zu einer Branchenproduktion<br />
aggregiert wurden. <strong>Die</strong>s ist somit zum jetzigen Zeitpunkt<br />
die beste verfügbare Quelle. <strong>Die</strong> Zeitreihe ist entsprechend<br />
angepasst.<br />
Mexiko: <strong>Die</strong> grob geschätzten Produktionsdaten entstammen<br />
dem World Survey des „Metalworking Insiders Report“.<br />
Brasilien: Der brasilianische Verband ABIMAQ meldet die<br />
Produktionsdaten inklusive Teile/Zubehör.<br />
Indien: Für Indien meldete der zuständige Verband IMTMA<br />
früher Daten basierend auf Erhebungen <strong>im</strong> Mitgliederkreis.<br />
Seit dem Berichtsjahr 2011 bezieht der Verband über<br />
Schätzungen auch die Produktion von Firmen ein, die sich<br />
nicht an diesen Erhebungen beteiligen. Der Produktionswert<br />
erhöhte sich dadurch beträchtlich um ca. 70 %, z. B. für<br />
2010 von 344 auf 580 Mio. EUR. Der <strong>VDW</strong> hat seine Zeitreihen<br />
entsprechend angepasst.<br />
China: <strong>Die</strong> Aussagekraft der chinesischen Produktionsdaten<br />
ist <strong>im</strong>mer wieder stark diskutiert und das Volumen als unrealistisch<br />
hoch kritisiert worden. Detaillierte Recherchen<br />
des <strong>VDW</strong> haben ergeben, dass in 2011 54,3 % des Produktionswertes<br />
NC-gesteuerte Maschinen sind, die aber auch<br />
teilweise äußerst einfache Technologie beinhalten. Der<br />
konventionelle Bereich besteht zu einem überwiegenden<br />
Teil aus Maschinen einfachster Machart, zum Teil auch für<br />
den nicht<strong>industrie</strong>llen Einsatz. Auch ist fraglich, ob es sich<br />
bei den gemeldeten Daten durchgängig um <strong>Werkzeugmaschinen</strong><br />
<strong>im</strong> eigentlichen Sinne handelt (Verunreinigung<br />
Canada: Canadian production data are also a frequent subject<br />
of discussion, as there are no detailed, verifiable sources.<br />
At the suggestion of the <strong>VDW</strong>, the US association AMT carried<br />
out extensive research for Canada some t<strong>im</strong>e ago. The<br />
est<strong>im</strong>ates were based on the identification of Canadian<br />
machine tool companies and their turnovers, which were<br />
then aggregated into a production figure for the sector.<br />
That makes this the best available source at the moment.<br />
The t<strong>im</strong>e periods have been adjusted accordingly.<br />
Mexico: The rough production est<strong>im</strong>ates are drawn from<br />
the world survey of the Metalworking Insiders’ Report.<br />
Brazil: The Brazilian association ABIMAQ reports production<br />
figures that include parts / accessories.<br />
India: For India, the responsible association IMTMA used to<br />
report data based on surveys of its members. Since the reporting<br />
year 2011, the association also includes est<strong>im</strong>ated<br />
production figures from companies which do not participate<br />
in those surveys. This has raised the production value considerably:<br />
by about 70%, e.g. for 2010 from EUR 344 million<br />
to EUR 580 million. The <strong>VDW</strong> has adjusted its t<strong>im</strong>e periods<br />
accordingly.<br />
China: The validity of Chinese production data is a perennially<br />
controversial topic and the volume has been severely<br />
criticised as unrealistic. Detailed <strong>VDW</strong> research has revealed<br />
that while machine tools using numerical control represent<br />
54.3% of the production value in 2011, some of those machines<br />
also employ extremely s<strong>im</strong>ple technology. The conventional<br />
segment largely comprises the s<strong>im</strong>plest of machinery,<br />
including equipment intended for non-industrial<br />
applications as well. It is also doubtful whether the figures<br />
reported consistently pertain to machine tools in the strict<br />
sense of the term (contamination by manually operated<br />
drills, etc.). The <strong>VDW</strong>’s research relative to conventional
78<br />
durch handgeführte Bohrmaschinen etc.). Basis der <strong>VDW</strong>-<br />
Recherchen bezüglich konventioneller Maschinen ist das<br />
vom chinesischen Verband CMTBA veröffentlichte „China<br />
Machine Tool & Tool Industry Yearbook“. Darin sind ca. 80 %<br />
des vom CMTBA veröffentlichten spanenden Produktionsvolumens<br />
abgedeckt, wobei hier sicherlich firmenbezogen<br />
von einer „Positivauswahl“ zu sprechen ist. Nach dieser Erhebung<br />
(Datenstand 2010) haben spanende NC-Maschinen<br />
einen Durchschnittswert von 28 Tsd. EUR, konventionelle<br />
von 6 Tsd. EUR. Vom erfassten konventionellen (also nicht<br />
NC-gesteuerten) Produktionsvolumen entfallen 42 % auf<br />
Drehmaschinen mit einem Durchschnittswert von 9 Tsd.<br />
EUR, 10 % auf Schleifmaschinen (11 Tsd. EUR), 9 % auf<br />
Bohrmaschinen (3 Tsd. EUR) und 8 % auf Fräsmaschinen<br />
(4 Tsd. EUR.) <strong>Die</strong> Umformtechnik ist in dem Handbuch zu ca.<br />
50 % abgedeckt. Konventionelle Umformmaschinen stehen<br />
für einen Durchschnittswert von 9 Tsd. EUR. Mechanische<br />
Pressen mit einem Durchschnittswert von 7 Tsd. EUR haben<br />
alleine einen Anteil von 74 %. Bezogen auf alle <strong>Werkzeugmaschinen</strong><br />
lässt sich sagen, dass es sich bei zwei Dritteln<br />
der konventionellen Technik um Maschinen mit einem<br />
Wert unter 10 Tsd. EUR handelt.<br />
Insgesamt verzerren die chinesischen Daten einen sinnvollen<br />
Ländervergleich <strong>im</strong> Weltmaßstab. Der <strong>VDW</strong> hat sich daher<br />
entschlossen, die Produktionsdaten auf Basis der Recherchen<br />
zu bereinigen. Einbezogen wird die komplette NC-<br />
Technologie sowie ein Drittel des konventionellen Bereichs,<br />
der ansonsten stark von Billigstmaschinen beeinflusst ist.<br />
Der Weiterentwicklung der technologischen Wettbewerbsfähigkeit<br />
wird durch Einbezug der steigenden NC-Durchdringung<br />
Rechnung getragen. So ist der NC-Anteil von<br />
2007 bis 2011 von 45,0 % auf 54,3 % angestiegen. <strong>Die</strong><br />
<strong>VDW</strong>-Methode führt in <strong>2012</strong> zu einer Bereinigung des<br />
Original-Produktionswertes um 32 % von 21,4 auf 14,7<br />
Mrd. EUR. Mit gleichem Prozentsatz wird auch der Exportwert<br />
gekürzt, die Importdaten bleiben hingegen unverändert.<br />
Rechnerisch ergibt sich damit eine Reduzierung des<br />
chinesischen Marktvolumens um 20 % von 29,9 auf 23,9<br />
Mrd. EUR. Der <strong>VDW</strong> wird seine Recherchen auch in der Zukunft<br />
fortführen, um den Grad der notwendigen Bereinigung<br />
laufend zu überprüfen.<br />
Im Sinne der Gleichbehandlung hat der <strong>VDW</strong> auch die Produktionsdaten<br />
anderer wichtiger Herstellerländer mit der<br />
gleichen Methodik überprüft. Das klare Ergebnis: <strong>Die</strong> notwendige<br />
Bereinigung läge je nach Land bei 0 bis max<strong>im</strong>al<br />
5 % (übrigens sogar auch für den Produzent Indien). Also eine<br />
zu vernachlässigende Größenordnung. <strong>Die</strong>s belegt, dass<br />
die chinesischen Produktionsdaten in nennenswertem Um-<br />
machinery is based on the “China Machine Tool & Tool<br />
Industry Yearbook” published by the Chinese association<br />
CMTBA. It covers approx<strong>im</strong>ately 80% of the production<br />
volume for cutting machines reported by the CMTBA,<br />
which undoubtedly reflects a form of “positive discr<strong>im</strong>ination”<br />
towards specific companies. According to that survey<br />
(with data updated through 2010), the average metal-cutting<br />
NC machine is valued at EUR 28,000 and the average<br />
conventional machine is valued at EUR 6,000. Of the conventional<br />
(i.e. non-NC) machines reported, 42% of the production<br />
volume corresponds to lathes with an average value<br />
of EUR 9,000, 10% are grinding machines (EUR 11,000), 9%<br />
are drill presses (EUR 3,000) and 8% are milling machines<br />
(EUR 4,000). The yearbook covers about 50% of forming<br />
technology. Conventional forming technology averages<br />
EUR 9,000 per machine. Mechanical presses averaging EUR<br />
7,000 per machine represent a 74% share of the total on<br />
their own. Taking together all machine tools as a whole, it<br />
is est<strong>im</strong>ated that two thirds of the conventional technology<br />
involves machines valued at less than EUR 10,000.<br />
Overall, the Chinese data distort any useful comparison<br />
among countries on a worldwide scale. For this reason, the<br />
<strong>VDW</strong> decided to adjust the production data based on the<br />
research. It considers all NC technology plus one third of<br />
the conventional area, which is otherwise heavily influenced<br />
by the least expensive “cheap and s<strong>im</strong>ple” machines. The<br />
further development of technological competitiveness is<br />
taken into account by considering the increasing penetration<br />
of NC. In the period from 2007 to 2011, for example, the<br />
share of NC grew from 45.0% to 54.3%. In <strong>2012</strong>, the <strong>VDW</strong><br />
methodology has adjusted the original production value<br />
downward by 32% from EUR 21.4 billion to EUR 14.7 billion.<br />
The export value was also reduced by the same percent -<br />
age, while <strong>im</strong>port data remained unchanged. This results in<br />
a 20% reduction in the Chinese market volume – from EUR<br />
29.9 billion to EUR 23.9 billion. The <strong>VDW</strong> will also carry on<br />
its research in the future, in order to continuously monitor<br />
the required degree of adjustment.<br />
In the interest of equal treatment, the <strong>VDW</strong> also used the<br />
same methodology to study the production data of other<br />
major manufacturing countries. The clear result showed<br />
that the required adjustments for various countries ranged<br />
from 0% to a max<strong>im</strong>um of 5% (and by the way, that even<br />
included India), which is to say, a negligible amount. This<br />
confirms that a considerable portion of the Chinese production<br />
data represents technology in a form that cannot<br />
be compared on a global scale. China’s size itself would<br />
cause the unfiltered data to distort global forecasts. But
Anhang<br />
Appendix<br />
79<br />
fang eine <strong>im</strong> Weltmaßstab nicht vergleichbare Technologie<br />
abbilden. Und allein aufgrund der Größe Chinas hätten die<br />
unbereinigten Daten einen verzerrenden Einfluss auf die<br />
Weltaussagen. Einen – geradezu naheliegenden – Zweifelsfall<br />
gibt es jedoch noch. Auch die Daten Taiwans scheinen<br />
durch Billigmaschinen stark beeinflusst. Allerdings sind die<br />
zur Verfügung stehenden taiwanesischen Produktionsdaten<br />
nicht detailliert genug und lassen keine gesicherten<br />
Aufschlüsse zu. Im spanenden Bereich liegt der NC-Anteil<br />
bei knapp 77 %, also deutlich höher als in China. <strong>Die</strong> wenigen<br />
verfügbaren Daten aus der Umformtechnik werfen jedoch<br />
Fragen auf. Hier ergeben sich be<strong>im</strong> Vergleich der<br />
Stückzahlen und Wertangaben sehr geringe Durchschnittswerte.<br />
Allerdings lässt sich aus den groben Daten nicht ableiten,<br />
wie viel sinnvollerweise anrechenbare Technologie<br />
(<strong>im</strong> Sinne der Verwendbarkeit <strong>im</strong> <strong>industrie</strong>llen Einsatz) mit<br />
welchem Wertanteil enthalten sein könnte. Der <strong>VDW</strong> hat<br />
daher auf eine Bereinigung bei Taiwan verzichtet, auch weil<br />
die Größenordnung <strong>im</strong> Weltmaßstab bei weitem nicht den<br />
Einfluss hätte wie <strong>im</strong> Falle Chinas.<br />
Japan, spanende <strong>Werkzeugmaschinen</strong>: Der japanische Verband<br />
für spanende <strong>Werkzeugmaschinen</strong> JMTBA veröffentlicht<br />
in seinen Publikationen in der Regel Produktionsdaten<br />
des METI (Ministry of Economy, Trade and Industry), die allerdings<br />
nur Firmen mit mehr als 50 Beschäftigten einbeziehen.<br />
<strong>Die</strong> in die Weltstatistik gemeldeten Daten beinhalten<br />
auch eine Schätzung für kleinere Firmen. Das Produktionsvolumen<br />
wird dadurch um ca. 11 % erhöht (z. B. 2010: Produktion<br />
spanend, Firmen > 50 Beschäftigte: 7,18 Mrd. EUR,<br />
inkl. kleinerer Firmen: 7,97 Mrd. EUR).<br />
Japan, umformende Maschinen: Der japanische Verband<br />
für Umformtechnik JFMA folgt nun der Methodik, die der<br />
Verband für spanende Technologie JMTBA schon länger<br />
nutzt. <strong>Die</strong> bisherigen Produktionsdaten bezogen nur Firmen<br />
ab 50 Beschäftigten ein. Der JFMA schätzt jetzt einen<br />
Anteil für kleinere Firmen hinzu (z. B. 2010: Produktion umformend,<br />
Firmen > 50 Beschäftigte: 0,96 Mrd. EUR, inkl.<br />
kleinerer Firmen: 1,07 Mrd. EUR). <strong>Die</strong> Zeitreihe ist entsprechend<br />
angepasst.<br />
Südkorea: Viele Veröffentlichungen des südkoreanischen<br />
Verbandes KOMMA beziehen sich auf die Produktion der<br />
Mitgliedsfirmen. In die Weltstatistik meldet der Verband<br />
Werte für die Gesamtbranche auf Basis amtlicher Statistiken.<br />
there is yet another cause for doubt – practically next door.<br />
The data from Taiwan also appear to be heavily influenced<br />
by “cheap and s<strong>im</strong>ple” machines. As the available Taiwanese<br />
production data do not offer sufficient detail, however,<br />
they cannot be used to draw any unequivocal conclusions.<br />
In cutting machinery, the share of NC is nearly 77% of the<br />
total, i.e. considerably higher than in China. The l<strong>im</strong>ited data<br />
available from metal-forming technology raise questions,<br />
however. Comparing quantities and value data here generates<br />
very low average values. However, these rough data<br />
do not indicate how much technology could reasonably be<br />
grouped together (in the sense of applicability in industrial<br />
operations) under which share of value. For this reason, the<br />
<strong>VDW</strong> chose not to adjust the Taiwanese figures – and also<br />
because data of this magnitude would have nowhere near<br />
as much effect as they would in the case of China.<br />
Japan – cutting machine tools: In its publications, the Japanese<br />
Machine Tool Builders’ Association (JMTBA) generally<br />
reports production data from the METI (Ministry of Economy,<br />
Trade and Industry). These data exclude companies<br />
with less than 50 employees, however. The data reported<br />
in the world statistics also contain an est<strong>im</strong>ate for smaller<br />
firms. This raises the production volume by some 11% (e.g.<br />
2010: cutting machine production companies > 50 employees:<br />
EUR 7.18 billion; including smaller companies:<br />
EUR 7.97 billion).<br />
Japan – forming machines: The Japanese Forming Machinery<br />
Association (JFMA) is now using the same methodology<br />
which the Japanese Machine Tool Builders’ Association<br />
(JMTBA) has been using for quite some t<strong>im</strong>e already. The<br />
previous production data only included companies with<br />
50 employees or more. The JFMA now also includes an est<strong>im</strong>ated<br />
share for smaller companies (e.g. 2010: forming<br />
machine production companies > 50 employees: EUR 0.96<br />
billion; including smaller companies: EUR 1.07 billion). The<br />
periods have been adjusted accordingly.<br />
South Korea: Many of the publications of figures from the<br />
South Korean association KOMMA refer to the production of<br />
its member companies. In world statistics, the association reports<br />
values for the entire sector based on official statistics.
© Copyright 2013<br />
Herausgeber/Editor<br />
Verein Deutscher <strong>Werkzeugmaschinen</strong>fabriken e. V. (<strong>VDW</strong>)<br />
German Machine Tool Builders’ Association<br />
Corneliusstraße 4, 60325 Frankfurt am Main<br />
Deutschland/Germany<br />
Telefon: +49 (0)69 756081-0<br />
Telefax: +49 (0)69 756081-11<br />
E-Mail: vdw@vdw.de<br />
Internet: www.vdw.de<br />
Redaktion/Editorial<br />
Bereich Wirtschaft und Statistik<br />
Economy and Statistics Division<br />
Ansprechpartner/In charge<br />
Dipl.-Volkswirt Gerhard Hein<br />
Telefon: +49 (0)69 756081-43<br />
E-Mail: g.hein@vdw.de<br />
Dipl.-Volkswirt Bernhard Geis<br />
Telefon: +49 (0)69 756081-42<br />
E-Mail: b.geis@vdw.de<br />
Dipl.-Volkswirt Niklas Kuczaty<br />
Telefon: +49 (0)69 756081-48<br />
E-Mail: n.kuczaty@vdw.de<br />
Gestaltung/Design<br />
Neufrankfurt GmbH<br />
Frankfurt am Main<br />
www.neufrankfurt.de<br />
Druck/Printing<br />
H. Reuffurth Gmbh<br />
Mühlhe<strong>im</strong> am Main<br />
www.reuffurth.net<br />
Bildnachweis/List of illustrations<br />
Titelseite/Cover page: GROB-WERKE GmbH & Co. KG, Mindelhe<strong>im</strong><br />
Seite/Page 3: Maschinenfabrik Berthold Hermle AG, Goshe<strong>im</strong><br />
Seite/Page 7: MAG Europe GmbH, Göppingen<br />
Seite/Page 17: Liebherr-Verzahntechnik GmbH, Kempten<br />
Seite/Page 31: GILDEMEISTER Aktiengesellschaft, Bielefeld<br />
Seite/Page 45: EMAG Salach Maschinenfabrik GmbH, Salach<br />
Seite/Page 59: SHW <strong>Werkzeugmaschinen</strong> GmbH, Aalen-Wasseralfingen<br />
Seite/Page 65: Körber Schleifring AG, Bern
<strong>VDW</strong>-Mitgliedsfirmen/<strong>VDW</strong> member companies<br />
ALFING KESSLER, Aalen<br />
ALZMETALL, Altenmarkt/Alz<br />
BAUST, Langenfeld<br />
BECKHOFF, Verl<br />
BENZINGER, Pforzhe<strong>im</strong>-Büchenbronn<br />
BIHLER, Halblech<br />
BLOHM JUNG, Göppingen<br />
BLOHM JUNG, Hamburg<br />
BOSCH REXROTH, Lohr am Main<br />
CHIRON, Tuttlingen<br />
CITIZEN, Esslingen<br />
DECKEL MAHO, Pfronten<br />
DECKEL, MICHAEL, Weilhe<strong>im</strong><br />
DESCH, Arnsberg<br />
DISKUS, <strong>Die</strong>tzenbach<br />
DITTEL, Landsberg<br />
DÖRRIES SCHARMANN, Mönchengladbach<br />
EIMA, Frickenhausen<br />
ELHA, Hövelhof<br />
EMAG LEIPZIG, Leipzig<br />
EMAG SALACH, Neu-Isenburg<br />
EMAG SALACH, Salach<br />
EMCO MAGDEBURG, Magdeburg<br />
FISCHER, KARL EUGEN, Burgkunstadt<br />
FORST, Solingen<br />
FORTE, Winterbach<br />
FRÖMAG, Fröndenberg<br />
G.D.W., Herzogenaurach<br />
GEHRING, Ostfildern<br />
GEIBEL & HOTZ, Homberg/Ohm<br />
GILDEMEISTER, Bielefeld<br />
GLEASON-HURTH, München<br />
GLEASON-PFAUTER, Ludwigsburg<br />
GÖCKEL, Darmstadt<br />
GROB, Mindelhe<strong>im</strong><br />
HAMUEL, Meeder<br />
HECKERT, Chemnitz<br />
HEIDENHAIN, Traunreut<br />
HELLER, Nürtingen<br />
HELMERDING, Bad Oeynhausen<br />
HERMLE, Goshe<strong>im</strong><br />
INDEX, Esslingen<br />
INNSE BERARDI, Albershausen<br />
KAPP, Coburg<br />
KEHREN, Hennef<br />
KESEL, Kempten<br />
KESSLER, Bad Buchau<br />
KLINGELNBERG, Hückeswagen<br />
KOEPFER, Furtwangen<br />
KÖRBER SCHLEIFRING, Hamburg<br />
KUGLER, Salem<br />
LASCO, Coburg<br />
LEISTRITZ, Nürnberg<br />
LICON, Lauphe<strong>im</strong><br />
LIEBHERR, Kempten<br />
MAG Europe, Göppingen<br />
MAG IAS, Eislingen<br />
MAG IAS, Göppingen<br />
MAG IAS, Mosbach<br />
MAG IAS, Taunusstein<br />
MAG MODUL, Chemnitz<br />
MAIER, Wehingen<br />
MAKINO, Hamburg<br />
MANNESMANN, A., Remscheid<br />
MATEC, Köngen<br />
MAUSER, Oberndorf<br />
MIKRON, Rottweil<br />
MIKSCH, Göppingen<br />
MONFORTS, Mönchengladbach<br />
NEFF, Karlsruhe<br />
NILES, Berlin<br />
NILES-SIMMONS, Chemnitz<br />
NOMOCO, Sundern<br />
OPEN MIND, Wessling<br />
OVERBECK, Herborn<br />
PEISELER, Remscheid<br />
POWER AUTOMATION, Pleidelshe<strong>im</strong><br />
PROFILATOR, Wuppertal<br />
PROFIROLL, Bad Düben<br />
RATTUNDE, Ludwigslust<br />
RAUSCH, Haan<br />
RENISHAW, Pliezhausen<br />
RÖDERS, Soltau<br />
SAMAG, Saalfeld<br />
SCHAUDT MIKROSA, Leipzig<br />
SCHIESS, Aschersleben<br />
SCHLEGEL & VOLK, Frankfurt am Main<br />
SCHNEEBERGER, Höfen/Enz<br />
SCHULER PRESSEN, Göppingen<br />
SCHULER PRESSEN, Weingarten<br />
SCHULER SMG, Waghäusel<br />
SCHÜTTE, ALFRED H., Köln<br />
SCHÜTTE SCHLEIFTECHNIK, Köln<br />
SCHÜTTE SERVICECENTER, Köln<br />
SCHWÄBISCHE WERKZEUGMASCHINEN, Schramberg-Waldmössingen<br />
SEIDLER, Neuss-Holzhe<strong>im</strong><br />
SHW WERKZEUGMASCHINEN, Aalen-Wasseralfingen<br />
SIEMENS, Erlangen<br />
SKF, Schweinfurt<br />
SMS MEER, Mönchengladbach<br />
TRAUB, Reichenbach<br />
TRUMPF, Ditzingen<br />
TRUMPF VERTRIEB+SERVICE, Ditzingen<br />
UNITECH, Chemnitz<br />
VOLLMER, Biberach/Riß<br />
WALDRICH COBURG, Coburg<br />
WALTER, Tübingen<br />
WEILER, Emskirchen<br />
WEISSER, St. Georgen<br />
WEMA VOGTLAND, Plauen<br />
WOLTERS, Rendsburg<br />
ZF FRIEDRICHSHAFEN, Friedrichshafen<br />
ZIERSCH, Ilmenau<br />
ZIMMER & KREIM, Brensbach<br />
Stand: März 2013
Verein Deutscher <strong>Werkzeugmaschinen</strong>fabriken e. V. (<strong>VDW</strong>)<br />
German Machine Tool Builders’ Association<br />
www.vdw.de