Mikrozensus im Land Brandenburg 2011 - Amt für Statistik Berlin ...
Mikrozensus im Land Brandenburg 2011 - Amt für Statistik Berlin ...
Mikrozensus im Land Brandenburg 2011 - Amt für Statistik Berlin ...

Erfolgreiche ePaper selbst erstellen
Machen Sie aus Ihren PDF Publikationen ein blätterbares Flipbook mit unserer einzigartigen Google optimierten e-Paper Software.
– 54 –<br />
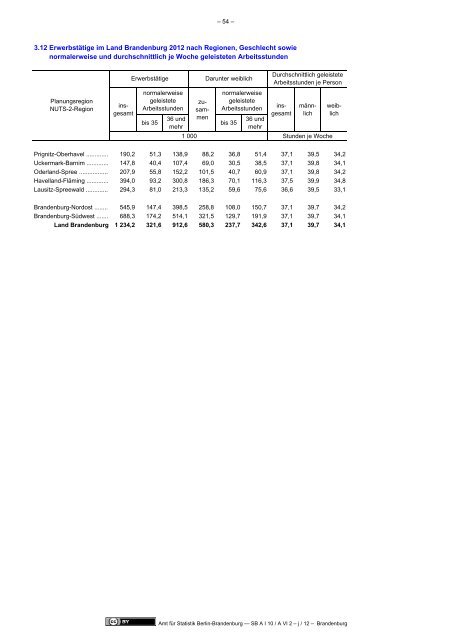
3.12 Erwerbstätige <strong>im</strong> <strong>Land</strong> <strong>Brandenburg</strong> 2012 nach Regionen, Geschlecht sowie<br />
normalerweise und durchschnittlich je Woche geleisteten Arbeitsstunden<br />
Planungsregion<br />
NUTS-2-Region<br />
Erwerbstätige<br />
normalerweise<br />
geleistete<br />
Arbeitsstunden<br />
36 und<br />
bis 35<br />
mehr<br />
weiblich<br />
zusammen<br />
Darunter weiblich<br />
normalerweise<br />
geleistete<br />
Arbeitsstunden<br />
36 und<br />
bis 35<br />
mehr<br />
Durchschnittlich geleistete<br />
Arbeitsstunden je Person<br />
1 000 Stunden je Woche<br />
insgesamt<br />
insgesamt<br />
männlich<br />
Prignitz-Oberhavel ............. 190,2 51,3 138,9 88,2 36,8 51,4 37,1 39,5 34,2<br />
Uckermark-Barn<strong>im</strong> ............. 147,8 40,4 107,4 69,0 30,5 38,5 37,1 39,8 34,1<br />
Oderland-Spree ................. 207,9 55,8 152,2 101,5 40,7 60,9 37,1 39,8 34,2<br />
Havelland-Fläming ............. 394,0 93,2 300,8 186,3 70,1 116,3 37,5 39,9 34,8<br />
Lausitz-Spreewald ............. 294,3 81,0 213,3 135,2 59,6 75,6 36,6 39,5 33,1<br />
<strong>Brandenburg</strong>-Nordost ........ 545,9 147,4 398,5 258,8 108,0 150,7 37,1 39,7 34,2<br />
<strong>Brandenburg</strong>-Südwest ....... 688,3 174,2 514,1 321,5 129,7 191,9 37,1 39,7 34,1<br />
<strong>Land</strong> <strong>Brandenburg</strong> 1 234,2 321,6 912,6 580,3 237,7 342,6 37,1 39,7 34,1<br />
<strong>Amt</strong> <strong>für</strong> <strong>Statistik</strong> <strong>Berlin</strong>-<strong>Brandenburg</strong> — SB A I 10 / A VI 2 – j / 12 – <strong>Brandenburg</strong>