Mikrozensus im Land Brandenburg 2011 - Amt für Statistik Berlin ...
Mikrozensus im Land Brandenburg 2011 - Amt für Statistik Berlin ...
Mikrozensus im Land Brandenburg 2011 - Amt für Statistik Berlin ...

Erfolgreiche ePaper selbst erstellen
Machen Sie aus Ihren PDF Publikationen ein blätterbares Flipbook mit unserer einzigartigen Google optimierten e-Paper Software.
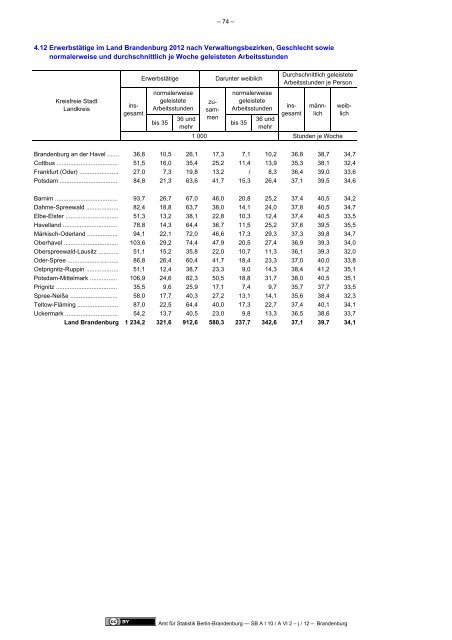
– 74 –<br />
4.12 Erwerbstätige <strong>im</strong> <strong>Land</strong> <strong>Brandenburg</strong> 2012 nach Verwaltungsbezirken, Geschlecht sowie<br />
normalerweise und durchschnittlich je Woche geleisteten Arbeitsstunden<br />
Kreisfreie Stadt<br />
<strong>Land</strong>kreis<br />
Erwerbstätige<br />
normalerweise<br />
geleistete<br />
Arbeitsstunden<br />
36 und<br />
bis 35<br />
mehr<br />
weiblich<br />
zusammen<br />
Darunter weiblich<br />
normalerweise<br />
geleistete<br />
Arbeitsstunden<br />
36 und<br />
bis 35<br />
mehr<br />
Durchschnittlich geleistete<br />
Arbeitsstunden je Person<br />
1 000 Stunden je Woche<br />
insgesamt<br />
insgesamt<br />
männlich<br />
<strong>Brandenburg</strong> an der Havel ....... 36,6 10,5 26,1 17,3 7,1 10,2 36,8 38,7 34,7<br />
Cottbus .................................... 51,5 16,0 35,4 25,2 11,4 13,9 35,3 38,1 32,4<br />
Frankfurt (Oder) ....................... 27,0 7,3 19,8 13,2 / 8,3 36,4 39,0 33,6<br />
Potsdam .................................. 84,8 21,3 63,6 41,7 15,3 26,4 37,1 39,5 34,6<br />
Barn<strong>im</strong> ..................................... 93,7 26,7 67,0 46,0 20,8 25,2 37,4 40,5 34,2<br />
Dahme-Spreewald ................... 82,4 18,8 63,7 38,0 14,1 24,0 37,8 40,5 34,7<br />
Elbe-Elster ............................... 51,3 13,2 38,1 22,8 10,3 12,4 37,4 40,5 33,5<br />
Havelland ................................ 78,8 14,3 64,4 36,7 11,5 25,2 37,6 39,5 35,5<br />
Märkisch-Oderland .................. 94,1 22,1 72,0 46,6 17,3 29,3 37,3 39,8 34,7<br />
Oberhavel ................................ 103,6 29,2 74,4 47,9 20,5 27,4 36,9 39,3 34,0<br />
Oberspreewald-Lausitz ............ 51,1 15,2 35,8 22,0 10,7 11,3 36,1 39,3 32,0<br />
Oder-Spree .............................. 86,8 26,4 60,4 41,7 18,4 23,3 37,0 40,0 33,8<br />
Ostprignitz-Ruppin ................... 51,1 12,4 38,7 23,3 9,0 14,3 38,4 41,2 35,1<br />
Potsdam-Mittelmark ................ 106,9 24,6 82,3 50,5 18,8 31,7 38,0 40,5 35,1<br />
Prignitz .................................... 35,5 9,6 25,9 17,1 7,4 9,7 35,7 37,7 33,5<br />
Spree-Neiße ............................ 58,0 17,7 40,3 27,2 13,1 14,1 35,6 38,4 32,3<br />
Teltow-Fläming ........................ 87,0 22,5 64,4 40,0 17,3 22,7 37,4 40,1 34,1<br />
Uckermark ............................... 54,2 13,7 40,5 23,0 9,8 13,3 36,5 38,6 33,7<br />
<strong>Land</strong> <strong>Brandenburg</strong> 1 234,2 321,6 912,6 580,3 237,7 342,6 37,1 39,7 34,1<br />
<strong>Amt</strong> <strong>für</strong> <strong>Statistik</strong> <strong>Berlin</strong>-<strong>Brandenburg</strong> — SB A I 10 / A VI 2 – j / 12 – <strong>Brandenburg</strong>