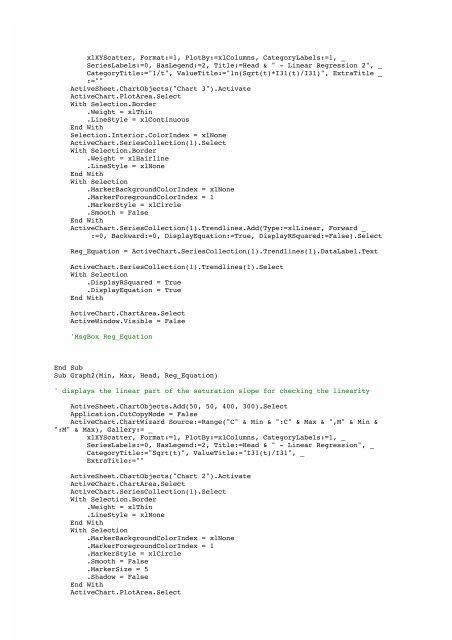
xlXYScatter, Format:=1, PlotBy:=xlColumns, CategoryLabels:=1, _SeriesLabels:=0, HasLegend:=2, Title:=Head & " - Linear Regression 2", _CategoryTitle:="1/t", ValueTitle:="ln(Sqrt(t)*I31(t)/I31)", ExtraTitle _:=""ActiveSheet.ChartObjects("Chart 3").ActivateActiveChart.PlotArea.SelectWith Selection.Border.Weight = xlThin.LineStyle = xlContinuousEnd WithSelection.Interior.ColorIndex = xlNoneActiveChart.SeriesCollection(1).SelectWith Selection.Border.Weight = xlHairline.LineStyle = xlNoneEnd WithWith Selection.MarkerBackgro<strong>und</strong>ColorIndex = xlNone.MarkerForegro<strong>und</strong>ColorIndex = 1.MarkerStyle = xlCircle.Smooth = FalseEnd WithActiveChart.SeriesCollection(1).Trendlines.Add(Type:=xlLinear, Forward _:=0, Backward:=0, DisplayEquation:=True, DisplayRSquared:=False).SelectReg_Equation = ActiveChart.SeriesCollection(1).Trendlines(1).DataLabel.TextActiveChart.SeriesCollection(1).Trendlines(1).SelectWith Selection.DisplayRSquared = True.DisplayEquation = TrueEnd WithActiveChart.ChartArea.SelectActiveWindow.Visible = False'MsgBox Reg_EquationEnd SubSub Graph2(Min, Max, Head, Reg_Equation)' displays the linear part of the saturation slope for checking the linearityActiveSheet.ChartObjects.Add(50, 50, 400, 300).SelectApplication.CutCopyMode = FalseActiveChart.ChartWizard Source:=R<strong>an</strong>ge("C" & Min & ":C" & Max & ",M" & Min &":M" & Max), Gallery:= _xlXYScatter, Format:=1, PlotBy:=xlColumns, CategoryLabels:=1, _SeriesLabels:=0, HasLegend:=2, Title:=Head & " - Linear Regression", _CategoryTitle:="Sqrt(t)", ValueTitle:="I31(t)/I31", _ExtraTitle:=""ActiveSheet.ChartObjects("Chart 2").ActivateActiveChart.ChartArea.SelectActiveChart.SeriesCollection(1).SelectWith Selection.Border.Weight = xlThin.LineStyle = xlNoneEnd WithWith Selection.MarkerBackgro<strong>und</strong>ColorIndex = xlNone.MarkerForegro<strong>und</strong>ColorIndex = 1.MarkerStyle = xlCircle.Smooth = False.MarkerSize = 5.Shadow = FalseEnd WithActiveChart.PlotArea.Select
End SubSelection.Interior.ColorIndex = xlNoneActiveChart.SeriesCollection(1).Trendlines.Add(Type:=xlLinear, Forward:=0, _Backward:=0, DisplayEquation:=True, DisplayRSquared:=False).SelectReg_Equation = ActiveChart.SeriesCollection(1).Trendlines(1).DataLabel.TextActiveChart.SeriesCollection(1).Trendlines(1).SelectWith Selection.DisplayRSquared = True.DisplayEquation = TrueEnd With'MsgBox Reg_EquationActiveChart.ChartArea.SelectActiveWindow.Visible = FalseSub Graph1(Fin, Head)' Displays a I31-Concentration versus sqrt(t) saturation graph_ActiveSheet.ChartObjects.Add(1, 1, 400, 300).SelectApplication.CutCopyMode = FalseActiveChart.ChartWizard Source:=R<strong>an</strong>ge("C1:C" & Fin & ",M1:M" & Fin), Gallery:=xlXYScatter, Format:=1, PlotBy:=xlColumns, CategoryLabels:=1, _SeriesLabels:=1, HasLegend:=2, Title:=Head & " - Saturation Graph", _CategoryTitle:="Sqrt(t)", ValueTitle:="I31(t)/I31", _ExtraTitle:=""End SubActiveSheet.ChartObjects("Chart 1").ActivateActiveChart.ChartArea.SelectActiveChart.SeriesCollection(1).SelectWith Selection.Border.Weight = xlThin.LineStyle = xlContinuousEnd WithWith Selection.MarkerBackgro<strong>und</strong>ColorIndex = xlNone.MarkerForegro<strong>und</strong>ColorIndex = 1.MarkerStyle = xlCircle.Smooth = False.MarkerSize = 2.Shadow = FalseEnd WithActiveChart.PlotArea.SelectSelection.Interior.ColorIndex = xlNoneActiveChart.ChartArea.SelectActiveWindow.Visible = FalseSub Graph_start(Fin, Head)' Displays a I31:t graph for evaluating the selection of <strong>an</strong> end pointActiveSheet.ChartObjects.Add(1, 1, 400, 300).SelectApplication.CutCopyMode = FalseActiveChart.ChartWizard Source:=R<strong>an</strong>ge("A21:A" & Fin & ",E21:E" & Fin & ",I21:I"& Fin), Gallery:= _xlXYScatter, Format:=1, PlotBy:=xlColumns, CategoryLabels:=1, _SeriesLabels:=1, HasLegend:=2, Title:=Head & " - Evaluation Graph", _CategoryTitle:="Cycle", ValueTitle:="I31", _ExtraTitle:=""ActiveSheet.ChartObjects("Chart 1").ActivateActiveChart.ChartArea.Select
- Seite 1 und 2: Messungen an PSI- und Nafion-Membra
- Seite 3 und 4: 1. EinleitungIm Rahmen des Studiums
- Seite 5 und 6: 4. Messmethode4.1 Theoretischer Hin
- Seite 7 und 8: 6. Auswertung6.1 Automatisierung mi
- Seite 9 und 10: Nafion 115, Versuch h), 1:1 - Satur
- Seite 11 und 12: Nafion 115, Versuch h), 1:1 - Time-
- Seite 13 und 14: Intensitätsplot, PSI-100, 4M MeOH
- Seite 15 und 16: Intensitätsplott, PSI-50, 64.8% Pr
- Seite 17 und 18: PSI-100: Propfgrad 52.1%Diffusionsk
- Seite 19 und 20: PSI-100: Propfgrad 52.1%Permeabilt
- Seite 21 und 22: Nafion 117: Konzentration MeOH vs.D
- Seite 23 und 24: Die nächsten 2 Graphiken sollen ei
- Seite 25 und 26: 8. Fehleranalyse und Messschwierigk
- Seite 27 und 28: 8.3 Keine Stationarität des Methan
- Seite 29 und 30: 10. LiteraturverzeichnisJoachim Kie
- Seite 31 und 32: LN METHODTIME LAG METHODDescription
- Seite 33: Anhang BExcel-Makro zur Auswertung
- Seite 37 und 38: 'Setupform.TextBox10.Value = Thres_
- Seite 39 und 40: Graph2 Min, Max, Head, Equation1Gra


