Geburten- und Vornamenstatistik der Landeshauptstadt Graz
Geburten- und Vornamenstatistik der Landeshauptstadt Graz
Geburten- und Vornamenstatistik der Landeshauptstadt Graz

Sie wollen auch ein ePaper? Erhöhen Sie die Reichweite Ihrer Titel.
YUMPU macht aus Druck-PDFs automatisch weboptimierte ePaper, die Google liebt.
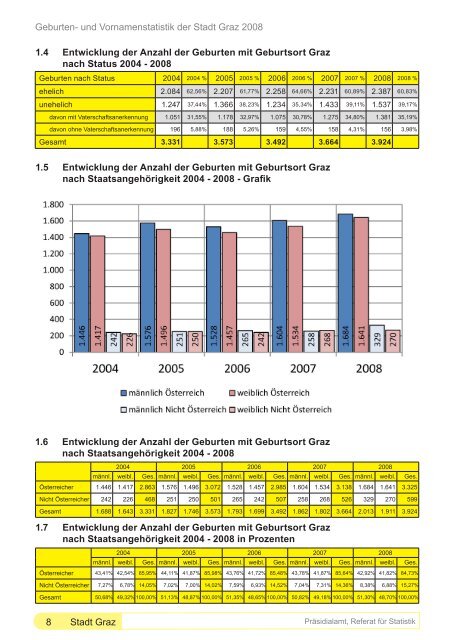
<strong>Geburten</strong>- <strong>und</strong> <strong>Vornamenstatistik</strong> <strong>der</strong> Stadt <strong>Graz</strong> 2008<br />
1.4 Entwicklung <strong>der</strong> Anzahl <strong>der</strong> <strong>Geburten</strong> mit Geburtsort <strong>Graz</strong><br />
nach Status 2004 - 2008<br />
<strong>Geburten</strong> nach Status 2004 2004 % 2005 2005 % 2006 2006 % 2007 2007 % 2008 2008 %<br />
ehelich 2.084 62,56% 2.207 61,77% 2.258 64,66% 2.231 60,89% 2.387 60,83%<br />
unehelich 1.247 37,44% 1.366 38,23% 1.234 35,34% 1.433 39,11% 1.537 39,17%<br />
1.5 Entwicklung <strong>der</strong> Anzahl <strong>der</strong> <strong>Geburten</strong> mit Geburtsort <strong>Graz</strong><br />
nach Staatsangehörigkeit 2004 - 2008 - Grafik<br />
8<br />
davon mit Vaterschaftsanerkennung 1.051 31,55% 1.178 32,97% 1.075 30,78% 1.275 34,80% 1.381 35,19%<br />
davon ohne Vaterschaftsanerkennung 196 5,88% 188 5,26% 159 4,55% 158 4,31% 156 3,98%<br />
Gesamt 3.331 3.573 3.492 3.664 3.924<br />
1.6 Entwicklung <strong>der</strong> Anzahl <strong>der</strong> <strong>Geburten</strong> mit Geburtsort <strong>Graz</strong><br />
nach Staatsangehörigkeit 2004 - 2008<br />
Stadt <strong>Graz</strong><br />
2004 2005 2006 2007 2008<br />
männl. weibl. Ges. männl. weibl. Ges. männl. weibl. Ges. männl. weibl. Ges. männl. weibl. Ges.<br />
Österreicher 1.446 1.417 2.863 1.576 1.496 3.072 1.528 1.457 2.985 1.604 1.534 3.138 1.684 1.641 3.325<br />
Nicht Österreicher 242 226 468 251 250 501 265 242 507 258 268 526 329 270 599<br />
Gesamt 1.688 1.643 3.331 1.827 1.746 3.573 1.793 1.699 3.492 1.862 1.802 3.664 2.013 1.911 3.924<br />
1.7 Entwicklung <strong>der</strong> Anzahl <strong>der</strong> <strong>Geburten</strong> mit Geburtsort <strong>Graz</strong><br />
nach Staatsangehörigkeit 2004 - 2008 in Prozenten<br />
2004 2005 2006 2007 2008<br />
männl. weibl. Ges. männl. weibl. Ges. männl. weibl. Ges. männl. weibl. Ges. männl. weibl. Ges.<br />
Österreicher 43,41% 42,54% 85,95% 44,11% 41,87% 85,98% 43,76% 41,72% 85,48% 43,78% 41,87% 85,64% 42,92% 41,82% 84,73%<br />
Nicht Österreicher 7,27% 6,78% 14,05% 7,02% 7,00% 14,02% 7,59% 6,93% 14,52% 7,04% 7,31% 14,36% 8,38% 6,88% 15,27%<br />
Gesamt 50,68% 49,32% 100,00% 51,13% 48,87% 100,00% 51,35% 48,65% 100,00% 50,82% 49,18% 100,00% 51,30% 48,70% 100,00%<br />
Präsidialamt, Referat für Statistik