Understanding the performance of free-space optics ... - by LightPointe
Understanding the performance of free-space optics ... - by LightPointe
Understanding the performance of free-space optics ... - by LightPointe

Create successful ePaper yourself
Turn your PDF publications into a flip-book with our unique Google optimized e-Paper software.
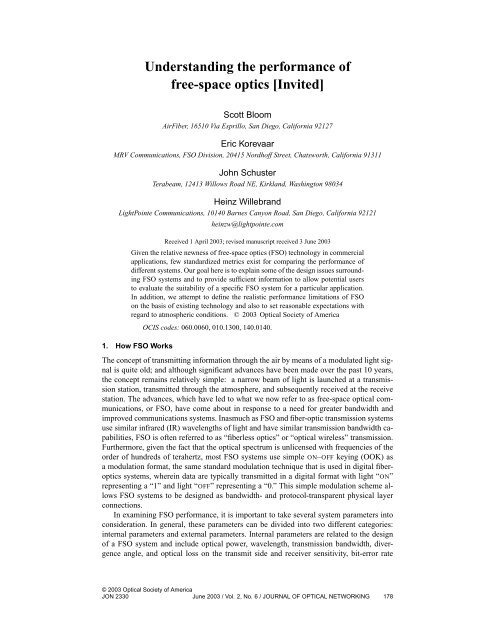
<strong>Understanding</strong> <strong>the</strong> <strong>performance</strong> <strong>of</strong><br />
<strong>free</strong>-<strong>space</strong> <strong>optics</strong> [Invited]<br />
Scott Bloom<br />
AirFiber, 16510 Via Esprillo, San Diego, California 92127<br />
Eric Korevaar<br />
MRV Communications, FSO Division, 20415 Nordh<strong>of</strong>f Street, Chatsworth, California 91311<br />
John Schuster<br />
Terabeam, 12413 Willows Road NE, Kirkland, Washington 98034<br />
Heinz Willebrand<br />
<strong>LightPointe</strong> Communications, 10140 Barnes Canyon Road, San Diego, California 92121<br />
heinzw@lightpointe.com<br />
Received 1 April 2003; revised manuscript received 3 June 2003<br />
Given <strong>the</strong> relative newness <strong>of</strong> <strong>free</strong>-<strong>space</strong> <strong>optics</strong> (FSO) technology in commercial<br />
applications, few standardized metrics exist for comparing <strong>the</strong> <strong>performance</strong> <strong>of</strong><br />
different systems. Our goal here is to explain some <strong>of</strong> <strong>the</strong> design issues surrounding<br />
FSO systems and to provide sufficient information to allow potential users<br />
to evaluate <strong>the</strong> suitability <strong>of</strong> a specific FSO system for a particular application.<br />
In addition, we attempt to define <strong>the</strong> realistic <strong>performance</strong> limitations <strong>of</strong> FSO<br />
on <strong>the</strong> basis <strong>of</strong> existing technology and also to set reasonable expectations with<br />
regard to atmospheric conditions. © 2003 Optical Society <strong>of</strong> America<br />
1. How FSO Works<br />
OCIS codes: 060.0060, 010.1300, 140.0140.<br />
The concept <strong>of</strong> transmitting information through <strong>the</strong> air <strong>by</strong> means <strong>of</strong> a modulated light signal<br />
is quite old; and although significant advances have been made over <strong>the</strong> past 10 years,<br />
<strong>the</strong> concept remains relatively simple: a narrow beam <strong>of</strong> light is launched at a transmission<br />
station, transmitted through <strong>the</strong> atmosphere, and subsequently received at <strong>the</strong> receive<br />
station. The advances, which have led to what we now refer to as <strong>free</strong>-<strong>space</strong> optical communications,<br />
or FSO, have come about in response to a need for greater bandwidth and<br />
improved communications systems. Inasmuch as FSO and fiber-optic transmission systems<br />
use similar infrared (IR) wavelengths <strong>of</strong> light and have similar transmission bandwidth capabilities,<br />
FSO is <strong>of</strong>ten referred to as “fiberless <strong>optics</strong>” or “optical wireless” transmission.<br />
Fur<strong>the</strong>rmore, given <strong>the</strong> fact that <strong>the</strong> optical spectrum is unlicensed with frequencies <strong>of</strong> <strong>the</strong><br />
order <strong>of</strong> hundreds <strong>of</strong> terahertz, most FSO systems use simple ON–OFF keying (OOK) as<br />
a modulation format, <strong>the</strong> same standard modulation technique that is used in digital fiber<strong>optics</strong><br />
systems, wherein data are typically transmitted in a digital format with light “ON”<br />
representing a “1” and light “OFF” representing a “0.” This simple modulation scheme allows<br />
FSO systems to be designed as bandwidth- and protocol-transparent physical layer<br />
connections.<br />
In examining FSO <strong>performance</strong>, it is important to take several system parameters into<br />
consideration. In general, <strong>the</strong>se parameters can be divided into two different categories:<br />
internal parameters and external parameters. Internal parameters are related to <strong>the</strong> design<br />
<strong>of</strong> a FSO system and include optical power, wavelength, transmission bandwidth, divergence<br />
angle, and optical loss on <strong>the</strong> transmit side and receiver sensitivity, bit-error rate<br />
© 2003 Optical Society <strong>of</strong> America<br />
JON 2330 June 2003 / Vol. 2, No. 6 / JOURNAL OF OPTICAL NETWORKING 178
(BER), receive lens diameter, and receiver field <strong>of</strong> view (FOV) on <strong>the</strong> receive side. External<br />
parameters, or non-system-specific parameters, are related to <strong>the</strong> environment in which<br />
<strong>the</strong> system must operate and include visibility and atmospheric attenuation, scintillation,<br />
deployment distance, window loss, and pointing loss.<br />
It is important to understand that many <strong>of</strong> <strong>the</strong>se parameters are not independent but are<br />
linked toge<strong>the</strong>r in specifying overall system <strong>performance</strong>. For example, system availability<br />
is a function <strong>of</strong> not only <strong>the</strong> deployment distance but also <strong>of</strong> local climate and transceiver<br />
design. In addition, a system optimized for long-range <strong>performance</strong> (>1 km) may not be<br />
optimally designed for high-availability (>99.9%) short-range <strong>performance</strong>. Overall, optimum<br />
FSO system design is highly dependent upon <strong>the</strong> intended application, required<br />
availability, and cost point.<br />
2. Environmental Factors<br />
The <strong>performance</strong> <strong>of</strong> a FSO link is primarily dependent upon <strong>the</strong> climatology and <strong>the</strong> physical<br />
characteristics <strong>of</strong> its installation location. In general, wea<strong>the</strong>r and installation characteristics<br />
that impair or reduce visibility also effect FSO link <strong>performance</strong>. A typical FSO<br />
system is capable <strong>of</strong> operating at a range <strong>of</strong> two to three times that <strong>of</strong> <strong>the</strong> naked eye in<br />
any particular environmental condition. The primary factors affecting <strong>performance</strong> include<br />
atmospheric attenuation, scintillation, window attenuation, alignment or building motion,<br />
solar interference, and line-<strong>of</strong>-sight obstructions.<br />
3. Atmospheric Attenuation<br />
Atmospheric attenuation <strong>of</strong> FSO systems is typically dominated <strong>by</strong> fog but can also be dependent<br />
upon low clouds, rain, snow, dust, and various combinations <strong>of</strong> each. The effects<br />
<strong>of</strong> fog on visibility and range can be seen in Fig. 1, which presents a series <strong>of</strong> photographs<br />
taken during a fog event in Denver, Colorado. The tall building in <strong>the</strong> foreground (on <strong>the</strong><br />
right-hand side) is located approximately 300 m from <strong>the</strong> camera. The first panel shows<br />
clear atmospheric conditions with a visibility range <strong>of</strong> >2000 m as measured with a nephelometer<br />
mounted at <strong>the</strong> camera site. This corresponds to an attenuation <strong>of</strong> approximately<br />
6.5 dB/km at near-IR wavelengths and according to <strong>the</strong> 5% contrast standard for visibility<br />
and as defined <strong>by</strong> <strong>the</strong> World Meteorological Organization (WMO). The distant mountain<br />
range is clearly visible, even though it is many kilometers away. The second panel depicts<br />
<strong>the</strong> onset <strong>of</strong> a fog event, at which time visibility is measured at approximately 113 m (115<br />
dB/km). The near building is still visible at 300 m; all buildings and landmarks beyond this<br />
range are obscured. In <strong>the</strong> third panel, with a visibility range <strong>of</strong> approximately 75 m (173<br />
dB/km), <strong>the</strong> building in <strong>the</strong> foreground is completely obscured.<br />
4. Scintillation<br />
Atmospheric scintillation can be defined as <strong>the</strong> changing <strong>of</strong> light intensities in time and<br />
<strong>space</strong> at <strong>the</strong> plane <strong>of</strong> a receiver that is detecting a signal from a transmitter located at a<br />
distance. The received signal at <strong>the</strong> detector fluctuates as a result <strong>of</strong> <strong>the</strong> <strong>the</strong>rmally induced<br />
changes in <strong>the</strong> index <strong>of</strong> refraction <strong>of</strong> <strong>the</strong> air along <strong>the</strong> transmit path. These index changes<br />
cause <strong>the</strong> atmosphere to act like a series <strong>of</strong> small lenses that deflect portions <strong>of</strong> <strong>the</strong> light<br />
beam into and out <strong>of</strong> <strong>the</strong> transmit path. The time scale <strong>of</strong> <strong>the</strong>se fluctuations is <strong>of</strong> <strong>the</strong> order<br />
<strong>of</strong> milliseconds, approximately equal to <strong>the</strong> time that it takes a volume <strong>of</strong> air <strong>the</strong> size <strong>of</strong> <strong>the</strong><br />
beam to move across <strong>the</strong> path, and <strong>the</strong>refore is related to <strong>the</strong> wind speed.<br />
Scintillation can change <strong>by</strong> more than an order <strong>of</strong> magnitude during <strong>the</strong> course <strong>of</strong> a day,<br />
being <strong>the</strong> worst, or most scintillated, during midday when <strong>the</strong> temperature is <strong>the</strong> highest.<br />
Some experiments have shown that, depending upon <strong>the</strong> atmospheric conditions along <strong>the</strong><br />
© 2003 Optical Society <strong>of</strong> America<br />
JON 2330 June 2003 / Vol. 2, No. 6 / JOURNAL OF OPTICAL NETWORKING 179
6.5 dB/km 113 dB/km<br />
173 dB/km<br />
Fig. 1. Denver, Colorado, fog event.<br />
beam path, <strong>the</strong> magnitude <strong>of</strong> scintillation-induced fades reaches a maximum that does not<br />
continue to increase with distance.<br />
Overall, scintillation causes rapid fluctuations <strong>of</strong> received power and, in a worst case,<br />
results in high-error-rate FSO <strong>performance</strong>. However, at ranges less than 1 km, most FSO<br />
systems have enough dynamic range or margin to compensate for scintillation effects. In<br />
addition, FSO installations capable <strong>of</strong> 99.9% or better availability typically have enough<br />
margin to compensate for large amounts <strong>of</strong> atmospheric attenuation and thus have more<br />
than enough margin to compensate for scintillation. For longer, lower-availability links,<br />
transceiver design features such as <strong>the</strong> use <strong>of</strong> multiple laser transmitters can substantially<br />
reduce <strong>the</strong> effects <strong>of</strong> scintillation.<br />
5. Window Attenuation<br />
One <strong>of</strong> <strong>the</strong> advantages <strong>of</strong> FSO systems is that <strong>the</strong>y allow communication through windows<br />
without <strong>the</strong> need for ro<strong>of</strong>top-mounted antennas. This is especially advantageous for connecting<br />
individual customers who may or may not have access to a building’s ro<strong>of</strong> and also<br />
may have to pay for access to <strong>the</strong> riser wiring <strong>of</strong> a building.<br />
Even though windows allow optical signals to pass through <strong>the</strong>m, <strong>the</strong>y all add some<br />
amount <strong>of</strong> attenuation to <strong>the</strong> signal. Uncoated glass windows usually attenuate 4% per<br />
surface, because <strong>of</strong> reflection. This means that a perfectly clear double-pane window attenuates<br />
all optical signals at least 15% (four surfaces, each with 4% reflection). Windows<br />
that are tinted or coated can have much greater attenuation, and <strong>the</strong> actual magnitude is<br />
typically quite wavelength dependent.<br />
For a high-availability FSO deployment behind windows, it is recommended that installers<br />
measure <strong>the</strong> actual attenuation <strong>of</strong> <strong>the</strong> window so that <strong>the</strong> expected link <strong>performance</strong><br />
can be accurately calculated. In addition, when planning an installation on tall buildings,<br />
an installer may want to weigh <strong>the</strong> possibility <strong>of</strong> low clouds interrupting a ro<strong>of</strong>top-mounted<br />
system against <strong>the</strong> reduction in link <strong>performance</strong> that results from <strong>the</strong> lower-altitude window<br />
attenuation. In many cases, <strong>the</strong> window attenuation may have a lesser effect on overall<br />
link availability.<br />
6. Alignment<br />
One <strong>of</strong> <strong>the</strong> key challenges with FSO systems is maintaining transceiver alignment. FSO<br />
transceivers transmit highly directional and narrow beams <strong>of</strong> light that must impinge upon<br />
© 2003 Optical Society <strong>of</strong> America<br />
JON 2330 June 2003 / Vol. 2, No. 6 / JOURNAL OF OPTICAL NETWORKING 180
<strong>the</strong> receive aperture <strong>of</strong> <strong>the</strong> transceiver at <strong>the</strong> opposite end <strong>of</strong> <strong>the</strong> link. A typical FSO<br />
transceiver transmits one or more beams <strong>of</strong> light, each <strong>of</strong> which is 5–8 cm in diameter<br />
at <strong>the</strong> transmitter and typically spreads to roughly 1–5 m in diameter at a range <strong>of</strong> 1 km.<br />
Adding to <strong>the</strong> challenge is <strong>the</strong> fact that FSO receivers have a limited FOV, which can be<br />
thought <strong>of</strong> as <strong>the</strong> receiver’s “cone <strong>of</strong> acceptance” and is similar to <strong>the</strong> cone <strong>of</strong> light projected<br />
<strong>by</strong> <strong>the</strong> transmitter. For a FSO link to function, it is very important that both <strong>the</strong> transmitted<br />
beam <strong>of</strong> light and <strong>the</strong> receive FOV cone encompass <strong>the</strong> transceiver at <strong>the</strong> opposite end <strong>of</strong><br />
<strong>the</strong> link.<br />
Despite our perceptions to <strong>the</strong> contrary, buildings are, in fact, constantly in motion. This<br />
movement is <strong>the</strong> result <strong>of</strong> a variety <strong>of</strong> factors, including <strong>the</strong>rmal expansion, wind sway,<br />
and vibration. Because <strong>of</strong> <strong>the</strong> narrowness <strong>of</strong> <strong>the</strong> transmitted beam and <strong>the</strong> receiver’s FOV,<br />
building sway can affect a FSO transceiver’s alignment and interrupt communication. This<br />
building sway is generally referred to as “base motion.” In most circumstances, angular<br />
motion (azimuth and elevation), as opposed to linear motion, poses <strong>the</strong> greatest challenge<br />
for transceiver alignment. Base motion can usually be assigned to one <strong>of</strong> three classes: low,<br />
moderate, and high frequency. Low-frequency motion is defined as motion with periods<br />
from minutes to months and is dominated <strong>by</strong> diurnal and seasonal temperature variations.<br />
Moderate-frequency motion has periods <strong>of</strong> seconds and includes wind-induced building<br />
motion. High-frequency motion has periods <strong>of</strong> less than 1 s and is generally referred to as<br />
vibration, which includes motion induced <strong>by</strong> large machinery (e.g., large fans), as well as<br />
human activity (e.g., walking, shutting doors). Each class is discussed in more detail below.<br />
7. Low-Frequency Base Motion<br />
Thermal gradients induce bending and twisting in buildings, <strong>the</strong> magnitude <strong>of</strong> which varies<br />
greatly with <strong>the</strong> building size, shape, and structural type. Generally, this motion is so insignificant<br />
and slow that it goes unnoticed <strong>by</strong> building occupants. A correlation has been<br />
shown to exist between low-frequency base motion and daily temperature changes. As<br />
would be expected, <strong>the</strong> motion tends to increase with height in a building and can be significant<br />
for ro<strong>of</strong>top installations—even for installations on shorter buildings. Also, it is<br />
more pronounced in elevation angles than in azimuth angles.<br />
8. Moderate-Frequency Base Motion<br />
Moderate-frequency base motion is caused <strong>by</strong> wind and can be quite significant in tall<br />
buildings. Fortunately, minimizing building motion in strong winds is usually a key goal in<br />
<strong>the</strong> structural design <strong>of</strong> skyscrapers. Thus, only <strong>the</strong> most severe winds are likely to result<br />
in large building motions. FSO outages that result from building motion will be short in<br />
duration inasmuch as once <strong>the</strong> wind gust tapers <strong>of</strong>f, <strong>the</strong> building will return to its original<br />
position and alignment. Wider-beam transceivers and transceivers with sufficiently capable<br />
automatic pointing and tracking systems will be able to “reject” even <strong>the</strong>se rare large<br />
motions without outage.<br />
9. High-Frequency Base Motion<br />
High-frequency base motion is caused <strong>by</strong> vibration. Base motion faster than a few hertz is<br />
highly dependent on how and where a FSO terminal is mounted. Floor, wall, and ro<strong>of</strong>top<br />
(i.e., surface <strong>of</strong> ro<strong>of</strong> or parapet wall) can all yield quite different levels <strong>of</strong> base motion.<br />
Figure 2 presents power spectral density plots <strong>of</strong> vibration for several buildings, including<br />
two ro<strong>of</strong>top mounts (surface <strong>of</strong> ro<strong>of</strong>), two tall <strong>of</strong>fice buildings (floor mount), and a small<br />
wood-frame building (floor mount). The curves show <strong>the</strong> large variability in vibration from<br />
building to building. In addition, <strong>the</strong> magnitude <strong>of</strong> vibration due to occupant activity (e.g.,<br />
© 2003 Optical Society <strong>of</strong> America<br />
JON 2330 June 2003 / Vol. 2, No. 6 / JOURNAL OF OPTICAL NETWORKING 181
walking, shutting doors) will vary greatly over time within <strong>the</strong> same building. It is interesting<br />
to note that almost all <strong>the</strong> integrated motion is due to frequency content below 10 Hz.<br />
Measurements show that peak angular base motion due to vibration above 1 Hz should<br />
rarely exceed 1 mrad and in many environments will rarely approach half this value. However,<br />
mounting hardware must be carefully designed (and installed) so that <strong>the</strong> mount does<br />
not amplify <strong>the</strong> base motion that <strong>the</strong> FSO terminal experiences.<br />
10. Link Degradation from Base Motion<br />
Base motion can cause link outages in two ways: excess geometric loss due to pointing errors<br />
and/or large detector coupling loss due to tracking errors. Geometric loss is <strong>the</strong> optical<br />
loss from <strong>the</strong> transmit terminal output aperture to <strong>the</strong> receive terminal input aperture. Errors<br />
in <strong>the</strong> pointing <strong>of</strong> <strong>the</strong> transmit laser beam toward <strong>the</strong> opposing terminal’s receive aperture<br />
(angle in link <strong>space</strong>) will increase this geometric loss. Detector coupling loss is <strong>the</strong> ratio <strong>of</strong><br />
<strong>the</strong> optical power in <strong>the</strong> receive focal plane to <strong>the</strong> power incident on <strong>the</strong> active area <strong>of</strong> <strong>the</strong><br />
detector. As <strong>the</strong> receive spot moves away from <strong>the</strong> center <strong>of</strong> <strong>the</strong> detector, <strong>the</strong> detector coupling<br />
loss increases. The receive spot decenter can be expressed as a tracking error (angle<br />
in link <strong>space</strong>), and <strong>the</strong> increased loss resulting from this tracking error is referred to as a<br />
tracking loss. Given that <strong>the</strong> tracking error exceeds half <strong>the</strong> receive FOV, this tracking loss<br />
can increase quickly.<br />
Power Spectral Density (Rad^2/Hz)<br />
1.E-06<br />
1.E-07<br />
1.E-08<br />
1.E-09<br />
1.E-10<br />
1.E-11<br />
1.E-12<br />
1.E-13<br />
1.E-14<br />
1.E-15<br />
1.E-16<br />
1.E-17<br />
1.E-18<br />
1.E-19<br />
Ro<strong>of</strong>top <strong>of</strong> 10-story bldg<br />
4th floor <strong>of</strong> wood-frame bldg<br />
Ro<strong>of</strong>top <strong>of</strong> 2-story bldg<br />
20th floor <strong>of</strong> 33-story bldg<br />
24th floor <strong>of</strong> 47-story bldg<br />
1.E-20<br />
1 10<br />
Frequency (Hz)<br />
100<br />
Fig. 2. Power spectral density <strong>of</strong> measured vibration.<br />
There are two approaches to managing base motion: nontracking systems and systems<br />
with automatic pointing and tracking. Nontracking systems are designed to optimize transmit<br />
divergence in order to minimize geometric losses and attempt to match <strong>the</strong>ir receive<br />
FOV in order to handle base motion. Systems with automatic pointing and tracking can<br />
significantly compensate for <strong>the</strong> base motion before it can be translated into pointing and<br />
tracking errors. This enables a system with automatic pointing and tracking to have low<br />
geometric loss (with a small transmit divergence) and low tracking losses (even when used<br />
with a small receive FOV). The trade-<strong>of</strong>f between nontracking and automatic pointing and<br />
tracking is <strong>performance</strong> versus cost, because tracking systems can add considerable cost<br />
© 2003 Optical Society <strong>of</strong> America<br />
JON 2330 June 2003 / Vol. 2, No. 6 / JOURNAL OF OPTICAL NETWORKING 182
and complexity to a FSO system.<br />
Total tracking and pointing errors must be determined <strong>by</strong> means <strong>of</strong> combining base<br />
motion (as described above) with o<strong>the</strong>r criteria, such as initial field alignment errors (for<br />
nontracking systems), coalignment errors, and terminal <strong>the</strong>rmal drift. Table 1 presents examples<br />
<strong>of</strong> pointing and tracking error budgets for nontracking and automatic pointing and<br />
tracking FSO terminals. The tracking terminal uses residual base motion, which accounts<br />
for <strong>the</strong> expected compensation <strong>of</strong> <strong>the</strong> tracking system as a function <strong>of</strong> base motion frequency.<br />
The low-, moderate-, and high-frequency base motions are not independent. Therefore<br />
this budget, which directly adds <strong>the</strong> base motion components, has been tailored for<br />
conditions that emphasize low-frequency building motion with non-extreme moderate- and<br />
high-frequency motion.<br />
Table Table 1. Sample 1. Sample Pointing and Tracking Error Budgets for for FSO FSOTerminals Terminals<br />
Pointing Errors (mrad) Tracking Errors (mrad)<br />
Source No Tracking Tracking No Tracking Tracking<br />
Initial alignment 0.2 N/A 0.2 N/A<br />
TX/RX coalignment 0.2 0.05 N/A N/A<br />
Terminal <strong>the</strong>rmal drift 0.1 0.02 0.1 0.02<br />
Low-frequency motion 1.5 0.01 1.5 0.01<br />
Moderate-frequency motion 0.5 0.02 0.5 0.02<br />
High-frequency motion 0.5 0.05 0.5 0.05<br />
Total<br />
N/A, not applicable.<br />
3.0 0.15 2.8 0.1<br />
The above types <strong>of</strong> base motion can be summarized in a few rules <strong>of</strong> thumb for evaluating<br />
whe<strong>the</strong>r a particular FSO system will experience motion-induced outages.<br />
• Short concrete structures (fewer than three stories) typically move less than taller<br />
buildings or wooden structures.<br />
• Motion <strong>of</strong> <strong>the</strong> transceiver mount may dominate motion <strong>of</strong> <strong>the</strong> building.<br />
• Less than 15% <strong>of</strong> buildings move more than 4-mrad full side to side over a 1-yr<br />
period.<br />
• Less than 5% <strong>of</strong> buildings move more than 6-mrad full side to side over a 1-yr period.<br />
• Less than 1% <strong>of</strong> buildings move more than 10-mrad full side to side over a 1-yr<br />
period.<br />
11. Solar Interference<br />
A FSO system uses a highly sensitive receiver in combination with a large-aperture lens,<br />
and, as a result, natural background light can potentially interfere with FSO signal reception.<br />
This is especially <strong>the</strong> case with <strong>the</strong> high levels <strong>of</strong> background radiation associated<br />
with intense sunlight. In some circumstances, direct sunlight may cause link outages for<br />
periods <strong>of</strong> several minutes when <strong>the</strong> Sun is within <strong>the</strong> receiver’s FOV. However, <strong>the</strong> times<br />
when <strong>the</strong> receiver is most susceptible to <strong>the</strong> effects <strong>of</strong> direct solar illumination can be easily<br />
predicted. When direct exposure (i.e., pointing) <strong>of</strong> <strong>the</strong> equipment cannot be avoided, narrowing<br />
<strong>the</strong> receiver FOV and/or using a narrow-bandwidth light filter can improve system<br />
<strong>performance</strong>. It is important to remember that interference <strong>by</strong> sunlight reflected <strong>of</strong>f a glass<br />
surface is possible as well.<br />
© 2003 Optical Society <strong>of</strong> America<br />
JON 2330 June 2003 / Vol. 2, No. 6 / JOURNAL OF OPTICAL NETWORKING 183
12. Transceiver Design<br />
The optimal design <strong>of</strong> a FSO system is highly dependent upon its desired price point as<br />
well as <strong>the</strong> required range, availability, and data rate for its intended application. Once <strong>the</strong><br />
application-dependent design constraints have been established, several fundamental technical<br />
choices that will greatly influence <strong>the</strong> overall design <strong>of</strong> <strong>the</strong> FSO transceivers must<br />
be made <strong>by</strong> <strong>the</strong> design team. These fundamental design choices include transmission characteristics,<br />
nontracking versus automatic pointing and tracking, single transmitter/receiver<br />
versus multiple transmitter/receiver, and direct coupling versus fiber coupling.<br />
13. Transmission Characteristics<br />
Optical Wavelengths<br />
Generally, all <strong>of</strong> today’s commercially available FSO systems operate in <strong>the</strong> near-IR wavelength<br />
range between roughly 750 and 1600 nm, with one or two systems being developed<br />
to operate at <strong>the</strong> IR wavelength <strong>of</strong> 10,000 nm. The physics and transmission properties <strong>of</strong><br />
optical energy as it travels through <strong>the</strong> atmosphere are similar throughout <strong>the</strong> visible and<br />
<strong>the</strong> near-IR wavelength range, but <strong>the</strong>re are several factors that influence which wavelength<br />
is chosen <strong>by</strong> a given design team.<br />
Atmospheric Transmission Windows<br />
It is important to note that although <strong>the</strong> atmosphere is considered to be highly transparent<br />
in <strong>the</strong> visible and near-IR wavelengths, certain wavelengths (or wavelength bands) can<br />
experience severe absorption. In <strong>the</strong> near-IR wavelength, absorption occurs primarily in response<br />
to water particles (i.e., moisture), which are an inherent part <strong>of</strong> <strong>the</strong> atmosphere even<br />
under clear wea<strong>the</strong>r conditions The contribution <strong>of</strong> gas absorption (e.g., COx or NOx) to<br />
<strong>the</strong> overall absorption coefficient is not considered here because <strong>the</strong> gas-specific absorption<br />
coefficients are quite small when compared with water absorption. However, in <strong>the</strong> longer-<br />
IR wavelength range (>2000 nm), gas absorption can dominate <strong>the</strong> absorption properties<br />
<strong>of</strong> <strong>the</strong> atmosphere. Figure 3 shows <strong>the</strong> absorption <strong>of</strong> <strong>the</strong> atmosphere under clear wea<strong>the</strong>r<br />
conditions (visibility >10 miles) for various transmission wavelengths in <strong>the</strong> near-IR spectral<br />
range (between 0.7 and 1.6 µm) and was created with MODTRAN, a s<strong>of</strong>tware program<br />
that was developed to facilitate <strong>the</strong> study <strong>of</strong> transmission properties <strong>of</strong> <strong>the</strong> atmosphere.<br />
There are several transmission windows that are nearly transparent (i.e., have an attenuation<br />
<strong>of</strong>
Attenuation [dB/km]<br />
5<br />
4.5<br />
4<br />
3.5<br />
3<br />
2.5<br />
2<br />
1.5<br />
1<br />
0.5<br />
0<br />
0.7 0.8 0.9 1 1.1 1.2 1.3 1.4 1.5 1.6<br />
Transmission wavelength [µm]<br />
Fig. 3. MODTRAN transmission calculation under clear wea<strong>the</strong>r conditions.<br />
1520–1600 nm. These wavelengths are well suited for <strong>free</strong>-<strong>space</strong> transmission, and highquality<br />
transmitter and detector components are readily available. The combination <strong>of</strong> low<br />
attenuation and high component availability in this wavelength makes <strong>the</strong> development <strong>of</strong><br />
wavelength-division multiplexing (WDM) FSO systems feasible. However, components<br />
are generally more expensive, and detectors are typically less sensitive and have a smaller<br />
receive surface area when compared with Si APD detectors that operate in <strong>the</strong> 850-nm<br />
wavelength. That being said, <strong>the</strong>se wavelengths are also used in long-haul fiber systems,<br />
and many companies are working to reduce <strong>the</strong> cost and increase <strong>the</strong> <strong>performance</strong> <strong>of</strong> 1520–<br />
1600-nm components. In addition, <strong>the</strong>se wavelengths are compatible with erbium-doped<br />
fiber amplifier (EDFA) technology, which is important for high-power (>500 mW) and<br />
high-data rate (>2.5 Gbit/s) systems. Finally, 50–65 times as much power can be transmitted<br />
at 1520–1600 nm than can be transmitted at 780–850 nm for <strong>the</strong> same eye safety<br />
classification, owing to <strong>the</strong> low transmission <strong>of</strong> <strong>the</strong> human eye at <strong>the</strong>se wavelengths.<br />
10,000 nm (10 μ m). This wavelength is relatively new to <strong>the</strong> commercial FSO arena and<br />
is being developed because <strong>of</strong> claims <strong>of</strong> better fog transmission characteristics. At this time,<br />
<strong>the</strong>re is considerable debate regarding <strong>the</strong>se characteristics because <strong>the</strong>y are heavily dependent<br />
upon fog type and duration. In general, <strong>the</strong>re are few components available at 10 µm,<br />
inasmuch as it is not normally used in telecommunications equipment. In addition, 10-µm<br />
energy does not penetrate glass, so it is ill-suited to behind-window deployments. However,<br />
<strong>the</strong> poor glass penetration means that it is highly unlikely to be concentrated <strong>by</strong> optical aids<br />
(binoculars), thus allowing for high-power operation in unrestricted environments.<br />
Ano<strong>the</strong>r topic concerning <strong>the</strong> <strong>performance</strong> <strong>of</strong> FSO systems is <strong>the</strong> issue <strong>of</strong> atmospheric<br />
propagation in heavy fog conditions for different wavelengths. Until recently, <strong>the</strong> generally<br />
held belief was that systems operating at longer wavelengths had better range <strong>performance</strong><br />
than do those operating at shorter wavelengths. However, recent studies have shown that in<br />
heavy fog conditions, attenuation is almost constant with wavelength over <strong>the</strong> 780–1600nm<br />
region and that, in fact, <strong>the</strong>re are no benefits until one gets to millimeter-wave wavelengths.<br />
So far, <strong>the</strong> vast majority <strong>of</strong> research suggests that 10-µm radiation propagates better<br />
under hazy and very moderate fog conditions. However, <strong>the</strong>se conditions typically do not<br />
constitute a problem for well-designed shorter wavelength FSO transmission systems over<br />
transmission distances currently envisioned in commercial applications. Therefore, <strong>the</strong> actual<br />
magnitude <strong>of</strong> this improvement is likely to be highly dependent upon fog type and<br />
duration. Standard models <strong>of</strong> atmospheric scattering using ei<strong>the</strong>r Mie <strong>the</strong>ory or more integrated<br />
packages such as MODTRAN show no <strong>performance</strong> improvement at 10 µm. Even<br />
© 2003 Optical Society <strong>of</strong> America<br />
JON 2330 June 2003 / Vol. 2, No. 6 / JOURNAL OF OPTICAL NETWORKING 185
when <strong>the</strong> particle size distributions are centered on particles as small as 5 µm, <strong>the</strong> contribution<br />
from <strong>the</strong> upper end <strong>of</strong> <strong>the</strong> distribution (owing to <strong>the</strong> r 2 dependence <strong>of</strong> <strong>the</strong> scattering)<br />
negates any advantage for this wavelength.<br />
14. Transmission<br />
The modulated light source, which is typically a laser or light-emitting diode (LED), provides<br />
<strong>the</strong> transmitted optical signal and determines all <strong>the</strong> transmitter capabilities <strong>of</strong> <strong>the</strong><br />
system. Only <strong>the</strong> detector sensitivity plays an equally important role in total system <strong>performance</strong>.<br />
For telecommunication purposes, only lasers that are capable <strong>of</strong> being modulated at<br />
20 Mbit/s to 2.5 Gbit/s can meet current marketplace demands. In addition, how <strong>the</strong> device<br />
is modulated and how much modulated power is produced are both important to <strong>the</strong> selection<br />
<strong>of</strong> a device. Lasers in <strong>the</strong> 780–925-nm and 1525–1580-nm spectral bands meet frequency<br />
requirements and are available as <strong>of</strong>f-<strong>the</strong>-shelf products. Although o<strong>the</strong>r operating<br />
wavelengths are used in commercial FSO systems, this discussion will focus on lasers that<br />
operate in <strong>the</strong> 850- and 1550-nm wavelength bands. Within <strong>the</strong>se two wavelength windows,<br />
FSO systems should have <strong>the</strong> following characteristics:<br />
• Ability to operate at higher power levels (important for longer-distance FSO systems).<br />
• High-speed modulation (important for high-speed FSO systems).<br />
• Small footprint and low power consumption (important for overall system design and<br />
maintenance).<br />
• Ability to operate over a wide temperature range without major <strong>performance</strong> degradation<br />
(important for outdoor systems).<br />
• Mean time between failure (MTBF) that exceeds 10 yr.<br />
To meet <strong>the</strong> above requirements, FSO manufacturers generally use VCSELs for operation<br />
in <strong>the</strong> shorter-IR wavelength range and Fabry–Perot (FP) or distributed-feedback (DFB)<br />
lasers for operation in <strong>the</strong> longer-IR wavelength range. Several o<strong>the</strong>r laser types are not<br />
suitable for high-<strong>performance</strong> FSO systems.<br />
15. VCSEL Lasers<br />
The VCSEL (850-nm wavelength) is an outgrowth <strong>of</strong> fiber communications development<br />
and has many attractive features. VCSELs revolutionized <strong>the</strong> transmission component market<br />
because <strong>of</strong> <strong>the</strong>ir exceptional cost and <strong>performance</strong> advantages over previously available<br />
technology. Most notably, VCSELs have a reasonable, nominal average power level <strong>of</strong> several<br />
milliwatts <strong>of</strong> output at high-speed operation and high reliability numbers for MTBF.<br />
The average power, not <strong>the</strong> peak power, determines <strong>the</strong> link margin. Inasmuch as <strong>the</strong> 850nm<br />
VCSEL is cheaper than many <strong>of</strong> its alternatives, <strong>the</strong> 850-nm products dominate <strong>the</strong><br />
low-price FSO systems because operation speeds are generally below 1 Gbit/s for <strong>of</strong>f-<strong>the</strong>shelf<br />
systems. Because <strong>of</strong> <strong>the</strong>ir high efficiency, power dissipation is typically not an issue<br />
for VCSELs, and active cooling is not required. In addition, VCSELs emit light in <strong>the</strong><br />
form <strong>of</strong> a circular beam instead <strong>of</strong> an elliptical beam. The round shape <strong>of</strong> <strong>the</strong> beam pattern<br />
perfectly matches <strong>the</strong> round core <strong>of</strong> an optical fiber, facilitating <strong>the</strong> coupling process and<br />
improving coupling efficiency. The success <strong>of</strong> VCSEL technology has been so tremendous<br />
that many VCSEL manufacturers can produce shorter-wavelength 850-nm laser structures<br />
with direct modulation speeds beyond 3 Gbit/s. The direct electrical modulation <strong>of</strong> VC-<br />
SELs beyond 10 Gbit/s has been demonstrated and commercialized for OC-48 (STM-16)<br />
and 10-GigE operations.<br />
© 2003 Optical Society <strong>of</strong> America<br />
JON 2330 June 2003 / Vol. 2, No. 6 / JOURNAL OF OPTICAL NETWORKING 186
16. Fabry–Perot and Distributed-Feedback Lasers<br />
FP and DFB lasers based on InGaAs/InP semiconductor technology with operating wavelengths<br />
around 1550 nm were developed specifically for fiber-optic communications systems<br />
because <strong>of</strong> <strong>the</strong> low attenuation characteristics <strong>of</strong> optical fiber in this wavelength range.<br />
With <strong>the</strong> development <strong>of</strong> <strong>the</strong>se lower-power laser sources came high modulation speed,<br />
wavelength stability, reliability, and long life spans. Today’s lower-power 1550-nm DFB<br />
lasers have demonstrated excellent lifetime <strong>performance</strong> that satisfies <strong>the</strong> stringent requirements<br />
<strong>of</strong> <strong>the</strong> telecommunications industry. DFB lasers can drive fiber networks capable <strong>of</strong><br />
1–40 Gbit/s <strong>of</strong> modulation under highly controlled environmental conditions.<br />
17. Amplification Sources<br />
Amplification sources, such as EDFAs and semiconductor optical amplifiers (SOAs), are<br />
used to boost <strong>the</strong> power <strong>of</strong> lower-power laser sources. EDFA and SOA technologies also<br />
can amplify both single and multiple closely <strong>space</strong>d wavelengths simultaneously, which is<br />
known as WDM. With high optical gains that exceed 30 dB, EDFAs can drive <strong>the</strong> 1550-nm<br />
optical output power <strong>of</strong> a FSO system up to between 1 and 2 W. At this time, EDFAs are<br />
quite expensive, and <strong>the</strong>ir use tends to be limited to very high-end <strong>performance</strong> systems<br />
that operate at or above 1 Gbit/s. As 1550-nm technology becomes more widely used in<br />
telecommunications, it is anticipated that <strong>the</strong> costs will come down.<br />
18. Peak Output Power<br />
The peak output power refers to <strong>the</strong> maximum allowable output power <strong>of</strong> a transmission<br />
source. The peak output power value is <strong>of</strong>ten important in pulsed laser operations, in which<br />
a high-power laser pulse is required for a short period <strong>of</strong> time. In general, <strong>the</strong> peak power<br />
and pulse repetition frequency are closely tied, and high peak power is usually coupled<br />
with a low pulse repetition frequency to prevent damage to <strong>the</strong> device. However, for most<br />
communication systems, <strong>the</strong> peak power capability <strong>of</strong> a laser source is irrelevant because<br />
most applications do not use high-power pulse/low duty cycle modulation schemes but<br />
instead typically rely on 50% duty cycle modulation schemes. For most FSO systems, <strong>the</strong><br />
peak power rating would refer to <strong>the</strong> transmit power <strong>of</strong> a “1” and would be approximately<br />
twice <strong>the</strong> average output power <strong>of</strong> <strong>the</strong> signal.<br />
19. Average Output Power<br />
The average output power <strong>of</strong> a transmission system is a key factor in determining <strong>the</strong> system<br />
link margin because, as with <strong>the</strong> majority <strong>of</strong> digital fiber communication systems, most<br />
FSO systems are digital in terms <strong>of</strong> <strong>the</strong>ir transmission <strong>of</strong> bits across <strong>the</strong> link. These communication<br />
systems typically use a coding scheme (e.g., 8B/10B coding) to ensure that an<br />
approximately equal number <strong>of</strong> digital “1s” and “0s” are transmitted, thus maintaining a<br />
50% duty cycle. In this case, where peak power is transmitted for a “1” and zero power is<br />
transmitted for a “0,” <strong>the</strong> average power is approximately half <strong>the</strong> peak power. This average<br />
power is what is used for eye-safety classification and is typically used to define <strong>the</strong><br />
transmit power <strong>of</strong> a FSO transceiver.<br />
20. Beam Divergence<br />
One <strong>of</strong> <strong>the</strong> primary advantages <strong>of</strong> FSO transmission is <strong>the</strong> narrowness <strong>of</strong> <strong>the</strong> transmitted<br />
laser beam that can be achieved with well-designed <strong>optics</strong>. This narrow beam allows for<br />
secure and efficient transmission with a major fraction <strong>of</strong> <strong>the</strong> transmitted power being collected<br />
<strong>by</strong> <strong>the</strong> receiver. For our purposes here, we will restrict our discussion to circular<br />
© 2003 Optical Society <strong>of</strong> America<br />
JON 2330 June 2003 / Vol. 2, No. 6 / JOURNAL OF OPTICAL NETWORKING 187
Gaussian or “top-hat” beam pr<strong>of</strong>iles. However, it is not necessary for <strong>the</strong> beam from a FSO<br />
system to have ei<strong>the</strong>r <strong>of</strong> <strong>the</strong>se characteristics.<br />
Typically, <strong>the</strong> optical beam width from a FSO transceiver will be relatively wide (2–10mrad<br />
divergence, which is equivalent to a beam spread <strong>of</strong> 2–10 m at 1 km), as is generally<br />
<strong>the</strong> case in nontracking applications. For such applications, <strong>the</strong> system must compensate<br />
for any platform motion <strong>by</strong> having a beam width and total FOV (TFOV) that is larger<br />
than ei<strong>the</strong>r transceiver’s anticipated platform motion. If <strong>the</strong> system provides for automatic<br />
pointing and tracking, <strong>the</strong>n <strong>the</strong> beam width can be narrowed significantly (typically, 0.05–<br />
1.0 mrad <strong>of</strong> divergence, which is equivalent to a beam spread <strong>of</strong> 5 cm to 1 m at 1 km),<br />
fur<strong>the</strong>r improving link margin and providing <strong>the</strong> system with greater link margin to combat<br />
adverse wea<strong>the</strong>r conditions. However, <strong>the</strong> cost for <strong>the</strong> additional tracking feature can be<br />
significant.<br />
21. Beam Propagation Models (Gaussian Beams, 1/e, 1/e 2 , and FWHA)<br />
The amount <strong>of</strong> beam divergence and <strong>the</strong> shape <strong>of</strong> <strong>the</strong> optical beam at <strong>the</strong> location <strong>of</strong> <strong>the</strong> receiving<br />
terminal are important criteria in <strong>the</strong> evaluation <strong>of</strong> system <strong>performance</strong>—especially<br />
in terms <strong>of</strong> <strong>the</strong> link margin.<br />
Two types <strong>of</strong> beams are normally used in FSO: <strong>the</strong> Gaussian beam and <strong>the</strong> top-hat<br />
beam. The typical Gaussian beam is a natural <strong>by</strong>product <strong>of</strong> <strong>the</strong> laser resonant cavity. Most<br />
lasers produce Gaussian beams that have point-source spatial qualities. For instance, singlemode<br />
lasers produce <strong>the</strong> narrowest <strong>of</strong> Gaussian beams, and <strong>the</strong> output <strong>of</strong> <strong>the</strong> single-mode<br />
fiber coupled to such lasers also is Gaussian.<br />
For a Gaussian beam, <strong>the</strong> intensity at a transverse or radial distance (ρ) from <strong>the</strong> center<br />
<strong>of</strong> <strong>the</strong> beam is given below for a beam width, β, at a wavelength, λ, and beam waist, ωe:<br />
J(W/m 2 � J0/z 2 )exp[−2(ρ/βz)2],<br />
β = (2/π)(λ/ωe).<br />
The power in <strong>the</strong> beam radius <strong>of</strong> ρ0 is given <strong>by</strong><br />
P(W) = 1 − exp[−2(ρ0/βz) 2 ].<br />
When <strong>the</strong> radial amplitude declines to 0.135 (∼1/e 2 ) <strong>of</strong> its peak intensity, 86% <strong>of</strong> <strong>the</strong><br />
energy is encircled in this radius, thus defining <strong>the</strong> 1/e 2 beam width, β. This is <strong>the</strong> fundamental<br />
parameter <strong>of</strong> a Gaussian beam pr<strong>of</strong>ile. Alternatively, <strong>the</strong> beam can also be characterized<br />
to where its radial amplitude declines to 0.368 (1/e) <strong>of</strong> its peak intensity. A third<br />
alternative is to characterize <strong>the</strong> beam <strong>by</strong> <strong>the</strong> full-width at half-amplitude (FWHA), which<br />
for <strong>the</strong> Gaussian beam is 0.589 ∗ β. The gradual fall<strong>of</strong>f <strong>of</strong> <strong>the</strong> Gaussian beam inherently<br />
results in weaker link <strong>performance</strong> at <strong>the</strong> edges <strong>of</strong> <strong>the</strong> beam for nontracking FSO systems.<br />
Ano<strong>the</strong>r shortcoming <strong>of</strong> <strong>the</strong> Gaussian beam pr<strong>of</strong>ile is that its peak intensity limits <strong>the</strong><br />
total power output when transmitter emissions must meet specific eye-safety classification<br />
levels (e.g., Class 1 or 1M). Depending upon <strong>the</strong> wavelength, <strong>the</strong> peak power must<br />
be maintained below a threshold value. However, this peak, or <strong>the</strong> on-axis intensity, <strong>the</strong>n<br />
determines <strong>the</strong> total power and <strong>the</strong>refore <strong>the</strong> link margin <strong>of</strong> <strong>the</strong> Gaussian beam system.<br />
Thus <strong>the</strong> Gaussian beam characteristic limits <strong>the</strong> power capable <strong>of</strong> being projected onto <strong>the</strong><br />
target.<br />
An advantage <strong>of</strong> a Gaussian beam pr<strong>of</strong>ile is that in a tracking FSO system, <strong>the</strong> beam<br />
can be di<strong>the</strong>red to provide tracking information via <strong>the</strong> communications detector, obviating<br />
<strong>the</strong> need for an additional tracking sensor and <strong>the</strong>refore additional cost. This functionality<br />
is also possible with a top-hat beam, discussed below, but with less sensitivity.<br />
© 2003 Optical Society <strong>of</strong> America<br />
JON 2330 June 2003 / Vol. 2, No. 6 / JOURNAL OF OPTICAL NETWORKING 188
An alternative to a Gaussian beam pr<strong>of</strong>ile is a top-hat beam, which has a virtually uniform<br />
power distribution over its entire wave front. The projection <strong>of</strong> such a beam typically<br />
requires a finite source size, which can be accomplished <strong>by</strong> use <strong>of</strong> a multimode optical fiber<br />
as a power transmit source. An in-focus transmitter, in which <strong>the</strong> exit aperture <strong>of</strong> <strong>the</strong> fiber is<br />
at <strong>the</strong> focus <strong>of</strong> <strong>the</strong> output lens, can produce a finite beam size that has a nearly flat intensity<br />
distribution across <strong>the</strong> majority <strong>of</strong> <strong>the</strong> beam. A beam <strong>of</strong> this pr<strong>of</strong>ile is better characterized<br />
<strong>by</strong> its FWHA (as opposed to its 1/e or 1/e 2 width) inasmuch as <strong>the</strong> intensity goes through<br />
a rapid transition at this diameter and maintains peak intensity over <strong>the</strong> widest possible<br />
angle or divergence. The resulting top-hat beam maximizes <strong>the</strong> total energy carried <strong>by</strong> <strong>the</strong><br />
beam under eye-safe conditions. For most good top-hat designs, <strong>the</strong> FWHA is ∼ 0.9 ∗ β,<br />
which provides excellent area coverage for platform motion while maximizing <strong>the</strong> total<br />
beam power for <strong>the</strong> particular eye-safe threshold. The real challenge with <strong>the</strong> top-hat design<br />
is filling <strong>the</strong> modes <strong>of</strong> <strong>the</strong> fiber to produce a beam that is as wide as <strong>the</strong> fiber’s physical<br />
core diameter.<br />
It should be noted that at ranges in which <strong>the</strong> diameter <strong>of</strong> <strong>the</strong> transmitted beam has<br />
expanded to <strong>the</strong> point where <strong>the</strong> spot is several times larger than <strong>the</strong> receive aperture, <strong>the</strong>re<br />
is little difference between <strong>the</strong> received beam pr<strong>of</strong>ile <strong>of</strong> a Gaussian beam and <strong>of</strong> a top-hat<br />
beam.<br />
In conclusion, it is important to understand <strong>the</strong> role <strong>of</strong> beam pr<strong>of</strong>ile characteristics in<br />
comparing <strong>the</strong> <strong>performance</strong> <strong>of</strong> FSO systems. A Gaussian-like beam with a 1/e 2 beam width<br />
is characterized <strong>by</strong> a relatively high on-axis power intensity that falls <strong>of</strong>f sharply toward <strong>the</strong><br />
edges <strong>of</strong> <strong>the</strong> beam. This can affect <strong>performance</strong> if <strong>the</strong> system does not incorporate tracking<br />
or is installed on a platform that experiences a considerable amount <strong>of</strong> sway. In contrast, a<br />
top-hat beam pr<strong>of</strong>ile has lower on-axis beam intensity and, because <strong>of</strong> <strong>the</strong> relatively constant<br />
power distribution in a radial direction, is better suited to compensate for building<br />
sway. All <strong>the</strong> above beam pr<strong>of</strong>ile characteristics also are valid for systems that use an active<br />
tracking mechanism.<br />
22. Single- and Multiple-Aperture FSO System Designs<br />
FSO systems require some type <strong>of</strong> optical system to receive and transmit <strong>the</strong> optical signals.<br />
Transceivers can use <strong>the</strong> same optical system for both transmit and receive (common aperture),<br />
but typically, separate optical systems are used for transmit and receive functionality.<br />
In ei<strong>the</strong>r case, it is possible for <strong>the</strong> optical systems to incorporate more than one aperture<br />
for ei<strong>the</strong>r or both transmit and receive functions.<br />
There are several advantages to using a multiple-aperture design, including greater resistance<br />
to complete blockage, better scintillation compensation, and inherent redundancy.<br />
However, in comparing systems, it is important to take into account <strong>the</strong> optical system aperture<br />
size inasmuch as a single large aperture (for transmit and/or receive) may <strong>of</strong>fer equal<br />
or better <strong>performance</strong> than several smaller apertures in <strong>the</strong> same “footprint.”<br />
An advantage <strong>of</strong> a multiple-aperture approach is that <strong>the</strong> potential for <strong>the</strong> temporary<br />
blockage <strong>of</strong> <strong>the</strong> beam <strong>by</strong> obstructions (e.g., birds) is significantly minimized because <strong>the</strong><br />
likelihood that all beams would be blocked is drastically reduced. In addition, from an<br />
operational perspective, using multiple apertures with multiple lasers on <strong>the</strong> transmission<br />
side can provide redundancy <strong>of</strong> <strong>the</strong> transmission path in <strong>the</strong> event that a laser source should<br />
fail. Most important, from an atmospherics perspective, a multiple-aperture approach can<br />
be very beneficial in <strong>the</strong> reduction <strong>of</strong> scintillation (heat shimmer). Minimizing <strong>the</strong> effect <strong>of</strong><br />
scintillation is especially important when FSO systems are installed over longer distances.<br />
A disadvantage <strong>of</strong> a multiple-aperture approach is that it adds complexity because <strong>the</strong><br />
light must be effectively coupled onto one or more receivers when multiple receive <strong>optics</strong><br />
are used. In addition, it can be quite difficult to effectively coalign multiple transmit<br />
© 2003 Optical Society <strong>of</strong> America<br />
JON 2330 June 2003 / Vol. 2, No. 6 / JOURNAL OF OPTICAL NETWORKING 189
and/or receive apertures and maintain that alignment over a wide temperature range. Fur<strong>the</strong>rmore,<br />
<strong>the</strong> addition <strong>of</strong> a tracking system can become more complicated when multiple<br />
apertures are used because it is unlikely that <strong>the</strong>re will be a shared portion <strong>of</strong> <strong>the</strong> optical<br />
path where a single steering element will be able to steer all <strong>the</strong> transmit and receive beams<br />
simultaneously. This complexity can increase <strong>the</strong> overall system cost and, depending on<br />
<strong>the</strong> application, <strong>the</strong> advantage <strong>of</strong> using multiple apertures might not be justifiable.<br />
23. Receivers and Material Systems<br />
Compared with transmitters, receiver choices are much more limited. The two most common<br />
detector material systems used in <strong>the</strong> near-IR spectral range are based on Si or indium<br />
gallium arsenide (InGaAs) technology. Germanium is ano<strong>the</strong>r material system that covers<br />
<strong>the</strong> operating wavelength range <strong>of</strong> commercially available FSO systems. However, germanium<br />
technology is not used very <strong>of</strong>ten because <strong>of</strong> <strong>the</strong> high dark current values <strong>of</strong> this<br />
material. All <strong>the</strong>se materials have a ra<strong>the</strong>r broad spectral response in wavelength, and, unlike<br />
lasers, <strong>the</strong>y are not tuned toward a specific wavelength. If <strong>the</strong>re is a need to detect a<br />
specific wavelength, as, for example, in WDM systems, external wavelength filters must be<br />
incorporated into <strong>the</strong> design.<br />
24. Short-Wavelength Detectors<br />
Si is <strong>the</strong> most commonly used detector material in <strong>the</strong> visible and near-IR wavelength range.<br />
Si technology is quite mature, and Si receivers can detect extremely low levels <strong>of</strong> light. As<br />
with <strong>the</strong> majority <strong>of</strong> wideband detector material, Si has a wavelength-dependent spectral<br />
response, which must be matched to <strong>the</strong> operation wavelength <strong>of</strong> <strong>the</strong> transmitter. Detectors<br />
based on Si typically have a spectral response maximum sensitivity around 850 nm, making<br />
Si detectors ideal for use in conjunction with short-wavelength VCSELs operating at 850<br />
nm. However, Si sensitivity drops <strong>of</strong>f dramatically for wavelengths beyond 1 μm. As a<br />
result, 1100 nm marks <strong>the</strong> wavelength cut<strong>of</strong>f for <strong>the</strong> use <strong>of</strong> Si for light detection, and it<br />
cannot be used as a detector material beyond this wavelength range. Si detectors can operate<br />
at very high bandwidth; a recent application at 10 Gbit/s has been commercialized for use<br />
in short-wavelength 850-nm, 10-GigE systems.<br />
Lower-bandwidth (1-Gbit/s) Si PIN (Si-PIN) and Si APD (Si-APD) detectors are<br />
widely available. Si-PIN detectors with integrated transimpedance amplifiers (TIAs) also<br />
are quite common. In <strong>the</strong>se detectors, sensitivity is a function <strong>of</strong> signal modulation bandwidth,<br />
which decreases as <strong>the</strong> detection bandwidth increases. Typical sensitivity values for<br />
a Si-PIN diode are around −34 dBm at 155 Mbit/s. Si-APDs are far more sensitive, owing<br />
to an internal amplification (avalanche) process. Therefore, Si-APD detectors are highly<br />
useful for detection in FSO systems. Sensitivity values for higher-bandwidth applications<br />
can be as low as −55 dBm at speeds <strong>of</strong> several megabits/s, −52 dBm at 155 Mbit/s, or −46<br />
dBm at 622 Mbit/s. Si detectors can be quite large in size (e.g., 0.2 mm × 0.2 mm) and still<br />
operate at higher bandwidths. This feature minimizes losses when light is focused on <strong>the</strong><br />
detector and ei<strong>the</strong>r a larger-diameter lens or a reflective parabolic mirror is used.<br />
25. Long-Wavelength Detectors<br />
InGaAs is <strong>the</strong> most commonly used detector material for <strong>the</strong> longer wavelength range. Similar<br />
to Si, InGaAs is a wideband detector material, and <strong>the</strong> spectral response or underlying<br />
quantum efficiency depends on <strong>the</strong> detection wavelength. Over <strong>the</strong> past decade, <strong>the</strong> <strong>performance</strong><br />
<strong>of</strong> InGaAs detectors with regard to sensitivity, bandwidth capabilities, and <strong>the</strong> development<br />
<strong>of</strong> 1550-nm fiber optic-technology has been continually improving. Nearly 100%<br />
<strong>of</strong> all longer-wavelength fiber-optic systems use InGaAs as a detector material. Commercially,<br />
InGaAs detectors are optimized for operation at ei<strong>the</strong>r 1310 or 1550 nm. Because <strong>of</strong><br />
© 2003 Optical Society <strong>of</strong> America<br />
JON 2330 June 2003 / Vol. 2, No. 6 / JOURNAL OF OPTICAL NETWORKING 190
<strong>the</strong> drastic decrease in sensitivity toward <strong>the</strong> shorter wavelength range, InGaAs detectors<br />
are typically not used in <strong>the</strong> 850-nm wavelength range.<br />
The primary benefit <strong>of</strong> InGaAs detectors is <strong>the</strong>ir extremely high bandwidth capability<br />
combined with a high spectral response at 1550 nm. The majority <strong>of</strong> InGaAs receivers are<br />
based on PIN or APD technology. As with Si, InGaAs APDs are far more sensitive because<br />
<strong>of</strong> an internal amplification (avalanche) process. Sensitivity values for higher-bandwidth<br />
applications can be as low as −46 dBm at 155 Mbit/s, or −36 dBm at 1.25 Gbit/s; although,<br />
InGaAs detectors operating at higher speed are typically smaller in size than <strong>the</strong>ir<br />
Si counterparts. This makes <strong>the</strong> light coupling process more challenging.<br />
Table 2 presents some <strong>of</strong> <strong>the</strong> more common detector materials used in FSO systems and<br />
<strong>the</strong>ir basic physical properties.<br />
Table 2. Selected Detector Material System and Basic Physical Properties<br />
Material/Structure<br />
Wavelength<br />
(nm)<br />
Responsivity<br />
(A/W) Gain<br />
Silicon PIN 300 – 1100 0.5 1<br />
Germanium PIN 500 – 1800 0.7 1<br />
InGaAs PIN 1000 – 1700 0.9 1<br />
Silicon APD 400 – 1000 77 150<br />
Germanium APD 800 – 1300 7 10<br />
InGaAs APD 1000 – 1700 9 10<br />
In summary, it is important to remember that detector <strong>performance</strong> plays a dominant<br />
role in <strong>the</strong> overall design <strong>of</strong> a FSO system. Selecting <strong>the</strong> appropriate transmitter–receiver<br />
combination can compensate for potential shortcomings, owing to <strong>the</strong> use <strong>of</strong> lower-power<br />
transmission sources.<br />
26. Laser Safety<br />
Laser safety is an important issue. The primary safety concern is <strong>the</strong> potential exposure <strong>of</strong><br />
<strong>the</strong> eye or skin to <strong>the</strong> beam. High-power laser beams can cause injury to skin, but risks<br />
<strong>of</strong> injury to <strong>the</strong> eye are more significant because <strong>of</strong> <strong>the</strong> eye’s ability to focus light and<br />
<strong>the</strong>re<strong>by</strong> concentrate optical energy. In general, any laser that is considered to be “eye-safe”<br />
is also considered to be “skin-safe.” Like sunlight, laser light arrives in parallel rays, which,<br />
depending upon wavelength, <strong>the</strong> eye focuses to a point on <strong>the</strong> retina, <strong>the</strong> layer <strong>of</strong> cells that<br />
responds to light. Just as staring at <strong>the</strong> Sun can damage vision, exposure to a laser beam <strong>of</strong><br />
sufficient power can cause eye injury.<br />
The specific wavelength is important because only certain wavelengths— between approximately<br />
0.4 and 1.4 µm—are focused <strong>by</strong> <strong>the</strong> eye onto <strong>the</strong> retina. O<strong>the</strong>r wavelengths<br />
tend to be absorbed <strong>by</strong> <strong>the</strong> front part <strong>of</strong> <strong>the</strong> eye (<strong>the</strong> cornea) before <strong>the</strong> energy is focused<br />
and concentrated. The absorption <strong>of</strong> <strong>the</strong> eye varies with wavelength (see Fig. 4). With respect<br />
to IR radiation, <strong>the</strong> absorption coefficient <strong>of</strong> <strong>the</strong> cornea is much higher for longer<br />
wavelengths (>1.4 µm) than for shorter wavelengths. As such, damage from <strong>the</strong> UV and<br />
visible radiation <strong>of</strong> sunlight is more likely than from longer wavelengths located in <strong>the</strong><br />
IR spectrum. Eye response also differs within <strong>the</strong> range that penetrates <strong>the</strong> eye (400–1400<br />
nm) because <strong>the</strong> eye has a natural aversion response, which makes it turn away from a<br />
bright visible light. Wavelengths longer than 0.7 µm do not trigger an aversion response,<br />
because <strong>the</strong>y are invisible. Although IR light can damage <strong>the</strong> surface <strong>of</strong> <strong>the</strong> eye, <strong>the</strong> damage<br />
threshold is higher than that for UV light.<br />
© 2003 Optical Society <strong>of</strong> America<br />
JON 2330 June 2003 / Vol. 2, No. 6 / JOURNAL OF OPTICAL NETWORKING 191
Fig. 4. Response/absorption <strong>of</strong> <strong>the</strong> human eye at various wavelengths.<br />
27. Laser Safety Standards<br />
___ Photopic eye<br />
response<br />
------ Total absorption<br />
across near-IR<br />
wavelengths<br />
Many countries have developed or adopted laser safety standards that apply to all laser<br />
products sold within <strong>the</strong>ir borders. These safety standards generally fall into two categories:<br />
those that address <strong>the</strong> safety <strong>of</strong> laser equipment and those that focus on <strong>the</strong> safe use <strong>of</strong><br />
lasers. In addition, some entities have <strong>the</strong> authority to create legal standards, while o<strong>the</strong>rs set<br />
laser safety standards and establish guidelines that are not enforceable <strong>by</strong> law. In general,<br />
laser safety standards include provisions for automatic or manual safety controls; warning<br />
labels and signs; training for operation, maintenance, and service; and use <strong>of</strong> protective<br />
equipment. A list <strong>of</strong> <strong>the</strong> principal laser safety standards organizations is presented below.<br />
Center for Devices and Radiological Health (CDRH). CDRH is an agency within <strong>the</strong><br />
United States (U.S.) Food and Drug Administration (FDA). It establishes regulatory standards<br />
for lasers and laser equipment that are enforceable <strong>by</strong> law (21 CFR 1040).<br />
International Electrotechnical Commission (IEC). IEC publishes international<br />
standards related to all electrical equipment, including lasers and laser equipment<br />
(IEC60825-1). These standards are not automatically enforceable <strong>by</strong> law, and <strong>the</strong> decision<br />
to adopt and enforce IEC standards is at <strong>the</strong> discretion <strong>of</strong> individual countries.<br />
American National Standards Institute (ANSI). ANSI is a U.S. organization that publishes<br />
standards for laser use (ANSI Z136.1). ANSI standards are not enforceable <strong>by</strong> law<br />
but do form <strong>the</strong> basis for <strong>the</strong> U.S. Occupational Safety and Health Administration (OSHA)<br />
legal standards, as well as comparable legal standards that have been adopted <strong>by</strong> various<br />
state regulatory agencies.<br />
European Committee for Electrotechnical Standardization (CENELEC). CEN-<br />
ELEC is an organization that establishes electrotechnical standards based on recommendations<br />
made <strong>by</strong> 19 European member nations. CENELEC standards are not directly enforceable<br />
<strong>by</strong> law but, as with IEC standards, are <strong>of</strong>ten integrated into <strong>the</strong> legal requirements<br />
developed <strong>by</strong> individual countries.<br />
Laser Institute <strong>of</strong> America (LIA). LIA is an organization that promotes <strong>the</strong> safe use <strong>of</strong><br />
lasers, provides laser safety information, and sponsors laser conferences, symposia, publications,<br />
and training courses.<br />
© 2003 Optical Society <strong>of</strong> America<br />
JON 2330 June 2003 / Vol. 2, No. 6 / JOURNAL OF OPTICAL NETWORKING 192
Over <strong>the</strong> years, <strong>the</strong> above organizations have developed a mechanism for classifying<br />
lasers according to <strong>the</strong>ir type and power. Although <strong>the</strong> specific criteria vary slightly, <strong>the</strong>se<br />
classifications have generally been divided into four groups, Class 1 through Class 4, with<br />
Class 1 being <strong>the</strong> least powerful and Class 4 being <strong>the</strong> most powerful. However, <strong>the</strong> fact<br />
that all <strong>of</strong> <strong>the</strong>se organizations had adopted slightly different standards and classification<br />
schemes was somewhat overwhelming for companies wishing to do business in <strong>the</strong> global<br />
marketplace. To help remedy this situation, IEC, CDRH, and ANSI are in <strong>the</strong> process<br />
<strong>of</strong> harmonizing <strong>the</strong>ir classification methods and product requirements. On 27 May 2001,<br />
CDRH issued Laser Notice 50 that <strong>of</strong>ficially allows products that comply with IEC60825-1,<br />
Amendment 2, to be introduced into <strong>the</strong> United States. This notice is a first step in a process<br />
that is expected to result in <strong>the</strong> CDRH amending its own regulations to be consistent with<br />
<strong>the</strong> new IEC standards.<br />
Under <strong>the</strong> new IEC standard, specific laser classes were identified, and each class assigned<br />
specific labeling and warning instructions. The document outlines installation compliance<br />
requirements based on <strong>the</strong> level <strong>of</strong> emitted power, defines specific hazardous zones<br />
in front <strong>of</strong> <strong>the</strong> transmit aperture that must be cleared for eye-safe viewing, and restricts <strong>the</strong><br />
installation <strong>of</strong> certain high-power laser systems in areas that are easily accessible to <strong>the</strong><br />
public. Within <strong>the</strong> new classification scheme, Class 1 and Class 1M systems are considered<br />
to be eye-safe for viewing at a close distance without (Class 1M) or even with (Class 1) an<br />
optical instrument such as binoculars.<br />
IEC is in <strong>the</strong> process <strong>of</strong> writing a new standard, IEC60825-12 (in addition to <strong>the</strong><br />
IEC60825-1, Amendment 2), which is intended specifically to cover FSO system classification<br />
and use. This new standard is currently in draft form and is expected to be <strong>of</strong>ficially<br />
released in 2003.<br />
At this point, it is important to mention that <strong>the</strong> laser classification (e.g., Class 1, Class<br />
1M, Class 3B) and not <strong>the</strong> transmission wavelength itself determines <strong>the</strong> laser classification<br />
standard. In o<strong>the</strong>r words, <strong>the</strong>re is no wavelength that is ei<strong>the</strong>r inherently eye-safe or inherently<br />
dangerous to <strong>the</strong> eye. It is fundamentally possible to design an eye-safe laser system<br />
that operates at any given wavelength; output power levels (and not <strong>the</strong> wavelength itself)<br />
determine <strong>the</strong> laser classification. It also is important to understand that <strong>the</strong> new regulation<br />
addresses <strong>the</strong> power density in front <strong>of</strong> <strong>the</strong> transmit aperture ra<strong>the</strong>r than <strong>the</strong> absolute power<br />
created <strong>by</strong> a laser diode inside <strong>the</strong> equipment. For example, <strong>the</strong> laser diode inside <strong>the</strong> FSO<br />
equipment can actually be Class 3B even though <strong>the</strong> system itself is considered to be a<br />
Class 1 or 1M laser product if <strong>the</strong> light is launched from a large-diameter lens that spreads<br />
out <strong>the</strong> radiation over a large area before it enters <strong>the</strong> <strong>space</strong> in front <strong>of</strong> <strong>the</strong> aperture. The<br />
new regulation also states that a Class 1M laser system operating at 1550 nm is allowed<br />
to transmit approximately 55 times more power than a system operating in <strong>the</strong> shorter IR<br />
wavelength range, such as 850 nm, when both have <strong>the</strong> same size aperture lens. Indeed, it is<br />
possible to increase <strong>the</strong> lens aperture size to allow higher laser power emission at a shorter<br />
wavelength. Ano<strong>the</strong>r method <strong>of</strong> maintaining a Class 1 or 1M laser safety classification is<br />
to use multiple large transmission apertures.<br />
The following discussion focuses on eye safety related to Class 1 and Class 1M laser<br />
systems inasmuch as <strong>the</strong>y are <strong>the</strong> only ones that operate below <strong>the</strong> maximum permissible<br />
exposure (MPE) levels for naked-eye exposure and are thus suitable for wide-scale deployment.<br />
The specific features <strong>of</strong> each <strong>of</strong> <strong>the</strong>se two classifications are summarized below.<br />
Class 1. Class 1 lasers are safe under reasonably foreseeable operating conditions, including<br />
<strong>the</strong> use <strong>of</strong> optical instruments for intrabeam viewing. Class 1 systems can be installed<br />
in any location without restriction.<br />
© 2003 Optical Society <strong>of</strong> America<br />
JON 2330 June 2003 / Vol. 2, No. 6 / JOURNAL OF OPTICAL NETWORKING 193
Class 1M. Class 1M laser systems operate in <strong>the</strong> wavelength range from 302.5 to 4000<br />
nm, which is safe under reasonably foreseeable conditions but may be hazardous if <strong>the</strong> user<br />
employs optical instruments within some portion <strong>of</strong> <strong>the</strong> beam path. As a result, Class 1M<br />
systems should only be installed in locations where <strong>the</strong> unsafe use <strong>of</strong> optical aids can be<br />
prevented.<br />
Table 3 presents permissible power levels according to <strong>the</strong> IEC standard (IEC60825-1,<br />
Amendment 2) for Class 1 and 1M laser systems for both <strong>the</strong> 850- and 1550-nm wavelengths.<br />
Table 3. 3. IEC IEC 60825-1, Amendment 2 Laser Power Levels<br />
Laser<br />
Classification Power (mW)<br />
850-nm Wavelength a<br />
Class 1 0.78 b<br />
Class 1M 0.78 c<br />
1550-nm Wavelength<br />
Class 1 10<br />
Aperture Size<br />
(mm) Distance (mm)<br />
Power Density<br />
(mW/cm 2 )<br />
7 14 2.03<br />
50 2000 0.04<br />
7 100 2.03<br />
7 14 26.0<br />
25 2000 2.04<br />
Class 1M 10 3.5 100 104<br />
a It is assumed here that <strong>the</strong> laser behaves as a point source. These power limits increase for<br />
extended sources that are focused to larger spots on <strong>the</strong> retina.<br />
b For sources with angular subtense < 0.21 mrad.<br />
c For sources with angular subtense < 1.5 mrad.<br />
28. Atmospheric Effects and Availability<br />
The link equation for a FSO system is actually quite simple at a high level (if we exclude<br />
optical efficiencies, detector noises, and so on). The equation is<br />
where<br />
P = power,<br />
Preceived = Ptransmitted ∗<br />
d1 = transmit aperture diameter (m),<br />
d2 = receive aperture diameter (m),<br />
d 2 2<br />
� d + 1 (D ∗ R) � 2 ∗ 10(−a∗R/10) , (1)<br />
D = beam divergence (mrad)(1/e for Gaussian beams; FWHA for flat top beams),<br />
R = range (km),<br />
a = atmospheric attenuation factor (dB/km).<br />
In Eq. (1), <strong>the</strong> amount <strong>of</strong> received power is proportional to <strong>the</strong> amount <strong>of</strong> power transmitted<br />
and <strong>the</strong> area <strong>of</strong> <strong>the</strong> collection aperture but inversely proportional to <strong>the</strong> square <strong>of</strong> <strong>the</strong> beam<br />
divergence and <strong>the</strong> square <strong>of</strong> <strong>the</strong> link range. It is also inversely proportional to <strong>the</strong> exponential<br />
<strong>of</strong> <strong>the</strong> product <strong>of</strong> <strong>the</strong> atmospheric attenuation coefficient (in units <strong>of</strong> 1/distance) times<br />
<strong>the</strong> link range.<br />
© 2003 Optical Society <strong>of</strong> America<br />
JON 2330 June 2003 / Vol. 2, No. 6 / JOURNAL OF OPTICAL NETWORKING 194
If we examine Eq. (1), <strong>the</strong> variables that can be controlled are <strong>the</strong> transmit power, <strong>the</strong><br />
receive aperture size, <strong>the</strong> beam divergence, and <strong>the</strong> range <strong>of</strong> <strong>the</strong> link. The atmospheric<br />
attenuation coefficient is uncontrollable in an outdoor environment and is roughly independent<br />
<strong>of</strong> wavelength in heavy attenuation conditions. Unfortunately, <strong>the</strong> received power is<br />
exponentially dependent on <strong>the</strong> product <strong>of</strong> <strong>the</strong> atmospheric attenuation coefficient and <strong>the</strong><br />
range; in real atmospheric situations, for applications with required availabilities <strong>of</strong> 99.9%<br />
or higher, this term overwhelms everything else in <strong>the</strong> equation.<br />
A key issue in <strong>the</strong> deployment <strong>of</strong> FSO systems is availability, which is dependent on a<br />
variety <strong>of</strong> factors, including equipment reliability and network design (e.g., redundancy),<br />
but <strong>the</strong>se are well known and fairly quantifiable. The biggest unknown is <strong>the</strong> effect <strong>of</strong> atmospheric<br />
attenuation. Although most major airports around <strong>the</strong> world collect and maintain<br />
visibility statistics (which can be converted to attenuation coefficients), <strong>the</strong> spatial scale <strong>of</strong><br />
visibility measurements is rough (generally 100 m or so), and <strong>the</strong> temporal scale is infrequent<br />
(hourly in most cases). As a result, estimates <strong>of</strong> availability <strong>of</strong> 99.9% or better are<br />
difficult to obtain. Thus, airport databases are generally only marginally useful in accurately<br />
and reliably determining grades <strong>of</strong> service. As a result, FSO manufacturers have taken it<br />
upon <strong>the</strong>mselves to ga<strong>the</strong>r more reliable atmospheric data <strong>by</strong> using sensitive instruments<br />
such as nephelometers, visibility meters, and path transmissometers.<br />
29. Link Budgets<br />
One <strong>of</strong> <strong>the</strong> key methods for determining how well a FSO link will perform is to calculate<br />
a link budget. At a minimum, a link budget is used to predict how much margin, or extra<br />
power, will be available in a link under any particular set <strong>of</strong> operating conditions. This<br />
margin can <strong>the</strong>n be integrated with a model <strong>of</strong> atmospheric attenuation to calculate expected<br />
availability on <strong>the</strong> basis <strong>of</strong> losses from both scattering and scintillation. Typically, a FSO<br />
link budget includes inputs for transmit power, receive sensitivity, optical system losses,<br />
geometric losses, and mis-point or alignment loss.<br />
Transmit power is <strong>the</strong> amount <strong>of</strong> optical energy transmitted <strong>by</strong> <strong>the</strong> FSO system; receive<br />
sensitivity is <strong>the</strong> minimum amount <strong>of</strong> optical energy that must be received <strong>by</strong> <strong>the</strong> FSO<br />
system for a specified error rate. Both <strong>of</strong> <strong>the</strong>se are typically measured as ei<strong>the</strong>r peak or<br />
average power. In addition, both can be measured ei<strong>the</strong>r at <strong>the</strong> transmit or receive apertures<br />
or at <strong>the</strong> lasers or detectors. If <strong>the</strong> measurements are taken immediately in front <strong>of</strong> <strong>the</strong><br />
detectors or lasers, it is necessary to factor in <strong>the</strong> additional optical system losses that will<br />
occur as <strong>the</strong> optical energy passes through <strong>the</strong> system. Optical system losses include scatter,<br />
surface reflections, absorption, and overfill losses.<br />
Geometric losses are those losses that occur due to <strong>the</strong> spreading <strong>of</strong> <strong>the</strong> transmitted<br />
beam between <strong>the</strong> transmitter and <strong>the</strong> receiver. Typically, <strong>the</strong> beam spreads to a size larger<br />
than <strong>the</strong> receive aperture, and this “overfill” energy is lost. In general, larger receive apertures<br />
or smaller transmit divergences result in less geometric loss for a given range. For a<br />
uniform transmit power distribution with a nonobscured transmitter or receiver, geometric<br />
losses can be approximated with <strong>the</strong> following formula:<br />
�<br />
Geometric loss (dB) = 10∗log<br />
Receive Aperture Diameter (m)<br />
TX Aperture (m) + [Range (km) ∗ Divergence (mrad)]<br />
(2)<br />
Equation (2) can also be used to approximate <strong>the</strong> geometric losses for a Gaussian power<br />
distribution <strong>by</strong> use <strong>of</strong> <strong>the</strong> 1/e divergence but with slightly less accuracy because it assumes<br />
a uniform power distribution. It should also be noted that Eq. (2) is appropriate for FSO<br />
systems only and is not typically used in microwave link budgets where geometric loss is<br />
based upon assumptions for transmit beam diffraction as limited <strong>by</strong> <strong>the</strong> antenna.<br />
© 2003 Optical Society <strong>of</strong> America<br />
JON 2330 June 2003 / Vol. 2, No. 6 / JOURNAL OF OPTICAL NETWORKING 195<br />
� 2<br />
.
Mis-point loss represents <strong>the</strong> imperfect alignment <strong>of</strong> <strong>the</strong> transmitter and <strong>the</strong> receiver<br />
and results from <strong>the</strong> fact that most FSO systems transmit a beam with a Gaussian power<br />
distribution and that only a portion <strong>of</strong> <strong>the</strong> beam overlaps <strong>the</strong> receiver. In general, a system<br />
is perfectly aligned when <strong>the</strong> center <strong>of</strong> <strong>the</strong> Gaussian power distribution is at <strong>the</strong> center <strong>of</strong><br />
<strong>the</strong> receiver. If this is not <strong>the</strong> case, <strong>the</strong>n <strong>the</strong> receiver may only be collecting energy from<br />
<strong>the</strong> “edges” <strong>of</strong> <strong>the</strong> beam, where <strong>the</strong> energy intensity is lower. As discussed in Section 3,<br />
mis-point loss is primarily caused <strong>by</strong> base motion. FSO systems that incorporate automatic<br />
pointing and tracking inherently have less mis-point loss because <strong>the</strong>y are constantly adjusting<br />
for optimal alignment but do experience some mis-point loss resulting from <strong>the</strong><br />
limited ability <strong>of</strong> pointing and tracking systems to correct for all types <strong>of</strong> motion.<br />
Tables 4 and 5 present simplified link budgets for nontracking and automatic tracking<br />
systems, respectively. It is interesting to note <strong>the</strong> improvement in link margin that can be<br />
obtained <strong>by</strong> use <strong>of</strong> an automatic tracking system. The tracking system reduces <strong>the</strong> residual<br />
pointing and tracking errors so that a smaller TX divergence can be used to substantially<br />
reduce <strong>the</strong> geometric link loss.<br />
Table 4. Simplified Link Budgets for a Nontracking System<br />
Table 4. Simplified Link Budgets for a Nontracking System<br />
Link Range<br />
Parameter 300 m 2000 m Comment<br />
Average laser power 10.0 dBm 10.0 dBm<br />
System loss −6.0 dB −6.0 dB Combined TX/RX terminal<br />
losses<br />
Geometric loss −27.0 dB −44.0 dB 8-mrad TX divergence;<br />
3-mrad pointing error<br />
Signal power on detector −23.0 dBm −40.0 dBm In clear air, no window loss<br />
Detector sensitivity −46.0 dBm −46.0 dBm Wavelength and data-rate<br />
dependent<br />
Clear air link margin 23.0 dB 6.0 dB For atmospherics and window<br />
loss<br />
Table 5. Simplified Link Budgets for an Automatic Tracking System<br />
Table 5. Simplified Link Budgets for an Automatic Tracking System<br />
Link Range<br />
Parameter 300 m 2000 m Comment<br />
Average laser power 10.0 dBm 10.0 dBm<br />
System loss −8.0 dB −8.0 dB Combined TX/RX terminal losses<br />
Geometric loss −4.0 dB −18.0 dB 0.5-mrad TX divergence; 0.15mrad<br />
pointing error<br />
Signal power on detector −2.0 dBm −16.0 dBm In clear air, no window loss<br />
Detector sensitivity −46.0 dBm −46.0 dBm Wavelength and data rate<br />
dependent<br />
Clear air link margin 44.0 dB 30.0 dB For atmospherics and window loss<br />
30. Metrics<br />
One <strong>of</strong> <strong>the</strong> biggest challenges faced <strong>by</strong> potential users <strong>of</strong> FSO systems is accurately comparing<br />
<strong>the</strong> relative <strong>performance</strong> <strong>of</strong> products from different manufacturers. The reason for<br />
this is that each manufacturer tends to quote slightly different versions <strong>of</strong> similar <strong>performance</strong><br />
specifications. For example, transmit power can be defined as ei<strong>the</strong>r peak or average,<br />
and transmit divergence can be defined to ei<strong>the</strong>r <strong>the</strong> 1/e, 1/e 2 , or FWHA points.<br />
© 2003 Optical Society <strong>of</strong> America<br />
JON 2330 June 2003 / Vol. 2, No. 6 / JOURNAL OF OPTICAL NETWORKING 196
As discussed in <strong>the</strong> abstract, one <strong>of</strong> our goals in this paper is to suggest a common set<br />
<strong>of</strong> metrics for FSO systems that will allow for <strong>the</strong> accurate comparison <strong>of</strong> <strong>performance</strong>. To<br />
that end, we would like to suggest that <strong>the</strong> following six metrics be used <strong>by</strong> manufacturers<br />
<strong>of</strong> FSO equipment when specifying <strong>performance</strong>.<br />
• Transmit power<br />
• Transmit beam divergence<br />
• Receive sensitivity<br />
• Receive field <strong>of</strong> view<br />
• Pointing and tracking field <strong>of</strong> regard and closed-loop bandwidth<br />
• Link margin and attenuation versus range curves<br />
By using <strong>the</strong>se six metrics, a potential end user should be able to fully evaluate <strong>the</strong> expected<br />
<strong>performance</strong> <strong>of</strong> a given FSO transceiver in a particular installation and be able to make a<br />
quantitative comparison <strong>of</strong> different systems.<br />
Transmit Power<br />
We would like to suggest that <strong>the</strong> industry adopt <strong>the</strong> standard metric “Total Maximum<br />
Average Power at <strong>the</strong> Output Aperture.” Using this guideline, each FSO transceiver specification<br />
sheet would list <strong>the</strong> integrated sum <strong>of</strong> <strong>the</strong> emitted power over <strong>the</strong> entire output<br />
aperture measured, with an averaging time <strong>of</strong> at least 25 times <strong>the</strong> operational bit period.<br />
Alternatively, a FSO manufacturer could list <strong>the</strong> “Maximum Average Output Power <strong>of</strong> <strong>the</strong><br />
Transmit Laser” in conjunction with “Transmit System Optical Losses.”<br />
Transmit Beam Divergence<br />
We would like to suggest that <strong>the</strong> industry adopt <strong>the</strong> standard metric “Transmit Beam Divergence<br />
to <strong>the</strong> 1/e, 1/e 2 , and FWHA points.” This combined information will allow a<br />
potential user to make an approximate determination <strong>of</strong> <strong>the</strong> transmit beam pr<strong>of</strong>ile and be<br />
able to predict power distribution at various ranges.<br />
Receive Sensitivity<br />
We would like to suggest that <strong>the</strong> industry adopt <strong>the</strong> standard metric “Average Required<br />
Power at <strong>the</strong> Receive Aperture for a 10 −9 Bit Error Rate.” Extrapolating to o<strong>the</strong>r error rates<br />
is pretty straightforward, with 10 −12 approximately corresponding to 1 dB less sensitivity<br />
and 10 −6 approximately corresponding to 1 dB more sensitivity. Alternatively, a FSO<br />
manufacturer could list <strong>the</strong> “Average Required Power at <strong>the</strong> Detector” in conjunction with<br />
“Receive System Optical Losses.”<br />
Receive Field <strong>of</strong> View<br />
We would like to suggest that <strong>the</strong> industry adopt <strong>the</strong> standard metric “Receive Field <strong>of</strong> View<br />
to <strong>the</strong> FWHA Points.”<br />
Pointing and Tracking<br />
For pointing and tracking systems, we would like to suggest that <strong>the</strong> industry adopt <strong>the</strong><br />
standard metrics “Tracking System Field <strong>of</strong> Regard” and “Tracking System Closed-Loop<br />
Bandwidth.” We fully acknowledge that <strong>the</strong>se two metrics would not provide sufficient<br />
information to fully quantify <strong>the</strong> capabilities <strong>of</strong> a pointing and tracking system, but <strong>the</strong>y<br />
are typically fairly representative <strong>of</strong> overall <strong>performance</strong> and should allow for <strong>the</strong> accurate<br />
comparison <strong>of</strong> different transceivers.<br />
© 2003 Optical Society <strong>of</strong> America<br />
JON 2330 June 2003 / Vol. 2, No. 6 / JOURNAL OF OPTICAL NETWORKING 197
31. Link Margin and Attenuation Versus Range<br />
The final metrics that we would like to suggest are two curves showing link margin versus<br />
range and attenuation versus range as presented in Fig. 5. The first curve shows how much<br />
margin a given system has at a given range to compensate for both scattering and scintillation<br />
losses. The second curve is derived from <strong>the</strong> first and shows <strong>the</strong> maximum range in<br />
which a FSO system will operate for a given atmospheric attenuation. This second curve<br />
loses accuracy at low attenuation (
Table 6. Ranges for Various Annual Availabilities and Climatesa Table 6. Ranges for Various Annual Availabilities and Climates a<br />
Service<br />
Range<br />
Availability (%) Cities<br />
(m)<br />
99.5<br />
Phoenix – atmospherically excellent 10,000+<br />
Denver – atmospherically good 2400<br />
Seattle – atmospherically fair 1200<br />
London – atmospherically poor 630<br />
99.9<br />
Phoenix – atmospherically excellent 5200<br />
Denver – atmospherically good 850<br />
Seattle – atmospherically fair 420<br />
London – atmospherically poor 335<br />
99.99<br />
Phoenix – atmospherically excellent 460<br />
Denver – atmospherically good 290<br />
Seattle – atmospherically fair 255<br />
London – atmospherically poor 185<br />
a<br />
Availability ranges are based upon two 125/155 Mbit/s FSO transceivers that are located<br />
outdoors and transmitting through clear air under normal operating conditions.<br />
33. Conclusion<br />
Well-designed FSO systems are capable <strong>of</strong> delivering 99.9% or better <strong>performance</strong> at 500–<br />
1000-m ranges for <strong>the</strong> vast majority <strong>of</strong> cities throughout <strong>the</strong> world. They are eye-safe and<br />
can be used to provision carrier-grade service as long as <strong>the</strong> appropriate processes have<br />
been used to calculate <strong>the</strong>ir expected <strong>performance</strong>.<br />
The authors <strong>of</strong> this paper hope that <strong>the</strong> suggested metrics will be adopted <strong>by</strong> <strong>the</strong> FSO<br />
industry as a method for quantitatively defining system <strong>performance</strong>, because <strong>the</strong> longterm<br />
success and adoption <strong>of</strong> this very powerful technology depends upon consistent and<br />
accurate <strong>performance</strong> expectations.<br />
Bibliography<br />
General Literature Covering Various Aspects <strong>of</strong> Free-Space Optics<br />
FSO systems have been studied in detail for several decades. One can find numerous technical<br />
papers in <strong>the</strong> SPIE proceedings on Free-Space Laser Communication Technologies<br />
and in <strong>the</strong> SPIE proceedings on Optical Wireless Communications.<br />
Specific Literature Covering Various Aspects <strong>of</strong> Laser Safety<br />
American National Standards Institute (ANSI), Standard for <strong>the</strong> Safe Use <strong>of</strong> Lasers,<br />
ANSI Z136.1, http://www.ansi.org.<br />
European Committee for Electrotechnical Standardization (CENELEC), Safety <strong>of</strong><br />
Laser Products—Part 1: Equipment Classification, Requirements, and User’s Guide,<br />
EN 60825-1:1994 (CENELEC, 1994), http://www.cenelec.org.<br />
European Committee for Electrotechnical Standardization (CENELEC), Safety <strong>of</strong><br />
Laser Products—Part 2: Equipment Classification, Requirements, and User’s Guide,<br />
EN 60825-1:1994 (CENELEC, 1994), http://www.cenelec.org.<br />
International Electrotechnical Commission (IEC), Safety <strong>of</strong> Laser Products— Part 1:<br />
Equipment Classification, Requirements, and User’s Guide, IEC 825-1 (IEC, 1993),<br />
© 2003 Optical Society <strong>of</strong> America<br />
JON 2330 June 2003 / Vol. 2, No. 6 / JOURNAL OF OPTICAL NETWORKING 199
http://www.iec.ch. Published in 1993 and amended in 1997, <strong>the</strong> standard is<br />
being redesignated as IEC 60825-1.<br />
International Electrotechnical Commission (IEC), “Amendment 2 (2001),” Safety <strong>of</strong><br />
Laser Products—Part 1: Equipment Classification, Requirements, and User’s Guide,<br />
IEC 60825-1 (IEC, 2001), http://www.iec.ch. New classification standard<br />
adopted as <strong>of</strong> 1 March 2001.<br />
The Photonics Directory (Laurin Publishing, Pittsfield, Mass., 2002), http://<br />
www.photonicsdirectory.com.<br />
D. Sliney and M. Wolbarsht, Safety with Lasers and O<strong>the</strong>r Optical Sources (Plenum,<br />
New York, 1980).<br />
U.S. Center for Devices and Radiological Health (CDRH), Laser Product Performance<br />
Standard, Code <strong>of</strong> Federal Regulations, Vol. 21, Section 1040 (21 CFR 1040)<br />
(CDRH, Washington, D.C., 2002).<br />
M. J. Weber, ed., CRC Handbook <strong>of</strong> Laser Science and Technology (CRC Press, Boca<br />
Raton, Fla., 1982), Vols. 1 and 2.<br />
M. J. Weber, ed., CRC Handbook <strong>of</strong> Laser Science and Technology, Supplement 1<br />
(CRC Press, Boca Raton, Fla., 1989).<br />
R. Weiner, “Status <strong>of</strong> laser safety requirements,” in Laser and Optronics 1990 Buying<br />
Guide (1990).<br />
D. C. Winburn, Practical Laser Safety, 2nd ed. (Marcel Dekker, New York, 1990).<br />
© 2003 Optical Society <strong>of</strong> America<br />
JON 2330 June 2003 / Vol. 2, No. 6 / JOURNAL OF OPTICAL NETWORKING 200