Conceptual Drainage Report - Maricopa County Department of ...
Conceptual Drainage Report - Maricopa County Department of ...
Conceptual Drainage Report - Maricopa County Department of ...

Create successful ePaper yourself
Turn your PDF publications into a flip-book with our unique Google optimized e-Paper software.
FINAL<br />
Technical Memorandum 3<br />
<strong>Conceptual</strong> <strong>Drainage</strong> <strong>Report</strong><br />
Prepared by:<br />
7-fl rrrmleY-norn<br />
f-f/ \ anoAbsoctares, rnc.<br />
August 201 1<br />
091337133<br />
Copyright @ 201 1 Kimley-Hom and Associates, lnc.<br />
Yuma Parkrvay<br />
Corridor Feasibility Study -<br />
Salome Highway to<br />
Palo Verde Road<br />
Contract No.: 2O1O-055<br />
Froject No.: TT005<br />
F-x?t*tI 7fo/zot+
TABLE OF CONTENTS<br />
CONCEPTUAL DRAINAGE REPORT<br />
1. INTRODUCTION .................................................................................................................................. 1<br />
1.1 Background and Study Need ......................................................................................... 1<br />
1.2 Study Area ...................................................................................................................... 1<br />
1.3 Document Purpose and Scope ....................................................................................... 2<br />
1.4 Design <strong>Drainage</strong> Criteria ............................................................................................... 2<br />
2. EXISTING STUDIES AND OTHER DATA SOURCES ............................................................................. 4<br />
2.1 Summary <strong>of</strong> <strong>Drainage</strong> Studies ...................................................................................... 4<br />
2.2 Summary <strong>of</strong> Other Documents and Data ..................................................................... 7<br />
3. WATERSHED FEATURES .................................................................................................................... 9<br />
3.1 Topography and Geology .............................................................................................. 9<br />
3.2 Soils ................................................................................................................................ 12<br />
3.3 Existing Land Use ........................................................................................................ 14<br />
3.4 Flooding Hazards ......................................................................................................... 14<br />
3.5 Existing <strong>Drainage</strong> Structures ...................................................................................... 20<br />
4. EXISTING HYDROLOGY ................................................................................................................... 22<br />
4.1 Summary <strong>of</strong> Hydrology Methods ................................................................................ 22<br />
4.2 Offsite Hydrology Results ............................................................................................ 26<br />
5. SUMMARY AND CONCLUSIONS ........................................................................................................ 29<br />
091337133, 2010-055, TT005 <strong>Maricopa</strong> <strong>County</strong> <strong>Department</strong> <strong>of</strong> Transportation<br />
Technical Memorandum 3 Yuma Parkway Corridor Feasibility Study<br />
<strong>Conceptual</strong> <strong>Drainage</strong> <strong>Report</strong> i August 2011
LIST OF FIGURES<br />
TABLE OF CONTENTS<br />
CONCEPTUAL DRAINAGE REPORT<br />
Figure 1 – Study Area ................................................................................................................................ 3<br />
Figure 2 – Area <strong>Drainage</strong> Studies .............................................................................................................. 5<br />
Figure 3 – Slope Analysis ........................................................................................................................ 10<br />
Figure 4 – Hydrologic Soil Groups .......................................................................................................... 13<br />
Figure 5 – Regulatory Floodplains ........................................................................................................... 16<br />
Figure 6 – Offsite Hydrology Workmap .................................................................................................. 24<br />
LIST OF TABLES<br />
Table 1 – Significant Offsite <strong>Drainage</strong> Crossings .................................................................................... 23<br />
Table 2 – Offsite Hydrology Results ........................................................................................................ 28<br />
LIST OF APPENDICES<br />
Appendix TM3-01: Data Collection Summary<br />
Appendix TM3-02: Existing Geologic Mapping<br />
Appendix TM3-03: Subsidence and Earth Fissure Documentation<br />
Appendix TM3-04: Tonopah Uplift Documentation<br />
Appendix TM3-05: <strong>Drainage</strong> Field Photos<br />
Appendix TM3-06: Recommended Area <strong>Drainage</strong> Master Plan Improvements<br />
Appendix TM3-07: Recent Erosion and Sedimentation in Hassayampa River<br />
Appendix TM3-08: Existing Erosion Hazard Mapping<br />
Appendix TM3-09: Sand and Gravel Mining Documentation<br />
Appendix TM3-10: Existing <strong>Drainage</strong> Structure Documentation<br />
Appendix TM3-11: Existing Hydrology Results Excerpts<br />
091337133, 2010-055, TT005 <strong>Maricopa</strong> <strong>County</strong> <strong>Department</strong> <strong>of</strong> Transportation<br />
Technical Memorandum 3 Yuma Parkway Corridor Feasibility Study<br />
<strong>Conceptual</strong> <strong>Drainage</strong> <strong>Report</strong> ii August 2011
1. INTRODUCTION<br />
Technical Memorandum 3 (TM 3), entitled <strong>Conceptual</strong> <strong>Drainage</strong> <strong>Report</strong>, identifies and summarizes the<br />
existing drainage conditions, features, and hydrologic characteristics for the Yuma Parkway Corridor<br />
Feasibility Study – Salome Highway to Palo Verde Road (hereafter referred to as “the study”). The<br />
purpose <strong>of</strong> TM 3 is to identify known drainage opportunities and constraints for developing feasible<br />
corridor alignments. Offsite concentration points and flow magnitudes prepared in previous studies and<br />
reports within the study area for the 100-year storm event were compiled and are presented in this<br />
report. TM 3 is based on a review <strong>of</strong> available existing information including previous drainage master<br />
plans and studies, floodplain delineation studies, roadway drainage reports, discussions with several<br />
stakeholders, and field observations. Additional detailed information about the study is included in the<br />
following companion documents: Existing and Future Corridor Features (TM 1), Environmental<br />
Overview (TM 2), Development and Evaluation <strong>of</strong> Candidate Alternative Alignments (TM 4), and<br />
Detailed Preferred Alignment (TM 5).<br />
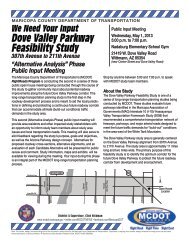
1.1 Background and Study Need<br />
In July 2008, the <strong>Maricopa</strong> Association <strong>of</strong> Governments (MAG) completed the Interstate<br />
10/Hassayampa Valley Transportation Framework Study (known as the Hassayampa Framework<br />
Study), that recommended a comprehensive roadway network to meet the future traffic demands<br />
that result when the area west <strong>of</strong> the White Tank Mountains is completely developed (hereafter<br />
referred to as buildout travel demand). This long-range regional transportation network includes<br />
the “Arizona Parkway” as a new facility type to supplement more traditional roadway<br />
classifications in meeting projected travel demand.<br />
The Arizona Parkway utilizes a distinct intersection treatment that prohibits left turns at major<br />
cross-street intersections and controls intersection traffic movements with two-phased traffic<br />
signal control. Left-turn movements are made indirectly using directional left-turn crossovers in<br />
the median immediately downstream <strong>of</strong> cross-street intersections. The typical right-<strong>of</strong>-way width<br />
for an Arizona Parkway is 200 feet.<br />
The Hassayampa Framework Study recommended Yuma Parkway as an “Arizona Parkway” to<br />
meet buildout travel demands and provide a continuous parkway network. Although today’s land<br />
development and travel demands in the study area do not warrant a major new high capacity<br />
roadway in the short-term, the buildout forecast for future land development and travel demands<br />
does warrant a major new high capacity roadway in the long-term future. Plans are already<br />
underway to convert some <strong>of</strong> the vacant lands within the study area to land uses that will generate<br />
future traffic.<br />
The scope <strong>of</strong> work for this study includes the preparation <strong>of</strong> a corridor feasibility report that will<br />
provide <strong>Maricopa</strong> <strong>County</strong>, the Town <strong>of</strong> Buckeye, area property owners, developers, and other<br />
stakeholders with guidelines to preserve a 200-foot-wide right-<strong>of</strong>-way corridor to accommodate<br />
the typical Arizona Parkway design. This will require significant coordination with various<br />
governing bodies, other public agencies, development interests, and the general public.<br />
1.2 Study Area<br />
The Yuma Parkway study area is approximately 13 miles long and two miles wide and is<br />
generally centered on the Buckeye Road/Yuma Road section line, from one-half mile west <strong>of</strong><br />
091337133, 2010-055, TT005 <strong>Maricopa</strong> <strong>County</strong> <strong>Department</strong> <strong>of</strong> Transportation<br />
Technical Memorandum 3 Yuma Parkway Corridor Feasibility Study<br />
<strong>Conceptual</strong> <strong>Drainage</strong> <strong>Report</strong> 1 August 2011
Salome Highway to one-half mile east <strong>of</strong> Palo Verde Road. The study area boundary is shown in<br />
Figure 1.<br />
1.3 Document Purpose and Scope<br />
The purpose <strong>of</strong> the <strong>Conceptual</strong> <strong>Drainage</strong> <strong>Report</strong> is to describe the existing drainage conditions in<br />
the study area. The drainage study was limited to the collection and review <strong>of</strong> existing drainage<br />
reports and studies, existing geologic and groundwater mapping, limited discussion with<br />
stakeholders, and field observations <strong>of</strong> existing drainage patterns and structures included in and<br />
adjacent to the study area. Hydrologic information from previous drainage and floodplain studies<br />
was compiled to present watershed subbasins and previously determined peak flow rates draining<br />
to the study area. This information provides an overview <strong>of</strong> the physical features <strong>of</strong> the study<br />
area pertaining to drainage and will be used in the development <strong>of</strong> feasible alignment alternatives.<br />
1.4 Design <strong>Drainage</strong> Criteria<br />
<strong>Drainage</strong> design for the proposed parkway will follow criteria outlined in the <strong>Drainage</strong> Policies<br />
and Standards for <strong>Maricopa</strong> <strong>County</strong>, Arizona (<strong>Maricopa</strong> <strong>County</strong>, 2007) and Chapter 4.7 <strong>of</strong> the<br />
Roadway Design Manual (<strong>Maricopa</strong> <strong>County</strong>, 2004). A draft version <strong>of</strong> an update to the <strong>Drainage</strong><br />
Policies and Standards for <strong>Maricopa</strong> <strong>County</strong> was distributed by <strong>Maricopa</strong> <strong>County</strong> for public<br />
review and comment in July 2010.<br />
091337133, 2010-055, TT005 <strong>Maricopa</strong> <strong>County</strong> <strong>Department</strong> <strong>of</strong> Transportation<br />
Technical Memorandum 3 Yuma Parkway Corridor Feasibility Study<br />
<strong>Conceptual</strong> <strong>Drainage</strong> <strong>Report</strong> 2 August 2011
Figure 1 – Study Area<br />
091337133, 2010-055, TT005 <strong>Maricopa</strong> <strong>County</strong> <strong>Department</strong> <strong>of</strong> Transportation<br />
Technical Memorandum 3 Yuma Parkway Corridor Feasibility Study<br />
<strong>Conceptual</strong> <strong>Drainage</strong> <strong>Report</strong> 3 August 2011
2. EXISTING STUDIES AND OTHER DATA SOURCES<br />
Numerous drainage, geologic, groundwater studies and other drainage-related documents have been<br />
prepared within or adjacent to the study area. A complete list <strong>of</strong> the existing documents reviewed is<br />
included in Appendix TM3-01. Summaries <strong>of</strong> the most relevant documents are provided in the<br />
following sections. The general order <strong>of</strong> presentation and discussion is from west to east.<br />
2.1 Summary <strong>of</strong> <strong>Drainage</strong> Studies<br />
A map depicting the major drainage studies that are in the general vicinity <strong>of</strong> the study area is<br />
provided as Figure 2 at the end <strong>of</strong> this section. The drainage studies shown in Figure 2 that have<br />
direct relevance to the Yuma Parkway study area are briefly discussed below. These drainage<br />
studies were reviewed for descriptions <strong>of</strong> existing hydrology, drainage features, and existing<br />
drainage patterns. Most <strong>of</strong> these drainage studies were completed for the Flood Control District<br />
<strong>of</strong> <strong>Maricopa</strong> <strong>County</strong> (FCDMC).<br />
2.1.1 Palo Verde Watershed Detailed Floodplain Delineation Study Technical Data<br />
Notebook (Draft 2010)<br />
This FCDMC study aims to establish and refine 100-year flooding limits. The Palo Verde<br />
Watershed extends from the Big Horn Mountains to just east <strong>of</strong> Wickenburg Road. This<br />
study is a refinement <strong>of</strong> the 2003 Zone A Floodplain Delineation Study for the same<br />
watershed. The detailed study is not yet complete, but the draft hydrology report was<br />
available for review. Six <strong>of</strong> the studied washes cross the Yuma Parkway study area: Four<br />
Mile Wash, T1N-R6W-S17E, T1N-R6W-S08, T1N-R6W-S16, T1S-R6W-S27, and T1N-<br />
R6W-S22N.<br />
2.1.2 Hydrologic Study <strong>Report</strong> for Luke Wash Zone AE Floodplain Delineation Study<br />
(2008)<br />
The purpose <strong>of</strong> this FCDMC study was to develop detailed 100-year hydrologic models to<br />
delineate 85 linear miles <strong>of</strong> Zone AE floodplains and floodways. The analysis focused on<br />
Luke Wash and nearby tributaries <strong>of</strong> the Hassayampa and Gila Rivers, with six washes that<br />
cross the Yuma Parkway study area: T1S-R5W-S17, Phillips Wash, Dickey Wash, Luke<br />
Wash, T1N-R5W-S22, and T1N-R5W-S15.<br />
2.1.3 500 kV Electric Transmission Structures Hassayampa River Hydrologic<br />
Engineering Services (2010)<br />
The Salt River Project (SRP) initiated the 500kV Electric Transmission Structures<br />
Hassayampa River Hydrologic Engineering Services (ETS report) in response to the<br />
January 2010 flood that exposed the foundations <strong>of</strong> transmission towers in the Yuma<br />
Parkway study area. The report included scour and lateral stream bank migration analyses<br />
for the Hassayampa River, and provided mitigation recommendations for the tower<br />
foundations.<br />
091337133, 2010-055, TT005 <strong>Maricopa</strong> <strong>County</strong> <strong>Department</strong> <strong>of</strong> Transportation<br />
Technical Memorandum 3 Yuma Parkway Corridor Feasibility Study<br />
<strong>Conceptual</strong> <strong>Drainage</strong> <strong>Report</strong> 4 August 2011
Figure 2 – Area <strong>Drainage</strong> Studies<br />
091337133, 2010-055, TT005 <strong>Maricopa</strong> <strong>County</strong> <strong>Department</strong> <strong>of</strong> Transportation<br />
Technical Memorandum 3 Yuma Parkway Corridor Feasibility Study<br />
<strong>Conceptual</strong> <strong>Drainage</strong> <strong>Report</strong> 5 August 2011
2.1.4 500 kV Electric Transmission Structures Hassayampa River Phase 3 Hydrologic<br />
Engineering Services (2011)<br />
This SRP report was completed after a single ring dike was chosen as the preferred<br />
alternative from the 2010 report. The ring dike would consist <strong>of</strong> a raised structure<br />
surrounding the power pole foundations and elevated above the floodplain. The ring dike<br />
would incorporate scour protection measures such as riprap, gabion mattresses or soil<br />
cement that would extend below the river bed to protect the tower foundations from scour<br />
and lateral migration <strong>of</strong> the river banks. This report provided additional hydraulic impacts<br />
and scour design for the selected option.<br />
2.1.5 FLUVIAL-12 Modeling <strong>of</strong> Sand Mining Impacts for Lower Hassayampa River<br />
(2009)<br />
This study was prepared to assist the FCDMC with managing erosion and flooding hazards<br />
due to sand and gravel mining in the Lower Hassayampa River. The study presents a<br />
sediment transport model that simulates river bed changes in the vertical and horizontal<br />
direction.<br />
2.1.6 Lower Hassayampa Watercourse Master Plan Phase 1 (2006)<br />
The FCDMC prepared Phase 1 <strong>of</strong> the Lower Hassayampa Watercourse Master Plan<br />
(LHWMP) to formulate technical guidance for managing flooding hazards, lateral migration<br />
<strong>of</strong> the watercourse, and cumulative impacts <strong>of</strong> existing and future development into the<br />
floodplain <strong>of</strong> the Hassayampa River. The river crosses the Yuma Parkway study area<br />
within River Reach 2, which extends from the Union Pacific Railroad (UPRR) Bridge to<br />
just downstream <strong>of</strong> Interstate 10 (I-10). Phase 1 is complete and contains seven volumes;<br />
Phase 2 is currently under development and should be made available in the near future.<br />
Volume 2 contains hydrologic documentation – an analysis <strong>of</strong> stream gage records, a<br />
simplified HEC-1 model, and multiple previous studies were compared to examine peak<br />
discharges for the river. Volume 5 contains river behavior analysis – compiled and<br />
presented historical and existing fluvial processes in the river.<br />
2.1.7 Hydrologic Analysis <strong>of</strong> the Hassayampa River in <strong>Maricopa</strong> <strong>County</strong>, Arizona<br />
(1988)<br />
This report was prepared for FEMA in order to estimate the 100-year discharge <strong>of</strong> the<br />
Hassayampa River for use in the corresponding FEMA Flood Insurance Re-Study. The<br />
study limits comprise approximately 53 stream miles from the Yavapai/<strong>Maricopa</strong> <strong>County</strong><br />
line to the confluence with the Gila River. The Hassayampa River crosses the Yuma<br />
Parkway study area within this reach.<br />
2.1.8 Buckeye Flood Retarding Structure #1 Rehabilitation Project (Ongoing)<br />
This project is currently under development by FCDMC. Buckeye FRS #1 is located along<br />
the north side <strong>of</strong> I-10 for 7.1 miles, extending from approximately the Hassayampa River to<br />
Oglesby Road (287 th Avenue). The planning phase was completed in 2008, with overall<br />
rehabilitation being selected as the alternative to move forward into final design.<br />
091337133, 2010-055, TT005 <strong>Maricopa</strong> <strong>County</strong> <strong>Department</strong> <strong>of</strong> Transportation<br />
Technical Memorandum 3 Yuma Parkway Corridor Feasibility Study<br />
<strong>Conceptual</strong> <strong>Drainage</strong> <strong>Report</strong> 6 August 2011
2.1.9 Buckeye/Sun Valley Area <strong>Drainage</strong> Master Study (2006)<br />
This FCDMC Area <strong>Drainage</strong> Master Study (ADMS) identified drainage, flooding, and<br />
erosion hazards within the Buckeye/Sun Valley area and developed preliminary guidelines<br />
for development to be used as a basis <strong>of</strong> stormwater management. The Buckeye/Sun Valley<br />
study limits extend from the Hassayampa River to approximately the White Tank<br />
Mountains and Dean Road alignment. This overall watershed was subdivided into four<br />
hydrologically distinct areas, with the Yuma Parkway study area falling within Area 1,<br />
named the Buckeye Area.<br />
2.1.10 Buckeye Area <strong>Drainage</strong> Master Plan Recommended Design <strong>Report</strong> (2009)<br />
This Area <strong>Drainage</strong> Master Plan (ADMP) was prepared for the FCDMC as a follow-up to<br />
the ADMS process described previously. The master plan study area extends from I-10<br />
south to the Gila River, and from Airport Road west to the Hassayampa River. The Yuma<br />
Parkway study area crosses the ADMP study area. The ADMP provides regional drainage<br />
recommendations, including two proposed north-south channels: the Palo Verde Channel<br />
follows Palo Verde Road and the Johnson Channel follows an alignment ½ mile east <strong>of</strong><br />
Johnson Road. However both <strong>of</strong> these proposed 100-year channels begin at the Roosevelt<br />
Irrigation District (RID) canal, which is located south <strong>of</strong> the Yuma Parkway study area.<br />
The ADMP also recommends constructing a regional retention basin one-half mile east <strong>of</strong><br />
Johnson Road on the north side <strong>of</strong> the RID canal (outside the Yuma Parkway study area).<br />
The recommended master plan drainage improvements are shown in Appendix TM3-06.<br />
2.2 Summary <strong>of</strong> Other Documents and Data<br />
In addition to drainage studies, data sources such as geologic investigations and groundwater<br />
records were reviewed for information on other regional physical processes that could potentially<br />
impact the Yuma Parkway study area. A summary <strong>of</strong> the most relevant data sources is provided<br />
below.<br />
2.2.1 Geologic Map <strong>of</strong> the Wintersburg 7.5’ Quadrangle, <strong>Maricopa</strong> <strong>County</strong>, Arizona<br />
(2006)<br />
The AZGS produced digital geologic mapping and descriptions <strong>of</strong> the Wintersburg 7.5’<br />
Quadrangle. This quadrangle encompasses the study area from 383 rd Avenue to just west <strong>of</strong><br />
the Hassayampa River. The descriptive map legend describes surficial and bedrock<br />
geology, geologic hazards and aggregate resources.<br />
2.2.2 Geologic Map <strong>of</strong> the Buckeye NW 7.5’ Quadrangle, <strong>Maricopa</strong> <strong>County</strong>, Arizona<br />
(2004)<br />
The AZGS produced digital geologic mapping and descriptions <strong>of</strong> the Wagner Wash Well<br />
7.5’ Quadrangle. This quadrangle encompasses the study area from the Hassayampa River<br />
to Oglesby Road (287 th Avenue).<br />
091337133, 2010-055, TT005 <strong>Maricopa</strong> <strong>County</strong> <strong>Department</strong> <strong>of</strong> Transportation<br />
Technical Memorandum 3 Yuma Parkway Corridor Feasibility Study<br />
<strong>Conceptual</strong> <strong>Drainage</strong> <strong>Report</strong> 7 August 2011
2.2.3 Earth Fissure Map <strong>of</strong> <strong>Maricopa</strong> <strong>County</strong>, Arizona (2009)<br />
The AZGS produced a map summarizing the earth fissure mapping that had been completed<br />
in <strong>Maricopa</strong> <strong>County</strong>. It presents a graphical overview <strong>of</strong> the eight areas that have been<br />
found to have active earth fissures.<br />
2.2.4 A New Earth Fissure near Wintersburg, <strong>Maricopa</strong> <strong>County</strong>, Arizona (2001)<br />
The AZGS produced a report on an earth fissure located approximately three miles south <strong>of</strong><br />
the study area near Wintersburg. The report presents maps, photos, geologic setting,<br />
groundwater history, and discussion <strong>of</strong> the fissure formation.<br />
2.2.5 Additional Giant Desiccation Cracks near Wintersburg, <strong>Maricopa</strong> <strong>County</strong>,<br />
Arizona (2003)<br />
The AZGS produced a report on giant desiccation cracks located approximately one-half<br />
mile south <strong>of</strong> the study area near Wintersburg. The report presents maps, photos, and<br />
history <strong>of</strong> development <strong>of</strong> the cracks.<br />
2.2.6 Active Land Subsidence Areas in Arizona Based on ADWR InSAR Data (2009)<br />
This working document shows active land subsidence areas monitored by the Arizona<br />
<strong>Department</strong> <strong>of</strong> Water Resources (ADWR). Interferometric synthetic aperture radar<br />
(InSAR) technology is used to measure temporal elevation changes in the Earth’s surface.<br />
The map covers the entire state <strong>of</strong> Arizona.<br />
2.2.7 Land Subsidence Areas in the Buckeye Area, Western <strong>Maricopa</strong> <strong>County</strong> (2008)<br />
This ADWR map shows subsidence in an area roughly bounded by Johnson Road and<br />
Miller Road. Some <strong>of</strong> the active subsidence area is within the Yuma Parkway study<br />
corridor. The exhibit presents InSAR measurements <strong>of</strong> land subsidence between February<br />
2007 and April 2008.<br />
2.2.8 Uplift in the Vicinity <strong>of</strong> the Tonopah Recharge Facility (2010)<br />
This ADWR working document shows the extent <strong>of</strong> uplift, or elevation <strong>of</strong> the Earth’s<br />
surface, caused by the Tonopah Desert Recharge Project. The recharge facility is located<br />
approximately nine miles northwest <strong>of</strong> the study area adjacent to the Central Arizona<br />
Project (CAP) Canal.<br />
2.2.9 Groundwater Site Inventory (GWSI) (2011)<br />
The GWSI is ADWR’s primary repository for statewide groundwater data. It contains<br />
historical well levels and other background information for each well in the database,<br />
including the wells within the study area. The GWSI is an online product that is<br />
continuously updated as new field data is collected.<br />
091337133, 2010-055, TT005 <strong>Maricopa</strong> <strong>County</strong> <strong>Department</strong> <strong>of</strong> Transportation<br />
Technical Memorandum 3 Yuma Parkway Corridor Feasibility Study<br />
<strong>Conceptual</strong> <strong>Drainage</strong> <strong>Report</strong> 8 August 2011
3. WATERSHED FEATURES<br />
3.1 Topography and Geology<br />
Most <strong>of</strong> the study area is fairly flat, particularly west <strong>of</strong> the Hassayampa River and north <strong>of</strong> the<br />
Salome Highway. The Hassayampa River, which crosses the study area roughly between the<br />
315 th Avenue and 331 st Avenue alignments, is surrounded by rolling terrain, particularly on the<br />
east side <strong>of</strong> the river. A land form slope analysis map is provided in Figure 3.<br />
The region west <strong>of</strong> the Hassayampa River is described as Piedmont Alluvium in the Geologic<br />
Map <strong>of</strong> the Wintersburg 7.5’ Quadrangle, <strong>Maricopa</strong> <strong>County</strong>, Arizona (AZGS, 2006). This<br />
piedmont contains areas <strong>of</strong> young deposits associated with active or recently active fluvial<br />
systems and areas <strong>of</strong> older intermediate deposits associated with extensive relic alluvial fans.<br />
Wash channels are typically located less than two meters (6.6 feet) below adjacent surfaces.<br />
These areas without much local relief are <strong>of</strong> particular concern because <strong>of</strong> the potential for<br />
widespread inundation and changes in channel positions during floods. In the southwest corner<br />
<strong>of</strong> the study area, south <strong>of</strong> the Salome Highway, basalt lava flows cap several hills known as the<br />
Palo Verde Hills. These hills represent the greatest local relief within the study area, but are not<br />
expected to influence the alignment <strong>of</strong> Yuma Parkway since the future roadway will tie into the<br />
Salome Highway.<br />
The region around the Hassayampa River contains<br />
more undulating terrain and steeper slopes. The<br />
incised, sandy river channel width varies between<br />
approximately 500 feet to 2000 feet within the study<br />
area. The unit descriptions in the Geologic Map <strong>of</strong><br />
the Buckeye NW 7.5’ Quadrangle, <strong>Maricopa</strong><br />
<strong>County</strong>, Arizona (AZGS, 2004) suggest that the<br />
current Hassayampa River channel is 15 to 20<br />
meters (49 to 66 feet) below the terraces formed by<br />
the maximum aggradation <strong>of</strong> the river. These<br />
terrace surfaces are dissected by tributary drainages<br />
and have been substantially modified by erosion.<br />
Within the study area, the higher terraces are much<br />
more preserved on the east side <strong>of</strong> the Hassayampa<br />
River than on the west side.<br />
Undulating terrain near river<br />
The region east <strong>of</strong> the Hassayampa River is<br />
described as Piedmont Alluvium in the Geologic Map <strong>of</strong> the Buckeye NW 7.5’ Quadrangle. This<br />
piedmont contains areas <strong>of</strong> young deposits associated with active or recently active fluvial<br />
systems and areas <strong>of</strong> older intermediate deposits associated with extensive relic alluvial fans.<br />
Local topographic relief varies from 0.5 m to 6 m (1.6 feet to 20 feet). The Arizona Geological<br />
Survey (AZGS) maps pertaining to the study area have been included as Appendix TM3-02.<br />
091337133, 2010-055, TT005 <strong>Maricopa</strong> <strong>County</strong> <strong>Department</strong> <strong>of</strong> Transportation<br />
Technical Memorandum 3 Yuma Parkway Corridor Feasibility Study<br />
<strong>Conceptual</strong> <strong>Drainage</strong> <strong>Report</strong> 9 August 2011
Figure 3 – Slope Analysis<br />
091337133, 2010-055, TT005 <strong>Maricopa</strong> <strong>County</strong> <strong>Department</strong> <strong>of</strong> Transportation<br />
Technical Memorandum 3 Yuma Parkway Corridor Feasibility Study<br />
<strong>Conceptual</strong> <strong>Drainage</strong> <strong>Report</strong> 10 August 2011
3.1.1 Land Subsidence and Earth Fissures<br />
ADWR has mapped an active land subsidence feature in the Buckeye Area based on<br />
measurements obtained between February 2007 and April 2008. The map entitled Land<br />
Subsidence in the Buckeye Area, Western <strong>Maricopa</strong> <strong>County</strong> (ADWR, 2008) indicates that<br />
there has been up to 0.5 cm (0.2 inches) <strong>of</strong> subsidence within the study area east <strong>of</strong> Palo<br />
Verde Road. South <strong>of</strong> the study area between Johnson Road and Palo Verde Road, up to<br />
three centimeters (1.2 inches) <strong>of</strong> subsidence has been documented. The extent <strong>of</strong> the land<br />
subsidence is included in Appendix TM3-03. Land subsidence in Arizona typically occurs<br />
due to groundwater drawdown. While subsidence is not considered to be a significant issue<br />
within the study area at this time, as water demand changes with future development, the<br />
increased potential for land subsidence (or uplift) should be considered when building<br />
infrastructure.<br />
ADWR is also monitoring an active uplift area caused by the Tonopah Desert Recharge<br />
Project. The recharge facility is located adjacent to the CAP Canal approximately nine<br />
miles northwest <strong>of</strong> the study area. As <strong>of</strong> March 2010, the facility’s groundwater plume and<br />
associated ground uplift had extended as far east as 355 th Avenue and as far south as<br />
Buckeye Road. ADWR provided an exhibit called Uplift in the Vicinity <strong>of</strong> the Tonopah<br />
Recharge Facility (ADWR, 2010) that is included in Appendix TM3-04. This map shows<br />
that up to one centimeter (0.4 inches) <strong>of</strong> uplift occurred within the study area between 2006<br />
and 2010. A review <strong>of</strong> recent well logs from the Groundwater Site Inventory (GWSI)<br />
(ADWR, 2011) did not indicate a marked increase in groundwater elevation within the<br />
study area. These hydrographs and a map showing the four well sites have been included in<br />
Appendix TM3-04. However, the plume may continue to expand as groundwater travels<br />
towards the Hassayampa River and Gila River. The recharge project will probably not<br />
impact the selection <strong>of</strong> a Yuma Parkway alternative, but uplift or subsidence in this area<br />
should be monitored in future design phases, especially if the Tonopah Desert Recharge<br />
Project modifies the rate <strong>of</strong> groundwater recharge.<br />
The nearest documented earth fissure is located approximately three miles south <strong>of</strong> the<br />
study area near the intersection <strong>of</strong> the 363 rd Avenue and Baseline Road alignments. Earth<br />
fissures are large cracks associated with differential basin subsidence, largely due to<br />
groundwater drawdown. Earth fissures pose a serious danger to roadways: extensive<br />
underground fissures can develop below the surface before anything is apparent on the<br />
surface, and filling exposed fissures is <strong>of</strong>ten only a temporary solution. A location map and<br />
photo <strong>of</strong> the fissure, where it crosses Baseline Road is included in Appendix TM3-03.<br />
More detailed information can be found in A New Earth Fissure near Wintersburg,<br />
<strong>Maricopa</strong>, Arizona (AZGS, 2001). No surface evidence <strong>of</strong> fissures has been found in the<br />
study area, but this does not guarantee that hidden or future earth fissures are not present.<br />
Giant desiccation cracks have also been found in the area, with the closest documented<br />
features approximately one-half mile south <strong>of</strong> the study area immediately west <strong>of</strong><br />
Wintersburg Road. A location map and photos <strong>of</strong> the cracks, excerpted from Additional<br />
Giant Desiccation Cracks near Wintersburg, <strong>Maricopa</strong> <strong>County</strong>, Arizona (AZGS, 2003), are<br />
included in Appendix TM3-03. Desiccation cracks are formed by the drying out <strong>of</strong> finegrained<br />
soils. These cracks are not the same as earth fissures, but there is some evidence<br />
that desiccation cracks may significantly advance the development <strong>of</strong> nearby earth fissures.<br />
While no giant desiccation cracks have been identified within the study area, prolonged<br />
drought conditions may increase the probability for these cracks to occur within the area.<br />
091337133, 2010-055, TT005 <strong>Maricopa</strong> <strong>County</strong> <strong>Department</strong> <strong>of</strong> Transportation<br />
Technical Memorandum 3 Yuma Parkway Corridor Feasibility Study<br />
<strong>Conceptual</strong> <strong>Drainage</strong> <strong>Report</strong> 11 August 2011
3.2 Soils<br />
The National Resources Conservation Service (NRCS) assigns soil map unit components to<br />
hydrologic soil groups to broadly indicate soils groups that have similar run<strong>of</strong>f characteristics.<br />
These hydrologic soil groups are shown in Figure 4. Most <strong>of</strong> the study area falls within Group<br />
B: soils that have moderately low run<strong>of</strong>f potential when thoroughly wet. These areas typically<br />
have a large proportion <strong>of</strong> sands and allow unimpeded transmission <strong>of</strong> water through the soil.<br />
However, the land west <strong>of</strong> the Hassayampa River contains significant areas that fall within<br />
Hydrologic Group C: soils with moderately high run<strong>of</strong>f potential. Soils in Group C typically<br />
have between 20 to 40 percent clay and less than 50 percent sands. Water movement through the<br />
soil is expected to be somewhat restricted.<br />
Three areas fall within Hydrologic Group D: soils with high run<strong>of</strong>f potential when thoroughly<br />
wet. One area is the exposed bedrock <strong>of</strong> the Palo Verde Hills southwest <strong>of</strong> the Salome Highway.<br />
The second area is the residential area bounded by Power Butte Road and 315 th Avenue, and the<br />
third is a small area within the Buckeye Municipal Airport. Water movement in these soils is<br />
restricted or very restricted. Soils in Group D typically have greater than 40 percent clay or the<br />
depth to a water impermeable layer (such as rock) is less than 20 inches. Descriptions <strong>of</strong> the<br />
hydrologic soil groups were taken from Chapter 7 <strong>of</strong> the NRCS National Engineering Handbook<br />
Part 630 Hydrology (2007). Contributing watersheds that contain Hydrologic Group D soils<br />
should be carefully analyzed when designing downstream structures or roadways since<br />
precipitation events may result in very quick run<strong>of</strong>f responses.<br />
The LHWMP River Behavior <strong>Report</strong> (FCDMC, 2006) documented soil pit analyses (average<br />
depth <strong>of</strong> 6.6 feet) that were taken from the Hassayampa River floodplain within the study area.<br />
Pit results indicated that sediments were alternating loamy sand and sand, with the lower pr<strong>of</strong>ile<br />
more sandy. Gravel was less than 10% throughout the pr<strong>of</strong>ile, and no clay was present. Evidence<br />
suggested a geologically young surface with historically frequent inundation and no resistance to<br />
lateral erosion. Soil borings in the same area were also taken for the ETS report (SRP, 2010).<br />
These borings showed more than 30 feet <strong>of</strong> refuse depth before encountering bedrock.<br />
091337133, 2010-055, TT005 <strong>Maricopa</strong> <strong>County</strong> <strong>Department</strong> <strong>of</strong> Transportation<br />
Technical Memorandum 3 Yuma Parkway Corridor Feasibility Study<br />
<strong>Conceptual</strong> <strong>Drainage</strong> <strong>Report</strong> 12 August 2011
Figure 4 – Hydrologic Soil Groups<br />
091337133, 2010-055, TT005 <strong>Maricopa</strong> <strong>County</strong> <strong>Department</strong> <strong>of</strong> Transportation<br />
Technical Memorandum 3 Yuma Parkway Corridor Feasibility Study<br />
<strong>Conceptual</strong> <strong>Drainage</strong> <strong>Report</strong> 13 August 2011
3.3 Existing Land Use<br />
Technical Memorandum 1 (TM 1) presents a discussion <strong>of</strong> land ownership, zoning, existing land<br />
use, future land use, existing and planned developments, and existing and future transportation<br />
networks. The land use descriptions below are abbreviated versions <strong>of</strong> the TM 1 descriptions that<br />
pertain to drainage design.<br />
3.3.1 Existing Land Use<br />
The predominant existing land use within the study area is natural desert open space, but<br />
there are large clusters <strong>of</strong> single family residential land uses west <strong>of</strong> the Hassayampa River.<br />
Appendix TM3-05 provides photographs<br />
taken during field visits <strong>of</strong> the study area land<br />
uses and major drainage features. Photo 650<br />
(in Appendix TM3-05) shows undeveloped<br />
desert landscape that is typical <strong>of</strong> the land<br />
around the Hassayampa River, and photo 687<br />
shows typical low density residential<br />
development along Buckeye Road west <strong>of</strong> the<br />
river. A few clusters <strong>of</strong> agriculture use are<br />
also present, with a large dairy farm located<br />
east <strong>of</strong> Johnson Road. The Buckeye<br />
Municipal Airport is located near the<br />
southeast corner <strong>of</strong> the study area. A limited<br />
network <strong>of</strong> two-lane paved roadways and<br />
unpaved roadways serve the existing<br />
properties, but there is not an existing<br />
roadway that connects the east and west sides<br />
Typical land use along Buckeye Road<br />
<strong>of</strong> the Hassayampa River within the study area.<br />
3.3.2 Future Land Use<br />
According to <strong>Maricopa</strong> Association <strong>of</strong> Governments (MAG) general plan GIS data<br />
provided by Public Works <strong>of</strong> <strong>Maricopa</strong> <strong>County</strong> (May 2009), existing vacant land within the<br />
study area is anticipated to be converted to primarily residential land use at buildout. The<br />
land west <strong>of</strong> the Hassayampa River is primarily planned to have low density single family<br />
residential uses. The study area east <strong>of</strong> the Hassayampa River is planned to have more<br />
medium/high density residential and multi-family uses. There are large areas <strong>of</strong> retail,<br />
<strong>of</strong>fice, and industrial land uses planned at major intersections throughout the study area,<br />
particularly near the Town <strong>of</strong> Wintersburg and within the Buckeye Municipal Planning<br />
Area Boundary (east <strong>of</strong> the Hassayampa River). These future land use patterns incorporate<br />
the land use plans for the large master planned communities in the study area vicinity.<br />
3.4 Flooding Hazards<br />
3.4.1 Regulatory Floodplains<br />
Floodplain and floodway delineations were based on the Flood Insurance Study, <strong>Maricopa</strong><br />
<strong>County</strong>, Arizona and Incorporated Areas, FIS No. 04013CV001A (Federal Emergency<br />
091337133, 2010-055, TT005 <strong>Maricopa</strong> <strong>County</strong> <strong>Department</strong> <strong>of</strong> Transportation<br />
Technical Memorandum 3 Yuma Parkway Corridor Feasibility Study<br />
<strong>Conceptual</strong> <strong>Drainage</strong> <strong>Report</strong> 14 August 2011
Management Agency, 2005). Numerous FEMA floodplains drain through the study area.<br />
Figure 5 provides a map <strong>of</strong> the 100-year floodplain areas and also displays the Flood<br />
Insurance Rate Map (FIRM) panels containing the effective floodplain mapping. Both<br />
FEMA effective and FCDMC (typically pending FEMA approval) floodplain limits are<br />
shown on this exhibit. The watercourses west <strong>of</strong> 371 st Avenue drain south to Centennial<br />
Wash, which is a tributary <strong>of</strong> the Gila River. Washes between 363 rd Avenue and 339 th<br />
Avenue drain south directly to the Gila River.<br />
Watercourses between 339 th Avenue and<br />
Johnson Road drain to the Hassayampa River,<br />
which discharges into the Gila River. The<br />
study area east <strong>of</strong> Johnson Road does not<br />
contain any regulatory floodplains.<br />
Hassayampa River floodplain<br />
The crossings <strong>of</strong> Four Mile Wash and the<br />
drainage system near 371 st Avenue also<br />
deserve further attention when developing<br />
alignment alternatives because each has a very<br />
wide floodplain. The Four Mile Wash 100year<br />
floodplain is approximately 3,300 feet<br />
wide. An eastern tributary <strong>of</strong> Four Mile Wash<br />
historically joined Four Mile Wash<br />
immediately north <strong>of</strong> the Palo Verde Hills, but<br />
the Salome Highway now acts as a partial<br />
barrier and forces the ponding <strong>of</strong> flood flows<br />
upstream <strong>of</strong> the elevated highway. This<br />
backwater flood zone is located at the<br />
intersection <strong>of</strong> Salome Highway and the<br />
Buckeye Road alignment, so it may be<br />
possible to avoid the floodplain with a Yuma<br />
Parkway alignment that ties into the Salome<br />
Highway further east (south <strong>of</strong> the section line).<br />
The study area contains 15 regulatory<br />
floodplains. Floodplain encroachment is a<br />
consideration for the parkway alternatives,<br />
especially when crossing major watercourses<br />
like the Hassayampa River. The Hassayampa<br />
River 100-year floodplain is approximately<br />
3,000 feet wide at the section line. Detailed<br />
hydraulic and sediment transport studies will<br />
be necessary to develop appropriate crossing<br />
alternatives for this highly dynamic river.<br />
Four Mile Wash floodplain<br />
The regulatory 100-year floodplain <strong>of</strong> the drainage system near 371 st Avenue is<br />
approximately 3,200 feet wide at the Buckeye Road alignment. There is little topographic<br />
relief in this area and the wash system may be distributary with multiple branching<br />
flowpaths.<br />
091337133, 2010-055, TT005 <strong>Maricopa</strong> <strong>County</strong> <strong>Department</strong> <strong>of</strong> Transportation<br />
Technical Memorandum 3 Yuma Parkway Corridor Feasibility Study<br />
<strong>Conceptual</strong> <strong>Drainage</strong> <strong>Report</strong> 15 August 2011
Figure 5 – Regulatory Floodplains<br />
091337133, 2010-055, TT005 <strong>Maricopa</strong> <strong>County</strong> <strong>Department</strong> <strong>of</strong> Transportation<br />
Technical Memorandum 3 Yuma Parkway Corridor Feasibility Study<br />
<strong>Conceptual</strong> <strong>Drainage</strong> <strong>Report</strong> 16 August 2011
Per discussions with the FCDMC Project Manager for the Palo Verde Detailed Floodplain<br />
Delineation Study, which is currently being developed, there will be three mapped flooding<br />
sources at this location: the wash known as T1S-R6W-S25 and two split flows <strong>of</strong> this wash.<br />
The detailed delineation study may result in three distinct floodplains with islands in<br />
between the flood hazard areas; however, it may also result in a single very wide floodplain,<br />
as currently shown on FCDMC mapping.<br />
3.4.2 Alluvial Fans<br />
No active alluvial fans have been identified within the Yuma Parkway study area. Active<br />
alluvial fans are extensively documented north <strong>of</strong> I-10 near the White Tank Mountains, but<br />
the Buckeye Flood Retarding Structures effectively block the alluvial fans from extending<br />
south into the study area.<br />
3.4.3 Scour and Sedimentation<br />
Scour and sedimentation associated with the Hassayampa River was analyzed as part <strong>of</strong> the<br />
LHWMP River Behavior <strong>Report</strong> (FCDMC, 2006). The Yuma Parkway crossing occurs in<br />
Reach 2 <strong>of</strong> the Hassayampa River, which extends from just downstream <strong>of</strong> the I-10 Bridge<br />
to just upstream <strong>of</strong> the UPRR Bridge. Total scour (not including local scour) in Reach 2<br />
was estimated to be approximately 10 feet for the 10-year event and 15 feet for the 100-year<br />
event. The largest component <strong>of</strong> calculated scour was bend scour due to the sharp bends in<br />
the active river channel. Degradation <strong>of</strong> the Hassayampa River channel bed was not<br />
expected to be limited by the development <strong>of</strong> an armored layer <strong>of</strong> larger materials. Scour<br />
was also calculated for the transmission lines crossing within the study area as part <strong>of</strong> the<br />
ETS report (SRP, 2010). The report stated a total estimated scour <strong>of</strong> 9.5 feet and 11 feet<br />
respectively for the 25- and 100-yr flood events.<br />
A UPRR bridge located approximately four miles downstream <strong>of</strong> the study area is the<br />
nearest downstream bridge on the Hassayampa River. The LHCMP documented evidence<br />
<strong>of</strong> scour between one to three feet deep at the upstream face <strong>of</strong> three (<strong>of</strong> 12) piers, and no<br />
significant erosion <strong>of</strong> the abutments. The I-10 bridges located approximately 3,000 feet<br />
upstream <strong>of</strong> the study area are the nearest upstream bridges. The LHCMP found no<br />
evidence <strong>of</strong> scour at any <strong>of</strong> the 28 piers. The abutments were protected by rock riprap held<br />
in place by I-beam rails and chain link fencing, but a large scour hole on the east and a<br />
small cutbank on the west were encroaching on the upstream abutments. During the March<br />
2010 field work conducted for the ETS report, some scour was observed around the west<br />
bridge abutment.<br />
Despite the large amount <strong>of</strong> sediment moving through the Hassayampa River system,<br />
historical channel slopes have been relatively constant, suggesting that the system is near<br />
sediment balance equilibrium (FCDMC, 2006). This equilibrium could readily change in<br />
the future if sand and gravel mining in the river or other disturbances reduce the sediment<br />
supply. Increased pressure to mine the Hassayampa River channel for sand and gravel is<br />
likely as development occurs in the area. The LHWMP River Behavior <strong>Report</strong> plotted<br />
historical river pr<strong>of</strong>iles and found that Reach 2 showed net aggradation between 1988 and<br />
2004. In contrast, a HEC-RAS sediment transport model that was completed for the ETS<br />
report suggested that the long-term river behavior tended towards degradation, with a<br />
maximum degradation <strong>of</strong> 1.4 feet over the entire simulation period. The authors noted that<br />
the one-dimensional HEC-RAS model does not account for horizontal erosion processes;<br />
091337133, 2010-055, TT005 <strong>Maricopa</strong> <strong>County</strong> <strong>Department</strong> <strong>of</strong> Transportation<br />
Technical Memorandum 3 Yuma Parkway Corridor Feasibility Study<br />
<strong>Conceptual</strong> <strong>Drainage</strong> <strong>Report</strong> 17 August 2011
this is important in the Hassayampa River since lateral migration should tend to limit<br />
vertical erosion.<br />
Sediment issues are expected to be a potential maintenance concern for any Yuma Parkway<br />
culvert, especially since very high sediment loads have been associated with the<br />
Hassayampa River. The FCDMC provided photos <strong>of</strong> a significant flood event that occurred<br />
in January <strong>of</strong> 2010. One <strong>of</strong> these photos showing sediment deposition <strong>of</strong> the Hassayampa<br />
River near the Tonopah-Salome Highway has been included in Appendix TM3-07. Water<br />
can be seen flowing through the main channel in the background <strong>of</strong> the photo, and the<br />
foreground shows the overbank where slowing flows deposited approximately six feet <strong>of</strong><br />
sediment. Photo 722 in Appendix TM3-05 shows the typical sedimentation that can be<br />
expected in Yuma Parkway culverts.<br />
3.4.4 Sand and Gravel Mining<br />
Numerous active sand and gravel mining operations are present in the Hassayampa River.<br />
According to FCDMC records (2010), the nearest upstream mining permit is approximately<br />
8,000 feet north <strong>of</strong> the Yuma Parkway study area near Indian School Road. The nearest<br />
downstream mining permit is along the southern boundary <strong>of</strong> the study area near the Lower<br />
Buckeye Road alignment. These and other active mining permits in the area are shown in<br />
an exhibit in Appendix TM3-09. Sand and gravel mines create deep pits in the flow<br />
channel – during a flood event sediment that is suspended in the water tends to deposit in<br />
the pits, leaving the water starved <strong>of</strong> sediment. This leads to degradation in the reaches<br />
downstream <strong>of</strong> large mining pits, such as the reach that passes through the study area. It is<br />
also possible that a headcut from the downstream pit along Lower Buckeye Road could<br />
propagate upstream during erosive flood events.<br />
Results from the FLUVIAL-12 Modeling <strong>of</strong> Sand Mining Impacts for Lower Hassayampa<br />
River (FCDMC, 2009) further document that sand and gravel mines in the Hassayampa<br />
River have the potential to greatly impact the long-term channel bed. According to the<br />
FLUVIAL-12 study, the model that includes all approved pits exhibits a bed degradation<br />
that is one foot more than the existing conditions model during a single 100-year flood<br />
event, and eight feet more degradation during the long-term flood series. Both <strong>of</strong> these<br />
values were taken at river station 9.45, which is the closest cross section to the Yuma Road<br />
section line. Additional results and plotted bed pr<strong>of</strong>iles from the FLUVIAL-12 study are<br />
included in Appendix TM3-09. It is expected that as development occurs in the region,<br />
pressure to further mine the Hassayampa River will increase. Ultimate mining pit<br />
configurations should be carefully considered when determining toe-down depths <strong>of</strong> any<br />
structure, such as a bridge or culverts, in the Hassayampa River.<br />
3.4.5 Lateral Erosion<br />
Bank erosion from flood events is a critical concern for potential Yuma Parkway<br />
infrastructure. The LHWMP River Behavior <strong>Report</strong> (FCDMC, 2006) concluded that rather<br />
than undergo significant vertical changes in bed elevation in response to changes in flow or<br />
sediment supply, the river tends to migrate laterally. Both the LHWMP and the ETS report<br />
provide detailed analyses <strong>of</strong> river morphology within the study area. The active channel in<br />
Reach 2 was listed as varying between 100 to 600 feet wide.<br />
091337133, 2010-055, TT005 <strong>Maricopa</strong> <strong>County</strong> <strong>Department</strong> <strong>of</strong> Transportation<br />
Technical Memorandum 3 Yuma Parkway Corridor Feasibility Study<br />
<strong>Conceptual</strong> <strong>Drainage</strong> <strong>Report</strong> 18 August 2011
Vertical cutbanks within the limits <strong>of</strong> the<br />
study area, evidence <strong>of</strong> lateral migration,<br />
varied between two to eight feet at the time <strong>of</strong><br />
the LHWMP field investigation. Cutbanks<br />
were typically located on the outside <strong>of</strong> large<br />
bends in the active channel. Bank materials in<br />
cutbanks were found to be composed <strong>of</strong> noncohesive,<br />
highly erodible fine-grained<br />
alluvium. Photos 662 and 663 in Appendix<br />
TM3-05 show wash banks in the study area<br />
that have recently eroded into near vertical cut<br />
banks. These banks are unstable and may<br />
continue to erode during successive flood<br />
events until a more resistant soil layer is<br />
encountered.<br />
Vertical cutbanks<br />
Appendix TM3-07 presents photos and map<br />
exhibits showing the extent <strong>of</strong> bank erosion <strong>of</strong><br />
the Hassayampa River during the recent January 2010 flood event. As shown in the map<br />
exhibit, the three SRP transmission line towers near the Yuma Road section line were<br />
originally built above the bank <strong>of</strong> the Hassayampa River. The bank <strong>of</strong> the river eroded<br />
approximately 265 feet during this single storm event, exposing the tower footings as<br />
shown in the photos and providing yet another indicator <strong>of</strong> the extremely erosive nature <strong>of</strong><br />
the Hassayampa River. Analysis <strong>of</strong> historical lateral migration events in the ETS report<br />
indicate that internal forces such as pore water pressure likely played a larger factor in bank<br />
migration than external scour forces such as bend scour. Sloughed material at the toe <strong>of</strong> the<br />
banks, as seen in the photo at left, supports this conclusion.<br />
Avulsions (when flows abandon a previously established channel in favor <strong>of</strong> a new drainage<br />
path) can unexpectedly form when some manmade or natural changes are made in the<br />
floodplain terrain. Yuma Parkway improvements should minimize changes to existing flow<br />
paths as much as possible, and provide adequate structural protection <strong>of</strong> the roadway at all<br />
wash crossing locations. Photo 700 in Appendix TM3-05 shows an example <strong>of</strong> bank<br />
stabilization measures that have been constructed within the study area.<br />
The LHWMP classified the Hassayampa River as having a naturally braided pattern, with<br />
the active channel pattern consisting mostly <strong>of</strong> a single channel within the study area. The<br />
river is subject to extreme rates <strong>of</strong> lateral erosion during small and large flood events. The<br />
active flow channel moves laterally on a frequent basis, except at confluences with major<br />
tributaries. The maximum reported change in channel position during a single storm event<br />
was 1,300 feet. The LHWMP included the delineation <strong>of</strong> Hassayampa River erosion hazard<br />
zones to safeguard future development from river bank movement. Existing erosion hazard<br />
maps and historical channel locations are shown in Appendix TM3-08. The ETS report<br />
redefined floodway and erosion hazard zones after the primary flow channel moved in the<br />
January 2010 storm event. These revised erosion hazard figures can be found in Appendix<br />
TM3-07.<br />
Wherever possible, care must be taken to locate foundations and structures, such as<br />
proposed bridge abutments, outside <strong>of</strong> the erosion hazard zones that have been delineated<br />
for the Hassayampa River. This system is highly dynamic and has a history <strong>of</strong> rapidly<br />
091337133, 2010-055, TT005 <strong>Maricopa</strong> <strong>County</strong> <strong>Department</strong> <strong>of</strong> Transportation<br />
Technical Memorandum 3 Yuma Parkway Corridor Feasibility Study<br />
<strong>Conceptual</strong> <strong>Drainage</strong> <strong>Report</strong> 19 August 2011
changing channels. If structures must be placed inside the erosion hazard zones, the ETS<br />
report provided some potential mitigation options: bank protection (such as soil cement),<br />
ring dikes, grade control structure or dumped riprap, training devices (such as bendway<br />
weirs), and detention ponds. The follow-up report, 500 kV Electric Transmission Structures<br />
Hassayampa River Phase 3 Hydrologic Engineering Services (SRP, 2011) provided further<br />
technical analysis for the selected mitigation measure: a single ring dike around the three<br />
transmission towers. As the proposed Yuma Parkway will likely cross the Hassayampa<br />
River near these existing towers, any design improvements in the area will need to consider<br />
both the existing towers and any associated scour countermeasures.<br />
3.5 Existing <strong>Drainage</strong> Structures<br />
3.5.1 Culverts<br />
East <strong>of</strong> the Hassayampa River, the existing<br />
paved Yuma Road contains numerous cross<br />
culverts. These culverts are typically<br />
corrugated metal pipe (CMP) with concrete<br />
headwalls. The design storm <strong>of</strong> these culverts<br />
is not known, but based on field observations<br />
they are only capable <strong>of</strong> containing relatively<br />
small flows. Erosion protection at outlets was<br />
not observed; however, little evidence <strong>of</strong> inlet<br />
or outlet scour was seen in the field.<br />
There are also twin reinforced concrete pipe<br />
(RCP) culverts at the Four Mile Wash<br />
crossing <strong>of</strong> the Salome Highway. These<br />
culverts appear to have grouted riprap instead<br />
<strong>of</strong> headwalls at the pipe inlet and outlet. At Culvert near Palo Verde Road<br />
the present time, there is little evidence <strong>of</strong> scour. Sedimentation does appear to be a<br />
maintenance issue for culverts in this area.<br />
3.5.2 At-Grade Crossings<br />
The existing Buckeye Road features at-grade<br />
dip crossings instead <strong>of</strong> culverts at the eight<br />
study crossing locations west <strong>of</strong> the<br />
Hassayampa River. The larger washes have<br />
concrete aprons on the upstream and<br />
downstream sides <strong>of</strong> the at-grade crossings.<br />
Evidence <strong>of</strong> downstream undercutting <strong>of</strong> this<br />
apron, as shown in the photo at right, was<br />
found at the Dickey Wash crossing.<br />
As the intent <strong>of</strong> drainage design for Yuma<br />
Parkway will be to maintain existing flow<br />
patterns to the extent feasible, it is expected<br />
that more detailed hydraulic calculations will<br />
Dickey Wash crossing<br />
091337133, 2010-055, TT005 <strong>Maricopa</strong> <strong>County</strong> <strong>Department</strong> <strong>of</strong> Transportation<br />
Technical Memorandum 3 Yuma Parkway Corridor Feasibility Study<br />
<strong>Conceptual</strong> <strong>Drainage</strong> <strong>Report</strong> 20 August 2011
e required if culverts are proposed at a future date. Care must be exercised to avoid<br />
adverse flooding impacts on upstream adjacent properties if the proposed roadway is raised<br />
for a dry crossing, and to avoid adverse flooding impacts on downstream properties by<br />
concentrating sheet flows at crossing locations.<br />
3.5.3 Channels<br />
The only drainage channels observed during<br />
the field visit were at Stotz Dairy and Phillips<br />
Wash. An earthen channel has been<br />
constructed south <strong>of</strong> Yuma Road through the<br />
dairy property. This channel likely has been<br />
designed to convey both <strong>of</strong>fsite flows and<br />
local onsite run<strong>of</strong>f from the dairy land. As<br />
with all the drainages east <strong>of</strong> the Hassayampa<br />
River, little <strong>of</strong>fsite flow is expected due to the<br />
Buckeye FRS #1.<br />
The partial channelization <strong>of</strong> Phillips Wash<br />
occurs downstream <strong>of</strong> Buckeye Road. The<br />
wash bed is at the natural location, but a<br />
vertical gabion wall has been constructed<br />
along the east bank to protect 355 th Avenue<br />
from lateral migration <strong>of</strong> the wash. This<br />
Stotz Dairy channel<br />
gabion wall is displayed in Photo 700 <strong>of</strong> Appendix TM3-05.<br />
3.5.4 Buckeye Flood Retarding Structure #1<br />
Buckeye Flood Retarding Structure (FRS) #1 is located immediately east <strong>of</strong> the<br />
Hassayampa River and north <strong>of</strong> I-10. This earthen embankment was constructed in 1974 to<br />
provide flood protection for the interstate and downstream properties. The embankment is<br />
approximately seven miles long and outlets west into the Hassayampa River. Yuma<br />
Parkway will not impact the Buckeye FRS #1, but the dam impacts <strong>of</strong>fsite flows that reach<br />
the study area. The structure intercepts <strong>of</strong>fsite flows that historically traveled south through<br />
the study area east <strong>of</strong> the Hassayampa River. This run<strong>of</strong>f is instead retained behind the<br />
dam; with excessive flows from large storm events being discharged directly to the<br />
Hassayampa River. If the earthen embankment were to fail when water is impounded, the<br />
entire study area east <strong>of</strong> the Hassayampa River could potentially be at risk <strong>of</strong> inundation.<br />
The potential inundation areas and flood depths/velocities from the Emergency Action Plan<br />
for the Buckeye Structures (FCDMC, 2007) are included in Appendix TM3-09.<br />
The FCDMC is currently in the design phase <strong>of</strong> a rehabilitation project for Buckeye FRS<br />
#1. Overall rehabilitation has been chosen as the alternative to move forward into final<br />
design. Based on conversations with the FCDMC Project Manager (2011), this alternative<br />
does not represent a significant change from existing conditions. The principal spillway<br />
capacity is approximately 400 cfs, which is much less than flood flows within the<br />
Hassayampa River. The emergency spillway is utilized only for events greater than the<br />
500-year flood.<br />
091337133, 2010-055, TT005 <strong>Maricopa</strong> <strong>County</strong> <strong>Department</strong> <strong>of</strong> Transportation<br />
Technical Memorandum 3 Yuma Parkway Corridor Feasibility Study<br />
<strong>Conceptual</strong> <strong>Drainage</strong> <strong>Report</strong> 21 August 2011
4. EXISTING HYDROLOGY<br />
Various hydrologic studies have been completed that together encompass the entire study area. These<br />
existing studies were not necessarily performed to the same level <strong>of</strong> detail. Some studies, typically<br />
those intended for planning purposes, focused on broad drainage trends, featuring large subbasins and a<br />
limited number <strong>of</strong> concentration points. On the other hand, studies intended for floodplain delineation<br />
purposes typically used small subbasins and a large number <strong>of</strong> concentration points. To present a<br />
consistent level <strong>of</strong> hydrologic analysis throughout this study, <strong>of</strong>fsite flows were reported at each<br />
location where a regulatory 100-year floodplain or a United States Geological Survey (USGS) “blue<br />
line” stream crossed the study corridor centerline. Regulatory floodplains can be FEMA effective<br />
floodplains or 100-year floodplains that have been recognized by FCDMC. USGS “blue lines” refer to<br />
intermittent and perennial streams that are shown (in blue) on the commonly referenced USGS primary<br />
series quadrangle maps. Table 1 presents an overview <strong>of</strong> the <strong>of</strong>fsite hydrology concentration points<br />
examined for this report.<br />
The location <strong>of</strong> each <strong>of</strong>fsite drainage crossing is provided in Figure 6. <strong>Drainage</strong> crossings 1-9 are<br />
located in the region west <strong>of</strong> the Hassayampa River. Crossings 10-13 are in the Hassayampa River<br />
region and Crossings 14-18 are located in the region east <strong>of</strong> the Hassayampa River. Six named washes<br />
exist in the study area.<br />
4.1 Summary <strong>of</strong> Hydrology Methods<br />
Existing hydrology data for the study area was extracted for each <strong>of</strong> the 18 <strong>of</strong>fsite concentration<br />
points from the following five studies:<br />
� Palo Verde Watershed Detailed Floodplain Delineation Study Hydrology Study<br />
(FCDMC, Draft 2010);<br />
� Hydrologic Study <strong>Report</strong> for Luke Wash Zone AE Floodplain Delineation Study<br />
(FCDMC, 2008);<br />
� Hydrologic Analysis <strong>of</strong> the Hassayampa River in <strong>Maricopa</strong> <strong>County</strong>, Arizona (FEMA,<br />
1988); and<br />
� Buckeye Area <strong>Drainage</strong> Master Plan Existing Conditions Hydrology Update (FCDMC,<br />
2008).<br />
Figure 6 shows the subbasins within each <strong>of</strong> these watersheds grouped by color. Concentration<br />
points in existing studies were used directly if located near the study corridor. If a crossing was<br />
not near a published concentration point, the peak flow was calculated as the contributing area<br />
weighted portion <strong>of</strong> the next downstream published value. The methodology used in each existing<br />
study is summarized as follows. The watersheds are discussed from a west to east direction.<br />
4.1.1 Palo Verde Watershed<br />
The 100-year, 6-hour and 24-hour storm events were modeled for the Palo Verde<br />
Watershed using HEC-1 s<strong>of</strong>tware, in conjunction with methods and procedures described<br />
by FCDMC. <strong>Drainage</strong> Design Management System for Windows (DDMSW) s<strong>of</strong>tware was<br />
utilized to prepare the input parameters for the HEC-1 models. ArcGIS was utilized to<br />
prepare parameters for modeling purposes.<br />
091337133, 2010-055, TT005 <strong>Maricopa</strong> <strong>County</strong> <strong>Department</strong> <strong>of</strong> Transportation<br />
Technical Memorandum 3 Yuma Parkway Corridor Feasibility Study<br />
<strong>Conceptual</strong> <strong>Drainage</strong> <strong>Report</strong> 22 August 2011
Crossing<br />
ID Watercourse Name<br />
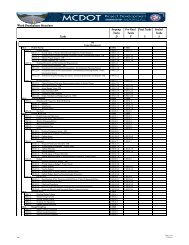
Table 1 – Significant Offsite <strong>Drainage</strong> Crossings<br />
Nearest Cross<br />
Street<br />
FEMA /<br />
FCDMC<br />
Regulatory<br />
Floodplain<br />
USGS<br />
"Blue<br />
Line"<br />
1 Four Mile Wash 388 th Ave Yes Yes<br />
2 T1N-R6W-S17E 387 th Ave Yes No<br />
3 T1N-R6W-S08 379 th Ave Yes No<br />
4 T1N-R6W-S16 377 th Ave Yes No<br />
5 T1S-R6W-S27 376 th Ave Yes Yes<br />
6 T1S-R5W-S17 363 rd Ave Yes Yes<br />
7 Phillips Wash 355 th Ave Yes Yes<br />
8 Dickey Wash 350 th Ave Yes Yes<br />
9 Luke Wash 343 rd Ave Yes Yes<br />
10 T1N-5W-S22 336 th Ave Yes Yes<br />
11 T1N-5W-S15 333 rd Ave Yes Yes<br />
12 Hassayampa River N/A Yes Yes<br />
13 Unnamed Tributary to Hassayampa River Powers Butte Rd Yes Yes<br />
14 Unnamed Tributary to Hassayampa River 315 th Ave Yes Yes<br />
15 White Tanks Wash 309 th Ave Yes Yes<br />
16 Unnamed Tributary to Gila River Johnson Rd No Yes<br />
17 Unnamed Tributary to Gila River N/A No Yes<br />
18 Unnamed Tributary to Gila River Palo Verde Rd No Yes<br />
091337133, 2010-055, TT005 <strong>Maricopa</strong> <strong>County</strong> <strong>Department</strong> <strong>of</strong> Transportation<br />
Technical Memorandum 3 Yuma Parkway Corridor Feasibility Study<br />
<strong>Conceptual</strong> <strong>Drainage</strong> <strong>Report</strong> 23 August 2011
Figure 6 – Offsite Hydrology Workmap<br />
091337133, 2010-055, TT005 <strong>Maricopa</strong> <strong>County</strong> <strong>Department</strong> <strong>of</strong> Transportation<br />
Technical Memorandum 3 Yuma Parkway Corridor Feasibility Study<br />
<strong>Conceptual</strong> <strong>Drainage</strong> <strong>Report</strong> 24 August 2011
National Oceanic and Atmospheric Administration (NOAA) Atlas 14 rainfall data was used<br />
to estimate the design rainfall depth for this study. FCDMC 6-hour local storm distributions<br />
for the 6-hour model and the SCS Type II precipitation distribution for the 24-hour model<br />
were used for HEC-1 rainfall distributions. The Green and Ampt infiltration equations were<br />
utilized for the estimation <strong>of</strong> rainfall losses. Topography used for the study consisted<br />
primarily <strong>of</strong> 10-foot contour interval mapping north <strong>of</strong> the CAP Canal and 2-foot contour<br />
interval data south <strong>of</strong> the CAP Canal. Aerial mapping (2008) was used to adjust subbasin<br />
delineations as appropriate.<br />
Normal depth channel routing methodology was utilized in the hydrologic model to route<br />
surface run<strong>of</strong>f through subbasins, and the Modified Puls method with stage-storagedischarge<br />
relationships was used for storage routing. Rating tables to determine flow splits<br />
were based on normal depth hydraulic calculations. The longitudinal slopes were estimated<br />
with ArcGIS based on existing topography, and Manning’s “n” values were based on field<br />
reconnaissance and aerial photography.<br />
Events were modeled for two separate conditions: a “With Levee” scenario that accounts<br />
for the effects <strong>of</strong> structures such as the CAP Canal, I-10, Palo Verde Power Plant, and<br />
Salome Highway, and a “Without Levee” scenario that ignores the embankments (FCDMC,<br />
2010). Of particular relevance to the Yuma Parkway study, the Salome Highway near Four<br />
Mile Wash is one <strong>of</strong> the non-certified levees that is modeled differently in the two<br />
scenarios. In the “Without Levee” models the full flow is routed directly across the<br />
highway, but in the “With Levee” models some <strong>of</strong> the flow is diverted east.<br />
4.1.2 Luke Wash Watershed<br />
The 100-year, 6-hour and 24-hour storm events were modeled for the Luke Wash watershed<br />
using HEC-1 s<strong>of</strong>tware, in conjunction with methods and procedures described by FCDMC.<br />
Watershed Modeling System (WMS) s<strong>of</strong>tware was used to develop the preliminary<br />
subbasin boundary delineations. DDMSW s<strong>of</strong>tware was utilized to prepare the input<br />
parameters for the HEC-1 models. ArcGIS was applied to transfer databases available from<br />
FCDMC to prepare parameters for modeling purposes. Surface run<strong>of</strong>f from the subbasins<br />
has the potential to concentrate at more than one point. It was assumed that the<br />
concentration point was located at the hydrologic low point <strong>of</strong> the subbasin (FCDMC,<br />
2008).<br />
NOAA 14 rainfall data was used to estimate the design rainfall depth for this study.<br />
FCDMC 6-hour local storm distributions for the 6-hour model and the SCS Type II<br />
precipitation distribution for the 24-hour model were used for HEC-1 rainfall distributions.<br />
The Green and Ampt Method was utilized for the estimation <strong>of</strong> rainfall losses. The S-<br />
Graph method was used for the development <strong>of</strong> unit hydrographs.<br />
Normal depth channel routing methodology was utilized in the hydrologic model to route<br />
surface run<strong>of</strong>f through subbasins. An eight-point composite channel cross-section was<br />
developed to represent typical wash cross-section conveyance using 2-foot contour<br />
mapping. The longitudinal slopes were estimated based on general existing wash slopes,<br />
and Manning’s “n” values were based on field reconnaissance estimates.<br />
091337133, 2010-055, TT005 <strong>Maricopa</strong> <strong>County</strong> <strong>Department</strong> <strong>of</strong> Transportation<br />
Technical Memorandum 3 Yuma Parkway Corridor Feasibility Study<br />
<strong>Conceptual</strong> <strong>Drainage</strong> <strong>Report</strong> 25 August 2011
4.1.3 Hassayampa River<br />
Peak discharges at three existing stream gage locations were calculated using a Log-Pearson<br />
Type III statistical analysis <strong>of</strong> each site’s gage records. Yuma Parkway is upstream <strong>of</strong> gage<br />
station 95170 (Arlington) and downstream <strong>of</strong> gage station 95165 (Morristown), which had<br />
22 and 30 years <strong>of</strong> recorded data, respectively. The study recommended using a 100-year<br />
peak discharge <strong>of</strong> 74,100 cfs at the Arlington gage station and 61,600 cfs at the Morristown<br />
gage station. The original published discharge (FEMA, 1988) nearest the study area was<br />
the Hassayampa River at I-10 with a 100-year peak <strong>of</strong> 74,800 cfs. Flow rates for locations<br />
between the previously described reference stations were calculated by interpolation using<br />
an attenuation rate per stream mile.<br />
4.1.4 Buckeye Area Watershed<br />
The 100-year and 10-year, 6-hour and 24-hour storm events were modeled for the Buckeye<br />
Area Watershed using HEC-1 s<strong>of</strong>tware, in conjunction with methods and procedures<br />
described by FCDMC. DDMSW s<strong>of</strong>tware was utilized to prepare the input parameters for<br />
the HEC-1 models. The primary goal <strong>of</strong> this hydrology update was to update existing land<br />
uses in the hydrologic model.<br />
NOAA 2 rainfall data was used to estimate the design rainfall depth for this study. Rainfall<br />
distributions for the 6-hour storm were taken from the FCDMC Hydrology Manual. SCS<br />
Type II precipitation distributions were used for 24-hour models. The Green and Ampt<br />
Method was utilized for the estimation <strong>of</strong> rainfall losses. The S-Graph method was used for<br />
the development <strong>of</strong> unit hydrographs.<br />
Normal depth channel routing methodology was used to route run<strong>of</strong>f through subbasins.<br />
An eight-point composite channel cross-section was obtained from field surveys to<br />
represent typical wash cross-section conveyance. Some routing channels were expanded if<br />
they were incapable <strong>of</strong> conveying the 100-year peak discharge. Retention basin information<br />
<strong>of</strong> existing developments was collected from drainage reports or estimated from Buckeye’s<br />
100-year, 2-hour retention requirement and accounted for in the storage routing.<br />
4.2 Offsite Hydrology Results<br />
Detailed hydrologic analysis was not performed as part <strong>of</strong> this study. The existing peak 100-year<br />
flows for each major wash crossing <strong>of</strong> the study area are listed in Table 2. The wash information<br />
presented previously is also included to provide a comprehensive summary <strong>of</strong> the <strong>of</strong>fsite<br />
hydrology at each crossing. Note that the contributing basins shown in Figure 6 have been<br />
trimmed at the section line, and the drainage areas reported in Table 2 reflect these revised areas.<br />
Table 2 indicates if the peak flow was taken directly from an existing study or if the discharge<br />
was calculated as a contributing area weighted portion <strong>of</strong> a published value. The concentration<br />
point or subbasin identification and storm duration used in each existing study are also presented.<br />
Excerpts from the original source documents <strong>of</strong> each respective hydrologic study are included in<br />
Appendix TM3-10.<br />
The regional watercourse within the study area is the Hassayampa River (Crossing 12). The peak<br />
flows presented for these large crossings in Table 2 reflect the effective FEMA discharges, but it<br />
should be noted that these values have been the subject <strong>of</strong> significant debate. A limited record <strong>of</strong><br />
stream gage measurements were available when the peak flows were calculated for FEMA in<br />
091337133, 2010-055, TT005 <strong>Maricopa</strong> <strong>County</strong> <strong>Department</strong> <strong>of</strong> Transportation<br />
Technical Memorandum 3 Yuma Parkway Corridor Feasibility Study<br />
<strong>Conceptual</strong> <strong>Drainage</strong> <strong>Report</strong> 26 August 2011
1988 and new statistical analyses continue to be performed as more gage data becomes available.<br />
An analysis completed for the FCDMC as part <strong>of</strong> the LHWMP Hydrology <strong>Report</strong> (FCDMC,<br />
2005) presented peak discharges that were much lower than the effective peak discharges. For<br />
instance, the Hassayampa River 100-year flow rate at I-10 was calculated as 39,000 cfs. The<br />
100-year flow presented in the original 1988 FEMA report was 74,100 cfs, and the most recent<br />
FEMA effective flow is 75,164 cfs at this location. The USGS is also conducting a statistical<br />
analysis <strong>of</strong> their Hassayampa River gage records and should present results soon. However,<br />
despite the varying results it is unlikely that FCDMC and FEMA will adopt different regulatory<br />
flows for these reaches in the near future. The recommended design flows for the Hassayampa<br />
Rivers is the FEMA effective flow shown in Table 2.<br />
091337133, 2010-055, TT005 <strong>Maricopa</strong> <strong>County</strong> <strong>Department</strong> <strong>of</strong> Transportation<br />
Technical Memorandum 3 Yuma Parkway Corridor Feasibility Study<br />
<strong>Conceptual</strong> <strong>Drainage</strong> <strong>Report</strong> 27 August 2011
Crossing<br />
ID<br />
Watercourse Name<br />
Nearest Cross<br />
Street<br />
<strong>Drainage</strong><br />
Area<br />
(mi 2 )<br />
Table 2 – Offsite Hydrology Results<br />
FEMA /<br />
FCDMC<br />
Regulatory<br />
Floodplain<br />
USGS "Blue<br />
Line"<br />
Calculation Method Existing Study Name<br />
1 Four Mile Wash 388th Ave 17.92 Yes Yes published value Palo Verde FDS C760M 24-Hour 3,659<br />
2 T1N-R6W-S17E 387th Ave 1.86 Yes No published value Palo Verde FDS C770C 24-Hour 1,674<br />
3 T1N-R6W-S08 379th Ave 0.73 Yes No published value Palo Verde FDS S800A 6-Hour 800<br />
4 T1N-R6W-S16 377th Ave 0.10 Yes No published value Palo Verde FDS S800B 6-Hour 360<br />
5 T1S-R6W-S27 376th Ave 5.53 Yes Yes published value Palo Verde FDS C910J 24-Hour 848<br />
6 T1S-R5W-S17 363rd Ave 6.03 Yes Yes published value Luke Wash FDS C20h 24-Hour 1,045<br />
7 Phillips Wash 355th Ave 8.34 Yes Yes published value Luke Wash FDS C40c 24-Hour 2,107<br />
8 Dickey Wash 350th Ave 4.98 Yes Yes published value Luke Wash FDS C60b 24-Hour 1,571<br />
9 Luke Wash 343rd Ave 1.09 Yes Yes published value Luke Wash FDS 36c 24-Hour 702<br />
10 T1N-5W-S22 336th Ave 0.28 Yes Yes published value Luke Wash FDS 80b 24-Hour 404<br />
11 T1N-5W-S15 333rd Ave 0.51 Yes Yes published value Luke Wash FDS 81b 24-Hour 495<br />
12 Hassayampa River<br />
091337133, 2010-055, TT005 <strong>Maricopa</strong> <strong>County</strong> <strong>Department</strong> <strong>of</strong> Transportation<br />
Technical Memorandum 3 Yuma Parkway Corridor Feasibility Study<br />
<strong>Conceptual</strong> <strong>Drainage</strong> <strong>Report</strong> 28 August 2011<br />
Existing<br />
Study ID<br />
Storm<br />
Duration<br />
Peak 100-<br />
Year Flow<br />
(cfs)<br />
1,450 Yes Yes published value FEMA FIS At I-10 6-Hour 75,164<br />
13 Unnamed Tributary to Hassayampa River Powers Butte Rd 1.07 Yes Yes partial area pro-rate Buckeye ADMP A1 6-Hour 1,040<br />
14 Unnamed Tributary to Hassayampa River 315th Ave 0.83 Yes Yes partial area pro-rate Buckeye ADMP E1 6-Hour 774<br />
15 White Tanks Wash 309th Ave 0.53 Yes Yes partial area pro-rate Buckeye ADMP E2 6-Hour 342<br />
16 Unnamed Tributary to Gila River Johnson Rd 0.87 No Yes partial area pro-rate Buckeye ADMP 1 6-Hour 308<br />
17 Unnamed Tributary to Gila River<br />
0.50 No Yes partial area pro-rate Buckeye ADMP 2 6-Hour 556<br />
18 Unnamed Tributary to Gila River Palo Verde Rd 0.07 No Yes partial area pro-rate Buckeye ADMP 2 6-Hour 76
5. SUMMARY AND CONCLUSIONS<br />
The purpose <strong>of</strong> TM 3 is to provide an overview <strong>of</strong> the existing drainage conditions and patterns,<br />
including peak flows, for the study area based on available studies and data. The findings <strong>of</strong> this<br />
memorandum will help determine the preferred alignment for the proposed Yuma Parkway. <strong>Drainage</strong><br />
structures and features in and around the study area have been identified and should be considered<br />
during the design <strong>of</strong> the future parkway. Peak flows reported in this memorandum have been compiled<br />
for planning purposes only. Discharges should be evaluated based on FCDMC drainage criteria during<br />
final design <strong>of</strong> the parkway.<br />
The impacts <strong>of</strong> crossing the numerous washes in the study area should be a significant consideration<br />
when developing and evaluating potential parkway alignment alternatives. <strong>Drainage</strong> structures, such as<br />
bridges and box culverts, necessary to convey flood flows under the proposed parkway will play a<br />
considerable role in both the cost and impacts <strong>of</strong> the project. Structures that are too large will result in<br />
unnecessary capital costs for the project; however, structures that are too small can cause substantial<br />
adverse impacts to adjacent properties and the environment and also result in increased maintenance<br />
costs. As a result, the two overarching goals <strong>of</strong> drainage design for Yuma Parkway are to minimize the<br />
impacts <strong>of</strong> the proposed parkway on existing drainage patterns, and to minimize the impacts <strong>of</strong> drainage<br />
on the parkway.<br />
Four Mile Wash is a major wash crossing that may be avoided with an adjustment <strong>of</strong> the proposed<br />
alignment for Yuma Parkway. The Four Mile Wash floodplain is approximately 3,300 feet wide at the<br />
intersection <strong>of</strong> the Salome Highway and the Buckeye Road alignment. If the Yuma Parkway alignment<br />
were to tie into the Salome Highway further east (south <strong>of</strong> the section line), the crossing could be<br />
avoided completely.<br />
Due to the nature <strong>of</strong> the study area, most wash crossings, unlike Four Mile Wash, are unavoidable<br />
regardless <strong>of</strong> the proposed alignment. At these locations, Yuma Parkway could cause incremental<br />
increases in inundation upstream <strong>of</strong> the road as well as increased flow velocities downstream <strong>of</strong> the<br />
road. As a result, the configuration and size <strong>of</strong> the drainage structures at these crossings are vital to<br />
avoiding adverse impacts to upstream and downstream properties. Avoiding adverse floodplain impacts<br />
are particularly important for the multiple drainage systems where flood flows are not contained in a<br />
well-defined channel, such as the drainage system near 371st Avenue. These watercourses typically<br />
have wide floodplains with shallow flow depths, and existing roadway crossings mainly consist <strong>of</strong> atgrade<br />
dip crossings. Concentrating flows to provide improved dry crossings <strong>of</strong> Yuma Parkway must be<br />
done carefully to avoid adverse impacts upstream and downstream <strong>of</strong> the project.<br />
The most critical drainage crossing within the study corridor is at the Hassayampa River. In addition to<br />
floodplain impacts, the location and size <strong>of</strong> this proposed bridge crossing should take into account the<br />
highly dynamic nature <strong>of</strong> the watercourse. The river has demonstrated a significant potential for lateral<br />
migration <strong>of</strong> the river channel, especially within the Yuma Parkway study area, as evidenced by the<br />
January 2010 flood which eroded the river bank and exposed the footings <strong>of</strong> several SRP transmission<br />
line towers. If possible, proposed bridge abutments and other structures, should be located outside <strong>of</strong><br />
the erosion hazard zones that have been delineated for the river. In addition, while the river appears to<br />
be in dynamic equilibrium (i.e., no trends toward significant aggradation or degradation) any potential<br />
changes to the sediment supply, such as increased sand and gravel mining operations, could cause longterm<br />
changes to river bed elevation and further impact the proposed bridge crossing.<br />
091337133, 2010-055, TT005 <strong>Maricopa</strong> <strong>County</strong> <strong>Department</strong> <strong>of</strong> Transportation<br />
Technical Memorandum 3 Yuma Parkway Corridor Feasibility Study<br />
<strong>Conceptual</strong> <strong>Drainage</strong> <strong>Report</strong> 29 August 2011
Sedimentation is another factor that should be taken into account when designing proposed drainage<br />
structures. The high sediment loads associated with the Hassayampa River and its tributaries should be<br />
considered when sizing culverts. Undersized culverts can become easily clogged with sediment, which<br />
in turn can cause flooding problems upstream and possibly cause degradation downstream. Culverts<br />
should be sized appropriately to allow for the conveyance <strong>of</strong> sediment-laden flows, thereby maintaining<br />
the existing sediment continuity <strong>of</strong> the system.<br />
In summary, the most important drainage issue to be considered during the alignment alternatives<br />
analysis is the location <strong>of</strong> crossings at the Hassayampa River and other major washes. The location,<br />
configuration and size <strong>of</strong> these crossings will play a substantial role in determining both the capital and<br />
long-term costs <strong>of</strong> the Yuma Parkway project as well as the impacts to existing conditions. If properly<br />
designed, the drainage structures will meet the two-fold goal <strong>of</strong> minimizing the impacts <strong>of</strong> Yuma<br />
Parkway on drainage and minimizing the impacts <strong>of</strong> drainage on Yuma Parkway.<br />
091337133, 2010-055, TT005 <strong>Maricopa</strong> <strong>County</strong> <strong>Department</strong> <strong>of</strong> Transportation<br />
Technical Memorandum 3 Yuma Parkway Corridor Feasibility Study<br />
<strong>Conceptual</strong> <strong>Drainage</strong> <strong>Report</strong> 30 August 2011
APPENDIX TM3-01<br />
DATA COLLECTION SUMMARY<br />
091337133, 2010-055, TT005 <strong>Maricopa</strong> <strong>County</strong> <strong>Department</strong> <strong>of</strong> Transportation<br />
Technical Memorandum 3 Yuma Parkway Corridor Feasibility Study<br />
<strong>Conceptual</strong> <strong>Drainage</strong> <strong>Report</strong> August 2011
AZGS = Arizona Geological Survey<br />
ADOT = Arizona <strong>Department</strong> <strong>of</strong> Transportation<br />
ADWR = Arizona <strong>Department</strong> <strong>of</strong> Water Resources<br />
FCDMC = Flood Control District <strong>of</strong> <strong>Maricopa</strong> <strong>County</strong><br />
FEMA = Federal Emergency Management Agency<br />
KHA = Kimley-Horn and Associates<br />
MAG = <strong>Maricopa</strong> Associated Governments<br />
MC - <strong>Maricopa</strong> <strong>County</strong><br />
MCDOT - <strong>Maricopa</strong> <strong>County</strong> <strong>Department</strong> <strong>of</strong> Transportation<br />
LIBRARY<br />
KHA<br />
No.<br />
Summary Table <strong>of</strong> Documents Reviewed - Kimley-Horn and Associates<br />
Yuma Parkway<br />
Corridor Feasibility Study<br />
Data Collection Summary<br />
ITEM TRACKING<br />
Title Description Author Date Source<br />
<strong>Drainage</strong> Document Inventory<br />
Format/<br />
File Type<br />
Collected<br />
By<br />
Discipline<br />
75<br />
500 kV Electric Transmission Structures<br />
Hassayampa River Hydrologic Engineering<br />
Services<br />
Examines hydraulics, scour, and sediment<br />
transport <strong>of</strong> Hassayampa River as it relates to the<br />
WEST Consultants<br />
tower foundations along the banks. Also<br />
presents mitigation alternatives<br />
Aug 2010 WEST pdf BML <strong>Drainage</strong><br />
500 kV Electric Transmission Structures Describes ring dike scour protection measures<br />
76 Hassayampa River Phase 3 Hydrologic<br />
for selected alternative at transmission tower WEST Consultants Feb 2011 WEST pdf BML <strong>Drainage</strong><br />
Engineering Services<br />
foundations<br />
79<br />
A New Earth Fissure near Wintersburg,<br />
<strong>Maricopa</strong>, Arizona<br />
report, maps, geology, + photos on earth fissure<br />
and nearby giant desiccation cracks, Open-File<br />
<strong>Report</strong> 01-10<br />
AZGS Nov 2001 AZGS pdf BML Geology<br />
2<br />
Active Land Subsidence Areas in Arizona Based<br />
on ADWR InSAR Data<br />
map showing active subsidence areas ADWR Jul 2009 ADWR pdf BML Water<br />
80<br />
Additional Giant Desiccation Cracks near<br />
Wintersburg, <strong>Maricopa</strong> <strong>County</strong>, Arizona<br />
report, maps, + photos on cracks, Open-File<br />
<strong>Report</strong> 03-07<br />
Shapefiles: recharge points, industry points,<br />
AZGS Nov 2003 AZGS pdf BML Geology<br />
3 ADWR GIS Data CD-ROM<br />
depth to water and water level elev (Phoenix AMA ADWR<br />
only), irrigation polygons, hardrock<br />
Mar 2009 ADWR CD BML Water<br />
7<br />
As-Built <strong>Report</strong> p Buckeye y Site 1 Drain <strong>Maricopa</strong> p<br />
<strong>County</strong>, Arizona<br />
as-built inspection report for 4.5 miles <strong>of</strong> 17.5'<br />
ddeep embankment b k t ddrain i ttrench h for f Buckeye B k FRS<br />
ERTEC ERTEC, IInc. #1, includes plans at end <strong>of</strong> document<br />
MMar 1981 FCDMC pdf df BML D<strong>Drainage</strong> i<br />
68<br />
Bridge Scour and Design <strong>of</strong> Corrective Measures<br />
presents 3 alternatives for scour<br />
for Old U.S. 80 Highway Bridge over<br />
countermeasures<br />
Hassayampa River<br />
Bridge Scour Assessment <strong>Report</strong>s for 16<br />
INCA Engineers Oct 1997 FCDMC pdf BML <strong>Drainage</strong><br />
67<br />
<strong>Maricopa</strong> <strong>County</strong> Bridges Volume II Structure<br />
Numbers 9427, 9588, 9999, 8038, 7818, 9154,<br />
9142, 7553<br />
assesses scour failure for superflood at Old US<br />
80 Bridge over Hassayampa River<br />
Cannon &<br />
Associates<br />
Jul 1996 FCDMC pdf BML <strong>Drainage</strong><br />
74<br />
Buckeye Area <strong>Drainage</strong> Master Plan Existing<br />
Conditions Hydrology Update<br />
updates HEC-1 models from ADMS with newer<br />
(existing) land use and limited retention basin<br />
information<br />
describes various plan components to manage<br />
Dibble Engineering Mar 2008 FCDMC pdf BML <strong>Drainage</strong><br />
8<br />
Buckeye Area <strong>Drainage</strong> Master Plan<br />
Recommended Design <strong>Report</strong><br />
run<strong>of</strong>f. Study area is south <strong>of</strong> I-10. Also includes<br />
Dibble Engineering<br />
<strong>Conceptual</strong> Design Plans for recommended<br />
channels and detention basins.<br />
Jun 2009 FCDMC pdf BML <strong>Drainage</strong><br />
9<br />
FEMA report to estimate 100-yr peak flows for<br />
Buckeye Area Flood Delineation Study Hydrology<br />
McLaughlin Kmetty<br />
floodplain delineation. Study area is south <strong>of</strong> I-10<br />
<strong>Report</strong><br />
Engineers<br />
so not esp. pertinent to NP.<br />
Jul 1992 FCDMC pdf BML <strong>Drainage</strong><br />
61<br />
Buckeye Area Flood Delineation Study Public<br />
Notification and FEMA Forms RSD-1 Document<br />
documentation notebook for detailed floodplains<br />
along RID Canal, SPRR, and Buckeye Canal<br />
embankments<br />
FCDMC Apr 1994 FCDMC pdf BML <strong>Drainage</strong><br />
KHA Project No. 091337133<br />
K:\PHX_Systems\091337133-MCDOT Yuma Parkway\Data Collection\Data Collection Summary.xls 1 <strong>of</strong> 4
AZGS = Arizona Geological Survey<br />
ADOT = Arizona <strong>Department</strong> <strong>of</strong> Transportation<br />
ADWR = Arizona <strong>Department</strong> <strong>of</strong> Water Resources<br />
FCDMC = Flood Control District <strong>of</strong> <strong>Maricopa</strong> <strong>County</strong><br />
FEMA = Federal Emergency Management Agency<br />
KHA = Kimley-Horn and Associates<br />
MAG = <strong>Maricopa</strong> Associated Governments<br />
MC - <strong>Maricopa</strong> <strong>County</strong><br />
MCDOT - <strong>Maricopa</strong> <strong>County</strong> <strong>Department</strong> <strong>of</strong> Transportation<br />
LIBRARY<br />
KHA<br />
No.<br />
Summary Table <strong>of</strong> Documents Reviewed - Kimley-Horn and Associates<br />
Yuma Parkway<br />
Corridor Feasibility Study<br />
Data Collection Summary<br />
ITEM TRACKING<br />
Title Description Author Date Source<br />
<strong>Drainage</strong> Document Inventory<br />
Format/<br />
File Type<br />
Collected<br />
By<br />
Discipline<br />
84<br />
Buckeye Flood Retarding Structure No. 1<br />
Rehabilitation Project<br />
Buckeye/Sun Valley Area <strong>Drainage</strong> Master Study<br />
study currently under development (in final design<br />
FCDMC<br />
phase) to fully rehab embankment<br />
pending FCDMC phone BML <strong>Drainage</strong><br />
66 Geomorphic Evaluation and Landform Stability<br />
Assessment<br />
focuses on areas 3/4 -- not relevant Ayres Associates Jul 2005 FCDMC pdf BML <strong>Drainage</strong><br />
64<br />
presents existing regulations, potential<br />
Buckeye/Sun Valley Area <strong>Drainage</strong> Master Study<br />
flooding/erosion impacts due to development,<br />
Guidelines for Development<br />
and proposed guidelines<br />
Buckeye/Sun Valley Area <strong>Drainage</strong> Master Study<br />
PBS&J Jan 2006 FCDMC pdf BML <strong>Drainage</strong><br />
62<br />
Technical Data Notebook Volume IV-B: Area 2<br />
Hydrology, Hydraulics, and Floodplain<br />
Delineation <strong>Report</strong><br />
Buckeye/Sun Valley Area <strong>Drainage</strong> Master Study<br />
See title (Area 2 is from Hassayampa River to<br />
Johnson Rd)<br />
PBS&J Feb 2006 FCDMC pdf BML <strong>Drainage</strong><br />
63 Technical Data Notebook Volume V-A2: Area 3<br />
Hydrology <strong>Report</strong><br />
Area 3 is north <strong>of</strong> I-10, so probably not relevant PBS&J Feb 2006 FCDMC pdf BML <strong>Drainage</strong><br />
65<br />
Buckeye/Sun Valley Area <strong>Drainage</strong> Master Study<br />
short memos and erosion hazard setback<br />
Technical Memorandum T2.6.5 Delineation <strong>of</strong><br />
mapping for area 2 and 3<br />
Erosion Hazard Setbacks<br />
Ayres Associates May 2005 FCDMC pdf BML <strong>Drainage</strong><br />
10<br />
BBuckeye/Sun k /S VValley ll AArea D<strong>Drainage</strong> i MMaster t St Study d overview i <strong>of</strong> f the th project j t and d th the ffour<br />
areas<br />
Volume I: Master Document Summary<br />
included. References the other eight volumes<br />
PBS&J Jun 2006 FCDMC pdf AOM <strong>Drainage</strong><br />
11<br />
Buckeye/Sun Valley Area <strong>Drainage</strong> Master Study description <strong>of</strong> hydrologic methods and results for<br />
Volume III-A: Area 1 Hydrology <strong>Report</strong><br />
Area 1<br />
PBS&J Aug 2006 FCDMC pdf AOM <strong>Drainage</strong><br />
12<br />
Buckeye/Sun Valley Area <strong>Drainage</strong> Master Study<br />
description <strong>of</strong> hydrologic and hydraulic methods<br />
Volume IV-B: Area 2 Floodplain Delineation<br />
and results for Area 2<br />
<strong>Report</strong><br />
maps showing groundwater conditions in the<br />
PBS&J Feb 2006 FCDMC pdf AOM <strong>Drainage</strong><br />
13 D.W.R. Hydrologic Map Series <strong>Report</strong> No. 10 Hassayampa Sub-basin <strong>of</strong> the Phoenix Active<br />
Management Area<br />
maps showing groundwater conditions in the<br />
ADWR 1982 ADWR pdf BML Water<br />
70 D.W.R. Hydrologic Map Series <strong>Report</strong> No. 12<br />
West Salt River, East Salt River, Lake Pleasant,<br />
Carefree and Fountain Hills Sub-basins <strong>of</strong> the<br />
Phoenix AMA<br />
ADWR 1983 ADWR pdf BML Water<br />
14 D.W.R. Hydrologic Map Series <strong>Report</strong> No. 27<br />
maps showing groundwater conditions in the<br />
Phoenix Active Management Area<br />
ADWR 1992 ADWR pdf BML Water<br />
15 D.W.R. Hydrologic Map Series <strong>Report</strong> No. 35<br />
Data Collection and Modeling Approach for<br />
maps showing groundwater conditions in the<br />
Phoenix Active Management Area<br />
ADWR<br />
Nov 2002-<br />
Feb 2003<br />
ADWR pdf BML Water<br />
58<br />
Selected River Mechanics Tasks <strong>of</strong> Phase II <strong>of</strong><br />
the Lower Hassayampa Watercourse Master<br />
Plan<br />
topo and hydraulic/sediment transport models,<br />
mining photos<br />
FCDMC Nov 2010 FCDMC CD BML <strong>Drainage</strong><br />
KHA Project No. 091337133<br />
K:\PHX_Systems\091337133-MCDOT Yuma Parkway\Data Collection\Data Collection Summary.xls 2 <strong>of</strong> 4
AZGS = Arizona Geological Survey<br />
ADOT = Arizona <strong>Department</strong> <strong>of</strong> Transportation<br />
ADWR = Arizona <strong>Department</strong> <strong>of</strong> Water Resources<br />
FCDMC = Flood Control District <strong>of</strong> <strong>Maricopa</strong> <strong>County</strong><br />
FEMA = Federal Emergency Management Agency<br />
KHA = Kimley-Horn and Associates<br />
MAG = <strong>Maricopa</strong> Associated Governments<br />
MC - <strong>Maricopa</strong> <strong>County</strong><br />
MCDOT - <strong>Maricopa</strong> <strong>County</strong> <strong>Department</strong> <strong>of</strong> Transportation<br />
LIBRARY<br />
KHA<br />
No.<br />
19<br />
82<br />
Summary Table <strong>of</strong> Documents Reviewed - Kimley-Horn and Associates<br />
Yuma Parkway<br />
Corridor Feasibility Study<br />
Data Collection Summary<br />
ITEM TRACKING<br />
Title Description Author Date Source<br />
<strong>Drainage</strong> Document Inventory<br />
Format/<br />
File Type<br />
Collected<br />
By<br />
Discipline<br />
DI-05: Geologic Data for the Phoenix South 30' x<br />
60' Quadrangle<br />
1:100,000 digital map <strong>of</strong> OFR93-18, in jpg and<br />
shp formats<br />
AZGS Mar 2006 AZGS CD BML Geology<br />
<strong>Drainage</strong> Policies and Standards for <strong>Maricopa</strong><br />
<strong>County</strong>, Arizona<br />
drainage standards FCDMC Apr 2007 FCDMC pdf BML <strong>Drainage</strong><br />
20 Earth Fissure Map <strong>of</strong> <strong>Maricopa</strong> <strong>County</strong>, Arizona mapping <strong>of</strong> earth fissures AZGS Dec 2009 AZGS pdf BML Geology<br />
81<br />
Earth Fissure Map <strong>of</strong> the Wintersburg Study<br />
Area: <strong>Maricopa</strong> <strong>County</strong>, Arizona<br />
location map <strong>of</strong> nearest earth fissure, Digital Map<br />
AZGS<br />
Series-Earth Fissure Map 10<br />
Feb 2009 AZGS pdf BML Geology<br />
60<br />
Emergency Action Plan for the Buckeye<br />
Structures<br />
flowcharts and downstream inundation exhibits<br />
for frs #1, #2, #3<br />
LTM Engineering Jun 2007 FCDMC CD BML <strong>Drainage</strong><br />
108<br />
Flood Insurance Rate Map <strong>Maricopa</strong> <strong>County</strong>,<br />
Arizona and Incorporated Areas<br />
effective FIRMs: panels 1980, 1985, 1990, 2005,<br />
2010, 2015, and 2020<br />
FEMA Sep 2005 FEMA jpg BML <strong>Drainage</strong><br />
22<br />
FIS No. 04013CV001A: description <strong>of</strong> general<br />
Flood Insurance Study <strong>Maricopa</strong> <strong>County</strong>, Arizona<br />
flooding issues in county, effective discharges,<br />
and Incorporated Area<br />
and flood pr<strong>of</strong>iles<br />
FEMA Sep 2005 KHA pdf BML <strong>Drainage</strong><br />
109<br />
mobile boundary sediment transport model<br />
FLUVIAL-12 Modeling <strong>of</strong> Sand Mining Impacts for<br />
comparing existing conditions and scenario<br />
Lower Hassayampa River<br />
where all active mining permits are exercised<br />
FCDMC May 2009 FCDMC pdf BML <strong>Drainage</strong><br />
17<br />
GGeologic l i MMap <strong>of</strong> f th the BBuckeye k NW 77.5' 5'<br />
Quadrangle, <strong>Maricopa</strong> <strong>County</strong>, Arizona<br />
DGM-37 AZGS Nov 2004 AZGS CD BML Geology<br />
18<br />
Geologic Map <strong>of</strong> the Wintersburg 7.5'<br />
Quadrangle, <strong>Maricopa</strong> <strong>County</strong>, Arizona<br />
DGM-47<br />
Access database <strong>of</strong> Groundwater Site Inventory:<br />
AZGS Mar 2006 AZGS CD BML Geology<br />
25 GWSI Database CD-ROM<br />
well ownership, historic water levels, construction ADWR<br />
data, etc.<br />
Jul 2009 ADWR CD BML Water<br />
71 GWSI Hydrographs<br />
83<br />
27<br />
29<br />
73<br />
historical groundwater levels at four sites: B-01-<br />
05 10BBC, 33254111, 33263411, and 33264811<br />
Hydrologic Analysis <strong>of</strong> the Hassayampa River in hydrology for jackrabbit wash and hassayampa<br />
<strong>Maricopa</strong> <strong>County</strong>, Arizona<br />
river completed for FIS<br />
Hydrologic Study <strong>Report</strong> for Luke Wash Zone AE Contains only the hydrology documentation<br />
Floodplain Delineation Study<br />
(Section 4) <strong>of</strong> a larger study<br />
Hydrologic/Hydraulic Design Analysis <strong>of</strong><br />
Proposed Sun Valley Parkway Crossing <strong>of</strong> the<br />
Buckeye Watershed Structure<br />
summary <strong>of</strong> the analysis <strong>of</strong> the proposed<br />
improved interchange on the Buckeye FRS #1<br />
Land Subsidence in the Buckeye Area, Western<br />
<strong>Maricopa</strong> <strong>County</strong> 02/10/2007 to 04/05/2008<br />
ADWR May 2011 ADWR pdf BML Water<br />
FEMA May 1988 FCDMC pdf BML <strong>Drainage</strong><br />
Wood, Patel &<br />
Associates<br />
Collar, Williams &<br />
White Engineering<br />
Sep 2008 KHA pdf BML <strong>Drainage</strong><br />
Aug 1987 FCDMC pdf BML <strong>Drainage</strong><br />
map showing 1.2 yr subsidence (0 to 3 cm) ADWR Apr 2008 ADWR pdf BML Water<br />
KHA Project No. 091337133<br />
K:\PHX_Systems\091337133-MCDOT Yuma Parkway\Data Collection\Data Collection Summary.xls 3 <strong>of</strong> 4
AZGS = Arizona Geological Survey<br />
ADOT = Arizona <strong>Department</strong> <strong>of</strong> Transportation<br />
ADWR = Arizona <strong>Department</strong> <strong>of</strong> Water Resources<br />
FCDMC = Flood Control District <strong>of</strong> <strong>Maricopa</strong> <strong>County</strong><br />
FEMA = Federal Emergency Management Agency<br />
KHA = Kimley-Horn and Associates<br />
MAG = <strong>Maricopa</strong> Associated Governments<br />
MC - <strong>Maricopa</strong> <strong>County</strong><br />
MCDOT - <strong>Maricopa</strong> <strong>County</strong> <strong>Department</strong> <strong>of</strong> Transportation<br />
LIBRARY<br />
KHA<br />
No.<br />
Summary Table <strong>of</strong> Documents Reviewed - Kimley-Horn and Associates<br />
Yuma Parkway<br />
Corridor Feasibility Study<br />
Data Collection Summary<br />
ITEM TRACKING<br />
Title Description Author Date Source<br />
<strong>Drainage</strong> Document Inventory<br />
Format/<br />
File Type<br />
Collected<br />
By<br />
Discipline<br />
72<br />
Land Subsidence in the Buckeye Area, Western<br />
<strong>Maricopa</strong> <strong>County</strong> 02/25/2006 to 04/05/2008<br />
map showing 2-yr subsidence (0 to 4 cm) ADWR Apr 2008 ADWR pdf BML Water<br />
31<br />
Lower Hassayampa Watercourse Master Plan<br />
Phase I<br />
seven technical reports intended to develop<br />
guidance for managing the river floodplain<br />
FCDMC Apr 2006 FCDMC pdf AOM <strong>Drainage</strong><br />
28<br />
Luke Wash Watershed Zone AE Floodplain<br />
Delineation Study Technical Data Notebook<br />
4 volumes. <strong>Report</strong>, survey field notes, supporting Wood, Patel &<br />
documentation, and exhibits.<br />
Associates<br />
Mar 2009 FCDMC pdf BML <strong>Drainage</strong><br />
32<br />
<strong>Maricopa</strong> <strong>County</strong> <strong>Drainage</strong> Policies and<br />
Standards<br />
drainage guidelines MC Jan 2007 KHA pdf BML <strong>Drainage</strong><br />
38<br />
National Engineering Handbook Part 630<br />
Hydrology<br />
Chapter 7 Hydrologic Soil Groups NRCS May 2007 NRCS pdf BML <strong>Drainage</strong><br />
78<br />
Palo Verde Watershed Detailed Floodplain<br />
Delineation Hydrology Draft GIS Subbasins<br />
ArcGIS files showing hydrology schematics for<br />
With and Without Levee models<br />
documents hydrology for palo verde watershed<br />
Entellus Sep 2010 FCDMC gdb BML <strong>Drainage</strong><br />
77<br />
Palo Verde Watershed Detailed Floodplain<br />
Delineation Hydrology Study (DRAFT)<br />
detailed study - includes report, exhibits, and<br />
Entellus<br />
DDMSW/HEC-1 files. Study is still open and this<br />
Is not the final version<br />
7 volumes. Hydrology, hydraulics, and floodplain<br />
Sep 2010 FCDMC zip BML <strong>Drainage</strong><br />
39<br />
PPalo l VVerde d WWatershed t h d ZZone A Fl Floodplain d l i<br />
Delineation Study Technical Data Notebook<br />
ddelineation li ti ffor approx. 400 miles il <strong>of</strong> f washes; h AArea<br />
Entellus<br />
C and Area D cover western portion <strong>of</strong> NP study<br />
area.<br />
May 2003 FCDMC pdf BML <strong>Drainage</strong><br />
40 Phoenix Active Management Area<br />
maps shows major infrastructure and<br />
grandfathered water rights<br />
ADWR Sep 2003 ADWR pdf BML Water<br />
47 Roadway Design Manual guidelines for standard roadway design MCDOT Apr 2004 KHA pdf BML Roadway<br />
69 Special Provisions for Palo Verde Road T.I. special provisions for bid document ADOT Jul 1987 FCDMC pdf BML Roadway<br />
57<br />
Uplift in the Vicinity <strong>of</strong> the Tonopah Recharge<br />
Facility<br />
map showing ground uplift from 2006 to 2010 due<br />
ADWR<br />
to recharge plume<br />
Mar 2010 ADWR pdf BML Water<br />
KHA Project No. 091337133<br />
K:\PHX_Systems\091337133-MCDOT Yuma Parkway\Data Collection\Data Collection Summary.xls 4 <strong>of</strong> 4
APPENDIX TM3-02<br />
EXISTING GEOLOGIC MAPPING<br />
091337133, 2010-055, TT005 <strong>Maricopa</strong> <strong>County</strong> <strong>Department</strong> <strong>of</strong> Transportation<br />
Technical Memorandum 3 Yuma Parkway Corridor Feasibility Study<br />
<strong>Conceptual</strong> <strong>Drainage</strong> <strong>Report</strong> August 2011
@@ @ @ @<br />
Qy1<br />
Qi3<br />
Qy1<br />
Qi<br />
Qy2<br />
Qy1<br />
Qy1<br />
Qi 3<br />
Qi 3<br />
Qy2<br />
Qi3<br />
Qi3<br />
d<br />
Qy<br />
Qi1r<br />
Qi2<br />
Qi2<br />
Qi2<br />
Qy1<br />
QTsr<br />
Qi3<br />
Qy<br />
d<br />
d<br />
Qi2<br />
Qi3<br />
d<br />
Qi2<br />
Qi3<br />
Qy2r<br />
Qi2<br />
Qy<br />
Qy1<br />
Qi1<br />
Qi3<br />
Qy1<br />
Qi2<br />
Qy<br />
Qy1<br />
Qy1<br />
Qy1<br />
Qy2<br />
Qi3<br />
Qy2r<br />
Qy2<br />
Qi3<br />
Qi2<br />
Qi3<br />
Qi2<br />
Qy1<br />
Qy2<br />
Qi3<br />
Qy<br />
Qi2<br />
QTsr<br />
Qy2<br />
Qi3<br />
Qi3<br />
Qi3<br />
Qi 3<br />
Qi3<br />
Qi2<br />
Qi3<br />
Qy<br />
Qy1<br />
Qy1<br />
Qtc<br />
Qy1<br />
Qy1<br />
Qi3<br />
Qi3<br />
Qi3<br />
Qy<br />
Qy1<br />
Qy1<br />
Qi3<br />
Qi2<br />
Qy<br />
Qy1<br />
Qi3<br />
Qi2<br />
Qi2<br />
Qi3<br />
Qy1<br />
Qy2<br />
Qi3<br />
Qy1<br />
Qi3<br />
Qy1<br />
Qi3<br />
Qy1<br />
Qy1<br />
QTs<br />
Qi3<br />
Qy1<br />
Tb<br />
Qi3<br />
Qi3<br />
Qy2r<br />
Qi3<br />
Qi3<br />
Qy<br />
Qi3<br />
Qy2r<br />
Qi2<br />
Qi3<br />
Qy1<br />
Qy1<br />
Qy2r<br />
Qy1<br />
Qy1<br />
Qi3<br />
Qi3<br />
Qi3<br />
Qi3<br />
Qi3<br />
Qy2<br />
Qi3<br />
Qy1<br />
Qy<br />
Qy1<br />
Qy1<br />
Qy1<br />
Qy1<br />
Qy1<br />
Qy1r<br />
Qi 3 Qi 3<br />
Qi 3<br />
d<br />
Qy1<br />
Qi3<br />
Qi3<br />
Qi3<br />
Qi 3<br />
Qi 3<br />
Qi3<br />
Qi 3<br />
Qi 3<br />
Qi 2<br />
Qi 3<br />
Qi 2<br />
Qy1<br />
Qi 3<br />
Qi 3<br />
Qi 3<br />
Qy1<br />
Qy1<br />
Qi2<br />
Qy1<br />
Qyc<br />
Qyc<br />
Qy2<br />
Qy<br />
Qy1<br />
d<br />
Qy1<br />
Qy2<br />
Qy2<br />
Qy2<br />
Qy2<br />
Qy2<br />
Qy2<br />
d<br />
Qy2<br />
Qy2r<br />
Qycr<br />
Qy2r<br />
Qy<br />
Qy2r<br />
Qy1r<br />
Qy<br />
QTsr<br />
Qi1r<br />
QTsr<br />
Qi3<br />
Qy2<br />
Qy2r<br />
Qi3<br />
Qi3<br />
Qy1<br />
Qi3<br />
Qy2<br />
d<br />
Qy1<br />
Qy1<br />
Qy1<br />
Qi3<br />
Qi3<br />
Qy1<br />
Qy<br />
Qi2<br />
Qi2<br />
Tb<br />
Qy1<br />
Qi3<br />
Qy1<br />
Qi3<br />
Qy1<br />
Qy1<br />
Qi3<br />
Qi 3<br />
Qi3<br />
Qi2<br />
QTsr<br />
Qy2<br />
Qy<br />
Qi3<br />
Qi3<br />
Qi3<br />
Qy1<br />
Qy1<br />
Qi3<br />
Qy1<br />
Qi3<br />
Qi2<br />
Qi2<br />
Qi 3<br />
Qi3<br />
Qi3<br />
Qi3<br />
Qi2<br />
Qy1<br />
Qy1<br />
Qy1<br />
Qi2<br />
Qy1<br />
Qi3<br />
Qi3<br />
Qi3<br />
Qy1<br />
Qi 3<br />
Qi3<br />
Qy1<br />
Qi3<br />
Qi2<br />
Qi3<br />
Qy1<br />
Tbu<br />
Tbu<br />
Qyc<br />
Qy1<br />
Qy1<br />
Qi 2<br />
Qy1<br />
Qy1<br />
Qyc<br />
Qy2r<br />
Qy1r<br />
QTsr<br />
Qi3r<br />
Qy2<br />
QTsr<br />
Qy2<br />
Qy 2r<br />
Qi 3r<br />
Qi 3<br />
Qi 3<br />
Qy1<br />
Qi 3<br />
Qi 3<br />
Qi3<br />
Qy2r<br />
Qy1<br />
Qi3<br />
Qi3<br />
Qy1<br />
Qi3<br />
Qy1<br />
Qy1<br />
Qy1<br />
Qi3<br />
Qi3<br />
QTsr<br />
Qy<br />
Qi3<br />
Qi3<br />
Qi3<br />
Qyf<br />
Qi 3<br />
Qi3<br />
Qi3<br />
Qi3<br />
Qi2<br />
Qi3<br />
Qi2<br />
Qy1<br />
Qy1<br />
Qy1<br />
Qy1<br />
Qy2r<br />
Qi 3<br />
Qy1<br />
Qi3<br />
Qy1<br />
Qy2r<br />
Qi2<br />
Qi3<br />
Qir<br />
Qi3<br />
Qy2r<br />
Qi 3<br />
Qi3<br />
Qi3<br />
Qi 3<br />
Qy1<br />
Qy1<br />
Qi3<br />
Qy1<br />
Qi3<br />
Qi3<br />
Qy1<br />
Qi2<br />
Qy1<br />
Qy1<br />
Qy1 Qi2<br />
Qi3<br />
Qi 3<br />
Qi3<br />
Qi3<br />
Qi3<br />
Qi3<br />
Qi3<br />
QTs<br />
Qi2<br />
Qy1<br />
Qy1<br />
Qi3<br />
Qi3<br />
Qy2<br />
Tbl<br />
Qi3<br />
Qi 1r<br />
QTsr<br />
Qi3<br />
Qi3<br />
Qy1<br />
Qy1<br />
Qy1<br />
QTsr<br />
QTsr<br />
Tbu<br />
Qi 2<br />
Qi3<br />
Qi3<br />
Qi 2<br />
QTsr<br />
Qi3<br />
Qi3<br />
Qy1<br />
Qy1<br />
Qy 1<br />
Qi 3<br />
Qi2<br />
Qy1<br />
QTsr<br />
Tbu<br />
Qy1<br />
Qi3<br />
Qy1<br />
Qi 3<br />
Qy1 Qy2<br />
Qi 3<br />
Qy2<br />
Qy1<br />
Qi 3<br />
Qy1<br />
Qi 3<br />
Qyc<br />
Qi 3<br />
Qy1<br />
Qy1<br />
Qi 3<br />
QTsr<br />
Qi 1r<br />
Qy1r<br />
Qy1r<br />
Qy2r<br />
Qy1r<br />
Qy2<br />
Qy1r<br />
Qy<br />
QTsr<br />
Qy2r<br />
Qy2r<br />
Qi 3<br />
Qy1<br />
Qy2r<br />
Qy2r<br />
Qy2r<br />
Qy2<br />
Qy1r<br />
Qy2<br />
Qy1r<br />
Qy2<br />
Qy1<br />
Qy1<br />
Qy1<br />
Qy1<br />
Qi3<br />
Qi2<br />
Qy1<br />
Qi 3<br />
Qi3<br />
Qi3<br />
Qi3<br />
Qy1<br />
Qy1<br />
Qi3<br />
Qi3<br />
Qy1<br />
Qi 3<br />
Qi 3<br />
Qi<br />
Qy1<br />
Qi 2<br />
Qi3<br />
Qy<br />
Qi3<br />
Qy1<br />
Qy<br />
Qy1<br />
Qi3<br />
Qi 3<br />
Qy1<br />
Qy 1<br />
Qy1<br />
Tb<br />
Qy1<br />
Qi 3<br />
Qi3<br />
Tbu<br />
Qy1<br />
Qi3<br />
Tb<br />
Tb<br />
Tb Qtc<br />
Qy2<br />
Qi3<br />
Qy1<br />
Qy1<br />
Qi3<br />
Qy 1<br />
Qy1<br />
Qy2<br />
Qy1<br />
Qi 3<br />
d<br />
Qi 3<br />
Qi 3<br />
Qi 3<br />
Qy1<br />
Qy1<br />
Qy1<br />
Qi 3<br />
Qy1<br />
Qy1<br />
Qi 3<br />
Qy1<br />
Qi 3<br />
Qy1<br />
Qy2<br />
Qy1<br />
Qy1<br />
Qy1<br />
Qy1<br />
Qi 3<br />
Qi 3<br />
Qi 3<br />
Qi 3<br />
Qi 3<br />
Qi 3<br />
Qi 3<br />
Qi 2<br />
Qy2<br />
Qi2<br />
Qi3<br />
Qi3<br />
Qi3<br />
Qy2<br />
Qyf<br />
Qi3<br />
Qy1<br />
d<br />
Qi3<br />
Qi3<br />
Qy2<br />
Qy2<br />
Qyf<br />
Qyf<br />
Qyf<br />
Qy2<br />
Qi 2<br />
Qi2<br />
Qi3<br />
Qy1<br />
Qi 3<br />
Qy1<br />
Qy 1<br />
Qy 1<br />
Qy1<br />
Qy1 Qy1<br />
Qy1<br />
Qy1<br />
Qi 3<br />
Qi3<br />
Qy1<br />
Qi 3<br />
Qi3<br />
Qi3<br />
Qi3<br />
Qi3<br />
Qi3<br />
Qy1<br />
Qy1<br />
Qy 1<br />
Qy 1<br />
Qy 1<br />
Qy2<br />
Qy2<br />
Qy1<br />
Qy1<br />
Qy2<br />
Qy1<br />
Qi 3<br />
Qi 3<br />
Qi3<br />
Qi3<br />
Qy1<br />
Qy1<br />
Qy1r<br />
Qi 1r<br />
QTsr<br />
Qy2<br />
QTsr<br />
Qy2<br />
Qy2r<br />
Qi 3r<br />
Qi3r<br />
QTsr<br />
QTsr<br />
Qi1r<br />
Qi 3r<br />
Qi 3<br />
Qy1<br />
QTsr<br />
Qy2r<br />
Qy2<br />
Qi 1r<br />
Qy1<br />
Qi 1r<br />
Qy 1<br />
QTsr<br />
Qy 2<br />
Qy2r<br />
Qy2r<br />
Qy2<br />
Qy2<br />
Qy1<br />
Qy2r<br />
Qi 2r<br />
Qyc<br />
Qy2<br />
Qi1r<br />
Qi1r d<br />
Qy1r<br />
Qy2<br />
Qyc<br />
Qy1r<br />
Qy1<br />
Qy<br />
Qy1<br />
Qy2<br />
Qy2r<br />
Qy1<br />
Qy2<br />
Qy2r<br />
Qy2<br />
Qi3<br />
Qy2<br />
Qy2<br />
Qy1<br />
Qi 3<br />
Qy2<br />
Qy1<br />
Qy2<br />
Qi 3<br />
Qy 1<br />
Qi 3<br />
Qi3<br />
Qi 3<br />
Qi 3<br />
Qi 3<br />
Qy1<br />
Qi2<br />
Qi 3<br />
Qy 2<br />
Qy 1<br />
Qi3<br />
Qi3<br />
Qi 3<br />
Qi2<br />
Qi 3<br />
Qi 3<br />
Qi3<br />
Qi 3<br />
Qi 3<br />
Qy2<br />
Qi2<br />
Qi2<br />
Qi2<br />
Qi 2<br />
Qi 3<br />
Qi 3<br />
Qi 3<br />
Qi 3<br />
Qi 3<br />
Qy1<br />
Qi 3<br />
Qi 3<br />
Qi 3<br />
Qy1<br />
Qy2<br />
Qy1<br />
Qy1<br />
Qi 3<br />
Qy1<br />
Qy1<br />
Qy1<br />
Qi 3<br />
Qy2<br />
Qi 3<br />
Qy1<br />
Qi3<br />
Qi3<br />
Qy2<br />
Qy1<br />
Qy2<br />
Qy 1<br />
Qy1<br />
Qi 3<br />
Qi 3<br />
Qi 3<br />
Qi 3<br />
Qy1<br />
Qi 3<br />
Qi 3<br />
Qi 3<br />
Qi 3<br />
Qy 2<br />
Qy2<br />
Qy2 Qi 3<br />
Qy1 Qi 3<br />
Qi 3<br />
Qy 1<br />
Qi 3<br />
Qi 3<br />
Qi 3<br />
Qi 3<br />
Qi 3<br />
Qy1<br />
Qy1<br />
Qi 3<br />
Qi 3<br />
Qi 3<br />
Qy1<br />
Qi 3<br />
Qy1<br />
Qi 3<br />
Qi3<br />
Qi 3<br />
Qi 3<br />
Qi 3<br />
Qy1<br />
Qy1<br />
Qi 3<br />
Qi 3<br />
Qi 3<br />
Qy1<br />
Qi3<br />
Qy1<br />
Qy1<br />
Qy1<br />
Qy 1<br />
Qy1<br />
Qy1<br />
Qi 3<br />
Qy1<br />
Qy1<br />
Qi 3<br />
Qi 3?<br />
Qi 3<br />
Qi 3<br />
Tbu<br />
Qy 1<br />
Qy1<br />
Qy1<br />
Qy1<br />
Qy1<br />
Qi 3<br />
Qy1<br />
Qy<br />
Qy1<br />
Qi 3<br />
Qi 3<br />
Qy1<br />
Qi 3<br />
Qi 3<br />
Qi 2<br />
Qi3<br />
Qi 2<br />
Qi 2<br />
Qy1<br />
Qi 3<br />
Qy1<br />
Qi 2<br />
Qi2<br />
Qy1<br />
Qy1<br />
Qy1<br />
Qy1<br />
Qy1<br />
Qy1<br />
Qy1<br />
Qi 3<br />
Qi 3<br />
Qi 3<br />
Qi 3<br />
Qy1 Qi 3<br />
Qy1<br />
Qi 3<br />
Qi 2<br />
Qi 2<br />
Qy1?<br />
Qy1<br />
Qi 2<br />
Qi 3<br />
d<br />
Qi 3<br />
Qy<br />
Qi 3<br />
Qi 3<br />
Qy1<br />
Qi3<br />
Qy1<br />
Qi 3<br />
Qy2<br />
Qi2<br />
Qi 2<br />
Qi 2<br />
Qy1<br />
Qi 3<br />
Qi 2<br />
Qi 3<br />
Qi 3<br />
Qi3<br />
Qi 2<br />
Qi2<br />
Qyf<br />
Qyf<br />
Qy2<br />
Qy1<br />
Qi3<br />
Qi3<br />
d<br />
Qy2<br />
Qy2<br />
Qy2<br />
Qi3<br />
d<br />
Qy2<br />
Qy1<br />
Qtc<br />
Qtc<br />
Qtc<br />
Qtc<br />
Tbl<br />
Qi2<br />
Qi2<br />
Qi2<br />
Qy<br />
Qy2<br />
Qi3<br />
Qi3<br />
Qi3<br />
Qi 3<br />
Qi2<br />
Qy1<br />
Qy1<br />
Qtc<br />
Qy2<br />
d<br />
Qy2<br />
Qyc<br />
Qy1<br />
Qy 2<br />
Qy1<br />
Qtc<br />
Qy1<br />
Qy2<br />
Qy2<br />
Qi2<br />
Qi 3<br />
Qi 3<br />
Qy2<br />
Qyc<br />
Qi2<br />
Qi2<br />
Qy 2<br />
Qy2<br />
Qyc<br />
Qy2<br />
Qy2<br />
d<br />
Qy2<br />
Qy2<br />
Qi 3<br />
Qi 3<br />
Qi 3<br />
Qyf<br />
Qyf<br />
Qyf<br />
Qyf<br />
Qyf<br />
Qyf<br />
Qy2<br />
Qy1<br />
Qy 1<br />
Qyf<br />
Qyf<br />
Qy1<br />
Qyf<br />
Qi2<br />
Qyf<br />
Qyf<br />
Qyf<br />
Qy1<br />
Qy1<br />
Qi 3<br />
Qyf<br />
Qy 1<br />
Qy1<br />
Qy1<br />
Qy1<br />
Qy1<br />
Qi3<br />
Qy1<br />
Qy2<br />
Qy2<br />
Qy<br />
Qy2<br />
Qi3<br />
Qy1<br />
Qy2<br />
Qy2<br />
Qy2<br />
Qy2<br />
Qy2<br />
Qy 1<br />
Qy1<br />
Qy2<br />
Qy1<br />
Qy1<br />
Tbl<br />
Qi3<br />
Qi3<br />
Qi 2<br />
Qy1<br />
Qi 3<br />
Qi 3<br />
Qy1<br />
Qi 3<br />
Qyf<br />
Qi3<br />
Qi 2<br />
Qi 2<br />
Qi 3<br />
Qi2<br />
Qi3<br />
Qi2<br />
Qy2<br />
Qy2<br />
Qy2<br />
Qy2<br />
Qy2<br />
Qy1<br />
Qy 1 Qy1<br />
Qi3<br />
Qi3<br />
Qy1<br />
Qi2<br />
QTs<br />
Qy 1<br />
Qy 1<br />
Qy 1<br />
QTs<br />
Qy 1<br />
Qy2<br />
Qy 1<br />
QTs<br />
Qy2<br />
Qy2<br />
Qy2<br />
Qy1<br />
Qy1<br />
QTs<br />
QTs<br />
Qy1<br />
Qi2<br />
Qi 2<br />
Qy1<br />
Qy1<br />
Qi3<br />
Qy2<br />
Qy1<br />
Qy1<br />
Qy2<br />
Qyc<br />
Qi1<br />
Qy2<br />
Qy2<br />
Qy2<br />
Qy2<br />
Qi1<br />
Qy2<br />
Qi1<br />
Qy2<br />
Qy 2<br />
Qi3<br />
Qi1<br />
Qi1<br />
Qy2<br />
Qy1<br />
Qy 2<br />
Qy1<br />
Qyc<br />
Qy2<br />
Qy 2<br />
Qy2<br />
Qy1<br />
Qy1<br />
d<br />
Qi1<br />
Qy2<br />
Qy2<br />
Qi3<br />
Qy2<br />
Qy1<br />
Qy2<br />
Qy2<br />
Qy2<br />
Qy1<br />
Qy<br />
Qy2<br />
Qy<br />
Qy2<br />
Qy1<br />
Qy1<br />
Qi1r<br />
Qi2<br />
Qy1<br />
Qi<br />
Qy<br />
Qy<br />
Qy<br />
Qy1<br />
Qy1<br />
Qi1r<br />
Qi<br />
Qy<br />
Qi1<br />
Qi1<br />
Qi1<br />
Qi1<br />
QTs<br />
Qi3<br />
Qy1<br />
Qi 2<br />
Qy1<br />
Qy2<br />
Qy1<br />
Qi 3<br />
Qi 3<br />
Qi 3<br />
Qi 3<br />
Qi3<br />
Qi3<br />
Qi2<br />
Qi 3<br />
Qi3<br />
Qy1 Qy2<br />
Qi 3<br />
Qi 3<br />
QTs<br />
QTsr<br />
QTsr<br />
QTsr<br />
Qy2<br />
Qy2<br />
Qi2r<br />
Qy2<br />
Qy1<br />
Qi3r<br />
Qy2<br />
Qy2<br />
QTs<br />
QTs<br />
QTs<br />
Qi2r<br />
Qy1<br />
QTsr<br />
QTsr<br />
QTsr<br />
Qy1<br />
Qy1<br />
Qy2<br />
Qy2<br />
d<br />
Qy1<br />
Qy2<br />
Qy2<br />
QTs<br />
Qy1<br />
Qyc<br />
Qy2<br />
QTs<br />
QTs<br />
Qy2<br />
QTs<br />
QTs<br />
QTs<br />
QTs<br />
QTs<br />
QTs<br />
QTs<br />
QTs<br />
Qy2<br />
Qy1<br />
Qi1<br />
Qi1<br />
Qy2<br />
QTs<br />
Qi1<br />
QTs<br />
QTs<br />
Qi 2<br />
Qi 2<br />
QTs<br />
Qy2<br />
Qi2<br />
Qi2<br />
Qy2<br />
QTs<br />
QTs<br />
QTsr<br />
Qy2r<br />
Qy1<br />
QTsr<br />
QTsr<br />
Qycr<br />
Qy2<br />
Qi3r<br />
Qy2<br />
QTsr<br />
Qir<br />
Qycr<br />
Qy2r<br />
Qy 2<br />
Qi3<br />
Qy1<br />
Qi2<br />
Qi2<br />
Tbu<br />
Qy2<br />
Qy1<br />
Qy1<br />
Qi 3<br />
Qy2<br />
Qy2<br />
Qy1<br />
Qi 2r<br />
Qir<br />
Qy2r<br />
Qy2<br />
Qy2<br />
Qi 2<br />
Qy1<br />
Qy2<br />
Qi2<br />
Qyc<br />
Qy1<br />
Qy2<br />
Qy2<br />
Qy2<br />
Qi3<br />
Qy2<br />
Qi 1 Qi1<br />
Qi 2<br />
Qy2<br />
Qyc<br />
Qi1<br />
Qi1<br />
Qi 3<br />
Qy1<br />
Qy1<br />
Qy1<br />
Qy2<br />
Qy1<br />
d<br />
Qy2<br />
Qy2<br />
Qi 3<br />
Qi1<br />
Qy1<br />
Qy1<br />
Qi 3<br />
Qi3<br />
area <strong>of</strong><br />
dessication<br />
cracks<br />
earth<br />
fissure<br />
Arizona Geological Survey<br />
DGM-47 (Wintersburg)<br />
Arizona Geological Survey<br />
416 W. Congress Street, Suite 100<br />
Tucson, AZ 85701<br />
(520) 770-3500<br />
www.azgs.az.gov<br />
Geologic Map <strong>of</strong> the Wintersburg<br />
7.5' Quadrangle,<br />
<strong>Maricopa</strong> <strong>County</strong>, Arizona<br />
d<br />
Qi<br />
Tb<br />
Qir<br />
Qi 1<br />
Tbl<br />
Qtc<br />
Qi 1r<br />
Qi 3r<br />
Qi 2r<br />
Tbu<br />
QTs<br />
Qycr<br />
Qy1r<br />
Qy2r<br />
QTsr<br />
Qy<br />
Qi 3<br />
Qi 2<br />
Qyf<br />
Qyc<br />
Qy1<br />
Qy2<br />
Holocene<br />
Pleist ocene<br />
Pliocene<br />
Miocene<br />
Hassayampa<br />
River Deposits<br />
Piedmont<br />
Deposits<br />
Stratigraphic Correlation<br />
Qi<br />
Qts<br />
d<br />
Qtc<br />
QTsr<br />
Qir<br />
Tb<br />
Qy<br />
Qi2<br />
Qyf<br />
Tbl<br />
Qy1<br />
Qi3<br />
Qi1<br />
Tbu<br />
Qi1r<br />
Qi3r<br />
Qi2r<br />
Qy2<br />
Qy1r<br />
Qy2r<br />
Qyc<br />
Qycr<br />
Location Index Map<br />
Wintersburg<br />
7.5' Qu adra ngl e is loca te d<br />
in northwestern <strong>Maricopa</strong> <strong>County</strong>.<br />
#<br />
#<br />
#<br />
#<br />
#<br />
#<br />
#<br />
#<br />
#<br />
#<br />
SENT INEL<br />
BUCKEYE<br />
PHOENIX<br />
TONOPAH<br />
GILA BEND<br />
TORTILLA FLATS<br />
GILBERT<br />
CAREFREE<br />
NEW RIVER<br />
WICKENBURG<br />
by Philip A. Pearthree and Charles A. Ferguson and Raymond C. Harris<br />
Arizona Geological Survey Digital Geologic Map 47 (DGM-47), version 1.0<br />
March 2006<br />
Citation for this map: Pearthree, P. A., Ferguson, C.A., Harris, R. C., 2006, Geological map<br />
<strong>of</strong> the Wintersburg 7.5’ Quadrangle, <strong>Maricopa</strong> <strong>County</strong>, Arizona: Tucson, Arizona<br />
Geological Survey Digital Geologic Map 47 (DGM-47), version 1.0,<br />
1 CD-ROM with 1 Adobe Acrobat file (1 sheet, layout scale 1:24,000).<br />
Not to be reproduced for commercial purposes<br />
Research supported by the U.S. Geological Survey, National Cooperative Geologic<br />
Mapping Program, under USGS award number #04HQAG0072. The views and conclusions<br />
contained in this document are those <strong>of</strong> the authors and should not be interpreted as<br />
necessarily representing the <strong>of</strong>ficial policies, either expressed or implied, <strong>of</strong> the U.S.<br />
Government.<br />
Surficial Units<br />
Piedmont Alluvium<br />
Quaternary and late Tertiary piedmont deposits from the Belmont Mountains to the north cover<br />
the western 2/3 <strong>of</strong> the Wintersburg quadrangle. This alluvium was deposited primarily by larger<br />
tributary streams that head to the north <strong>of</strong> the quadrangle; these larger streams and smaller<br />
streams that in this quadrangle have eroded and reworked some <strong>of</strong> these deposits. Clast<br />
lithologies include basalt and felsic volcanic rocks with lesser amounts <strong>of</strong> granite. Deposits<br />
range in age from modern to Pliocene. Abbreviations used are ka, thousands <strong>of</strong> years before<br />
present, and Ma, millions <strong>of</strong> years before present.<br />
Modern stream channel deposits – Active channel deposits composed <strong>of</strong> very<br />
poorly-sorted sand, pebbles, and cobbles with some boulders to moderately-sorted<br />
sand and pebbles. Channels are generally incised 0.5 to 2 m below adjacent<br />
Holocene terraces and alluvial fans, but may be incised as much as 4 m below<br />
adjacent Pleistocene deposits. Channel morphologies generally consist <strong>of</strong> a single<br />
thread, relatively deep channel or multi-threaded smaller, shallower channels with<br />
gravel bars. Channels are extremely flood prone and are subject to deep, high<br />
velocity flow in moderate to large flow events. Areas adjacent to Qyc deposits may be<br />
prone to lateral bank erosion.<br />
Late Holocene alluvium – Young, typically fine-grained deposits in floodplains, low<br />
terraces and small channels. Along the larger drainages, unit Qy 2 sediment is<br />
generally poorly to very poorly sorted silt, sand, pebbles, and small cobbles;<br />
floodplain and terrace surfaces typically are mantled with sand and finer sediment. On<br />
lower piedmont areas and in smaller tributary washes young deposits consist<br />
predominantly <strong>of</strong> moderately sorted sand and silt, with some pebbles and cobbles in<br />
channels. Soils are pale brown in color (10 YR), and soil development is very weak,<br />
consisting <strong>of</strong> slight carbonate accumulation. Channels generally are incised less than<br />
1 m below adjacent young surfaces, but locally incision may be as much as 2 m.<br />
Channel morphologies generally consist <strong>of</strong> a single- or multi-threaded channels with<br />
gravel bars adjacent to low flow channels. Channels are flood prone and may be<br />
subject to deep, high velocity flows in large flow events. Substantial lateral bank<br />
erosion may occur in these deposits, and flood flows may significantly change<br />
channel morphology and flow paths. Local relief varies from fairly smooth channel<br />
bottoms to undulating bar-and-swale topography that is characteristic <strong>of</strong> coarser<br />
deposits. Terraces have planar surfaces, but small channels are common.<br />
Holocene alluvium – Older Holocene terrace deposits found mostly along the<br />
margins <strong>of</strong> incised drainages throughout the map area. Qy1 surfaces are higher and<br />
less subject to inundation than adjacent Qy2 surfaces. Qy1 terraces are generally<br />
planar but local surface relief may be up to 1 m where gravel bars are present. Qy 1<br />
surfaces are
Arizona Geological Survey<br />
DGM-37 (Buckeye NW)<br />
112º 45'<br />
33º 30'<br />
27' 30"<br />
25'<br />
33º 22' 30"<br />
112º 45'<br />
Topographic base from USGS Buckeye NW 7.5' quadrangle,<br />
compiled from photogrammetric methods from aerial photos<br />
taken 1955 and by planetable surveys 1958. UTM zone 12,<br />
NAD 27. Reprojected to NAD 83.<br />
Magnetic declination 13º east <strong>of</strong> true north.<br />
Contour interval 10 feet.<br />
Arizona Geological Survey<br />
416 W. Congress Street, Suite 100<br />
Tucson, AZ 85701<br />
(520) 770-3500<br />
www.azgs.az.gov<br />
42' 30"<br />
Yuma Parkway<br />
Study Area<br />
MN<br />
13º<br />
42' 30"<br />
1<br />
SCALE 1:24,000<br />
0 1<br />
0.5<br />
1,000 500 0 1,000 2,000 3,000 4,000 5,000 6,000 7,000<br />
Feet<br />
1 0.5<br />
0 1<br />
contour interval 10 feet<br />
Kilometers<br />
Miles<br />
40'<br />
40'<br />
Location Index Map<br />
WICKENBURG<br />
NEW RIVER<br />
CAREFREE<br />
TONOPAH<br />
TORTILLA FLATS<br />
PHOENIX<br />
BUCKEYE<br />
GILBERT<br />
GILA BEND<br />
SENTINEL<br />
Buckeye NW 7.5' quadrangle is<br />
located in central <strong>Maricopa</strong> <strong>County</strong>.<br />
112º 37' 30"<br />
33º 30'<br />
27' 30"<br />
25'<br />
33º 22' 30"<br />
112º 37' 30"<br />
Qy2<br />
Qy1<br />
Qy<br />
Qi3<br />
Qi2<br />
Qi<br />
Qi1<br />
Qycr<br />
Qy2 r<br />
Qor<br />
QTsr<br />
Qtc<br />
d<br />
TKm<br />
TKq<br />
YXp<br />
Xg<br />
Xgd<br />
Xa<br />
Xp<br />
Other Units<br />
Holocene and Pleistocene colluvium and talus – V ery poorly s orted, weakly s tratified, hills lope<br />
depos its mantling bedrock slopes.<br />
Disturbed areas<br />
– Much <strong>of</strong> the quadrangle has been dis turbed by human activities , particularly<br />
agricultural activities. This unit designation is used only in areas <strong>of</strong> substantial excavation or<br />
anthropogenic deposition, for example, major flood-control levees.<br />
Bedrock map units<br />
Mafic dikes (Tertiary – Cretaceous) – Dark-colored, fine-grained to very fine-grained dioritic dikes<br />
with sparse 1-4 mm plagioclase and mafic phenocrysts .<br />
Rhyolite porphyry (Cretaceous) – Quartz-phyric rhyolite porphyry dikes and small intrusions with<br />
variable phenocryst content. T he rhyolite porphyry is characterized by light gray, commonly flowfoliated<br />
aphanitic matrix and contains between 5% and 20% 1-6 mm quartz, potassium feldspar, and<br />
plagioclase phenocrysts with sparse biotite, hornblende, and other mafics. In general, grain size and<br />
the abundance <strong>of</strong> accessory mafic minerals increases with phenocryst content. The rhyolite porphyry<br />
correlates with the intrusive rocks (unit Ti) <strong>of</strong> R eynolds et al. (2002).<br />
Pegmatite and leucogranite complex (Middle and Early Proterozoic) – Medium- to coarse-grained<br />
pegmatite and heterogenous texture, banded, muscovite leucogranite.<br />
Granite (Early Proterozoic) – Weakly foliated, fine- to medium-grained 10-20% biotite granite or<br />
quartz monzonite (Xg) that appears to be younger than the granodiorite (Xgd).<br />
Granodiorite (Early Proterozoic) – Medium-grained, weakly to s trongly foliated granodiorite to quartz<br />
monz odiorite containing between 15-40% ma fics . T he gra nodiorite correla tes with the undifferentia ted<br />
metamorphic rocks (Xm), granitic rocks and pegmatite (Xgr), and tonalite (Xt) units <strong>of</strong> R eynolds et al.<br />
(2002).<br />
Amphibolite schist (Early Proterozoic) – F ine- to medium-grained amphibolite schis t and banded,<br />
mafic-rich orthogneiss with lesser amounts <strong>of</strong> biotite schist, sericite schist and psammitic s chist. T he<br />
amphibolite s chis t correlates with the undifferentiated metamorphic rocks (Xm), and tonalite (Xt) units<br />
<strong>of</strong> R eynolds et al. (2002).<br />
Pinal Schist (Early Proterozoic) – Fine- to medium-grained, light gray biotite schist, sericite schist,<br />
and psammitic schist. T he P inal S chist map unit represents a zone <strong>of</strong> metamorphic rocks void <strong>of</strong><br />
amphibolite schist.<br />
Qycr<br />
Hassayampa<br />
River<br />
deposits<br />
Qor<br />
QTsr<br />
Unit Descriptions<br />
Piedmont Alluvium<br />
Late Holocene deposits in active stream channels, low terraces, and alluvial fans – Very young<br />
depos its as sociated with active or recently active fluvial sys tems . C hannel depos its typically cons is t <strong>of</strong><br />
s and and pebbles with s ome cobbles and s mall boulders in middle and upper piedmont areas , and<br />
s and and s ome pebbles lower on the piedmont. T errace and fan depos its typically cons is t <strong>of</strong> s and and<br />
silt with some gravel lenses. Fan and terrace surfaces typically are planar where deposits are fine and<br />
gently undulating where deposits are coarser, with gravel bars and finer-grained swales. Desert<br />
pavement development is minimal and rock varnish is very light or nonexistent. Soil development is<br />
weak. Surface dissection is minimal and is associated with channels that are incised up to 1.5 m below<br />
adjacent fans or terraces . C hannel patterns are variable, including anas tamos ing or dis tributary linked<br />
channels and separate small tributary channels feeding into larger channels.<br />
Older Holocene deposits on alluvial fans and terraces – Young deposits associated with recently<br />
active alluvial fans and terraces. In middle and upper piedmont areas, deposits are poorly sorted,<br />
cons isting s and, s ilt, pebbles , and cobbles; in lower piedmont areas , deposits are typically s and and s ilt<br />
with minor gravel. S urface relief varies with particle size, with relict bar and swale topography where<br />
deposits are gravelly and relatively smooth surfaces where sand and silt predominate. S oil<br />
development is weak, with s ome s oil s tructure and minor carbonate accumulation. S urfaces typically<br />
are brown to gray, with common gravel litter but minimal desert pavement and light brown rock varnis h.<br />
Holocene alluvial deposits, undifferentiated, undiff f erentiated, primarily in areas disturbed disturbed by agricultural activity<br />
Late Pleistocene alluvial fan and terrace deposits – Y ounger intermediate depos its associated with<br />
inactive alluvial fans and terraces along washes. Deposits typically are poorly sorted mixtures <strong>of</strong> silt,<br />
sand, pebbles and cobbles. Surfaces are moderately dissected by tributary drainages that head on the<br />
surfaces and through-going distributary channels. Local surface topographic varies from about 0.5 to 2<br />
m. S oil development is moderate, with minimal clay accumulation and s oil reddening and weak to<br />
moderate calcic horizon development. R ock varnish on surface clasts varies from light to dark brown.<br />
Middle Pleistocene alluvial fan depos its – O lder intermediate depos its as s ociated with extens ive<br />
relict alluvial fans . Depos its are poorly s orted, including sand, pebbles and cobbles , with minor s ilt and<br />
clay. S urfaces are moderately to deeply dis sected, with local topographic relief varying from about 0.5<br />
to 6 m. O riginal depos itional topography typically is not pres erved, and surfaces are quite smooth<br />
where not eroded. Qi1 surfaces are drained by extensive tributary drainage networks. Interfluve areas<br />
between drainage vary from quite flat to broadly rounded. S oils have weak to moderate clay<br />
accumulation and slight reddening in the upper 30 cm beneath the surface, and calcic horizons show<br />
obvious visible carbonate accumulation.<br />
Middle and late Pleistocene alluvial alluvial fan and terrace deposits, undifferentiated<br />
undiff f erentiated<br />
Middle to early Pleistocene alluvial fan deposits – Old relict alluvial fans with moderately s trong soil<br />
development. Depos its are poorly s orted, including sand, pebbles , cobbles , and s mall boulders with<br />
minor silt and clay. Surfaces typically are moderately dissected with up to 6 m <strong>of</strong> local relief, but<br />
interfluve surfaces are quite smooth and have dark, strongly developed pebble-cobble desert<br />
pavements . S oils have moderate clay accumulation and obvious reddening and abundant carbonate<br />
accumulation res ulting in weak cementation.<br />
Hassayampa River Alluvium<br />
Active river channel deposits – Moderately to poorly sorted sand, gravel and minor silt in recently<br />
active channels and lightly vegetated bars <strong>of</strong> the Has s ayampa R iver. G ravel includes s ubangular to<br />
well-rounded clas ts <strong>of</strong> divers e lithology.<br />
Late Holocene to modern floodplain deposits – Sand, silt, and gravel deposits associated with<br />
slightly higher terraces along the Hassayampa River. Terrace surfaces typically are smooth and are<br />
less than 3 m above the active channel. Terrace surfaces typically are covered with fine-grained<br />
floodplain depos its , but relict gravel bars and lenses are common.<br />
Early Pleistocene Pleistocene river deposits deposits – Depos its as s ociated with the high terraces along the Has s ayampa<br />
River that record the maximum aggradation <strong>of</strong> the river. Terrace surfaces are fairly flat or or broadly<br />
rounded, but all terrace s urfaces are moderately to deeply dis sected by tributary drainages and the<br />
river and have been substantially modified by erosion. E xposures are poor, but well-rounded gravel is<br />
evident at the surface. Terrace surfaces are also typically covered with litter from underlying petrocalcic<br />
s oil horizons . T errace s urfaces range from about 15 to 20 m above the active river channel, and ris e<br />
s lightly to the north acros s the quadrangle.<br />
Pliocene to to early Pleistocene river deposits<br />
– A moderately thick s equence <strong>of</strong> old Has s ayampa<br />
R iver deposits that underlies the Qor terrace/fan depos its . T hes e depos its cons is t <strong>of</strong> river s a nd, gravel<br />
and silt with a substantial component <strong>of</strong> tributary sand and gravel. Local zones <strong>of</strong> substantial carbonate<br />
accumulation may repres ent moderately to s trongly developed buried s oils .<br />
Qy2 r<br />
Stratigraphic Correlation diagram<br />
Qtc<br />
Xgd<br />
TKm<br />
YXp<br />
Xa Xp<br />
Xg<br />
Qy2<br />
Qy1<br />
Qi3<br />
Qi2<br />
Qi1<br />
TKq<br />
Qy<br />
Qi<br />
Piedmont<br />
deposits<br />
Quaternary<br />
Pliocene<br />
Cretaceous -<br />
early Tertiary<br />
Proterozoic<br />
GEOLOGIC MAP OF THE BUCKEYE<br />
NW 7.5' QUADRANGLE, MARICOPA<br />
COUNTY, ARIZONA<br />
by John J. Field, Philip A. Pearthree and Charles A. Ferguson<br />
Arizona Geological Survey Digital Geologic Map 37 (DGM-37), version 1.0<br />
November, 2004<br />
Citation for this map: Field, J.J., Pearthree, P.A., and Ferguson, C.A., 2004,<br />
Geologic Map <strong>of</strong> the Buckeye NW 7.5' Quadrangle, <strong>Maricopa</strong> <strong>County</strong>,<br />
Arizona: Arizona Geological Survey Digital Geologic Map 37<br />
(DGM-37), 1 sheet, scale 1:24,000.<br />
Not to be reproduced for commercial purposes<br />
Research supported by the U.S. Geological Survey, National Cooperative Geologic Mapping Program, under USGS award<br />
#03HQAG0114. The views and conclusions contained in this document are those <strong>of</strong> the authors and should not be<br />
interpreted as necessarily representing the <strong>of</strong>ficial policies, either expressed or implied, <strong>of</strong> the U.S. government.<br />
Introduction<br />
The Buckeye NW 7.5' quadrangle is located approximately 35 miles (60 km) west <strong>of</strong> downtown Phoenix, Arizona.<br />
The map area covers the southwestern piedmont <strong>of</strong> the White Tank Mountains which merges to the south into Buckeye Valley<br />
and to the west into Hassayampa Plain. Bedrock was mapped in April, 2004, and Quaternary geology, modified from Field<br />
and Pearthree (1991), was supplemented with new mapping and aerial photograph interpretation using high-resolution digital<br />
images provided by the Flood Control District <strong>of</strong> <strong>Maricopa</strong> <strong>County</strong>. This map is one <strong>of</strong> six 1:24,000 scale geologic maps<br />
covering much <strong>of</strong> the Hassayampa Plain area that were produced for this study. Mapping was done as part <strong>of</strong> a multiyear<br />
mapping program directed at producing complete geologic map coverage for the Phoenix-Tucson metropolitan corridor, and<br />
was done under the joint State-Federal STATEMAP program, as specified in the National Geologic Mapping Act <strong>of</strong> 1992.<br />
Surficial Geology<br />
Surficial geology was mapped primarily using aerial photos taken in 1979 for the Bureau <strong>of</strong> Land Management. Unit<br />
boundaries were spot-checked in the field, and mapping was supplemented by field observations during the spring <strong>of</strong> 2004.<br />
The physical characteristics <strong>of</strong> Quaternary alluvial surfaces (channels, alluvial fans, floodplains, stream terraces) evident on<br />
aerial photographs and in the field were used to differentiate their associated deposits by age and source. This mapping was<br />
transferred to a digital orthophotoquad base from 2002 provided by the Flood Control District <strong>of</strong> <strong>Maricopa</strong> <strong>County</strong>. Mapping<br />
was compiled in a GIS format and the final linework was generated from the digital data. Surficial deposits <strong>of</strong> the map area<br />
were then correlated with regional deposits to roughly estimate their ages. The mapping <strong>of</strong> Field and Pearthree (1991) was<br />
incorporated into this map with contacts modified extensively in some parts <strong>of</strong> the map based on reinterpretation <strong>of</strong> geologic<br />
relationships and the higher-quality digital aerial photo base that is currently available.<br />
Characteristics evident on aerial photographs and on the ground were used to differentiate and map various alluvial<br />
surfaces. The color <strong>of</strong> alluvial surfaces depicted on aerial photographs is primarily controlled by soil color, and to a lesser<br />
extent, rock varnish. Significant soil development begins on an alluvial surface after it becomes isolated from active flooding<br />
and depositional processes (Gile et al., 1981, Birkeland, 1999). Over thousands <strong>of</strong> years, distinct soil horizons develop. Two<br />
typical soil horizons in Pleistocene alluvial sediments <strong>of</strong> Arizona are reddish brown argillic horizons and white calcic horizons.<br />
As a result, on color aerial photographs older alluvial surfaces characteristically appear redder or whiter (on more eroded<br />
surfaces) than younger surfaces. Older surfaces have a dark brown color where darkly varnished desert pavements are well<br />
preserved. Differences in the drainage patterns between surfaces provide clues to surface age and potential flood hazards.<br />
Young alluvial surfaces that are subject to flooding commonly display distributary (branching downstream) or braided channel<br />
patterns; young surfaces may have very little developed drainage if unconfined shallow flooding predominates. Dendritic<br />
tributary drainage patterns are characteristic <strong>of</strong> older surfaces that are not subject to extensive flooding. Topographic relief<br />
between adjacent alluvial surfaces and the depth <strong>of</strong> entrenchment <strong>of</strong> channels can be determined using stereo-paired aerial<br />
photographs and topographic maps. Young flood-prone surfaces appear nearly flat on aerial photographs and are less than 1<br />
m above channel bottoms. Active channels are typically entrenched 1 to 10 m below older surfaces. Comparisons <strong>of</strong> calcic<br />
horizon development on the White Tank Mountains piedmont with other soil sequences in the western United States provide<br />
one <strong>of</strong> the few methods <strong>of</strong> estimating the ages <strong>of</strong> the different alluvial surfaces (Gile et al, 1981; Machette, 1985). Calcic<br />
horizon development varies from fine white filaments <strong>of</strong> calcium carbonate in young soils to soil horizons completely plugged<br />
with calcium carbonate (caliche) in very old soils.<br />
Variations in the distribution <strong>of</strong> surfaces <strong>of</strong> different ages and sources and concomitant variations in dissection across<br />
the quadrangle provide evidence regarding the recent geologic evolution <strong>of</strong> this area and the distribution <strong>of</strong> flood hazards.<br />
Generally, areas near the Hassayampa River are moderately to deeply dissected, whereas dissection in middle piedmont<br />
areas varies substantially across the quadrangle. Very old terraces <strong>of</strong> the Hassayampa River (unit Qor) record the level <strong>of</strong> the<br />
river bed in the early Quaternary. Qor terraces cap a substantial aggradational sequence that was deposited during the late<br />
Tertiary to early Quaternary. At that time the river was not entrenched and probably was depositing sediment across a fairly<br />
broad floodplain in the western part <strong>of</strong> the quadrangle. Since then the Hassayampa River has downcut up to 20 m, with<br />
dissection increasing slightly to the north. The effects <strong>of</strong> this downcutting are expressed by incision <strong>of</strong> tributary drainages near<br />
the western margin <strong>of</strong> the quadrangle. In the eastern and southern part <strong>of</strong> the quadrangle, piedmont drainages turn to the<br />
southwest and south before eventually joining the Hassayampa or Gila rivers. Incision along these drainages generally is less<br />
than a few meters, and most drainages have major expansion reaches with distributary channel networks and extensive, thin<br />
young deposits in the middle piedmont. These areas are <strong>of</strong> particular concern because <strong>of</strong> the potential for widespread<br />
inundation and changes in channel positions during floods (Field and Pearthree, 1992). The southern part <strong>of</strong> the map area is<br />
mantled by relatively fine-grained Pleistocene and Holocene distal fan deposits that merge to the south with floodplain<br />
deposits <strong>of</strong> the Gila River (south <strong>of</strong> the quadrangle). Surfaces in this southern area have been pr<strong>of</strong>oundly modified by<br />
agriculture activity, and age estimates and mapping are based on interpretation <strong>of</strong> an NRCS soil survey (Hartman, 1977).<br />
Bedrock Geology<br />
Bedrock units are dominated by Early Proterozoic granodiorite (Xgd). The granodiorite intrudes amphibolite schist<br />
(Xa) and biotite sericite schist (Xp). Collectively, these rocks comprise a widespread metamorphic complex that is present<br />
throughout the White Tank Mountains (Reynolds et al., 2002; Ferguson et al., 2004). Other rocks include a small stock <strong>of</strong><br />
pegmatite (YXp) that probably correlates with a series <strong>of</strong> Middle Proterozoic pegmatite stocks associated with a coarsegrained,<br />
potassium feldspar porphyritic granite found to the north. A series <strong>of</strong> mostly north-striking mafic (Tb, TKm),<br />
intermediate (TKap), and quartz porphyry (TKq) dikes are correlated with similar dikes in the northerly adjacent Wagner Wash<br />
Quadrangle (Ferguson et al., 2004). The early to middle Tertiary (TK) and middle Tertiary (T) ages for these rocks are based<br />
on cross-cutting relationships the dikes display with respect to a widespread granitic unit (TKg <strong>of</strong> the northerly adjacent map<br />
area) in the northern White Tank Mountains that has been dated at 56.2 ± 14 Ma (U-Pb zircon, Spencer et al., 2003).<br />
Schistosity in Early Proterozoic supracrustal rocks (Xa, Xp) and a weakly developed foliation in the Early Proterozoic<br />
granodiorite (Xgd) is generally steeply dipping and northeast striking. These fabrics are cut by the Middle Proterozoic, and<br />
middle to early Tertiary stocks and dikes, and are therefore not considered to be related to middle Tertiary extensional<br />
deformation. At the southern edge <strong>of</strong> the bedrock exposures, however, a pervasive, gently southeast-dipping protomylonitic<br />
fabric is present in the granodiorite (Xgd). This fabric is similar to pervasive fabrics described in the eastern White Tank<br />
Mountains that cut middle Tertiary rocks (Brittinghham, 1985), and is possibly related to middle Tertiary extension.<br />
Acknowledgments<br />
The authors would like to thank Steve Reynolds for introducing us to the bedrock geology <strong>of</strong> the White Tank<br />
Mountains. The Flood Control District <strong>of</strong> <strong>Maricopa</strong> <strong>County</strong> provided support for the initial surficial geologic mapping <strong>of</strong> this<br />
quadrangle (Field and Pearthree, 1991) and provided high-resolution digital orthophotos that were used to accurately locate<br />
surficial geologic unit boundaries. Erin M. Moore designed the map layout.<br />
References<br />
Birkeland, Peter W., 1999, Soils and Geomorphology (3 rd Ed.), New York: Oxford University Press, 429 p.<br />
Brittingham, P.L., 1985, Structural geology <strong>of</strong> a portion <strong>of</strong> the White Tank Mountains, central Arizona: Tempe, Arizona State<br />
University, unpublished M.S. thesis, 106 p.<br />
Ferguson, C.A., Spencer J.E., Pearthree, P.A., Youberg, A., and Field, J.J., 2004, Geologic map <strong>of</strong> the Wagner Wash Well<br />
7½’ Quadrangle, <strong>Maricopa</strong> <strong>County</strong>, Arizona: Arizona Geological Survey Digital Geologic Map 38, 1 sheet, scale<br />
1:24,000.<br />
Field, J.J., and Pearthree, P.A., 1991, Surficial geology around the White Tank Mountains, central Arizona [Daggs Tank, White<br />
Tank Mts. NE, McMicken Dam, Buckeye NW, White Tank Mts. SE, Waddell, Buckeye NW, Valencia, and Perryville 7.5’<br />
quadrangles]: Arizona Geological Survey Open-File <strong>Report</strong> 91-08, 7 p., 9 sheets, scale 1:24,000.<br />
Field, J.J., and Pearthree, P.A., 1992, Geologic mapping <strong>of</strong> flood hazards in Arizona – An example from the White Tank<br />
Mountains area, <strong>Maricopa</strong> <strong>County</strong>, Arizona: Arizona Geological Survey Open-File <strong>Report</strong> 91-10, 16 p., 4 sheets, scale<br />
1:24,000.<br />
Gile, L.H., Hawley, J.W., and Grossman, R.B., 1981, Soils and geomorphology in the basin and range area <strong>of</strong> southern New<br />
Mexico -- guidebook <strong>of</strong> the Desert Project: New Mexico Bureau <strong>of</strong> Mines and Mineral Resources Memoir 39, 222 p.<br />
Hartman, G.W., 1977, Soil survey <strong>of</strong> <strong>Maricopa</strong> <strong>County</strong>, central part: Soil Conservation Service, USDA, 117 p., 131 sheets,<br />
scale 1:20,000.<br />
Machette, M.N., 1985, Calcic soils <strong>of</strong> the southwestern United States, in, Weide, D.L., ed., Soils and Quaternary Geology <strong>of</strong><br />
the Southwestern United States: Geological Society <strong>of</strong> America Special Paper 203, p. 1-21.<br />
Reynolds, S.J., and DeWitt, Ed, 1991, Proterozoic geology <strong>of</strong> the Phoenix region, central Arizona, in, Karlstrom, K.E., ed.,<br />
Proterozoic geology and ore deposits <strong>of</strong> Arizona: Arizona Geological Society Digest 19, p. 237-250.<br />
Reynolds, S.J., Woods, S.E., Pearthree, P.A., and Field, J.J., 2002, Geologic map <strong>of</strong> the White Tank Mountains, central<br />
Arizona: Arizona Geological Survey Digital Geologic Map 14, scale 1:24,000.<br />
Spencer, J.E., Isachsen, C.E., Ferguson, C.A., Richard, S.M., Skotnicki, S.J., Wooden, J., and Riggs, N.R., 2003, U-Pb<br />
isotope geochronologic data from 23 igneous rock units in central and southeastern Arizona: Arizona Geological Survey<br />
Open-File <strong>Report</strong> 03-08, 40 p.<br />
Contact, accurate<br />
Contact, approximate<br />
Contact, concealed<br />
Map Legend<br />
Tertiary andesite porphyry dikes<br />
Tertiary basaltic dikes<br />
Tertiary - Cretaceous mafic dikes<br />
44 Bedding, accurate<br />
55<br />
75<br />
Schistosity<br />
61 Irregular or contorted inclined foliation<br />
25<br />
15<br />
Generic foliation<br />
Lineation in cumulate rocks<br />
Protomylonite<br />
38<br />
Fault attitude<br />
Arizona Geological Survey<br />
DGM-37 (Buckeye NW)
APPENDIX TM3-03<br />
SUBSIDENCE AND EARTH FISSURE DOCUMENTATION<br />
091337133, 2010-055, TT005 <strong>Maricopa</strong> <strong>County</strong> <strong>Department</strong> <strong>of</strong> Transportation<br />
Technical Memorandum 3 Yuma Parkway Corridor Feasibility Study<br />
<strong>Conceptual</strong> <strong>Drainage</strong> <strong>Report</strong> August 2011
Wintersburg Rd<br />
371st Ave<br />
Salome Hwy<br />
Elliot Rd<br />
Van Buren St<br />
Buckeye Rd<br />
355th Ave<br />
02/10/2007 To 04/05/2008<br />
Subsidence<br />
Decorellation/No Data<br />
-2.0 To -3.0 cm<br />
-1.5 To -2.0 cm<br />
-1.0 To -1.5 cm<br />
-0.5 To -1.0 cm<br />
0 To -0.5 cm<br />
339th Ave<br />
Dobbins Rd<br />
Arlington School Rd<br />
! !<br />
331st Ave<br />
Enterprise Rd<br />
!<br />
Wickenburg Rd<br />
Ward Rd<br />
319th Ave<br />
Subsidence Feature<br />
Hardrock<br />
CAP Canal<br />
309th Ave<br />
Johnson Rd<br />
Baseline Rd<br />
Bruner Rd<br />
Palo Verde Rd<br />
Southern Ave<br />
Narramore Rd<br />
Patterson Rd<br />
Arizona Highways and Interstates<br />
Interstate<br />
US<br />
State<br />
Railway<br />
Roads<br />
Yuma Parkway<br />
Study Area<br />
!"a$<br />
Lower Buckeye Rd<br />
Old US 80<br />
Turner Rd<br />
Tonopah Salome Hwy<br />
Wilson Ave<br />
rx 85<br />
Hazen Rd<br />
Land Subsidence in the Buckeye Area, Western <strong>Maricopa</strong> <strong>County</strong><br />
Based on ADWR EnviSat Time-Series InSAR Data<br />
Time Period <strong>of</strong> Analysis: 1.2 Years 02/10/2007 To 04/05/2008<br />
1:173,025<br />
μ<br />
Rooks Rd<br />
Miller Rd<br />
7th St<br />
Watson Rd<br />
Broadway Rd<br />
Apache Rd<br />
McDowell Rd<br />
Yuma Rd<br />
Rainbow Rd<br />
Beloat Rd<br />
Ocotillo Rd<br />
Dean Rd<br />
Riggs Rd<br />
© ESA 2007 - 2008<br />
0 1 2 4 6<br />
Miles<br />
8<br />
Decorrelation (white areas) are areas where the phase<br />
<strong>of</strong> the received satellite signal changed between<br />
satellite passes, causing the data to be unusable.<br />
This occurs in areas where the land surface has been<br />
disturbed (i.e. bodies <strong>of</strong> water, snow, agriculture areas,<br />
areas <strong>of</strong> development, etc).
A NEW EARTH FISSURE<br />
NEAR WINTERSBURG,<br />
MARICOPA COUNTY, ARIZONA<br />
Arizona Geological Survey<br />
Open-File <strong>Report</strong> 01-10<br />
Raymond C. Harris<br />
Arizona Geological Survey<br />
November 2001<br />
22 pages
ARIZONA’S NEWEST EARTH FISSURE<br />
A new earth fissure has been reported southeast <strong>of</strong> Wintersburg, about 75 km (50<br />
miles) WSW <strong>of</strong> Phoenix (Figure 1). The fissure was reported to AZGS in early<br />
September and was visited several times through early November. Field mapping was<br />
done with a hand-held GPS. This fissure appeared over the past summer, probably<br />
during a heavy rainstorm in July. The earth fissure and adjacent desiccation cracks are<br />
plotted on a topographic base (Figure 2) and an aerial photo base (Figure 3).<br />
The fissure is nearly north-south and is 307 m (1007 ft) long (Figure 4). The<br />
fissure is very young, with narrow, steep sides and a highly irregular apparent depth<br />
ranging from 8 feet over short distances. In two locations the fissure is en<br />
echelon (Figure 5), with NW-SE steps. There is no discernable vertical <strong>of</strong>fset across the<br />
fissure.<br />
At the time <strong>of</strong> the first visit in mid September, little material had sloughed <strong>of</strong>f into<br />
the fissure, only enough to open a narrow trench. Erosional downcutting <strong>of</strong> 4-12 inches<br />
has created miniature badlands up to 10 feet wide on the uphill (east) side <strong>of</strong> the crack<br />
(Figure 6). At the time <strong>of</strong> a follow-up visit in early November, the edges <strong>of</strong> fissure were<br />
noticeably rounded <strong>of</strong>f from a small rainstorm the previous day. Much <strong>of</strong> the fissure had<br />
been partially filled in but there had not been enough run<strong>of</strong>f to enlarged it.<br />
Both ends <strong>of</strong> the fissure are characterized by a gradual fading <strong>of</strong> the trench to<br />
miniature grabens and then to a hairline crack. The final 50 feet <strong>of</strong> both ends are slightly<br />
curved. Typical segments <strong>of</strong> the fissure are shown in Figures 7 and 8.<br />
It is common for earth fissures to seemingly appear “overnight” following severe<br />
rainfall. Heavy rain s<strong>of</strong>tens the surficial material, allowing it to cave into the underlying<br />
fissure. The surface expression <strong>of</strong> the fissure probably formed in response to heavy rain<br />
associated with a monsoon storm in July. At depth, the precursor fissure may have been<br />
forming for years or even decades.<br />
The location <strong>of</strong> the fissure, at the edge <strong>of</strong> the basin and somewhat in line with the<br />
trend <strong>of</strong> a small hill, suggests that a shallow buried bedrock ridge may extend south <strong>of</strong> the<br />
hill beneath the trace <strong>of</strong> the fissure. If this scenario is correct, the crack may represent<br />
fissuring due to compaction and subsidence on either or both sides <strong>of</strong> the buried ridge.<br />
This mechanism <strong>of</strong> differential subsidence due to buried topography has been proposed<br />
for earth fissure development in other areas <strong>of</strong> the state (Jachens and Holzer, 1982).<br />
1
Figure 1. Location <strong>of</strong> new earth fissure near Wintersburg.<br />
2
Figure 3. Aerial photo showing location <strong>of</strong> earth fissure and desiccation cracks.<br />
4
Figure 5. En echelon section <strong>of</strong> earth fissure crossing Baseline Road, looking NW.<br />
Fissure is 6-12 inches wide here. Second earth fissure crosses road at far left (arrow).<br />
Figure 6. Section <strong>of</strong> earth fissure north <strong>of</strong> Baseline Road, showing erosion on uphill<br />
(east) side. Fissure is 12-18 inches wide, 1-6 feet deep in this section.<br />
6
ADDITIONAL GIANT DESICCATION<br />
CRACKS NEAR WINTERSBURG,<br />
MARICOPA COUNTY, ARIZONA<br />
by<br />
Raymond C. Harris<br />
Arizona Geological Survey<br />
Open-File <strong>Report</strong> 03-07<br />
November 2003<br />
Arizona Geological Survey<br />
416 W. Congress, Suite #100,<br />
Tucson, Arizona 85701
AREAS OF ADDITIONAL GIANT DESICCATION CRACKS<br />
Giant desiccation cracks have been discovered in two areas near the settlement <strong>of</strong><br />
Wintersburg (Figure 1) on detailed aerial photos obtained from <strong>Maricopa</strong> <strong>County</strong> Flood<br />
Control District. One area is one mile southwest <strong>of</strong> Wintersburg. The second area is<br />
about one mile south-southeast <strong>of</strong> the intersection <strong>of</strong> Wintersburg Road (379th Ave.) and<br />
Elliot Road, about 6 miles south <strong>of</strong> Wintersburg.<br />
1
DESICCATION CRACKS SOUTHWEST OF WINTERSBURG<br />
Giant desiccation cracks have been discovered one mile southwest <strong>of</strong> Wintersburg<br />
(Figure 1) on detailed aerial photos obtained from <strong>Maricopa</strong> <strong>County</strong> Flood Control<br />
District. These cracks are immediately west <strong>of</strong> Wintersburg Road and south <strong>of</strong> a small<br />
hill (Figures 2 and 3). Previously, a new earth fissure and nearby giant desiccation cracks<br />
were reported three miles southeast <strong>of</strong> Wintersburg in the late Summer 2001 (Harris,<br />
2001).<br />
Two clusters <strong>of</strong> cracks are present. The larger northern group (main cluster) extends from<br />
within a few ten <strong>of</strong> meters <strong>of</strong> a small outlier <strong>of</strong> the Palo Verde Hills southward nearly 700<br />
meters. Another cluster, consisting <strong>of</strong> a single crack about 250 meters long, with minor<br />
splays, lies 400 meters south <strong>of</strong> the main cluster.<br />
2
APPENDIX TM3-04<br />
TONOPAH UPLIFT DOCUMENTATION<br />
091337133, 2010-055, TT005 <strong>Maricopa</strong> <strong>County</strong> <strong>Department</strong> <strong>of</strong> Transportation<br />
Technical Memorandum 3 Yuma Parkway Corridor Feasibility Study<br />
<strong>Conceptual</strong> <strong>Drainage</strong> <strong>Report</strong> August 2011
! ! !<br />
! !<br />
!.<br />
!<br />
!<br />
Courthouse Rd<br />
! ! ! ! !<br />
!.<br />
!.<br />
!. MCDOT GDACS Monuments<br />
!<br />
CAP Canal<br />
Hardrock<br />
Highways and Interstates<br />
Interstate<br />
US<br />
State<br />
Roads<br />
Railway<br />
! ! ! ! ! ! ! ! ! ! !<br />
!.<br />
!.<br />
e<br />
v<br />
A<br />
h<br />
t<br />
9<br />
1<br />
4<br />
e<br />
v<br />
A<br />
h<br />
t<br />
1<br />
1<br />
4<br />
Tonopah Recharge Basins<br />
Area <strong>of</strong> Uplift<br />
03/13/2006 To 03/06/2010<br />
Uplift<br />
Decorrelation/No Data<br />
0 To 1 cm<br />
1 To 2 cm<br />
2 To 3 cm<br />
3 To 4 cm<br />
!<br />
! ! ! ! ! ! !<br />
!.<br />
!.<br />
I 10 Front<br />
Thomas Rd<br />
McDowell Rd<br />
Yuma Parkway<br />
Study Area<br />
e<br />
v<br />
A<br />
h<br />
t<br />
5<br />
9<br />
3<br />
e<br />
v<br />
A<br />
h<br />
t<br />
7<br />
8<br />
3<br />
!<br />
d<br />
R<br />
g<br />
r<br />
u<br />
b<br />
s<br />
r<br />
e<br />
t<br />
n<br />
i<br />
W<br />
! !<br />
!.<br />
!.<br />
!.<br />
! !<br />
! !<br />
Indian School Rd<br />
Van Buren St<br />
Uplift in the Vicinity <strong>of</strong> the Tonpah Recharge Facility<br />
Based on ADWR EnviSat Time-Series InSAR Data<br />
Time Period <strong>of</strong> Analysis: 2.8 Years 03/13/2006 To 03/06/2010<br />
1:136,676<br />
μ<br />
e<br />
v<br />
A<br />
t<br />
s<br />
1<br />
7<br />
3<br />
0 0.5 1 2 3<br />
Miles<br />
4<br />
Decorrelation (white areas) are areas where the phase<br />
<strong>of</strong> the received satellite signal changed between<br />
satellite passes, causing the data to be unusable.<br />
This occurs in areas where the land surface has been<br />
disturbed (i.e. bodies <strong>of</strong> water, snow, agriculture areas,<br />
areas <strong>of</strong> development, etc).<br />
Salome Hwy<br />
!<br />
Wickenburg Rd<br />
!<br />
e<br />
v<br />
A<br />
355th<br />
! ! ! ! !<br />
!.<br />
!.<br />
Buckeye Rd<br />
Lower Buckeye Rd<br />
Broadway Rd<br />
© ESA 2006 - 2010
GWSI Web Map<br />
Arizona <strong>Department</strong> <strong>of</strong> Water Resources - Groundwater Data<br />
Legend Map Help<br />
0 16813362 6724 10086 13448 Feet<br />
https://gisweb.azwater.gov/gwsi/Default.aspx<br />
Map Scale 1:100000<br />
Page 1 <strong>of</strong> 1<br />
Water Resource Data GIS Data Map FAQs ADWR Feedback<br />
Satellite<br />
5/13/2011
GWSI Hydrograph<br />
Set x-axis Set y-axis Measurement Remarks<br />
Well Info Map Reset Graph Auto Site Hydrograph Email Help<br />
Local ID Site ID Registry ID Latitude NAD27<br />
Arizona GroundWater Monitoring Site Hydrograph<br />
Longitude<br />
NAD27<br />
Alt. (ft<br />
amsl)<br />
Water Use<br />
Well<br />
Depth (ft)<br />
Case<br />
Dia.<br />
(in)<br />
Drill Date<br />
Latest WL<br />
Date<br />
DTW<br />
(ft)<br />
Page 1 <strong>of</strong> 1<br />
WL Elv. (ft)<br />
B-01-05 10BBC 332648112454301 614389 33° 26' 47.5" 112° 45' 45.0" 1012.88 UNUSED 0 16 3/17/2011 45.67 967.21<br />
GWSI is ADWR's technical database <strong>of</strong> well locations, construction data, and water levels. Created on 5/13/2011<br />
https://gisweb.azwater.gov/gwsi/Hydrograph.aspx?SiteID=332648112454301<br />
5/13/2011
GWSI Automated Hydrograph<br />
Set x-axis Set y-axis Measurement Remarks<br />
Well Info Map Reset Graph Standard Hydrograph Email Help<br />
Local ID Site ID Registry ID<br />
Arizona Automated GroundWater Monitoring Site Hydrograph<br />
Latitude<br />
NAD27<br />
Longitude<br />
NAD27<br />
Alt. (ft<br />
amsl)<br />
Water Use<br />
Well<br />
Depth (ft)<br />
Case<br />
Dia.<br />
(in)<br />
Drill Date<br />
Latest WL<br />
Date<br />
B-01-05 10BBC 332648112454301 614389 33° 26' 47.5" 112° 45' 45.0" 1012.88 UNUSED 0 16 3/17/2011 45.67 967.21<br />
DTW<br />
(ft)<br />
WL Elv. (ft)<br />
GWSI is ADWR's technical database <strong>of</strong> well locations, construction data, and water levels. Created on 5/13/2011<br />
ResetGraph<br />
https://gisweb.azwater.gov/gwsi/HydrographAuto.aspx?SiteID=332648112454301<br />
Page 1 <strong>of</strong> 2<br />
5/13/2011
GWSI Hydrograph<br />
Set x-axis Set y-axis Measurement Remarks<br />
Well Info Map Reset Graph Auto Site Hydrograph Email Help<br />
Local ID Site ID Registry ID Latitude NAD27<br />
Arizona GroundWater Monitoring Site Hydrograph<br />
Longitude<br />
NAD27<br />
Alt. (ft<br />
amsl)<br />
Water Use<br />
Well<br />
Depth (ft)<br />
Case<br />
Dia.<br />
(in)<br />
Drill Date<br />
Latest WL<br />
Date<br />
B-01-05 15CBB1 332541112454501 636568 33° 25' 35.0" 112° 45' 44.3" 980 UNUSED 140 12 12/10/2007 39.3 940.7<br />
DTW<br />
(ft)<br />
Page 1 <strong>of</strong> 1<br />
WL Elv. (ft)<br />
GWSI is ADWR's technical database <strong>of</strong> well locations, construction data, and water levels. Created on 5/13/2011<br />
https://gisweb.azwater.gov/gwsi/Hydrograph.aspx?SiteID=332541112454501<br />
5/13/2011
GWSI Hydrograph<br />
Set x-axis Set y-axis Measurement Remarks<br />
Well Info Map Reset Graph Auto Site Hydrograph Email Help<br />
Local ID Site ID Registry ID Latitude NAD27<br />
Arizona GroundWater Monitoring Site Hydrograph<br />
Longitude<br />
NAD27<br />
Alt. (ft<br />
amsl)<br />
Water Use<br />
Well<br />
Depth (ft)<br />
Case<br />
Dia.<br />
(in)<br />
Drill Date<br />
Latest WL<br />
Date<br />
B-01-05 08DAB 332634112470001 800303 33° 26' 33.6" 112° 46' 59.3" 1056.8 UNUSED 304 16 1/1/1956 12/10/2007 95.8 961<br />
DTW<br />
(ft)<br />
Page 1 <strong>of</strong> 1<br />
WL Elv. (ft)<br />
GWSI is ADWR's technical database <strong>of</strong> well locations, construction data, and water levels. Created on 5/13/2011<br />
https://gisweb.azwater.gov/gwsi/Hydrograph.aspx?SiteID=332634112470001<br />
5/13/2011
GWSI Hydrograph<br />
Set x-axis Set y-axis Measurement Remarks<br />
Well Info Map Reset Graph Auto Site Hydrograph Email Help<br />
Local ID Site ID Registry ID Latitude NAD27<br />
Arizona GroundWater Monitoring Site Hydrograph<br />
Longitude<br />
NAD27<br />
Alt. (ft<br />
amsl)<br />
Water Use<br />
Well<br />
Depth (ft)<br />
Case<br />
Dia.<br />
(in)<br />
Drill Date<br />
Latest WL<br />
Date<br />
DTW<br />
(ft)<br />
Page 1 <strong>of</strong> 1<br />
WL Elv. (ft)<br />
B-01-06 11BCA 332648112504401 629598 33° 26' 46.8" 112° 50' 44.0" 1040.69 IRRIGATION 12/10/2007 90.6 950.09<br />
GWSI is ADWR's technical database <strong>of</strong> well locations, construction data, and water levels. Created on 5/13/2011<br />
https://gisweb.azwater.gov/gwsi/Hydrograph.aspx?SiteID=332648112504401<br />
5/13/2011
APPENDIX TM3-05<br />
DRAINAGE FIELD PHOTOS<br />
091337133, 2010-055, TT005 <strong>Maricopa</strong> <strong>County</strong> <strong>Department</strong> <strong>of</strong> Transportation<br />
Technical Memorandum 3 Yuma Parkway Corridor Feasibility Study<br />
<strong>Conceptual</strong> <strong>Drainage</strong> <strong>Report</strong> August 2011
Camelback Rd<br />
Indian School Rd<br />
Thomas Rd<br />
McDowell Rd<br />
Van Buren St<br />
Buckeye Rd<br />
Lower Buckeye Rd<br />
Broadway Rd<br />
Southern Ave<br />
Baseline Rd<br />
Dobbins Rd<br />
395th Ave<br />
Coyote Wash<br />
Winters Wash<br />
722<br />
387th Ave<br />
Fourmile Wash<br />
720 717<br />
Wintersburg Rd<br />
379th Ave<br />
371st Ave<br />
363rd Ave<br />
Phillips Wash<br />
355th Ave<br />
Salome Hwy<br />
355th Ave<br />
Dickey Wash<br />
347th Ave<br />
339th Ave<br />
339th Ave<br />
331st Ave<br />
Hassayampa River<br />
704 696 687<br />
670 662 654<br />
700<br />
690<br />
Luke Wash<br />
663<br />
678<br />
323rd Ave<br />
Yuma Parkway<br />
Corridor Feasibility Study<br />
Tonopah-Salome Hwy<br />
650<br />
315th Ave<br />
Buckeye FRS #1<br />
638<br />
Johnson Rd<br />
644<br />
Yuma Rd<br />
631<br />
Bruner Rd<br />
Sun Valley Pkwy<br />
Rooseve lt Irrigation District Canal<br />
Palo Verde Rd<br />
624<br />
TM3-05 <strong>Drainage</strong> Field Photo Locations<br />
Study Area<br />
Photo Location/Number<br />
Flood Retarding Structure<br />
River<br />
Wash<br />
Canal<br />
0 0.5 1 2<br />
Wilson Ave<br />
Miles<br />
Southern Ave<br />
Buckeye Canal<br />
Turner Rd<br />
<strong>Maricopa</strong> <strong>County</strong>, Arizona
624: Culvert near Palo Verde Rd<br />
631: D/S Channel through Stotz Dairy
638: U/S at I-10 Culvert<br />
644: Erosion SE <strong>of</strong> Johnson Rd crossing <strong>of</strong> I-10
650: W towards Hassayampa River valley<br />
654: D/S at Hassayampa River tributary
662: D/S along Hassayampa River R Bank<br />
663: U/S along Hassayampa River R bank
670: D/S towards recent lateral migration <strong>of</strong> Hassayampa River<br />
678: Hassayampa River floodplain
687: W towards Dickey Wash crossing<br />
690: U/S at Dickey Wash crossing
696: D/S at Phillips Wash crossing<br />
700: D/S at gabion lining along L Bank <strong>of</strong> Phillips Wash
704: U/S at Phillips Wash<br />
717: U/S at wash crossing near Wintersburg Rd
720: D/S at tributary to Fourmile Wash crossing<br />
722: D/S at Fourmile Wash culverts
APPENDIX TM3-06<br />
RECOMMENDED AREA DRAINAGE MASTER PLAN IMPROVEMENTS<br />
091337133, 2010-055, TT005 <strong>Maricopa</strong> <strong>County</strong> <strong>Department</strong> <strong>of</strong> Transportation<br />
Technical Memorandum 3 Yuma Parkway Corridor Feasibility Study<br />
<strong>Conceptual</strong> <strong>Drainage</strong> <strong>Report</strong> August 2011
Yuma Parkway<br />
Study Area
APPENDIX TM3-07<br />
RECENT EROSION AND SEDIMENTATION IN HASSAYAMPA RIVER<br />
JANUARY 2010 STORM<br />
091337133, 2010-055, TT005 <strong>Maricopa</strong> <strong>County</strong> <strong>Department</strong> <strong>of</strong> Transportation<br />
Technical Memorandum 3 Yuma Parkway Corridor Feasibility Study<br />
<strong>Conceptual</strong> <strong>Drainage</strong> <strong>Report</strong> August 2011
Overview <strong>of</strong> channel at SRP poles<br />
Lateral bank migration at SRP poles
Channel erosion at SRP poles<br />
Overview <strong>of</strong> SRP remedial fill
Sediment deposition at Tonopah Salome Highway<br />
Bank erosion at Tonopah Salome Highway
Eroded 2010<br />
( 18,500 cfs flow 1/21/10)<br />
Exhibit courtesy <strong>of</strong> WEST Consultants<br />
PV-WW1 T144<br />
265’<br />
PV-Rudd T28<br />
PV-WW2 T144<br />
1978 embankment<br />
2009 embankment<br />
BUCKEYE
500�KV�ELECTRIC�TRANSMISSION�STRUCTURES�<br />
HASSAYAMPA�RIVER�<br />
HYDROLOGIC�ENGINEERING�SERVICES�<br />
Prepared�for�the�Salt�River�Project�<br />
�<br />
August�2010�<br />
�Final�<strong>Report</strong>�<br />
�<br />
�<br />
�<br />
�<br />
�<br />
�<br />
�<br />
�<br />
�<br />
�<br />
�
�<br />
�<br />
Yuma Parkway<br />
Study Area (north boundary)<br />
Figure�8.��Erosion�Hazard�Zones�<br />
26�|�P age�<br />
�
�<br />
�<br />
Figure�31.��Erosion�hazard�zones�around�the�tributaries�<br />
55�|�P age�<br />
�
�<br />
5 Site�Conditions�<br />
On�March�9,�2010,�personnel�from�WEST�conducted�a�field�reconnaissance�<strong>of</strong>�the�Hassayampa�River�<br />
near�the�electrical�transmission�towers.��Several�changes�from�the�2005�conditions�under�which�the�<br />
LHWCMP�was�developed�were�noted�and�summarized�in�Figure�32.��The�most�obvious�observation�<br />
during�the�site�visit�was�the�lateral�migration�<strong>of</strong>�the�river�and�scour�that�had�occurred�around�the�<br />
foundations�<strong>of</strong>�electrical�transmission�lines�(see�Figure�33).��There�were�several�areas�where�vertical,�<br />
unstable�banks�were�present�(see�Figure�34�and�Figure�35).��In�addition,�a�minor�flow�split�north�<strong>of</strong>�the�<br />
electrical�transmission�line�crossing�has�now�become�a�major�conveyor�<strong>of</strong>�water.��Finally,�there�was�<br />
some�scour�observed�around�the�right�abutment�<strong>of</strong>�the�I�10�Bridge�(see�Figure�36).��The�soil�material�<br />
present�in�the�channel�appeared�to�be�similar�to�the�material�described�in�the�sediment�gradation�<br />
curves�for�the�sediment�transport�modeling�<strong>of</strong>�the�LHWCMP.��Thus,�it�was�determined�that�no�new�soil�<br />
analyses�were�needed�for�this�study.��<br />
�<br />
�<br />
Yuma Parkway<br />
Study Area (north boundary)<br />
Figure�32.��Areas�<strong>of</strong>�observed�changes�during�the�field�visit�<br />
�<br />
58�|�P age�
�<br />
�<br />
Yuma Parkway<br />
Study Area (north boundary)<br />
Figure�34.��Areas�along�the�Hassayampa�River�with�observed�vertical�banks�<br />
�<br />
�<br />
60�|�P age�
APPENDIX TM3-08<br />
EXISTING EROSION HAZARD MAPPING<br />
091337133, 2010-055, TT005 <strong>Maricopa</strong> <strong>County</strong> <strong>Department</strong> <strong>of</strong> Transportation<br />
Technical Memorandum 3 Yuma Parkway Corridor Feasibility Study<br />
<strong>Conceptual</strong> <strong>Drainage</strong> <strong>Report</strong> August 2011
������<br />
����������������<br />
������<br />
����������������<br />
������<br />
������������������<br />
������<br />
������������������<br />
������<br />
�������<br />
������<br />
�������<br />
������<br />
����������<br />
������<br />
����������<br />
��������<br />
�������<br />
��������<br />
�������<br />
��<br />
��<br />
�����<br />
����������<br />
���������������������<br />
�����<br />
����������<br />
���������������������<br />
������������������<br />
�������������<br />
������������<br />
������<br />
����������������������������<br />
����������������������<br />
����������������<br />
�������������������<br />
���������������������������<br />
�������������������������<br />
������������������������������������<br />
� � � � �<br />
�����<br />
��������������������<br />
���������������������������<br />
������������<br />
�������������������������<br />
���������������<br />
�������������������������<br />
���������������������������<br />
������������<br />
�������������������������<br />
��������������������<br />
�����������<br />
�������������������������<br />
��������<br />
��������������������������<br />
��������<br />
�����������������������<br />
�������������������������������������<br />
�����<br />
������������������������������������������<br />
���������������������������������������<br />
����������������������������������������<br />
��������������������������������������<br />
����������������������������������<br />
������������������������������������<br />
������<br />
���� �������<br />
����� ����
APPENDIX TM3-09<br />
SAND AND GRAVEL MINING DOCUMENTATION<br />
091337133, 2010-055, TT005 <strong>Maricopa</strong> <strong>County</strong> <strong>Department</strong> <strong>of</strong> Transportation<br />
Technical Memorandum 3 Yuma Parkway Corridor Feasibility Study<br />
<strong>Conceptual</strong> <strong>Drainage</strong> <strong>Report</strong> August 2011
Camelback Rd<br />
Indian School Rd<br />
Thomas Rd<br />
McDowell Rd<br />
Van Buren St<br />
Buckeye Rd<br />
Lower Buckeye Rd<br />
Broadway Rd<br />
Southern Ave<br />
Baseline Rd<br />
Dobbins Rd<br />
FA04-050<br />
Roy Ogg<br />
395th Ave<br />
387th Ave<br />
Wintersburg Rd<br />
379th Ave<br />
371st Ave<br />
363rd Ave<br />
355th Ave<br />
355th Ave<br />
Salome Hwy<br />
347th Ave<br />
FA01-113<br />
Celtic Visions LLC/Hassayampa Properties LLC<br />
SG08-001<br />
Pioneer Landscaping Materials Inc.<br />
SG03-002<br />
CEMEX Construction Materials South, LLC<br />
339th Ave<br />
339th Ave<br />
331st Ave<br />
Hassayampa River<br />
FA96-032A<br />
Hanson<br />
SG06-005<br />
ABC/Dave Waltemath<br />
323rd Ave<br />
Yuma Parkway<br />
Corridor Feasibility Study<br />
SG07-001<br />
Western Aggregates/Todd Hall<br />
315th Ave<br />
Johnson Rd<br />
Yuma Rd<br />
Bruner Rd<br />
Sun Valley Pkwy<br />
Roosevelt Irrigation District Canal<br />
Palo Verde Rd<br />
Study Area<br />
Sand and Gravel Permit Sites<br />
Permit data from FCDMC database (July 2010)<br />
0 0.5 1 2<br />
Tonopah-Salome Hwy<br />
Wilson Ave<br />
Southern Ave<br />
Appendix TM3-09. Sand and Gravel Mining Permits<br />
Miles<br />
Buckeye Canal<br />
Turner Rd<br />
<strong>Maricopa</strong> <strong>County</strong>, Arizona
þ,*.T1,!*r. T/l A'hShlrih+rJ<br />
' ì* .ir.¿h<br />
Ft,uvlAl.-ízrudd.nog <strong>of</strong> Sand uHiog rmpacrs<br />
For Lower Hassayampa River<br />
Prepared for<br />
Engineering Application Development and River Mechanics<br />
Engineering Division<br />
Flood Control District <strong>of</strong> <strong>Maricopa</strong> <strong>County</strong><br />
May 2009<br />
Gll[]10 Gonsufltants<br />
Hydraulic and Hydrologic<br />
Engineering<br />
Erosion and Sedimentation<br />
P.O. Box 9492<br />
6001 Avenida Alteras<br />
Rancho Santa Fe, CA92067-4492<br />
TEL: (858) 756-9050, (858) 692-0761<br />
FAX: (858) 7s6-9460<br />
Vt**n 4r, Y** ?k"1 l6'J.¡r'lall
L<br />
I 100<br />
1060 i<br />
a ; i*w.s.athalftinæ<br />
1020 fi*1¡úIat bed -<br />
E e80<br />
.€ e4o<br />
É)<br />
EI<br />
a)<br />
€<br />
d<br />
G<br />
a)<br />
f¡¡<br />
t400<br />
1360<br />
Iorrgtttdlnel Protrles Durlng l0lÞyr Flood<br />
¡ i-Bedatpeakflow<br />
! I<br />
- gsd at erid <strong>of</strong> flood<br />
tt<br />
t320 -P "+ InitÍal bed<br />
t280<br />
t2?10<br />
1200<br />
I r60<br />
ll20<br />
1080<br />
1040<br />
-T-<br />
I<br />
ioW.S. atlalftinp i<br />
i '-Brd atpeak flow<br />
-i-,_:: le4_g[_9nd_9[fl oog<br />
5 6 7 8- I<br />
Ctrum€l statiorl river milcs<br />
19 20 2t 22 23<br />
Channel statiorL river miles<br />
Fig. 6. Simulated lvater-surface and channel bed pr<strong>of</strong>ile changes<br />
during 100-yr flood for existing conditions<br />
l9<br />
24 25 26 27
1000<br />
990<br />
Longltudln¡l Prtflles During lO&yr Flood for<br />
980<br />
970<br />
960<br />
950<br />
ü e4o<br />
.ä e30<br />
E e2o<br />
I 'ow.s. atpeakflow<br />
f-'<br />
I -+Initial bed ;ìiitl<br />
!<br />
I . Bed at Deak flow<br />
¡:<br />
l--l - * Bed at end <strong>of</strong>flor<br />
t-'--<br />
E¡ 9lo<br />
&<br />
i.d (t<br />
q)<br />
I f¡l<br />
900<br />
890<br />
880<br />
870<br />
860<br />
850<br />
I 180<br />
I t60<br />
I 140<br />
I 120<br />
r r00<br />
r080<br />
t060<br />
1040<br />
t020<br />
'-l-- I -- i- - i--_-l<br />
Longltudlnal Pr<strong>of</strong>lles Durlng I Ol)-yr Flood for Pmposed Condtlons<br />
'<br />
- Bed at peak flow i<br />
{l<br />
i * Bed at end <strong>of</strong>flood:<br />
I1.5 t2 t2.5 13 13.5 t4 14.5 15 15.5<br />
Channel stat¡on, river miles<br />
Fig. 13. Water-surface and ohannel-bed pr<strong>of</strong>ïle changes<br />
during 100-yr flood for proposed conditions<br />
16 ló.5 l7 t7.5 18<br />
I
jE co<br />
6<br />
-È<br />
f͡<br />
c¡<br />
.{)<br />
c<br />
o<br />
(t<br />
4)<br />
fr¡<br />
970<br />
960<br />
950<br />
940<br />
930<br />
920<br />
9r0<br />
900<br />
890<br />
880<br />
870<br />
860<br />
I 180<br />
I 160<br />
I140<br />
tt20<br />
I t00<br />
t080<br />
1060<br />
1040<br />
1020<br />
1000<br />
Lo4gltudiml Prufiles Duúng Flood Series for Proposed<br />
4.5 5<br />
6.5 7 7.5 8<br />
Channel statior¡ ríver miles<br />
Longitudinel P¡<strong>of</strong>iles During Flood Series for Proposed Conditiorc<br />
l¡,t<br />
-FW.S. atpeakflow<br />
.-_1 -# Initial bed<br />
,i<br />
-Bed athalf time I ' i<br />
: + Bed at end <strong>of</strong> flood l-i-;<br />
.<br />
i__-_-l_______l i<br />
ii,t<br />
I r r r.5 12 12.5 t3 13.5 l4 14.5 15 r5.5 16 16.5 t7 t7.5 l8<br />
Channel station, river miles<br />
Fig. l4 (continued). Water-surface and channeþbed pr<strong>of</strong>ile changes<br />
during flood series for proposed conditions<br />
28<br />
iI
**ìp<br />
Table 5. Comparison <strong>of</strong> changes in sediment budget related to mining project<br />
River reach<br />
River miles<br />
M: Channel reach with instream mining<br />
N: Channel reaches without instream m<br />
Change in sediment<br />
storage for existing<br />
conditions<br />
Change in sediment<br />
storage for proposed<br />
conditions<br />
Impacts <strong>of</strong> sand<br />
mining on sediment<br />
budget*<br />
Million tons Million tons Million tons<br />
0.s4 - 0.82 (M) +0.22 +1.10 +0.88<br />
0.82 - s.57 (N) +1.01 +0.14 -0.87<br />
s.s7 -6.14 (M) -0.06 +2.07 +2.13<br />
6.14 - 7.37 (N) +0.13 -0.24 -0.37<br />
7.37 -8.22(M) +0.29 +1.75 +1.40<br />
8.32- 12.09 (N) +0.01 -1.40 -t.4t<br />
12.09 - 12.85 (M) +1.57 +0.78 +0.79<br />
r2.8s - 13.r3 (N) +0.09 -0.33 -0.42<br />
13.13 - r4.83 (M) -0.02 +1.52 +1.54<br />
14.83 - 1s.02 (N) -0.01 -0.23 -0.22<br />
rs.02 -<br />
r5.87 (M) -0.01 +1.52 +1.53<br />
15.87 - 26.38 (N) -1.5 t -4.38 -2.87<br />
26.38 - 27.8e (N) +0.83 +1.10 +0.27<br />
tA negative value indicates increased erosion due to sand mining for channel reach<br />
*A positive value indicates decreased erosion due to sand mining for channel reach<br />
35
Table t (continued). List <strong>of</strong> minimum bed elevations at end <strong>of</strong> events<br />
Channel 100-yr flood<br />
Station Existing<br />
River miles Feet<br />
7.75 944.62<br />
7.84 948.89<br />
7.94 949.52<br />
8.03 953.1s<br />
8.13 954.97<br />
8.32<br />
8.41<br />
8.51<br />
8.6<br />
8.1<br />
8.79<br />
8.89<br />
8.98<br />
9.08<br />
9.17<br />
9.27<br />
9.36<br />
9.45<br />
9.55<br />
9.64<br />
9.74<br />
9.83<br />
9.93<br />
10.02<br />
10. l2<br />
10.21<br />
10.31<br />
t0.4<br />
10.5<br />
10.59<br />
10.69<br />
10.73<br />
t0.77<br />
10.87<br />
r 0.98<br />
I l.0t<br />
I t.09<br />
ll.l6<br />
11.24<br />
957.74<br />
960.37<br />
961.42<br />
964.92<br />
966.96<br />
968.87<br />
970.t9<br />
972.15<br />
974.67<br />
976.66<br />
978.97<br />
981.22<br />
984.3<br />
986.97<br />
989.7t<br />
990. l8<br />
99t.87<br />
993.4<br />
995.18<br />
998.6<br />
1002.7<br />
r003.67<br />
1006.79<br />
1009.94<br />
l0 I 1.37<br />
10t2.92<br />
1013.32<br />
1015.06<br />
1015.t6<br />
1018.7<br />
1018.77<br />
1021.85<br />
1022.83<br />
100-yr flood<br />
Proposed<br />
Feet<br />
943.18<br />
942.31<br />
944.67<br />
945.37<br />
950.7t<br />
950.53<br />
951.6r<br />
9s4.35<br />
954.95<br />
9s6.72<br />
960.46<br />
962.62<br />
965.3s<br />
967.83<br />
970.92<br />
973.38<br />
974.99<br />
979.66<br />
982.09<br />
987.28<br />
988.77<br />
990.25<br />
992.08<br />
993.79<br />
99s.53<br />
999.05<br />
997.26<br />
1003.01<br />
r006.8<br />
1009.7t<br />
l0tl.86<br />
10t2.79<br />
l0r3.0s<br />
1014.87<br />
l0l5. t5<br />
1017.93<br />
1018.74<br />
1021.7<br />
t022.82<br />
Flood series Flood serres<br />
Existing Proposed<br />
Feet Feet<br />
945.44<br />
939.83<br />
69<br />
947.72<br />
949.06<br />
951.47<br />
953.98<br />
959.42<br />
961.66<br />
962.39<br />
963.74<br />
964.93<br />
967.52<br />
968.83<br />
971.25<br />
973.52<br />
974.87<br />
977.53<br />
979.77<br />
981.41<br />
983.41<br />
98s.81<br />
987.94<br />
989.68<br />
992.51<br />
995.19<br />
996.ss<br />
998.4s<br />
1000.84<br />
"_.,!-aH¿<br />
1004.47<br />
1008.32<br />
r009.38<br />
1013.07<br />
l0 13. l3<br />
1014.54<br />
1015.94<br />
r 016.98<br />
l0l8.7l<br />
10 r 9.98<br />
1021.12<br />
942.45<br />
943.6<br />
945.64<br />
946.64<br />
I<br />
951.4<br />
953.7<br />
9s6.06<br />
958.2t<br />
9s9.94<br />
961.76<br />
963.68<br />
965.25<br />
966,73<br />
968.39<br />
970.38<br />
972.25<br />
973.83<br />
975.8<br />
977.58<br />
979.58<br />
981.38<br />
983. r 5<br />
985.r I<br />
987.39<br />
988.75<br />
990.56<br />
992.22<br />
993.46<br />
994.61<br />
994.57<br />
996.1 I<br />
997,82<br />
999.46<br />
999J6<br />
999.43<br />
r 001.26<br />
1002.68
Table 2 (continueQ. List <strong>of</strong> bed elevations reached by malrimum scour during events<br />
Channel 100-yr flood 100-yr flood Flood series Flood series<br />
Station Existing Proposed Existing Proposed<br />
River miles Feet Feet Feet Feet<br />
7.84 948.9<br />
7.94 949.6<br />
8.03 95t.3<br />
8.13 954.t<br />
8.32<br />
8.41<br />
8.51<br />
8.6<br />
8.7<br />
8.79<br />
8.89<br />
8.98<br />
9.08<br />
9,17<br />
9.27<br />
9.36<br />
9.4s<br />
9.55<br />
9.64<br />
9,74<br />
9.83<br />
9.93<br />
10.02<br />
10.r2<br />
10.2t<br />
10.31<br />
10.59<br />
10.69<br />
10.73<br />
10.77<br />
10.87<br />
10.98<br />
I l.0l<br />
r r.09<br />
I Lr6<br />
n.24<br />
I 1.33<br />
957.5<br />
960,2<br />
96t.3<br />
964.8<br />
966.1<br />
968<br />
970<br />
972<br />
973.5<br />
975.8<br />
978.1<br />
980.3<br />
98t.5<br />
985.4<br />
987.4<br />
989.8<br />
991.7<br />
993.2<br />
994.5<br />
998.4<br />
100r.7<br />
1003,3<br />
1008.5<br />
1009.9<br />
t0r2.7<br />
1012.8<br />
l0l5<br />
l0l5.s<br />
1017.6<br />
l0t8.t<br />
t02t.7<br />
t023<br />
t025.3<br />
937<br />
939<br />
94t<br />
945<br />
946.7<br />
949.7<br />
947.8<br />
950.2<br />
954.8<br />
9æ.4<br />
964<br />
966.7<br />
969.7<br />
972.8<br />
974.7<br />
978.9<br />
980.5<br />
985.4<br />
987.5<br />
990<br />
991.7<br />
993.2<br />
994.s<br />
998.4<br />
1001.7<br />
r003.5<br />
r008.r<br />
1009.1<br />
1012.6<br />
l0r3.l<br />
1014.8<br />
1014.7<br />
r016.8<br />
r017.3<br />
102t.4<br />
t022.6<br />
1025.3<br />
77<br />
944.4<br />
947.5<br />
949.8<br />
950.3<br />
955.2<br />
956.6<br />
957.5 :<br />
962<br />
964.2<br />
965.8<br />
967.5<br />
969.t<br />
971<br />
972.t<br />
973<br />
976.2<br />
978.5<br />
981<br />
982.6<br />
984.4<br />
988<br />
988.3<br />
990.8<br />
994.6<br />
996.4<br />
997.7<br />
1001.6<br />
1004.6<br />
r006.9<br />
1007<br />
t007.2<br />
1009.2<br />
I0t3.7<br />
t0t6.7<br />
1017.8<br />
r018.9<br />
1020.2<br />
929.2<br />
931.4<br />
936.7<br />
936.6<br />
944.2<br />
946.2<br />
948.4<br />
951.7<br />
954.2<br />
956.4<br />
958.2<br />
960.4<br />
963<br />
965.4<br />
967.8<br />
969.9<br />
n0.5<br />
974.2<br />
n6.3<br />
976.4<br />
978.8<br />
98t.6<br />
983.7<br />
984.4<br />
986.1<br />
987.2<br />
988.1<br />
987.8<br />
990.2<br />
990.8<br />
991.8<br />
994.1<br />
996.3<br />
997.2<br />
998<br />
999.5<br />
r00t.4<br />
1000.4
APPENDIX TM3-10-1<br />
EXISTING DRAINAGE STRUCTURE DOCUMENTATION<br />
I-10 CULVERTS (PALO VERDE WATERSHED)<br />
091337133, 2010-055, TT005 <strong>Maricopa</strong> <strong>County</strong> <strong>Department</strong> <strong>of</strong> Transportation<br />
Technical Memorandum 3 Yuma Parkway Corridor Feasibility Study<br />
<strong>Conceptual</strong> <strong>Drainage</strong> <strong>Report</strong> August 2011
Excerpted from Palo Verde Watershed Zone A Floodplain Delineation Study Appendix E.2 (FCDMC, 2003)<br />
Methodology for 1-10 Impoundment Analysis<br />
The culvert analysis along 1-10 deal with types <strong>of</strong> culverts ranging from Box Culverts,<br />
CMP7s, RGRCP7s, and CMP Arch's. All culverts less than 24" in diameter were ignored<br />
since they cannot convey significant amount <strong>of</strong> flow. Flows reaching 1-10 either cross<br />
the roadway at the numbered culverts within the study area, or flow mostly southeast<br />
along the roadway embankment. Therefore, the analysis was started at the west side and<br />
proceed eastward. The area contributing flow to each culvert was determined based on<br />
topographic information and delineation <strong>of</strong> upstream basins. These areas, shown in<br />
acres, are seen on the spreadsheet in the "Area Associated to Culvert Inlet" column. In<br />
addition, any flow from adjacent culverts flowing along the embankment towards the<br />
culvert were added in column "Total Accumulated Area."<br />
An aerial photo plot along with contours are shown for each culvert and it's associated<br />
sub-basin. This plot shows the associated area and calculates flow based on AredRun<strong>of</strong>f<br />
Relationship [Flow=5 10 x Area (s.mi)], (see Section 4). There is an additional aerial<br />
photo plot that shows a close up <strong>of</strong> the culvert being analyzed, this plot was used to<br />
approximate the general slope around the culvert. From reviewing survey and aerial<br />
photographs, the best approach to the analysis <strong>of</strong> the culverts bypass flow was selected<br />
from either Manning's Equation or Weir Analysis (due to a berm or obstruction). FHWA<br />
Inlet Control Nomographs were used to estimate the flows through the culvert. Flow<br />
along the roadway (bypass) was based on a cross section representing either the typical<br />
conveyance path or the weir configuration. These cross sections are provided at each<br />
analysis point along with relevant calculations.<br />
Along the two Traffic Interchanges (T.I.) located within the study area, additional<br />
analysis was required because the access ramps crossings have less capacity than the<br />
freeway crossings. The analysis sheets for these locations explain the procedures used.
Excerpted from Palo Verde Watershed Zone A Floodplain Delineation Study Appendix E.2 (FCDMC, 2003)
Excerpted from Palo Verde Watershed Zone A Floodplain Delineation Study Appendix E.2 (FCDMC, 2003)
Excerpted from Palo Verde Watershed Zone A Floodplain Delineation Study Appendix E.2 (FCDMC, 2003)<br />
Interstate 10 Flow Calculations for Culverts
Culvert ID Culvert Type Contributing Area Contributing Area Total Area Target Flow<br />
from the north from the west Contributing to Culvert (cfs)<br />
(acres) (acres) (acres)<br />
Wsel = 1098<br />
65 1-42" RGRCP 30 0 30 24<br />
Wsel = 1093.3<br />
(Berm to the east preventing flow from going to Culvert #6bj<br />
66 (1 8A) 2-8' x 31' RCB 8221 0 8221 6551<br />
1-8' x 40' RCB<br />
Wsel = 1099.5<br />
(There is a berm at EL=1100 West <strong>of</strong> Culvert 66, so there is no<br />
flow mixing with Culvert #65)<br />
67 1-36 CMP 20 0 20 16<br />
68 1-42" CMP<br />
Wsel = 1099.5<br />
(See Analysis for Culverts 67 through 78 together below)<br />
69 and 1-42" CMP 5938 0 5938 4732<br />
70 (1 9) 2-8' X 10' RCB<br />
Wsel = 1099.5<br />
(See Analysis for Culverts 67 through 78 together below)<br />
Culvert @ 1088<br />
Box is @ 1086.8<br />
Weir is 1097<br />
Top EL <strong>of</strong> Weir<br />
Look at Culverts 78 through 71 for more Hydraulic Calculations<br />
Excerpted from Palo Verde Watershed Zone A Floodplain Delineation Study Appendix E.2 (FCDMC, 2003)<br />
Elevation<br />
(fl)<br />
1095<br />
1098<br />
1099<br />
1100<br />
1101<br />
1101.5<br />
1102<br />
1091<br />
1093<br />
1093.3<br />
1095<br />
1097<br />
1098<br />
1086<br />
1086.8<br />
1090.8<br />
1094.8<br />
1097<br />
1097.5<br />
1098<br />
1099<br />
Culvert lilow<br />
HW Chart 2 or 8 Chart 8 Q-culvert<br />
(fl) HWID QIB (cfslfl) (Cfs)<br />
3 1 .OO 35<br />
4 1.33 50<br />
5 1.67 61<br />
6 2.00 70<br />
6.5 2.17 -- 75<br />
7 2.33 80<br />
2 0.57 20.5<br />
2.3 0.66 26<br />
4 1.14 - 60<br />
6 1.71 95<br />
7 2.00 105<br />
Bottom Width 1 (fl) i31.30<br />
Bottom Width 2 (fl) $8.90<br />
Bottom Width 3 (fl) 31.30<br />
1091<br />
**<br />
1093.2 2.2 0.28 .10.60 1075.9<br />
1095 4 0.50 24.00 2436<br />
1097 6 0.75 54.00 4466<br />
1098 7 0.88 55.00 5582.5<br />
1099 8.00 1.00 li6.00<br />
6699<br />
1099.5 8.50 1.06 '70.00<br />
71 05<br />
1100.5 9.50 1.19 82.00<br />
8323<br />
**This is a three box culvert,<br />
with different dimensions<br />
1092<br />
36"CldP 42"Ch<br />
**<br />
1094 2 0.67 11)- 27 46<br />
1094.5 2.5 0.83 2!5 39 65<br />
1095 3 1.00 3! 52 87<br />
1097 5 1.67 60 90 150<br />
1098 6 2.00 70 106 176<br />
1099 7 2.33 8? 118 198<br />
1099.5 7.5 2.50 8? 123 205<br />
1100.5 8.5 2.83 8fj 129 21 5<br />
**These flows are added to~ether for both<br />
culverts, look at spreadsheet for individual<br />
culvert flows<br />
Bottom Width (fl) '1 0.00<br />
HWID Cfs1fo;lt 42"CMP<br />
for box Box<br />
4 1.14 540<br />
8 2.29 1623<br />
10.2 2.91 172.00 3440<br />
10.7 3.06 182.00 131 3640<br />
11.2 3.20 190.00 136 4036<br />
12.2 3.49 15!6.00 144 4064<br />
**<br />
Manning's Equation for flow along highway<br />
Cross Section Wetted Normal Depth<br />
Area (s.fl) Perimeter (fl) Q (cfs)<br />
bottom width (ft) 0.00<br />
normal depth at elev > 1100<br />
83.00 166.09 37.88<br />
186.75 249.13 111.70<br />
332.00 332.17 240.58<br />
normal depth at elev > 1100<br />
205<br />
-<br />
13800 cfs + 136 for 42"<br />
13920 cfs + 144 for 42"<br />
Weir Flow over obstruction<br />
Avg. :?eight Length Weighted Q-east<br />
H'N (L2) Avg Head (H) (cfs)<br />
( fl) (ft)<br />
weir flow depth at elev > 11 00.00<br />
-<br />
weir flee-th at elev > 1096.80<br />
(Just east <strong>of</strong> Culverts 69 and 70)<br />
weir flow depth at elev > 1096.80<br />
-<br />
Q-total<br />
(cfs)<br />
35<br />
50<br />
61<br />
108<br />
187<br />
321<br />
21<br />
26<br />
60<br />
95<br />
105<br />
1076<br />
2436<br />
4466<br />
5583<br />
6699<br />
46<br />
65<br />
87
MOI j ja6~el ea~v 1e1ol eaJv 6ullnql~luo3 eaJv 6ullnql~luo=) adAl vaAln3 a1 I J ~ A I ~ ~<br />
(~olaq s!sAleuv CL q6no~ql 8~ sva~ln3 ass<br />
(~olaq s!sA~euy LL q6nolw 8~ sva~1n3 ass<br />
dW3 ,,OE- l<br />
S 1 6 1 0 6 1 dW3 ,,OE- 1 PL Pue 9L<br />
(Molaq s!sAleuv LL y6no~ql 8~ sva~ln3 ass<br />
80LZ 9P9Z 0 SP9Z d W 3 ,,OEZ EL<br />
(Mow s!sAteuv LL q6no~ql 8~ svawn3 ass<br />
(sa~3e) (sa~3e) (88138)<br />
(543) va~ln3 01 6ullnql~luo3 1saM ayl UOJJ uvou aul wo~4<br />
LL va~ln3 sp~e~ol ~U!MOIJ 'adols (+) e uo a ~e (CL ol 8~) spa~ln3 BU!MOIIOJ a41<br />
93tl ,O1 x ,S-E (OZ) LL<br />
68 11 1 0 11 1 dW3 ,,OE-1 Pue 8L<br />
S'ZO L L s! aQePnS Peotl<br />
~g spay113 JO~ sfsAleuy aasj<br />
S'ZOLL = lasM<br />
L60 1 @ lJaAln3<br />
9'P60L @ Sl XOS<br />
(~olaq Jayla60l 8~ q6no~qj<br />
LZtr 619 0 6ZS dW3 ,,9E-Z 9L<br />
(~olaq ~ayjaSoj8~ y6no~ql~g spa~ln3 JOJ s!sAleuy aas)<br />
S'660C = lasM<br />
L<br />
(Molaq ~aqla6ol 8~ q6no~qj ~g spanln3 JOJ s!sAleuv aas)<br />
S'6601 = lasM<br />
1601. @ 1.la~ln3<br />
(~olaq ~aqla6ol 8~ 46no~yl ~g spayn3 JOJ s!sAleuy aas)<br />
S'660L = lasM<br />
160 C @ lJaAln3<br />
Excerpted from Palo Verde Watershed Zone A Floodplain Delineation Study Appendix E.2 (FCDMC, 2003)<br />
UOlleAal3<br />
(u)<br />
0011<br />
S6601<br />
S ZO11<br />
S 1011<br />
90011<br />
9'6601<br />
S 8601<br />
s 9601<br />
S P601<br />
P60 1<br />
Z60 1<br />
S60 1<br />
0011<br />
Zi 6601<br />
660 1<br />
860 1<br />
0011<br />
S 6601<br />
660 1<br />
860 1<br />
960 1<br />
P60 1<br />
Z60 1<br />
0011<br />
96601<br />
660 1<br />
860 1<br />
P60 1<br />
Z60 1<br />
($43) (141s~~) 910 a/MH (u)<br />
1~a~ln3-0 8 8 JO zveu3 MH<br />
MOM IJ~AIKI<br />
IenplAlpul JOJ 13aqspea~ds le yo01 'sva~ln3<br />
aaJyl JOJ Jaylatjol pappe ale SMOU asaul,,<br />
PEZP PSt 00 POZ LL '2 Z El<br />
6PLP 6P1 00 OOZ E9'E LZ1<br />
xog xoq JOJ<br />
dW3,,0E 10041s43 aIMH (u)<br />
MH<br />
SMOU 1~a~ln3<br />
OOL1 00 09 00 SS 09 1 8<br />
88PC 00 8P 00 8r7 OP' 1 L<br />
OPZ1 00 OP 00 Ot* OZ 1 9<br />
ZlOL OO'ZZ OWEr 00'1 E<br />
OZL 00 Pz 08 0 P<br />
OPZ 00 8 OP 0 z<br />
+*<br />
SMOU lJaAIn3<br />
lenpl~lpu~ JO~ 13ayspea~ds 1e yo01 'sl~a~ln3<br />
OW JOJ ~aylabol pappe a ~e SMOU asaq~,<br />
S43 dW3 04<br />
Mold aIMH<br />
sl~a~ln3 oq aJe aJaqj<br />
asnmaci palqnop ale SMOU asau,,<br />
PZ 1 00 Z9 OZ E 8<br />
OZ L 00'09 OO'E 9'F<br />
PI 1 00 LC 08 Z L<br />
ZO 1 00 1s OP Z 9<br />
99 00 8Z OZ 1 6<br />
ZE 00 91 08 0 Z<br />
*.*<br />
asnmaq palqnop aJe SMOU asayl,,<br />
PZt 00 Z9 OZ E 8<br />
OZ L 00'09 OO'E 9'L<br />
P11 00 LS 08 Z L<br />
ZO 1 00 1s OP Z 9<br />
ZE 0091 08 0 Z<br />
*1<br />
(~$3) 0 (u) JalaUlJad (U s) ea~v<br />
wdaa I~WJON pal la^ uolpag sso~3<br />
he~y61y G U O MOU ~ JOJ uo11enb3 s,6uluue~<br />
6PLP<br />
ZLOl<br />
OZ 1<br />
OZ 1<br />
,,ZP JO4 VG 1 + S43 080PI<br />
syaAln3 OMJ aJe<br />
aJaw asnaaq palqnop ale SMOU asayl,,<br />
9L 1 00 88 L9 Z 8<br />
99 1 99 1 OFF8 OS'Z S'L<br />
09 1 00 08 EE Z L<br />
- OP 1 00 OL 00 Z 9<br />
OL 00 SE 00 1 E<br />
8E 00 61 L9 0 Z<br />
*+<br />
(U) (44) ' Y)<br />
(~43) (H) PeaH 6 ~ v (~1) A~H<br />
$sea-r) paly6la~ q16ua1 1q61az4 66v<br />
UOlpnJlSqO JaAO Mold JlaM<br />
( 1~ ).la~ln3 40 1- 1snr)<br />
08'960 1 c hala je yldap JI~M<br />
( LL va~1n3 40 1 ~ ~snr) ~ 3<br />
< hala le yldap ~ ioy JI~M<br />
( LL va~1n3 40 $sea wr) < Aala 1e yldap MOD JlaM<br />
-<br />
( LL va~ln3 40 lsnr)<br />
c Aala le yjdap n?U JlaM<br />
08 960 1<br />
08 960 1<br />
08 960 1<br />
-<br />
(SP)<br />
le~ol-b
Culvert ID Culvert Type Contr~but~ng Area Contribut~ng Area Total Area Target Flow<br />
from the north from the west Contr~but~ng to Culvert (cfs)<br />
(acres) (acres) (acres)<br />
72 2-30" CMP 56 0 56 45<br />
See Culverts 78 through 71 Analysis below)<br />
Wsel = 1099.5<br />
(See Analysis for Culverts 67 through 78 together below)<br />
Culvert @ 1092<br />
7 1 2-30" CMP 21 0 0 21 0 168<br />
See Culverts 78 through 71 Analysis below)<br />
Wsel = 1099.5<br />
(See Analysis for Culverts 67 through 78 together below)<br />
Culvert @ 109;<br />
Hydraulic Analys~s Tor Lulverts 78 through 71<br />
78 1-30" CMP 11 1 0 3570 2845<br />
77 (20) 3-5' x 10' RCB<br />
76 2-36" CMP 529<br />
75 1-30" CMP 19<br />
74 1-30" CMP<br />
73 2-30" CMP 2645<br />
72 2-30" CMP 56<br />
7 1 2-30" CMP 21 0<br />
The Hydraul~c Calculations at EL > 1096 8 (Wh~ch a now a submerged Dyke) IS shown below<br />
67 and 1-36" CMP 0 3802 3029<br />
68 1-42" CMP<br />
69 and 42" CMP and 1370<br />
70 2-8' x 10' RCB<br />
78 to 71 2431<br />
Wsel=l098<br />
(Th~s Wsel is for Culverts 67 through 78)<br />
The follow~ng two culverts 79 to 81) are on a (-) Slope, flowing towards Culvert 81<br />
79 3-30" CMP 27 0 27 22<br />
Wsel = 1103.5<br />
(See Analysis for Culverts 79,80, and 81 together below)<br />
Excerpted from Palo Verde Watershed Zone A Floodplain Delineation Study Appendix E.2 (FCDMC, 2003)<br />
Elevat~on<br />
( ft )<br />
Culvert Flow<br />
HW Chart 2 or 8 Chart 8 Q-culvert<br />
(ft) HWlD QIB (cfsfslft) (Cfs)<br />
there are two culverts<br />
1092<br />
**<br />
1094 2 0.80 16 00 32<br />
1096 4 1 60 38.00 76<br />
1098 6 2 40 51 .OO 102<br />
1099 7 2 80 57.00 114<br />
1099.5 7.5 3 00 60 00 120<br />
1100 8 3 20 62 00 124<br />
**These flows are doubled because<br />
there are two culverts<br />
1092<br />
**<br />
1094<br />
1095<br />
2<br />
3<br />
0.80<br />
1 20 -<br />
16.00<br />
28 00<br />
32<br />
56<br />
1098 6 2 40 51 .OO 102<br />
1099 7 2 80 57 00 114<br />
1099 5 7.5 3 00 60 00 120<br />
1100 8 3 20 62 00 124<br />
**These flows are doubled because<br />
there are two culverts<br />
1091<br />
1092<br />
1094 1<br />
1096<br />
1096 8<br />
1097<br />
1098<br />
5<br />
6<br />
2 00<br />
2.40 --<br />
**<br />
31 67-<br />
1099 7 2 80<br />
**These flows were added t& lether for tl<br />
culverts, ~nd~v~dual flows are snown on a<br />
separate spreadsheet<br />
1101<br />
1103<br />
11035<br />
1104<br />
4 1.60 657.8<br />
4.8 1 92 907 3<br />
**These flows are added fo~ Culverts 78 to 71,<br />
see spreadsheet In Analys~s Sheets<br />
2 0.80 48<br />
2.5 1 .OO 66<br />
3 1 20 84<br />
**These flows are tr~pled because<br />
**<br />
**<br />
Mann~ng's Equat~on for flow along hlghway<br />
Cross Sect~on Wetted Normal Depth<br />
Area (s ft) Per~meter (ft) Q (cfs)<br />
120<br />
120<br />
6012 00<br />
normal depth at elev > 1105<br />
We~r Flow over obstruct~on<br />
Avg he~ght Length We~ghted Q-east<br />
HW (L2) Avg Head (H) (cfs)<br />
( ft ) (ft ) (ft)<br />
welr flow depth at elev > 1096 80<br />
(Just East <strong>of</strong> Culvert 71)<br />
Lencjth (L) <strong>of</strong> berm (ft) 292 00<br />
welr flow depth at elev > 1096 80<br />
s~de slope (r~ght) [Z I] 255 00<br />
Lencth (L) <strong>of</strong> berm (ft) 292 00<br />
welr flow depth at elev > 1096 80<br />
s~de slope (nght) [Z I ] 255 00<br />
013 51.00 0 19 76.75<br />
0 80 306 00 1 00 1603 27<br />
1 47 561 00 1.72 51 84 83<br />
Q-total<br />
(cfs)<br />
3244<br />
5275<br />
9357<br />
48<br />
66<br />
84
Culvert ID Culvert Type Contr~but~ng Area Contr~but~ng Area Total Area Target Flow<br />
from the north from the west Contr~but~ng to Culvert (cfs)<br />
(acres)<br />
(acres) (acres)<br />
The following culverts (85 to 83 and an existin g box cul\ rert) are on a (+) Slope, flowing towards Culvert E<br />
Culvert Flow<br />
HW Chart 2 or 8 Chart 8 Q-culvert<br />
(fl) HWID QIB (c.fs/ft) (cfs)<br />
there are three culverts<br />
Bottom W~dth (ft) 10 00<br />
81 (21)<br />
and 80<br />
4-7' x 10' RCB<br />
2-30" CMP<br />
6343<br />
6343 5054<br />
---- **<br />
1089 2<br />
1093 3 8 054 22 00 952<br />
1095 5.8 0 83 41 00 1740<br />
1100 108 154 08 00 3670<br />
1101 11.8 1 69 95 00 3960<br />
1103 138 1 97 106 00 4420<br />
**These flows are added together for two<br />
culverts, look at spreadsheet for ~nd~v~dual<br />
culvert flows<br />
The Hydraul~c Calculat~ons at EL > 1103 (Wh~ch IS now a rnl xed flow w ~th Culvert 79) a shown below<br />
79 3-30" CMP 796 634<br />
81 and 4-7' x 10' RCB<br />
80 2-30" CMP 796<br />
Wsel=l103.5<br />
(This Wsel is for Culverts 79,80, and 81)<br />
85 3-36" CMP 118 0 150 120<br />
83 2-6'~ IO' RCB 1636<br />
Wsel = 1107.8<br />
(If Wsel > 1107.8, then culvert analsis will be analyzed as a mix flow<br />
with Culvert 83)<br />
I 1636 1304<br />
Wsel = 1100<br />
(If Wsel > 1107.8, then culvert analsis will be analyzed as a mix flow<br />
with Culvert 85)<br />
Box Culvert (2-8' x 10')<br />
(No Survey for th~s culvert)<br />
281 1<br />
0 281 1 2240<br />
(Flow is coming directly from Culvert #83)<br />
Wsel = 1100<br />
The following culverts (86 to 89) are on a (-) Slope, flowing towards Culvert 89<br />
86 1-30" CMP 24 0 45 36<br />
Wsel = 11 04.3<br />
86 & 87 are a comb~ned system<br />
87 1-24" CMP 11 0 16 13<br />
Wsel = 1102<br />
Excerpted from Palo Verde Watershed Zone A Floodplain Delineation Study Appendix E.2 (FCDMC, 2003)<br />
Elevat~on<br />
(ft)<br />
1089.2<br />
**<br />
1103.5 14.3 204 11000 4648<br />
11036 144 206 11300 4776<br />
**These were added for nlnr: culverts<br />
1099<br />
**<br />
1103 4 1.33 !6 00 138<br />
1105 6 2 00 70 00 21 0<br />
1106 7 2 33 76 00 228<br />
**These flows are tr~pled because<br />
there are three culverts<br />
Bottom W~dth (ft) I0 00<br />
1091.1<br />
**<br />
1094 2.9 0 48 14 00 280<br />
1095 3.9 0 65 23 00 460<br />
1100 8.9 1.48 66.00 1320<br />
1101 99 1 65 73 00 1460<br />
1105 139 2 32 900 1900<br />
1107 8 167 2 78 109 00 2180<br />
**These flows are doubled because<br />
there are two box culverts<br />
Bottom Wldth (fl) 10 00<br />
1086<br />
**<br />
1090 4 0.50 24.00 480<br />
1093 7 0 88 55 00 1100<br />
1095 9 113 75 00 1500<br />
1098 12 1 50 103 00 2060<br />
1100 14 1.75 125.00 2500<br />
**These flows are doubled because<br />
there are two box culverts<br />
1102<br />
11035<br />
1104<br />
11043<br />
1105<br />
1100<br />
1102<br />
15 0.60 10<br />
2 0.80 16<br />
2.3 0 92 20<br />
3 1 20 28<br />
2 1 00 13<br />
Mann~ng's Equat~on for flow along h~ghway<br />
Cross Sect~on Wetted Normal Depth<br />
Area (s fl) Per~meter (fl) Q (cfs)<br />
normal depth at elev > 1108<br />
normal depth at elev > 1106<br />
normal depth at elev > 1103<br />
.-<br />
We~r Flow over obstruct~on<br />
Avg he~ght Length We~ghted Q-east<br />
HW (L2) Avg Head (H) (cfs)<br />
(!) ( fl) (fl)<br />
weir flow depth at elev > 111000<br />
-<br />
welr flow depth at elev > 1110.00<br />
welr flow depth at elev > 1110.00<br />
Q-total<br />
(cfs)<br />
952<br />
1740<br />
3670<br />
3960<br />
4420<br />
0<br />
0<br />
0<br />
4648<br />
4776<br />
138<br />
21 0<br />
228<br />
280<br />
460<br />
1320<br />
1460<br />
1900<br />
21 80<br />
480<br />
1100<br />
1500<br />
2060<br />
2500<br />
10<br />
16<br />
20<br />
28<br />
13
Culvert ID Culvert Type Contributing Area Contributing Area Total Area Target Ffow<br />
from the north from the west Contributing to Culvert (cfs)<br />
(acres) (acres) (acres)<br />
88 (23A) 5-5' x 10' RCB 2570 0 2560 2040<br />
Wsel = 1104.5<br />
The Road elevation is 1105<br />
89 3-36" CMP 167 270 436 348<br />
Wsel=l098<br />
(See Analysis for Culverts 89 and 90 together below)<br />
The following culverts 90 to 91) are on a (+) Slope, flowing towards Culvert 90<br />
91(24) 1-6'xIO'RCB 245 0 245 195<br />
Wsel = 1101<br />
90 1-36" 41<br />
89 3-36" LMY 167 270<br />
(Same invert from as-builts)<br />
-<br />
Wsel = 1098<br />
(This Wsel is for Culverts 89 and 90)<br />
0 21 3 170<br />
Excerpted from Palo Verde Watershed Zone A Floodplain Delineation Study Appendix E.2 (FCDMC, 2003)<br />
Elevation<br />
( ft ) 1103<br />
Culvert Flow<br />
HW Chart 2 or 8 Chart 8 Q-culvert<br />
(ft) HW/D QIB (cfslft) (cfs)<br />
3 1.50 20<br />
Bottom Width (ft) .I 0.00<br />
1096.5<br />
**<br />
1098 1.5 0.30 5.50 275<br />
1099 2.5 0.50 i2.00 600<br />
1100 3.5 0.70 19.50 975<br />
1100.3 3.8 0.76 22.00 1100<br />
1100.4 3.9 0.78 22.50 1125<br />
11 00.5 4 0.80 23.70 . 1185<br />
1101 4.5 0.90 .:!8.00 1400<br />
1102 5.5 1.10 36.50 1825<br />
11 03.5 7 1.40 48.00 2400<br />
1105 8.5 1.70 58.00 2900<br />
**These flows are multiplied.by 5 because<br />
there are five box culverts<br />
1095<br />
1097<br />
1098<br />
1099<br />
1100<br />
1097.3<br />
1100<br />
1101<br />
1102<br />
1 103.3<br />
1094 pp<br />
1096<br />
1096.5<br />
1097<br />
1098<br />
2 0.67<br />
3 1 .OO<br />
4 1.33<br />
5 1.67<br />
Bottom Width (ft) 10.00<br />
2.7 0.45 13.00 130<br />
3.7 0.62 21.00 21 0<br />
4.7 0.78 30.00 , 300<br />
6 1 .OO 43.00 430<br />
Manning's Equation for flow along highway<br />
Cross Section Wetted Normal Depth<br />
Area (s.ft) Perimeter (ft) Q (cfs)<br />
normal depth at elev > 1095.5<br />
bottom slope 0.001<br />
side slope (right) [Z:1] 205.000<br />
side slope (left) [Z:1] 6.000<br />
bottom width (ft) 0.00<br />
normal depth at elev > 1095.5<br />
Weir Flow over obstruction<br />
Avg. height Length Weighted Q-east<br />
HvV (L2) Avg Head (H) (cfs)<br />
(1 t) (ft) ( ft )<br />
Length (L) <strong>of</strong> berm (ft) 125.00<br />
weir flpw depth at elev > 1 100.30<br />
side slope (right) [Z:1] 202.00<br />
0.07 20.20 0.10 11.55<br />
0.13 40.40 0.18 35.17<br />
0.47 141.40 0.58 314.56<br />
1.13 343.40 1.28 1841.24<br />
weir flow depth at elev > 1 103.90<br />
-<br />
Q-total<br />
(cfs)<br />
20<br />
275<br />
600<br />
975<br />
1100<br />
1137<br />
1220<br />
1715<br />
3666<br />
0<br />
0<br />
130<br />
21 0<br />
300<br />
430<br />
** --<br />
2 0.67 74<br />
2.5 0.83 104<br />
3 1 .OO 140<br />
4 1.33 200<br />
**These flows are multiplied by 4 because<br />
there are four identical culverts<br />
26.38 105.54 7.58<br />
105.50 21 1.09 48.1 5<br />
237.38 316.63 141.99<br />
659.38 527.71 554.53<br />
82<br />
152<br />
282<br />
755
APPENDIX TM3-10-2<br />
EXISTING DRAINAGE STRUCTURE DOCUMENTATION<br />
I-10 CULVERTS (LUKE WASH WATERSHED)<br />
091337133, 2010-055, TT005 <strong>Maricopa</strong> <strong>County</strong> <strong>Department</strong> <strong>of</strong> Transportation<br />
Technical Memorandum 3 Yuma Parkway Corridor Feasibility Study<br />
<strong>Conceptual</strong> <strong>Drainage</strong> <strong>Report</strong> August 2011
I D 'lo<br />
FCDMC Contract 2007C020<br />
Task - Luke Wash Watershed Zone AE Floodplain Delineation Study<br />
Structure Detail Worksheet<br />
Wood/Patel Project #073087<br />
@ Type<strong>of</strong>Structure: L*~P z- qr" Date: r -ro- zuo 8<br />
File Name: LO~E wrs5n<br />
Description Name: rr - 10 s~a. 5,256 +so Partychief: J L~UIER<br />
General Condition <strong>of</strong> Structure -0<br />
(DOWNSTREAM).<br />
_ _ _ _ Photo Taken<br />
. . . . . .<br />
, .-.. .... ....... ....-.-..-..... . ... .. ..<br />
..... .<br />
, . . .> I -. . . .<br />
. - : i -. , ; - -. , ; ; ! . , , , . , > 2 , , , . ,<br />
><br />
,.__ ... . .... ...._._.__.........<br />
. . , I<br />
. . . . . . . .<br />
. . . . . . .<br />
; . , _ , / I A<br />
. , . , )<br />
8 . . . . . . . . .<br />
. . . . . . .<br />
. , . . I . . ! : I : : : :<br />
. . . . . . . . . . 3<br />
. ...- .., ...-..!<br />
. 3 , , , , , I * , . , , . , , .<br />
.......................... 8 . . .......... -1 -. ...... .; ......................... .
TZD 12<br />
FCDMC Contract 2007C020<br />
Task - Luke Wash Watershed Zone AE Floodplain Delineation Study<br />
Structure Detail Worksheet<br />
WoodIPatel Project #073087<br />
Type <strong>of</strong> Structure: LMJ~ z - 30t Date: /-24-~a~0<br />
File Name: L~ltfi ~ f i s t i<br />
Description Name: -C- 10 s74. S-Z~B+ so Party Chief: nfF MLLI EL<br />
General Condition <strong>of</strong> Structure
T D<br />
FCDMC Contract 2007C020<br />
Task - Luke Wash Watershed Zone AE Floodplain Delineation Study<br />
Structure Detail Worksheet<br />
Wood/Patel Project #073087<br />
Type <strong>of</strong> Structure: &r CQI,J,C~ z- IF 5' Date: I - ts -ms<br />
File Name: w KC &AS H<br />
52% t 25<br />
Description Name: .c- 10 ~TA. ,- zc Party Chief: SF, LAW EL<br />
. . 1)I1 . . Photo ............................... Taken ........................................... (UPSTREAM) a ~ .............-.... e ..........--... ......................<br />
a : . / . . . : I .<br />
. . . I . . < , , , . . . . . ., ,<br />
, . / .<br />
a . , . .<br />
I , . " . ' ? ' . ' . , 3 .<br />
I I / .<br />
9 . . !... ...... .$.. ..-.: ....: . ..: ..... :.. r ... .: .... .L... ....... - ... : ., , . , . , ! : : :... ..:. i<br />
: . ,<br />
. . . .<br />
General Condition <strong>of</strong> Structure 6000<br />
Photo Taken<br />
I . . . !<br />
. . . . a<br />
............. . .............. .... ...... ..... ........... , ....... .-. .<br />
...................... ...................... ..................... . ... ... S m ' . ..'-.-.-<br />
. I , . . . . . .<br />
I , , , . I ! : . * .<br />
i . I , , . s . -<br />
. . . . . . . . a , . . < / . . . ! . . . , , . . . I < . /<br />
..................................... I. ..I. ____.I ................... I..... J... .:...... , ........ ..................... i .......................... l<br />
/ . , . . . . I , . . , , , . l . . , . , .<br />
, , , . , . . . . , . , , ,<br />
, . , , $ * 8 s #<br />
, , , . . I . . . , , : ; ; : . : : ; ; : , , I . , , . , # , , !<br />
. ......... . . ........................... . . . . . . ............ . . . ...................... :... .. : ... :....--:-.-...a ..... . . . .<br />
. . , . . . . . . . , . , , . I / . /<br />
. . . ! : : ; i itW')j,~ : : :10
TFs 1%<br />
FCDMC Contract 2007C020<br />
Task - Luke Wash Watershed Zone AE Floodplain Delineation Study<br />
Structure Detail Worksheet<br />
Wood/Patel Project #073087<br />
Type<strong>of</strong>Structure: L ~ P 3- jd" Date: I - 29-zoo E3<br />
File Name: LJ~E 4 s ~<br />
Description Name: x- 10 rd. -5-3 16 + Party Chief: x~f &4LU64<br />
Photo Talten<br />
, . . -<br />
(UPSTREAM). .... ,!d%%7rt:.<br />
.; ...........................................<br />
I . .<br />
, , 1<br />
l . ...... 5.. .. ;.. .........I...... ;. ........... . \<br />
,<br />
,<br />
,<br />
,<br />
,<br />
-<br />
,<br />
I<br />
, , .<br />
, . , ,<br />
.<br />
, , , . , .<br />
................ . , . . , . . . . ...........................<br />
.<br />
, , . , . * , : ; : .<br />
. ) . c 2 . . , , ,<br />
. . . . :. ...... .: ...... : ...... ' .:..:.. .. : .......................................... 1 : : . ,<br />
I<br />
:<br />
....... I . .-<br />
, , . . . :<br />
. , , . 0 . ; .......... : . . .<br />
, . . . . s '<br />
.<br />
.:<br />
m . . .<br />
, . ,<br />
m a<br />
, . I , . ,<br />
. ,<br />
, . ,<br />
&<br />
. .<br />
,<br />
. ,<br />
, . .<br />
c . . . , . ,<br />
................ . , , . ..;.....; . * . . .!.$!;+&,., . . . ..pd~3".;.~o<br />
. . '<br />
, , . . I . . , , ! : ;<br />
. . I . '<br />
..........:.. ..I -... ;.. .. : ... ;. ..--. 1.. - :. Ed..$$,& -..+t?q.. ...; .--.-. ;. ... ;- ....................................‘.<br />
..<br />
d<br />
, ; . I<br />
. . . . . . . . . . . . , . .<br />
, . , . ' .<br />
. , . . i . / ' t .<br />
.... --..-.----..----.-- -..A .... ----.-.:-.-,-. ........-.. : . ....._. i.-. . .: ........ L ............... ! .--- .......... ...- . ................... ....-<br />
. . . . ,<br />
r ..... i.. ..:<br />
; : : ; ;<br />
, I , ,<br />
, . , .<br />
/ ' / / / :<br />
. . . . .
Type <strong>of</strong> Structure: ~ n p<br />
File Name: LJKE NI-~CH<br />
I D 20<br />
FCDMC Contract 2007C020<br />
Task - Luke Wash Watershed Zone AE Floodplain Delineation Study<br />
Structure Detail Worksheet<br />
WoodPatel Project #073087<br />
rr " Date: I- 29--6<br />
Description Name: s-10 57~1. 5319 + zo Party Chief: rt~f LA L& ER<br />
General Condition <strong>of</strong> Structure mp OF WP BEUT<br />
Photo Taken<br />
(DOWNSTREAM)<br />
. .................................................................................. ., ............. .%s9%%-- -..--.-... - , ......--.a ..... _,_ ...........................<br />
. a , , l , '<br />
, , , ! I . .<br />
, , I<br />
, . .<br />
1 I ! : : , . , . , I<br />
. , ; : : : : , , . , ( , . , , '<br />
s , , .................. , . . : : : . : I : : : : : : I ) : : : ;<br />
....I.. .., ...... ? .... '. ........ .. .............. 8 ................. .............................................. . . ..--..-. .................. *<br />
. . , . . I . I , , , < . I . . . . , / , . / , . , I<br />
, : ! ; : t , , . 8 8<br />
, . . : ; ; : ; ; : ,<br />
. . # , . , * . ,<br />
. . .<br />
, , . . , ,<br />
t ............... .... -1 -. .:. .. .'. .. ,...Mu~L..: . ....&. I .&.. &;i.. . 1 . 8 . .<br />
.' ... . : ......... ' .... . ....... ;<br />
. , a<br />
. , . , . . I I -I . 8<br />
. , . . , . : .<br />
7 : . . .<br />
, , ,<br />
, . ,<br />
a , .<br />
' . . / / ,<br />
: - 3. . . . . : . . . . . . . . . . . . . . . .."".i":.. . ...$o. .&* . &..$j,,w i. . ;. . i ................... 2<br />
. , .<br />
. . , .<br />
. .<br />
. , , a<br />
. . . . . . . ,<br />
. .<br />
, , .<br />
L . . . . ' , , . ! j : , : , . , , . . . . , . , . .<br />
/ / I , , .<br />
..<br />
I , . . , , . . !... ................-...-.-...-... .... . . - a - --..,.-.-.. ............................... w)qf.. .. ..;... .:..: ..... : .....; ...... ;.. .... : ...... : ...... : ........... ..:.. .. ,...-..,.-.... , ,<br />
a , . , . . I , , . , . . .<br />
, , , , I % / , ' . ! : ; a 3 . .<br />
. # . , I<br />
. . / . . , 3 , ; / . , . . . < , a<br />
, . ............ . .<br />
. . , .<br />
,. ........._................... / ...... ...... ....- -.-... .......... .......... ..... ...... .:...... . ......... . .<br />
. . ...... ......<br />
, .<br />
; : : .( ..L ..! : :... yi... ' .'... ; i<br />
I A . , , , . . I .<br />
h . . , . . , I , , ,<br />
2 m . ' I . , , . , . . .<br />
. . . . ,<br />
I * , , . : ' . 1 : : , i , : . : : : : :<br />
.......... L.. ........ ..: ..... :r .... ; ...... j .. .I.._ ..I ............. I ............. : ............. 4. ..... n. ..... ..... .C ....... .... i.._...,... ... 1. .... I. .: .... L<br />
4 3<br />
. , . . . . , . . , . : .<br />
I . , , , . ,<br />
8 .<br />
. . ! : . : . .<br />
, . , . < . . . , . ' .<br />
. / ; : !<br />
i ; . . . . , , , a . . I / . , ' I , , , , . I S , . , ,<br />
(.. . _<br />
................. ..... -4. ...........-.-................................... 0. .....,. ............................................ .., ........... ; ....... .i ...... : .... ..: ...... : ...... :<br />
General Condition <strong>of</strong> Structure E 2.5<br />
. .
ZD 2b<br />
FCDMC Contract 2007C020<br />
Task - Luke Wash Watershed Zone AE Floodplain Delineation Study<br />
Sh-ucture Detail Worksheet<br />
WoodIPatel Project #073087<br />
Type <strong>of</strong> Structure: cub60 r- ,a$%2 Date: I- 2 9- m 8<br />
File Name: LJ ICE HASH<br />
5345 -52<br />
Description Name: :S- 10 sr~. s3 qst sr Party Chief: TEFF LALLIJ~Q<br />
General Condition <strong>of</strong> Structure Goo0
TO 28<br />
FCDMC Contract 2007C020<br />
Task - Luke Wash Watershed Zone AE Floodplain Delineation Study<br />
Structure Detail Worksheet<br />
Wood/Patel Project #073087<br />
Type <strong>of</strong> Structure: YB" m P Date: I-LL-Z~O~<br />
File Name: LUKE crlf~~<br />
53f7-+50 .<br />
Description Name: 2- lo 5714. 53~4 +so Party Chief: Tiff ULLIER<br />
General Condition <strong>of</strong> Structure GWD
FCDMC Contract 2007C020<br />
Task - Luke Wash Watershed Zone AE Floodplain Delineation Study<br />
Structure Detail Worksheet<br />
WoodPatel Project #073087<br />
Type <strong>of</strong> Structure: $x c ~ w ~ Z- 6 IU'KJ' Date: 1-22 - z ~ e<br />
File Name: LJ ICE I.+<br />
Description Name: r- I o s,~, sJS3 + YO Party Chief: JEFF MU,E~<br />
Photo Taken<br />
(UPSTREAM)<br />
.................... . . . . . ... . .<br />
. , , ............................ .... .........<br />
..............<br />
. s ,<br />
, . ..; DQ=+ .-.;..... ;... ;. ,...<br />
, .<br />
. ,<br />
) ( .<br />
. . . . . . , , . . I '<br />
. , ' , , , . e<br />
! % , I !<br />
. . . . _ . . " ........ ' -. . ......... ,. ........................ , , . ..r.. I<br />
, ,<br />
........ / . . ' . . ..............<br />
, . .<br />
. . , ,<br />
, . /<br />
General Condition <strong>of</strong> Structure<br />
, . .<br />
Photo Taken ...................................... @OWNSTREREAM). . . .XbtiTA;. ......... ! ..... .;. ...................<br />
.......................... , . a ,<br />
5 , . . . . . . . . . . . . < . . . 0<br />
. a s<br />
a , . ,<br />
. . . . . , , , . * .<br />
, . . , .<br />
. , .<br />
. . .<br />
. , ,<br />
,<br />
, . . . . . . . . . .<br />
. . , , ,<br />
, , . . . + . , , , . . . < . a , l . , . I<br />
, , , , / I<br />
. . . . . . . . . . . . . . . . . . . . . . . I.. ................... 1.. ,. . . . . . . . . . . .<br />
.............. # . . . I . . ! .<br />
General Condition <strong>of</strong> Structure &D E 2-8<br />
Y:\SurveyV;CDMC Fonn2.doc I
I D<br />
32<br />
FCDMC Contract 2007C020<br />
Task - Luke Wash Watershed Zone AE Floodplain Delineation Study<br />
Structure Detail Worksheet<br />
Wood/Patel Project #073087<br />
Type <strong>of</strong> Structure: goy t~~~in-r I - loess Date: I -2 2- 2008<br />
Description Name: r- 10 sw. g36ot- 50 Party Chief: TEFF LA LLIE~ General Condition <strong>of</strong> Structure &.I)
TO 36<br />
FCDMC Contract 2007C020<br />
Task - Luke Wash Watershed Zone AE Floodplain Delineation Study<br />
Structure Detail Worksheet<br />
Wood/Patel Project #073087<br />
Type <strong>of</strong> Structure: Ibr c ~ w w<br />
File Name: WAS/-t<br />
IO'XS' Date: I-U-W~<br />
Description Name: 5- lo ST~. 5YoL 1-36 Party Chief: TGPF &f-64<br />
General Condition <strong>of</strong> Structure Goo0
FCDMC Contract 2007C020<br />
Task - Luke Wash Watershed Zone AE Floodplain Delineation Study<br />
Structure Detail Worksheet<br />
Wood/Patel Project #073087<br />
Type <strong>of</strong> Structure: 72. " L ~ P Date: 1-tz-zao8<br />
File Name: LL/W WASH<br />
Description Name: x - r o 57~1. JL(os+. 30 Party Chief: JEFF MLIEA<br />
I General Condition <strong>of</strong> Structure hi)
FCDMC Contract 20076020<br />
Task - Luke Wash Watershed Zone AE Floodplain el in eat ion Study<br />
Structure Detail Worksheet<br />
Wood/Patel Project #073087<br />
Type <strong>of</strong> Structure: ~f 6 ' I ~4 Date: I-zt-zoo8<br />
File Name: lu Kc &PSI+<br />
Description Name: r- 10 sr~. SY 70 + 00 Party Chief: TEF~ LALL~CR<br />
Photo Taken ...................................<br />
. . . . . . . . . . . . . . . . . . . . . . . . . . .<br />
........... . . .<br />
, . . , , (UPSTREAM) .?2rtwdk.<br />
. .<br />
. % .<br />
. .<br />
, -<br />
. .<br />
s I .<br />
. . . . . . . ........... . . , . , . t . . . , ................ ....... : ..... ......<br />
.......<br />
, / . :<br />
. . . .<br />
. . ,<br />
t<br />
.<br />
j . I I . : . . , , .<br />
, * . > .<br />
. ,<br />
m . ' . .:. -. :. .. -: ... - 3 . ~ . ....... - 2 . : . ........................... .<br />
1 ........... ..: . ...... , ..... ..: ..... !<br />
I . , .<br />
. . .<br />
- .<br />
: I<br />
...................... , '<br />
, .<br />
- .<br />
.... . ,. . . - ,, .<br />
.<br />
:<br />
A<br />
.<br />
.<br />
,<br />
. . A . .<br />
. . , , , . , , ,<br />
. . , ..........<br />
, . .<br />
...-- :.. -..<br />
.<br />
r<br />
.<br />
,<br />
,<br />
.<br />
,<br />
.<br />
, ,<br />
. ,<br />
. / ........<br />
, !<br />
;<br />
.. ..: .. .... .... .....<br />
......... .... ...........<br />
... .:. -.. ..... .. ...<br />
, . . . ' ,<br />
I I , : .<br />
. .I .- _I____ . '<br />
: .<br />
" ; ' i : ;<br />
: , . I . ,<br />
, . I '<br />
: . . .,. ... : .... .; . i. .j .. ..: {&,?-0;l ; . !.. .<br />
... . . . . . . . . . . . . . . . . . ..--.: ....... L .... ! ..... :.. ,.! .... :<br />
, . .<br />
. , s . I . , . . , . .<br />
2 , . . ,<br />
, , . ,<br />
. . . , . , . . ,<br />
! . :<br />
. , .<br />
; i ; : , i<br />
, . . . . . , --... ,<br />
' I . . ...a......,.... , , . , . !...:..: ..... i , .. , .... , ...... , . .......,.... ! : . . , . . . ._ : ... !<br />
- -<br />
, , . 0 , . , , . ,<br />
,<br />
. s , , , :<br />
, , . . . . , , . > ' . . , . ,<br />
! , . .<br />
I . . . . . . . , . . , .<br />
. . , , :<br />
;. .' . ' ......... .. .:.. . ..... I . - - .'. ........ ..:. ..'.. ..: ........ 3 ..................... ..... , ..... . ........... ............ -<br />
3 , , ,<br />
, , , . ,... ; , .' . '. ..'<br />
I . . / , .<br />
* .<br />
. I . . , , , , .<br />
z / . . /<br />
. , , , . ,<br />
, , . , ,<br />
, . . . . .<br />
3 , ' !<br />
.<br />
, , . ; . . ,<br />
..................'......-...-~.................... i ..... : ... !.. ..:.. .!.. ...... : ........... '.... ...... 1 ............................<br />
. .<br />
. . a , . . . , . . > . . , . . . !<br />
. . . I . , . ,<br />
, . , . . . . , , . .<br />
. . . .<br />
I . . . . 8<br />
, I ,<br />
I . . s s , . . , . : !<br />
.......... : . . . :. ..................... . -:.. ......... .,.. ....... ................................................ *... ,..- ................<br />
. . , b . , , I . . . . . . . .<br />
, . .<br />
I / , . ( . . . .<br />
, . . . . . . . > . , 1<br />
I . : . . , , ,<br />
. . , . . . . _ . * . . . . . . _ . . . . ;.. ...... . . ............. . , . .........................................................<br />
. . , . ' ; : '<br />
, .<br />
,<br />
I , ?<br />
, % ' .<br />
s s . . t . , ,<br />
* . . /<br />
8 2 . . I<br />
....................<br />
. . .<br />
.....<br />
. . ) . , . ' . I ,<br />
. . . . ......................... .. ..... ............ . .<br />
I . . .<br />
. . /<br />
. . . .<br />
, . . . * : : ; : . , :<br />
. . .<br />
.... . . ............ .<br />
/ . , , . . , .......... . . . . . . . . . ...... .......,. : ..........................<br />
: : ; : i<br />
8- . , . -._.: L.. 2 . _.#<br />
. . 8 I s . . , . .<br />
3 , . . ,<br />
I . l l ' s I j . , > .<br />
. , I<br />
, / . . . , , . . , , -<br />
m<br />
,<br />
. . . . i<br />
.... .-- ......... : i. . ...: L. L i..<br />
.........<br />
* ,<br />
........<br />
General Condition <strong>of</strong> Structure Goo0<br />
.t 4 : ! .'. : .., .... _____:<br />
. ,<br />
...... .A. ............... ..- -. .-.. ..................... " ..,- * .! -,-+ ..- ,:. + ..+-
. ., . FCDMC Contract 2007C020 . .....<br />
Wash Watershed Zone AE Floodplain Delineation Study<br />
Structure Detail Worksheet<br />
WoodIPatel Project #073087<br />
Task - ~uke<br />
Type <strong>of</strong> Structure: &% CUNELT Date: ( -21 -2008<br />
File Name: E wfi~<br />
Description Name: T- 10 55oq +YO Party ChieE J~F. LAUE.Q<br />
General Condition <strong>of</strong> Structure &ZOO<br />
. . .<br />
, . a<br />
Photo Taken<br />
a , . ,<br />
& A , , , <<br />
1 ....... .... '.;-".." .... :....,..: .-"' .... '.'.. .... .<br />
< .. ,.-<br />
. , , .<br />
. , . . . , .<br />
, .<br />
. , ,<br />
/ a<br />
. , .<br />
, . , : . , , . ; , . . / . I . , , & . 4<br />
< 8<br />
. ..-,- . . * . . :... .--................... 3 ............. ..... .. . - b . - .......... :.. ..... r ........ J. ... a . , . .......... ;. .._.. j... .;... ; . . .; ..... # . . . . . ,<br />
/<br />
,.. -, !<br />
' U , . . . . , ,<br />
. , , 0 . , : : : . ; :<br />
, . . , , ' , , , , . , .<br />
i : , . ; .<br />
I I . , . i . l<br />
........................................ .L.... ...__._... ... i , . . . ,<br />
/ ... 1 .. .-. L ........................... I . 1 ........................ ; .<br />
, * :<br />
General condition <strong>of</strong> structure 6000 Ez-/b 1
APPENDIX TM3-10-3<br />
EXISTING DRAINAGE STRUCTURE DOCUMENTATION<br />
BUCKEYE FRS #1<br />
091337133, 2010-055, TT005 <strong>Maricopa</strong> <strong>County</strong> <strong>Department</strong> <strong>of</strong> Transportation<br />
Technical Memorandum 3 Yuma Parkway Corridor Feasibility Study<br />
<strong>Conceptual</strong> <strong>Drainage</strong> <strong>Report</strong> August 2011
Flood Control District<br />
<strong>of</strong> <strong>Maricopa</strong> <strong>County</strong><br />
Emergency Action Plan<br />
For the<br />
Buckeye Structures<br />
Rev. June 2007<br />
Prepared by: JE Fuller/ Hydrology & Geomorphology, Inc.<br />
Revised by: LTM Engineering, Inc. 6/30/2007<br />
Buckeye Structures EAP Rev. June 2007
Exhibit A-3 - Emergency Spillway & Dambreak Inundation Areas – FRS #1<br />
West (lower crest) End <strong>of</strong> FRS #1<br />
Yuma Parkway<br />
Study Area<br />
Buckeye Structures EAP 34 Rev. June 2007<br />
Appendix A – Inundation Exhibits
Exhibit A-4 - Emergency Spillway & Dambreak Inundation Areas – FRS #1<br />
Between West End and Johnson Road<br />
Yuma Parkway<br />
Study Area<br />
Buckeye Structures EAP 35 Rev. June 2007<br />
Appendix A – Inundation Exhibits
Exhibit A-5 - Emergency Spillway & Dambreak Inundation Areas – FRS #1<br />
Between Johnson Road and Sun Valley Parkway<br />
Yuma Parkway<br />
Study Area<br />
Buckeye Structures EAP 36 Rev. June 2007<br />
Appendix A – Inundation Exhibits
Exhibit A-6 - Emergency Spillway & Dambreak Inundation Areas – FRS #1<br />
East <strong>of</strong> Sun Valley Parkway<br />
Yuma Parkway<br />
Study Area<br />
Buckeye Structures EAP 37 Rev. June 2007<br />
Appendix A – Inundation Exhibits
Tables - Emergency Spillway & Dambreak Inundation Hydraulics – FRS #1<br />
LOCATION<br />
Emergency Spillway Discharges<br />
DEPTH<br />
(Feet)<br />
VELOCITY<br />
(Feet/Second)<br />
Full Emergency Spillway Discharge (50,700 cfs)<br />
TIME<br />
(Hours)<br />
Below FRS 6-10 10-15 -<br />
I-10 6-10 10-15 < 0.25<br />
2/3 Emergency Spillway Discharge (33,800 cfs)<br />
Below FRS 5-7 10-13 -<br />
I-10 5-7 10-13 < 0.25<br />
1/3 Emergency Spillway Discharge (16,900 cfs)<br />
Below FRS 4-6 6-10 -<br />
I-10 4-6 6-10 < 0.25<br />
LOCATION<br />
Dam Failure<br />
DEPTH<br />
(Feet)<br />
VELOCITY<br />
(Feet/Second)<br />
TIME<br />
(Hours)<br />
Below FRS 20-25 4-12 --<br />
I-10 10-15 4-12 < .25<br />
Lower Buckeye Road 4-5 4-9 .25-.5<br />
Broadway Road 3-4 4-7 .5-75<br />
Baseline Road 2-3 4-8 .75-1.5<br />
Gila River 2-3 2-5 1.5-2<br />
Buckeye Structures EAP 38 Rev. June 2007<br />
Appendix A – Inundation Exhibits
APPENDIX TM3-11-1<br />
EXISTING HYDROLOGY RESULTS<br />
EXCERPTS FROM PALO VERDE FDS<br />
091337133, 2010-055, TT005 <strong>Maricopa</strong> <strong>County</strong> <strong>Department</strong> <strong>of</strong> Transportation<br />
Technical Memorandum 3 Yuma Parkway Corridor Feasibility Study<br />
<strong>Conceptual</strong> <strong>Drainage</strong> <strong>Report</strong> August 2011
Without Levee Concentration Point Controlling Storm Duration<br />
7 <strong>of</strong> 9<br />
Concentration<br />
Point<br />
<strong>Drainage</strong> Area<br />
(sq mi)<br />
Peak Flow (cfs)<br />
Controlling Storm<br />
Duration<br />
C760GL 2.34 348 6-Hour<br />
C760H 3.33 402 24-Hour<br />
C760I 60.30 3312 24-Hour<br />
C760K 60.76 3312 24-Hour<br />
C760KL 0.46 362 6-Hour<br />
C760L 64.08 3358 24-Hour<br />
C760LL 61.17 3284 24-Hour<br />
C760M 64.45 3340 24-Hour<br />
C760O 64.91 3329 24-Hour<br />
C770C 1.93 1109 6-Hour<br />
C770D 67.01 3333 24-Hour<br />
C770DL 2.10 1045 6-Hour<br />
C770E 236.46 16800 24-Hour<br />
C770F 237.04 16767 24-Hour<br />
C770G 242.40 18147 24-Hour<br />
C780C 12.61 3951 24-Hour<br />
C780D 13.41 3661 24-Hour<br />
C790B 2.83 2145 24-Hour<br />
C790C 3.66 2218 24-Hour<br />
C790D 4.66 1913 24-Hour<br />
C790E 270.24 18236 24-Hour<br />
C790ER 262.21 18154 24-Hour<br />
C800A 1.32 1025 6-Hour<br />
C800D 2.00 913 6-Hour<br />
C800E 2.51 694 24-Hour<br />
C800H 3.20 1080 6-Hour<br />
C800HR 2.81 410 6-Hour<br />
C800I 3.47 1018 6-Hour<br />
C800J 4.64 1038 24-Hour<br />
C800L 6.12 917 24-Hour<br />
C800M 6.82 1693 24-Hour<br />
C800MR 5.33 798 24-Hour<br />
C800N 7.31 1758 24-Hour<br />
C800O 8.03 1632 24-Hour<br />
C800P 270.86 18217 24-Hour<br />
C800PL 270.71 18218 24-Hour<br />
C800R 271.53 18183 24-Hour<br />
C800U 2.31 1029 6-Hour<br />
C800V 274.49 18148 24-Hour
With Levee Concentration Point Controlling Storm Duration<br />
7 <strong>of</strong> 10<br />
Concentration<br />
Point<br />
<strong>Drainage</strong> Area<br />
(sq mi)<br />
Peak Flow (cfs)<br />
Controlling Storm<br />
Duration<br />
C740D 60.77 768 24-Hour<br />
C740E 61.04 734 24-Hour<br />
C750B 3.55 1050 24-Hour<br />
C750C 3.88 1516 24-Hour<br />
C750CL 3.71 1043 24-Hour<br />
C750D 2.07 687 6-Hour<br />
C750E 4.23 1516 6-Hour<br />
C750F 4.64 1599 24-Hour<br />
C750G 5.28 1570 24-Hour<br />
C750H 5.78 1642 24-Hour<br />
C750I 65.23 2009 24-Hour<br />
C750IL 6.10 1596 24-Hour<br />
C750J 65.60 1976 24-Hour<br />
C750L 0.64 376 6-Hour<br />
C750M 0.99 383 6-Hour<br />
C750N 66.85 2063 24-Hour<br />
C760B 0.97 570 6-Hour<br />
C760C 1.35 299 6-Hour<br />
C760E 0.54 464 6-Hour<br />
C760F 0.94 398 6-Hour<br />
C760G 2.73 551 6-Hour<br />
C760GL 2.34 348 6-Hour<br />
C760H 3.33 402 24-Hour<br />
C760I 70.47 2028 24-Hour<br />
C760K 70.93 2031 24-Hour<br />
C760KL 0.46 362 6-Hour<br />
C760L 74.26 2142 24-Hour<br />
C760LL 71.34 1976 24-Hour<br />
C760M 74.62 2096 24-Hour<br />
C760N 73.13 379 6-Hour<br />
C760O 90.79 424 24-Hour<br />
C770C 76.57 1674 24-Hour<br />
C770D 92.89 1715 24-Hour<br />
C770DL 76.74 1338 24-Hour<br />
C770E 237.24 7847 24-Hour<br />
C770F 237.82 7822 24-Hour<br />
C770G 243.18 8840 24-Hour<br />
C780C 12.61 3951 24-Hour<br />
C780D 13.41 3661 24-Hour
Sub Basin Controlling Condition Summary<br />
8 <strong>of</strong> 11<br />
Sub Basin Area (sq mi) Peak Flow (cfs)<br />
Controlling Storm<br />
Duration<br />
S770E 0.70 694 6-Hour<br />
S770F 0.57 444 6-Hour<br />
S770G 1.00 705 6-Hour<br />
S780A 7.58 4251 24-Hour<br />
S780B 3.72 3085 24-Hour<br />
S780C 1.31 850 6-Hour<br />
S780D 0.80 927 6-Hour<br />
S780E 0.86 947 6-Hour<br />
S790A 1.33 1354 6-Hour<br />
S790B 1.50 1193 6-Hour<br />
S790C 0.83 896 6-Hour<br />
S790D 1.00 1181 6-Hour<br />
S790E 0.88 899 6-Hour<br />
S800A 1.01 800 6-Hour<br />
S800B 0.31 360 6-Hour<br />
S800D 0.69 1021 6-Hour<br />
S800E 0.51 951 6-Hour<br />
S800F 0.29 391 6-Hour<br />
S800G 0.23 406 6-Hour<br />
S800H 0.16 246 6-Hour<br />
S800I 0.27 335 6-Hour<br />
S800J 1.17 964 6-Hour<br />
S800K 1.26 909 6-Hour<br />
S800L 0.22 303 6-Hour<br />
S800M 0.70 694 6-Hour<br />
S800N 0.49 529 6-Hour<br />
S800O 0.72 815 6-Hour<br />
S800P 0.47 630 6-Hour<br />
S800Q 0.15 310 6-Hour<br />
S800R 0.67 895 6-Hour<br />
S800S 1.85 1011 6-Hour<br />
S800T 0.15 344 6-Hour<br />
S800U 0.32 496 6-Hour<br />
S800V 0.64 886 6-Hour<br />
S800W 0.23 426 6-Hour<br />
S800X 0.23 506 6-Hour<br />
S810A 0.26 472 6-Hour<br />
S820A 0.38 466 6-Hour<br />
S820B 0.94 655 6-Hour<br />
S820C 0.24 317 6-Hour
With Levee Concentration Point Controlling Storm Duration<br />
9 <strong>of</strong> 10<br />
Concentration<br />
Point<br />
<strong>Drainage</strong> Area<br />
(sq mi)<br />
Peak Flow (cfs)<br />
Controlling Storm<br />
Duration<br />
C900I 5.76 843 24-Hour<br />
C900IR 4.87 772 24-Hour<br />
C910B 0.38 391 6-Hour<br />
C910D 0.51 340 6-Hour<br />
C910E 6.10 822 24-Hour<br />
C910F 6.56 830 24-Hour<br />
C910G 6.95 821 24-Hour<br />
C910GL 6.75 821 24-Hour<br />
C910J 8.46 848 24-Hour<br />
C910K 9.85 1093 24-Hour<br />
C910KR 8.81 840 24-Hour<br />
C910L 1.42 643 6-Hour<br />
C910N 10.14 990 24-Hour<br />
C910O 10.63 982 24-Hour<br />
C920B 0.93 701 6-Hour<br />
C920BR 0.67 514 6-Hour<br />
C920D 11.90 1274 24-Hour<br />
C920E 12.27 1273 24-Hour<br />
C920F 12.75 1224 24-Hour<br />
C920H 13.97 1203 24-Hour<br />
C920J 14.16 1196 24-Hour<br />
C920L 0.41 374 6-Hour<br />
C920M 14.73 1221 24-Hour<br />
C920N 15.29 1211 24-Hour<br />
C920R 16.35 1213 24-Hour<br />
C920S 17.32 1190 24-Hour<br />
C920U 17.94 1175 24-Hour<br />
C920W 0.54 211 6-Hour<br />
C930B 0.35 331 6-Hour<br />
C930D 1.61 718 6-Hour<br />
C930DL 1.26 653 6-Hour<br />
C930E 1.85 618 6-Hour<br />
C930H 2.64 906 24-Hour<br />
C930I 21.04 1632 24-Hour<br />
C930J 22.36 1372 24-Hour<br />
C940B 0.55 477 6-Hour<br />
C940C 1.45 1183 6-Hour<br />
C940F 1.59 1167 6-Hour<br />
C940H 0.83 690 6-Hour
APPENDIX TM3-11-2<br />
EXISTING HYDROLOGY RESULTS<br />
EXCERPTS FROM LUKE WASH FDS<br />
091337133, 2010-055, TT005 <strong>Maricopa</strong> <strong>County</strong> <strong>Department</strong> <strong>of</strong> Transportation<br />
Technical Memorandum 3 Yuma Parkway Corridor Feasibility Study<br />
<strong>Conceptual</strong> <strong>Drainage</strong> <strong>Report</strong> August 2011
0<br />
Evaluation <strong>of</strong>Manninn's n-Value on Peak Flows<br />
The selection <strong>of</strong> Manning's "n" values impacts both hydrologic and hydraulic modeling<br />
results. In order to evaluate the impact <strong>of</strong> Manning's n-value on the peak flows, a<br />
sensitivity analysis was conducted by reducing the n-values from 0.005 to 0.01 for the<br />
channel routing operations in the HEC-1 model for both shallow-and-wide and well-<br />
defined wash cases. The modeling results were listed in Appendix D6 which shows that<br />
the n-value reduction has more significant impact on the peak flows for shallow-and-wide<br />
washes than well-defined washes.<br />
4.5 Final Results<br />
4.5.1 Hydrologic Analysis Results<br />
Eight HEC-1 hydrologic models were developed for four (4) scenarios (without<br />
dike, with both dikes, with 1-10 only, and with UPRR only); and two (2) storm<br />
durations (100-year, 24-hour, and 100-year, 6-hour). Peak flows from all <strong>of</strong> the 8<br />
models are summarized in Table 4.3 on the following pages. The maximum flow<br />
at each <strong>of</strong> the concentration points and the representative model that produces the<br />
maximum flow is identified. Note that if the maximum flow is generated by<br />
more than one model the selection order is as follows: 24-hour model first, then<br />
without dike model, and finally, with both dikes. The maximum peak flows for<br />
the 100-year storm are also shown in Exhibit A6. The output files for all <strong>of</strong> the<br />
HEC-1 models are presented in the Appendix D7.<br />
The HEC-1 model names are summarized below:<br />
Condition<br />
No Dike<br />
With Dike (1-10 & UPRR)<br />
With 1-10 Dike<br />
With UPRR Dike<br />
The electronic files for the HEC-1 models are provided on the CD in Exhibit A7<br />
(inside front cover).<br />
100-year, 24-hour<br />
EC24NODK.DAT<br />
EC24DIKE.DAT<br />
EC24IlO.DAT<br />
EC24UPRR.DAT<br />
100-year, 6-hour<br />
EC06NODK.DAT<br />
EC06DIKE.DAT<br />
EC06110.DAT<br />
EC06UPRR.DAT<br />
WOODIPATEL 17 Hydrologic Study <strong>Report</strong> for<br />
Luke Wash Watershed FDS<br />
Contract No. FCD 2007C020
Table 4.3 Peak Flow Summary Table<br />
WOODIPATEL 18 Hydrologic Study <strong>Report</strong> for<br />
Luke Wash Watershed FDS<br />
Contract No. FCD 2007C020<br />
--
I<br />
Table 4.3 Peak Flow Summary Table (continued)<br />
Hydrologic Modeling Peak Flow Summary<br />
Model => EC24DIICE ~ECOCDIKE 1~~24110 I~c06110 I E C ~ ~ U P R R ~ECOCUPRR ~ECZ~NODK ~ECOCNODK lMaximum Maximum<br />
Hydrograph (cfs) 1 (cfs) I (cfs) I (cfs) I (cfs) I (cfs) I (cfs) 1 (cfs) I Flow Flow<br />
Name (Cfs) Model<br />
44b 268 359 268 359 268 359 268 359 359 ECOGNODK<br />
C44b 614 723 614 723 614 723 614 728 728 ECOGNODK<br />
44a 452 568 452 568 452 568 452 5 68 568 ECOGNODK<br />
C44a 615 67 8 615 678 615 678 615 684 684 ECOGNODK<br />
WOODIPATEL 20 Hydrologic Study <strong>Report</strong> for<br />
Luke Wash wafers)& FDS<br />
Contract No. FCD 2007C020<br />
--
Table 4.3 Peak Flow Summary Table (continued)<br />
I Hydrologic Modeling Peak Flow Summary I<br />
WOODIPATEL 22 Hydrologic Study <strong>Report</strong> for<br />
Luke Wash Watershed FDS<br />
Contract No. FCD 2007C020
APPENDIX TM3-11-3<br />
EXISTING HYDROLOGY RESULTS<br />
EXCERPTS FROM BUCKEYE ADMP<br />
091337133, 2010-055, TT005 <strong>Maricopa</strong> <strong>County</strong> <strong>Department</strong> <strong>of</strong> Transportation<br />
Technical Memorandum 3 Yuma Parkway Corridor Feasibility Study<br />
<strong>Conceptual</strong> <strong>Drainage</strong> <strong>Report</strong> August 2011
BUCKEYE ADMP EXISTING CONDITIONS HYDROLOGY UPDATE - PARAMETERS SUMMARY TABLE<br />
100 Year, 6 Hour Storm<br />
SUB<br />
BASIN % INCREASE UNIT<br />
ADMP AREA SLOPE Length LCA IA DTHETA PSIF XKSAT RTIMP Tp S-GRAPH TYPE Kn Lag DISCHARGE DISCHARGE DISCHARGE<br />
ADMS (sq mi) (ft/mi) (ft) (ft) (in) (in) (in/hr) (%) (hrs) (min) (cfs) (cfs/sq mi)<br />
83 0.675 64.7 1.72 0.93 0.25 0.250 5.4 0.270 30.00 4.5 Phoenix Valley 0.05 39 1010 1496<br />
29%<br />
83 0.675 64.69 1.72 0.93 0.341 0.375 5.44 0.214 2.8 4.75 Desert Rangeland 0.05 39 781 1157<br />
MODEL FRW 100-yr, 6-hr<br />
SUB<br />
BASIN % INCREASE UNIT<br />
ADMP AREA SLOPE Length LCA IA DTHETA PSIF XKSAT RTIMP Tp S-GRAPH TYPE Kn Lag DISCHARGE DISCHARGE DISCHARGE<br />
ADMS (sq mi) (ft/mi) (ft) (ft) (in) (in) (in/hr) (%) (hrs) (min) (cfs) (cfs/sq mi)<br />
1 1.626 34.9 2.61 1.54 0.54 0.320 4.3 0.400 1.00 5.25 Desert Rangeland 0.079 98.3 576 354<br />
-43%<br />
1 1.626 34.86 2.61 1.54 0.347 0.329 4.33 0.398 5.88 5 Desert Rangeland 0.05 62 1004 617<br />
2 1.233 45.9 2.02 0.86 0.36 0.330 3.95 0.440 9.00 4.25 Desert Rangeland 0.035 30 1381 1120<br />
32%<br />
2 1.233 45.95 2.02 0.86 0.338 0.339 3.99 0.443 5.58 4.75 Desert Rangeland 0.05 43 1048 850<br />
3 1.648 39.2 2.04 1.39 0.32 0.320 4 0.490 13.00 4.5 Desert Rangeland 0.033 35.2 1474 894<br />
106%<br />
3 1.648 39.22 2.04 1.39 1 0.298 4.03 0.546 4.13 5 Desert Rangeland 0.05 53 715 434<br />
4 0.549 40.7 1.38 0.74 0.32 0.320 3.95 0.400 14.00 4.25 Desert Rangeland 0.032 23 956 1741<br />
56%<br />
4 0.549 40.65 1.38 0.74 0.306 0.332 4.02 0.485 14.55 4.75 Desert Rangeland 0.05 36 614 1118<br />
5A 1.172 49 1.75 1.16 0.32 0.310 4.3 0.440 19.00 4.25 Desert Rangeland 0.038 34.2 1230 1049<br />
22%<br />
5A 1.172 49.05 1.75 1.16 0.333 0.342 4.33 0.387 5.98 4.75 Desert Rangeland 0.05 45 1008 860<br />
5B 0.576 38.7 1.73 1.08 0.36 0.350 4.5 0.320 1.00 4.25 Desert Rangeland 0.028 25.5 913 1585<br />
52%<br />
5B 0.576 38.66 1.73 1.08 0.318 0.336 4.61 0.319 10.55 4.75 Desert Rangeland 0.05 46 602 1045<br />
15A 0.588 34.6 1.45 0.48 0.37 0.330 4.4 0.390 4.00 4.25 Desert Rangeland 0.036 23 943 1604<br />
33%<br />
15A 0.588 34.58 1.45 0.48 0.358 0.324 4.42 0.391 2.37 4.5 Desert Rangeland 0.05 32 711 1209<br />
15B 0.816 11 1.63 0.82 1 0.250 4.1 0.540 0.00 6.75 Agriculture 0.2 203.9 114 140<br />
0%<br />
15B 0.816 11.02 1.63 0.82 1 0.249 4.1 0.541 0.37 7 Agriculture 0.2 204 114 140<br />
16 0.951 25 2.00 1.37 0.28 0.250 4.35 0.440 47.00 4.75 Phoenix Valley 0.048 55 1075 1130<br />
2%<br />
16 0.951 24.99 2.00 1.37 0.208 0.25 4.4 0.438 45.68 5 Phoenix Valley 0.05 57 1049 1103<br />
17 0.607 16.9 1.43 0.71 0.25 0.250 4 0.550 30.00 4.5 Phoenix Valley 0.05 42.3 781 1287<br />
562%<br />
17 0.607 16.84 1.43 0.71 1 0.25 4.02 0.465 0.17 6.5 Agriculture 0.02 169 118 194<br />
18 0.796 31 1.81 0.75 0.25 0.250 4.15 0.520 30.00 4.5 Phoenix Valley 0.05 42.1 987 1240<br />
626%<br />
18 0.796 30.99 1.81 0.75 1 0.291 4.13 0.479 0.12 6.5 Agriculture 0.02 168 136 171<br />
Page 5 <strong>of</strong> 10
BUCKEYE ADMP EXISTING CONDITIONS HYDROLOGY UPDATE - PARAMETERS SUMMARY TABLE<br />
100 Year, 6 Hour Storm<br />
SUB<br />
BASIN % INCREASE UNIT<br />
ADMP AREA SLOPE Length LCA IA DTHETA PSIF XKSAT RTIMP Tp S-GRAPH TYPE Kn Lag DISCHARGE DISCHARGE DISCHARGE<br />
ADMS (sq mi) (ft/mi) (ft) (ft) (in) (in) (in/hr) (%) (hrs) (min) (cfs) (cfs/sq mi)<br />
68 0.413 45.6 0.96 0.33 0.52 0.290 4.35 0.370 4.00 4.5 Desert Rangeland 0.084 37.8 458 1109<br />
-34%<br />
68 0.413 45.58 0.96 0.33 0.374 0.334 4.37 0.374 0 4.5 Desert Rangeland 0.05 22 694 1680<br />
MODEL AREA 2 100-yr, 6-hr<br />
SUB<br />
BASIN % INCREASE UNIT<br />
ADMP AREA SLOPE Length LCA IA DTHETA PSIF XKSAT RTIMP Tp S-GRAPH TYPE Kn Lag DISCHARGE DISCHARGE DISCHARGE<br />
ADMS (sq mi) (%) (ft) (ft) (in) (in) (in/hr) (%) (hrs) (min) (cfs) (cfs/sq mi)<br />
A1 1.628 33 2.96 1.73 0.35 0.350 4.45 0.340 0.00 4.33 Desert Rangeland 0.025 34.5 1587 975<br />
71%<br />
A1 1.630 32.98 2.96 1.73 0.343 0.347 4.498 0.339 2.145 5 Desert Rangeland 0.05 69 929 570<br />
B1 0.300 57.2 1.34 0.66 0.35 0.350 4.6 0.320 0.00 4.08 Desert Rangeland 0.025 15.9 668 2227<br />
58%<br />
B1 0.300 57.24 1.34 0.66 0.35 0.35 4.624 0.315 0 4.42 Desert Rangeland 0.05 31 422 1407<br />
C1 0.947 41.6 2.65 1.06 0.35 0.350 4.65 0.310 0.00 4.25 Desert Rangeland 0.025 26.3 1301 1374<br />
72%<br />
C1 0.950 41.6 2.65 1.06 0.35 0.35 4.669 0.311 0 4.67 Desert Rangeland 0.05 52 758 798<br />
D1 0.687 41.1 2.05 0.98 0.35 0.350 4.65 0.320 0.00 4.25 Desert Rangeland 0.026 24.1 1072 1560<br />
66%<br />
D1 0.690 41.1 2.05 0.98 0.35 0.35 4.642 0.317 0 4.58 Desert Rangeland 0.05 46 646 936<br />
E1 1.466 27.9 3.19 1.81 0.35 0.350 4.35 0.360 0.00 4.42 Desert Rangeland 0.025 37.2 1375 938<br />
78%<br />
E1 1.470 27.95 3.19 1.81 0.343 0.347 4.362 0.364 2.082 5.08 Desert Rangeland 0.05 75 772 525<br />
E2-a2 1.223 27.5 2.97 1.67 0.41 0.340 4.4 0.350 1.00 4.75 Desert Rangeland 0.043 60.6 792 648<br />
11%<br />
E2-a2 1.220 27.48 2.97 1.67 0.348 0.343 4.461 0.354 2.288 5 Desert Rangeland 0.05 70 713 584<br />
E3-a2 0.943 25.9 2.72 0.99 0.78 0.270 4.25 0.440 1.00 6.33 Desert Rangeland 0.145 163.9 650 689<br />
-41%<br />
E3-a2 0.940 25.93 2.72 0.99 0.402 0.306 4.245 0.444 1.589 4.75 Desert Rangeland 0.05 56 1095 1165<br />
E4 0.740 29 2.00 1.24 0.56 0.300 4.15 0.420 1.00 5.25 Desert Rangeland 0.089 95.5 310 419<br />
-45%<br />
E4 0.740 28.98 2.00 1.24 0.389 0.324 4.185 0.421 0 4.75 Desert Rangeland 0.05 53 559 755<br />
Page 10 <strong>of</strong> 10