Scup, Stenotomus chrysops, Life History and Habitat Characteristics
Scup, Stenotomus chrysops, Life History and Habitat Characteristics
Scup, Stenotomus chrysops, Life History and Habitat Characteristics

You also want an ePaper? Increase the reach of your titles
YUMPU automatically turns print PDFs into web optimized ePapers that Google loves.
50<br />
40<br />
30<br />
20<br />
10<br />
0<br />
1 3 5 7 9 11 13 15 17 19 21 23<br />
0<br />
1 3 5 7 9 11 13 15 17 19 21 23<br />
Bottom Temperature (C) Bottom Temperature (C)<br />
25<br />
20<br />
15<br />
10<br />
5<br />
0<br />
1 3 5 7 9 11 13 15 17 19 21 23<br />
Bottom Temperature (C)<br />
50<br />
40<br />
30<br />
20<br />
10<br />
0<br />
40<br />
30<br />
20<br />
10<br />
0<br />
<strong>Scup</strong><br />
Mass. Inshore Trawl Surveys<br />
Juveniles Adults<br />
Catches<br />
30<br />
Spring Spring<br />
20<br />
10<br />
Autumn<br />
20<br />
16<br />
Autumn<br />
12<br />
0<br />
1 3 5 7 9 11 13 15 17 19 21 23<br />
Bottom Temperature (C)<br />
40<br />
Spring Spring<br />
30<br />
20<br />
10<br />
Bottom Depth (m) Bottom Depth (m)<br />
Bottom Depth (m)<br />
Autumn<br />
40<br />
30<br />
20<br />
10<br />
Page 23<br />
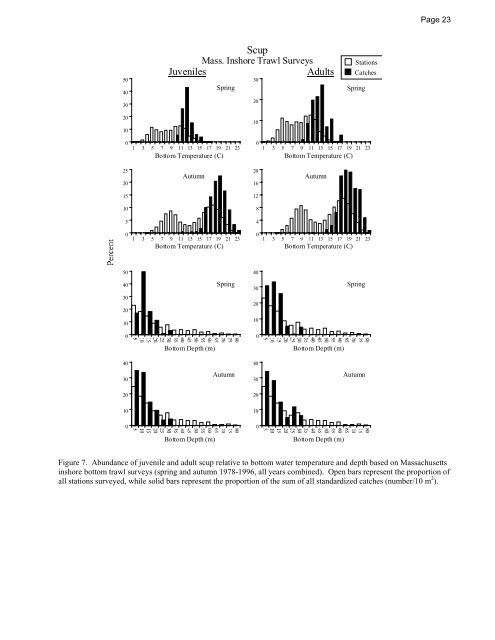
Figure 7. Abundance of juvenile <strong>and</strong> adult scup relative to bottom water temperature <strong>and</strong> depth based on Massachusetts<br />
inshore bottom trawl surveys (spring <strong>and</strong> autumn 1978-1996, all years combined). Open bars represent the proportion of<br />
all stations surveyed, while solid bars represent the proportion of the sum of all st<strong>and</strong>ardized catches (number/10 m 2 ).<br />
8<br />
4<br />
0<br />
0<br />
Bottom Depth (m)<br />
Autumn<br />
Stations