


You also want an ePaper? Increase the reach of your titles
YUMPU automatically turns print PDFs into web optimized ePapers that Google loves.
(Figure 19). However, there is overlap in the range of data values for gas flares and<br />
background. To isolate the locations of the flares a high pass filter was applied (Figure<br />
20). A threshold of five was applied to the high pass filtered image (Figure 21), which<br />
eliminated the background, preserving the centers of the detected flare locations. A<br />
dilation was applied to generate a mask which was used to extract theT4mT11 image<br />
values from the original T4mT11 image (Figure 22). We then compared the sum of<br />
T4mT11 with the <strong>report</strong>ed BCM for year 2004 reference flares in the Nigeria region<br />
(Figure 23). In reviewing the <strong>report</strong>ed BCM for reference flares not detected with the<br />
T4mT11 product we found that detections were rare for flares with less than 0.05 BCM<br />
per year and that flares with over 0.05 BCM were consistently detected. Based on this<br />
we place the BCM detection limit for the T4mT11 product at 0.05 BCM. A comparison<br />
of the sum of T4mT11 values versus DMSP satellite F15 sum of lights values for<br />
reference flares in the Nigeria region (Figure 24) indicates that outside of the lack of<br />
detection found for MODIS in gas flares under 0.05 BCM, the two sensors yield<br />
comparable values.<br />
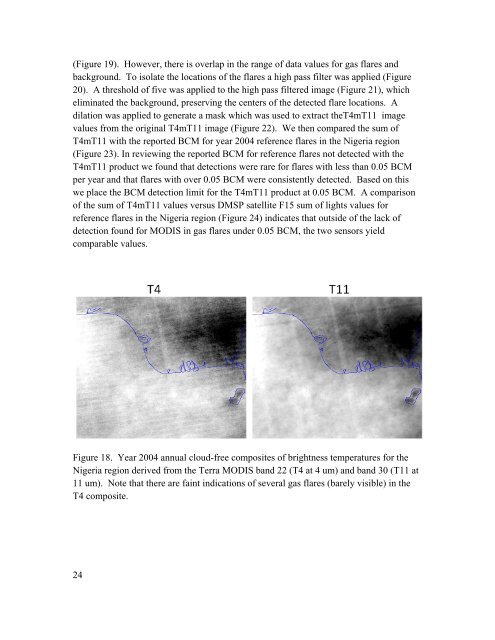
Figure 18. Year 2004 <strong>annual</strong> cloud-free composites of brightness temperatures for the<br />
Nigeria region derived from the Terra MODIS band 22 (T4 at 4 um) and band 30 (T11 at<br />
11 um). Note that there are faint indications of several gas flares (barely visible) in the<br />
T4 composite.<br />
24