Simulation of anaerobic digestion of cattle manure - Agronomy ...
Simulation of anaerobic digestion of cattle manure - Agronomy ...
Simulation of anaerobic digestion of cattle manure - Agronomy ...

You also want an ePaper? Increase the reach of your titles
YUMPU automatically turns print PDFs into web optimized ePapers that Google loves.
<strong>Agronomy</strong> Research Biosystem Engineering Special Issue 1, 167-174, 2012<br />
<strong>Simulation</strong> <strong>of</strong> <strong>anaerobic</strong> <strong>digestion</strong> <strong>of</strong> <strong>cattle</strong> <strong>manure</strong><br />
A. Normak 1 ; J. Suurpere 1 ; K. Orupõld 1 ; E. Jõgi 2 and E. Kokin 2<br />
1<br />
Institute <strong>of</strong> Agricultural and Environmental Sciences, Estonian University <strong>of</strong> Life<br />
Sciences, Kreutzwaldi 5, EE51014 Tartu, Estonia; e–mail: argo.normak@emu.ee<br />
2<br />
Institute <strong>of</strong> Technology, Estonian University <strong>of</strong> Life Sciences, Kreutzwaldi 56,<br />
EE51014 Tartu, Estonia<br />
Abstract. IWA Anaerobic Digestion Model No.1 (ADM1) was used to simulate the <strong>anaerobic</strong><br />
<strong>digestion</strong> process <strong>of</strong> <strong>cattle</strong> slurry. The model was applied to 200 l single stage completely stirred<br />
tank reactor. The simulation results <strong>of</strong> pH, biogas flow rate, acetate and methane concentration<br />
were under study. Ammonia inhibition constant was optimized during this study to improve<br />
modelling results compared to measurements <strong>of</strong> acetate concentration. Maximum methane yield<br />
during experiment was 291 l (kg VSadded) -1 at organic loading rate 2.0 kg VS (m 3 d) -1 .<br />
Keywords: <strong>anaerobic</strong> <strong>digestion</strong>, <strong>cattle</strong> slurry, modelling.<br />
Introduction<br />
New technologies are available for <strong>manure</strong> management with new business<br />
opportunities, where energy and nutrients are extra income to farmers. Agricultural<br />
companies are interested to implement new technologies for better <strong>manure</strong><br />
management, especially in large farms. In Estonia the total number <strong>of</strong> dairy and nondairy<br />
<strong>cattle</strong> was 96,000 and 145,000 and share <strong>of</strong> large farms (more than 300 animals)<br />
was about 53 and 67% respectively in 2010 (Statistics <strong>of</strong> Estonia). There are no exact<br />
figures, but it is assumed that 50% <strong>of</strong> dairy <strong>cattle</strong> have slurry type <strong>manure</strong> management<br />
and this number is increasing every year. Annually about 0.5 million tons <strong>of</strong> <strong>cattle</strong><br />
slurry and 1.2 million tons <strong>of</strong> <strong>cattle</strong> dung (non-dairy <strong>cattle</strong> and 50% <strong>of</strong> dairy <strong>cattle</strong>) in<br />
large farms are produced. Anaerobic <strong>digestion</strong> <strong>of</strong> <strong>manure</strong> is common technology in<br />
many countries, where biogas is produced and converted to electrical and thermal<br />
energy or upgraded to vehicle fuel. Several samples <strong>of</strong> <strong>cattle</strong> slurry from Estonia was<br />
analysed by Luna del Risco et al. (2011), biochemical methane potential (BMP) was<br />
238 l (kg VSadded) -1 . Annual methane potential <strong>of</strong> <strong>cattle</strong> slurry alone in large farms is<br />
around 7.3 million m 3 , by rough calculation the renewable energy potential is 100 TJ <strong>of</strong><br />
electricity and 130 TJ <strong>of</strong> thermal energy. However, today there is no biogas plant in<br />
Estonia treating cattly slurry, only one biogas plant processes pig slurry from eight<br />
farms in Saare County. In 2010 it produced 0.85 million m 3 <strong>of</strong> biogas and generated<br />
5.2 TJ <strong>of</strong> electricity and 7.8 TJ <strong>of</strong> thermal energy (Overview <strong>of</strong> Estonian bioenergy<br />
market). For the whole country the theoretical annual electricity generation from<br />
animal <strong>manure</strong>s could be 684 TJ and thermal energy 706 TJ (Kask et al., 2008). So,<br />
only 1% <strong>of</strong> this potential was utilized in 2010.<br />
Anaerobic <strong>digestion</strong> is complex biochemical process where biogas is produced by<br />
degradation <strong>of</strong> organic matter in an oxygen-free environment. The process is natural<br />
167
ut in industrial plants it is difficult to manage because <strong>of</strong> limitations <strong>of</strong> monitoring and<br />
control applications and lack <strong>of</strong> knowledge (Steyer et al., 2006). Control systems with<br />
real time measurements and process models, such as Anaerobic Digestion Model No.1<br />
(ADM1) should be used to achieve optimized biogas production (Ward et al., 2008).<br />
ADM1 was developed by the International Water Association (IWA) task group to<br />
support development <strong>of</strong> <strong>anaerobic</strong> technology, that is sustainable way for waste<br />
treatment and energy generation (Batstone et al., 2002b). ADM1 is implemented in<br />
several modelling packages, the most used are Aqusim 2.1 and Matlab (Batstone et al.,<br />
2006).<br />
Modelling <strong>of</strong> agricultural biogas production processes with ADM1 is not<br />
numerous and according to our knowledge the <strong>cattle</strong> slurry as substrate has been used<br />
only by Lübken et al. (2007).<br />
To utilize the renewable energy potential <strong>of</strong> <strong>cattle</strong> slurry in Estonia the<br />
development <strong>of</strong> modern <strong>anaerobic</strong> <strong>digestion</strong> control systems with modelling<br />
capabilities is necessary. The aim <strong>of</strong> the study was to define the usability <strong>of</strong> ADM1 in<br />
local conditions and specify the set <strong>of</strong> model parameters for simulation <strong>of</strong> <strong>anaerobic</strong><br />
<strong>digestion</strong> <strong>of</strong> <strong>cattle</strong> slurry.<br />
168<br />
Materials and methods<br />
Experimental set–up<br />
Experiment was carried out during 42 days in biogas pilot’s lab <strong>of</strong> Estonian<br />
University <strong>of</strong> Life Sciences. Cattle slurry from local farm was used as substrate. It was<br />
transported in 25 l canisters to laboratory and kept in pre-storage tank (600 l) at 10°C<br />
temperature to avoid active degradation processes before loading into <strong>anaerobic</strong><br />
reactor.<br />
Continuous stirred tank reactor (CSTR) (stainless steel, 200 l, 500 mm in<br />
diameter) was used, equipped with mechanical mixer, feeding pump and monitoring<br />
and control systems, including programmable logic controller (PLC) and SCADA<br />
system. Mixing was applied for 20 sec within every 2 minutes (30 rpm) to get stable<br />
biogas flow from the reactor. Temperature <strong>of</strong> the reactor was set to 38 �C. Loading <strong>of</strong><br />
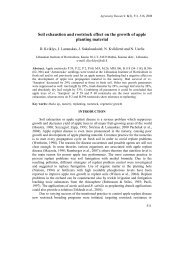
substrate was done once an hour. General experiment scheme is given on Fig. 1.<br />
Essential process parameters (gas flow, methane content in gas, digestate outflow,<br />
temperature, pH, etc) were measured online.<br />
P<br />
M<br />
Biogas<br />
Pre-storage Tank Anaerobic Reactor Outflow Scale<br />
Fig. 1. Pilot reactor set-up. Main equipment: pre-storage tank, <strong>anaerobic</strong> reactor<br />
dosing pump (P), mixer (M), and outflow scale for digestate canister.
Biogas production was measured by drum-type gas meter RITTER TG5 (1–<br />
60 l h -1 , accuracy ± 0.5% <strong>of</strong> reading) and methane content by infrared sensor Bluesens<br />
BCT–50–100 (0–100 Vol. %, accuracy ± 3% <strong>of</strong> reading). pH in the reactor was<br />
measured online by Honeywell Durafet–III sensor. Temperature in reactor was<br />
measured by RTD sensors PT–100 at two different points, temperature control was<br />
applied by average <strong>of</strong> two measurements. Gas production was calculated for standard<br />
conditions 273.15 K, 101.325 kPa.<br />
Chemical analyses<br />
Substrate and digestate (at the end <strong>of</strong> experiment) were analysed for pH, total<br />
solids (TS), volatile solids (VS), total nitrogen (TN), neutral detergent fibre (NDF),<br />
acid detergent fibre (ADF), lignin, calcium (Ca), phosphorus (P), magnesium (Mg) and<br />
potassium (K), see Table 1.<br />
Table 1. Chemical composition <strong>of</strong> substrate and digestate<br />
Parameter Unit Cattle slurry Digestate<br />
TS % 6.4 4.70<br />
VS %TS 80.60 69.9<br />
pH 7.06 7.88<br />
NH4–N mg l -1<br />
2,495.2 2,690.7<br />
TKN % 0.427 0.401<br />
RL %TS 3.29 1.14<br />
NDF %TS 41.93 36.87<br />
ADF %TS 28.98 32.06<br />
ADL %TS 15.04 19.67<br />
Hemicellulose %TS 12.94 ND<br />
Cellulose %TS 14.27 12.40<br />
P % 0.080 0.080<br />
K % 0.230 0.247<br />
Ca % 0.136 0.146<br />
Mg % 0.065 0.063<br />
Acetic acid mg l -1 5,218 172<br />
Propionic acid mg l -1 1,576 ND<br />
Isobutyric acid mg l -1 169 ND<br />
Butyric acid mg l -1 620 ND<br />
Isovaleric acid mg l -1 208 ND<br />
Valeric acid mg l -1 141 ND<br />
ND – not detected<br />
Total solids (TS) and volatile solids (VS) were analyzed according to method<br />
1684 (U.S. Environmental Protection Agency). TS were determined after drying the<br />
sample at 105°C and VS after ignition at 550°C (total solids minus the ash content). pH<br />
<strong>of</strong> liquid samples was measured by a Sartorius pH–meter. TN was determined by<br />
copper catalyst Kjeldahl method using a Kjekltec Auto 1030. NDF and ADF were<br />
determined using a Foss Tecator Fibertec 1020. Cellulose, hemicellulose and lignin<br />
content in samples were calculated as proposed by Van Soest et al. (1991). Calcium<br />
169
(o–Cresolphthaleincomplexone method; Connerty & Briggs, 1966), phosphorus<br />
(Stannous chloride method, ISO/FDIS 15681 method, ISO 3696), and magnesium<br />
(Titan Yellow method; Heaton, 1960) were determined using a Fiastar 5000.<br />
Samples for VFA determination were collected daily and determined after<br />
centrifugation at 11,000 rpm for 20 min. Then filtered and acidified with 17% H3PO4<br />
(150 μl to one ml <strong>of</strong> sample) and centrifuged again. Analyses were performed using<br />
GC 2014 ATF/SPL (Shimadzu), Zebron ZB–WAXplus capillary column (35 m, ID:<br />
0.25 mm, film thickness: 0.25 μm) and flame ionization (FID) detector. Helium was<br />
used as carrier gas, with injection temperature 250°C, gas flow 1.69 ml min -1 , detector<br />
temperature 350°C. The temperature program used was 100°C for 3 min, to 200°C at<br />
rate <strong>of</strong> 7°C min -1 , to 260°C at 80°C min -1 .<br />
Mathematical model<br />
Matlab application <strong>of</strong> ADM1 adapted by Rosen & Jeppson (2006) was used.<br />
Calculations were made using Matlab and Simulink s<strong>of</strong>tware. Most <strong>of</strong> the used<br />
parameters for ADM1 were default values (Batstone et al., 2002a), input parameters<br />
describing substrate are presented in Table 2.<br />
Table 2. ADM1 model input parameters describing substrate<br />
170<br />
Parameter Description Unit Value<br />
Sva total valerate (including isovalerate) g l -1 COD 0.548 a<br />
Sbu total butyrate (including isobutyrate) g l -1 COD 1,148 a<br />
Spro total propionate g l -1 COD 2,045 a<br />
Sac total acetate g l -1 COD 5,566 a<br />
Xxc dead bacteria g l -1 COD 0.50 b<br />
Xch insoluble hydrocarbons g l -1 COD 13.94 a<br />
Xpr insoluble proteins g l -1 COD 18.11 a<br />
Xli insoluble lipids g l -1 COD 7.49 a<br />
Sin total ammonia nitrogen mol l -1<br />
0.18 a<br />
Xsu bacteria consuming sugars g l -1 COD 0.60 c<br />
Xaa bacteria consuming aminoacids g l -1 COD 0.60 c<br />
Xfa bacteria consuming fatty acids g l -1 COD 0.60 c<br />
Xc4 bacteria consuming valerate and butyrate g l -1 COD 0.60 c<br />
Xpro bacteria consuming propionate g l -1 COD 0.60 c<br />
Xac bacteria consuming acetate g l -1 COD 0.018 d<br />
Xh2 bacteria consuming hydrogen g l -1 COD 0.018 d<br />
Scat inorganic cations (by charge) mol l -1<br />
0.040 e<br />
San inorganic anions (by charge) mol l -1 0.075 e<br />
a<br />
Calculated by substrate chemical composition measured.<br />
b<br />
Calculated by assumptions <strong>of</strong> bacterial cell count in reactor by Lübken et al (2007).<br />
c<br />
Calculated assuming that acidogenic bacteria found by Lübken et al (2007) are equally divided<br />
between 5 groups.<br />
d<br />
Calculated assuming that methanogenic bacteria found by Lübken et al (2007) are equally<br />
divided between 2 groups.<br />
e<br />
Determined back from the model.
In ADM1 the input substrate is described through 28 variables. These are<br />
concentrations <strong>of</strong> 12 dissolved and 12 particulate substances, concentration <strong>of</strong> cations<br />
and anions, liquid flow speed and temperature. Three additional parameters are needed<br />
to describe the state <strong>of</strong> the reactor. These are concentrations <strong>of</strong> H2, CH4 and CO2 in<br />
headspace (Batstone et al., 2002a, 2002b).<br />
Concentrations <strong>of</strong> VFA, insoluble proteins and lipids, and total ammonia nitrogen<br />
were taken directly from chemical composition <strong>of</strong> the substrate. Insoluble<br />
hydrocarbons were calculated by content <strong>of</strong> hemicellulose and cellulose. Hemicellulose<br />
was assumed to degrade completely but cellulose degradability was 36%, estimated by<br />
differences <strong>of</strong> cellulose concentration in substrate and digestate. Insoluble proteins<br />
were calculated by organic nitrogen (total nitrogen – inorganic ammonium nitrogen),<br />
ratio <strong>of</strong> insoluble proteins COD to nitrogen was 1/0.007 (Rosen & Jeppson, 2006).<br />
Also several ADM1 model default parameters (Batstone et al., 2002a) were<br />
changed according to Lübken et al. (2007), as their study was performed with <strong>cattle</strong><br />
slurry. Overview <strong>of</strong> default and changed values is presented in Table 3.<br />
Table 3. ADM1 model parameter values changed according to Lübken et al. (2007).<br />
Parameter Description Unit ADM1<br />
default<br />
Changed<br />
value<br />
Khyd,ch carbohydrate hydrolysis rate 1 d -1<br />
Khyd,pr protein hydrolysis rate 1 d<br />
10.0 0.31<br />
-1 Khyd,li lipid hydrolysis rate 1 d<br />
10.0 0.31<br />
-1 10.0 0.31<br />
pHUL,acid upper pH limit for acidogens 5.5 8.0<br />
pHLL,acid lower pH limit for acidogens 4.0 6.0<br />
Km_c4<br />
KS_c4<br />
Km_pro<br />
KS_pro<br />
maximum uptake rate <strong>of</strong><br />
valerate and butyrate<br />
half saturation concentration <strong>of</strong><br />
valerate and butyrate uptake<br />
maximum uptake rate <strong>of</strong><br />
propionate<br />
half saturation concentration <strong>of</strong><br />
propionate uptake<br />
1 d -1 20.0 13.7<br />
g l -1 COD 0.2 0.357<br />
1 d -1 13.0 5.5<br />
g l -1 COD 0.1 0.392<br />
Km ac maximum uptake rate <strong>of</strong> acetate 1 d -1 8.0 7.1<br />
KS_h2<br />
g l -1 COD 7·10 -6<br />
3·10 -5<br />
half saturation concentration <strong>of</strong><br />
hydrogen uptake<br />
Results and discussion<br />
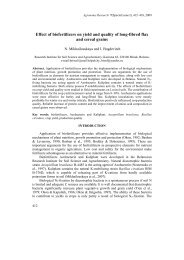
Experiment was planned in two main steps: stable loading in first period for 30<br />
days and the increase <strong>of</strong> loading for 12 days. But because <strong>of</strong> loading failure for 30<br />
hours, the experiment was conducted finally in four steps as shown in Fig. 2.<br />
The first stable period had average organic loading rate 1.3 kg VS (m 3 d) -1 , and<br />
was then increased to 2.0 kg VS (m 3 d) -1 . Average methane yield was<br />
256 l (kg VSadded) -1 in first period and increased up to 291 l (kg VSadded) -1 (273.15 K,<br />
101.325 kPa), being higher compared to BMP results (238 � 42 l (kg VSadded) -1 )<br />
published by Luna del Risco et al. (2011).<br />
171
Fig. 2. Substrate and organic loading rate and hydraulic retention time (HRT)<br />
during the experiment.<br />
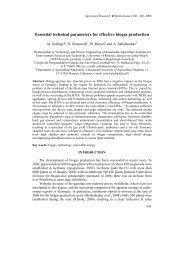
Results <strong>of</strong> simulation are presented on Fig. 3 – biogas flow rate, methane content<br />
in biogas, reactor pH and acetate concentration. The simulation results <strong>of</strong> biogas<br />
production were close to measurements. There is one miscalculation <strong>of</strong> biogas flow<br />
after loading failure, probably caused by incorrect substrate loading measurements and<br />
therefore too low loading rate applied to the model.<br />
172<br />
Fig. 3. Experimental and simulation results <strong>of</strong> chosen parameters.
Several default parameters <strong>of</strong> ADM1 were changed to simulate <strong>anaerobic</strong><br />
<strong>digestion</strong> <strong>of</strong> <strong>cattle</strong> <strong>manure</strong> (Table 2 & 3). Additionally, the ammonia inhibition<br />
constant was optimized during this study to improve modelling results compared to<br />
measurements <strong>of</strong> acetate concentration. ADM1 default value was 0.0018 mol l -1<br />
(Batstone et al., 2002a), but it overestimated inhibition effect and lead to acetate<br />
accumulation that was not observed in the experiment.<br />
Chen et al. (2008) gave review <strong>of</strong> inhibitors <strong>of</strong> <strong>anaerobic</strong> <strong>digestion</strong> and concluded<br />
that bacteria are able to acclimate to higher concentrations <strong>of</strong> ammonia. It has been<br />
proposed that acetate accumulation in simulation could be solved with increased<br />
ammonia inhibition constant (Parker, 2005; Batstone et al., 2006).<br />
We increased the value <strong>of</strong> ammonia inhibition constant (Kinh3) from 0.0018 to<br />
0.006 mmol l -1 . After this we obtained good correlation between experimental and<br />
simulation results. <strong>Simulation</strong> results <strong>of</strong> pH and methane concentration were slightly<br />
higher than measurements in the beginning <strong>of</strong> experiment, but later this difference<br />
disappears. We assume that it is related to acclimatization <strong>of</strong> bacteria with high<br />
ammonia concentration in reactor (NH4–N in reactor 2.7 g l -1 ). Measurement <strong>of</strong> pH was<br />
fluctuating during some shorter periods, this problem was solved with sensor cleaning<br />
and recalibration.<br />
Compared to other authors our ADM1calibration gave different results for free<br />
ammonia inhibition constant for acetate uptake. Agricultural wastes including pig<br />
slurry were studied by Gali et al. (2009), and they came to conclusion that the model<br />
gave correct simulation results for degradation <strong>of</strong> agro-wastes (NH4–N concentration in<br />
reactor was 2.7 g l -1 ). Cattle slurry <strong>anaerobic</strong> <strong>digestion</strong> with co–substrates was studied<br />
by Lübken et al. (2007), where a good agreement between simulation results and<br />
measurements was achieved and they did not report any changes <strong>of</strong> inhibition constant<br />
(NH4–N in reactor 3.1 g l -1 ). Koch et al. (2010) studied <strong>anaerobic</strong> <strong>digestion</strong> <strong>of</strong> grass<br />
silage. They found that higher ammonia inhibition constant gives better measurement<br />
reproducibility in simulation.<br />
Conclusions<br />
A pilot-scale continuous flow reactor for <strong>anaerobic</strong> <strong>digestion</strong> <strong>of</strong> <strong>cattle</strong> slurry was<br />
successfully put into operation. Cattle slurry from local farm had high methane yield,<br />
maximum value was 291 l (kg VSadded) -1 at organic loading rate 2.0 kg VS (m 3 d) -1 .<br />
The ADM1 model was used to simulate the biogas flow rate, methane content in<br />
biogas, reactor pH and acetic acid concentration during the process. Several changes<br />
were made to model parameters to adjust it for <strong>cattle</strong> slurry fermentation. Good<br />
agreement between simulated and measured biogas flow was achieved. <strong>Simulation</strong> <strong>of</strong><br />
pH and methane concentration had different tendency than measurements and slight<br />
underestimation <strong>of</strong> acetate concentration at the beginning <strong>of</strong> experiment was seen. We<br />
assume that it is related to bacteria acclimatisation with high ammonia concentration in<br />
reactor during the experiment. Additional research is needed to define inhibition levels<br />
related to culture adaptation to higher ammonia concentration.<br />
ACNOWLEDGEMENTS. This research was co-financed by European Union,<br />
European Regional Development Fund in Estonian Energy Technology Research and<br />
Development project 3.02.0501.10–0020.<br />
173
174<br />
References<br />
Batstone, D. J., Keller, J., Angelidaki, I, Kalyuzhnyi, S. V., Pavlostathis, S. G., Rozzi, A.,<br />
Sanders, W. T. M. , Siegrist, H. & Vavilin, V. A., 2002a. Anaerobic Digestion Model No.<br />
1. IWA Task Group on Mathematical Modelling <strong>of</strong> Anaerobic Digestion Processes. IWA<br />
Scientific and Technical Report No. 13.<br />
Batstone, D. J., Keller, J., Angelidaki, I., Kalyuzhnyi, S. V., Pavlostathis, S. G. & Rozzi, A.<br />
2002b. The IWA Anaerobic Digestion Model No 1 (ADM1). Water Science and<br />
Technology, 45(10), 65–73.<br />
Batstone, D. J., Keller, J. & Steyer, J. P. 2006. A review <strong>of</strong> ADM1 extensions, applications, and<br />
analysis: 2002–2005. Water Science & Technology, 54(4), 1–10. IWA Publishing.<br />
Chen, Y., Cheng, J. J. & Creamer, K. S. 2008. Inhibition <strong>of</strong> <strong>anaerobic</strong> <strong>digestion</strong> process: a<br />
review. Bioresource Technology, 99(10), 4044–64.<br />
Connerty, H.V. & Briggs, A.R. Determination <strong>of</strong> serum calcium by means <strong>of</strong> orthocresolphthalein<br />
complexone. Am. J. Clin. Pathol., 45: 290–6, 1966.<br />
Environmental friendly <strong>manure</strong> storage and handling.Estonian Ministry <strong>of</strong> Environment,<br />
Estonian Ministry <strong>of</strong> Agriculture, AS Maves. 2004. http://www.maves.ee/trukised.htm<br />
(In Estonian).<br />
Gali, A., Benabdallah, T., Astals, S., & Mata-Alvarez, J. 2009. Modified version <strong>of</strong> ADM1<br />
model for agro-waste application. Bioresource Technology, 100(11), 2783–90.<br />
Heaton, F.W., 1960. Determination <strong>of</strong> magnesium by the titan yellow and ammonium<br />
phosphate methods. J Clin Pathol. 13(4), 358–360.<br />
Kask.Ü, Kask, L., Link, S. &Lomunov, S. 2008. Biowastes for biogas production in Estonia.<br />
Estonian combustible natural resources and wastes, 20–22 (In Estonian).<br />
Koch, K., Lübken, M., Gehring, T., Wichern, M., & Horn, H. 2010. Biogas from grass silage –<br />
Measurements and modeling with ADM1. Bioresource Technology, 101(21), 8158–65.<br />
Luna del Risco, M., Normak, A. & Orupõld, K. 2011.Biochemical methane potential <strong>of</strong><br />
different organic wastes and energy crops from Estonia. <strong>Agronomy</strong> Research, 9(1–2),<br />
331–342.<br />
Lübken, M., Wichern, M., Schlattmann, M., Gronauer, A. & Horn, H. 2007. Modelling the<br />
energy balance <strong>of</strong> an <strong>anaerobic</strong> digester fed with <strong>cattle</strong> <strong>manure</strong> and renewable energy<br />
crops. Water Research, 41(18), 4085–96.<br />
Overview <strong>of</strong> Estonian bioenergy market 2010.a., Estonian Institute <strong>of</strong> Economic Research.<br />
http://www.mkm.ee (In Estonian).<br />
Parker, W. J. 2005. Application <strong>of</strong> the ADM1 model to advanced <strong>anaerobic</strong> <strong>digestion</strong>.<br />
Bioresource Technology, 96, 1832–1842.<br />
Statistics <strong>of</strong> Estonia, web database, http://www.stat.ee/pollumajandus.<br />
Steyer, J. P., Bernard, O., Batstone, D. J. &Angelidaki, I. 2006. Lessons learnt from 15 years <strong>of</strong><br />
ICA in <strong>anaerobic</strong> digesters. Water Science & Technology, 53(4–5), 25–33<br />
Ward, A. J., Hobbs, P. J., Holliman, P. J. & Jones, D. L. 2008.Optimisation <strong>of</strong> the <strong>anaerobic</strong><br />
<strong>digestion</strong> <strong>of</strong> agricultural resources. Bioresource Technology, 99(17), 7928–40.<br />
Van Soest, P.J., Robertson, J.B. & Lewis, B.A. 1991.Methods for dietary fiber, neutral<br />
detergent fiber and non–starch polysaccharides in relation to animal nutrition. J. Dairy<br />
Science 74, 3583–3597.<br />
Rosen, C. & Jeppsson, U. 2006, Aspects on ADM1 Implementation within the BSM2<br />
Framework. Technical report, Department <strong>of</strong> Industrial Electrical Engineering and<br />
Automation, Lund University.