Simulation of anaerobic digestion of cattle manure - Agronomy ...
Simulation of anaerobic digestion of cattle manure - Agronomy ...
Simulation of anaerobic digestion of cattle manure - Agronomy ...

You also want an ePaper? Increase the reach of your titles
YUMPU automatically turns print PDFs into web optimized ePapers that Google loves.
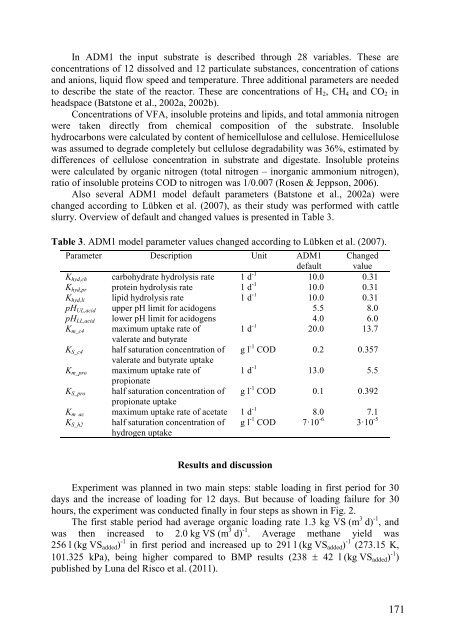
In ADM1 the input substrate is described through 28 variables. These are<br />
concentrations <strong>of</strong> 12 dissolved and 12 particulate substances, concentration <strong>of</strong> cations<br />
and anions, liquid flow speed and temperature. Three additional parameters are needed<br />
to describe the state <strong>of</strong> the reactor. These are concentrations <strong>of</strong> H2, CH4 and CO2 in<br />
headspace (Batstone et al., 2002a, 2002b).<br />
Concentrations <strong>of</strong> VFA, insoluble proteins and lipids, and total ammonia nitrogen<br />
were taken directly from chemical composition <strong>of</strong> the substrate. Insoluble<br />
hydrocarbons were calculated by content <strong>of</strong> hemicellulose and cellulose. Hemicellulose<br />
was assumed to degrade completely but cellulose degradability was 36%, estimated by<br />
differences <strong>of</strong> cellulose concentration in substrate and digestate. Insoluble proteins<br />
were calculated by organic nitrogen (total nitrogen – inorganic ammonium nitrogen),<br />
ratio <strong>of</strong> insoluble proteins COD to nitrogen was 1/0.007 (Rosen & Jeppson, 2006).<br />
Also several ADM1 model default parameters (Batstone et al., 2002a) were<br />
changed according to Lübken et al. (2007), as their study was performed with <strong>cattle</strong><br />
slurry. Overview <strong>of</strong> default and changed values is presented in Table 3.<br />
Table 3. ADM1 model parameter values changed according to Lübken et al. (2007).<br />
Parameter Description Unit ADM1<br />
default<br />
Changed<br />
value<br />
Khyd,ch carbohydrate hydrolysis rate 1 d -1<br />
Khyd,pr protein hydrolysis rate 1 d<br />
10.0 0.31<br />
-1 Khyd,li lipid hydrolysis rate 1 d<br />
10.0 0.31<br />
-1 10.0 0.31<br />
pHUL,acid upper pH limit for acidogens 5.5 8.0<br />
pHLL,acid lower pH limit for acidogens 4.0 6.0<br />
Km_c4<br />
KS_c4<br />
Km_pro<br />
KS_pro<br />
maximum uptake rate <strong>of</strong><br />
valerate and butyrate<br />
half saturation concentration <strong>of</strong><br />
valerate and butyrate uptake<br />
maximum uptake rate <strong>of</strong><br />
propionate<br />
half saturation concentration <strong>of</strong><br />
propionate uptake<br />
1 d -1 20.0 13.7<br />
g l -1 COD 0.2 0.357<br />
1 d -1 13.0 5.5<br />
g l -1 COD 0.1 0.392<br />
Km ac maximum uptake rate <strong>of</strong> acetate 1 d -1 8.0 7.1<br />
KS_h2<br />
g l -1 COD 7·10 -6<br />
3·10 -5<br />
half saturation concentration <strong>of</strong><br />
hydrogen uptake<br />
Results and discussion<br />
Experiment was planned in two main steps: stable loading in first period for 30<br />
days and the increase <strong>of</strong> loading for 12 days. But because <strong>of</strong> loading failure for 30<br />
hours, the experiment was conducted finally in four steps as shown in Fig. 2.<br />
The first stable period had average organic loading rate 1.3 kg VS (m 3 d) -1 , and<br />
was then increased to 2.0 kg VS (m 3 d) -1 . Average methane yield was<br />
256 l (kg VSadded) -1 in first period and increased up to 291 l (kg VSadded) -1 (273.15 K,<br />
101.325 kPa), being higher compared to BMP results (238 � 42 l (kg VSadded) -1 )<br />
published by Luna del Risco et al. (2011).<br />
171